2.1. Typical IBM Results for an Individual Position
IBM analysis typically consists of two components. Particle-induced X-ray emission (PIXE) yields a signal distribution of elements by analyzing the X-ray emission upon proton bombardment. The Rutherford backscattering spectrometry (RBS) analyzes the energy of backscattered protons and provides information on the elemental composition, depth profile, the accumulated charge, and the thickness of a sample.
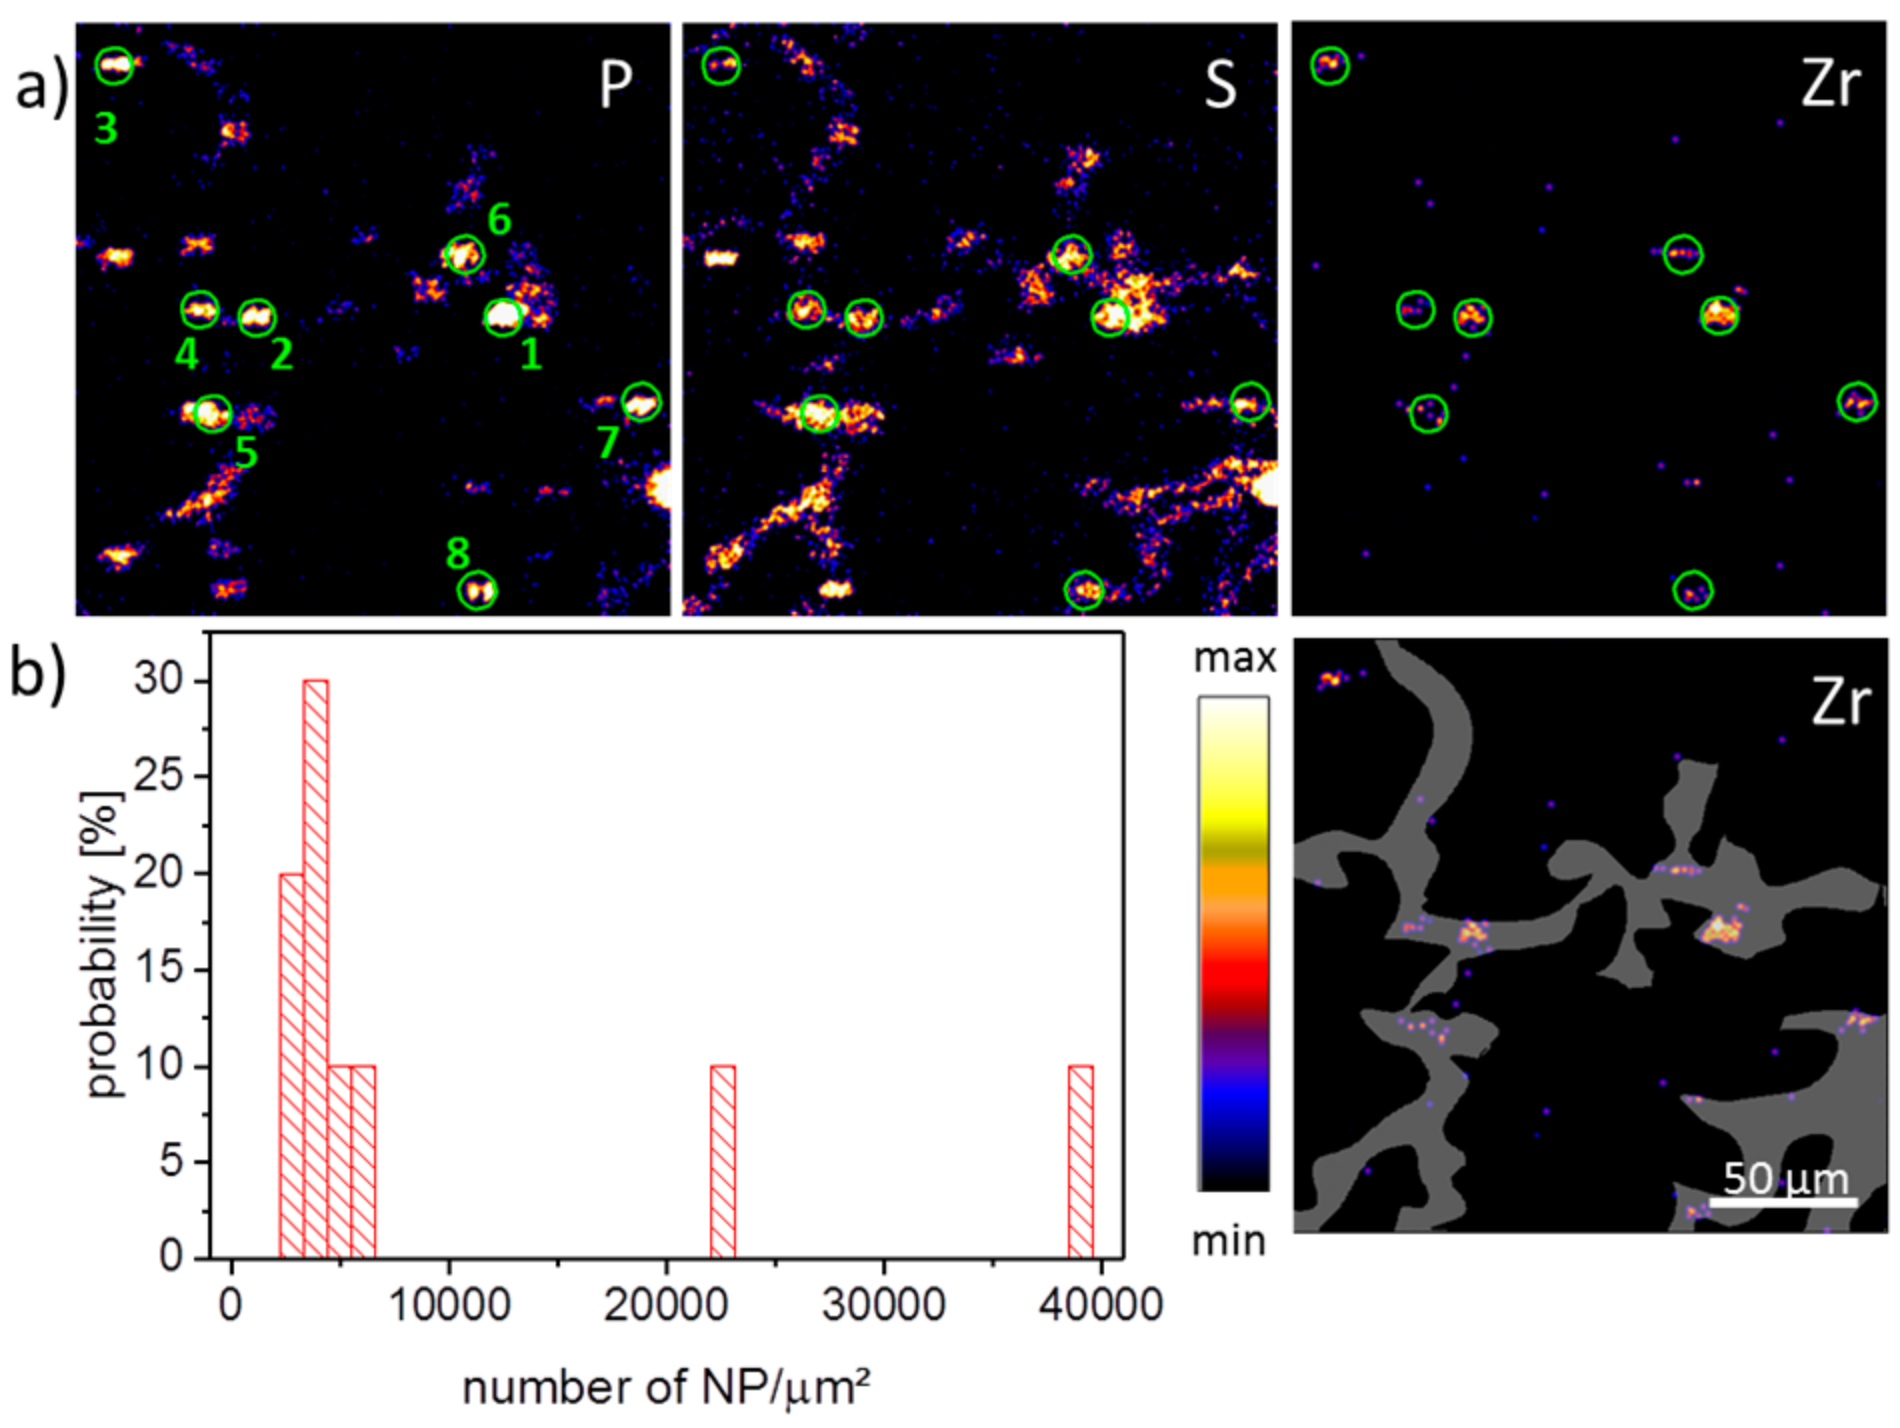
PIXE images of a ZrO
2 containing tissue section three days post-instillation are shown in
Figure 1a where the signal distribution of phosphorus, sulfur, and zirconium is presented. The grey area indicates a region-of-interest (ROI) comprising the network of alveolar septa, which are main constituents of the lung parenchyma. The phosphorus image showed numerous elliptical structures of high intensity, with diameters up to 20 µm. While frequency, distribution, and size of the smaller structures most likely represented phosphate groups of the nuclear DNA within cell nuclei, larger spots may have been caused by type-2 pneumocytes, which contain phospholipid-rich lamellar bodies as lung surfactant precursors, or alveolar macrophages, which also may engulf portions of lung surfactant. Furthermore, it had to be taken into account that the K line from phosphorus and L line from zirconium coincided with each other. Therefore the phosphor distribution was partially influenced by the Lα emission from the Zr signal. The sulfur distribution showed an overall medium intensity in alveolar septa with higher intensity areas in P-rich (nuclear) regions. The sulfur distribution reflected sulfur-containing amino acids in proteins, and the highest intensity should be found where the local protein concentration is high. Again, nuclear structures bearing DNA-histone complexes may underlie this phenomenon. The zirconium distribution showed some intense areas all of which are associated with P- and S-rich regions. This, and the fact that the diameters of these patches were mostly below 10 µm, suggested a significant concentration of nanoparticles and/or small agglomerates in single cells, like alveolar macrophages and other cells of the alveolar septa. The concentration of NPs in different patches detected in various PIXE images was calculated. The PIXE and RBS spectra were extracted from the eight ROIs which mark the NP spots by the green circles (
Figure 1a). After fitting the spectra, the obtained concentration of Zr elements was recalculated in terms of NP number per µm
2 assuming a density of ZrO
2 of 5680 kg/m³ per NP with a mean size of 9 nm.
Figure 1b shows the histogram of the NP loading across an evaluated lung section. The ROIs revealing a low NP loading of about 4000 NPs/µm
2 were associated with the alveolar septa, composed of type-1 and type-2 pneumocytes. A higher NP loading of up to 40,000 NPs/µm
2 was found in ROIs 1 and 2 (
Figure 1b). It may be suggested that the high loading of NPs occurs in alveolar macrophages, which were in the close vicinity of alveolar septum.
2.2. Individual Position SIMS Analysis: Inorganic Depth Profiling
In the first step, three-dimensional ToF-SIMS analyses (3D ToF-SIMS) were carried out using O2+ sputtering, as this lowers the detection limit for the nanoparticles compared to Ar-cluster sputtering. O2+ sputtering ensures a high oxidation state of the Zr in the samples as it provides excess oxygen and fosters the secondary ion yield of the electropositive Zr for 3D ToF-SIMS analyses. Furthermore, due to the availability of O2 during the analysis, the maximum ionization yield of the Zr specific ZrO+ signal should be reached, which optimizes the signal-to-noise ratio for this channel.
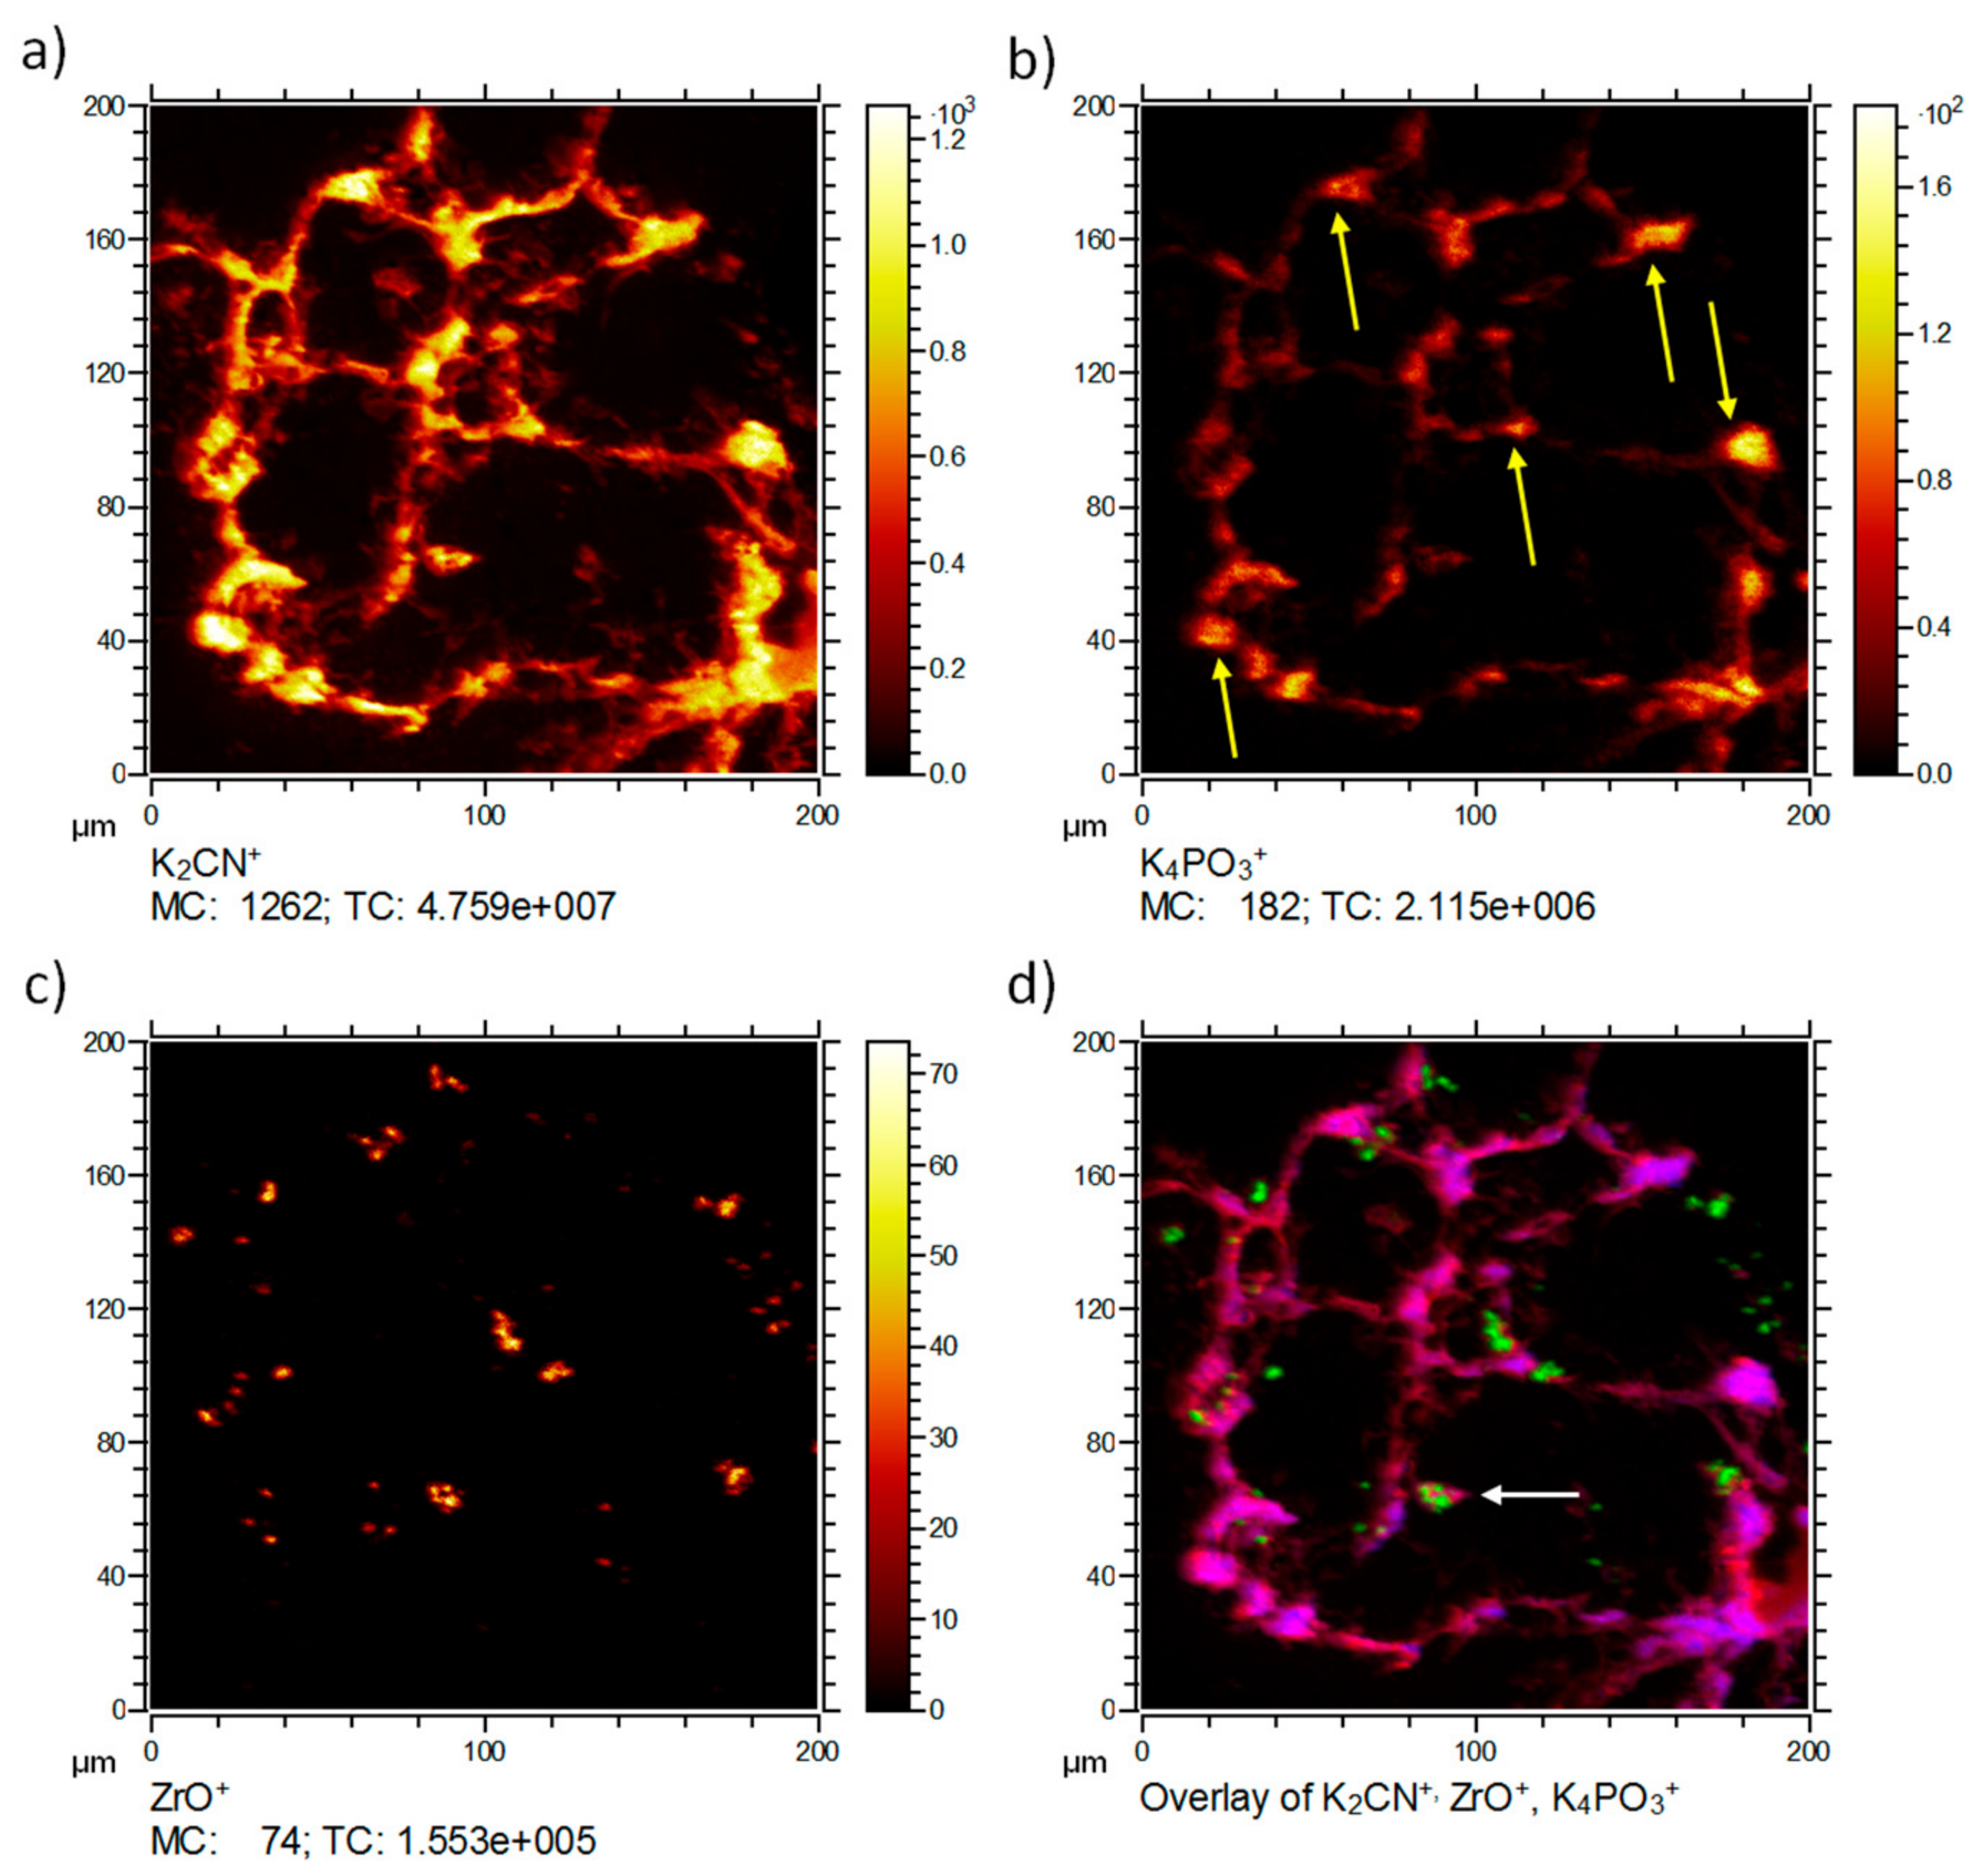
ToF-SIMS analysis of a ZrO
2 NP-containing lung tissue section three days post NP administration is presented in
Figure 2. The 3D data set was projected onto a 2D plane to enable a simple comparison of signal distributions. Typically, the K
2CN
+ signal (
m/
z = 103.95,
Figure 2a) is encountered in tissue material and used as a marker ion, if ToF-SIMS analysis of biomaterials is conducted with O
2+ sputtering. The K
4PO
3+ signal (
m/
z = 234.91,
Figure 2b) can be used as an indication for the phosphate distribution in K-rich tissue samples. In lung cells, this signal is therefore, mostly but not exclusively indicative of nuclear structures, and often surrounded by K
2CN
+, as shown in
Figure 2d. The highest intensities of K
4PO
3+ were found in alveolar edges, where phosphate-rich type-2 pneumocytes are quite often located. Thus, the K
4PO
3+ distribution resembled the distribution of phosphate-rich areas as revealed by IBM and most likely represents phospholipids (i.e., type-2 pneumocytes) or nucleic acids (i.e., nuclei).
The ZrO
+ image (
m/
z = 105.86,
Figure 2c) presents the distribution of the nanoparticles. The diameters of ZrO
+ containing areas ranged from about 400 nm (corresponding to the size of a single pixel) up to 10 µm. As the primary particle size was 9 nm and the mean size of agglomerates within the instillation fluid amounted to 80 nm, the occurrence of more than one coherent ZrO
+-positive pixel suggests the presence of accumulated nanoparticle agglomerates. These agglomerations might have formed in the absence of cells, i.e., secondary to the instillation process when instillation fluid is resorbed and particles contact the lung surfactant or lung lining fluid.
A correlation analysis overlaying the different components in different colors was performed (
Figure 2d). The correlation analysis presents the tissue material marker ion K
2CN
+ in red, the ZrO
+ signal in green, and the K
4PO
3+ in blue. K
4PO
3+ was predominantly found within the tissue at intense K
2CN
+ signals. This indicated a correlation with dense tissue and related most likely to compartments rich in nucleic acids or phospholipids. The ZrO
2 nanoparticles were likely to have accumulated alongside alveolar walls or were taken up by macrophage-like cells (
Figure 2d, white arrow) typical sizes [
8]. Some smaller signals appeared to be in the alveolar spaces. It cannot be excluded that some nanoparticles may have been displaced during the sectioning process. However, most of these were still associated with tissue material of lower signal intensity.
2.3. Individual Position: Organic Depth Profiling
While the ToF-SIMS approach using O
2+ sputtering results in excellent resolution and low detection thresholds, the extensive amount of fragmentation induced by the highly energetic O
2+ primary ions on organic molecules is less ideal for the detection of organic molecules. In particular, large biomolecules are prone to fragmentation. However, studying the distribution of these molecules may contain valuable information on the effects of nanoparticles in tissues. Although it is expected to result in a higher detection limit, e.g., for Zr secondary ions, sputtering with large gas clusters leads to a much better yield for larger molecules and larger fragments [
9,
10]. In particular, Ar-Cluster sputtering leads to less fragmentation along with higher sputter yields per ion compared to smaller clusters. In the next chapter, Ar
1000+ cluster sputtering is carried out and results will be compared to those of O
2+ sputtering.
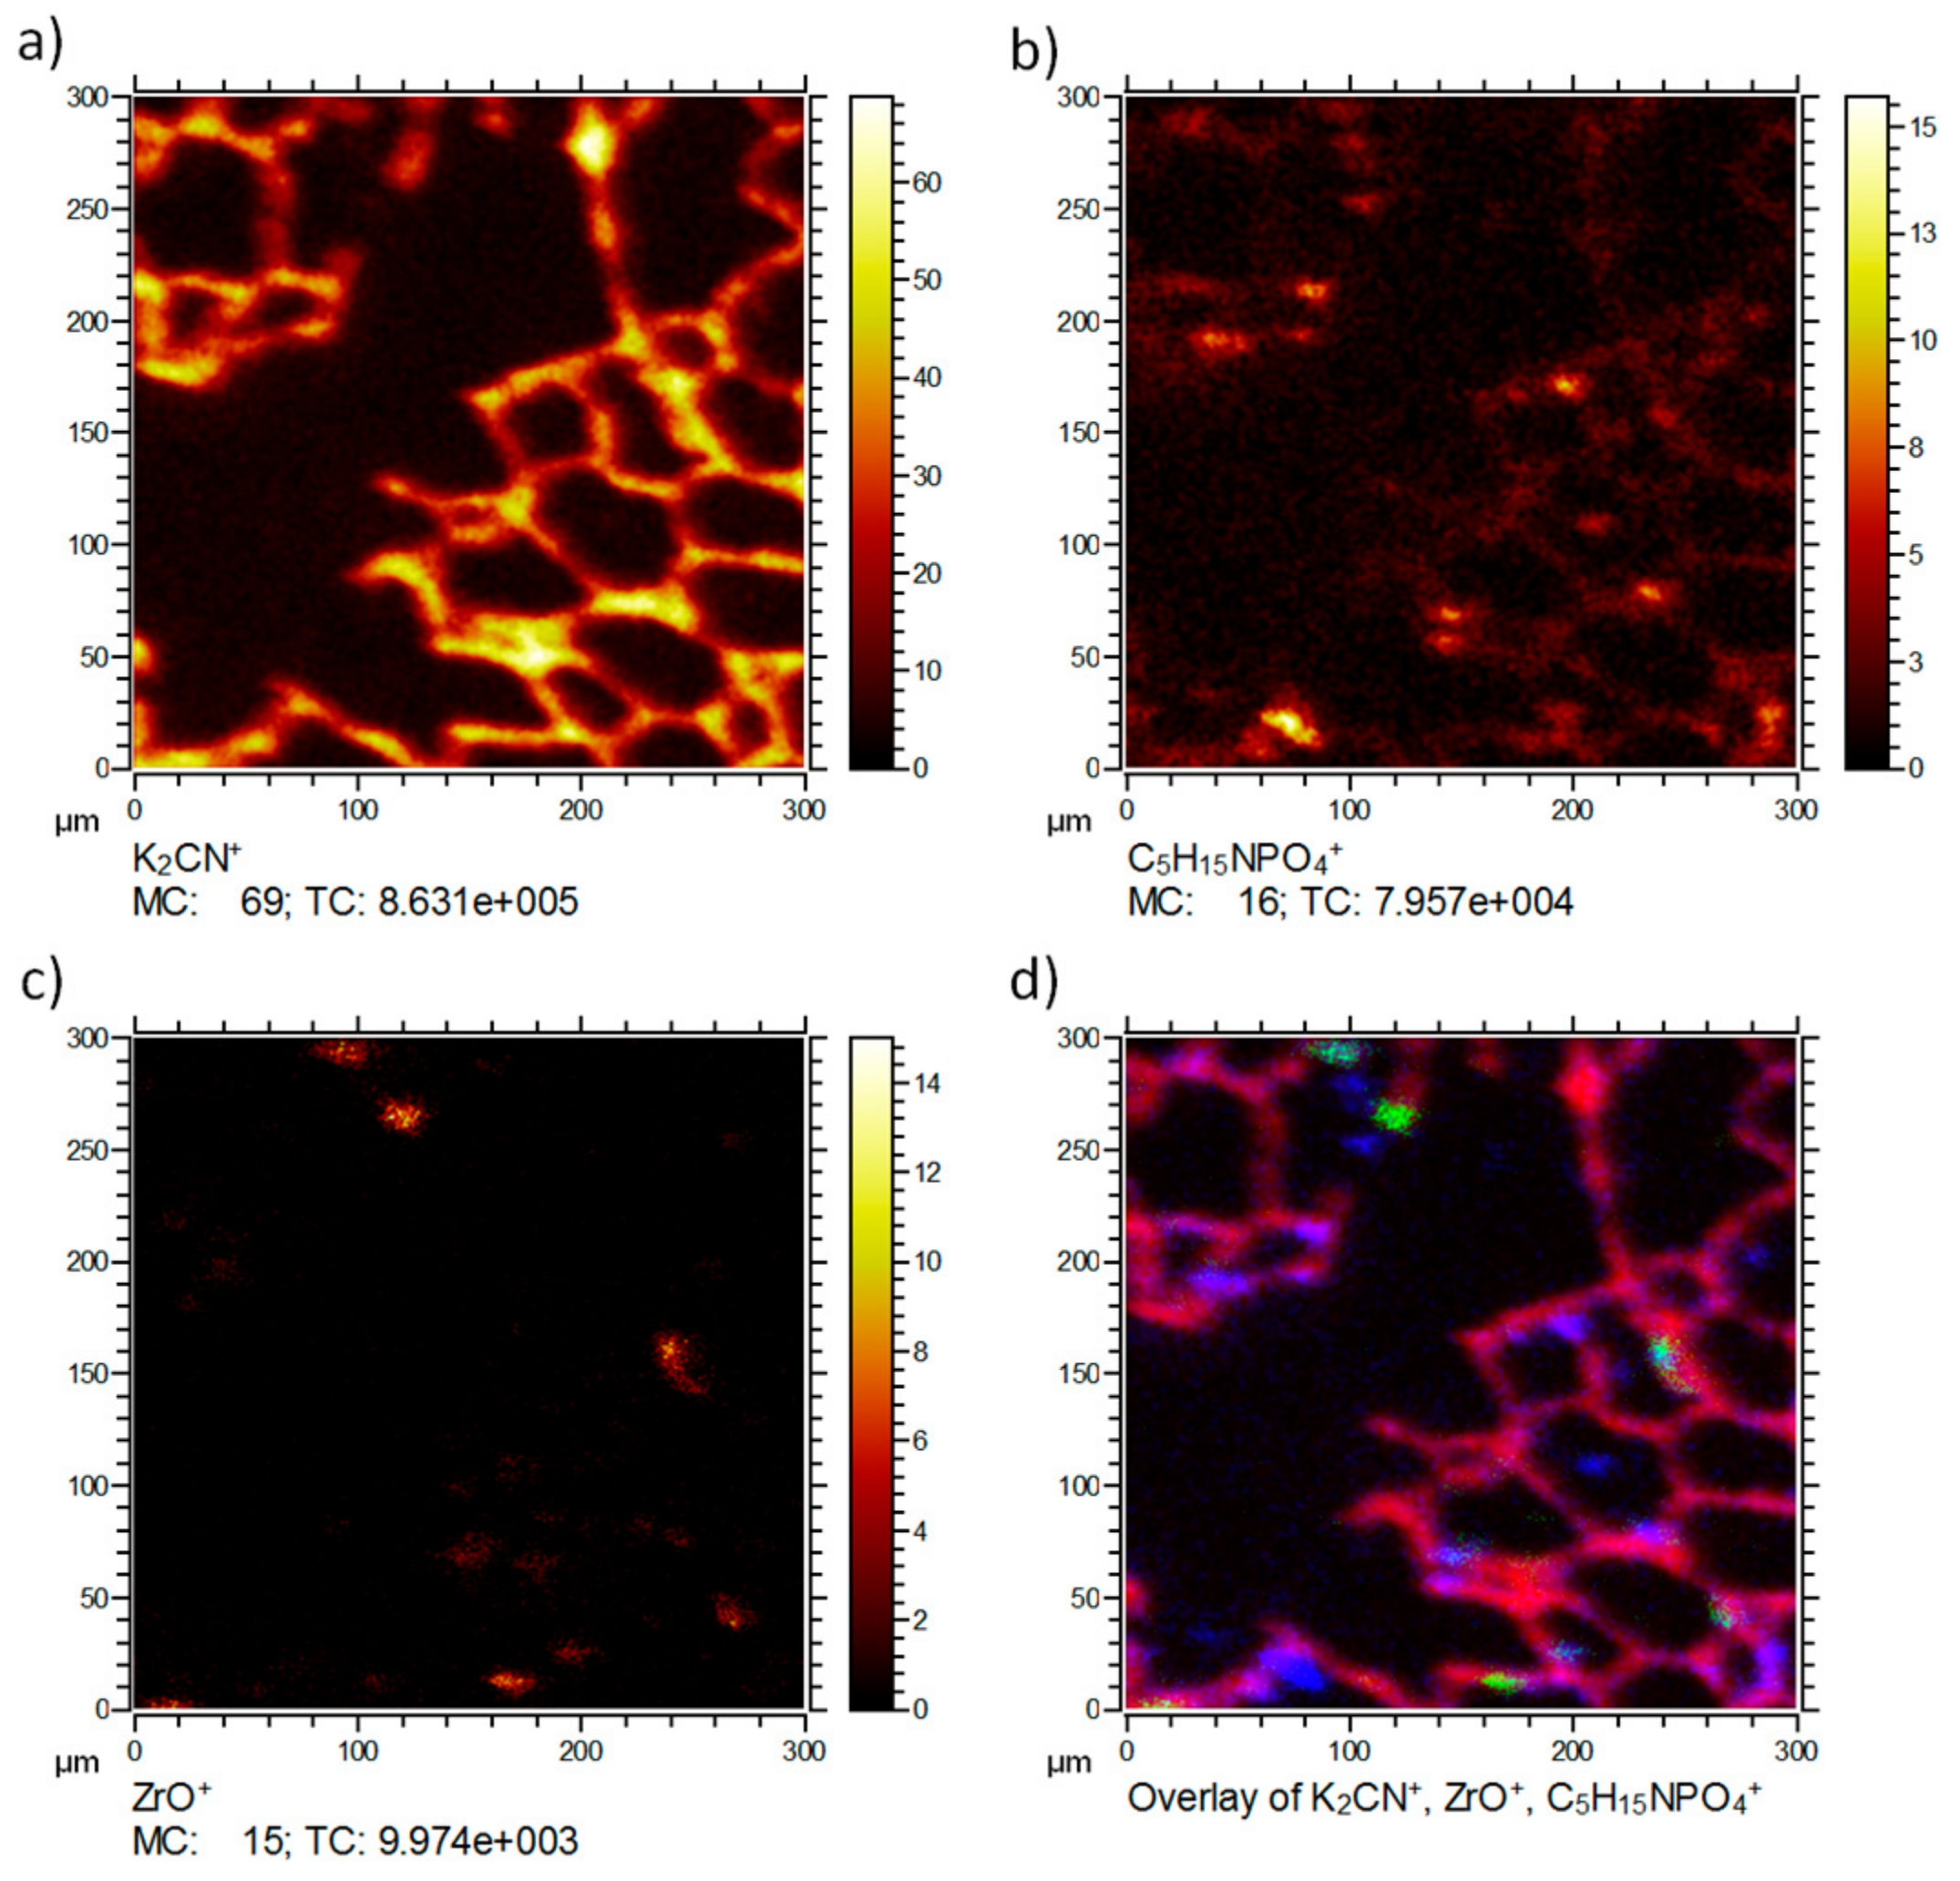
Figure 3 shows the distribution of the typical signals of the same lung tissue section. Besides the tissue marker ion K
2CN
+ (a) and the NP-related ZrO
+ (c), the distribution of the phosphatidylcholine head group C
5H
15NPO
4+ (b) is shown as an example for larger organic molecular species, which are not extensively fragmented but detected intact. C
5H
15NPO
4+ is a typical fragment of the important membrane lipid phosphatidylcholine. Consequently, the lateral distribution reveals the presence of this signal predominantly on the tissue material as expected for a membrane lipid. Several small patches of high intensity are visible. These most likely indicate the presence of pneumocyte type-2 cells, which produce the lung surfactant whose major phospholipid is phosphatidylcholine [
11,
12]. Of note, C
5H
15NPO
4+ was not associated with accumulated ZrO
+ (d), suggesting that (1) these NP, despite their large BET(Brunauer-Emmet-Teller) surface do not extensively bind lung surfactant, and (2) are not incorporated by type-2 pneumocytes.
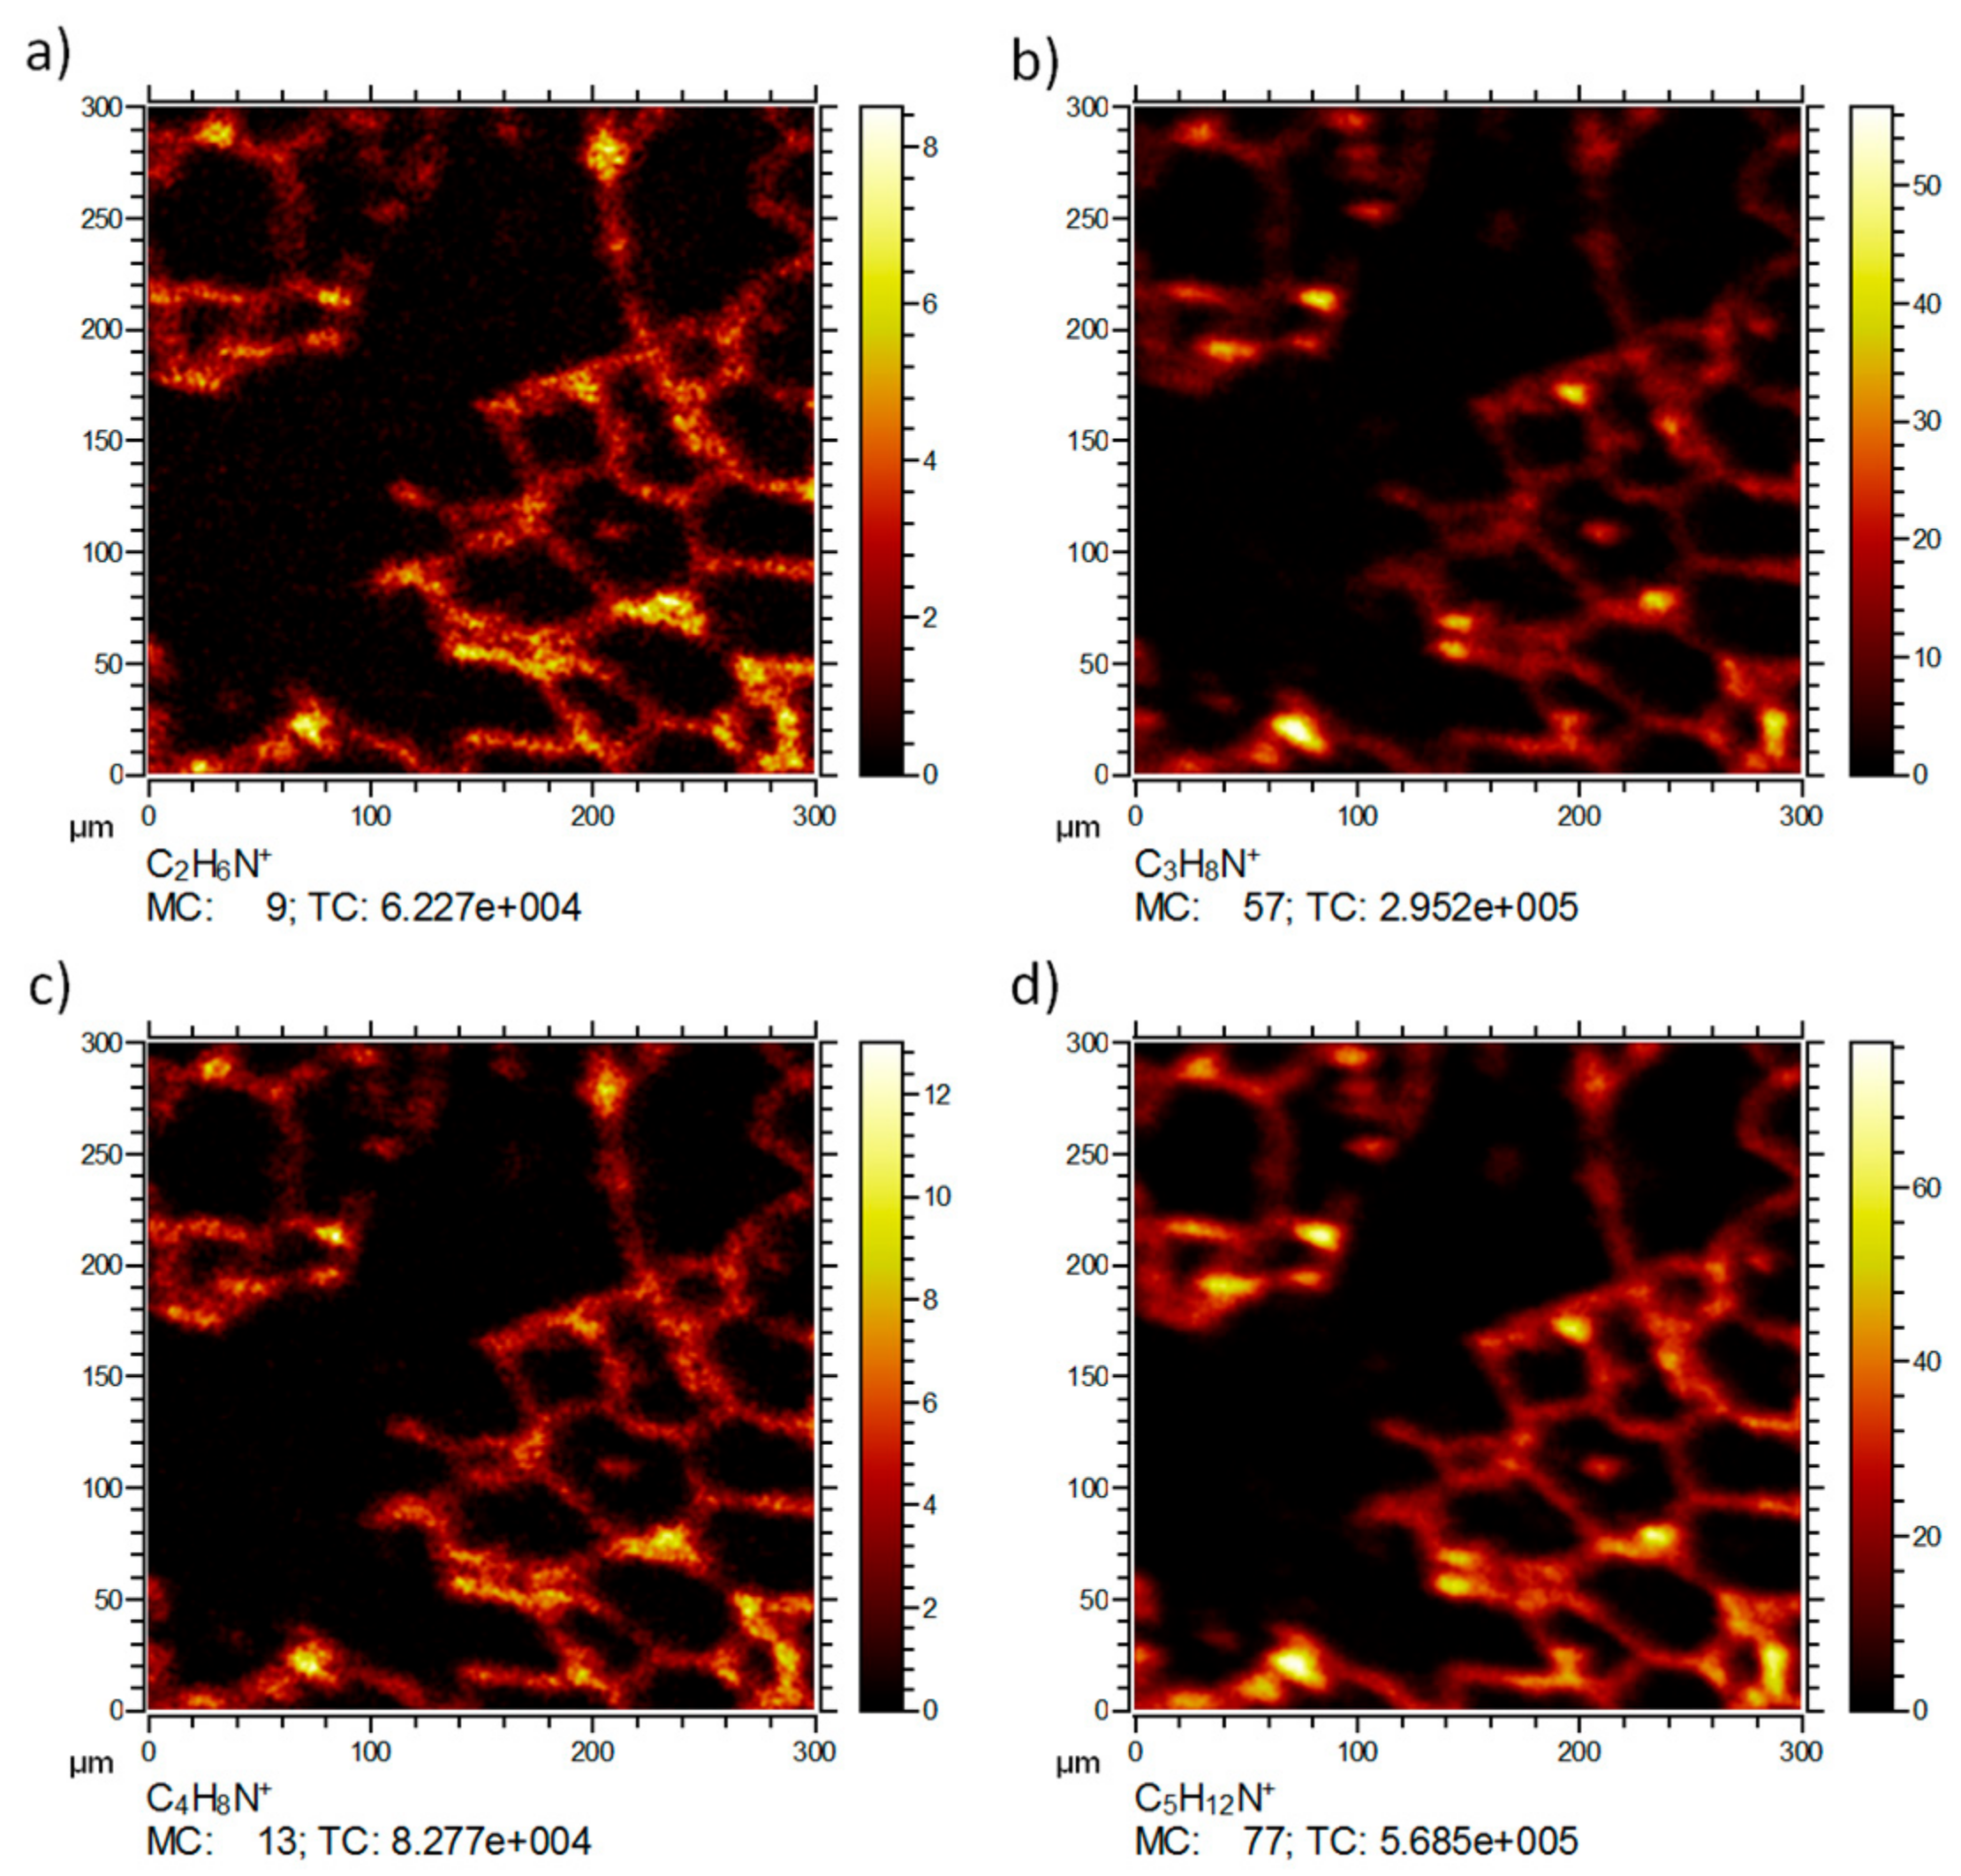
Figure 4 shows the distributions of signals most likely related to fragments of amino acids or other tissue molecules. While no distinct localization patterns were obtained for C
2H
6N
+ (
m/
z 44.05,
Figure 4a), most likely due to the ubiquitous occurrence of amino acids throughout all cells, other fragments (C
3H
8N
+ (
m/
z 58.06,
Figure 4b), C
4H
8N
+ (
m/
z 70.07,
Figure 4c), C
5H
12N
+ (
m/
z 86.10,
Figure 4d)) show a pattern resembling that of C
5H
15NPO
4+ from which they may have originated (at least in part). All these distributions reflect the septal structure of the lung tissue (compare K
2CN
+ in
Figure 3a) and were not associated with ZrO
2 NP.
2.4. Sequential Analysis of Identical Sample Sites: Ion Beam Microscopy (IBM)
To compare the results from IBM and ToF-SIMS analyses, a sequential analysis of the same site of ZrO2-NP laden lung tissue was carried out. Since the ToF-SIMS using Ar-cluster or O2 sputtering is a material-consuming (destructive) technique, IBM was done prior to ToF-SIMS analysis.
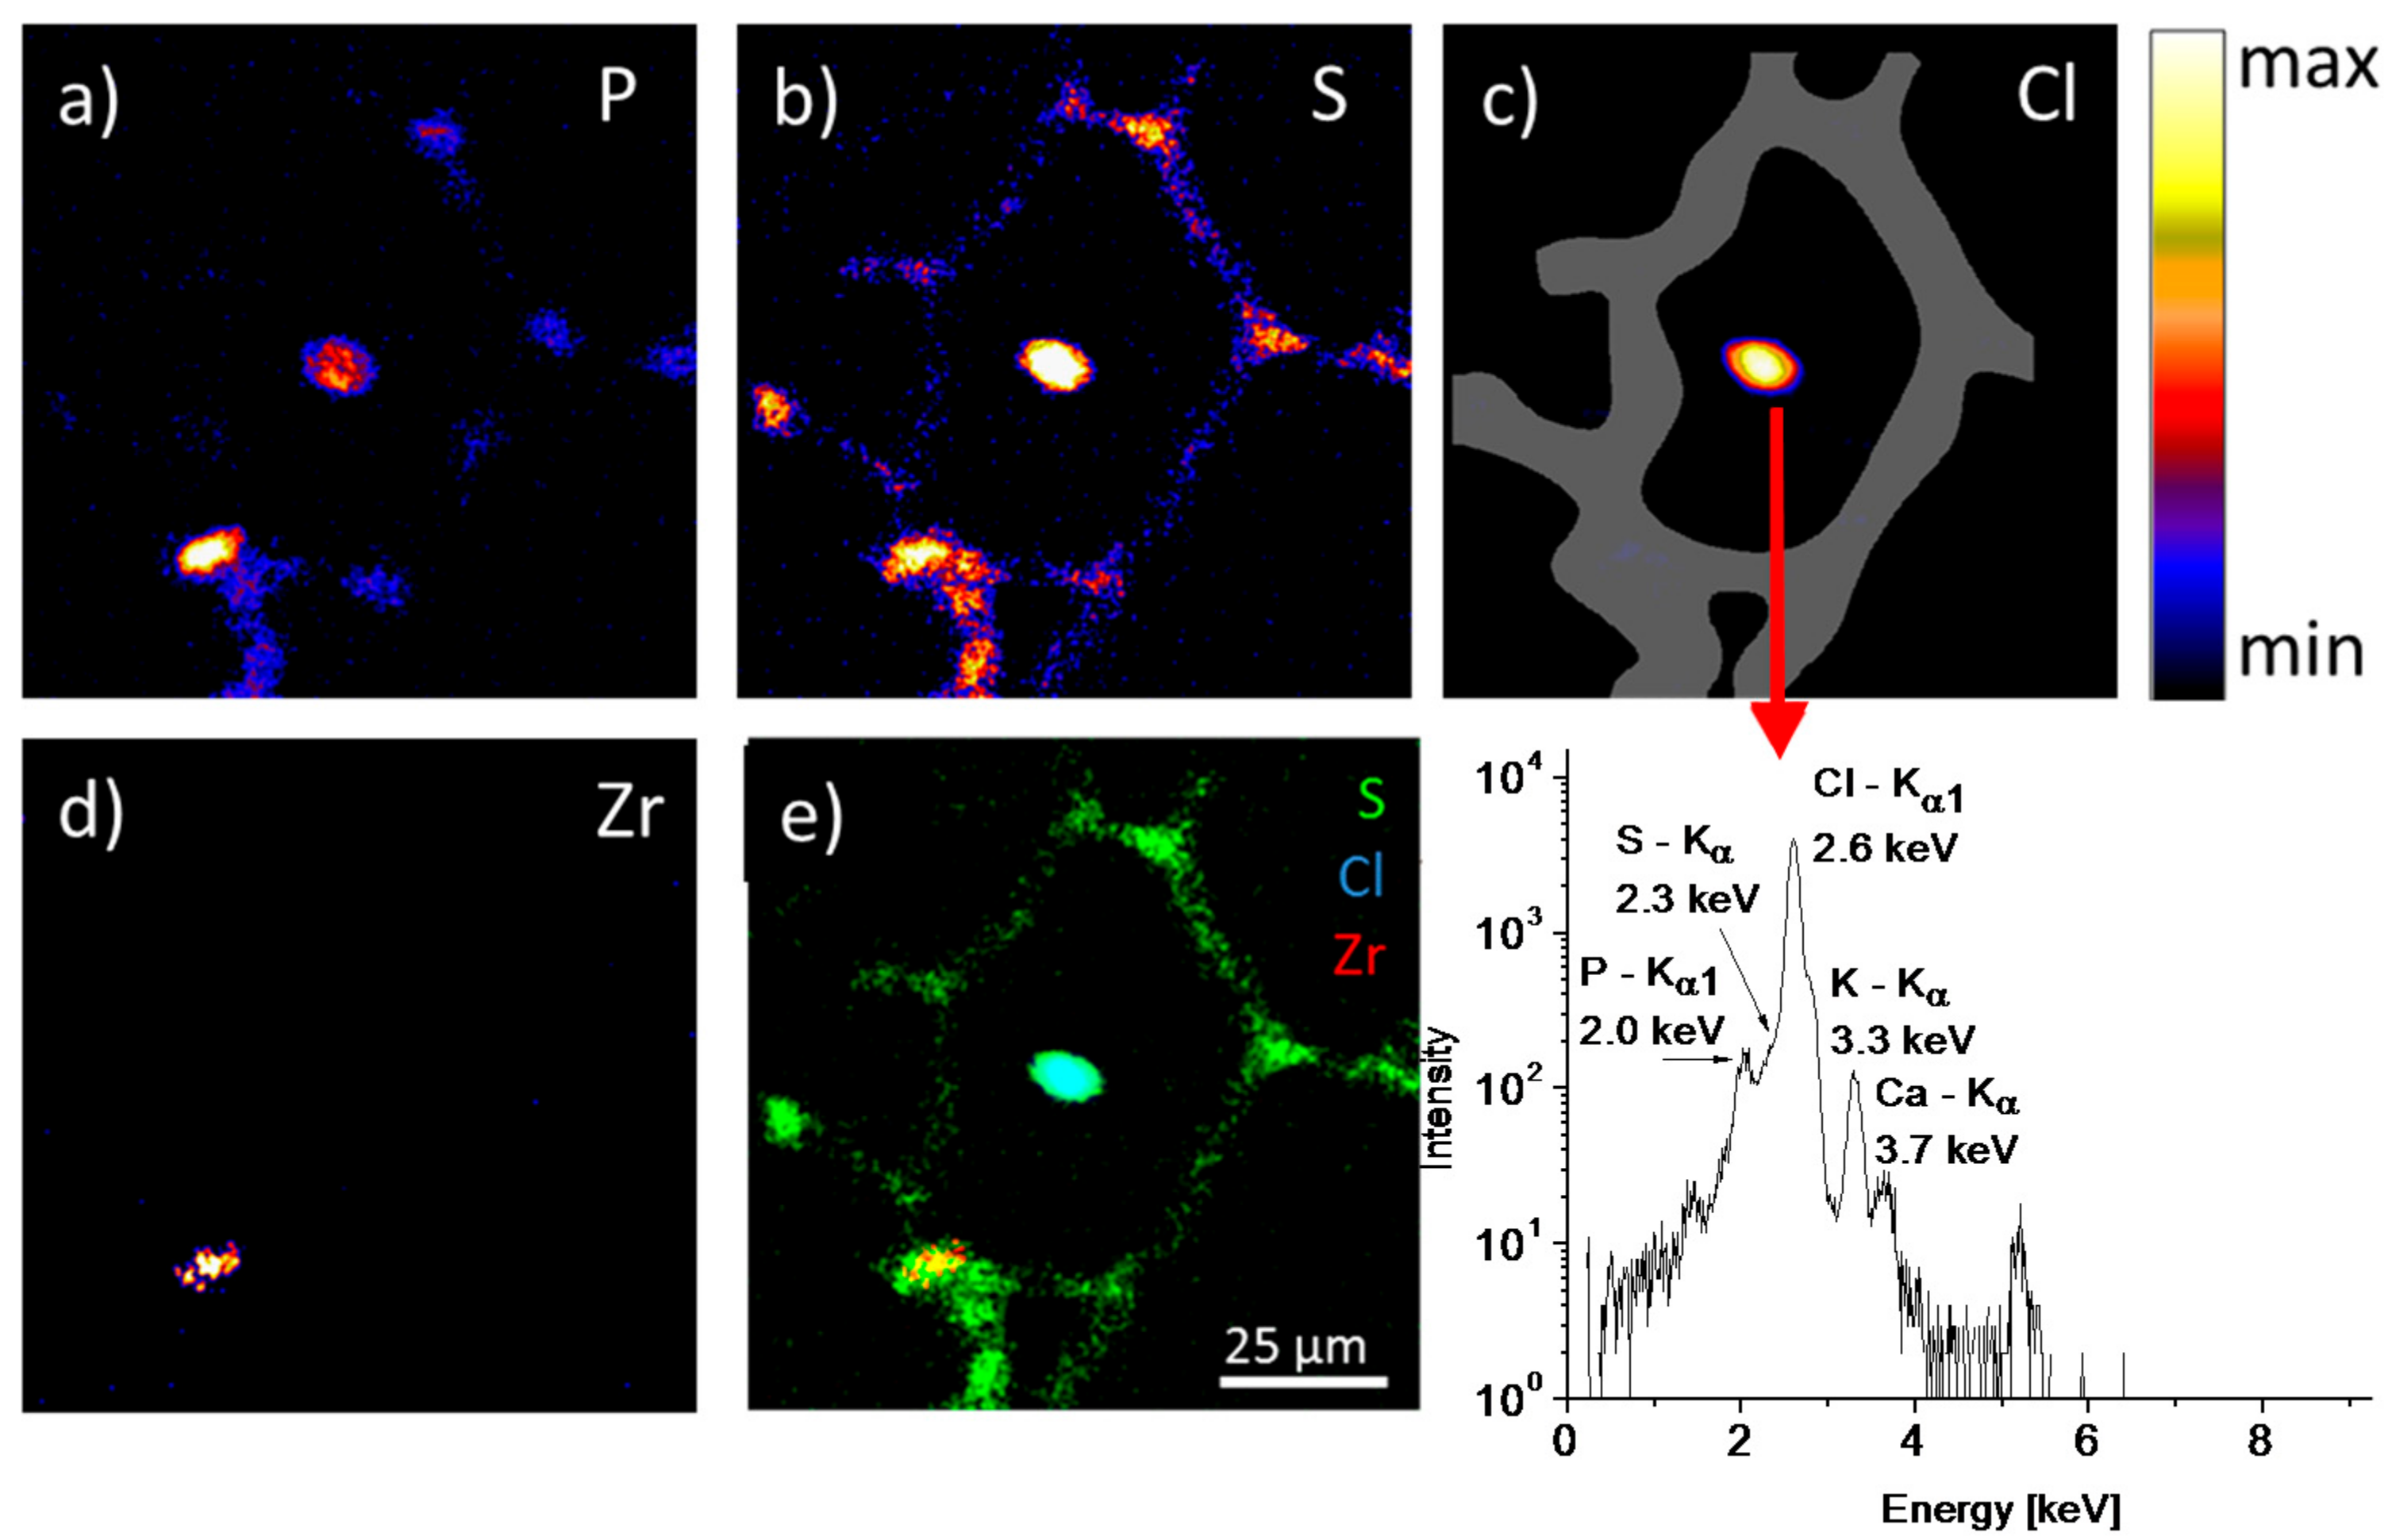
The IBM results show a notable distribution of P and S signals within the tissue section (
Figure 5a,b). Phosphorus reveals a patch pattern within the continuously distributed sulfur. Both elements can be used to visualize lung tissue. The origin of the phosphorus signals are most likely phospholipids from the tissue membranes or/and the phosphate of the nucleic acid backbone, which are most concentrated within the nuclei of the cells. Sulfur is a general marker for cells as it occurs in almost all proteins and cytoskeleton. The alveolar walls can be identified by the sulfur distribution indicating the localization of the pneumocytes, macrophages and other cells. An enhanced occurrence of sulfur and phosphorus elements was found in the alveolar junctions. The intense spots of the P and S distributions in the alveolar junction region could indicate the presence of pneumocyte type-2 cells, where their location is normally expected.
Surprisingly, the central area showed a highly intense chlorine signal co-localized with S and P signals (
Figure 5c,e). As the S signal was strongly interfered with by the intense Cl emission, it was regarded as an artifact. The P signal, however, was partially separated from the Cl signal (as can be seen from the emission spectrum (
Figure 5f)) and indicated the validity of the assignment in the P image. Furthermore, some Ca and K signals were found at that position, which suggested the presence of a salt residue. Of note, no corresponding structure was detected by ToF-SIMS.
The zirconium distribution in
Figure 5d only has a single area of notable intensity. This area is found within the tissue structure. This intense signal is found co-localized with the sulfur intensity. The higher sulfur as well as the phosphorous content compared with that in surrounding tissue could be usually found in macrophages. Furthermore the spatially defined appearance of the zirconium signal in a single area with a diameter of about 10 µm suggests also that the ZrO
2 nanoparticles were accumulated and might be contained in a macrophage. The achieved lateral resolution of about 1 µm revealed the substructure of Zr agglomerates inside a cell.
2.5. Sequential Analysis of Identical Sample Sites: ToF-SIMS
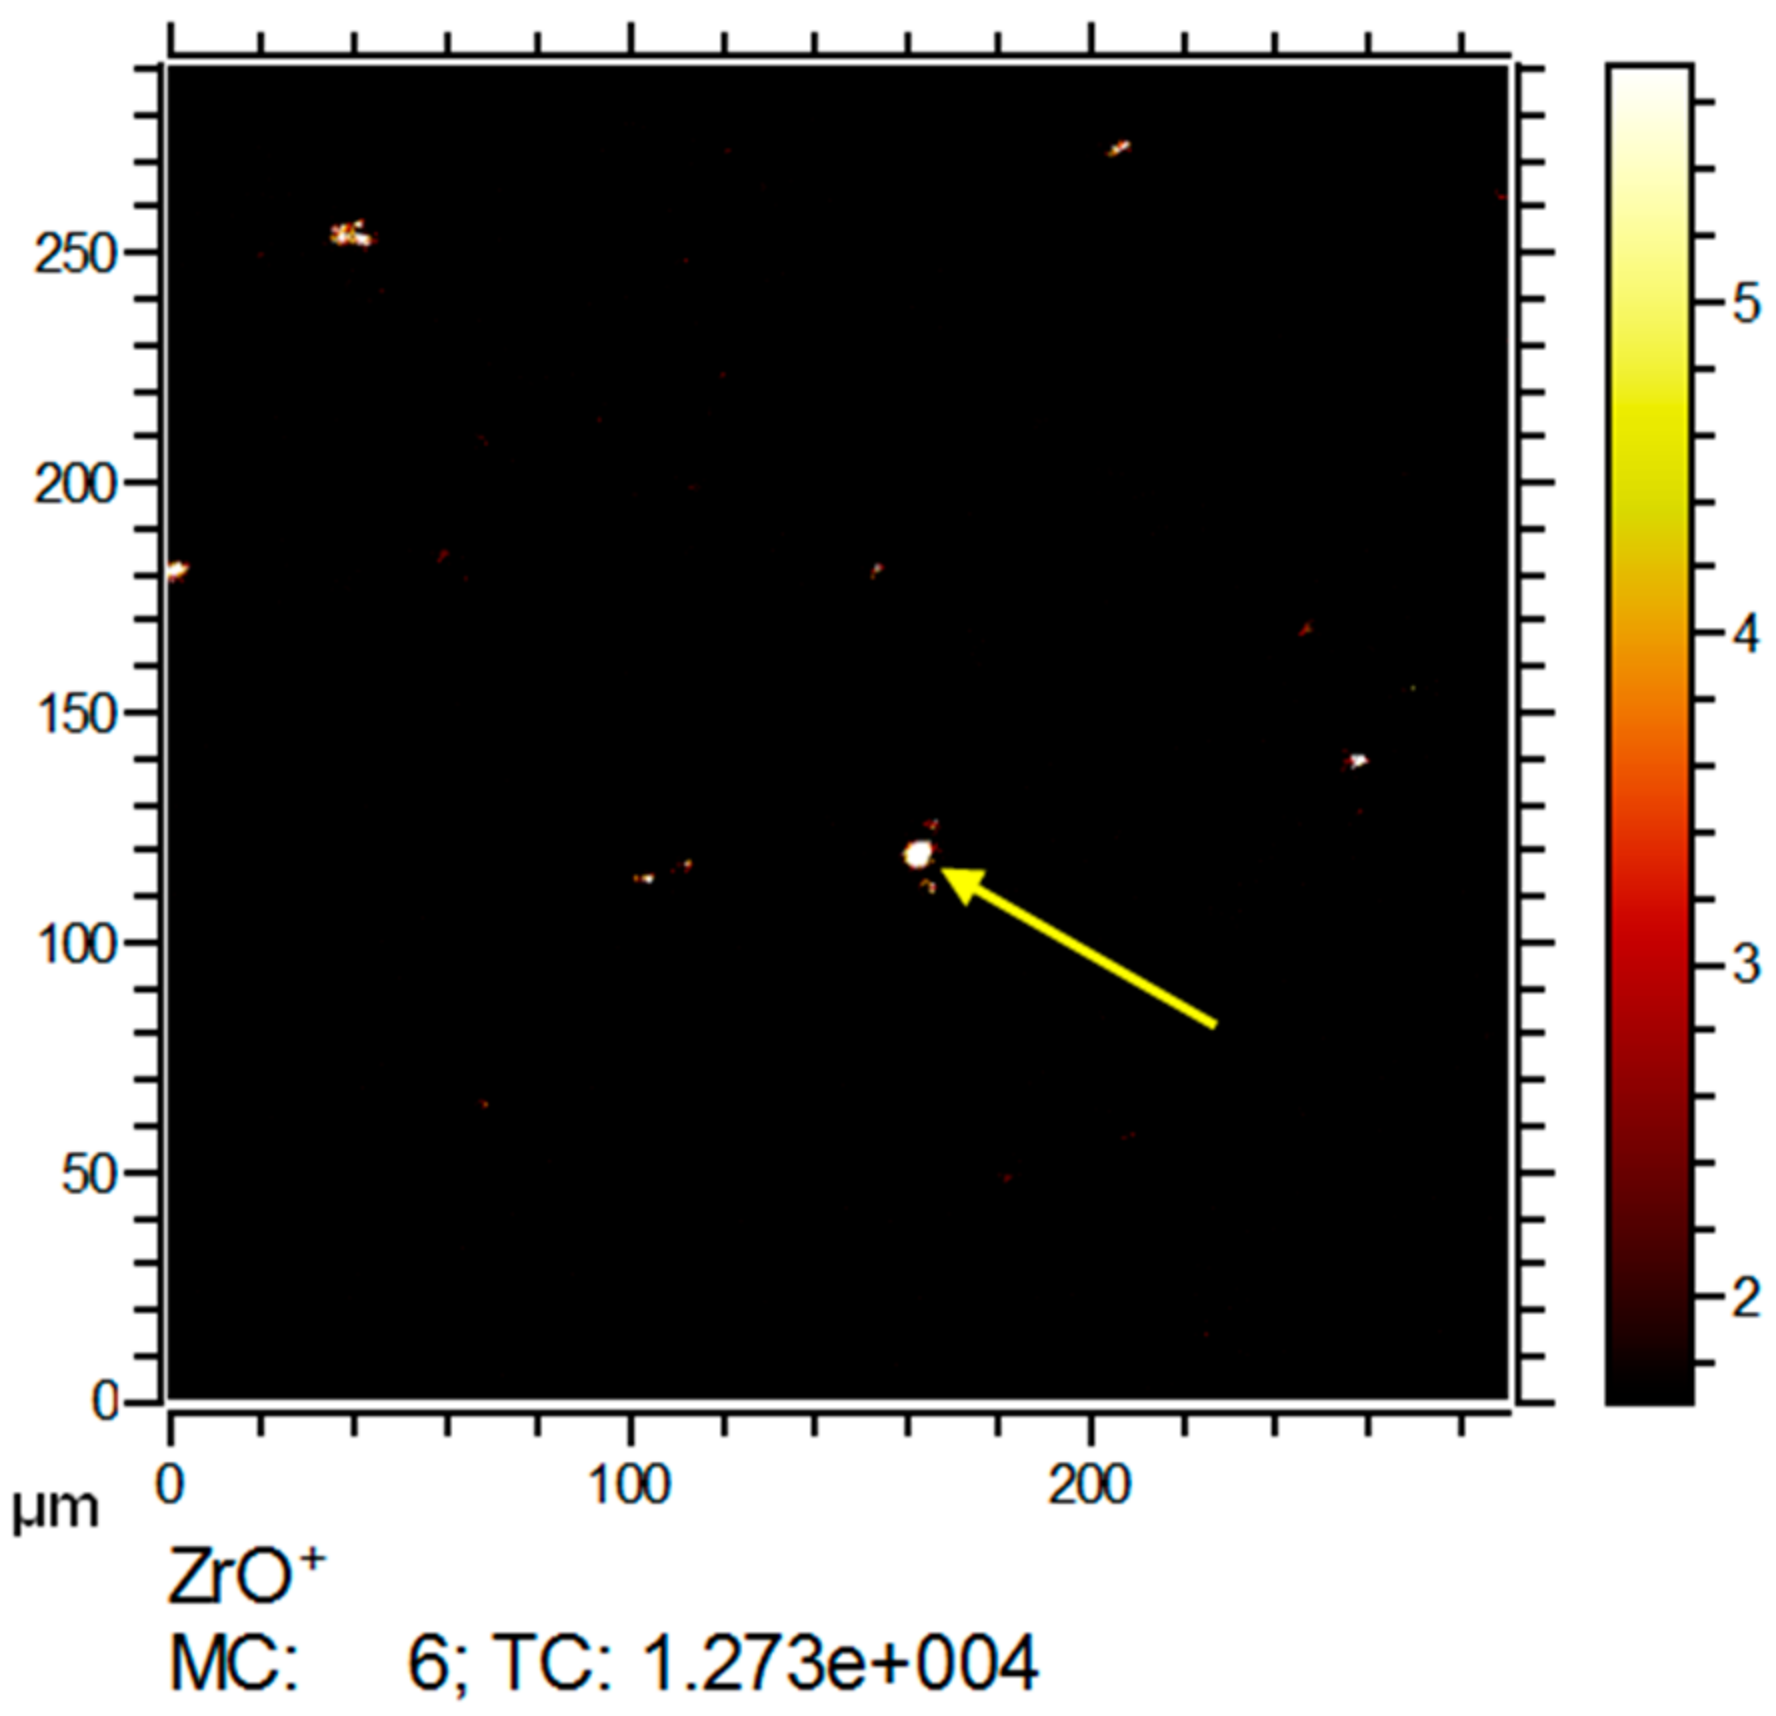
Results of the sequential analyses carried out first by IBM and than by ToF-SIMS are shown in
Figure 6,
Figure 7 and
Figure 8. Treatment with the high-energy proton beam led to locally confined changes of the tissue surface (
Figure 7a,f), which were used to identify the region-of-interest for the subsequent ToF-SIMS measurement. To maximize the signal yields especially for zirconium, we chose the more fragmenting O
2+ ion beam sputter method for the comparative analysis, as it increases the yields for electropositive elements.
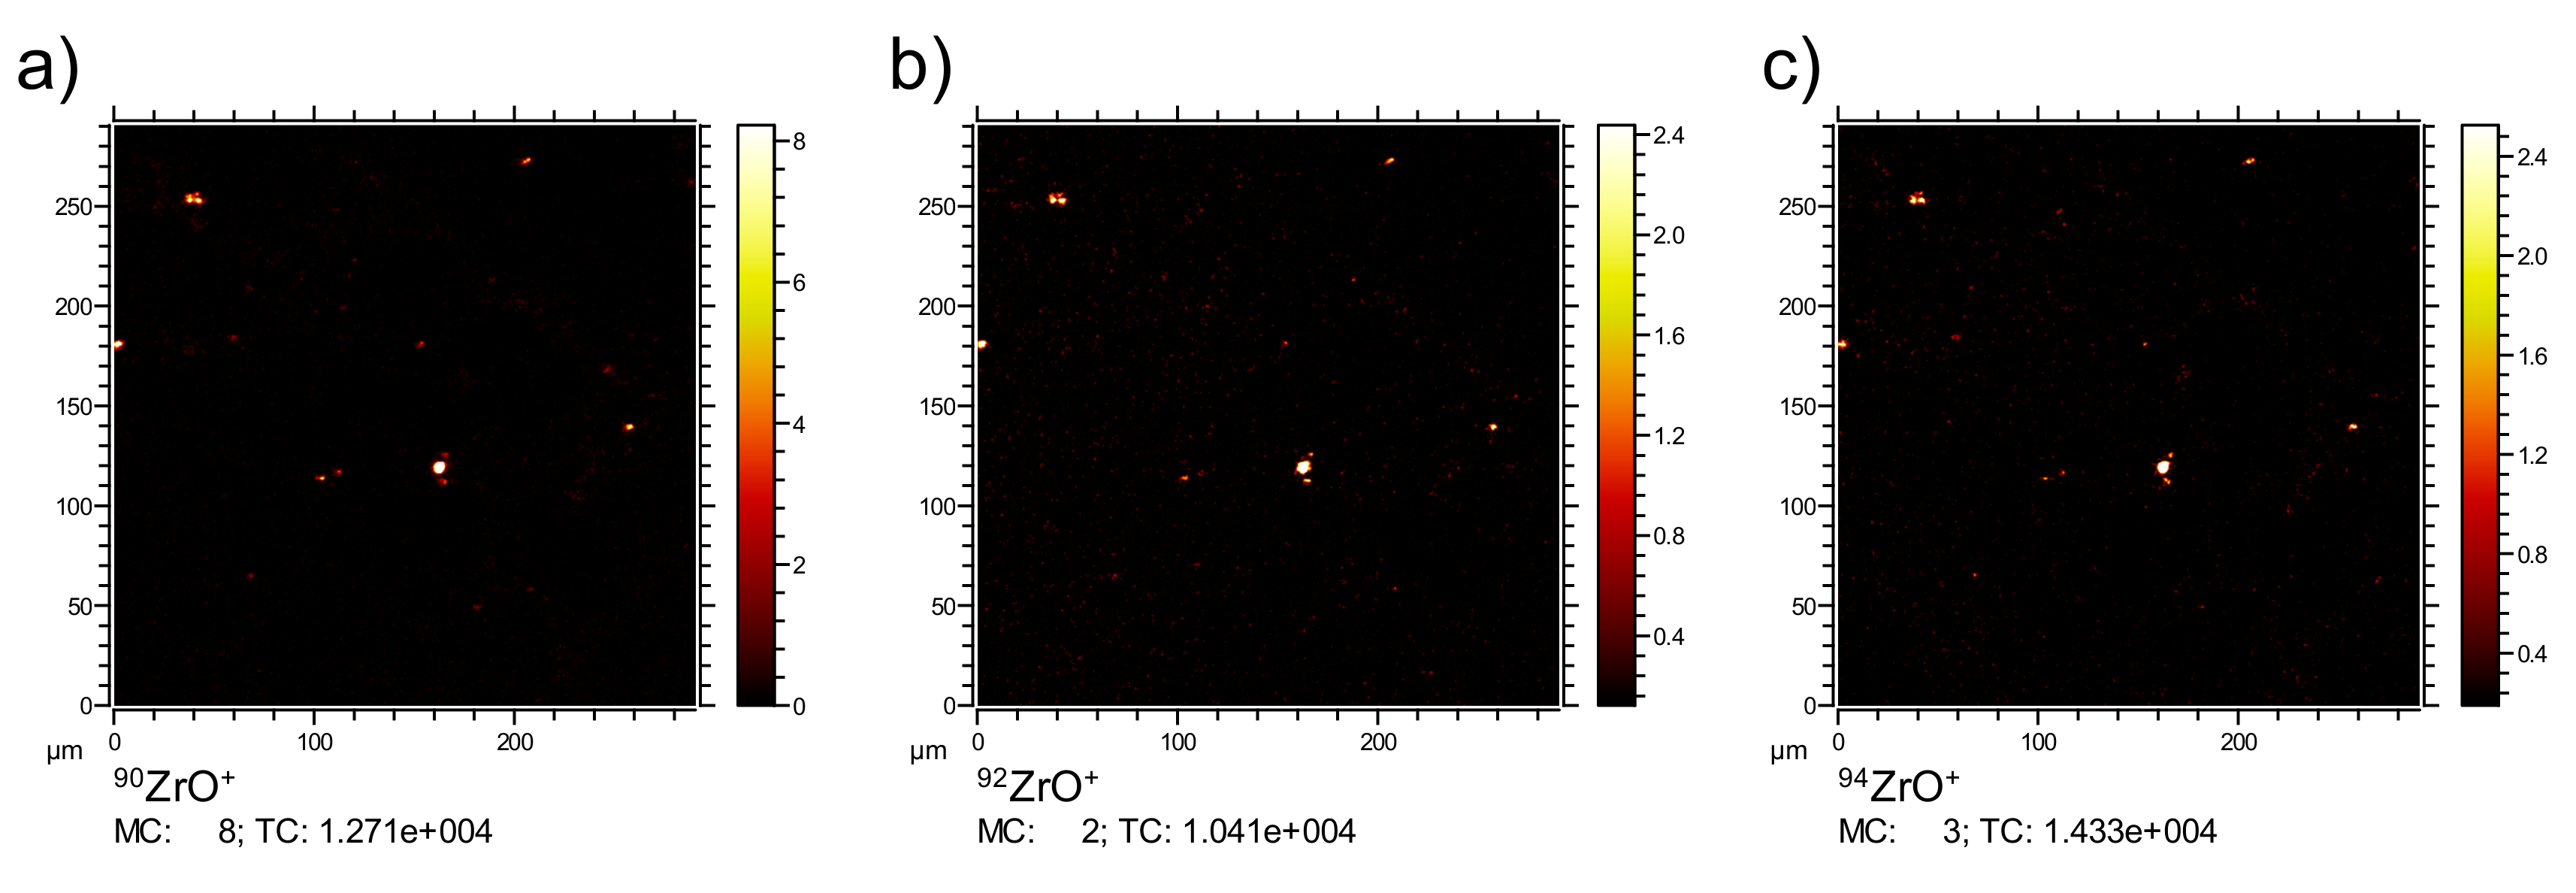
Furthermore, the lateral distributions of the signals from zirconium derived ions (ZrO
x+) were analyzed. The respective isotopic signal distributions were used to ensure the identity of the Zr derived signals combined (compare
Appendix A).
Figure 6 shows several intense Zr signals with diameters below 1 µm and up to 9 µm. As the pixel size limits the minimum diameter for signals to about 600 nm, smaller nanoparticles appeared as single pixels.
The lateral distribution of the total ion intensity reveals the overall structure of the analyzed tissue (
Figure 7a). The area subjected to IBM analysis was easily recognized due to its reduced total secondary ion yield and the increased levels of small organic fragments (
Figure 7f). To better compare ToF-SIMS and IBM images, we analyzed the distribution of S and P using SO
2+ (
m/
z 63.97,
Figure 7b) and PO
+ (
m/
z 46.96,
Figure 7d) signals, which show lung tissue typical distributions if compared to the analyses shown above. A comprehensive image is presented as a RGB overlay, and shows the tissue-related SO
2+ signal in blue, the phosphate signal in green, and the Zr oxide particle signal in red (
Figure 7e). The RGB image shows agglomerated ZrO
2 NP in the tissue, revealing that most nanoparticles were directly associated with the tissue.
As the ion-beam-treated area was visible on ToF-SIMS images, we speculated that the sample was altered during the IBM analysis. A careful evaluation of ToF-SIMS analyses from ion-beam-treated sites showed that a slightly higher amount of small organic fragments (e.g., C
5H
9 (
m/
z 69.07,
Figure 7f)) were detected in the ion beam-treated area and its close vicinity. It is conceivable that due to the impact of high energy protons, alterations of the organic material occurred. This would especially be the case with breaking of chemical bonds (similar to the proton beam writing process) [
13,
14], as it would potentially explain the slightly elevated levels of small organic fragments. This shows that the IBM technique could at least gradually change the molecular composition of tissue components, and this aspect is of importance for the direct comparison of results.
2.6. Sequential Analysis of Identical Sample Sites: Comparison of IBM vs. ToF-SIMS
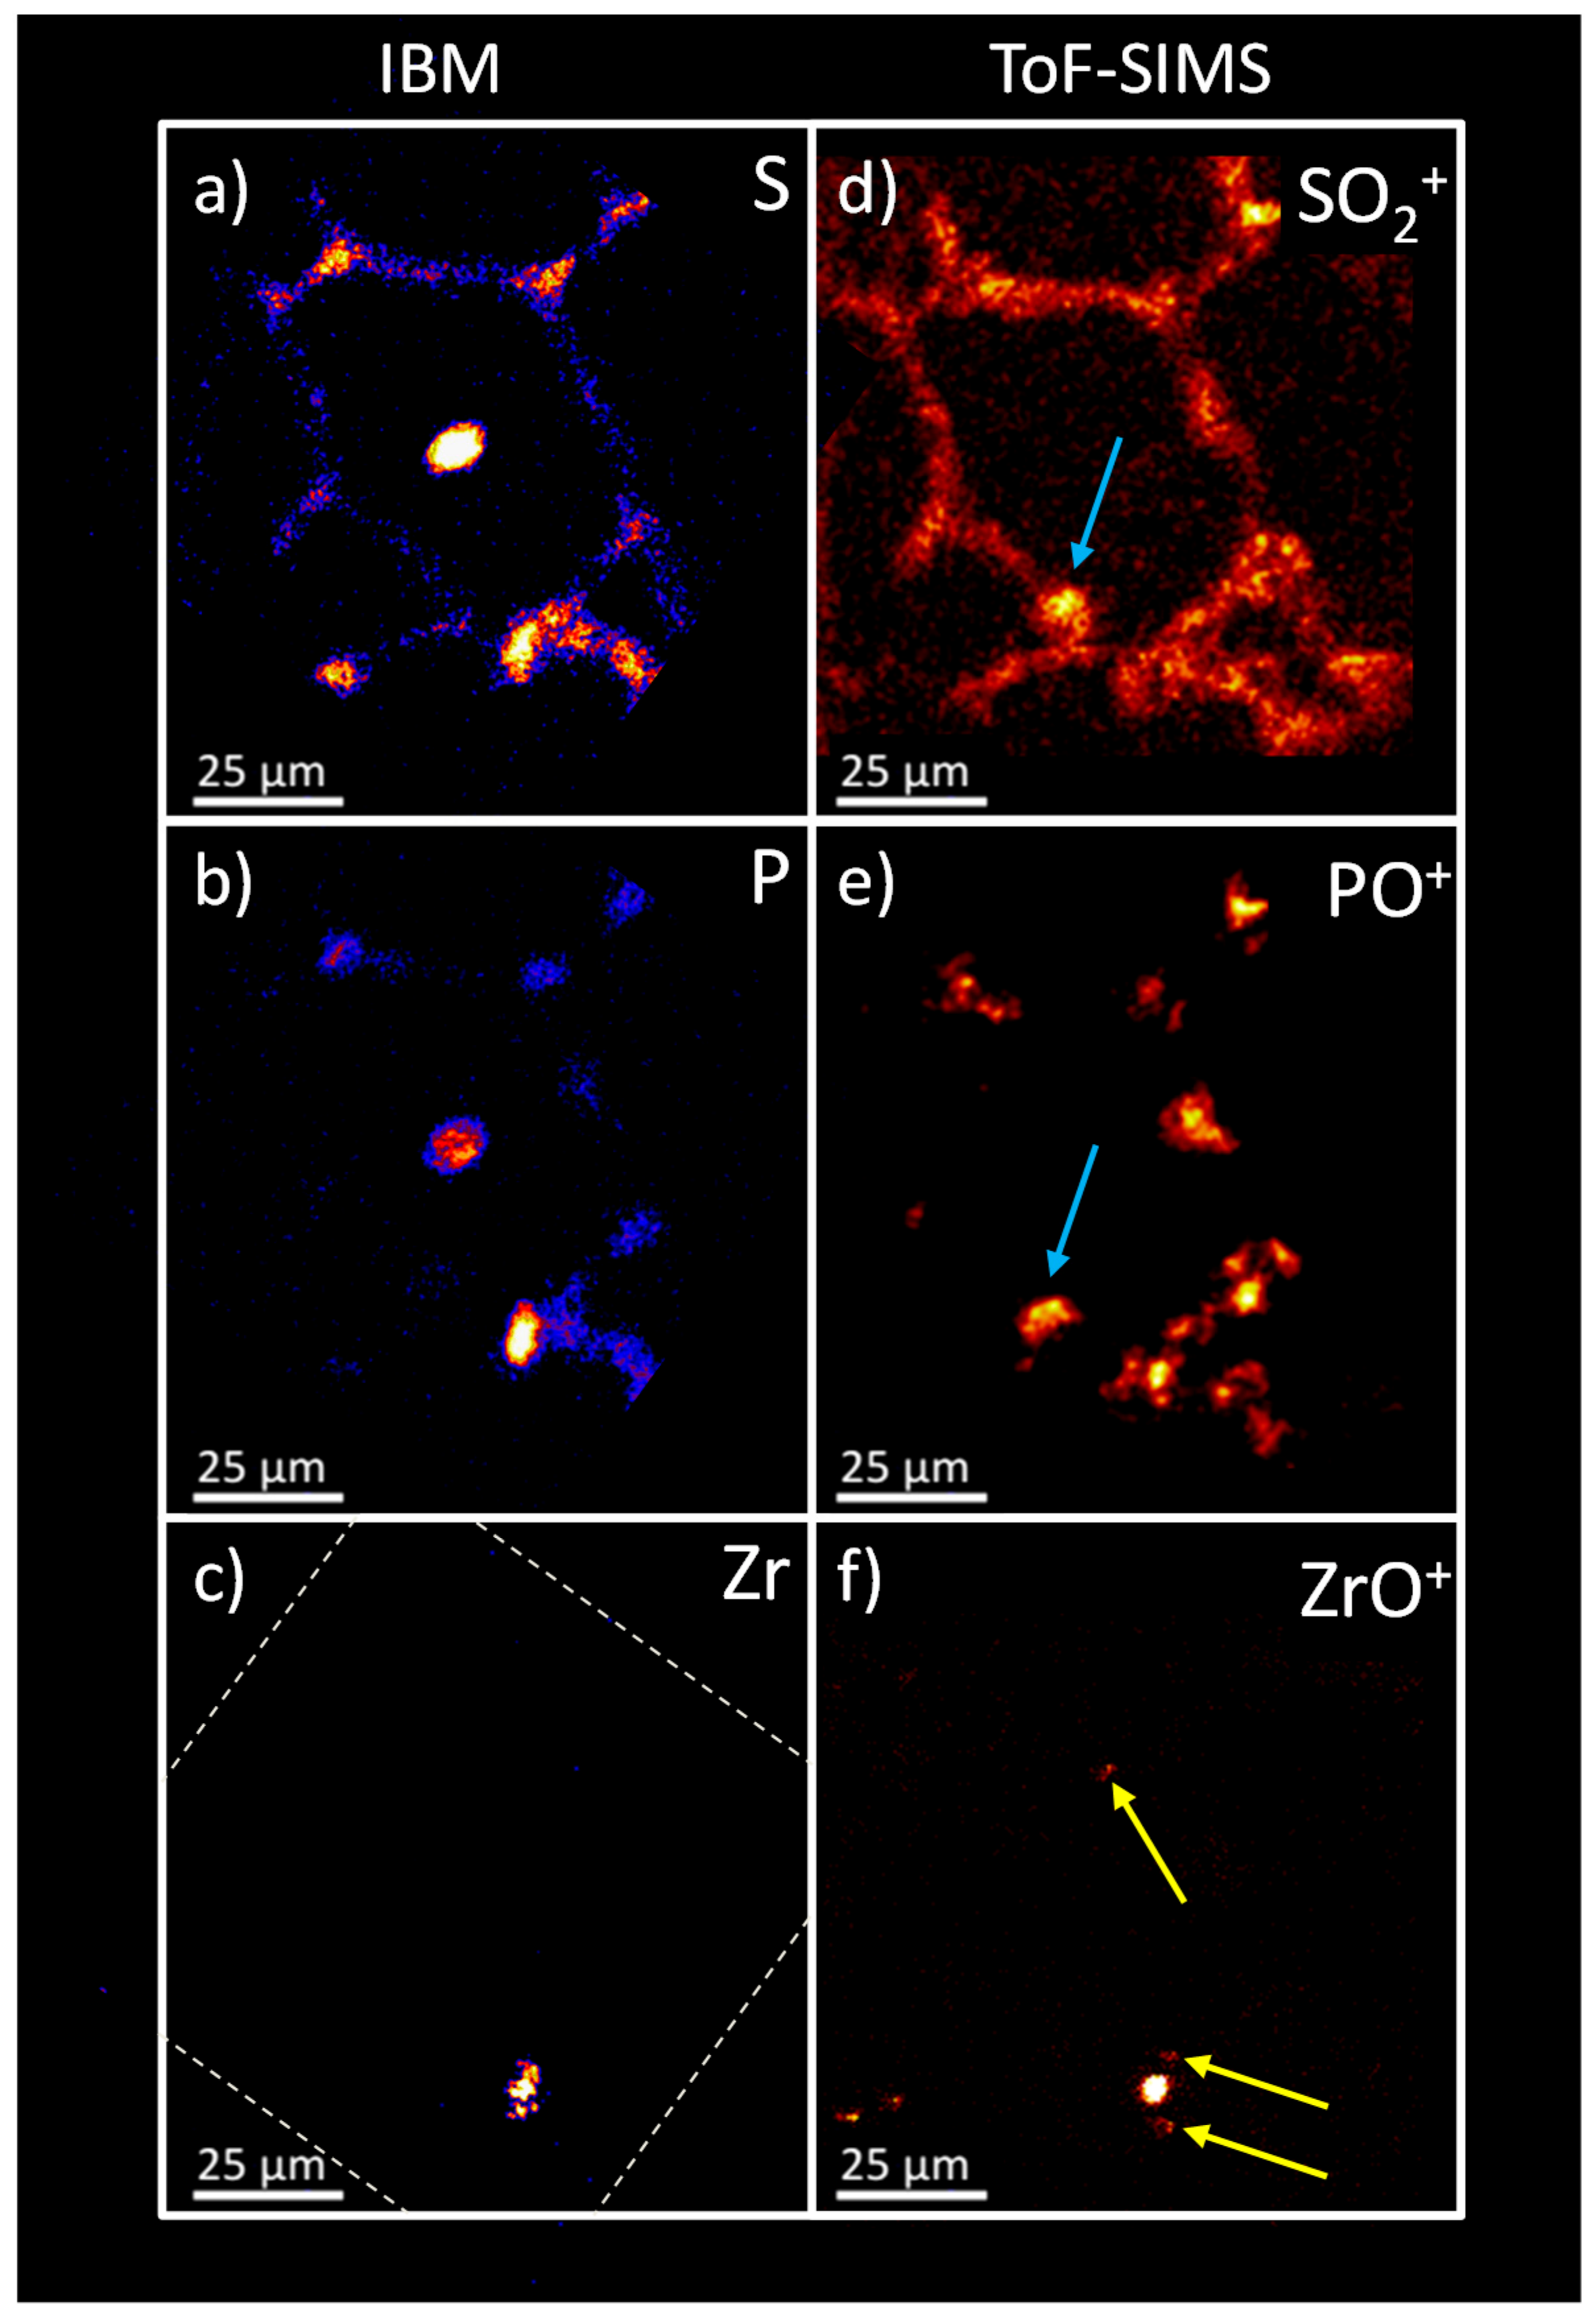
The results of the IBM analysis were compared to ToF-SIMS results (
Figure 8). Elemental distributions of the X-ray emission on the left (a–c) were compared to the oxygen containing secondary ion distributions on the right (d–f). For S and SO
2+, a high degree of correlation was obvious. With both techniques, a relatively weak signal distribution resembled the tissue structure with several higher intensity signals at the alveolar junctions. However, a difference was seen in the intense signal in the centre of the PIXE image (
Figure 8a,b). This central structure consisted of K, Ca, P, and Cl that formed a salt deposit as a result of the preparation process, and appeared to be an artifact (see above). Also, an indication for this deposit was found neither on micrographs taken after the IBM analysis (not shown), nor in the ToF-SIMS analysis. As the structure was found in the centre of an alveolus, where it was not linked to the tissue material, we assumed that this salt deposit was moved during transport. However, the ToF-SIMS distributions of SO
2+ and PO
+ both revealed an area similar in size and shape in the lower left corner of the alveolar structure (indicated by blue arrows) which might represent the salt deposit at its new position.
The P and PO+ distribution overall was highly similar. However, the ToF-SIMS image apparently presented the intense signals of the IBM at a higher resolution and enabled a more detailed assessment of the substructure compared to the IBM.
With respect to the Zr/ZrO
+ signals, a coincidence was obtained for the highly intense signal spot seen in the lower parts of
Figure 8c,f, although the detailed structure of Zr differed for both methods. Interestingly, the ToF-SIMS analysis revealed additional small ZrO
+ signals (
Figure 8f, yellow arrows), suggesting a lower limit of detection for the ToF-SIMS analysis along with a better lateral resolution. In fact, the routinely achieved lateral resolution in IBM experiments is about 1 µm, with limits of detection being in the parts-per-million (ppm) range [
15,
16]. In contrast, a lateral resolution of less than 30 nm (under ideal conditions) and limits of detection in the ppm-ppb (parts-per-billion) range may be achieved with ToF-SIMS analysis [
17,
18]. However, for both techniques the analytical parameters might still show some room for improvements. Prolonged measurement times and high performance detectors might lead to higher signal intensities and lower limits of detection in both instruments, but these were not available for this study. The application of high performance PIXE detectors will result in improved limits of detection and reduce measurement times. For ToF-SIMS, the amount of material eroded by the sputter beam per analysis cycle could be reduced to enhance the amount of material exposed to the analysis beam. It can be assumed that in particular for this analysis more signal intensity could be revealed under extended measurement conditions, since the majority of the signal intensity of the nanoparticles is only acquired towards the end of the analysis. Also, the lateral resolution (limited by the pixel number at a given Field-of-view to achieve a reasonably fast analysis) could be significantly improved for the detection of smaller agglomerates by selecting a smaller field-of-view or raising the pixel number per length unit. However, in favor of analyzing a larger area and measurement time constraints, a lateral resolution similar to the IBM was selected for this study.
The IBM provides element (inorganic) information [
2,
19,
20,
21], whereas ToF-SIMS detects inorganic and organic species [
22]. The detection of molecular information is only possible by ToF-SIMS, and works especially well for Ar-cluster ions. Therefore, in contrast to the IBM, ToF-SIMS also can serve for speciation analyses [
23,
24]. However, the certainty for the identification for even smaller quantities of small nanomaterials (i.e., weak signals) in a complex matrix in ToF-SIMS is challenging, because interfering signals could hinder the separation of small partially overlapping NP-related signals in crowded mass spectra. In IBM, the certainty of the identification depends on the assignment and selection of the correct emission lines and is comparatively high.
Quantitative information is routinely obtained for the IBM measurements without the need for standards or prior knowledge on the sample composition. In ToF-SIMS, quantitative information is only achievable by great efforts for simple, highly characterized samples (e.g., silicon wafers doped with boron) with the help of matrix-matched reference samples. For complex tissue samples, no simple routines exist for the quantification only based on ToF-SIMS results. Matrix effects are reported for ToF-SIMS as well, whereas the IBM does not suffer from severe matrix effects.
Depth information in IBM analyses is directly obtained via the RBS spectrometry, which also provides direct information if materials are internalized into cells or covered by tissue material. Depth resolutions of 100 nm are achieved [
2,
19]. In ToF-SIMS, depth information is accessed via repeated cycles of surface analysis and surface erosion. Consequently, information on the internalization of materials can be obtained by interpreting the appearance of signals in successive scans. Furthermore, depth distributions as well as 3D distributions of signals can be analyzed. Depth resolutions of about 20 and 10 nm were published for low energy Cs and Ar-cluster ion sputtering of multilayer amino acid films, respectively [
25]. However, this excellent resolution comes at the cost of analysis time, which is increasing with lower energy ions (i.e., lower sputter yields).
Both ToF-SIMS and ion beam microscopy need vacuum conditions. Vacuum compatibility for biological samples can be achieved by chemical fixation or analysis in the frozen state [
26,
27,
28].
The influence of the proton beam on the samples integrity was estimated as the site of the analysis is visible in the successive ToF-SIMS images and a slightly higher amount of small organic fragments was found in the irradiated area. However, the extent of the damaging influence was not fully assessed during this study (compare
Figure 7f). In comparison, ToF-SIMS 3D imaging, by nature, is a sample consuming technique. This is because signals can only be acquired if the respective materials are sputtered and ionized. Especially for the sensitive detection of low amounts of particle within complex matrices, it is necessary to obtain as much intensity as possible i.e., consume as much material as possible to ensure a comprehensive detection of all nanoparticles.
While ToF-SIMS already is a large and complex instrument, the IBM is still much more demanding in terms of size and complexity. Consequently, the pricing of commercially available ToF-SIMS instruments is much lower than for the IBM instruments, which need elaborate particle accelerators and a variety of detection components and are not available as complete kits. The time requirements for ToF-SIMS analyses of a single biological tissue area under the conditions shown here typically are in the order of 8–16 h (depending on the depth resolution and sample thickness). For the IBM measurements, approximately one hour is needed to reach ppm detection limits, however, these large-scale devices usually are shared among several institutions. In consequence, “beam time” for measurements is precious.
In summary, each technique revealed the position of nanoparticle agglomerations within a tissue section individually and in a successive analysis of the same section. Significant congruency in the lateral distributions for phosphorous, sulfur and zirconium enabled a cross-validation of the results of both techniques. Due to its non-consuming nature and high lateral resolution, the IBM analysis enhances the confidence for the assignments of low intensity signals (especially for nanomaterials) in ToF-SIMS analyses and allows a cross-validation for early ToF-SIMS method development studies.
A promising strategy for achieving quantitative information in ToF-SIMS might be achieved by using IBM and ToF-SIMS for selected samples to obtain quantitative information and establish sensitivity factors for defined experimental conditions/sample matrices.

 ,
, 