Rapid Detection of Flusilazole in Pears with Au@Ag Nanoparticles for Surface-Enhanced Raman Scattering

1
College of Food Science and Technology, Shanghai Ocean University, No. 999 Hucheng Huan Road, Lin Gang New City, Shanghai 201306, China
2
School of Chemistry and Biological Engineering, Changsha University of Science & Technology, Changsha 410004, China
3
Engineering Research Center of Food Thermal Processing Technology, Shanghai Ocean University, Shanghai 201306, China
*
Author to whom correspondence should be addressed.
Nanomaterials 2018, 8(2), 94; https://doi.org/10.3390/nano8020094
Submission received: 2 January 2018
/
Revised: 23 January 2018
/
Accepted: 1 February 2018
/
Published: 8 February 2018
Abstract
:Residual pesticides in vegetables or fruits have been become one of the world’s most concerned food safety issues. Au-Ag core-shell nanoparticles (Au@Ag NPs) coupled with surface-enhanced Raman spectroscopy (SERS) was used for analysis of flusilazole which was widely applied in pears. Three different diameters of Au@Ag NPs were prepared to select the best SERS substrate for analyzing flusilazole. The Au@Ag NPs sizes of 90 ± 7 nm showed the highest enhancement effect and could be detected flusilazole standard solution and the minimum detectable concentration was 0.1 mg/L. Flusilazole in pear could also identified at as low as 0.1 μg/g. The amount of adsorbent is critical in the sample preparation process and the best amount of each absorber dosage was 0.6 g MgSO4, 0.2 g C18 and 0.2 g primary secondary amine (PSA). The experimental results indicated a good linear relationship between the Raman intensities of chief peaks and the concentrations of flusilazole solutions (R2 = 0.924–0.962). This study shows that Au@Ag as SERS substrate has great potential to analyze of flusilazole in food matrices.
1. Introduction
Flusilazole, 1-[[bis(4-fluorophenyl)methylsilyl]methyl]-1H-1,2,4-triazole is a highly effective and broad-spectrum organosilicon fungicide that has been widely used to control plant diseases such as black spot or scab of pear, powdery mildew on cereal, wheat leaf rust and stripe rust and barley leaf spot [1]. To ensure the safety of food supplies, the maximum residual levels of flusilazole in certain plant source foods are regulated, which generally ranged from 0.05 μg/g (e.g., soybean, beetroot) to 0.5 μg/g (e.g., melons, small berries) depending on the types of foods [2]. Similar to the analysis of other residual pesticides, quantification of flusilazole in plant source foods is mainly based upon chromatographic methods such as high-performance liquid chromatography (HPLC), liquid chromatography-tandem mass spectrometry (LC-MS/MS), gas chromatography–tandem mass spectrometry (GC-MS/MS) [3,4,5]. However, chromatography-based analytical methods are usually expensive, lengthy and require professional operation. It has been always of significance to develop a simplified method to replace the chromatographic based methods. During the past decade, surface-enhanced Raman spectroscopy has attracted increasing concern from researchers in the area of analyzing trace chemical hazards in various foods, agricultural produce and environments [6,7,8,9,10,11,12,13]. Among all the potential applications of SERS, detection of residual insecticides, herbicides and fungicides in fruits and vegetables is one of the most active areas. For examples, Zhu synthesized multi-branched gold nanostars as SERS substrate for analysis of thiram and the lowest detected was 10−10 M in solution and 0.24 ng/cm2 in apple peels [14]; Li reported a simple method to prepare core-shell Ag2O@Ag NPs with Polymethyl methacrylate (PMMA) for the detection of chlorpyrifos with as low as 10−7 M on apple and cucumber peels [15]; Fang used Ag NPs as flexible SERS substrate to detect 10−9 M paraquat on the apple and pear peels [16]; Luo fabricated Au NPs to detect phosmet and thiabendazole in apple and the lowest detectable level was 0.5, 0.1 μg/g, respectively [17].
Some special substrates, mainly noble metals (e.g., Au and Ag) with nanoscale roughened surfaces or colloidal nanoparticles, have to be used to achieve tremendous enhancement effect for the Raman signal of a trace chemical. However, due to the complex nature of SERS phenomena, there is no universal substrate that can be applied for detection of all different chemicals and choosing an appropriate substrate is generally considered as the most important factor to achieve successful SERS applications [18,19]. Silver and gold bimetallic nanoparticles have shown tremendous advantages over commonly used gold or silver substrates [20]. Au-Ag core-shell nanoparticles (Au@Ag) could overcome the instability of silver NPs while keep the advantage of its higher enhancement effect [21,22]. In addition, the overall particle size of Au@Ag and its surface plasmon resonance (SPR) could be tuned by adjusting the ratio of Au to Ag to achieve the best enhancement effect for the analyte [23].
The aim of this study was to explore the feasibility of using Au@Ag as SERS substrate to analyze flusilazole in fruits. Au@Ag varied in particle size and the ratio of two metals were tested to achieve the best enhancement effect for detection of flusilazole. This study proposed a SERS-based quick and sensitive analytical method that could be used to detect other pesticides in fruits and vegetables.
2. Materials and Methods
2.1. Preparation of Standard Solutions
Flusilazole purchased from Sigma-Aldrich (≥99%, Sigma-Aldrich, St. Louis, MO, USA) was dissolved into acetonitrile (HPLC reagent, J&K Scientific, Logan, UT, USA) aqueous solution (50%, v/v) to prepare flusilazole standard solution with different concentrations. (0.1, 0.2, 0.5, 1 and 2 mg/L).
2.2. Synthesis of Au@Ag Nanoparticles
Au@Ag NPs was prepared by citrate reduction and seed-induced growth methods which described in our previous study [23]. Firstly, gold colloids were obtained as seeds with the Frens method which is a HAuCl4-citrate reduction method in 1973 [24]. Next, l-ascorbic acid (0.1 mol/L, 1.20 mL) and as-prepared Au seed (0.4, 0.5, 0.9 mL) were mixed in a 20 mL glass vial and stirred continuously. AgNO3 solution (0.01 mol/L, 2.70 mL) was added drop by drop into the above vial to form Au@Ag NPs with keeping stirring. The sizes of Au@Ag NPs could be adjusted by controlling amount of gold colloids (0.4, 0.5 and 0.9 mL) when silver shell was formed and the color of Au@Ag colloid changed from cream to orange as the increase of gold colloids used. The optical characteristics of gold colloids and three different Au@Ag NPs were performed on ultraviolet-visible (UV-Vis) absorbance spectroscopy (UV3000PC, MAPADA Instruments Ltd., Shanghai, China). The sizes and shapes of the Au@Ag NPs were characterized with a transmission electron microscopy (TEM, JEM-2100F, JEOL Ltd., Tokyo, Japan) and each size of Au@Ag NPs was averaged according to 50 Au@Ag particles in TEM images.
2.3. Sample Preparation
The method of extracting flusilazole from pears was based on QuEChERS method which was widely used in pesticide residues pre-treatment analysis [25]. In brief, pear samples were homogenized and spiked with various concentrations of fulsilazole (0-control, 0.1, 0.2, 0.5, 2, 5 μg/g). Different spiked pear (10 g) was then vigorously mixed with acetonitrile (20 mL), 3 g NaCl and 3 g MgSO4 for 1 min and centrifuged at 4000 rpm for 5 min. Next some sorbents were added into samples in order to cleanup food matrix. 2 mL supernatant was transferred into 15 mL centrifuge tube, added 0.6 g MgSO4, 0.2 g PSA sorbent and 0.2 g C18 sorbent, then dramatically shook for 1 min, then centrifuged at 4000 rpm for 5 min to eliminate non-targeted compounds such as organic acids, pigment, excess water. The final supernatant was moved to a 5 mL tube for the following SERS analysis, the above sample pretreatment steps were performed with 3 replicates for polluted pear at each concentration.
2.4. SERS Measurement
The normal Raman spectrum and SERS spectra of flusilazole standard solutions or pear extracts were obtained by a Nicolet DXR microscopy Raman spectrometer (Thermo Fisher Scientific Inc., Waltham, MA, USA) coupled with a 633 nm He-Ne laser with 6 mW laser power, 20× objective with a slit width of 50 cm−1. To acquire SERS spectra, 100 μL Au@Ag NPs were mixed with flusilazole standard solution or pear extract (2:1, v/v) for 10 s. 5 μL intermixture was pipette onto a neat and tidy glass slide and dried at 50 °C to volatilize the solvent. Ten spectra from different locations on the surface of the substrate were averaged for data analysis. Each experiment was repeated in triplicate.
3. Results and Discussion
3.1. Spectral Features of Flusilazole
Figure 1 shows chemical structure, Raman spectrum and the band assignments for characteristic peaks of flusilazole. The major prominent peaks of flusilazole at 804 and 827 cm−1 are attributed to C=C and C–N stretching, respectively [26]. The other major characteristic peaks appeared at 1588 cm−1 due to in-plane ring deformation mode of C=C, C–H scissoring vibration (1168 cm−1), C–F stretching vibration (1103 cm−1), C–N stretching vibration (1355 cm−1), as well as out-plane ring deformation (628 cm−1) [27,28].
3.2. Selection of Different Size Au@Ag Nanoparticles for Fulsilazole
It is well known that the size, degree of aggregation and the shape of the nanosubstrates have a crucial effect on the SERS enhancement effect [29,30]. The enhancing effect of particle size on SERS technology are relatively complicated and affected by many factors and the appropriate nanoparticle size for special application of SERS is often based on extensive experimental data through comparing the result of different sizes of nanoparticles as SERS substrate detecting targeted compound [31,32].
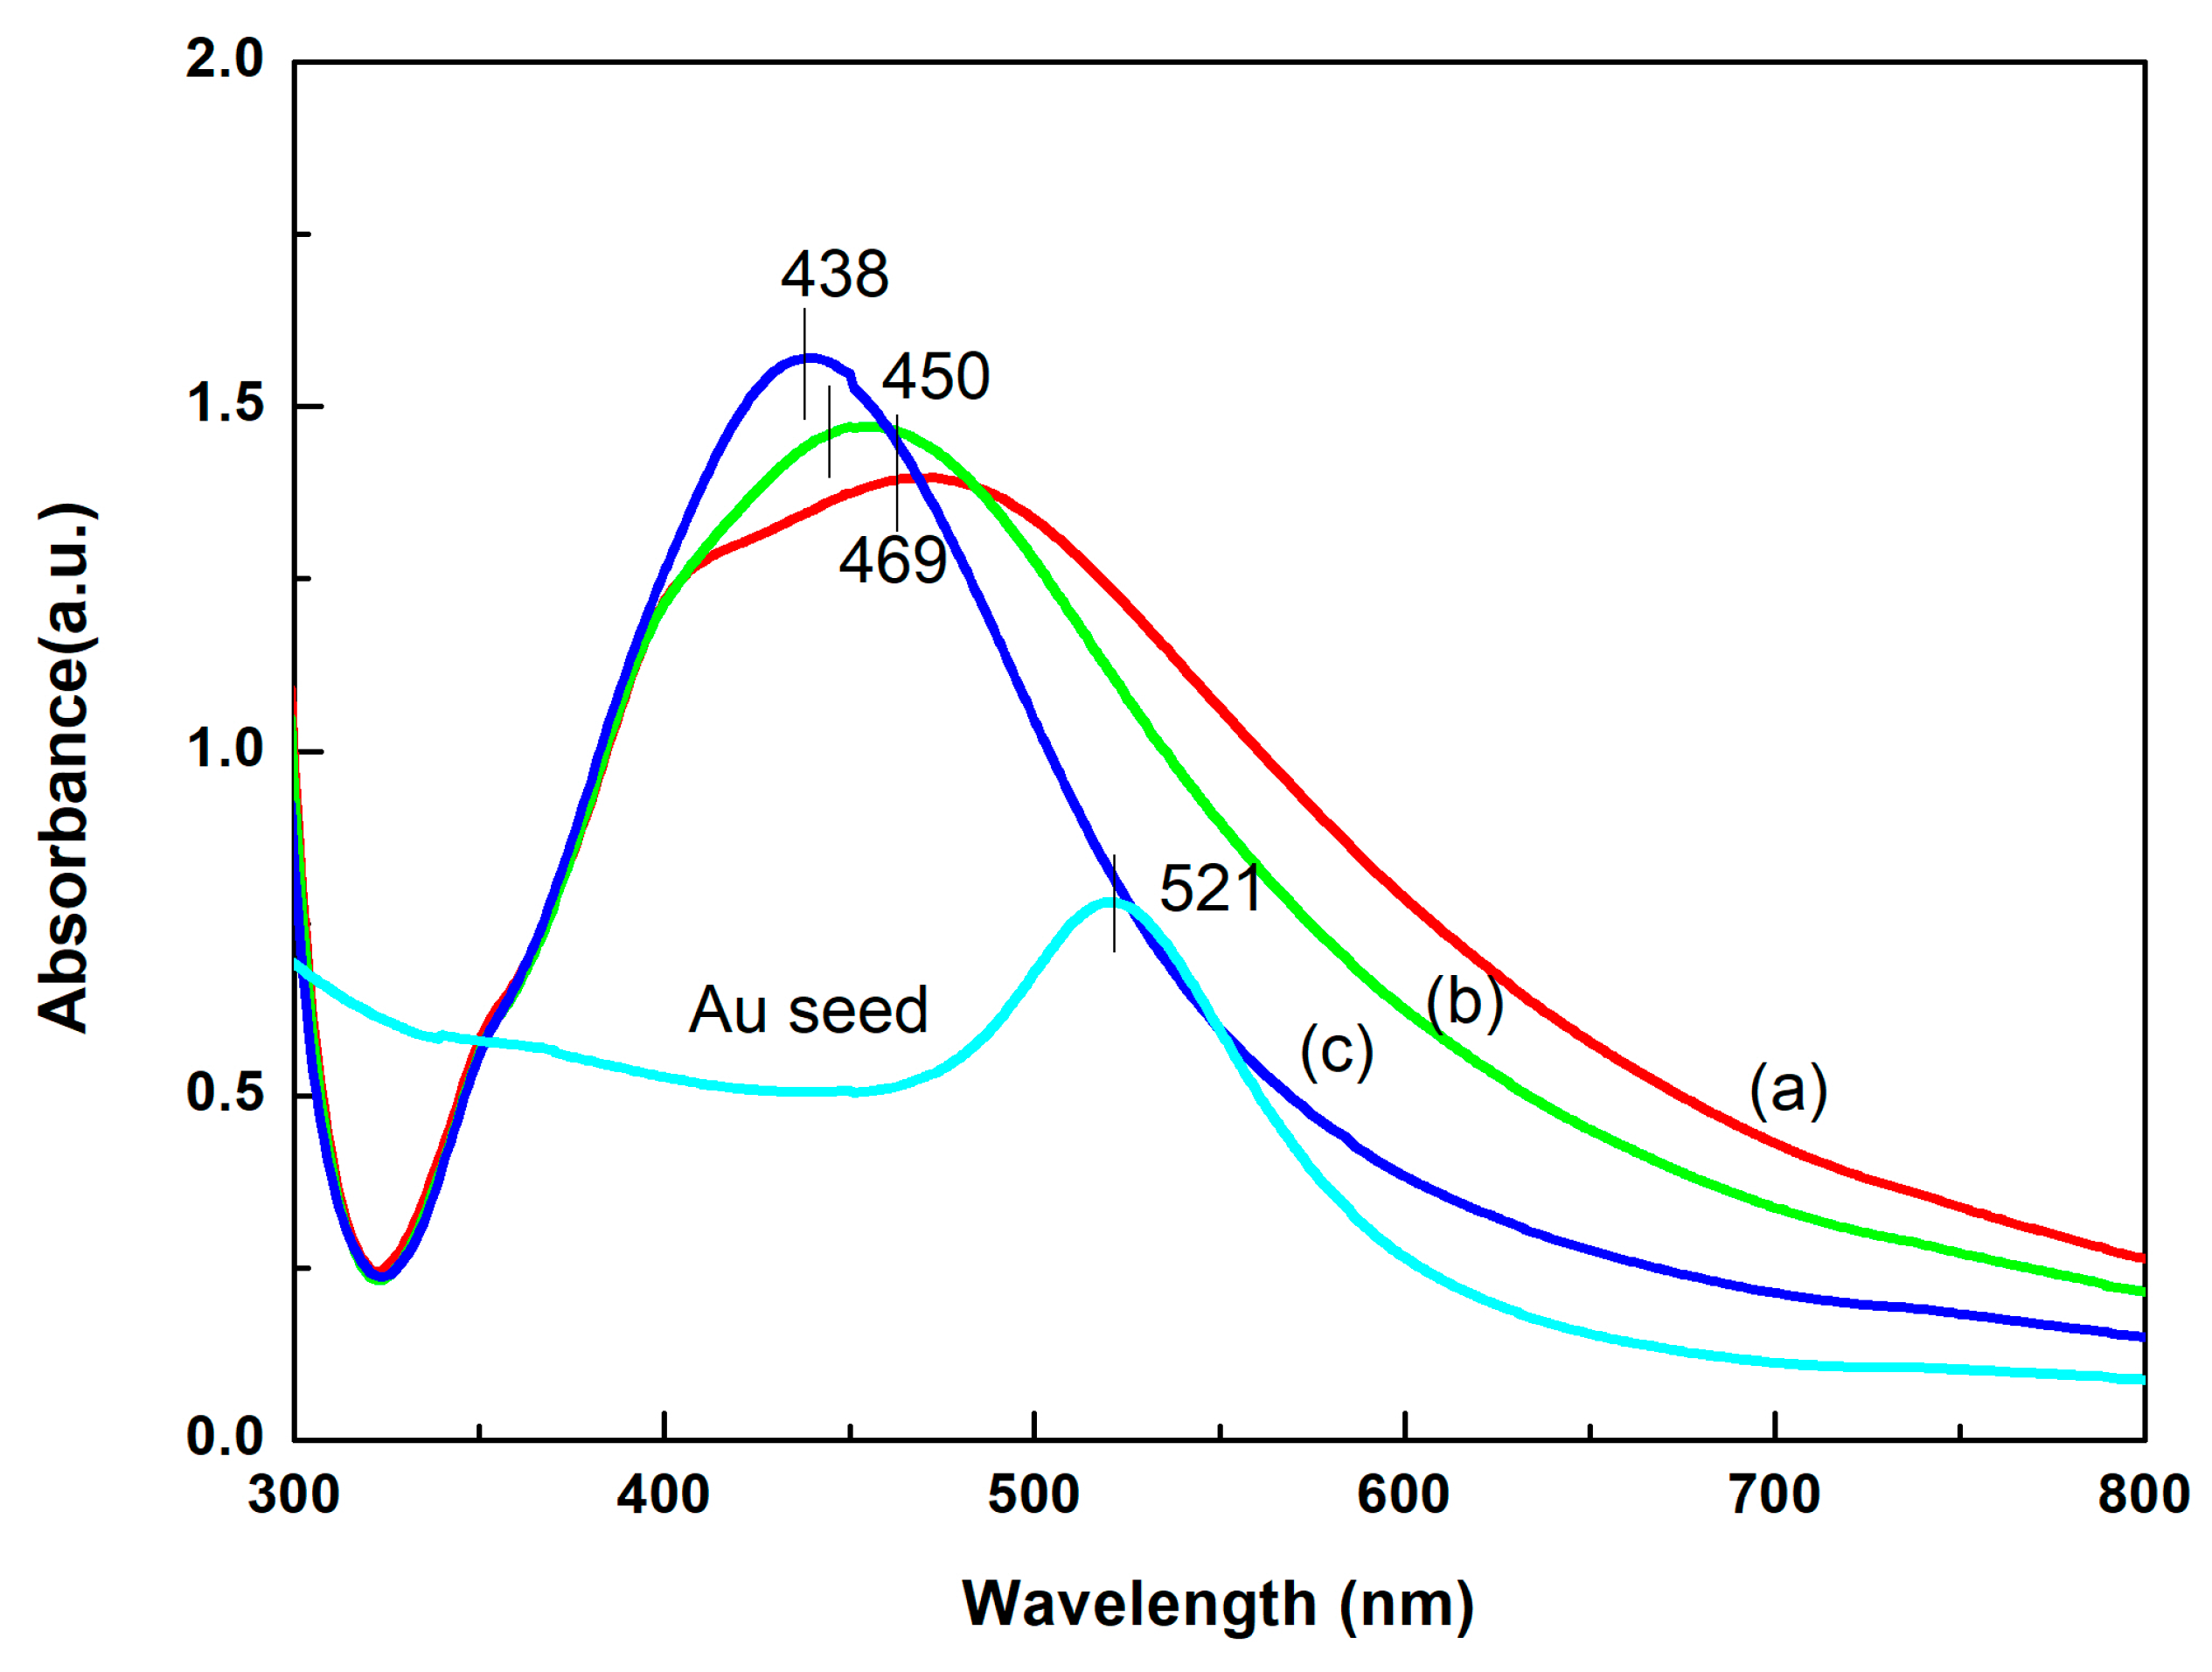
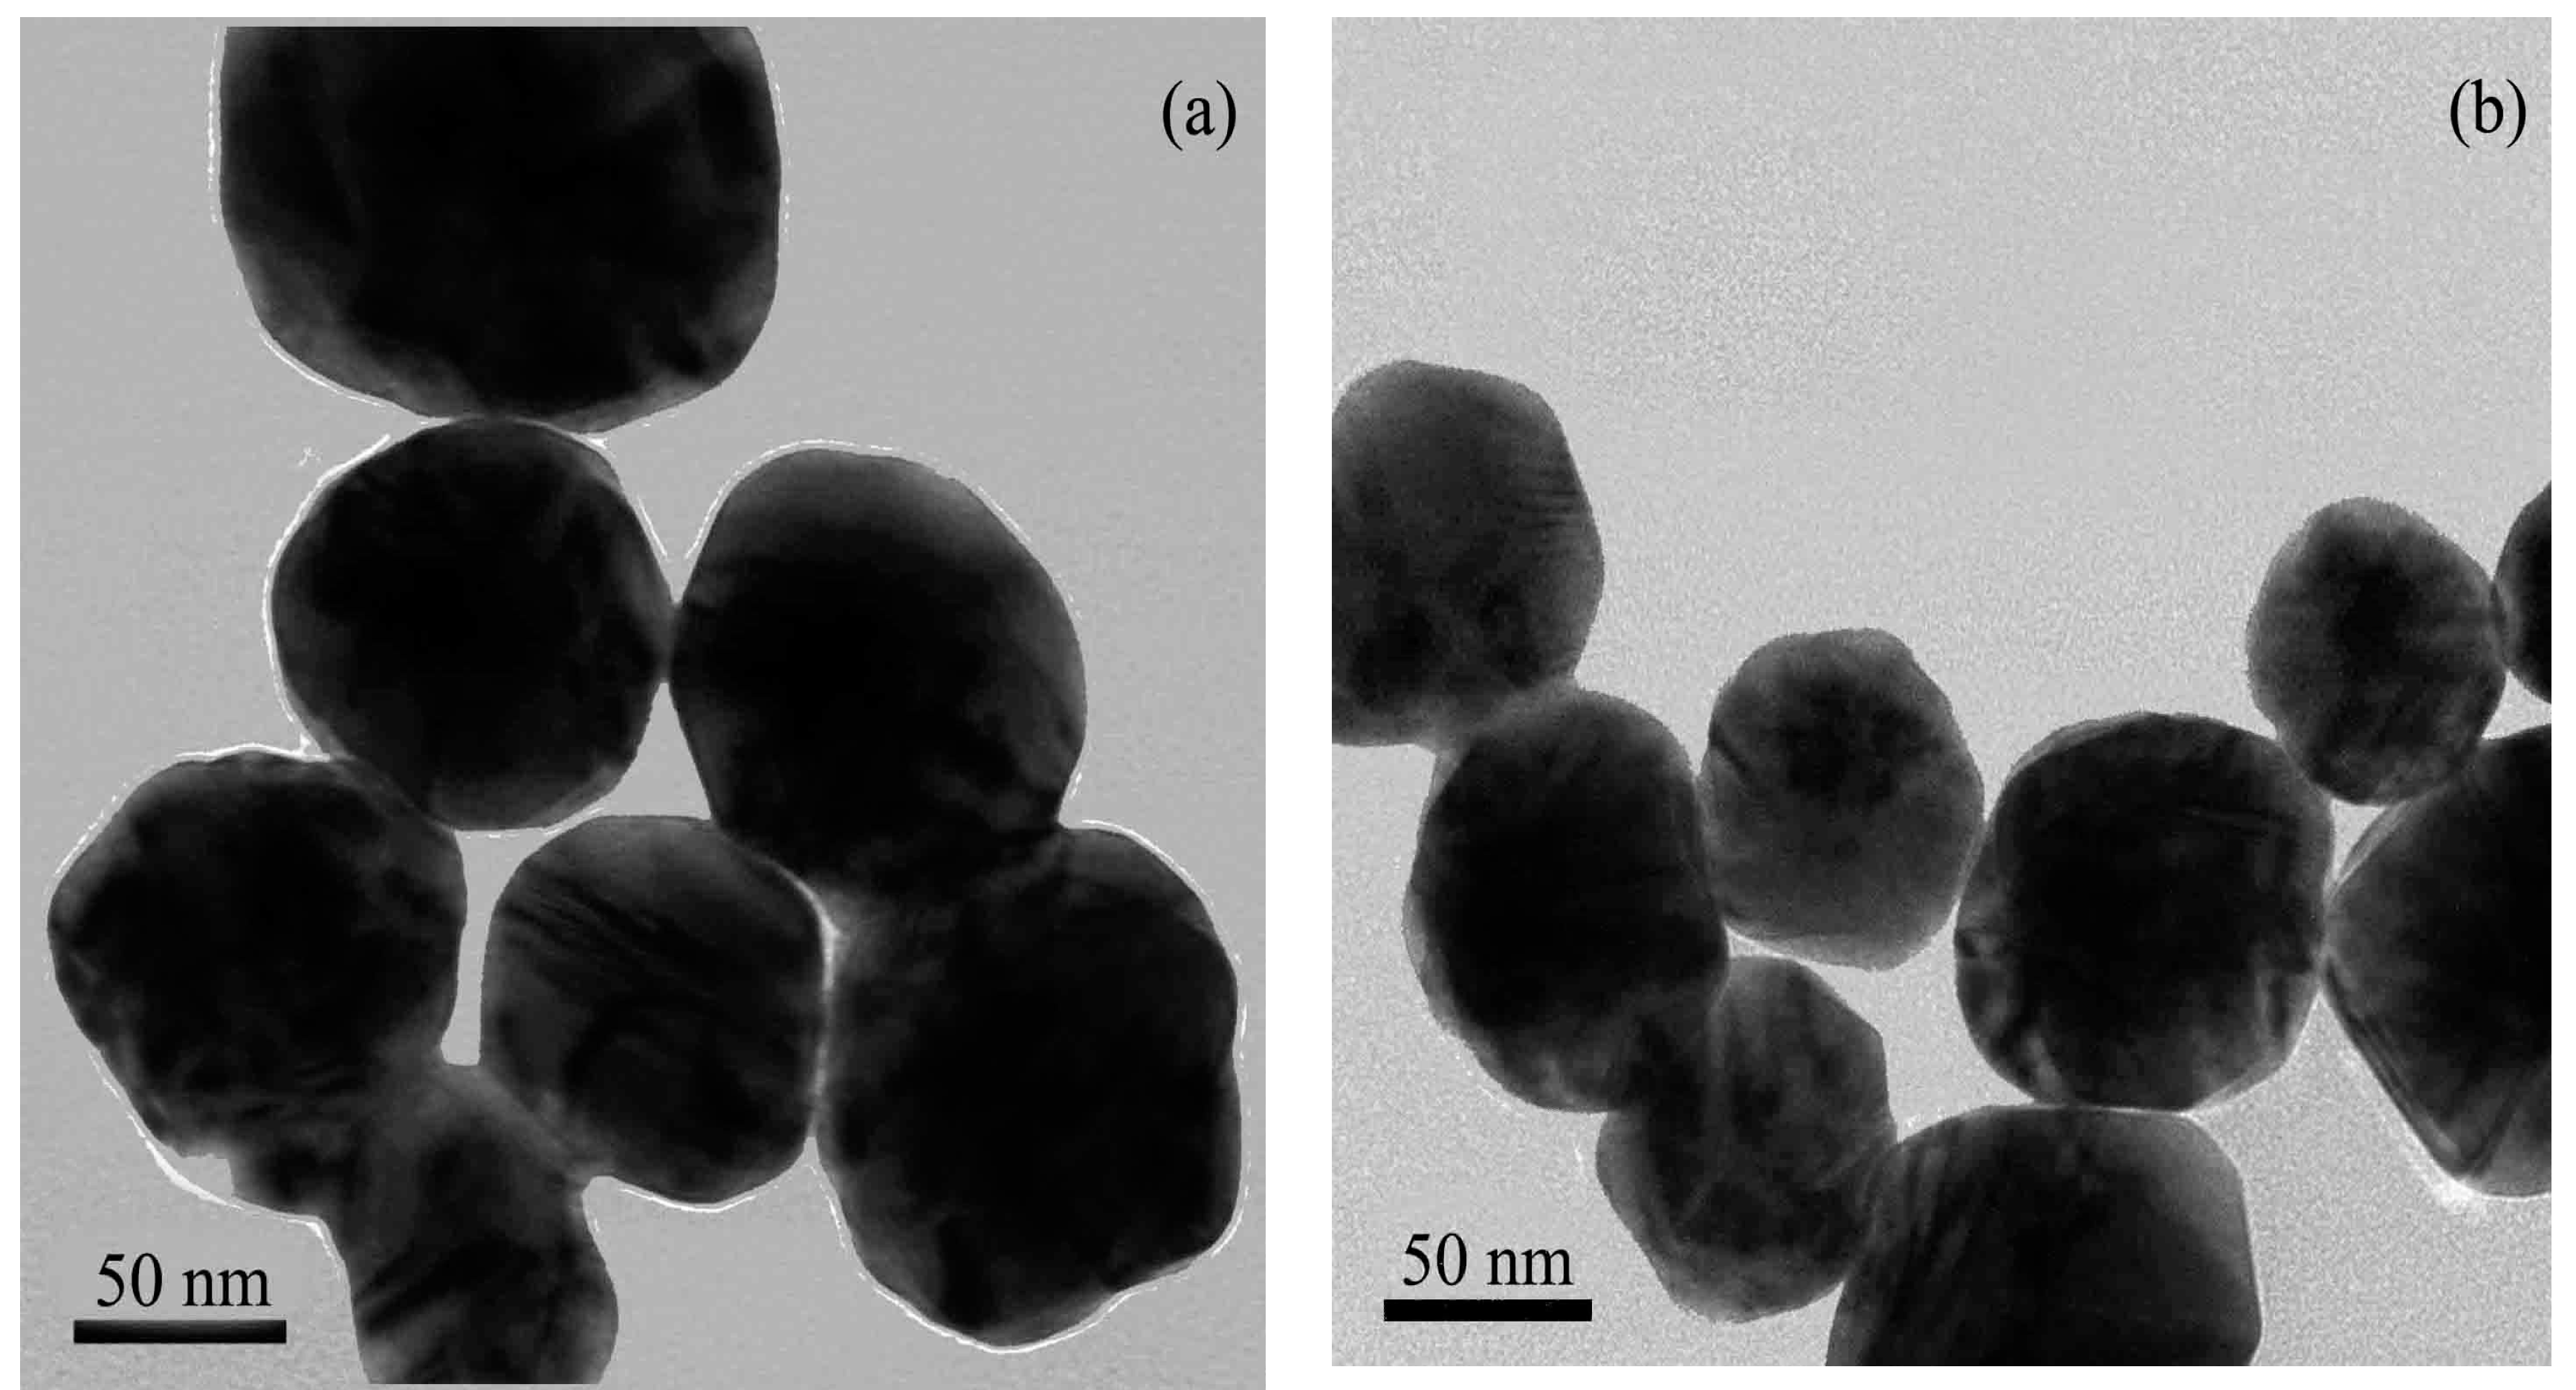
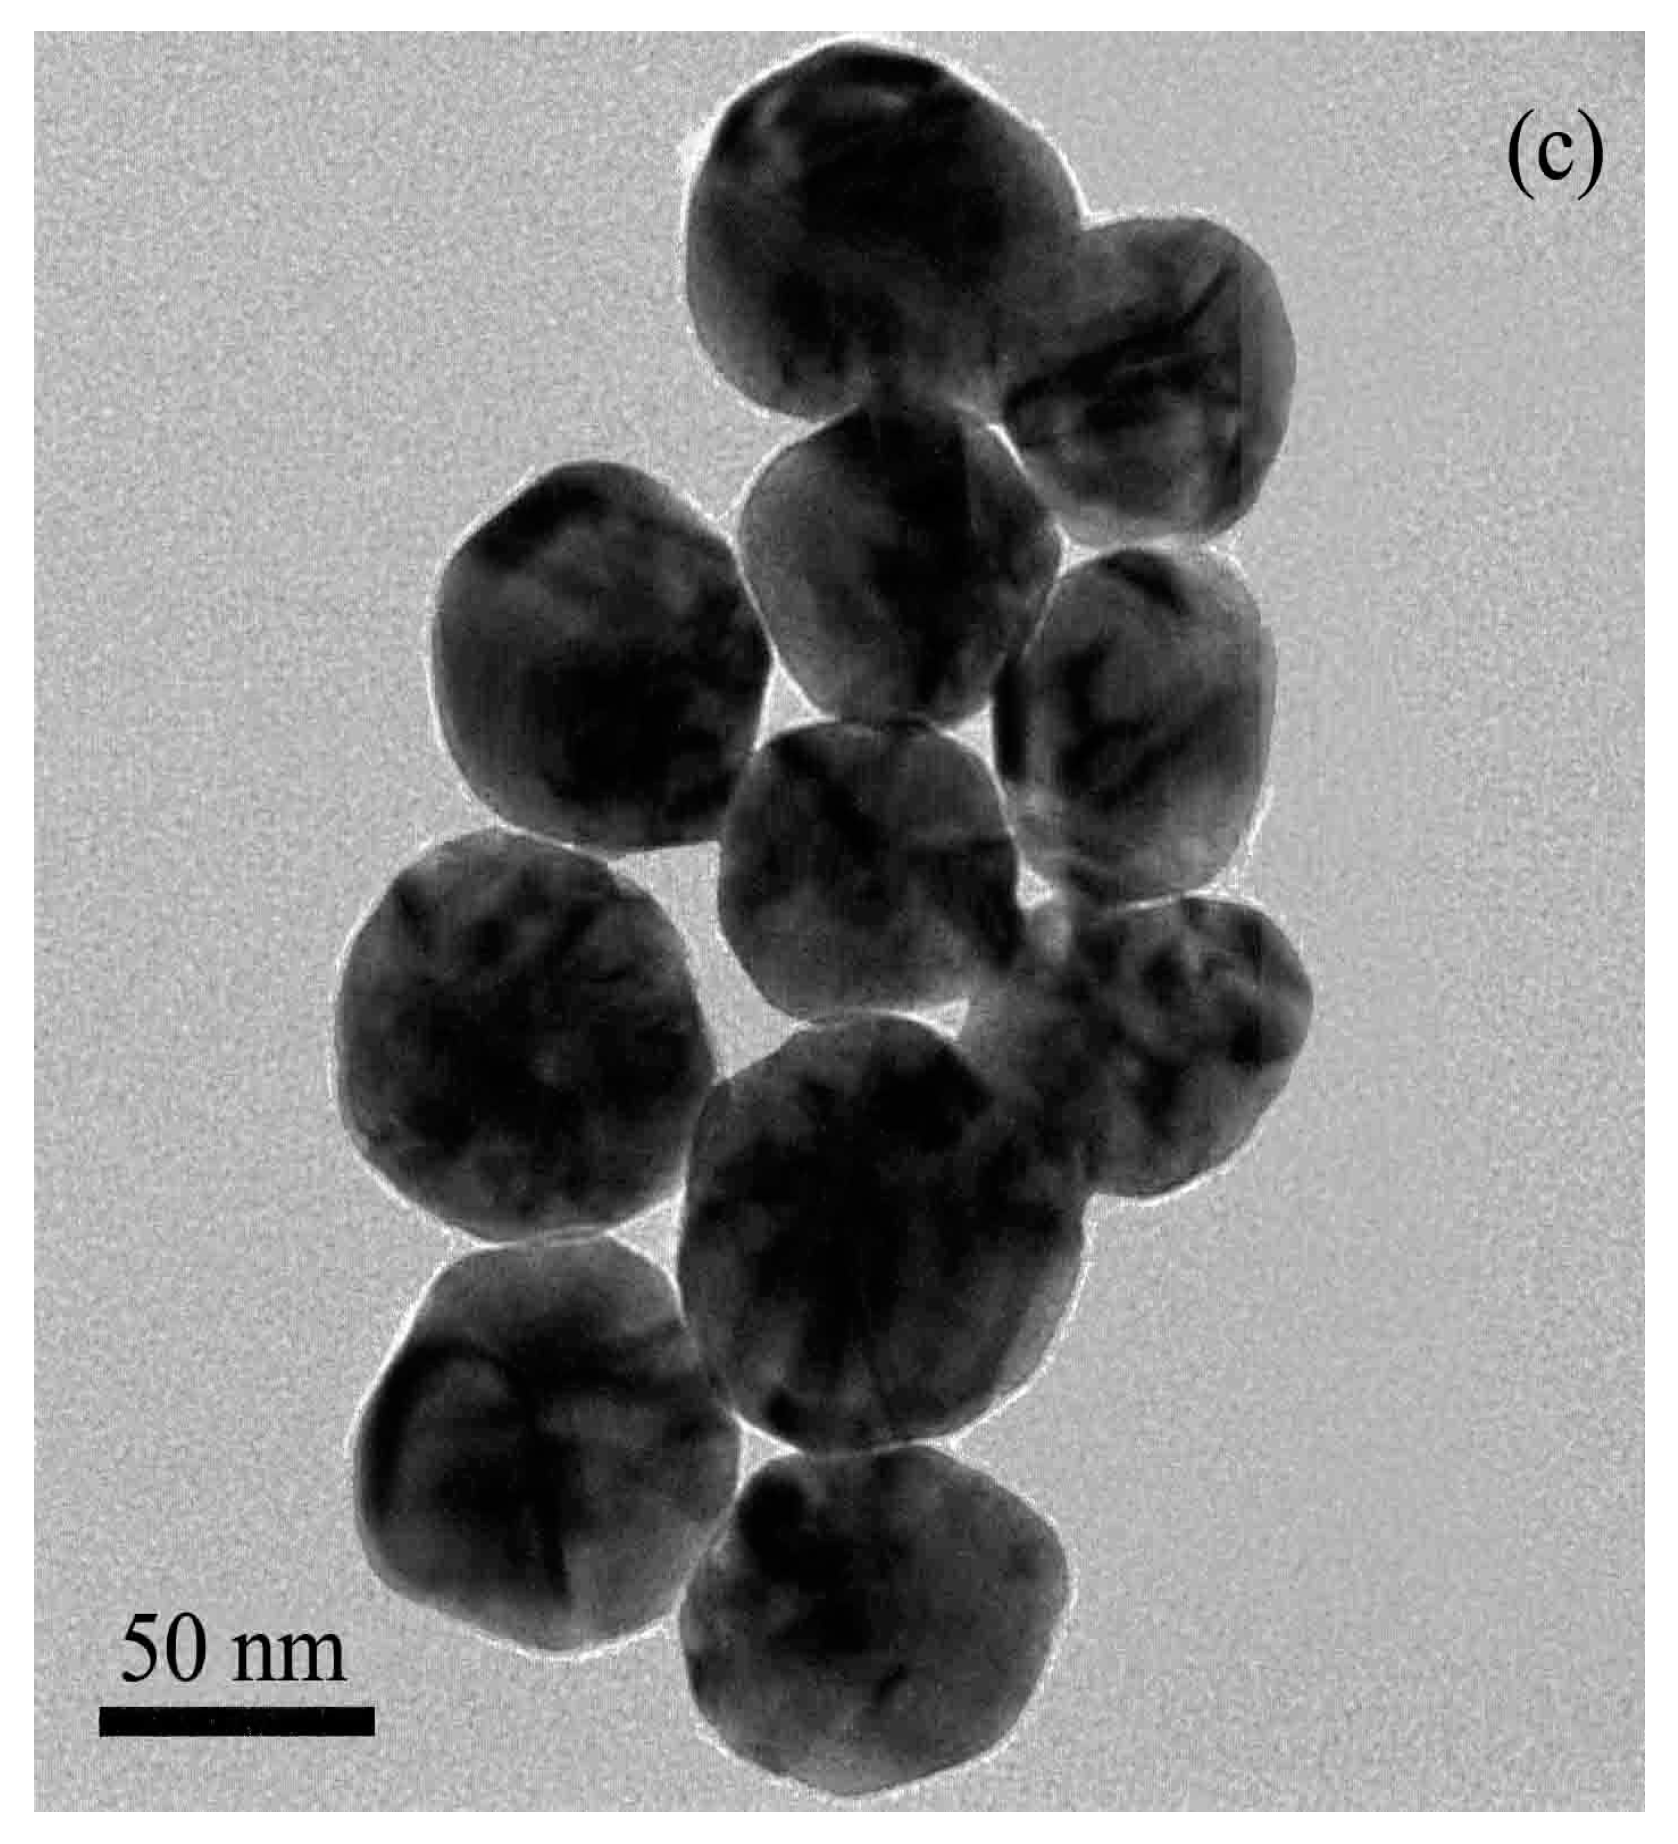
Figure 2 shows the surface plasmon resonance (SPR) peaks of gold colloids, which was observed at 521 nm and the SPR peaks of three different Au@Ag NPs were blue-shifted from 469 to 438 nm with the amount of colloidal Au seeds increasing from 0.4 to 0.9 mL. The average diameters of the three substrates were 98 ± 6, 90 ± 7 and 65 ± 4 nm based on the TEM image of Au@Ag NPs (Figure 3). The results indicated the sizes of Au@Ag NPs were decreased with the increase of Au seed amount, which led to the blue-shift of SPR peaks.
Compared with SERS spectra of the concentration of 1 and 0.1 mg/L flusilazole, there could not be detected by conventional Raman (Figure 4a), while the SERS intensities of flusilazole were largely affected by the sizes of Au@Ag NPs. As shown in Figure 4a,b, Au@Ag NPs of 90 ± 7 nm led to the best SERS enhancement effect, particularly for 0.1 mg/L concentration. Therefore, the 90 ± 7 nm Au@Ag NPs was used for following experiments for the analysis of flusilazole.
3.3. Analysis of Flusilazole Standard Solutions
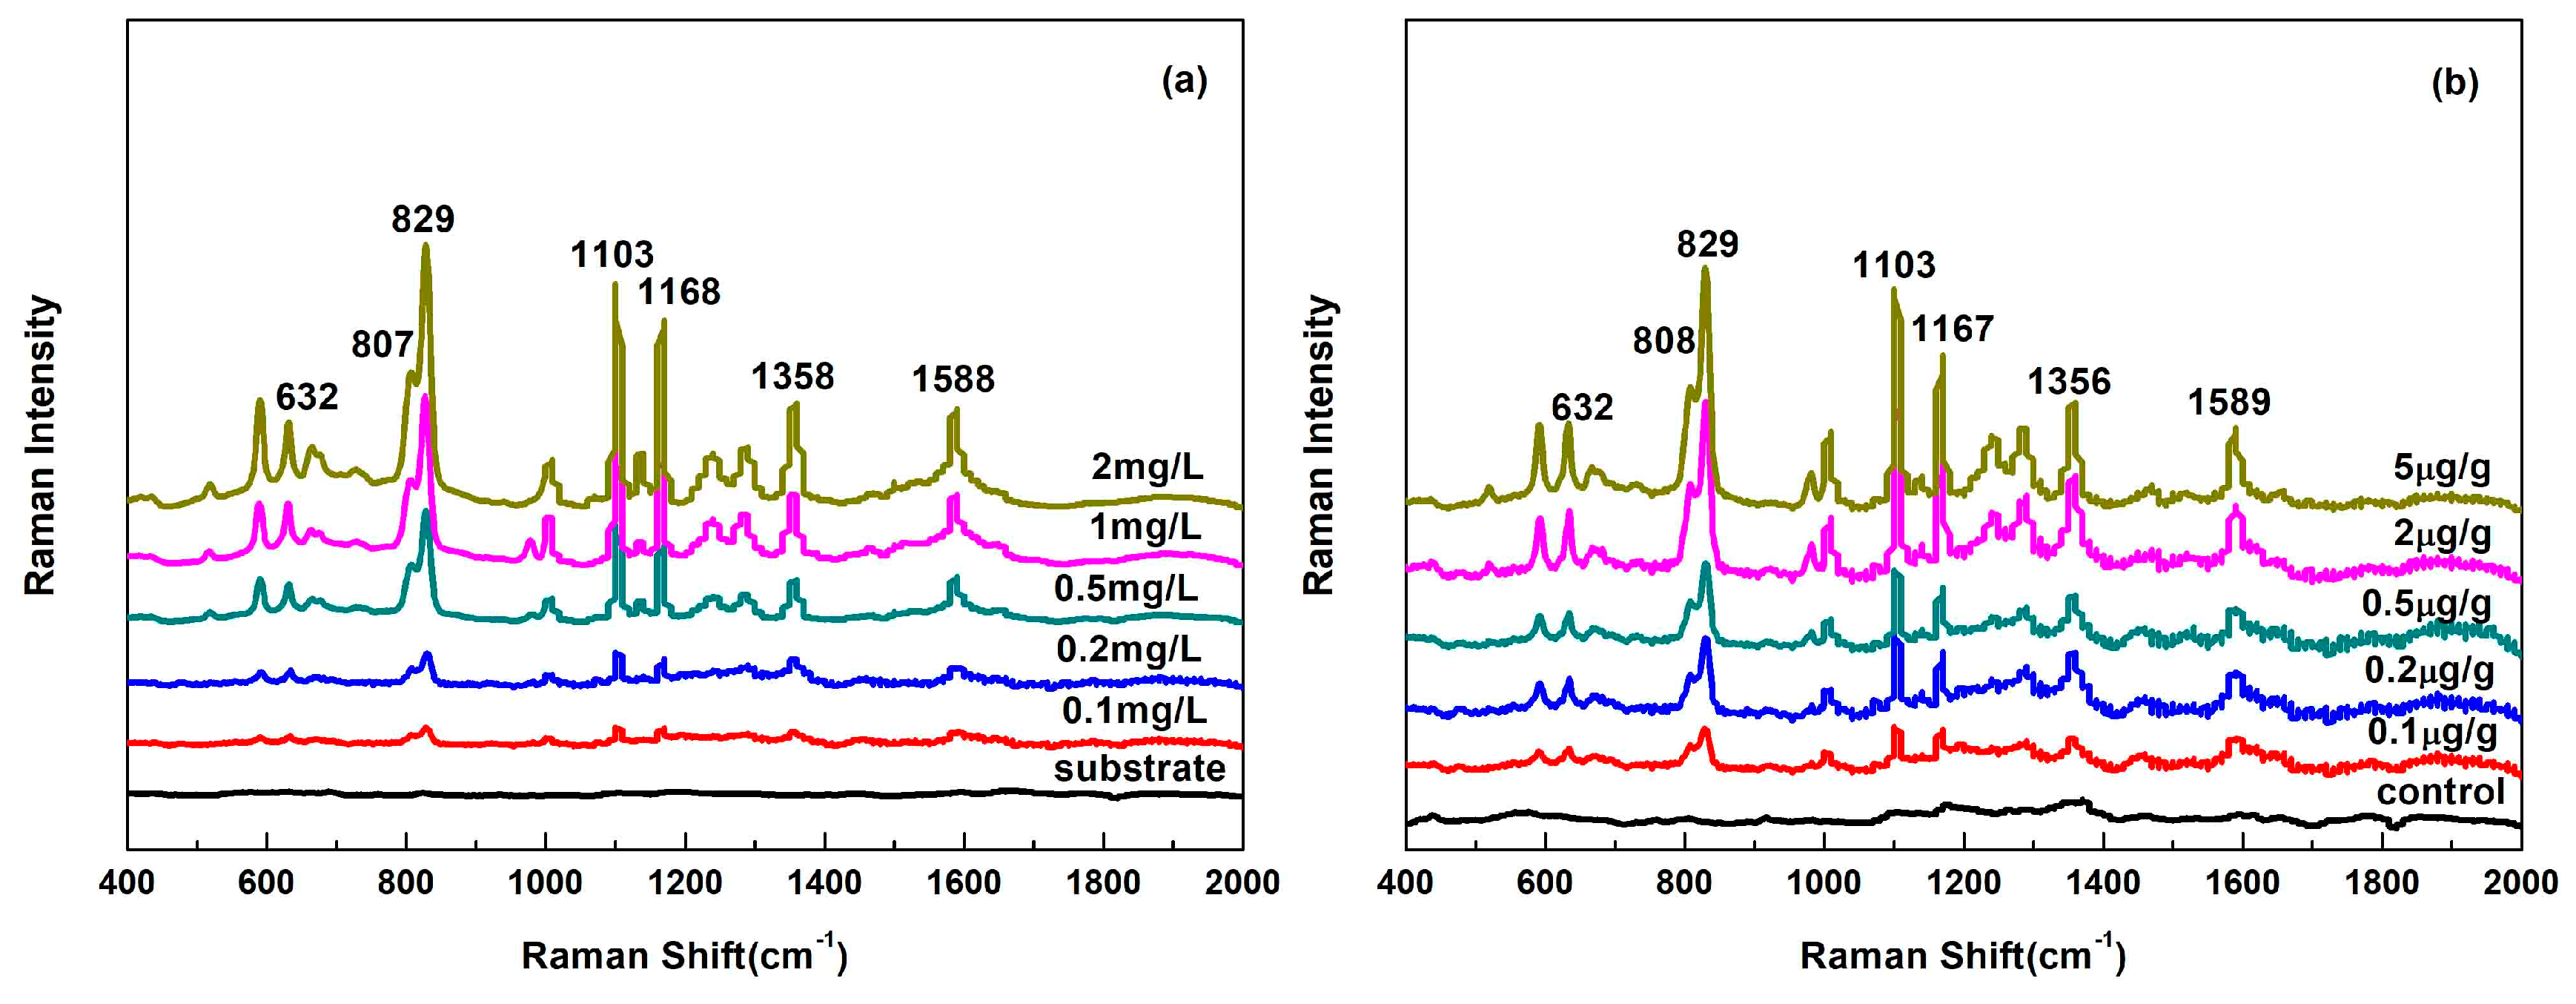
SERS spectra features of flusilazole standard solutions (Figure 5a) correspond with its conventional Raman spectra (Figure 1), the main characteristic peaks of flusilazole at 632, 807, 829, 1103, 1168, 1358 and 1588 cm−1 could be obviously discerned at 0.1 mg/L coupling with the Au@Ag NPs. Compared to that of conventional Raman spectra of flusilazole, there were no clear band shift occurred in the SERS spectrum of flusilazole standard solution but some peaks’ intensities were altered. For instance, the intensity peak of 827 cm−1 in the solid Raman spectra was medium, while it became a strong intensity peak in the SERS spectra; on the contrary, 1586 cm−1 in the Raman spectrum was a secondary intensity peak, while it became a weak peak in the SERS spectra. The change of relative intensity of characteristic peaks was depended on many factors such as the interaction between targeted chemical molecules and substrate surface, the adsorption sites of substrate, the molecular orientation attached to the substrates and so on [32].
As shown in Figure 5a, the intensity of prominent peaks, such as those at around 632, 807, 829, 1103, 1168, 1358 and 1588 cm−1, increased with an increase of flusilazole concentration. A good linear relationship between the intensity of prominent peaks and the flusilazole concentrations was obtained (R2 = 0.924–0.962), which made it probable to determine flusilazole content with SERS technology (Table 1).
3.4. SERS Analysis of Flusilazole in Pears
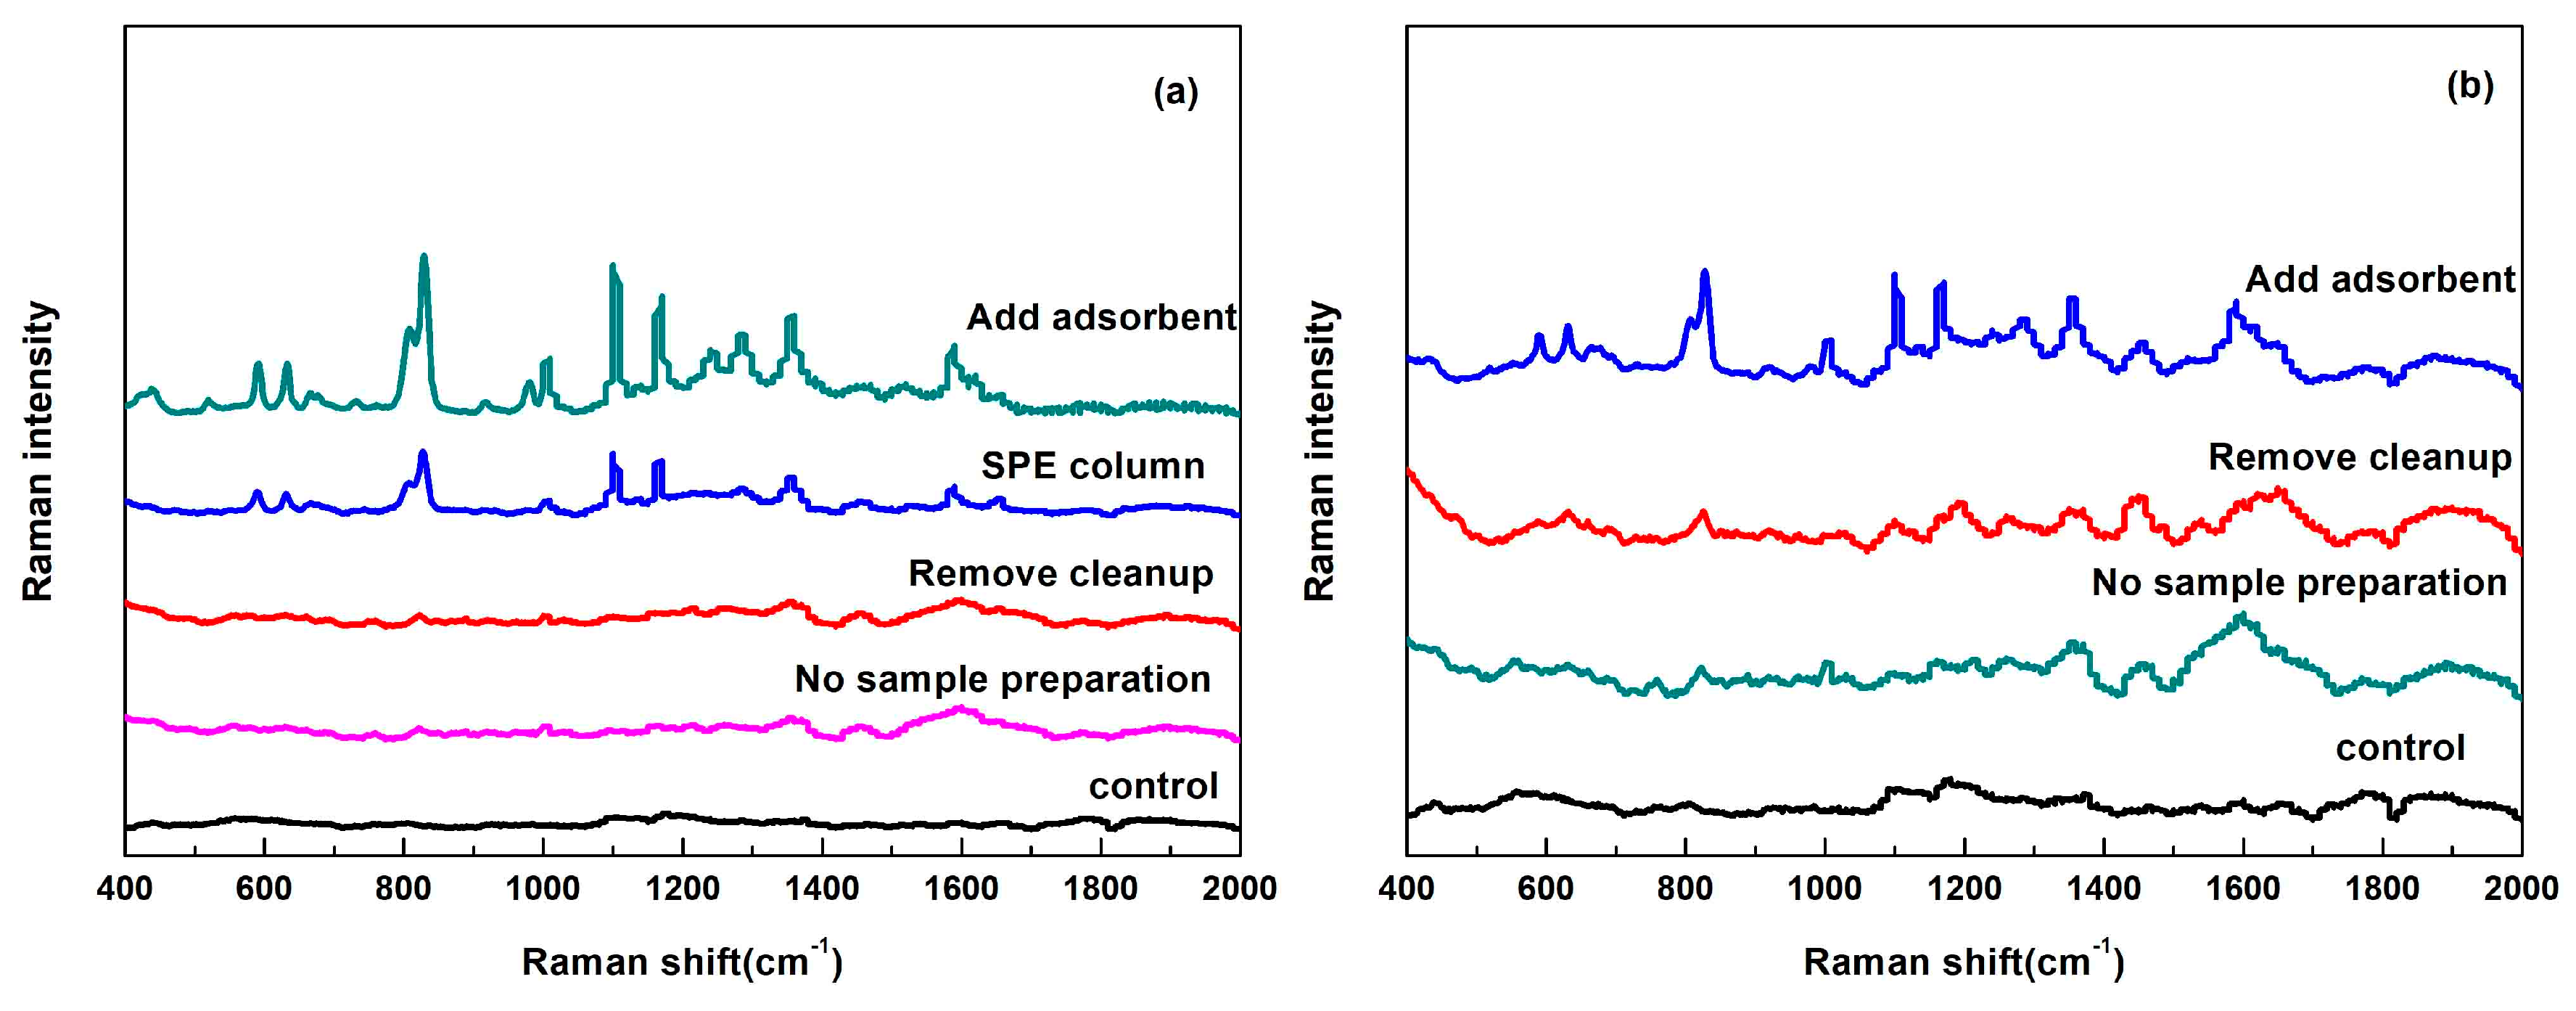
Sample pretreatments were needed to decrease the effect of non-targeted chemical components, for example, sugars, organic acids and pigments in pears. The quick, easy, cheap, effective, rugged and safe (QuEChERS) method as a practical sample preparation has been widely used in analysis of residual pesticide residues in fruits and vegetables [33]. This method is divided into two steps: extraction and cleanup. As shown in Figure 6, without sample preparation or removing cleanup, flusilazole cannot be detected, due to sample matrix interference. The sample can be further purified by adding adsorbents or through solid phase extraction (SPE) cartridge, however SPE column is very expensive and both methods are effective (Figure 6a). During the whole steps of QuEChERS method, addition of adsorbents was one of most important steps to remove non-targeted components, for the amounts of adsorbent too little or high could not obtain good SERS enhancement. The amount of each absorber dosage was determined as 0.6 g MgSO4, 0.2 g C18 and 0.2 g PSA according to several experiments’ results (Table 2). The typical SERS spectra of flusilazole extracts from pears and the major characteristic peaks were consistent with flusilazole standard solutions, which were shown in Figure 5b. There was no other peak appeared in pear extracts, the relative intensity of primary peaks changed comparing with that of standard solutions, which might be due to the interference of pear matrix.
As shown in Table 3, a good linear relationship between the intensity of prominent peaks and pears extracts was achieved (R2 = 0.924–0.962). The regressive results of extracts were not as good as those for standard solutions, indicating some non-targeted components in the pear extracts might hinder the adsorption of flusilazole onto the Au@Ag surface and caused less satisfied analysis results for pear extracts. The highest linear relationship was acquired for the peak at 632 cm−1, R2 with value of 0.922, which showed the potential of using SERS for analysis of flusilazole in pears.
4. Conclusions
Three different sizes of Au@Ag NPs were easily prepared and used to detect flusilazole standard solutions and in pear extracts. The Au@Ag NPs sizes of 90 ± 7 nm showed the highest enhancement effect, the minimum detectable concentration of flusilazole standard solution and flusilazole in pear extracts were 0.1 mg/L and 0.1 μg/g, respectively. The QuEchERS method, applied to sample preparation, is significant to eliminate or reduce the impact of non-targeted ingredients in food samples for the high sensitivity of SERS technology. SERS can provide a fast, sensitive, economical method to determine flusilazole in pears, which shows the potential for wide applications in residual pesticides in vegetables or fruits.
Acknowledgments
This study was supported by the National Key Research and Development Program of China (2017YFC1600700) and Ministry of Agriculture of the People’s Republic of China (No. 171721301102412135).
Author Contributions
Zhihui Zhao carried out the experiments, analyzed the experiments data and wrote the manuscript. Yiqun Huang gave advice on the experiment design and revised the manuscript. Yuxia Fan assisted to analyze experimental data and make figures. Keqiang Lai contributed to the research design, processed experiments data and modified the manuscript.
Conflicts of Interest
The authors declare no conflict of interest.
References
- Ozakca, D.U.; Silah, H. Genotoxicity effects of flusilazole on the somatic cells of Allium cepa. Pestic. Biochem. Phys. 2013, 107, 38–43. [Google Scholar] [CrossRef] [PubMed]
- Standards for Pesticide Residue Limits in Foods. Available online: www.fda.gov.tw/tc/includes/GetFile.ashx?mID=172&id=54271 (accessed on 3 October 2017).
- Ma, J.; Yao, Z.; Hou, L.; Lu, W.; Yang, Q.; Li, J.; Chen, L. Metal organic frameworks (MOFs) for magnetic solid-phase extraction of pyrazole/pyrrole pesticides in environmental water samples followed by HPLC-DAD determination. Talanta 2016, 161, 686–692. [Google Scholar] [CrossRef] [PubMed]
- Fu, Y.; Yang, T.; Zhao, J.; Zhang, L.; Chen, R.; Wu, Y. Determination of eight pesticides in Lycium barbarum by LC-MS/MS and dietary risk assessment. Food Chem. 2017, 218, 192–198. [Google Scholar] [CrossRef] [PubMed]
- Taha, S.M.; Gadalla, S.A. Development of an efficient method for multi residue analysis of 160 pesticides in herbal plant by ethyl acetate hexane mixture with direct injection to GC-MS/MS. Talanta 2017, 174, 767–779. [Google Scholar] [CrossRef] [PubMed]
- Lai, K.; Zhang, Y.; Du, R.; Zhai, F.; Rasco, B.A.; Huang, Y. Determination of chloramphenicol and crystal violet with surface enhanced Raman spectroscopy. Sens. Instrum. Food Qual. 2011, 5, 19–24. [Google Scholar] [CrossRef]
- Lai, K.; Zhai, F.; Zhang, Y.; Wang, X.; Rasco, B.A.; Huang, Y. Application of surface enhanced Raman spectroscopy for analyses of restricted sulfa drugs. Sens. Instrum. Food Qual. 2011, 5, 91–96. [Google Scholar] [CrossRef]
- Zhang, Y.; Yu, W.; Pei, L.; Lai, K.; Rasco, B.A.; Huang, Y. Rapid analysis of malachite green and leucomalachite green in fish muscles with surface-enhanced resonance Raman scattering. Food Chem. 2015, 169, 80–84. [Google Scholar] [CrossRef] [PubMed]
- Fan, Y.; Lai, K.; Rasco, B.A.; Huang, Y. Analyses of phosmet residues in apples with surface-enhanced Raman spectroscopy. Food Control 2014, 37, 153–157. [Google Scholar] [CrossRef]
- Fan, Y.; Lai, K.; Rasco, B.A.; Huang, Y. Determination of carbaryl pesticide in Fuji apples using surface-enhanced Raman spectroscopy coupled with multivariate analysis. LWT-Food Sci. Technol. 2015, 60, 352–357. [Google Scholar] [CrossRef]
- Kim, N.J.; Lin, M. A nanoporous metallic mat showing excellent and stable surface enhanced Raman spectroscopy activities. J. Nanosci. Nanotechnol. 2010, 10, 5077–5082. [Google Scholar] [CrossRef] [PubMed]
- He, L.; Lin, M.; Li, H.; Kim, N.J. Surface-enhanced Raman spectroscopy coupled with dendritic silver nanosubstrate for detection of restricted antibiotics. J. Raman Spectrosc. 2010, 41, 739–744. [Google Scholar] [CrossRef]
- Xiong, Z.; Chen, X.; Liou, P.; Lin, M. Development of nanofibrillated cellulose coated with gold nanoparticles for measurement of melamine by SERS. Cellulose 2017, 24, 2801–2811. [Google Scholar] [CrossRef]
- Zhu, J.; Liu, M.J.; Li, J.J.; Li, X.; Zhao, J.W. Multi-branched gold nanostars with fractal structure for SERS detection of the pesticide Thiram. Spectrochim. Acta A 2017, 189, 586–593. [Google Scholar] [CrossRef] [PubMed]
- Li, C.; Yang, C.; Xu, S.; Zhang, C.; Li, Z.; Liu, X.; Jiang, S.; Huo, Y.; Liu, A.; Man, B. Ag2O@Ag core-shell structure on PMMA as low-cost and ultra-sensitive flexible surface-enhanced Raman scattering substrate. J. Alloys Compd. 2017, 695, 1677–1684. [Google Scholar] [CrossRef]
- Fang, H.; Zhang, X.; Zhang, S.J.; Liu, L.; Zhao, Y.M.; Xu, H.J. Ultrasensitive and quantitative detection of paraquat on fruits skins via surface-enhanced Raman spectroscopy. Sens. Actuator B-Chem. 2015, 213, 452–456. [Google Scholar] [CrossRef]
- Luo, H.; Huang, Y.; Lai, K.; Rasco, B.A.; Fan, Y. Surface-enhanced Raman spectroscopy coupled with gold nanoparticles for rapid detection of phosmet and thiabendazole residues in apples. Food Control 2016, 68, 229–235. [Google Scholar] [CrossRef]
- Li, C.; Huang, Y.; Lai, K.; Rasco, B.A.; Fan, Y. Analysis of trace methylene blue in fish muscle using ultra-sensitive surface-enhanced Raman spectroscopy. Food Control 2016, 65, 99–105. [Google Scholar] [CrossRef]
- Kumar, S.; Goel, P.; Singh, J.P. Flexible and robust SERS active substrates for conformal rapid detection of pesticide residues from fruits. Sens. Actuator B-Chem. 2017, 241, 577–583. [Google Scholar] [CrossRef]
- Lu, L.; Wang, H.; Zhou, Y.; Xi, S.; Zhang, H.; Hu, J.; Zhao, B. Seed-mediated growth of large, monodisperse core-shell gold-silver nanoparticles with Ag-like optical properties. Chem. Commun. 2002, 2, 144–145. [Google Scholar] [CrossRef]
- Yang, Y.; Liu, J.; Fu, Z.W.; Qin, D. Galvanic replacement-freedeposition of Au on Ag for core−shell nanocubes with enhanced chemical stability and SERS activity. J. Am. Chem. Soc. 2014, 136, 8153–8156. [Google Scholar] [CrossRef] [PubMed]
- Samal, A.K.; Polavarapu, L.; Rodalcedeira, S.; Lizmarzán, L.M.; Pérezjuste, J.; Pastorizasantos, I. Size tunable Au@Ag core-shell nanoparticles: Synthesis and surface-enhanced Raman scattering properties. Langmuir 2013, 29, 15076–15082. [Google Scholar] [CrossRef] [PubMed]
- Pei, L.; Ou, Y.; Yu, W.; Fan, Y.; Huang, Y.; Lai, K. Au-Ag core-shell nanospheres for surface-enhanced Raman scattering detection of Sudan I and Sudan II in chili powder. J. Nanomater. 2015, 16, 215. [Google Scholar] [CrossRef]
- Frens, G. Controlled nucleation for the regulation of the particle size in monodisperse gold suspensions. Nature 1973, 241, 20–22. [Google Scholar] [CrossRef]
- Lehotay, S.J. Determination of pesticide residues in foods by acetonitrile extraction and partitioning with magnesium sulfate: Collaborative study. J. AOAC Int. 2007, 90, 485–520. [Google Scholar] [PubMed]
- Tang, H.; Li, Q.; Ren, Y.; Geng, J.; Cao, P.; Sui, T.; Wang, X.; Du, Y. Surface enhanced Raman spectroscopy signals of mixed pesticides and their identification. Chin. Chem. Lett. 2011, 22, 1477–1480. [Google Scholar] [CrossRef]
- Pan, Y.C.; Wen, Y.; Zhang, R.; Wang, Y.Y.; Zhang, Z.R.; Yang, H.F. Electrochemical and SERS spectroscopic investigations of 4-methyl-4h-1,2,4-triazole-3-thiol monolayers self-assembled on copper surface. Appl. Surf. Sci. 2012, 258, 3956–3961. [Google Scholar] [CrossRef]
- Sun, Y.; Song, W.; Zhu, X.; Zhang, R.; Pang, Q.; Zhang, Z.; Yang, H. Electrochemical and in situ SERS spectroelectrochemical investigations of 4-methyl-4h-1,2,4-triazole-3-thiol monolayers at a silver electrode. J. Raman Spectrosc. 2010, 40, 1306–1311. [Google Scholar] [CrossRef]
- Boca, S.C.; Farcau, C.; Astilean, S. The study of Raman enhancement efficiency as function of nanoparticle size and shape. Nucl. Instrum. Methods B 2009, 267, 406–410. [Google Scholar] [CrossRef]
- Güzel, R.; Üstündağ, Z.; Ekşi, H.; Keskin, S.; Taner, B.; Durgun, Z.G.; Turan, A.A.; Solak, A.O. Effect of Au and Au@Ag core–shell nanoparticles on the SERS of bridging organic molecules. J. Colloid Interface Sci. 2010, 351, 35–42. [Google Scholar] [CrossRef] [PubMed]
- Njoki, P.N.; Lim, I.S.; Mott, D.; Park, H.Y.; Khan, B.; Mishra, S.; Sujakumar, R.; Luo, J.; Zhong, C. Size correlation of optical and spectroscopic properties for gold nanoparticles. J. Phys Chem. C. 2007, 111, 14664–14669. [Google Scholar] [CrossRef]
- Smith, W.E. Practical understanding and use of surface enhanced Raman scattering/surface enhanced resonance Raman scattering in chemical and biological analysis. Chem. Soc. Rev. 2008, 37, 955–964. [Google Scholar] [CrossRef] [PubMed]
- Li, H.; Jiang, Z.; Cao, X.; Su, H.; Shao, H.; Jin, F.; Add EI-Aty, A.M.; Wang, J. Simultaneous determination of three pesticide adjuvant residues in plant-derived agro-products using liquid chromatography-tandem mass spectrometry. J. Chromatogr. A 2017, 1528, 53–60. [Google Scholar] [CrossRef] [PubMed]
Figure 1.
Molecular structure, Raman spectra and the band assignments for characteristic peaks of flusilazole.
Figure 1.
Molecular structure, Raman spectra and the band assignments for characteristic peaks of flusilazole.
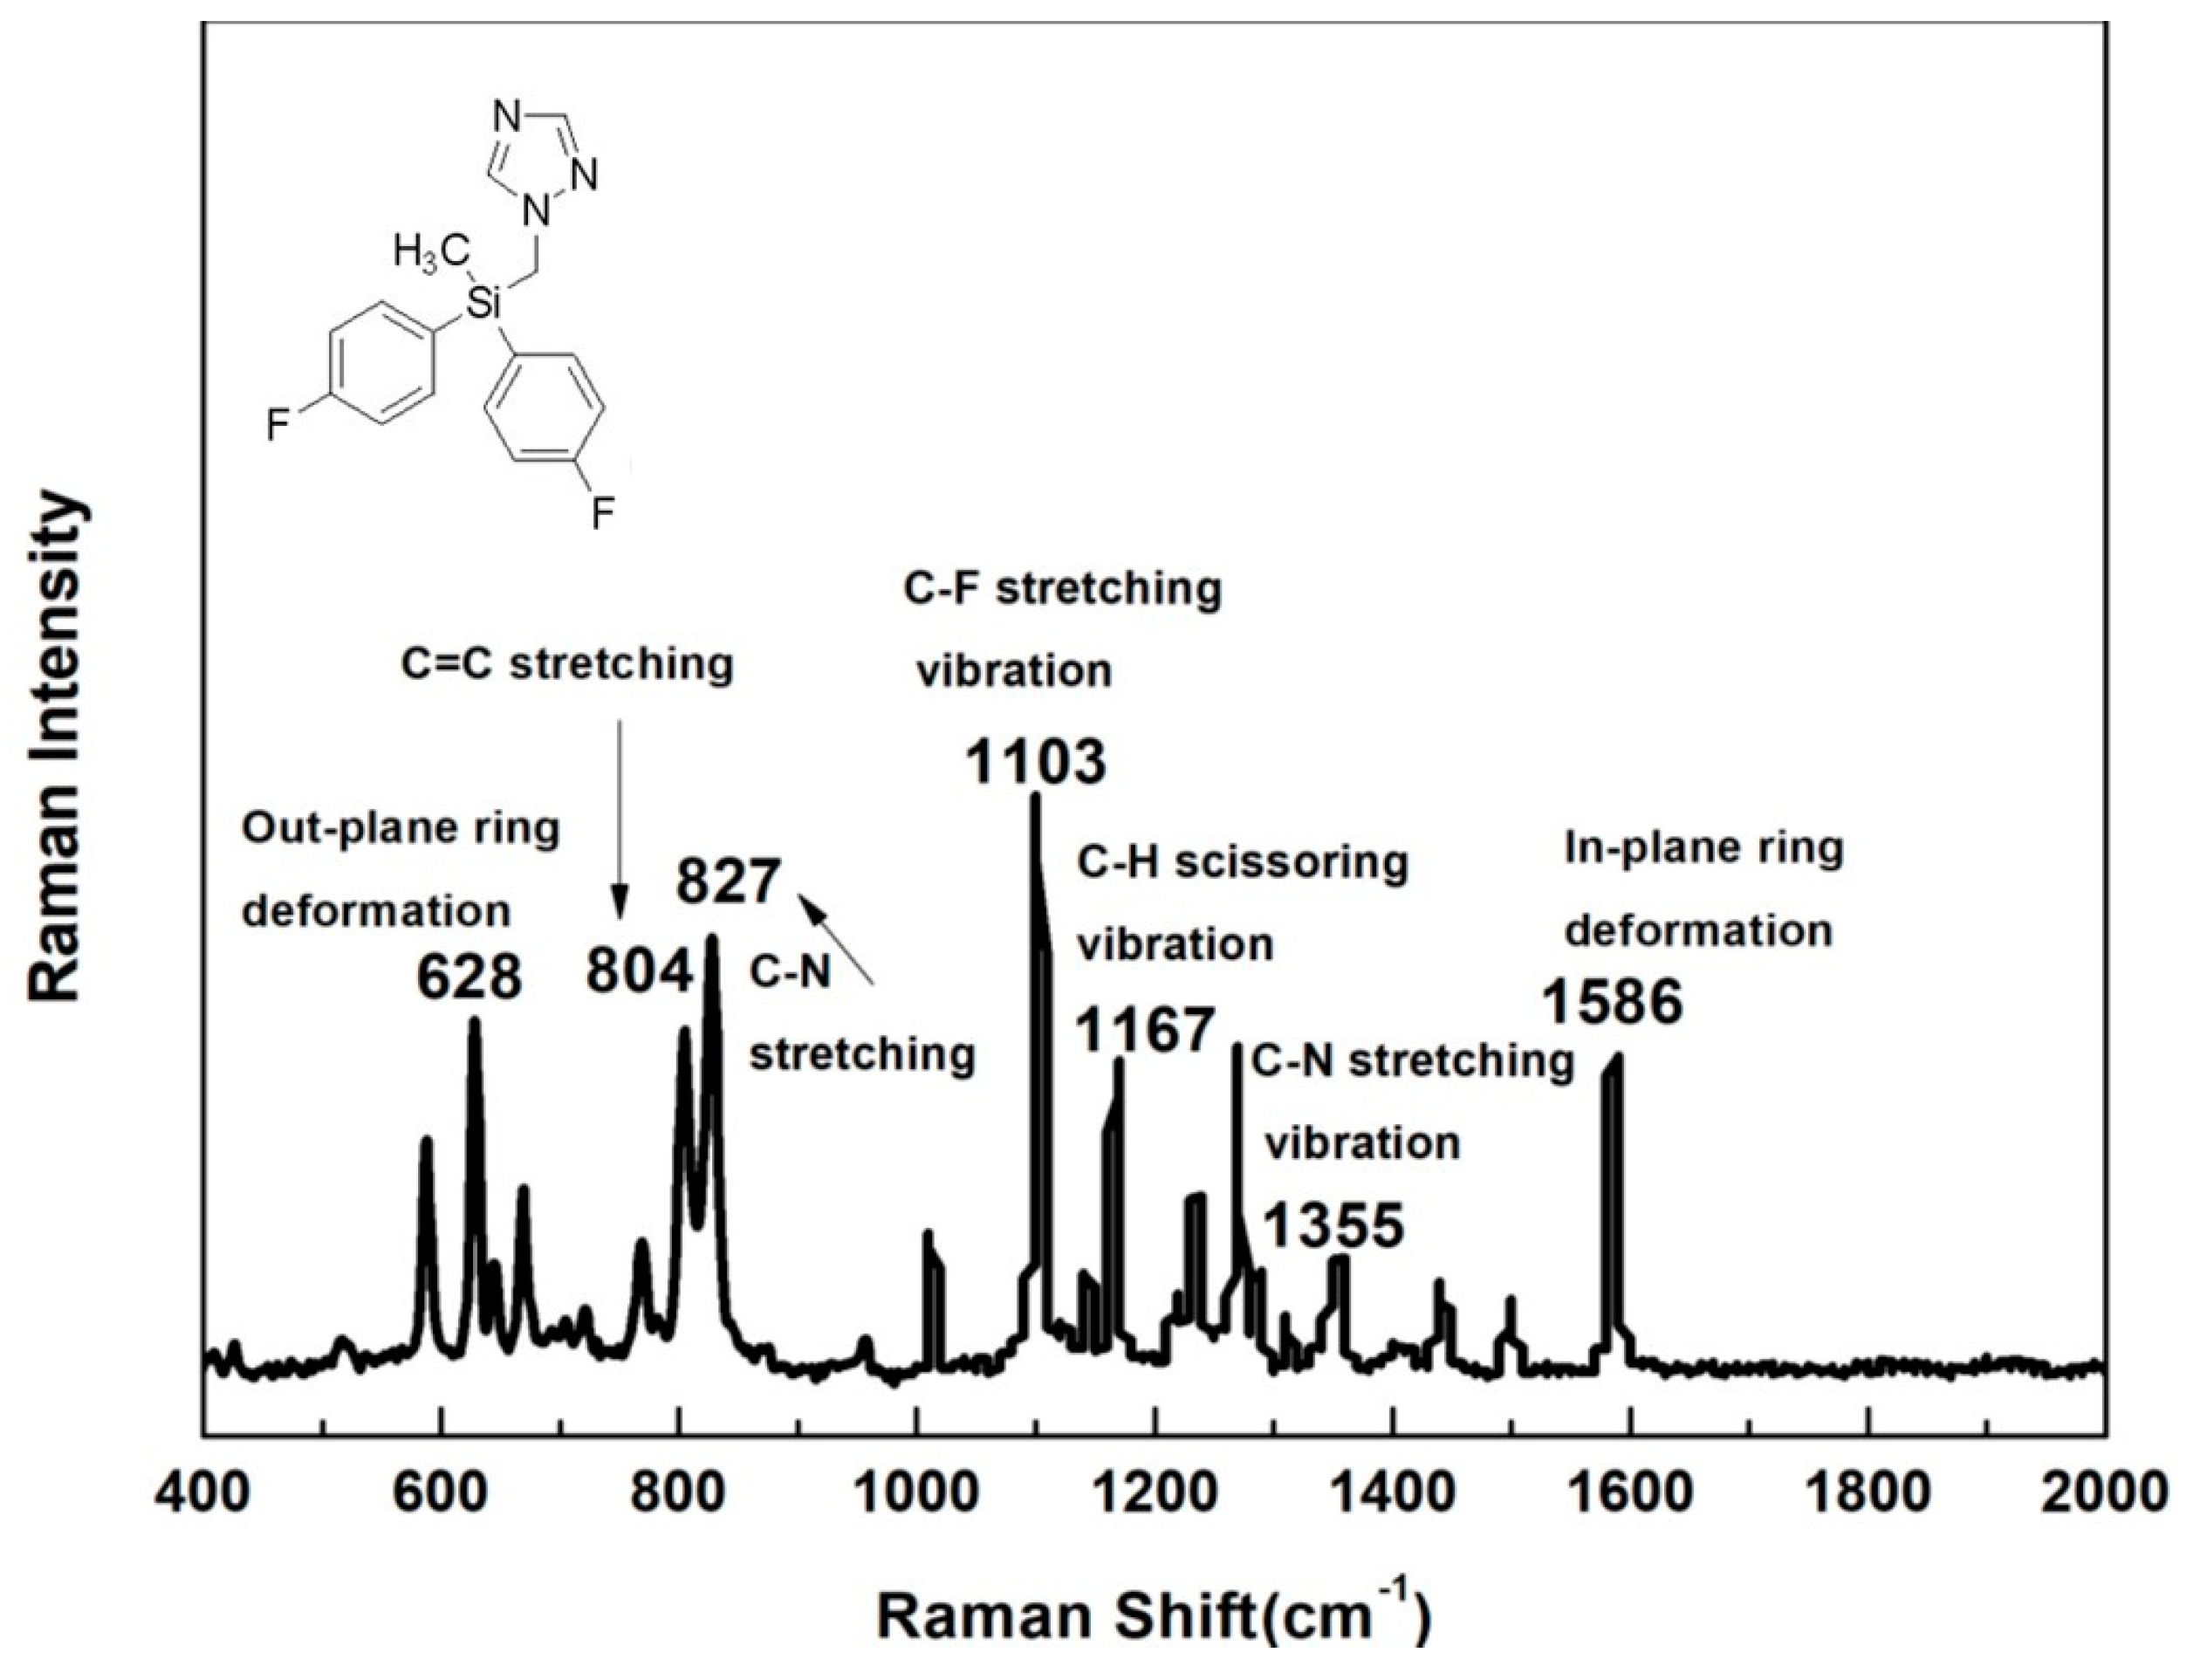
Figure 2.
UV-vis spectra of colloidal Au seeds and Au@Ag NPs synthesized with various amounts of Au seeds including (a) 0.4 mL; (b) 0.5 mL; (c) 0.9 mL.
Figure 2.
UV-vis spectra of colloidal Au seeds and Au@Ag NPs synthesized with various amounts of Au seeds including (a) 0.4 mL; (b) 0.5 mL; (c) 0.9 mL.

Figure 3.
Transmission electron microscopy images of Au@Ag NPs synthesized with different amounts of Au seeds including (a) 0.4 mL; (b) 0.5 mL and (c) 0.9 mL.
Figure 3.
Transmission electron microscopy images of Au@Ag NPs synthesized with different amounts of Au seeds including (a) 0.4 mL; (b) 0.5 mL and (c) 0.9 mL.


Figure 4.
Conventional Raman spectra and surface-enhanced Raman scattering spectra of (a) 1 mg/L and (b) 0.1 mg/L flusilazole standard solutions using Au@Ag with various amounts of Au seeds including 0.4, 0.5, 0.9 mL.
Figure 4.
Conventional Raman spectra and surface-enhanced Raman scattering spectra of (a) 1 mg/L and (b) 0.1 mg/L flusilazole standard solutions using Au@Ag with various amounts of Au seeds including 0.4, 0.5, 0.9 mL.
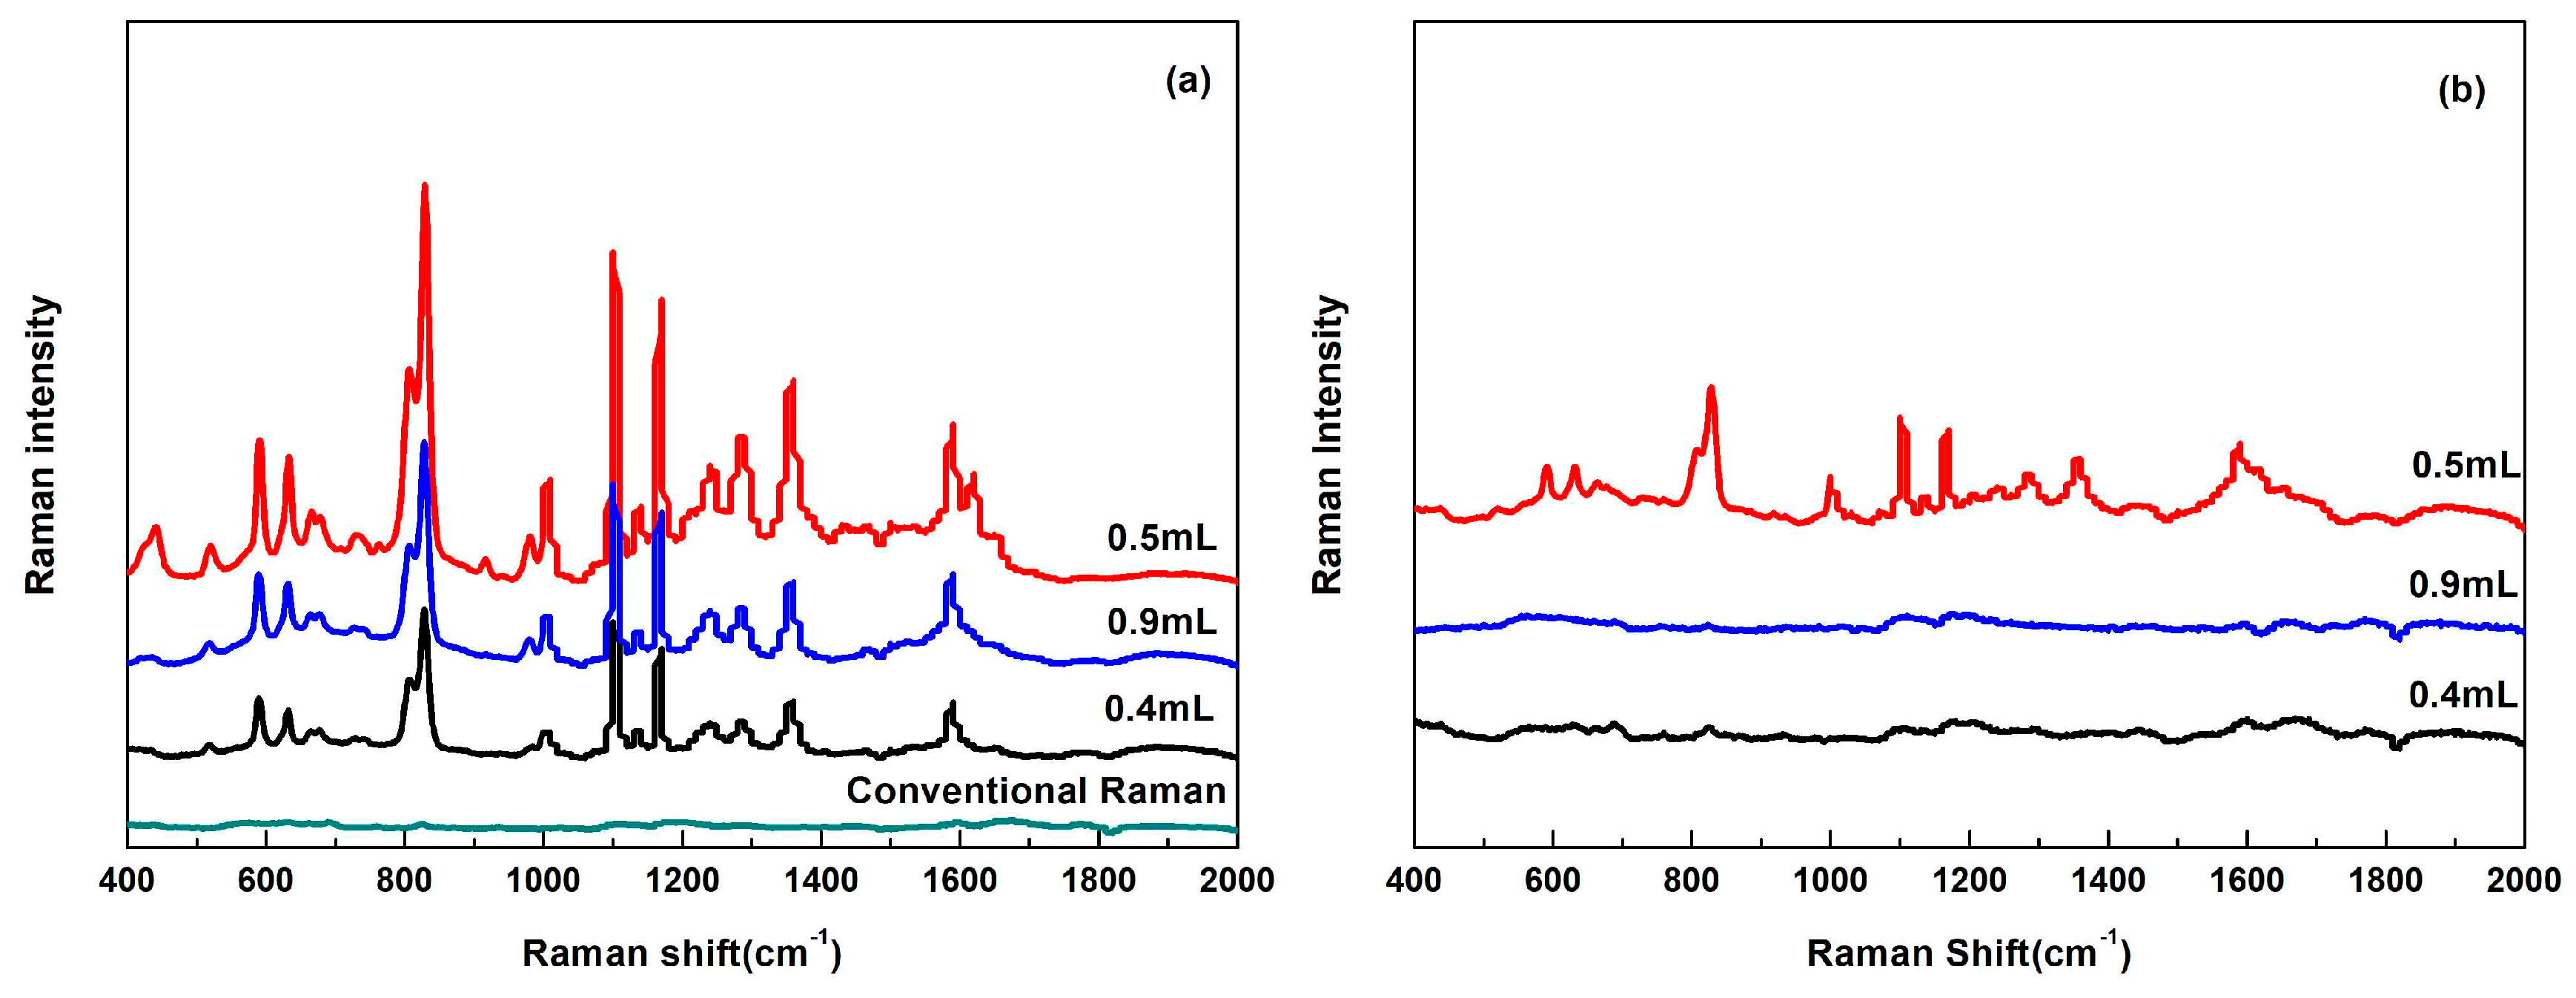
Figure 5.
SERS spectra of (a) flusilazole standard solutions and (b) flusilazole polluted pear extracts.
Figure 5.
SERS spectra of (a) flusilazole standard solutions and (b) flusilazole polluted pear extracts.

Figure 6.
SERS spectra of flusilazole extracts in pears with different sample preparation processes (a) 1 μg/g and (b) 0.2 μg/g.
Figure 6.
SERS spectra of flusilazole extracts in pears with different sample preparation processes (a) 1 μg/g and (b) 0.2 μg/g.

Table 1.
Linear relationship between the different concentrations of flusilazole standard solution (0.1–2 mg/L) and the intensities of prominent characteristic peaks in the surface-enhanced Raman scattering spectra.
Table 1.
Linear relationship between the different concentrations of flusilazole standard solution (0.1–2 mg/L) and the intensities of prominent characteristic peaks in the surface-enhanced Raman scattering spectra.
| - | Peaks/cm−1 | Regression Equation | R2 |
|---|---|---|---|
| Standard Solution | 632 | Y = 1300.06x + 513.57 | 0.924 |
| - | 807 | Y = 2186.26x + 498.59 | 0.956 |
| - | 829 | Y = 4242.81x + 1044.33 | 0.951 |
| - | 1103 | Y = 3644.11x + 783.79 | 0.952 |
| - | 1168 | Y = 2940.66x + 549.86 | 0.962 |
| - | 1358 | Y = 1677.96x + 368.57 | 0.946 |
| - | 1588 | Y = 1511.46x + 564.80 | 0.924 |
Table 2.
Influence of three different amounts of sorbents on SERS detect of flusilazole.
| Absorber Dosage | Flusilazole’s Concentration | ||
|---|---|---|---|
| MgSO4 | PSA | C18 | 0.1 μg/g |
| 0.45 g | 0.1 g | 0.1 g | - |
| 0.6 g | 0.1 g | 0.1 g | - |
| 0.6 g | 0.2 g | 0.1 g | - |
| 0.6 g | 0.2 g | 0.2 g | + |
| 0.45 g | 0.2 g | 0.2 g | - |
+: Flusilazole can be detected; -: Flusilazole can not be detected.
Table 3.
Linear relationship between the intensities of prominent characteristic peaks and the different concentrations of flusilazole in the SERS spectra of pears extracts.
Table 3.
Linear relationship between the intensities of prominent characteristic peaks and the different concentrations of flusilazole in the SERS spectra of pears extracts.
| - | Peaks/cm−1 | Regression Equation | R2 |
|---|---|---|---|
| Pear Extracts | 632 | Y = 232.05x + 219.72 | 0.922 |
| - | 808 | Y = 365.26x + 302.72 | 0.886 |
| - | 829 | Y = 749.85x + 533.64 | 0.914 |
| - | 1103 | Y = 655.32x + 557.58 | 0.921 |
| - | 1167 | Y = 442.63x + 525.25 | 0.879 |
| - | 1356 | Y = 301.85x + 450.82 | 0.741 |
| - | 1589 | Y = 216.17x + 350.04 | 0.708 |
© 2018 by the authors. Licensee MDPI, Basel, Switzerland. This article is an open access article distributed under the terms and conditions of the Creative Commons Attribution (CC BY) license (http://creativecommons.org/licenses/by/4.0/).
Share and Cite
MDPI and ACS Style
Zhao, Z.; Huang, Y.; Fan, Y.; Lai, K. Rapid Detection of Flusilazole in Pears with Au@Ag Nanoparticles for Surface-Enhanced Raman Scattering. Nanomaterials 2018, 8, 94. https://doi.org/10.3390/nano8020094
AMA Style
Zhao Z, Huang Y, Fan Y, Lai K. Rapid Detection of Flusilazole in Pears with Au@Ag Nanoparticles for Surface-Enhanced Raman Scattering. Nanomaterials. 2018; 8(2):94. https://doi.org/10.3390/nano8020094
Chicago/Turabian StyleZhao, Zhihui, Yiqun Huang, Yuxia Fan, and Keqiang Lai. 2018. "Rapid Detection of Flusilazole in Pears with Au@Ag Nanoparticles for Surface-Enhanced Raman Scattering" Nanomaterials 8, no. 2: 94. https://doi.org/10.3390/nano8020094
Note that from the first issue of 2016, this journal uses article numbers instead of page numbers. See further details here.