Optimization of Malachite Green Removal from Water by TiO2 Nanoparticles under UV Irradiation


1
Chongqing Institute of Green and Intelligent Technology, Chinese Academy of Sciences, Chongqing 400714, China
2
University of Chinese Academy of Sciences, Beijing 100049, China
*
Author to whom correspondence should be addressed.
Nanomaterials 2018, 8(6), 428; https://doi.org/10.3390/nano8060428
Submission received: 22 May 2018
/
Revised: 7 June 2018
/
Accepted: 7 June 2018
/
Published: 13 June 2018
Abstract
:TiO2 nanoparticles with surface porosity were prepared by a simple and efficient method and presented for the removal of malachite green (MG), a representative organic pollutant, from aqueous solution. Photocatalytic degradation experiments were systematically conducted to investigate the influence of TiO2 dosage, pH value, and initial concentrations of MG. The kinetics of the reaction were monitored via UV spectroscopy and the kinetic process can be well predicted by the pseudo first-order model. The rate constants of the reaction kinetics were found to decrease as the initial MG concentration increased; increased via elevated pH value at a certain amount of TiO2 dosage. The maximum efficiency of photocatalytic degradation was obtained when the TiO2 dosage, pH value and initial concentrations of MG were 0.6 g/L, 8 and 10−5 mol/L (M), respectively. Results from this study provide a novel optimization and an efficient strategy for water pollutant treatment.
1. Introduction
Environmental water pollution is becoming more serious with the development of the social economy and the high density of industrial activity [1,2]. Many countries have suffered water pollution because of the indiscriminate release of untreated wastewater. Among all water, environmental contaminants, synthetic dye, a typical organic pollutant, such as malachite green (MG, C23H25CN2), has been attracting growing attention [3,4,5]. MG is a common triphenylmethane dye in the textile industry, and it has also been widely used in the fish farming industry as a fungicide, disinfectant, ectoparasiticide, and antibacterial agent [6,7]. However, many researchers have reported that MG and its metabolite leucomalachite green (LMG) are environmentally persistent due to their complex chemical structures. They may also lead to teratogenic, carcinogenic, and mutagenic effects in human beings [8,9]. Thus, MG has been banned or is restricted in many countries. Nevertheless, MG is still illegally used in aquaculture because of its high efficacy and low cost [10]. To minimize the harm caused by MG, it is very important to efficiently remove MG residue from water systems.
In the past few decades, several methods have been applied for MG removal from wastewater. The conventional methods used for MG removal include adsorption, biodegradation, oxidation with ozone or hydrogen peroxide, membrane technology, etc. [11,12,13]. However, many of these methods are costly, time-consuming, difficult to control, and have high energy consumption and low efficiency. Fortunately, an alternative to the methods mentioned above is advanced oxidation processes, of which photocatalysis is the most popular. The photocatalytic degradation of pollutants through the use of nanomaterials has aroused world-wide attention. In the photocatalysis process, a semiconductor oxide is needed to generate radicals under illuminated light, which are the responsible active species for removal of hazardous compounds [14]. Among the various photocatalyst, titanium dioxide (TiO2) has been widely used in degrading organic pollutants due to its strong oxidizing power under ultraviolet (UV) light, extraordinary chemical stability, biocompatible features, relatively low cost, and environmental friendliness [15,16,17]. The principle of TiO2 photocatalytic properties is straightforward: When TiO2 absorbs energy greater than the band gap (approximately 3.2 eV) of itself, electrons can be excited to create electron-hole pairs. These electron-hole pairs migrate to the surface and form hydroxyl groups, which can react with chemicals adsorbed there [18,19]. Therefore, simple, low-cost, and high-efficiency TiO2 used as a photocatalyst to degrade pollutants is considered an attractive and promising treatment for water pollution.
Herein, we report a simple hydrothermal method to prepare TiO2 as an efficient photocatalyst for MG treatment from water under irradiation of UV light. Our procedure for material fabrication is easily operated, has a low cost and is scalable. We tried to determine the optimum operation conditions that can improve the efficiency of MG removal. A series of contrast experiments were performed to confirm TiO2 dosage, pH, and the concentrations of MG, which can maximize the utilization efficiency of TiO2 under UV lights. The whole dynamic process of photocatalytic degradation of MG with TiO2 under UV lights was monitored using a UV-vis spectrophotometer to evaluate the efficiency of MG removal. The results revealed that this simple photocatalytic platform can efficiently remove water pollutants.
2. Results and Discussion
2.1. Characterization of TiO2
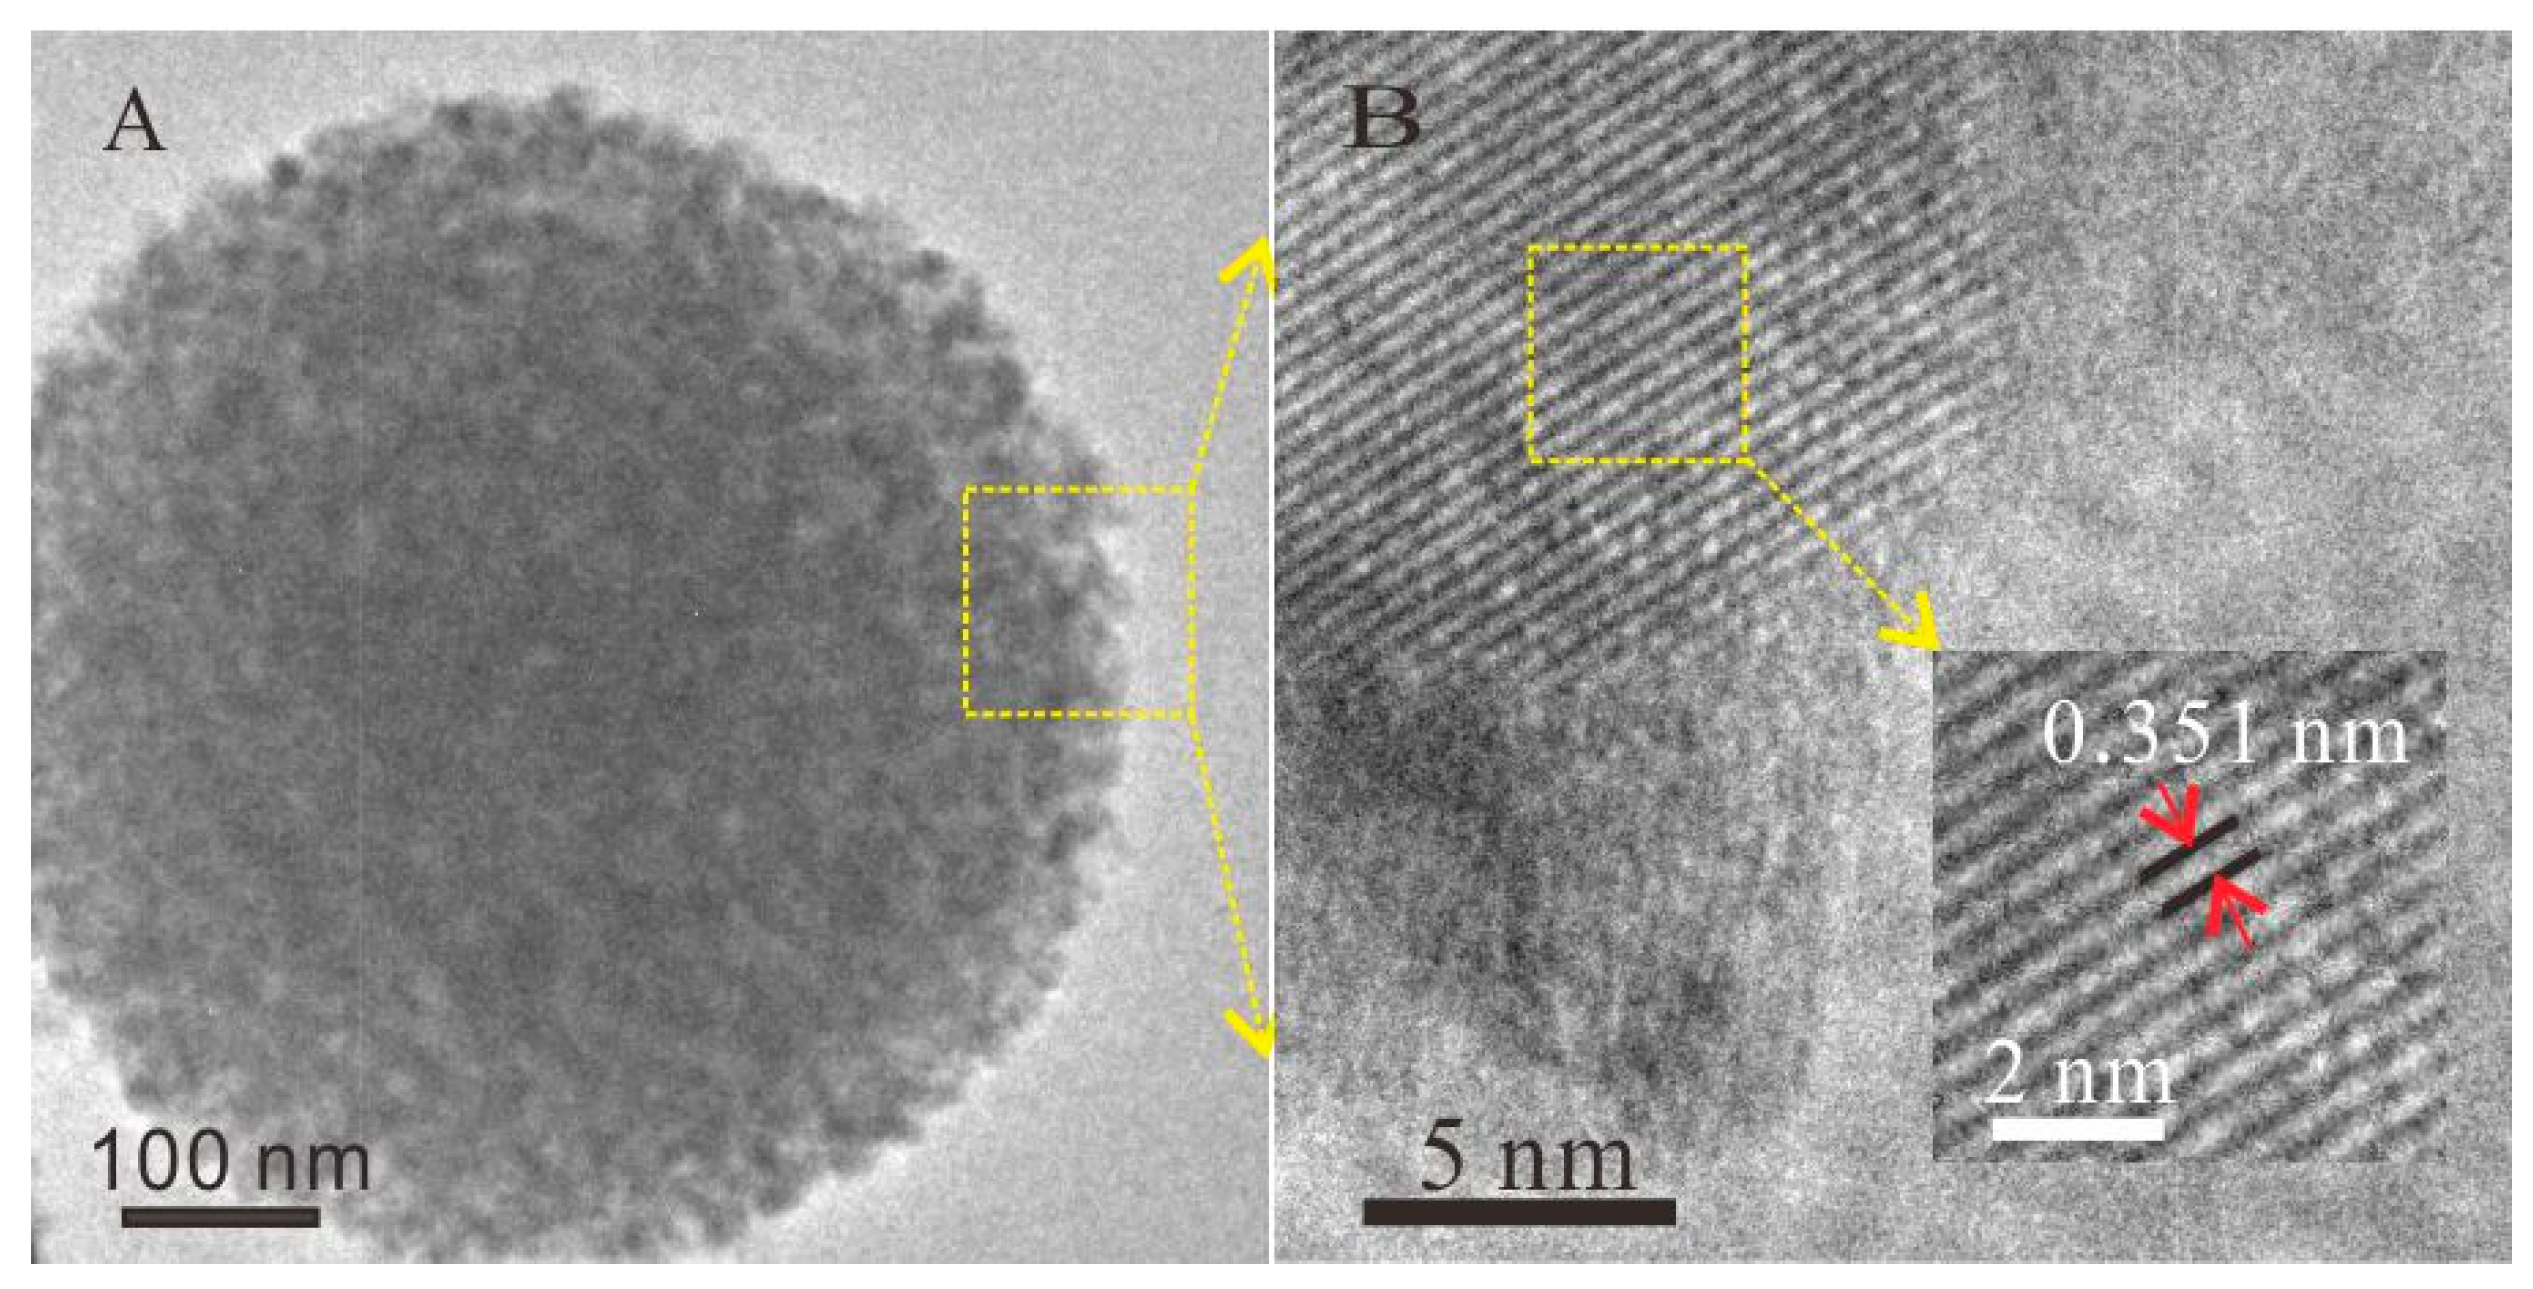
TiO2 particles were prepared according to a classical hydrothermal method [19]. Transmission electron microscopy (TEM) and scanning electron microscopy (SEM) images demonstrated that the TiO2 particles were sphere-shaped and had a uniform size distribution, with a diameter around 600 nm (Figure 1 and Figure S1). High resolution transmission electron microscopy (HRTEM) images demonstrated that the lattice fringe, with a spacing of about 0.35 nm, corresponded to the (101) plane of anatase titania. It also revealed that the TiO2 particles were well-dispersed without any aggregation, indicating the stability of these dispersions. The UV-vis spectra showed that TiO2 had an absorbance peak centered at 249 nm (Figure S2).
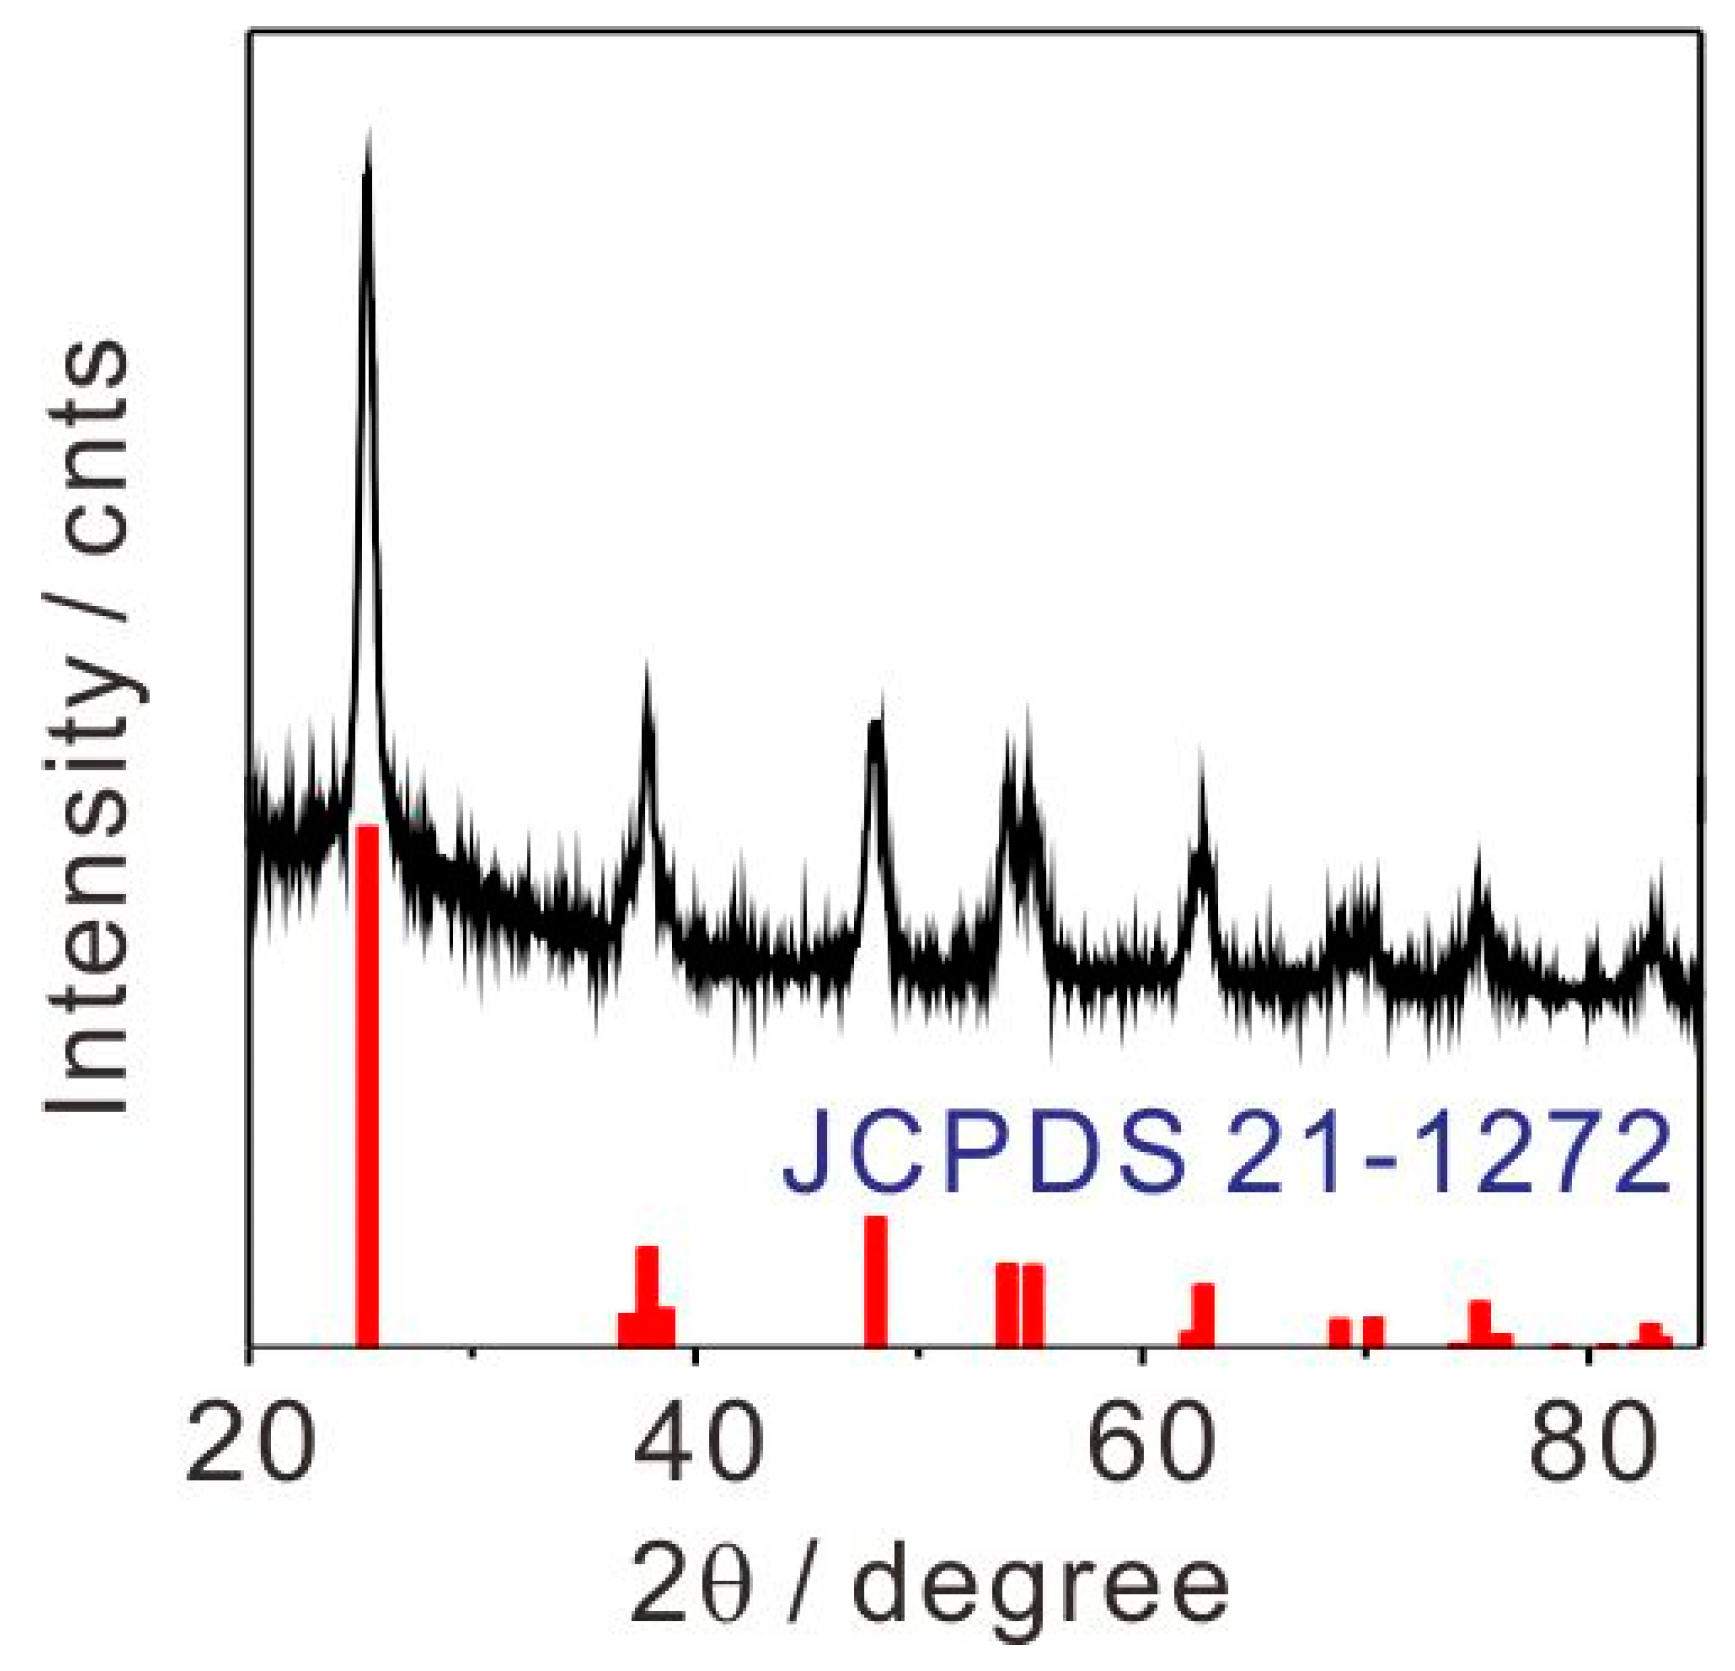
The X-ray diffractometer (XRD) pattern of the TiO2 nanoparticles (Figure 2) were in agreement with the standard values of anatase-phase TiO2, with peaks at 2θ = 25.3°, 38.6°, 48.1°, 54.3°, 55.4°, 62.8°, 68.9°, 70.4°, 75.2°, 83.2° (JCPDS files No. 21-1272). Anatase-phase TiO2 has been reported to demonstrate the best photocatalytic degradation activity among various TiO2 crystallinities [20].
2.2. Kinetics of Photocatalytic Degradation
2.2.1. TiO2 Dosage Effect on MG Removal
MG and UV light were used to investigate the photocatalytic activity of TiO2 particles. TiO2 particles were dispersed in MG solution (100 mL) in a quartz tube. For obtaining the accurate concentration of MG in photocatalytic degradation, the solution was first stirred for 2 h in the dark to reach an adsorption–desorption equilibrium between the nanoparticles and the solution. Upon UV light irradiation for a designated time, 3 mL of MG aqueous solution was taken out and centrifuged, then the supernatant was used for measuring the absorbance by UV-vis spectroscopy. In practical systems, the optimal operating conditions are very important for the efficiency of pollutant removal [21]. Thus, the optimal amount of TiO2, pH value and the concentrations of MG would be obtained in the next series of experiments.
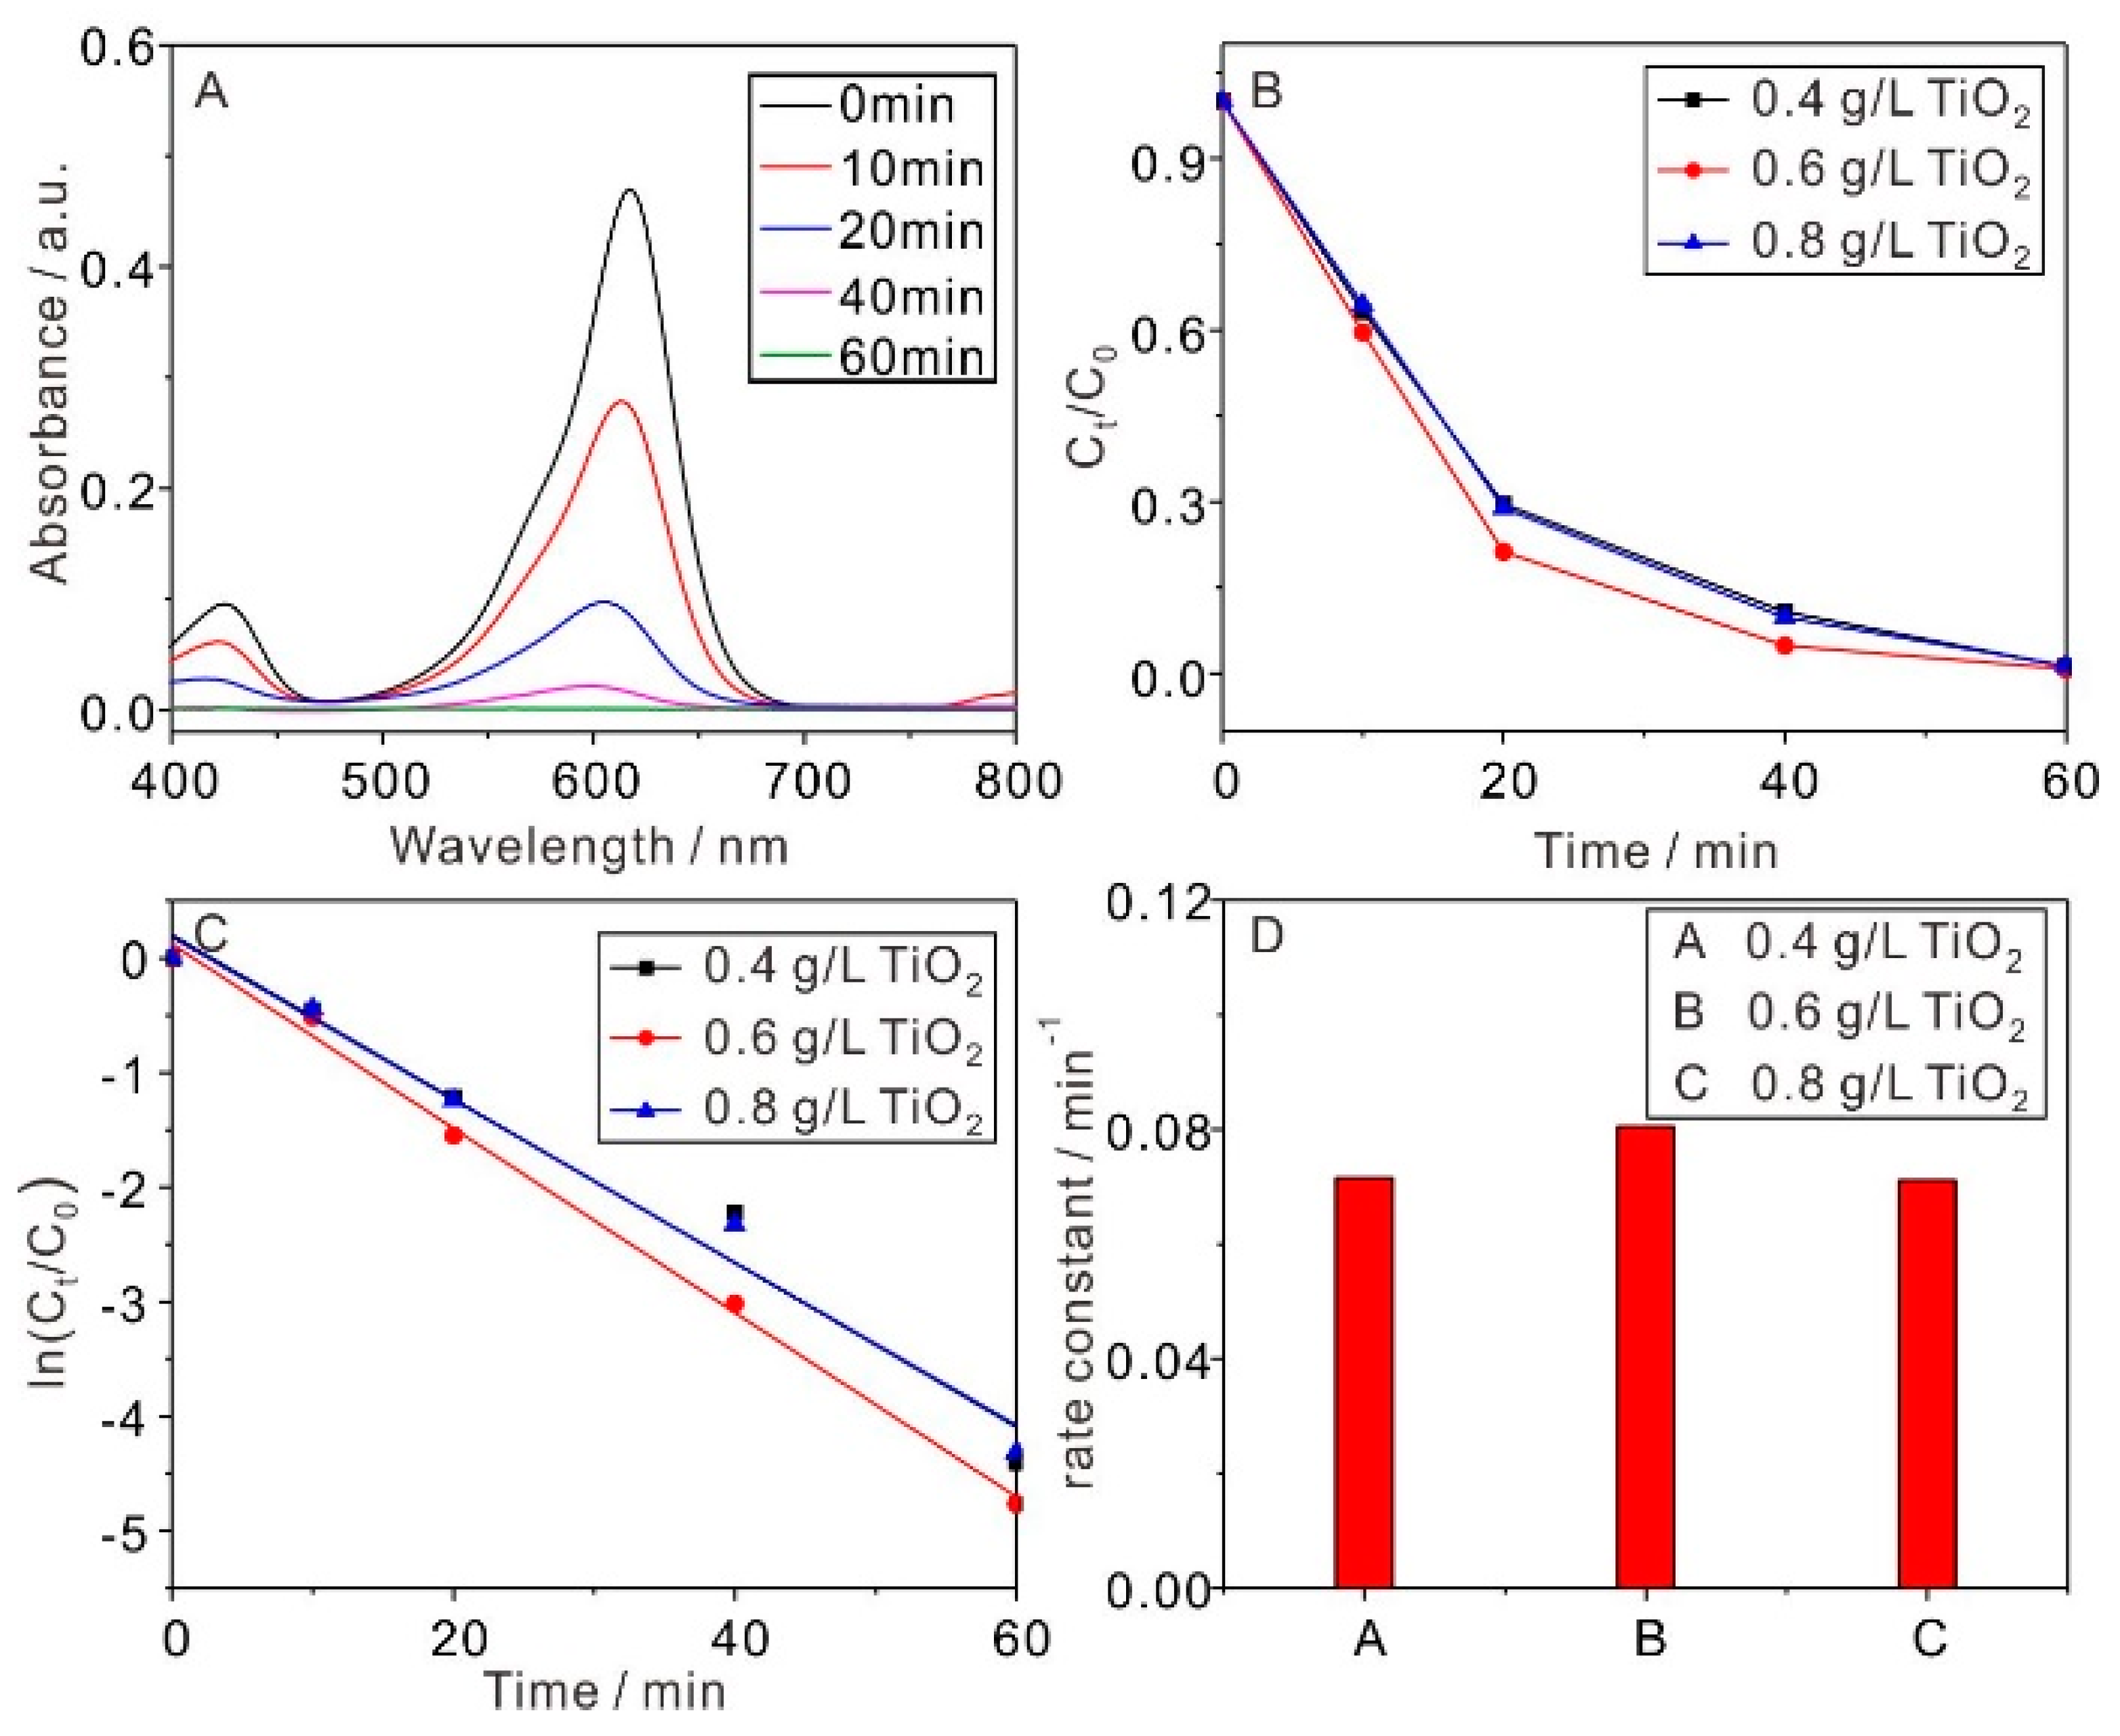
Figure 3 demonstrates the influence of amounts of TiO2 on the efficiency of MG removal. The absorbance spectra of MG (1 × 10⁻⁵ M) photocatalyzed by 0.6 g/L TiO2 particles under UV light irradiation, as a function of irradiation time, are shown in Figure 3A. With the increasing of irradiation time, the absorption intensity of MG at 615 nm gradually decreased, indicating the degradation of MG under the used conditions. The photocatalytic activity of TiO2 could be evaluated through a comparison between the supernatant concentration at each exposure time to that at time zero. Figure 3B plots time-dependent curves of the Ct/C0 ratio, an indicator of the degradation degree. C0 was the original concentration of MG at time zero and Ct was the supernatant concentration of MG after the sample was photocatalyzed by TiO2 particles under UV light for time t. Ct was obtained from comparing the 615 nm absorbance of the MG supernatant with that of the standard MG solution. After 1 h of irradiation, almost all the MG solution was photocatalytic degraded, regardless of the amount of TiO2. However, the degradation rates of the different amounts of TiO2 were different during the whole photocatalytic degradation process. In order to further evaluate the degradation rates mentioned above, Figure 3C shows the kinetics of the photocatalytic degradation reactions, which can be described as a pseudo first-order by Equation (1) [22].
The rate constants (k, min−1) were calculated from plots of ln (Ct/C0) vs. irradiation time. The calculated rate constants with 0.4, 0.6 and 0.8 g/L of TiO2 are 0.0716, 0.0805, and 0.0711 min−1, respectively (Figure 3D and Table 1). The results indicated that the rate constant reached best when TiO2 dosage was 0.6 g/L under current conditions. The reaction rate constant was found to decrease with increasing TiO2 dosage up to 0.8 g/L. The probable reason is that light scattering induced by the increased turbidity can reduce the UV light penetration into the bulk suspension and counteract the effect of photocatalyst surface area, resulting in decreased efficiency of MG removal [23,24]. The R2 of pseudo first-order kinetic model for the photocatalytic degradation of MG with 0.4, 0.6 and 0.8 g/L of TiO2 are 0.964, 0.995, and 0.976, respectively (Table 1). The R2 values indicated that there was a better correlation to photocatalytic degradation of MG under TiO2 particles based on the pseudo first-order kinetic model [25].
2.2.2. Initial Concentrations of MG Effect on the Efficiency of Photocatalytic Degradation
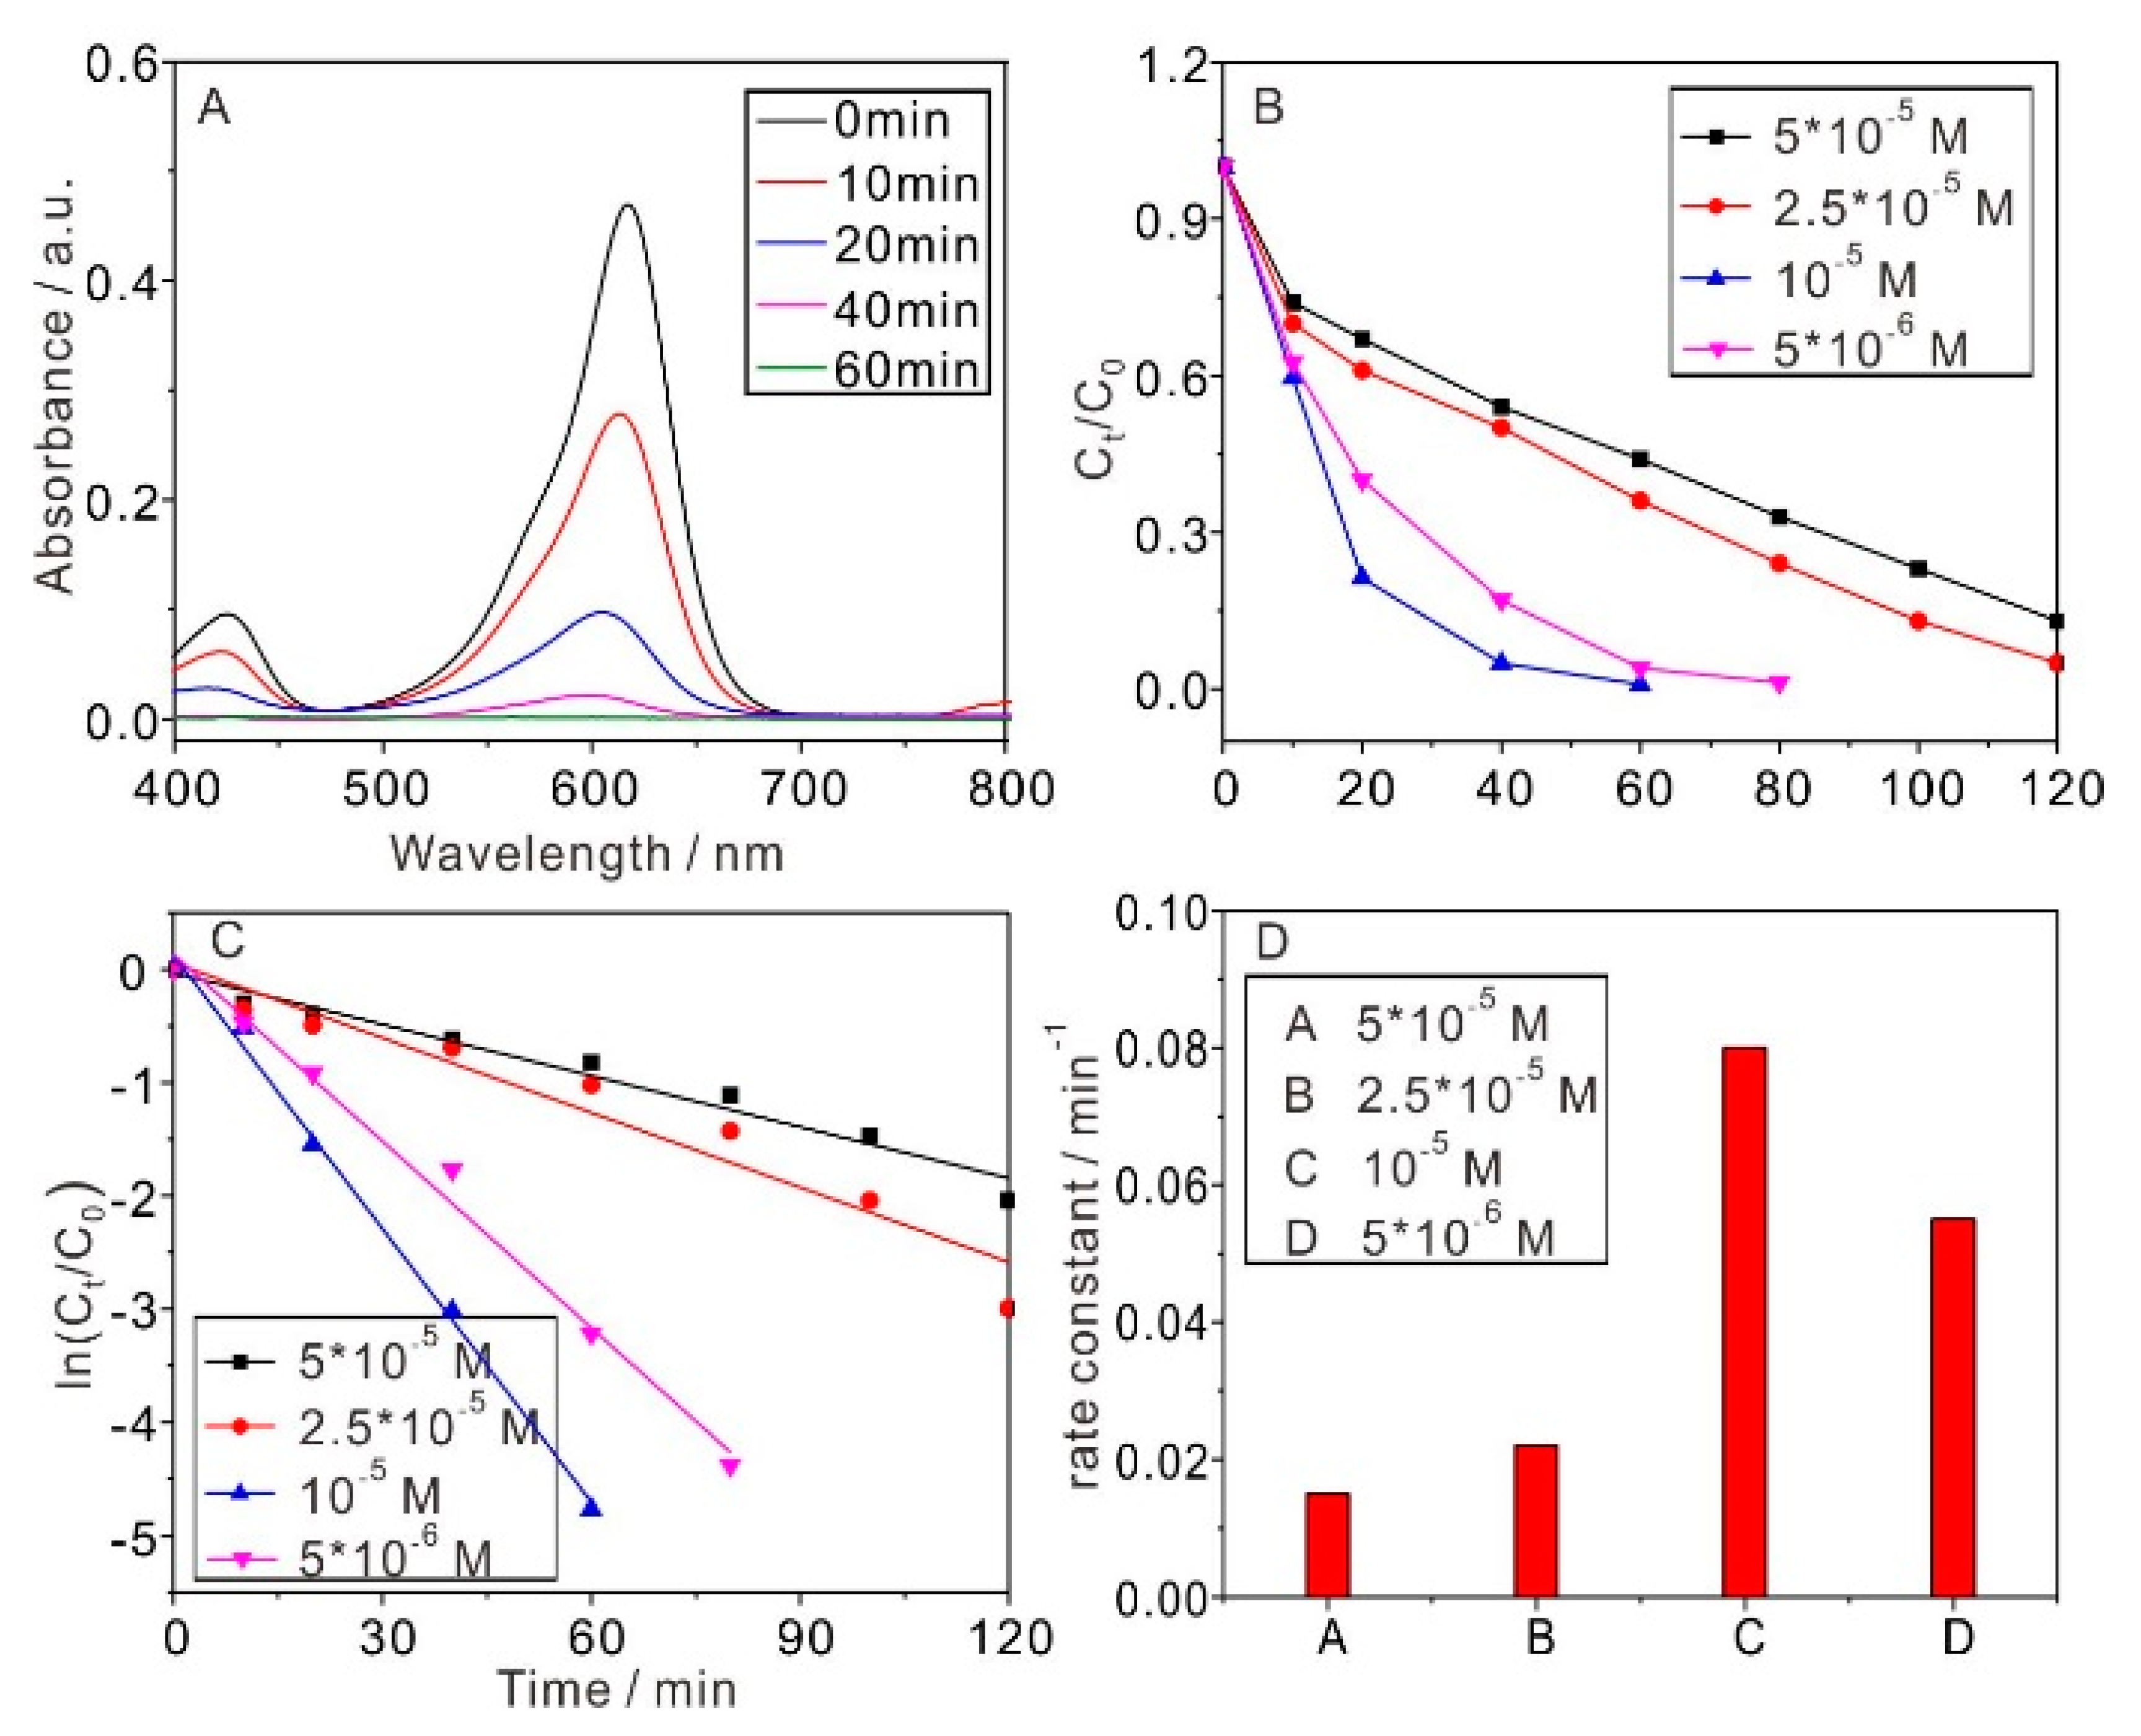
To obtain the capacity of the photocatalyst, different concentrations of MG solution were photocatalyzed using 0.6 g/L TiO2 under UV light (Figure 4). Figure 4A shows the absorbance spectra of MG (1 × 10⁻⁵ M) photocatalyzed using 0.6 g/L TiO2 particles under UV light irradiation as a function of the irradiation time. Similarly, Figure 4B plots time-dependent curves of the Ct/C0 ratio to indicate the photocatalytic activity of TiO2. After 1 h irradiation, almost all MG solution with concentrations of 10−5 and 5 × 10⁻⁶ M had been photocatalytically degraded. Fifty-six percent of the MG solution (5 × 10⁻⁵ M) was degraded, and 64% of MG solution (2.5 × 10⁻⁵ M) was degraded after 1 h. Meanwhile, both of the degradation ratios of MG increased continuously with growing irradiation time and reached about 99% after 2 h of irradiation.
The kinetics of the photocatalytic degradation reactions also can be described as pseudo first-order according to Equation (1) (Figure 4C). The calculated rate constants with the MG concentrations of 5 × 10⁻⁵, 2.5 × 10⁻⁵, 10−5 and 5 × 10⁻⁶ M were 0.0151, 0.0220, 0.0805 and 0.0550 min−1, respectively (Figure 4D and Table 2), using the methods mentioned above. The results demonstrated that the rate constant reached its best performance when the concentration of MG was 10−5 M under the used conditions. Generally, the reaction rate constant will increase by decreasing the concentration of pollutants. However, the ability of the photocatalyst may not show efficiently when the concentration of pollutants is too low. Thus, 10−5 M of MG was chosen in subsequent experiments. The R2 of the pseudo first-order kinetic model for the photocatalytic degradation of MG, with concentrations of 5 × 10⁻⁵, 2.5 × 10⁻⁵, 10−5 and 5 × 10⁻⁶ M, were 0.965, 0.935, 0.995 and 0.989, respectively (Table 2). The results indicated that the correlation to photocatalytic degradation of MG under TiO2 particles based on the pseudo first-order kinetic model was good.
2.2.3. Effect of pH Values
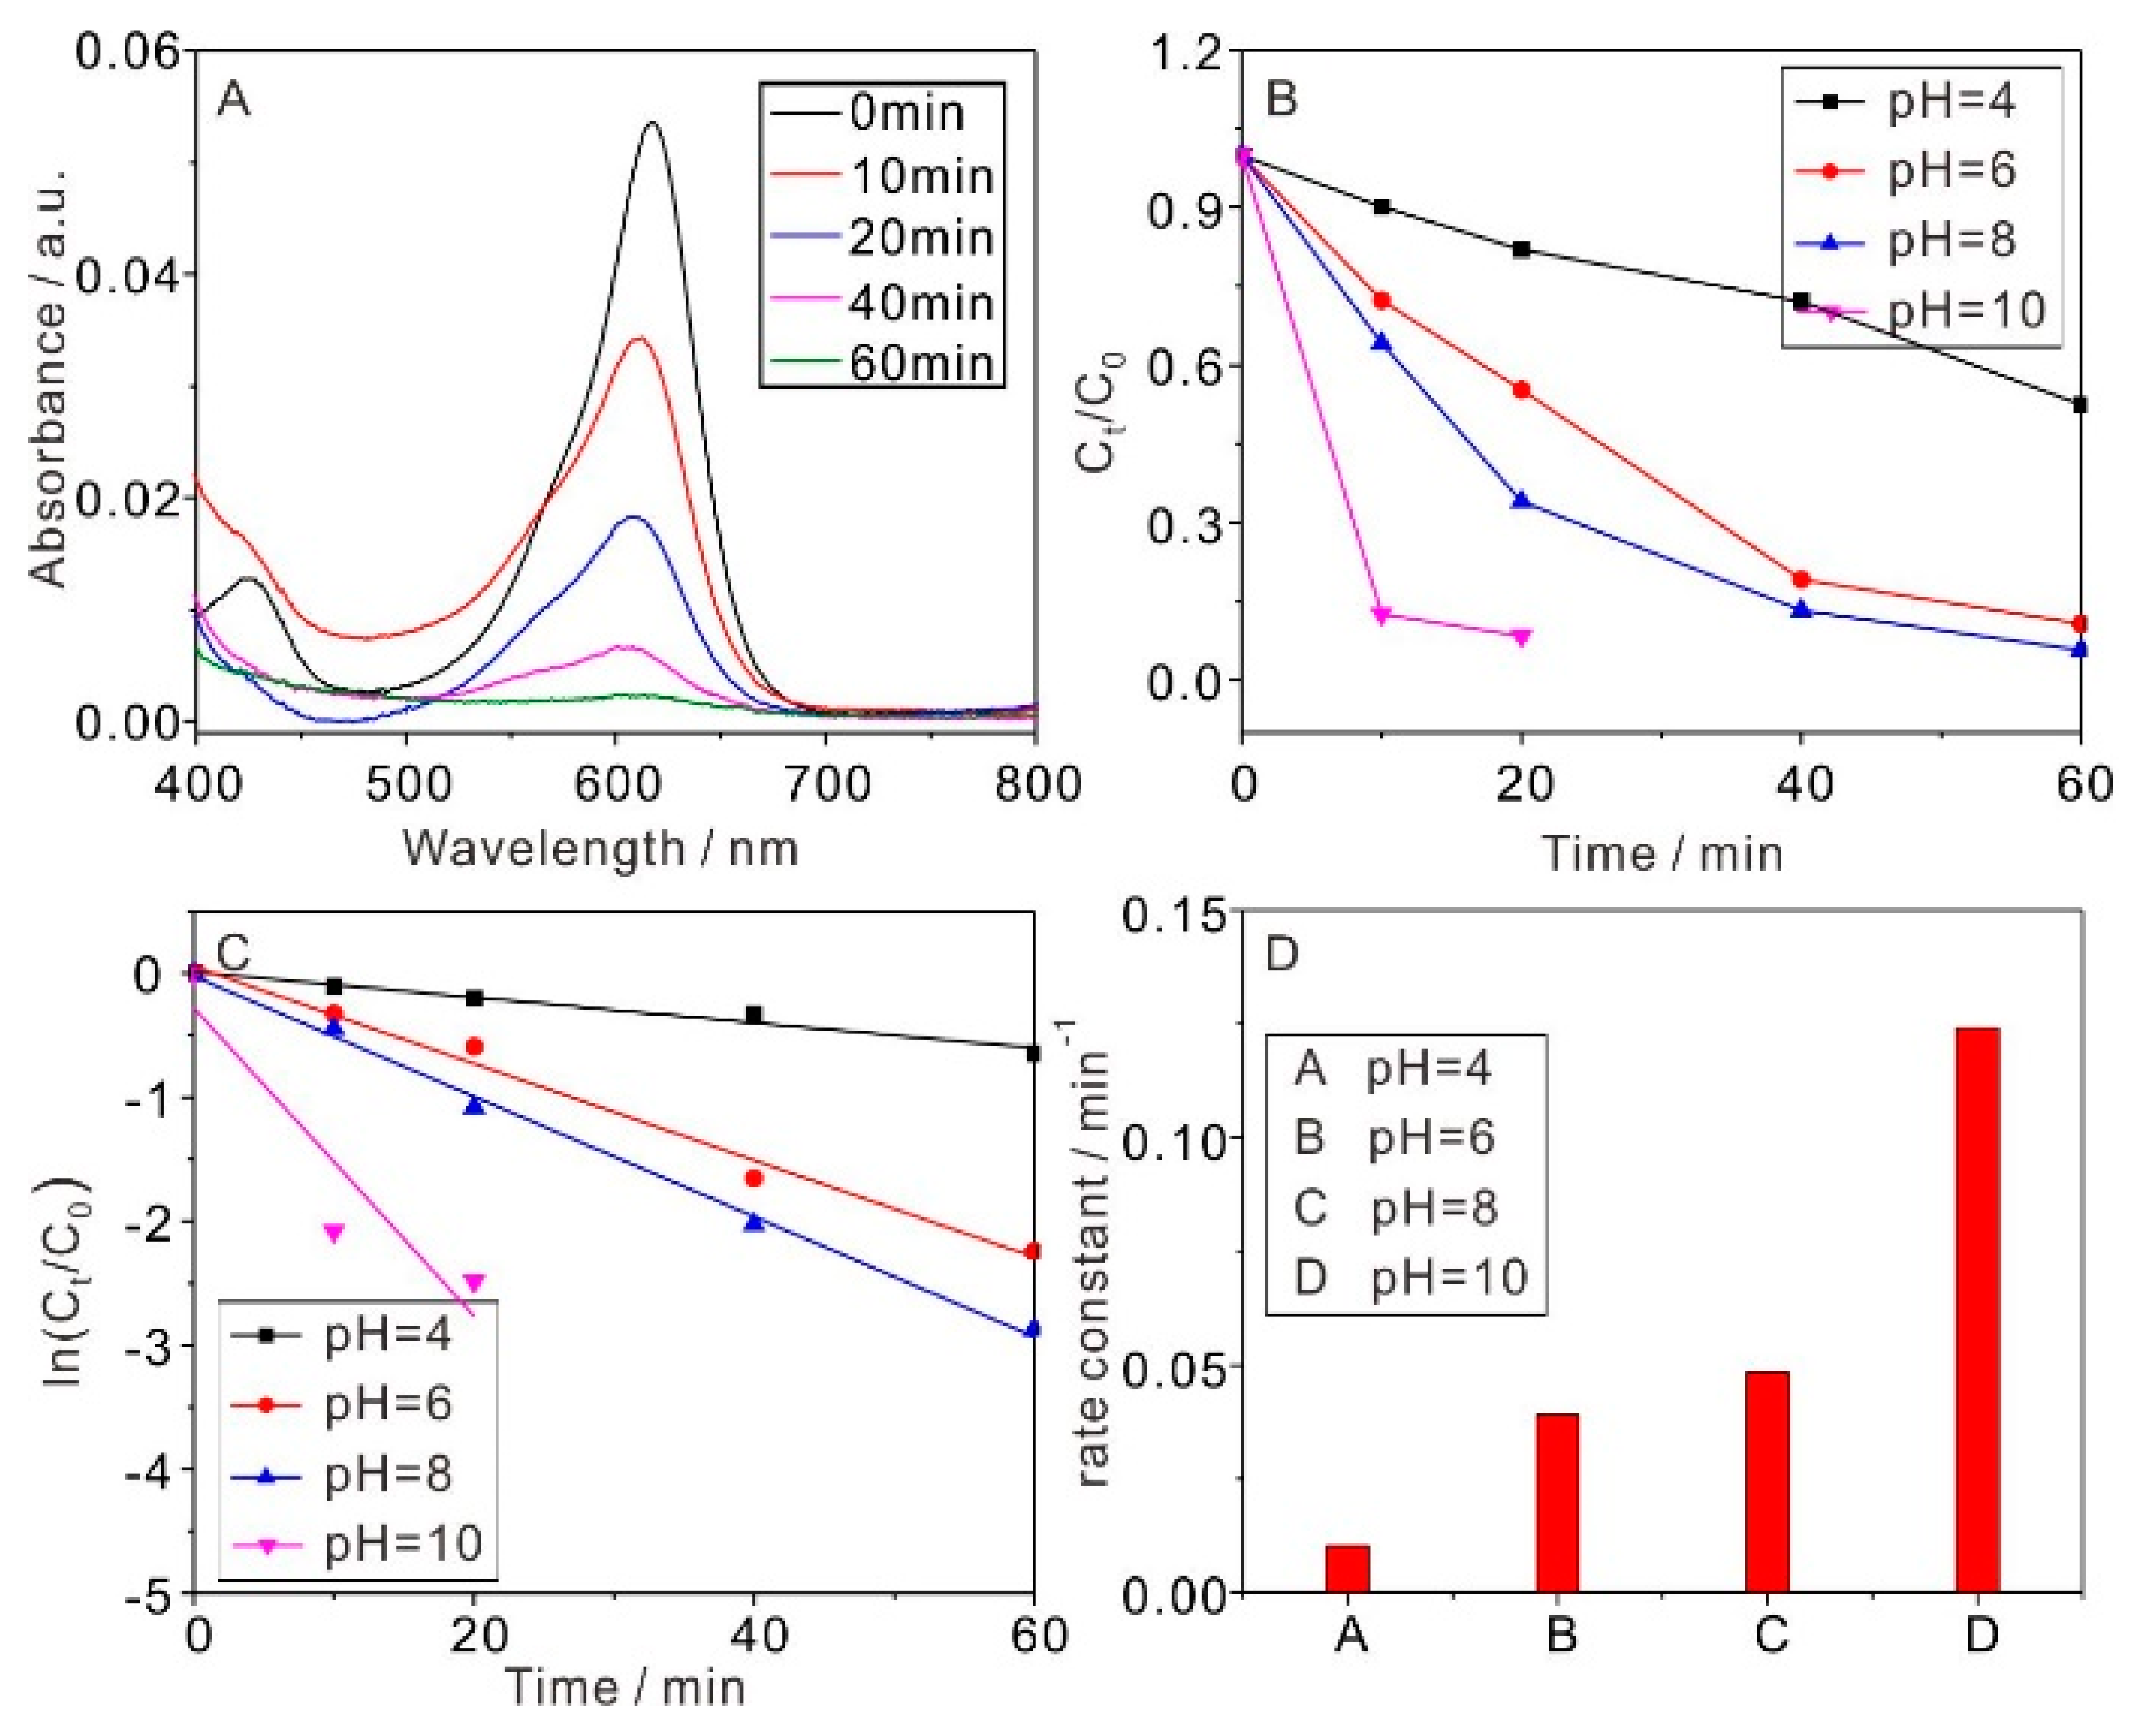
The pH of the aqueous solution is a significant parameter which influences the efficiency of the photocatalytic degradation at the solution-photocatalyst interfaces [26]. Figure 5 indicates the influence of pH on the efficiency of photocatalytic degradation. The absorbance spectra of MG (1 × 10⁻⁵ M) photocatalyzed by 0.6 g/L TiO2 particles at pH = 8 under UV light irradiation, as a function of the irradiation time, are shown in Figure 5A. The time-dependent curves of the Ct/C0 ratio were also used to indicate the photocatalytic activity of TiO2 (Figure 5B). After 1 h of irradiation, 48%, 90% and 95% of MG solution were degraded at pH = 4, 6 and 8, respectively. When the pH value was 10, the degradation ratio of MG reached about 92% after only 20 min of irradiation.
The kinetics of photocatalytic degradation was determined using Equation (1), and the reaction rate constant could be readily derived from the linearly-fitted slope (Figure 5C). The calculated rate constants at pH = 4, 6, 8 and 10 were 0.010, 0.039, 0.048 and 0.124 min−1, respectively (Figure 5D and Table 3). The results indicated that the reaction rate constant increased with the increasing of the pH values. The surface of the photocatalyst acquired a positive charge when the pH of the solution was less than 7. The amount of MG on the surface of the photocatalyst decreases because of the electrostatic repulsion between the positive surface of photocatalyst and the positive surface of MG. Meanwhile, a photocatalytic degradation reaction generally occurs on the surface of a photocatalyst [27,28]. Thus, acidic conditions were a disadvantage for the reaction. On the contrary, alkaline conditions can promote MG molecules to the surface of the photocatalyst because of the electrostatic attractions between the negative surface of the photocatalyst and the positive surface of MG, resulting in a high efficiency of reaction. The R2 of pseudo first-order kinetic models for the photocatalytic degradation of MG at pH = 4, 6, 8 and 10 were 0.961, 0.983, 0.995 and 0.737, respectively (Table 3). The results indicated that the correlation to the photocatalytic degradation of MG under TiO2 particles based on the pseudo first-order kinetic model was good, except for when the pH value was 10. In general, water is weak to mildly alkaline in nature, pH = 8 is close to the pH of natural riverine water. Thus, this condition has great practical application potential in photocatalytic treatment. More importantly, the efficiency of reaction at pH = 8 was also good. Overall, the relatively moderate conditions of pH = 8 were better for this reaction.
2.3. Mechanism of Photocatalytic Degradation
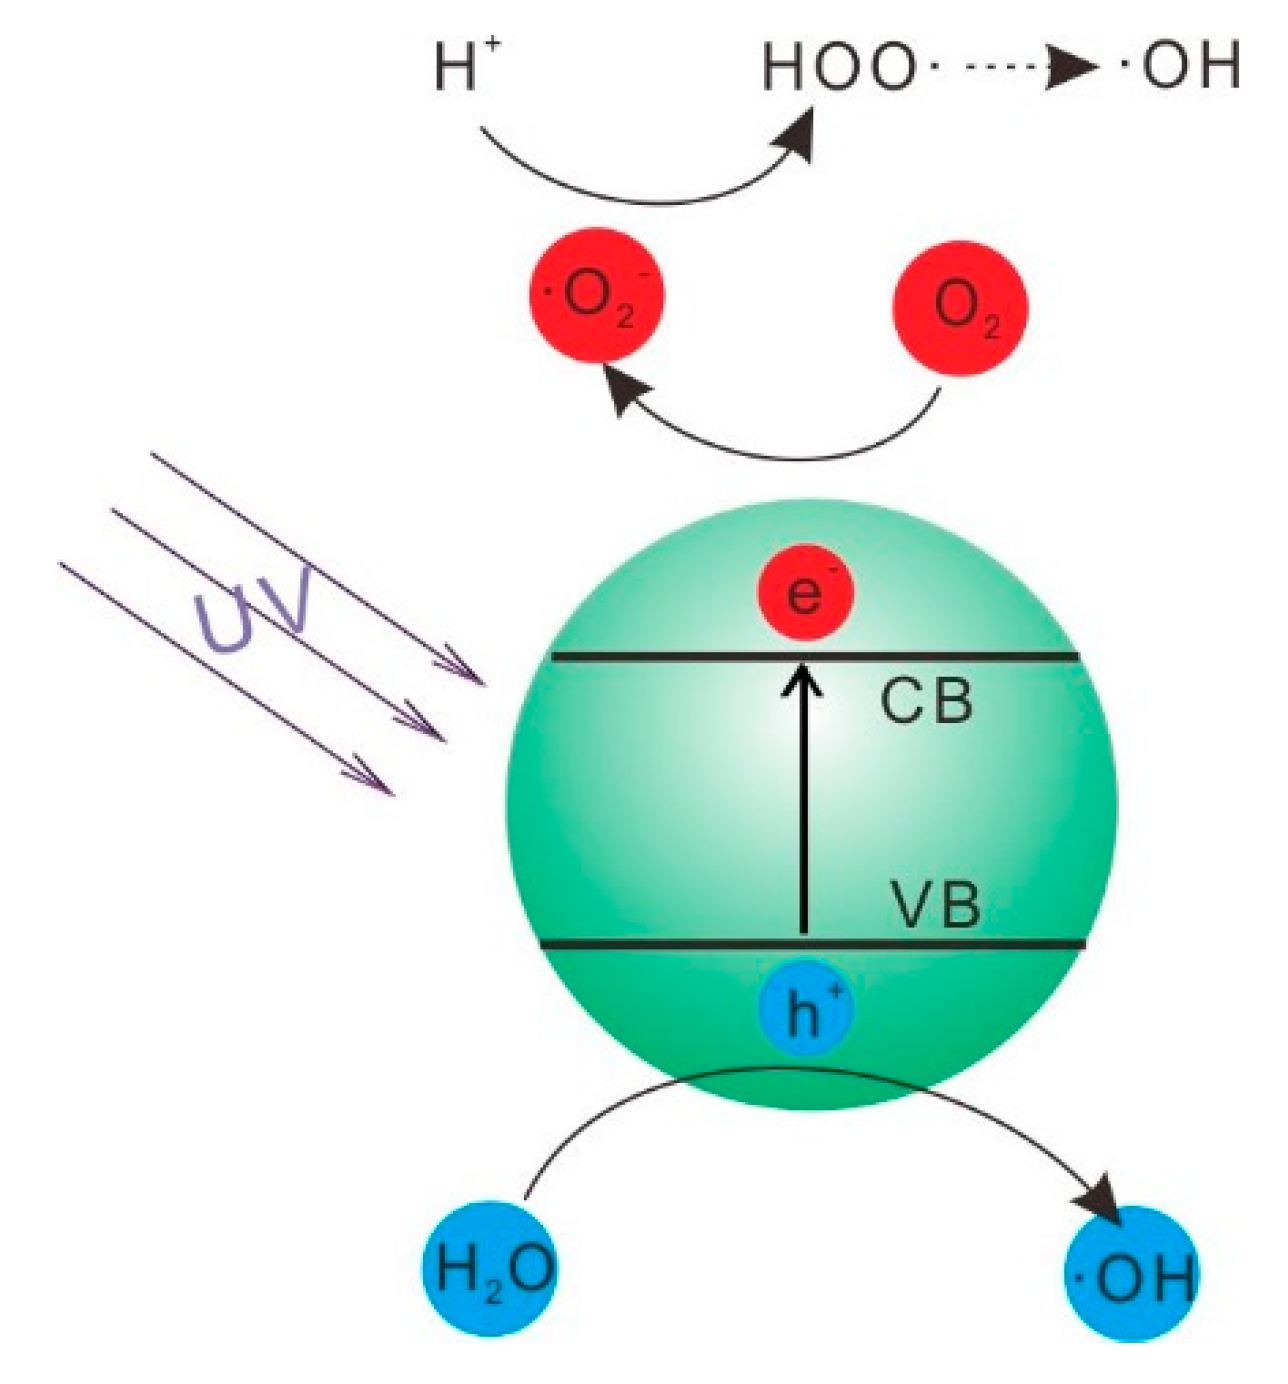
In order to understand the possible mechanisms for the UV-activated photocatalytic degradation activity of TiO2 nanoparticles, electron spin resonance (ESR) measurements were conducted. The spectra displaying signals with the characteristic intensity 1:2:2:1 for DMPO-·OH adducts was obtained, which indicated that the ·OH radical was formed under the used conditions (Figure S3) [29]. The possible mechanism for the photocatalytic degradation reaction was discussed (Scheme 1). Under the irradiation of UV light, TiO2 absorption the energy larger than its band gap (approximately 3.2 eV), electrons were excited from the valence band (CB) to the conduction band (VB), creating electron-hole pairs [30]. And then these electron−hole pairs will migrate to the surface and take part in surface reactions. When the excited electrons arrived at the surface, they reacted with the oxygen to form superoxide ·O2− radical anions. The superoxide ·O2− radical anions reacted with H+, and finally formed hydroxyl radicals (·OH). Meanwhile, holes also reacted with H2O and formed ·OH [15,31]. Therefore, the organic molecules present in the solution could react with these oxidizing agents to induce oxidative degradation. In addition, the strong oxidizing power of ·OH could oxidize most of the organics to carbon dioxide (CO2) and water (H2O).
3. Materials and Methods
3.1. Chemicals and Materials
Titanium n-butoxide (Ti(OBu)4), alcohol and Malachite green (MG) were obtained from Shanghai Reagent Co. (Shanghai, China), and these chemicals were analytical reagents and were used without further purification. The solutions were prepared with distilled water without further pH regulation, and all experiments were carried out under room temperature (25 °C) in a water system.
3.2. Preparation of TiO2
Titanium n-butoxide (Ti(OBu)4) was employed as the Ti source because the hydrolysis rate of Ti(OBu)4 was ca. 150 times slower than that of tetraethyl titanate, Ti(OEt)4 [32]. A typical procedure for preparing titania [33] is described as follows: 300 μL of Ti(OBu)4 was added into 10 mL of ethanol solution. Then, this newly-formed complex precursor solution was transferred into a 60-mL autoclave containing 5 mL of ultrapure water and was heated at 180 °C for 20 h. The resulting product was collected by centrifugation, washed several times with distilled water and ethanol, respectively, and then dried at 60 °C in a drying oven.
3.3. Photocatalytic Experiments
The photocatalytic activities of the TiO2 were evaluated by the degradation of MG under the irradiation of a UV lamp (set at 175 W). In a typical process, the TiO2 particles were dispersed into an MG solution in a quartz tube under different conditions, including the amount of TiO2, pH value and the concentrations of MG. The desired pH of the MG solution was adjusted with 1 M HCl/NaOH to determine the real concentration of MG in the photocatalytic degradation. The solution was then stirred for 2 h in the dark to reach an adsorption–desorption equilibrium between the nanoparticles and the solution. Subsequently, the quartz tube was exposed to irradiation from a UV lamp; 3 mL of MG aqueous solution was intermittently collected at given time intervals for centrifugation, the filtrates measured the absorbance by UV-vis spectroscopy.
3.4. Apparatus
The scanning electron microscopy (SEM) images were taken by a Sirion 200 field-emission scanning electron microscope (ThermoFisher, Waltham, MA, USA). X-ray scattering patterns were determined by analyzing the powder samples on a Philips X-Pert Pro X-ray diffractometer (XRD) (Philips, Amsterdam, Holland) with Cu Ka radiation. Transmission electron microscopy (TEM) images were recorded using a JEOL 2010 high resolution transmission electron microscope (Japan Electronics Co., Ltd., Tokyo, Japan), operated at an acceleration voltage of 200 kV. The absorbance of the MG solution was measured using a Lambda 35 UV-vis spectrometer (Perkinelmer, Waltham, MA, USA).
4. Conclusions
In summary, TiO2 nanoparticles were prepared using a simple and efficient method, which has been proved to be a highly-efficient photocatalyst to degrade MG, a representative and worldwide pollutant in water systems. The kinetics of reaction were successfully monitored by UV spectroscopy, and the kinetic process can be well predicted by the pseudo first-order model. The optimal conditions of the key factors, including TiO2 dosage, concentration of MG and pH values, were determined by analyzing the kinetics of the photocatalytic reaction. The maximum efficiency of MG removal was obtained with the conditions of TiO2 dosage, pH value and initial concentrations of MG at 0.6 g/L, 8 and 10−5 M, respectively. These results provide an efficient strategy to study the photocatalytic degradation of water pollutants.
Supplementary Materials
The following are available online at https://www.mdpi.com/2079-4991/8/6/428/s1, Figure S1: SEM and TEM imagines of TiO2 particles, Figure S2: The UV-vis spectra of TiO2, Figure S3: ESR spectral features of the DMPO-·OH spin adducts in the system without addition MG under irradiation of UV light with TiO2.
Author Contributions
Investigation and original draft preparation, Y.M.; methodology, M.N.; writing, review, and editing, S.L.
Funding
This research was funded by West Light Foundation of the Chinese Academy of Sciences (granted to Y.M.), “the Hundred-Talent Program” of the Chinese Academy of Sciences (granted to S.L.), and the National Natural Science Foundation of China (NSFC 31670473).
Acknowledgments
This study was financially supported by West Light Foundation of the Chinese Academy of Sciences (granted to Y.M.), “the Hundred-Talent Program” of the Chinese Academy of Sciences (granted to S.L.), and the National Natural Science Foundation of China (NSFC 31670473).
Conflicts of Interest
The authors declare no conflicts of interest.
References
- Berger, E.; Haase, P.; Kuemmerlen, M.; Leps, M.; Schafer, R.B.; Sundermann, A. Water quality variables and pollution sources shaping stream macroinvertebrate communities. Sci. Total Environ. 2017, 587, 1–10. [Google Scholar] [CrossRef] [PubMed]
- Moskovchenko, D.V.; Babushkin, A.G.; Ubaidulaev, A.A. Salt pollution of surface water in oil fields of Khanty-Mansi Autonomous Area-Yugra. Water Resour. 2017, 44, 128–138. [Google Scholar] [CrossRef]
- Li, L.; Lin, Z.Z.; Peng, A.H.; Zhong, H.P.; Chen, X.M.; Huang, Z.Y. Biomimetic ELISA detection of malachite green based on magnetic molecularly imprinted polymers. J. Chromatogr. B 2016, 1035, 25–30. [Google Scholar] [CrossRef] [PubMed]
- Stead, S.L.; Ashwin, H.; Johnston, B.; Tarbin, J.A.; Sharman, M.; Kay, J.; Keely, B.J. An RNA-aptamer-based assay for the detection and analysis of malachite green and leucomalachite green residues in fish tissue. Anal. Chem. 2010, 82, 2652–2660. [Google Scholar] [CrossRef] [PubMed]
- Maxwell, E.J.; Tong, W.G. Sensitive detection of malachite green and crystal violet by nonlinear laser wave mixing and capillary electrophoresis. J. Chromatogr. B 2016, 1020, 29–35. [Google Scholar] [CrossRef] [PubMed] [Green Version]
- Plakas, S.M.; ElSaid, K.R.; Stehly, G.R.; Gingerich, W.H.; Allen, J.L. Uptake, tissue distribution, and metabolism of malachite green in the channel catfish (Ictalurus punctatus). Can. J. Fish. Aquat. Sci. 1996, 53, 1427–1433. [Google Scholar] [CrossRef]
- Safarik, I.; Safarikova, M. Detection of low concentrations of malachite green and crystal violet in water. Water Res. 2002, 36, 196–200. [Google Scholar] [CrossRef]
- Wu, L.; Lin, Z.Z.; Zhong, H.P.; Peng, A.H.; Chen, X.M.; Huang, Z.Y. Rapid detection of malachite green in fish based on CdTe quantum dots coated with molecularly imprinted silica. Food Chem. 2017, 229, 847–853. [Google Scholar] [CrossRef] [PubMed]
- Song, D.; Yang, R.; Wang, C.W.; Xiao, R.; Long, F. Reusable nanosilver-coated magnetic particles for ultrasensitive SERS-based detection of malachite green in water samples. Sci. Rep. 2016, 6, 22870. [Google Scholar] [CrossRef] [PubMed] [Green Version]
- Sivashanmugan, K.; Liao, J.D.; Liu, B.H.; Yao, C.K.; Luo, S.C. Ag nanoclusters on ZnO nanodome array as hybrid SERS-active substrate for trace detection of malachite green. Sens. Actuators B Chem. 2015, 207, 430–436. [Google Scholar] [CrossRef]
- Hashemzadeh, F.; Rahimi, R.; Ghaffarinejad, A. Mesoporous nanostructures of Nb2O5 obtained by an EISA route for the treatment of malachite green dye-contaminated aqueous solution under UV and visible light irradiation. Ceram. Int. 2014, 40, 9817–9829. [Google Scholar] [CrossRef]
- Yin, Y.Y.; Li, C.; Song, C.W.; Tao, P.; Sun, M.H.; Pan, Z.L.; Wang, T.H.; Shao, M.H. The design of coal-based carbon membrane coupled with the electric field and its application on the treatment of malachite green (MG) aqueous solution. Colloids Surf. A Physicochem. Eng. Asp. 2016, 506, 629–636. [Google Scholar] [CrossRef]
- Li, X.L.; Zhang, Y.; Jing, L.Y.; He, X.H. Novel N-doped CNTs stabilized Cu2O nanoparticles as adsorbent for enhancing removal of Malachite Green and tetrabromobisphenol A. Chem. Eng. J. 2016, 292, 326–339. [Google Scholar] [CrossRef]
- Wang, Q.; Chen, C.C.; Zhao, D.; Ma, W.H.; Zhao, J.C. Change of adsorption modes of dyes on fluorinated TiO2 and its effect on photocatalytic degradation of dyes under visible irradiation. Langmuir 2008, 24, 7338–7345. [Google Scholar] [CrossRef] [PubMed]
- Furukawa, S.; Shishido, T.; Teramura, K.; Tanaka, T. Photocatalytic oxidation of alcohols over TiO2 covered with Nb2O5. ACS Catal. 2012, 2, 175–179. [Google Scholar] [CrossRef]
- Grabowska, E.; Diak, M.; Marchelek, M.; Zaleska, A. Decahedral TiO2 with exposed facets: Synthesis, properties, photoactivity and applications. Appl. Catal. B Environ. 2014, 156, 213–235. [Google Scholar] [CrossRef]
- Mansouri, F.; Kalankesh, R.L.; Hasankhani, H. The comparison of photo catalytic degradation of dissolved organic carbon (DOC) from water by UV/TiO2 in the presence and absence of iron ion. Glob. NEST J. 2016, 18, 392–401. [Google Scholar]
- Asuha, S.; Zhou, X.G.; Zhao, S. Adsorption of methyl orange and Cr(Vi) on mesoporous TiO2 prepared by hydrothermal method. J. Hazard. Mater. 2010, 181, 204–210. [Google Scholar] [CrossRef] [PubMed]
- Qin, S.H.; Cai, W.Y.; Tang, X.H.; Yang, L.B. Sensitively monitoring photodegradation process of organic dye molecules by surface-enhanced Raman spectroscopy based on Fe3O4@SiO2@TiO2@Ag particle. Analyst 2014, 139, 5509–5515. [Google Scholar] [CrossRef] [PubMed]
- Lee, R.; Kumaresan, Y.; Yoon, S.Y.; Um, S.H.; Kwon, I.K.; Jung, G.Y. Design of gold nanoparticles-decorated SiO2@TiO2 core/shell nanostructures for visible light-activated photocatalysis. RSC Adv. 2017, 7, 7469–7475. [Google Scholar] [CrossRef]
- Cai, X.G.; He, J.Y.; Chen, L.; Chen, K.; Li, Y.L.; Zhang, K.S.; Jin, Z.; Liu, J.Y.; Wang, C.M.; Wang, X.G.; et al. A 2D-g-C3N4 nanosheet as an eco-friendly adsorbent for various environmental pollutants in water. Chemosphere 2017, 171, 192–201. [Google Scholar] [CrossRef] [PubMed]
- Ma, Y.M.; Liu, H.L.; Han, Z.Z.; Yang, L.B.; Liu, J.H. Non-ultraviolet photocatalytic kinetics of NaYF4:Yb,Tm@TiO2/Ag core@comby shell nanostructures. J. Mater. Chem. A 2015, 3, 14642–14650. [Google Scholar] [CrossRef]
- Yang, J.K.; Lee, S.M. Removal of Cr(Vi) and humic acid by using TiO2 photocatalysis. Chemosphere 2006, 63, 1677–1684. [Google Scholar] [CrossRef] [PubMed]
- Huang, X.H.; Leal, M.; Li, Q.L. Degradation of natural organic matter by TiO2 photocatalytic oxidation and its effect on fouling of low-pressure membranes. Water Res. 2008, 42, 1142–1150. [Google Scholar] [CrossRef] [PubMed]
- Zhu, B.S.; Jia, Y.; Jin, Z.; Sun, B.; Luo, T.; Yu, X.Y.; Kong, L.T.; Huang, X.J.; Liu, J.H. Controlled synthesis of natroalunite microtubes and spheres with excellent fluoride removal performance. Chem. Eng. J. 2015, 271, 240–251. [Google Scholar] [CrossRef]
- Wu, S.B.; Zhang, K.S.; Wang, X.L.; Jia, Y.; Sun, B.; Luo, T.; Meng, F.L.; Jin, Z.; Lin, D.Y.; Shen, W.; et al. Enhanced adsorption of cadmium ions by 3D sulfonated reduced graphene oxide. Chem. Eng. J. 2015, 262, 1292–1302. [Google Scholar] [CrossRef]
- Wang, X.D.; Caruso, R.A. Enhancing photocatalytic activity of titania materials by using porous structures and the addition of gold nanoparticles. J. Mater. Chem. 2011, 21, 20–28. [Google Scholar] [CrossRef]
- Mills, A.; LeHunte, S. An overview of semiconductor photocatalysis. J. Photochem. Photobiol. A 1997, 108, 1–35. [Google Scholar] [CrossRef]
- Yang, J.; Dai, J.; Chen, C.C.; Zhao, J.C. Effects of hydroxyl radicals and oxygen species on the 4-chlorophenol degradation by photoelectrocatalytic reactions with TiO2-film electrodes. J. Photochem. Photobiol. A 2009, 208, 66–77. [Google Scholar] [CrossRef]
- Li, X.H.; Chen, G.Y.; Yang, L.B.; Jin, Z.; Liu, J.H. Multifunctional Au-coated TiO2 nanotube arrays as recyclable SERS substrates for multifold organic pollutants detection. Adv. Funct. Mater. 2010, 20, 2815–2824. [Google Scholar] [CrossRef]
- Muggli, D.S.; McCue, J.T.; Falconer, J.L. Mechanism of the photocatalytic oxidation of ethanol on TiO2. J. Catal. 1998, 173, 470–483. [Google Scholar] [CrossRef]
- Tang, Y.N.; Di, W.H.; Zhai, X.S.; Yang, R.Y.; Qin, W.P. NIR-responsive photocatalytic activity and mechanism of NaYF4:Yb,Tm@TiO2 core-shell nanoparticles. ACS Catal. 2013, 3, 405–412. [Google Scholar] [CrossRef]
- Zhang, Y.X.; Yu, X.Y.; Jia, Y.; Jin, Z.; Liu, J.H.; Huang, X.J. A facile approach for the synthesis of Ag-coated Fe3O4@TiO2 core/shell microspheres as highly efficient and recyclable photocatalysts. Eur. J. Inorg. Chem. 2011, 2011, 5096–5104. [Google Scholar] [CrossRef]
Figure 1.
(A) TEM image of the TiO2 particle; (B) enlarged HRTEM image of details of the TiO2 particle.
Figure 1.
(A) TEM image of the TiO2 particle; (B) enlarged HRTEM image of details of the TiO2 particle.

Figure 2.
XRD patterns of TiO2 and the standard XRD patterns of anatase-phase TiO2 (JCPDS 21-1272).

Figure 3.
(A) Time-course UV-Vis absorbance spectra of MG (10−5 M) photocatalyzed by 0.6 g/L TiO2 under UV light; (B–D) The calculated time-dependent ratios of Ct/C0, first-order degradation rates, and reaction rate constants under UV light with different TiO2 dosage.
Figure 3.
(A) Time-course UV-Vis absorbance spectra of MG (10−5 M) photocatalyzed by 0.6 g/L TiO2 under UV light; (B–D) The calculated time-dependent ratios of Ct/C0, first-order degradation rates, and reaction rate constants under UV light with different TiO2 dosage.

Figure 4.
(A) Time-course UV-vis absorbance spectra of MG (10−5 M) photocatalyzed by 0.6 g/L TiO2 under UV light; (B–D) The calculated time-dependent ratios of Ct/C0, first-order degradation rates, and reaction rate constants for different concentration of MG photocatalyzed by 0.6 g/L TiO2 under UV light.

Figure 5.
(A) Time-course UV-Vis absorbance spectra of MG (10−5 M) photocatalyzed by 0.6 g/L TiO2 under UV light at pH = 8. (B–D) The calculated time-dependent ratios of Ct/C0, first-order degradation rates and reaction rate constants for MG (10−5 M) photocatalyzed by 0.6 g/L TiO2 with different pH values.

Scheme 1.
Illustrated mechanism of UV-activated photocatalysis on TiO2.


Table 1.
Comparison of pseudo first-order model parameters, rate constants (k, min−1) and R2 under different TiO2 dosages.
Table 1.
Comparison of pseudo first-order model parameters, rate constants (k, min−1) and R2 under different TiO2 dosages.
| TiO2 Dosage (g/L) | k (min−1) | R2 |
|---|---|---|
| 0.4 | 0.0716 | 0.964 |
| 0.6 | 0.0805 | 0.995 |
| 0.8 | 0.0711 | 0.976 |
Table 2.
Comparison of pseudo first-order model parameters, rate constants (k, min−1) and R2 under different concentrations of MG.
Table 2.
Comparison of pseudo first-order model parameters, rate constants (k, min−1) and R2 under different concentrations of MG.
| Concentration of MG (M) | k (min−1) | R2 |
|---|---|---|
| 5 × 10⁻⁵ | 0.0151 | 0.965 |
| 2.5 × 10⁻⁵ | 0.022 | 0.935 |
| 10−5 | 0.0805 | 0.995 |
| 5 × 10⁻⁶ | 0.055 | 0.989 |
Table 3.
Comparison of pseudo first-order model parameters, rate constants (k, min−1) and R2 under different pH values.
Table 3.
Comparison of pseudo first-order model parameters, rate constants (k, min−1) and R2 under different pH values.
| pH Values | k (min−1) | R2 |
|---|---|---|
| 4 | 0.01 | 0.961 |
| 6 | 0.039 | 0.983 |
| 8 | 0.048 | 0.995 |
| 10 | 0.124 | 0.737 |
© 2018 by the authors. Licensee MDPI, Basel, Switzerland. This article is an open access article distributed under the terms and conditions of the Creative Commons Attribution (CC BY) license (http://creativecommons.org/licenses/by/4.0/).
Share and Cite
MDPI and ACS Style
Ma, Y.; Ni, M.; Li, S. Optimization of Malachite Green Removal from Water by TiO2 Nanoparticles under UV Irradiation. Nanomaterials 2018, 8, 428. https://doi.org/10.3390/nano8060428
AMA Style
Ma Y, Ni M, Li S. Optimization of Malachite Green Removal from Water by TiO2 Nanoparticles under UV Irradiation. Nanomaterials. 2018; 8(6):428. https://doi.org/10.3390/nano8060428
Chicago/Turabian StyleMa, Yongmei, Maofei Ni, and Siyue Li. 2018. "Optimization of Malachite Green Removal from Water by TiO2 Nanoparticles under UV Irradiation" Nanomaterials 8, no. 6: 428. https://doi.org/10.3390/nano8060428
Note that from the first issue of 2016, this journal uses article numbers instead of page numbers. See further details here.