Article

Effect of Tb-doped Concentration Variation on the Electrical and Dielectric Properties of CaF2 Nanoparticles

1
Key Laboratory of Functional Materials Physics and Chemistry of the Ministry of Education, National Demonstration Center for Experimental Physics Education, Jilin Normal University, Siping 136000, China
2
State Key Laboratory of Superhard Materials, Jilin University, Changchun 130012, China
*
Author to whom correspondence should be addressed.
Nanomaterials 2018, 8(7), 532; https://doi.org/10.3390/nano8070532
Submission received: 29 June 2018 / Revised: 11 July 2018 / Accepted: 12 July 2018 / Published: 14 July 2018

Abstract

:
Calcium fluoride (CaF2) nanoparticles with various terbium (Tb) doping concentrations were investigated by X-ray diffraction (XRD), transmission electron microscopy (TEM), and alternating current (AC) impedance measurement. The original shape and structure of CaF2 nanoparticles were retained after doping. In all the samples, the dominant charge carriers were electrons, and the F ion transference number increased with increasing Tb concentration. The defects in the grain region considerably contributed to the electron transportation process. When the Tb concentration was less than 3%, the effect of the ionic radius variation dominated and led to the diffusion of the F ions and facilitated electron transportation. When the Tb concentration was greater than 3%, the increasing deformation potential scattering dominated, impeding F ion diffusion and electron transportation. The substitution of Ca2+ by Tb3+ enables the electron and ion hopping in CaF2 nanocrystals, resulting in increased permittivity.

1. Introduction

Lanthanide (III)-doped nanocrystals have attracted considerable attention due to their potential applications in electrical and optical devices [1,2,3,4,5]. Due to low refractivity, high transparency, and low phonon energy, fluoride compounds are well-known host materials for lanthanide (III)-doped nanocrystals [6,7,8,9,10,11]. As an important class of fluorides, calcium fluoride (CaF2) has been used as a host due to its stability and non-hygroscopic behavior. Therefore, lanthanide (III)-doped CaF2 nanoparticles have been examined in fundamental and applied studies [12,13,14,15,16,17].
For optical and optoelectronic devices, energy consumption is a key factor in evaluating their performance [18,19,20,21]. Energy consumption is inextricably tied to the electrical and dielectric performance of the material used in a device. Therefore, the electrical and dielectric properties of lanthanide (III)-doped CaF2 nanoparticles are worth exploring. Due to the presence of numerous grain boundaries, nanocrystals have many unique properties that would not be present in their corresponding bulk counterparts [22,23]. Additionally, electrical and dielectric properties are closely related to the charge carrier types and their scattering processes. However, the above subjects have not been studied in detail.
In this study, the morphology and structure of CaF2 nanoparticles with various Tb doping concentrations are studied using X-ray diffraction (XRD) and transmission electron microscopy (TEM). The electrical and dielectric properties are investigated using alternating current (AC) impedance measurements. The transportation properties of charge carriers are also discussed.

2. Materials and Methods

A series of Tb-doped CaF2 nanoparticles were synthesized using the liquid-solid-solution (LSS) solvothermal route [24,25,26]. The sample was synthesized as follows: 16.8 mL oleic acid, 48 mL ethanol, and 0.4 g sodium hydroxide (Sinopharm Chemical Reagent Beijing Co., Ltd, Beijing, China) were mixed together and stirred for 10 min; 1.888 g Ca(NO3)2·H2O (Sinopharm Chemical Reagent Beijing Co., Ltd, Beijing, China) dissolved in 20 mL H2O was added to the solution and stirred for 10 min. Then, 0.672 g sodium fluoride (NaF) (Sinopharm Chemical Reagent Beijing Co., Ltd, Beijing, China) dissolved in 20 mL H2O was added to the solution and stirred for 1 h. Finally, the solution was poured into an autoclave. The system was kept at 160 °C for 24 h and then cooled naturally in air. The product was centrifuged with cyclohexane (Sinopharm Chemical Reagent Beijing Co., Ltd, Beijing, China) and ethanol and dried at 80 °C. To the Tb-doped samples, part of the Ca(NO3)2·H2O was substituted by Tb(NO3)3·5H2O (Sinopharm Chemical Reagent Beijing Co., Ltd, Beijing, China) and the Tb(NO3)3·5H2O molar fractions were 1, 2, 3, 4, and 5 mol %. Transmission electron micrographs were measured by TEM (JEOL Ltd., Tokyo, Japan). The samples structure and phase were measured by XRD (Rigaku, Tokyo, Japan) with Cu Kα radiation (λ = 1.5406 Å). The sample we synthesized was powered, which is incompact. However, to complete impedance measurements, the sample must be compact. Therefore, the sample was pressed into a cylinder (ø6 × 1 mm) using a shock pressure (20 MPa). The impedance measurement was measured by parallel plate electrode at atmospheric pressure. The input voltage amplitude was 1 V, and frequency ranged from 0.1 to 107 Hz. The output signal was gathered and processed by the impedance analyzer (Solartron 1260, Solartron, Hampshire, UK) with a dielectric interface (Solartron 1260, Solartron, Hampshire, UK).

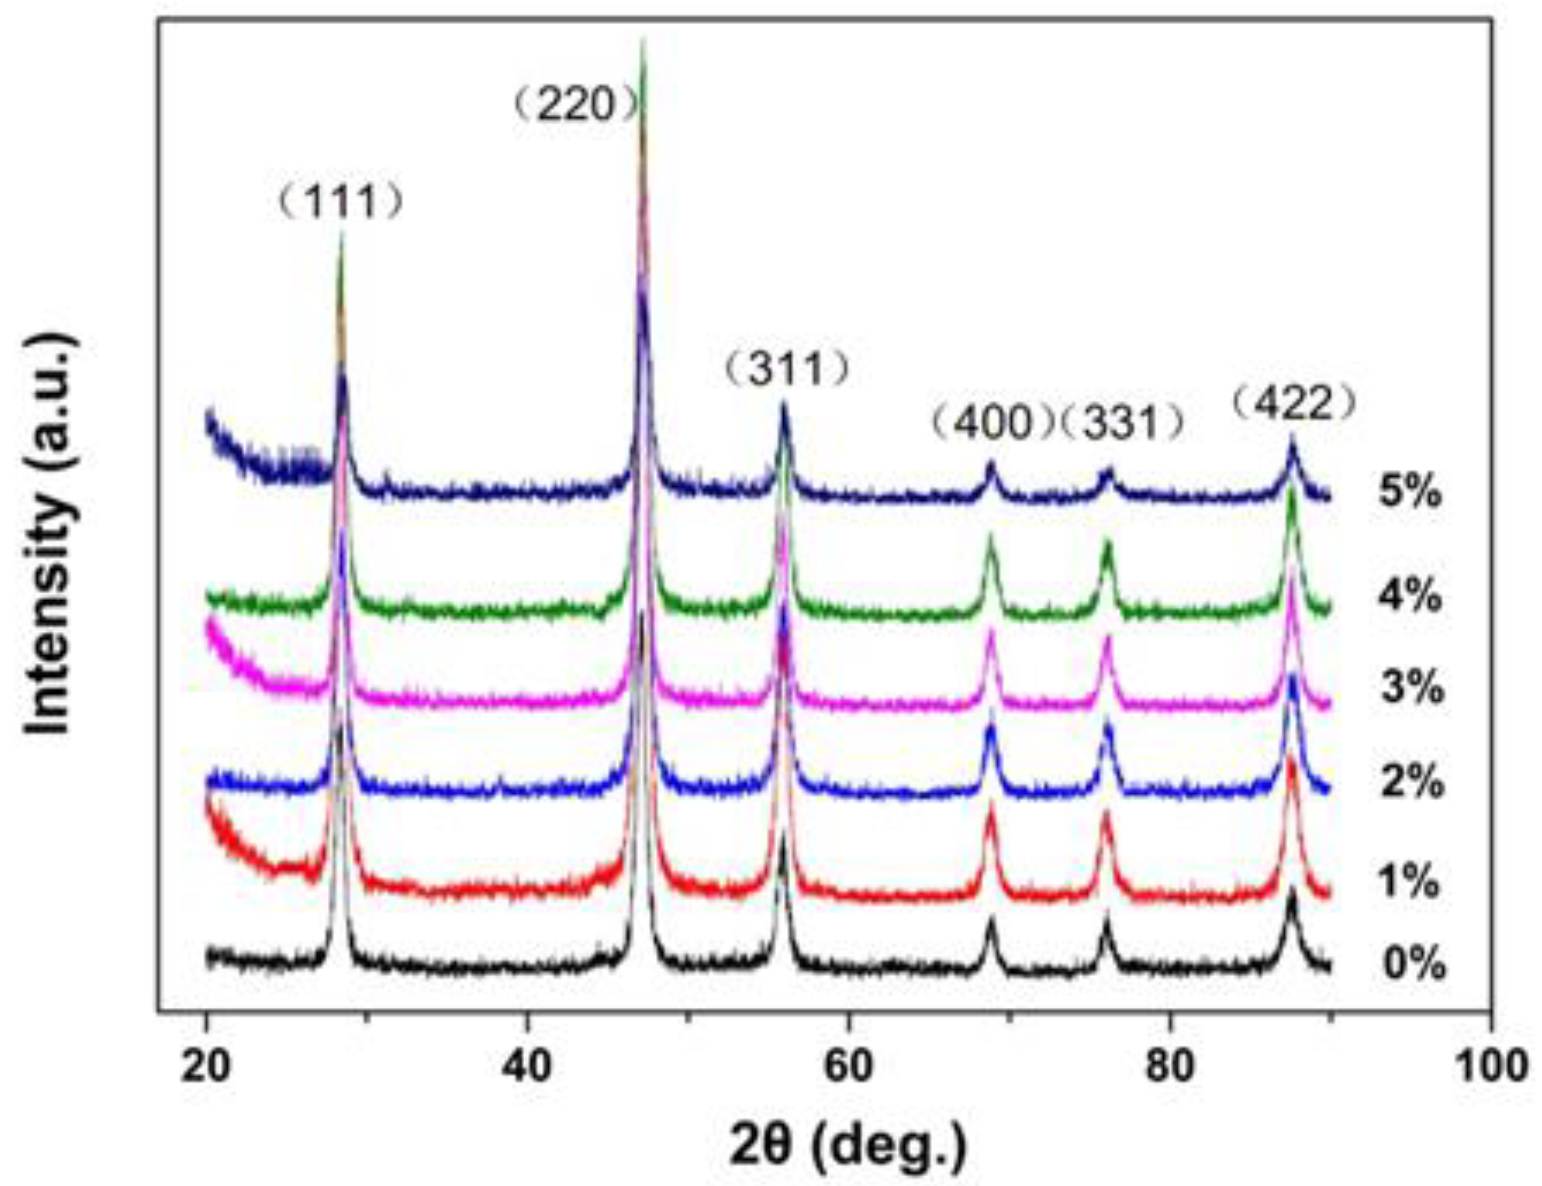
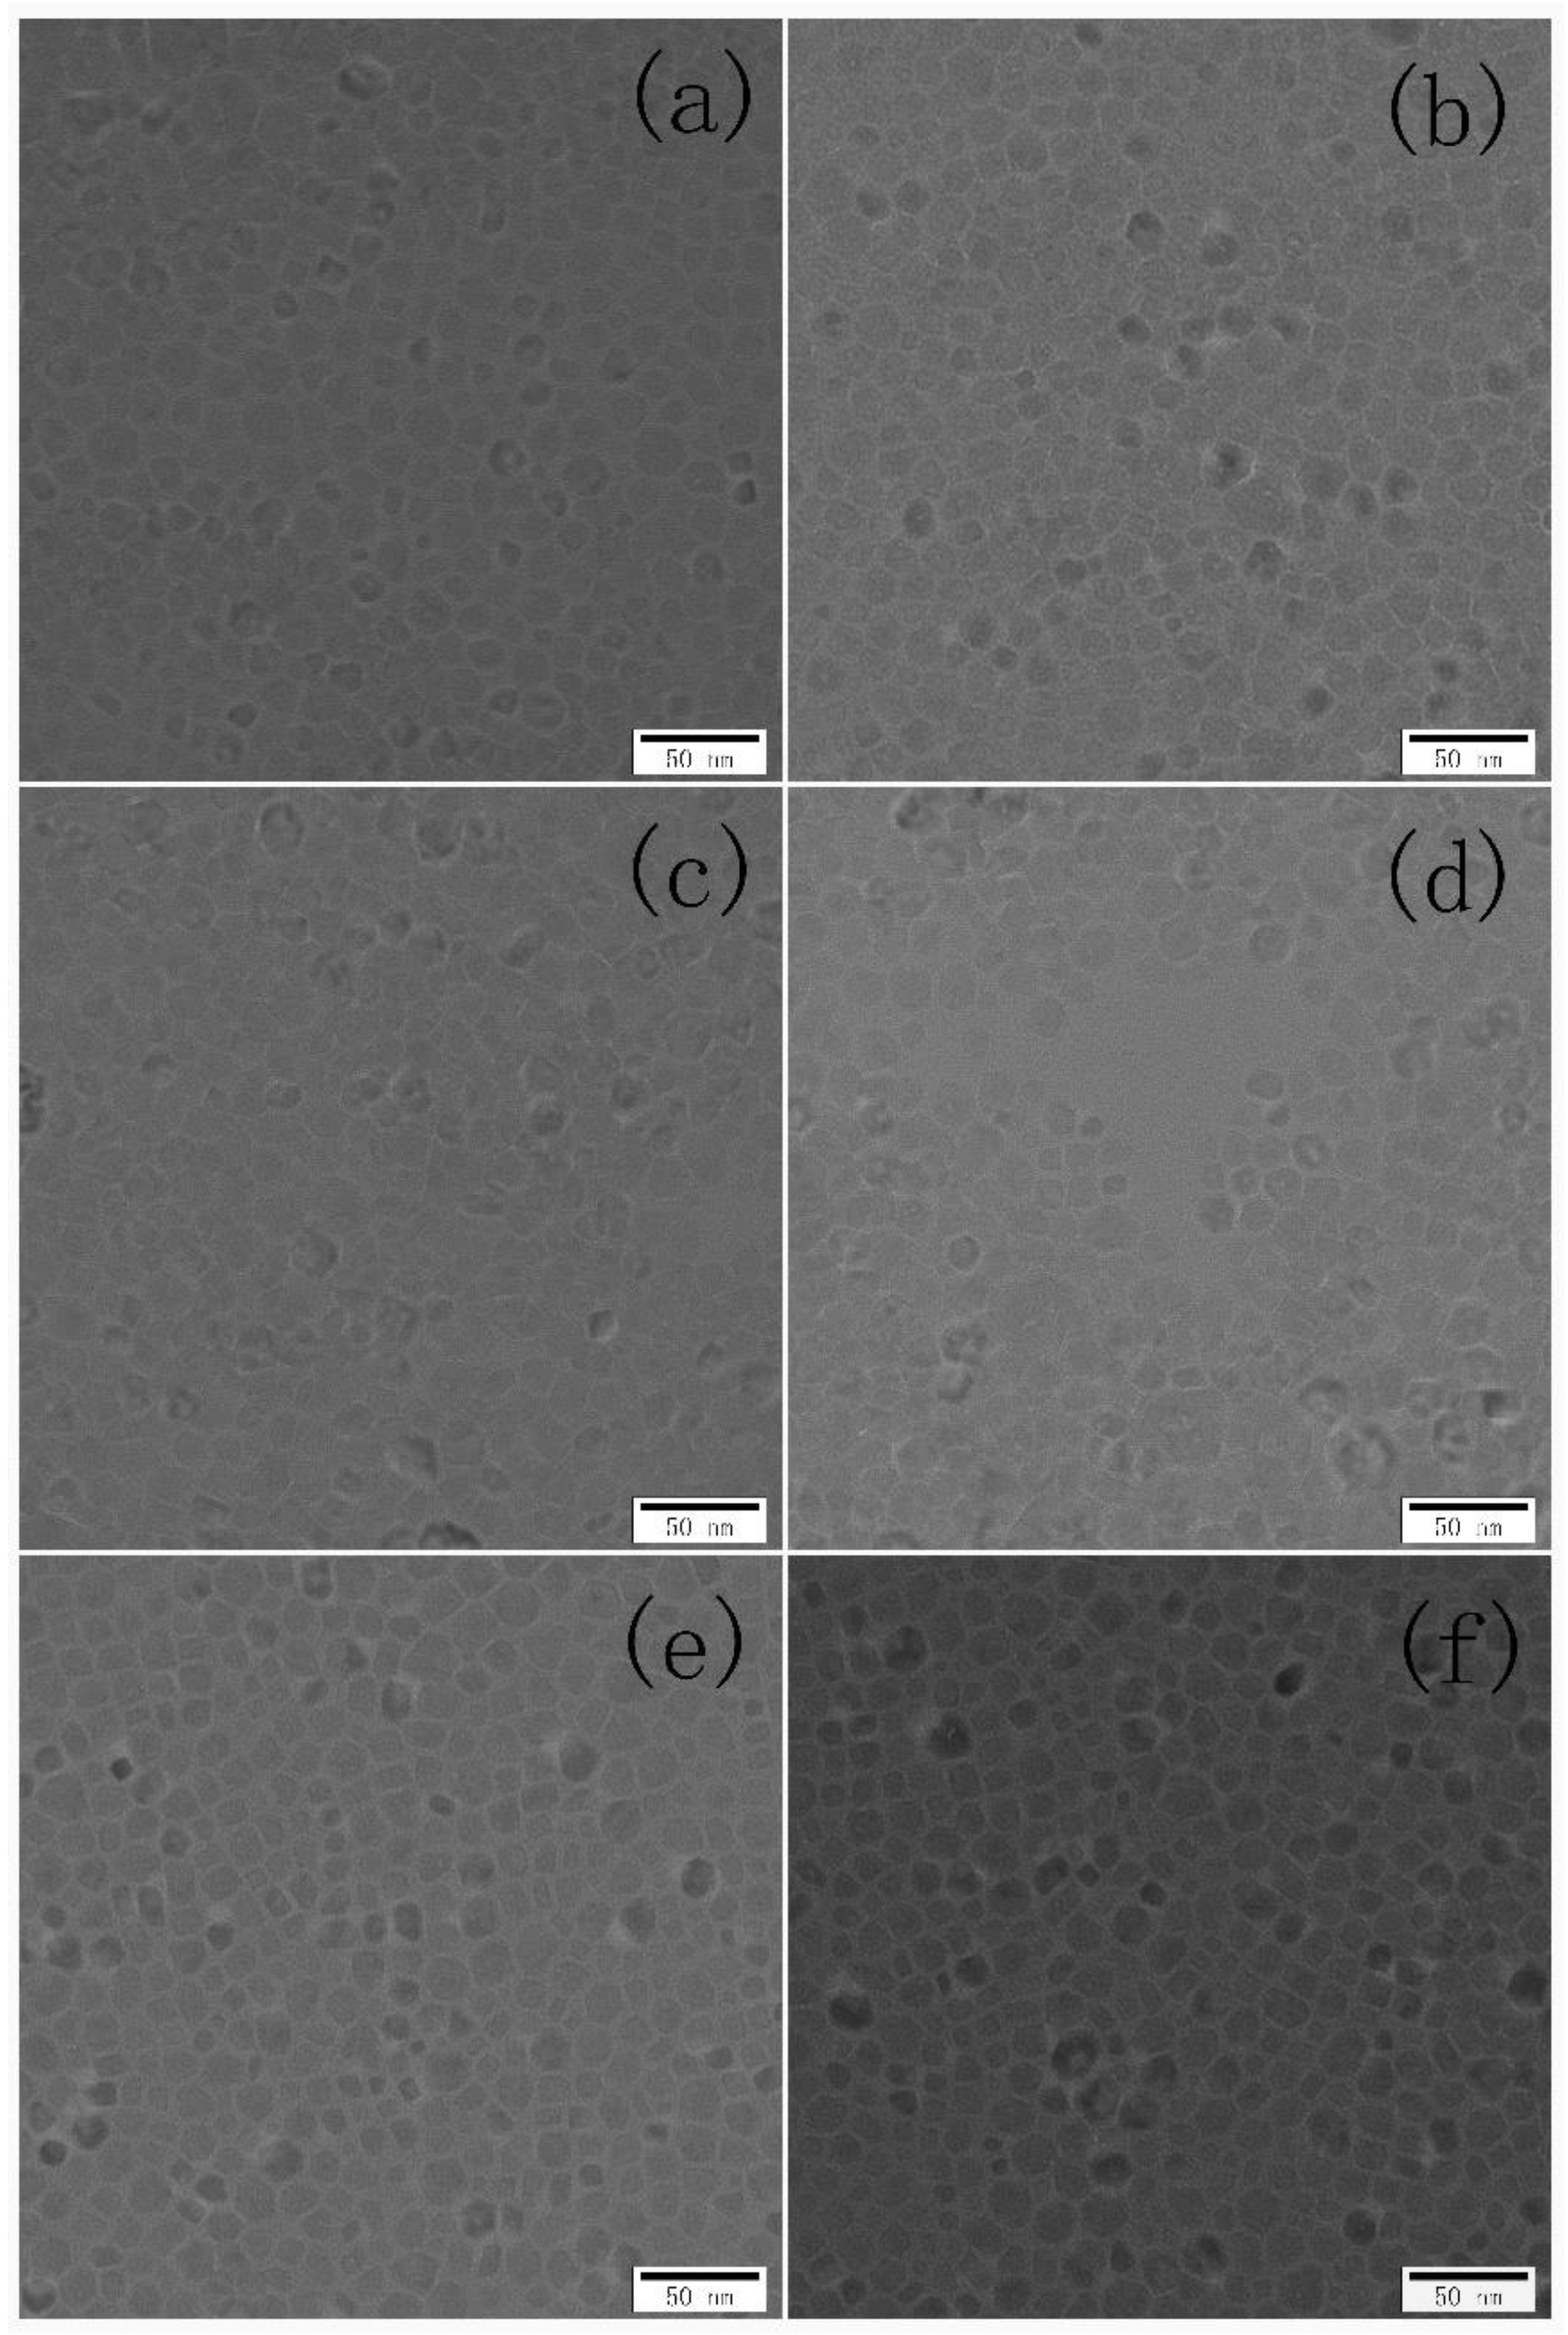
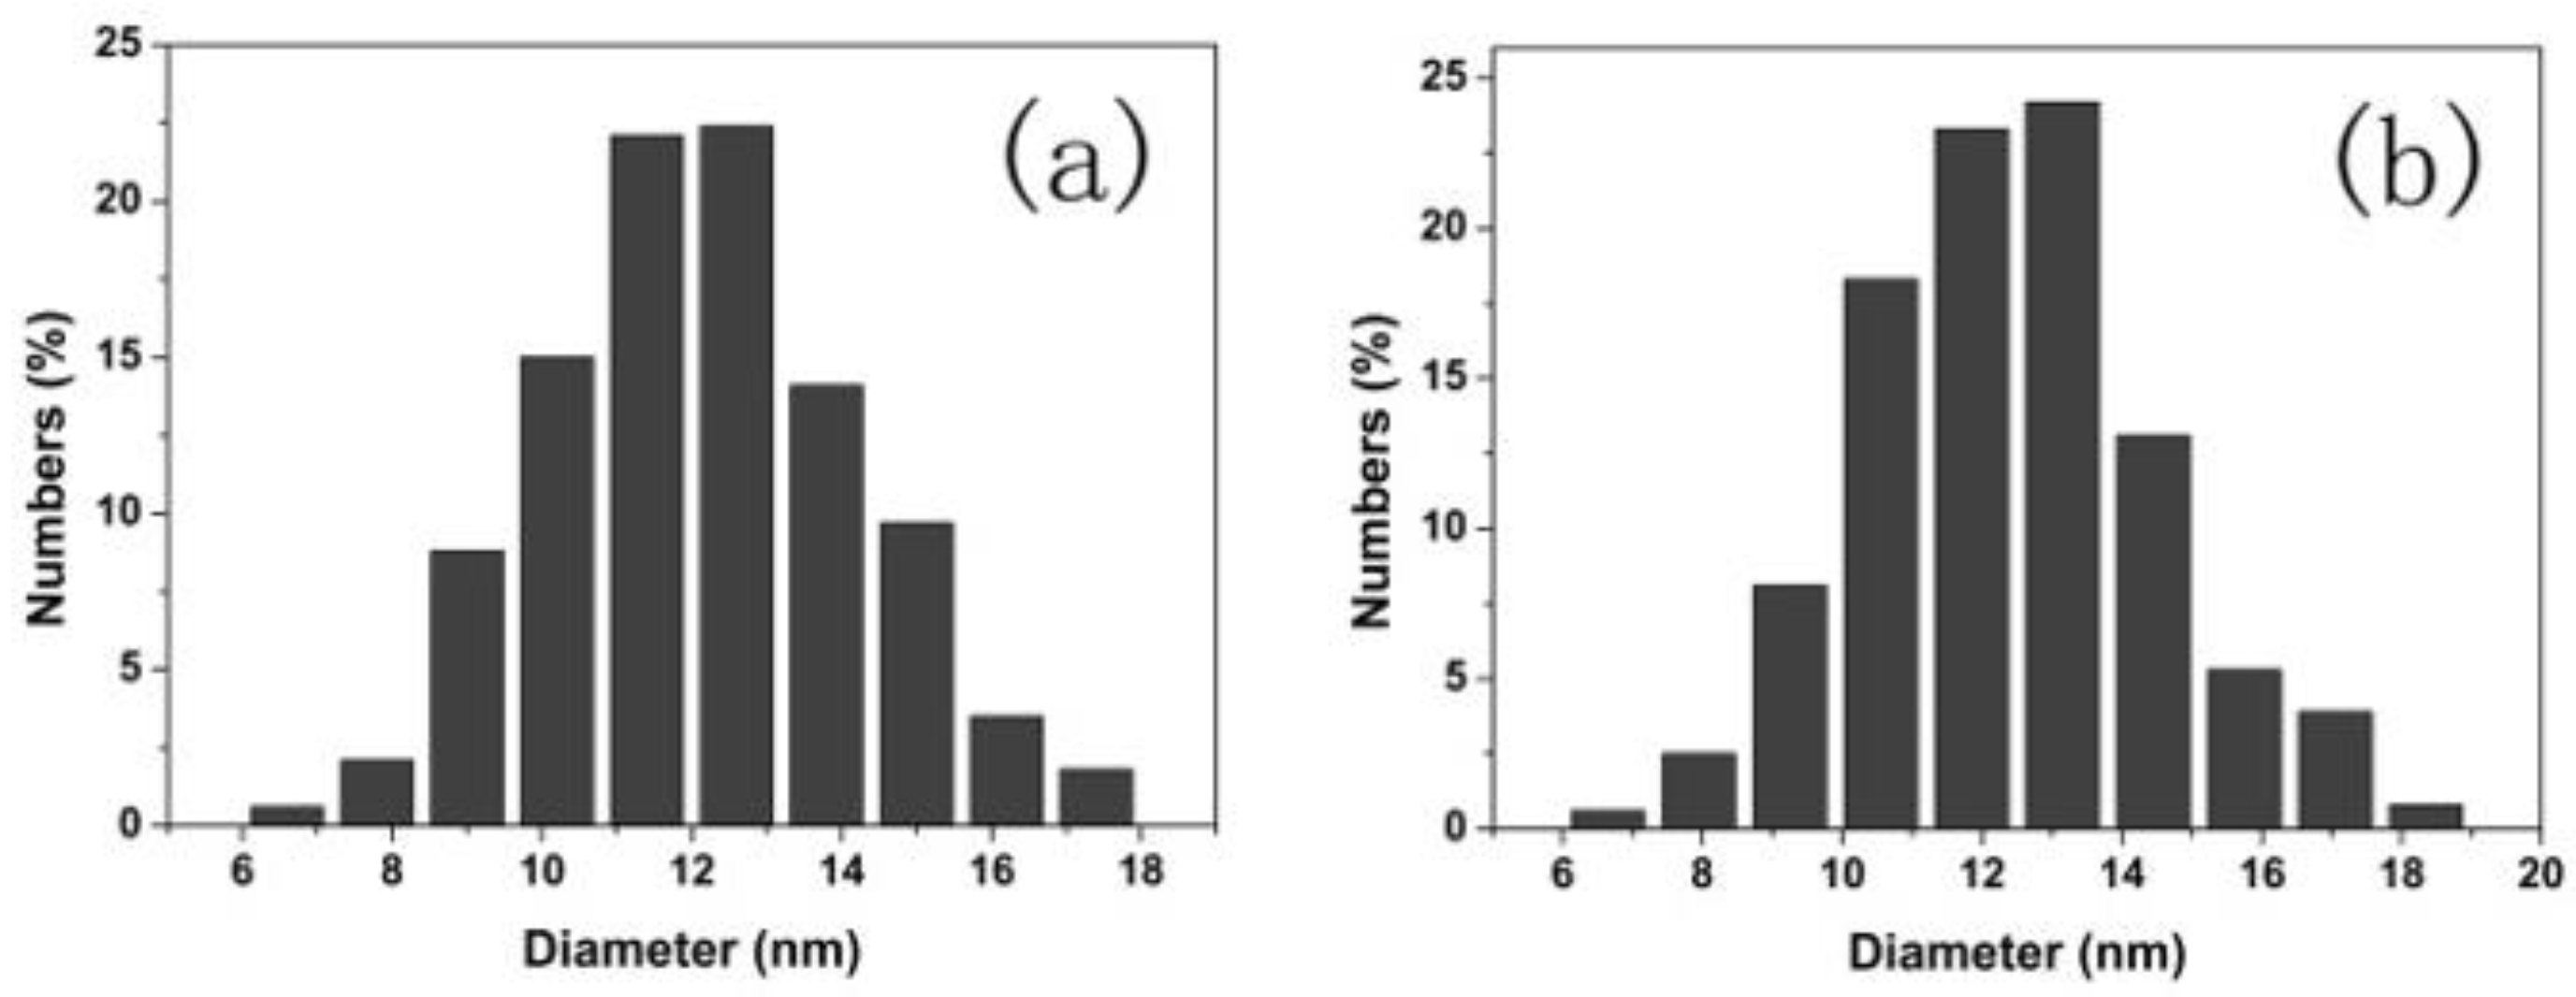
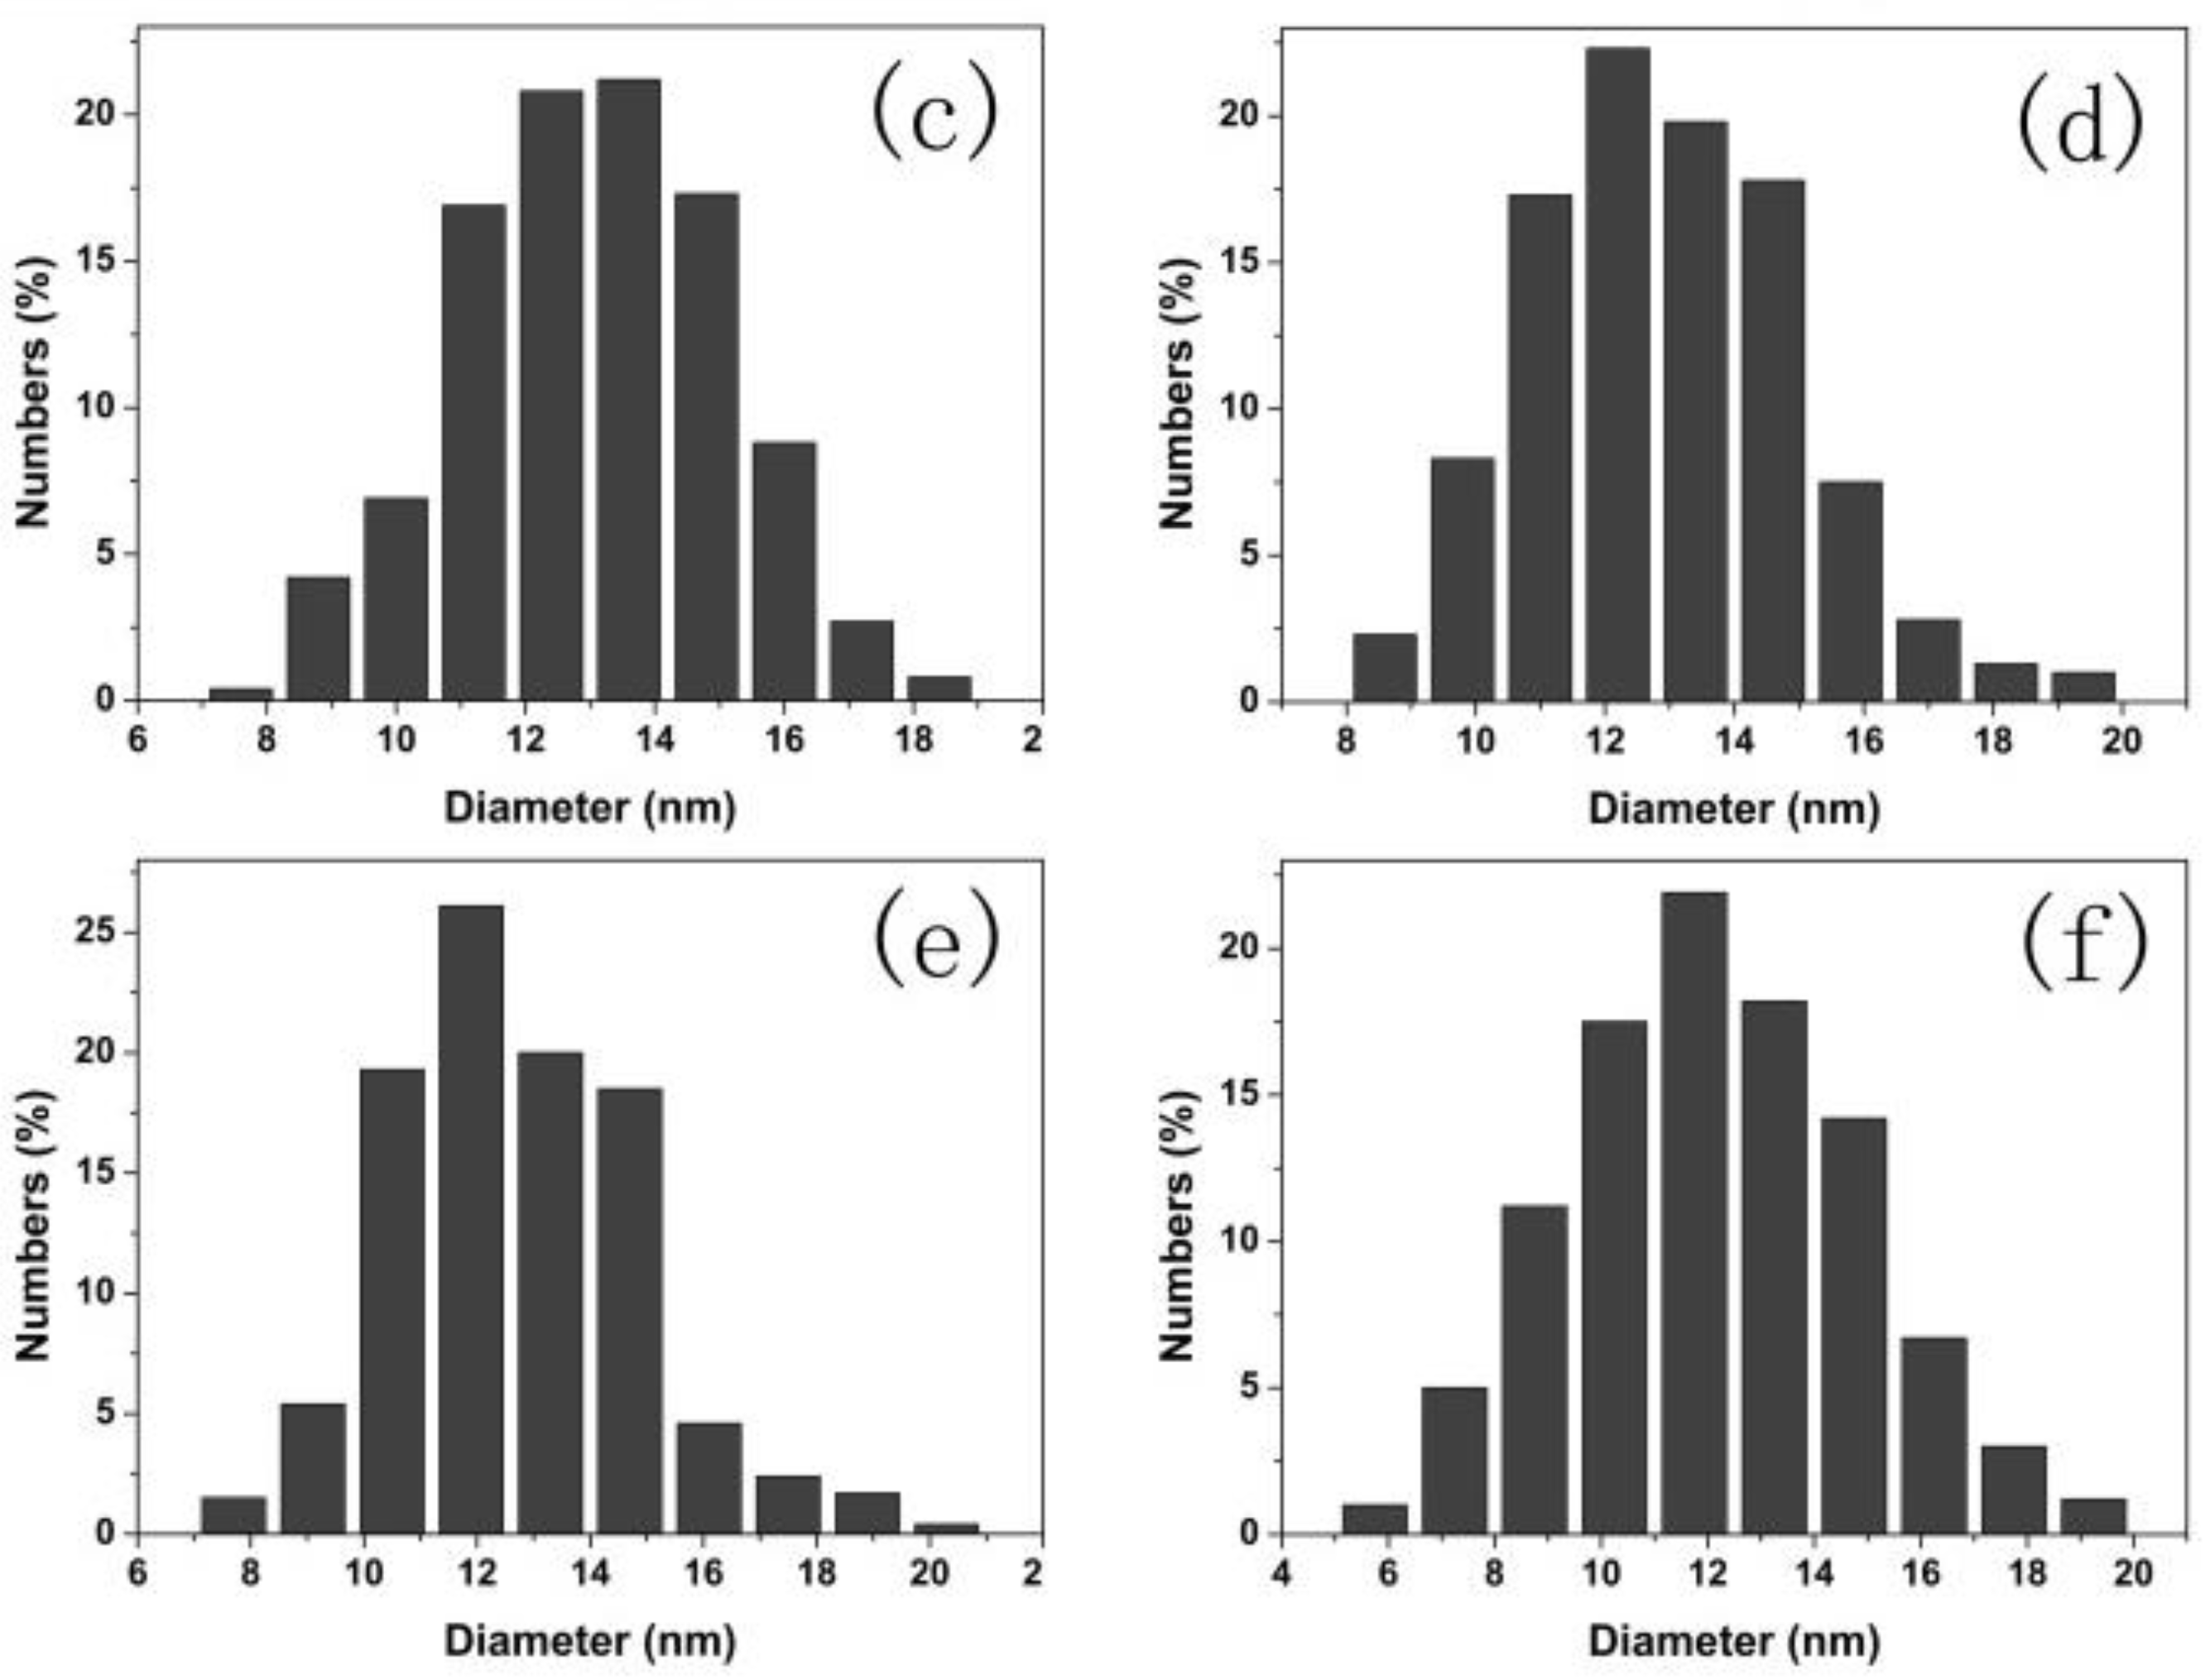
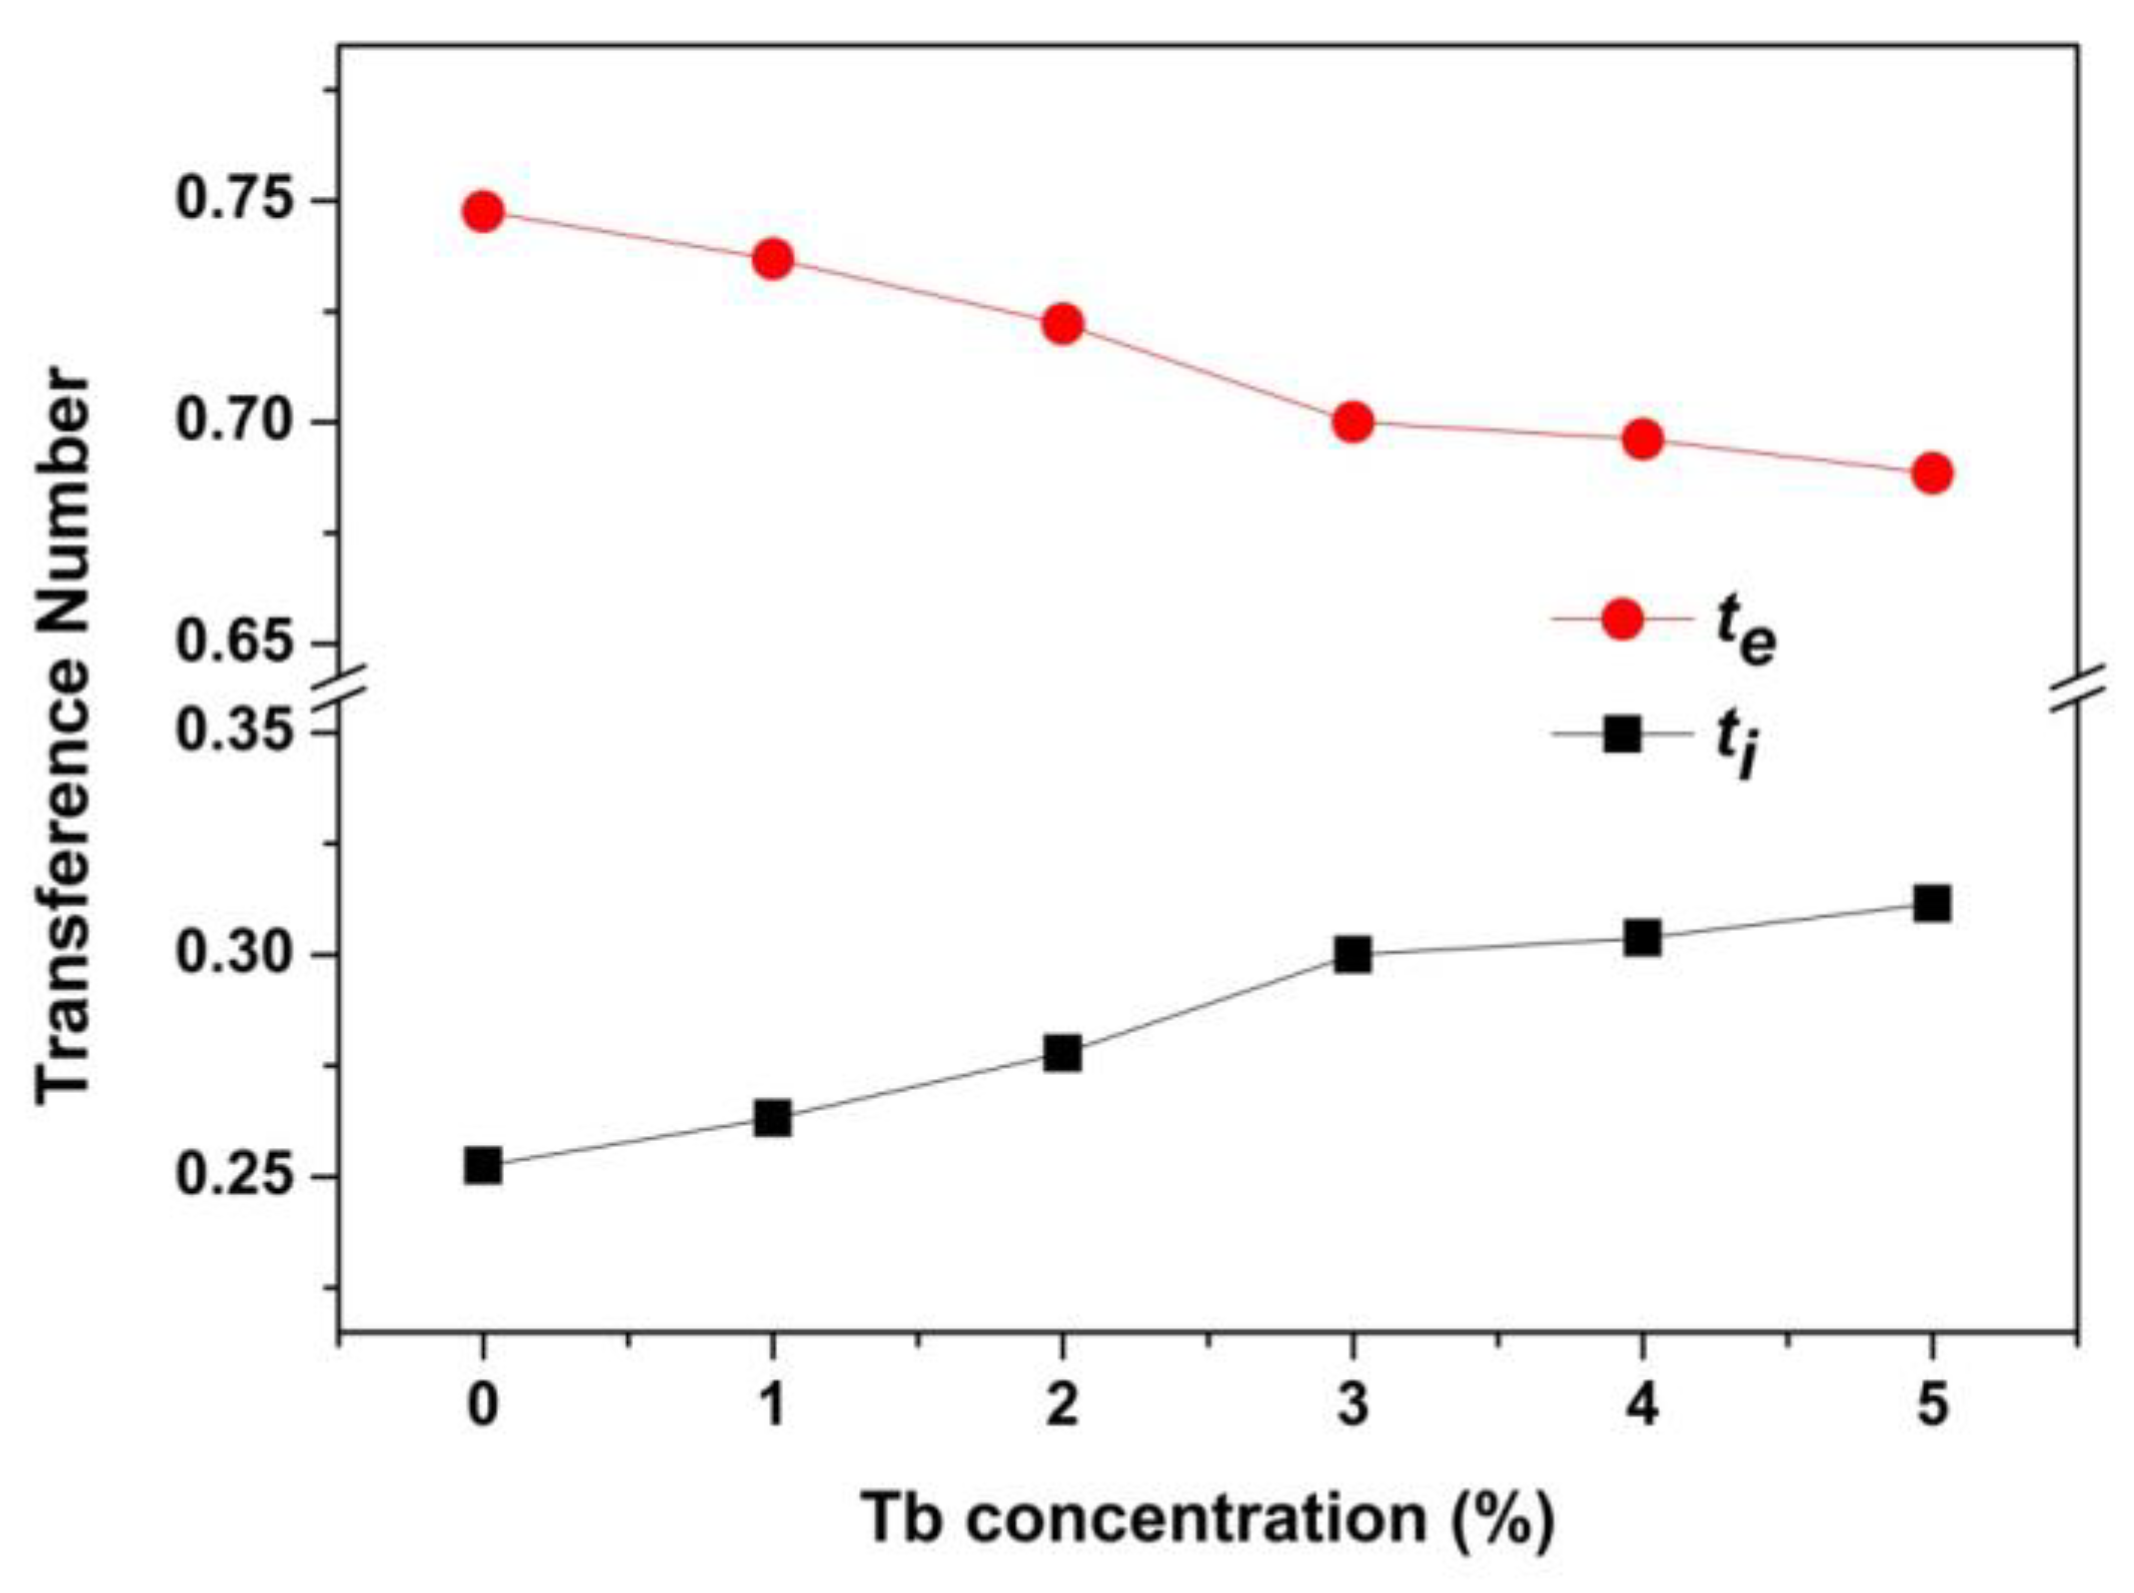
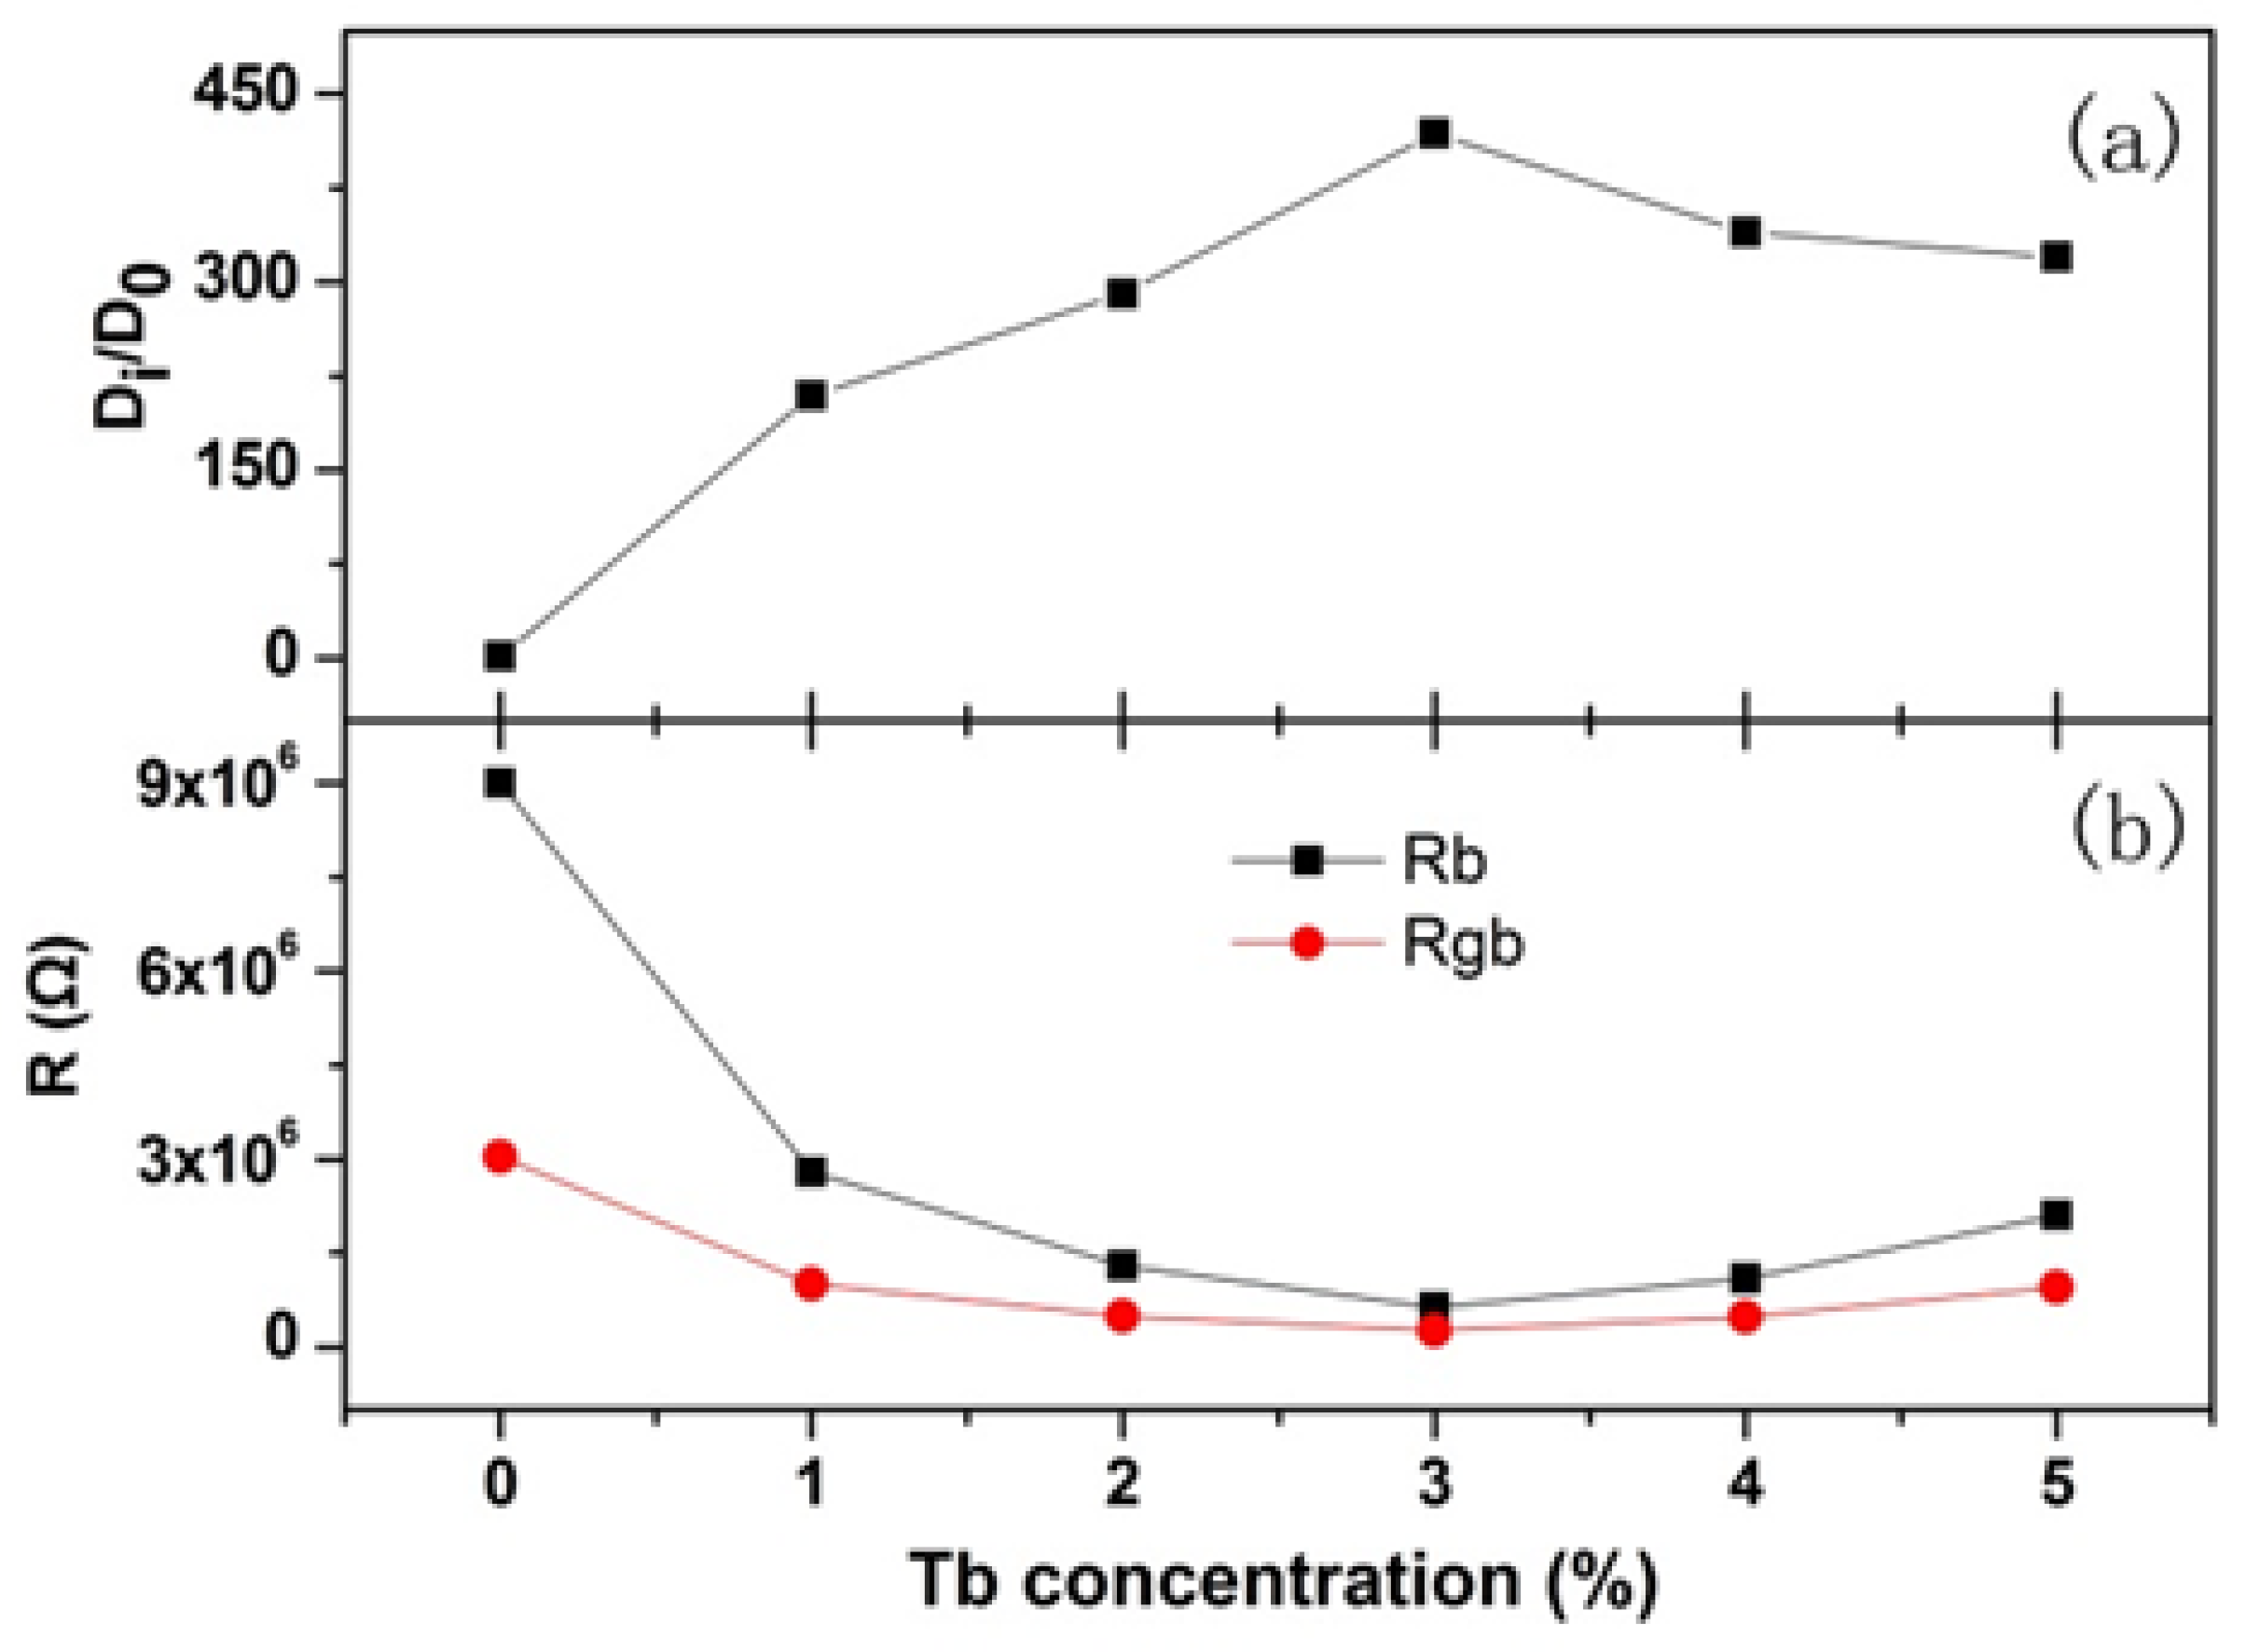
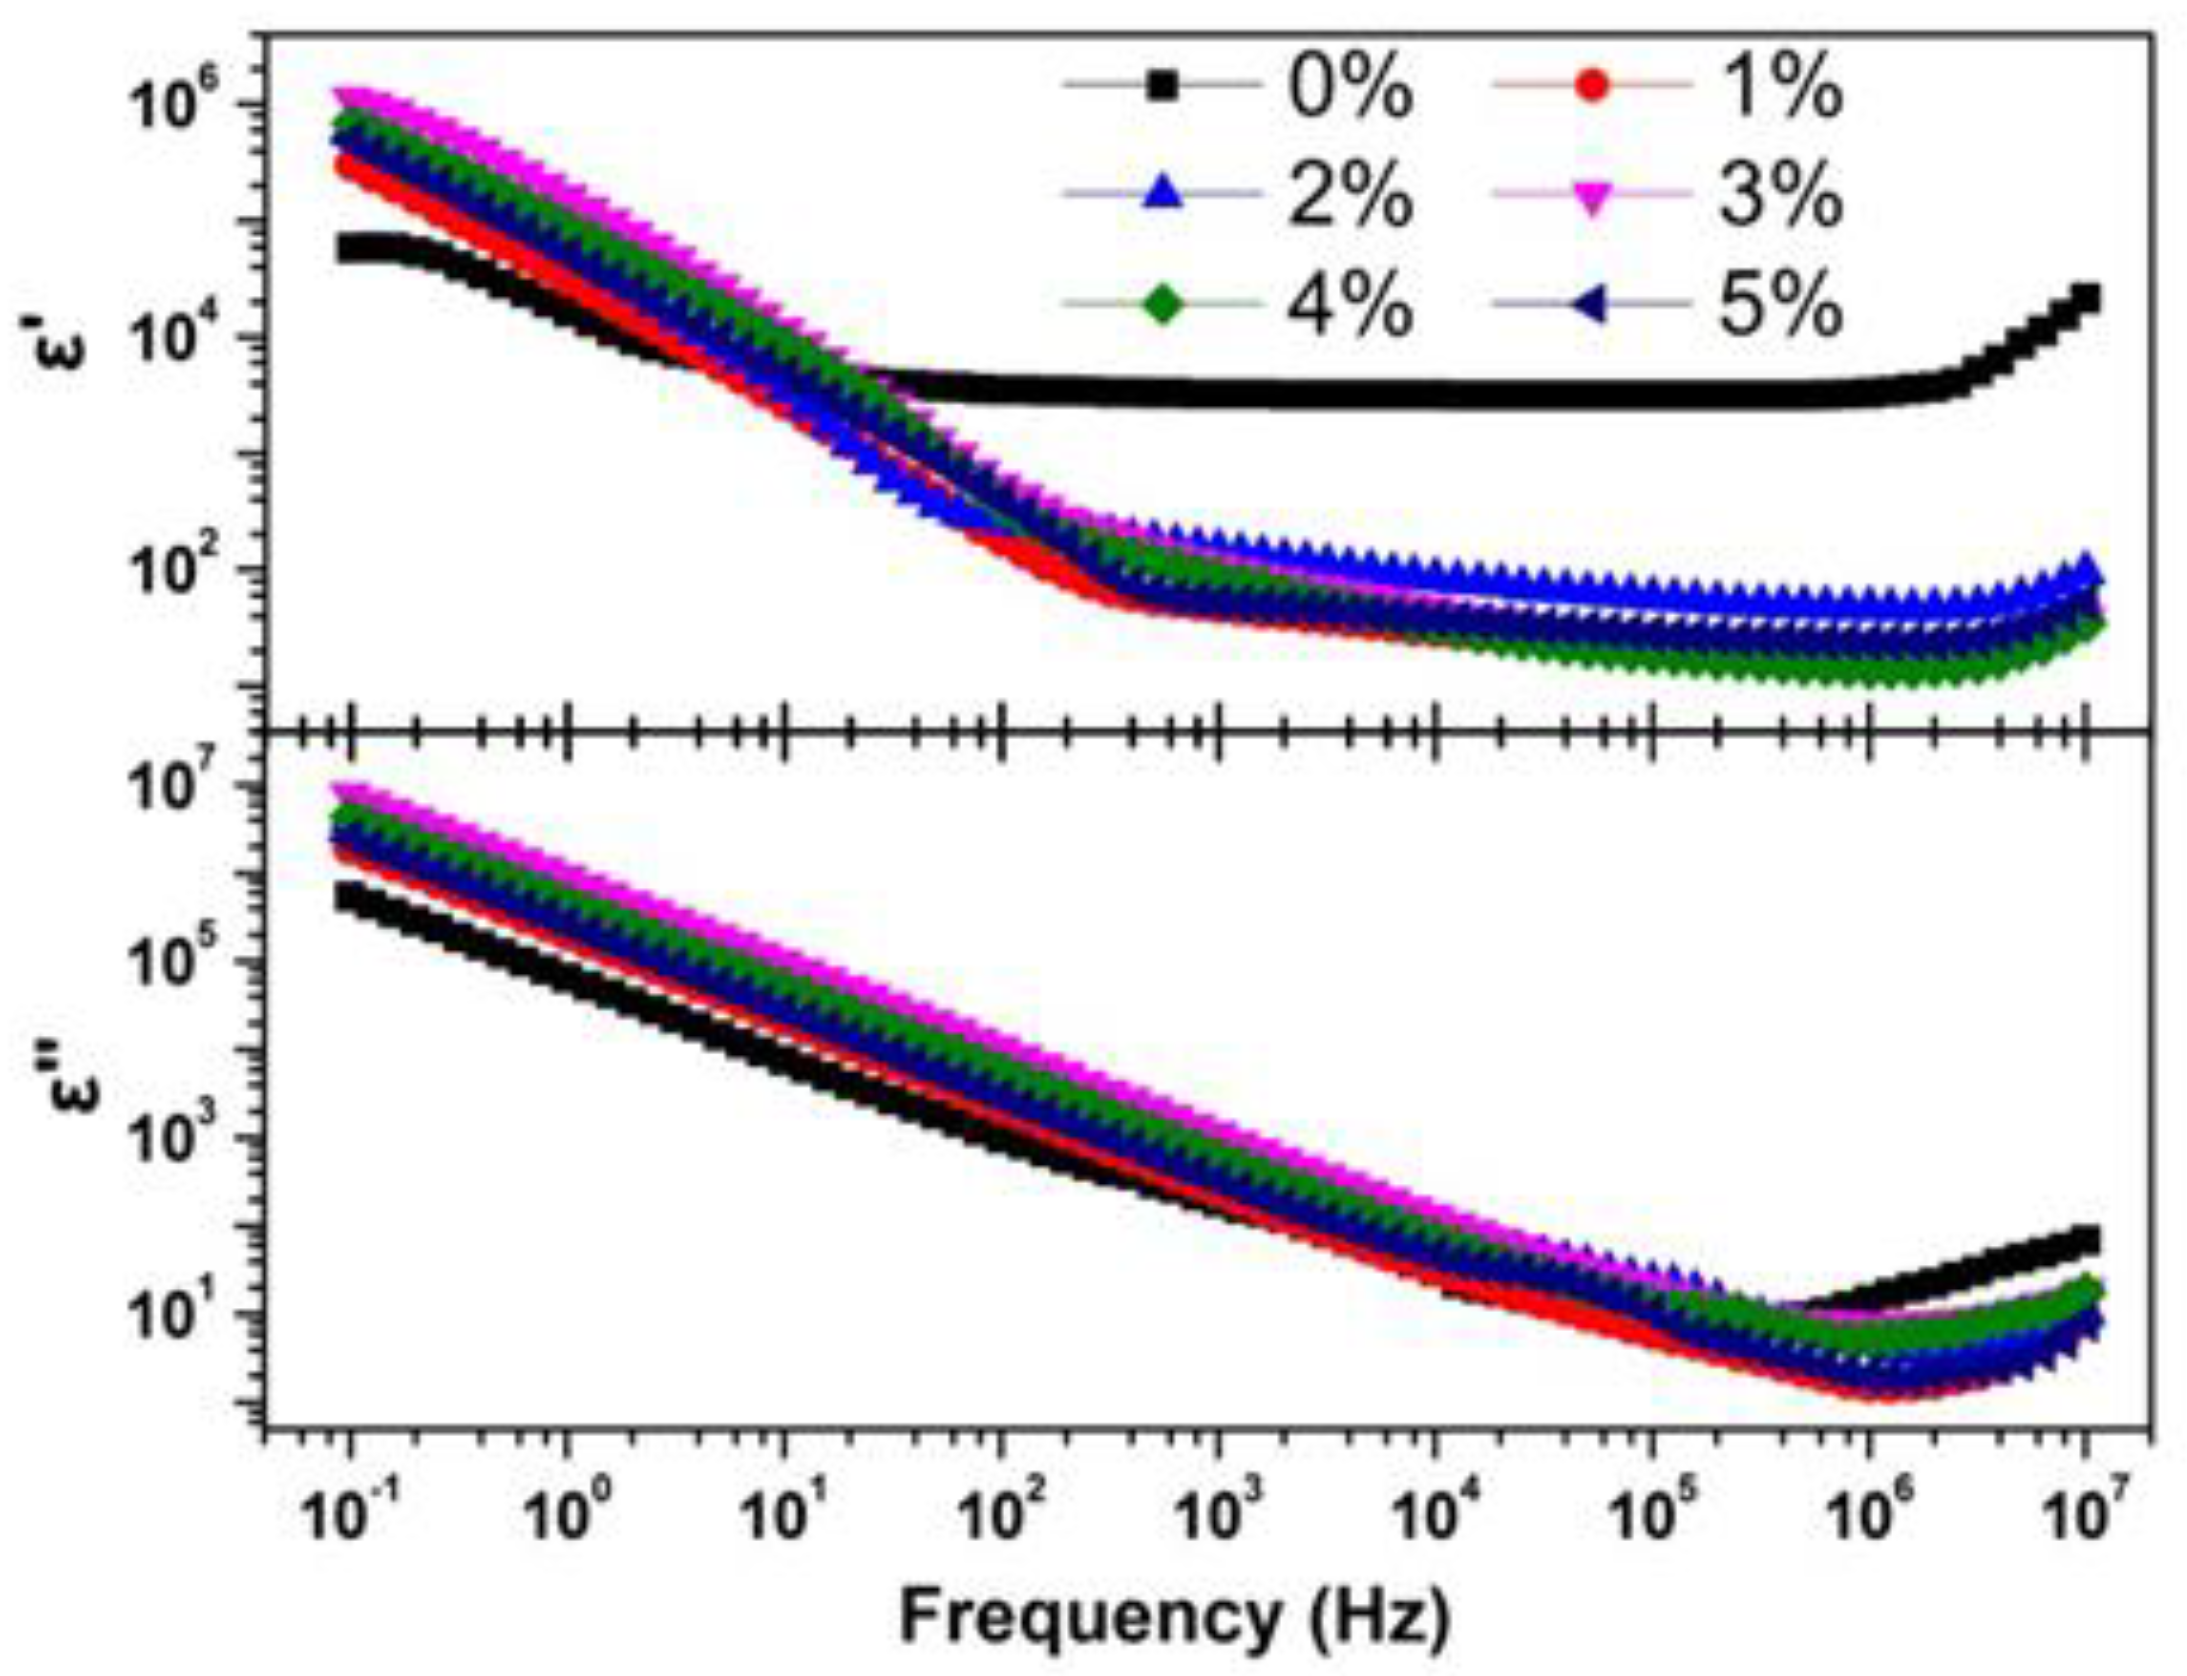
3. Results and Discussion

Figure 1 shows the XRD patterns of the Tb-doped CaF2 nanoparticles. The peaks of all the samples matched well with the standard cubic CaF2 phase (JCPDS Card No. 35-0816), and no impurity phase was found in the spectra. Therefore, the crystal structure remained unchanged after doping. Figure 2, Figure 3 and Figure 4 shows the TEM image, size distribution histogram, and energy dispersive spectrometer (EDS) of the CaF2 nanoparticles with various Tb concentrations. We observed that all samples were square and the mean dimensions were all about 12 ± 3 nm. The presence of Tb in the EDS spectrums of Tb-doped CaF2 nanoparticles indicates that Tb was successfully doped into the samples. The impedance spectroscopy of CaF2 nanocrystals with various Tb concentrations is shown in Figure 5.
To quantify the effect of Tb doping on the electrical transport properties of CaF2 nanocrystals, an equivalent circuit was used to fit the impedance results. The alternative representation Z′~ω−1/2 was used to study the F ion transport property and the result is presented in Figure 6.
In the low frequency region, the Z′ and ω−1/2 were linear, indicating the existence of F ion diffusion at low frequency. Thus, a Warburg element was used to depict the F ion conduction, which was added to the equivalent circuit diagram as presented in Figure 7. The fitted spectra agreed well with the experiment results (Figure 5), indicating that electron and ion conduction coexisted in the sample transport process.
Considering the charge carriers include both ions and electrons, the transference number was used to describe the contribution of the ions and electrons to the transportation process [27]. The F ion transference number was defined as ti and electron as te, so ti and te can be expressed as:
t i = ( R 2 R 1 ) / R 2 ,
t e = R 1 / R 2 ,
where R1 and R2 are the X-axis intercepts of the spectroscopy (Figure 5c). The ti and te of CaF2 nanocrystals with various Tb concentrations are presented in Figure 8. In all samples, the electron transport dominated, and the F ion transference number increased with increasing Tb concentration.
The Warburg coefficient (σ) can be obtained by the following equation [28]:
Z = Z 0 + σ ω 1 / 2 ,
where Z 0 is a constant and ω is the frequency. By performing a linear fit on the Z′~ω−1/2 scatterplot (Figure 6), the Warburg coefficient of CaF2 nanocrystals with different Tb concentrations was obtained. The ion diffusion coefficient can be expressed as:
D i = 0.5 ( R T A F 2 σ C ) 2 ,
where R is the ideal gas constant, T is temperature, F is the Faraday constant, and C is the molar concentration of F ions. The F ion diffusion coefficient for un-doped CaF2 nanocrystals was set as D0, and the Di/D0 of various Tb concentrations was obtained, as shown in Figure 9a. Through fitting the impedance spectra by the equivalent circuit, the grain and grain boundary resistances were obtained as shown in Figure 9b.
When the Tb concentration was less than 3%, the F ion diffusion coefficient increased with increasing Tb concentration; when the Tb concentration was greater than 3%, the F ion diffusion coefficient decreased. The grain and grain boundary resistances decreased with increasing Tb concentration until 3%, and then increased. In all samples, the grain resistance dominated in the total resistance, indicating that the defects in the grain region considerably contribute to the electron transportation process.
The changing of the transport properties with the replacement of Ca2+ by Tb3+ was analysed from two aspects: (1) the Tb3+ ionic radius being smaller than the Ca2+ ionic radius, which leads to the increasing mobility of the charge carriers [29]; and (2) due to the different valence, the replacement of Ca2+ by Tb3+ results in the deformation of the lattice and an increase in the deformation potential scattering, which decreases the mobility of the charge carriers. When the Tb concentration was less than 3%, the effect of ionic radius variation dominated, facilitating both F ion diffusion and electron transportation. However, when the Tb concentration was greater than 3%, the increasing deformation potential scattering was dominant, impeding F ion diffusion and electron transportation.
To comprehensively understand the transport properties of Tb-doped CaF2 nanoparticles, the dielectric properties were further studied. The complex permittivity (ε′, ε″) with frequency (f) of CaF2 nanocrystals under different Tb concentrations are shown in Figure 10.
The ε′ decreased linearly with increasing frequency in the low frequency region, then remained almost unchanged in the middle frequency region, finally increasing in the high frequency region. The ε″ decreased linearly with increasing frequency and then increased in the high frequency region. The presence of strong low-frequency dispersion in the permittivity implies that the electron and ion are hopping in the transport process [30]. At low frequencies, the ε′ and ε″ of Tb-doped samples were greater than of the un-doped sample, indicating Tb-doping facilitates electron and ion hopping in CaF2 nanocrystals. The substitution of Ca2+ by Tb3+ implies the creation of vacancy. Once a vacancy is created, further atom motion is relatively easy, so a neighboring atom hops into the vacancy, which is easily translated to another site, and finally facilitates charge carriers hopping and increases permittivity.

4. Conclusions

CaF2 nanoparticles with various Tb doping concentrations were characterized by XRD, TEM, and AC impedance. In all samples, the dominant charge carriers were electrons, and the F ion transference number increased with increasing Tb concentration. The defects in the grain region considerably contributed to the electron transportation process. When the Tb concentration was less than 3%, the ionic radius variation effect dominated and facilitated F ion diffusion and electron transportation. When the Tb concentration was greater than 3%, the increasing deformation potential scattering dominated, impeding F ion diffusion and electron transportation. The substitution of Ca2+ by Tb3+ enabled electron and ion hopping in CaF2 nanocrystals, and finally led to the increasing permittivity. We concluded that rare-earth-doping treatment is an effective method for modulating the electric conductive and dielectric performance of CaF2 nanoparticles. We expect that the design of CaF2-based optical and optoelectronic devices could benefit from our investigation.

Author Contributions

X.C. conceived and designed the experiments; J.W. and Y.C. fabricated and characterized the sample; X.Z. and J.Z. collaborated in XRD, TEM measurements; T.H., X.L., J.Y. and C.G. analyzed the data. All authors discussed the experiment results and contributed to writing the paper.

Funding

This research was funded by [the National Natural Science Foundation of China] grant numbers [11674404, 11704151 and 11404137], [the Program for the development of Science and Technology of Jilin province] grant number [20180101206JC], [Thirteenth Five-Year Program for Science and Technology of Education Department of Jilin Province, China] grant numbers [JJKH20180772KJ and JJKH20180769KJ] and [Open Project of State Key Laboratory of Superhard Materials (Jilin University)] grant number [201710].

Conflicts of Interest

The authors declare no conflict of interest.

References

  1. Matsuura, D. Red, green, and blue upconversion luminescence of trivalent-rare-earth ion-doped Y2O3 nanocrystals. Appl. Phys. Lett. 2001, 81, 4526–4528. [Google Scholar] [CrossRef]
  2. Wei, Z.G.; Sun, L.D.; Liao, C.S.; Yan, C.H. Fluorescence intensity and color purity improvement in nanosized YBO3:Eu. Appl. Phys. Lett. 2002, 80, 1447–1449. [Google Scholar] [CrossRef]
  3. Barber, D.B.; Pollock, C.R.; Beecroft, L.L.; Ober, C.K. Amplification by optical composites. Opt. Lett. 1997, 22, 1247–1249. [Google Scholar] [CrossRef] [PubMed]
  4. Lucca, A.; Jacquemet, M.; Druon, F.; Balembois, F.; Georges, P.; Camy, P.; Doualan, J.L.; Moncorgé, R. High-power tunable diode-pumped Yb3+:CaF2 laser. Opt. Lett. 2004, 29, 1879–1881. [Google Scholar] [CrossRef] [PubMed]
  5. Kawano, K.; Arai, K.; Yamada, H.; Hashimoto, N.; Nakata, R. Application of rare-earth complexes for photovoltaic precursors. Sol. Energ. Mat. Sol. C 1997, 48, 35–41. [Google Scholar] [CrossRef]
  6. Rothschild, M.; Bloomstein, T.M.; Curtin, J.E.; Downs, D.K.; Fedynyshyn, T.H.; Hardy, D.E.; Kunz, R.R.; Liberman, V.; Sedlacek, J.H.C.; Uttaro, R.S. 157 nm: Deepest deep-ultraviolet yet. J. Vac. Sci. Technol. B 1999, 17, 3262–3266. [Google Scholar] [CrossRef]
  7. Fujihara, S.; Kadota, Y.; Kimura, T. Role of organic additives in the sol-gel synthesis of porous CaF2 anti-reflective coatings. J. Sol–Gel Sci. Technol 2002, 24, 147–154. [Google Scholar] [CrossRef]
  8. McKeever, S.W.S.; Brown, M.D.; Abbundi, R.J.; Chan, H.; Mathur, V.K. Characterization of optically active sites in CaF2:Ce, Mn from optical spectra. J. Appl. Phys. 1986, 60, 2505–2510. [Google Scholar] [CrossRef]
  9. Fukuda, Y. Thermoluminescence in sintered CaF2:Tb. J. Radiat. Res. 2002, 43, S67–S69. [Google Scholar] [CrossRef] [PubMed]
  10. Pote, S.S.; Joshi, C.P.; Moharil, S.V.; Muthal, P.L.; Dhopte, S.M. Luminescence of Ce3+ in Ca0.65La0.35F2.35 host. J. Lumin. 2010, 130, 666–668. [Google Scholar] [CrossRef]
  11. Pote, S.S.; Joshi, C.P.; Moharil, S.V.; Muthal, P.L.; Dhopte, S.M. Luminescence in Ca1−xYxF2+x. Physica B 2011, 406, 1308–1311. [Google Scholar] [CrossRef]
  12. Bensalah, A.; Mortier, M.; Patriarche, G.; Gredin, P.; Vivien, D. Synthesis and optical characterizations of undoped and rare-earth-doped CaF2 nanoparticles. J. Solid State Chem. 2006, 179, 2636–2644. [Google Scholar] [CrossRef]
  13. Hong, B.C.; Kawano, K. Syntheses of euactivated alkaline earth fluoride MF2(M = Ca, Sr) nanoparticles. Jpn. J. Appl. Phys. 2007, 46, 6319–6323. [Google Scholar] [CrossRef]
  14. Song, L.; Xue, L. Efficient fluorescence of dissolved CaF2:Tb3+ and CaF2:Ce3+, Tb3+ nanoparticles through surface coating sensitization. Appl. Surf. Sci. 2012, 258, 3497–3501. [Google Scholar] [CrossRef]
  15. Wang, G.; Peng, Q.; Li, Y. Upconversion luminescence of monodisperse CaF2:Yb3+/Er3+ nanocrystals. J. Am. Chem. Soc. 2009, 131, 14200–14201. [Google Scholar] [CrossRef] [PubMed]
  16. Zhi, G.L.; Song, J.H.; Mei, B.C.; Zhou, W.B. Synthesis and characterization of Er3+ doped CaF2 nanoparticles. J. Alloy Compd. 2011, 509, 9133–9137. [Google Scholar] [CrossRef]
  17. Zheleznov, D.S.; Starobor, A.V.; Palashov, O.V. Characterization of the terbium-doped calcium fluoride single crystal. Optical Materials 2015, 46, 526–529. [Google Scholar] [CrossRef]
  18. Guo, C.; Gao, F.; Liang, L.; Choi, B.C.; Jeong, J.H. Synthesis, characterization and luminescent properties of novel red emitting phosphor Li3Ba2Ln3(MoO4)8:Eu3+(Ln = La, Gd and Y) for white light-emitting diodes. J. Alloy Compd. 2009, 479, 607–612. [Google Scholar] [CrossRef]
  19. Zhou, L.; Wei, J.; Wu, J.; Gong, F.; Yi, L.; Huang, J. Potential red-emitting phosphor for white LED solid-state lighting. J. Alloy Compd. 2009, 476, 390–392. [Google Scholar] [CrossRef]
  20. Lin, Z.; Liang, X.; Ou, Y.; Fan, C.; Yuan, S.; Zeng, H.; Chen, G. Full color photoluminescence of Tb3+/Sm3+ codoped oxyfluoride aluminosilicate glasses and glass ceramics for white light emitting diodes. J. Alloy Compd. 2010, 496, L33–L37. [Google Scholar] [CrossRef]
  21. Liang, X.; Yang, Y.; Zhu, C.; Yuan, S.; Chen, G.; Pring, A.; Xia, F. Luminescence properties of Tb3+–Sm3+ codoped glasses for white light emitting diodes. Appl. Phys. Lett. 2007, 91, 091104. [Google Scholar] [CrossRef]
  22. Zhao, F.; Gao, S. Pyrolysis of single molecular precursor for monodisperse lanthanide sulfide/oxysulfide nanocrystals. J. Mater. Chem. 2008, 18, 949–953. [Google Scholar] [CrossRef]
  23. Chen, M.; Kim, J.; Liu, J.P.; Fan, H.; Sun, S. Synthesis of FePt nanocubes and their oriented self-assembly. J. Am. Chem. Soc. 2006, 128, 7132–7133. [Google Scholar] [CrossRef] [PubMed]
  24. Wang, J.S.; Hao, J.; Wang, Q.S.; Jin, Y.X.; Li, F.F.; Liu, B.; Li, Q.J.; Liu, B.B.; Cui, Q.L. Pressure induced structural transition in CaF2 nanocrystals. Phys. Status Solidi B 2011, 248, 1115–1118. [Google Scholar] [CrossRef]
  25. Hu, T.; Cui, X.; Wang, J.; Zhong, X.; Chen, Y.; Zhang, J.; Li, X.; Yang, J.; Gao, C. The electrical properties of Tb-doped CaF2 nanoparticles under high pressure. Crystals 2018, 8, 98. [Google Scholar] [CrossRef]
  26. Wang, J.; Yang, J.; Hu, T.; Chen, X.; Lang, J.; Wu, X.; Zhang, J.; Zhao, H.; Yang, J.; Cui, Q. Structural Phase Transition and Compressibility of CaF2 Nanocrystals under High Pressure. Crystals 2018, 8, 199. [Google Scholar] [CrossRef]
  27. Wang, Q.L.; Liu, C.L.; Gao, Y.; Ma, Y.Z.; Han, Y.H.; Gao, C.X. Mixed conduction and grain boundary effect in lithium niobate under high pressure. Appl. Phys. Lett. 2015, 106, 132902. [Google Scholar] [CrossRef]
  28. Ho, C.; Raistrick, I.D.; Huggins, R.A. Application of AC techniques to the study of lithium diffusion in tungsten trioxide thin films. J. Electrochem. Soc. 1980, 127, 343–350. [Google Scholar] [CrossRef]
  29. Ali, A.A. Optical properties of Sm3+-doped CaF2 bismuth borate glasses. J. Lumin. 2009, 129, 1314–1319. [Google Scholar] [CrossRef]
  30. Peláiz Barranco, A.; Calderón Piñar, F.; Pérez Martínezy, O.; De Los Santos Guerra, J.; González Carmenate, I. AC behaviour and conductive mechanisms of 2·5 mol% La2O3 doped PbZr0.53Ti0.47O3 ferroelectric ceramics. J. Eur. Ceram. Soc. 1999, 19, 2677–2683. [Google Scholar] [CrossRef]
Figure 1. X-ray diffraction (XRD) patterns of terbium (Tb)-doped CaF2 nanocrystals.
Nanomaterials 08 00532 g001
Figure 2. Transmission electron microscopy (TEM) image of the CaF2 nanoparticles with various Tb concentrations: (a) un-doped; (b) 1% Tb; (c) 2% Tb; (d) 3% Tb; (e) 4% Tb; and (f) 5% Tb.
Nanomaterials 08 00532 g002
Figure 3. Size distribution histogram of the CaF2 nanoparticles with various Tb concentrations: (a) un-doped; (b) 1% Tb; (c) 2% Tb; (d) 3% Tb; (e) 4% Tb; and (f) 5% Tb.
Nanomaterials 08 00532 g003aNanomaterials 08 00532 g003b
Figure 4. EDS spectrum of the CaF2 nanoparticles with various Tb concentrations: (a) un-doped; (b) 1% Tb; (c) 2% Tb; (d) 3% Tb; (e) 4% Tb; and (f) 5% Tb.
Nanomaterials 08 00532 g004
Figure 5. (a) The impedance spectroscopy of Tb-doped CaF2 nanocrystals; (b) The enlarged spectra with Tb concentrations ranging from 1% to 5%; (c) The spectroscopy with 3% Tb, where R1 and R2 are the X-axis intercepts of the spectroscopy.
Nanomaterials 08 00532 g005
Figure 6. Z′~ω−1/2 of Tb-doped CaF2 nanocrystals in the low frequency region.
Nanomaterials 08 00532 g006
Figure 7. The equivalent circuit used to fit the impedance results. Rb is grain resistance, Rgb is grain boundary resistance, Cb is grain capacitance, Cgb is grain boundary capacitance, and Wi is the Warburg impedance.
Nanomaterials 08 00532 g007
Figure 8. Tb concentration dependence of the ion transference number (ti) and the electron transference number (te).
Nanomaterials 08 00532 g008
Figure 9. Tb concentration dependence of the diffusion coefficient (a), grain and grain boundary resistance (b). D0 represents the diffusion coefficient of un-doped CaF2 nanocrystals.
Nanomaterials 08 00532 g009
Figure 10. The complex permittivity (ε′ and ε″) vs. the frequency of CaF2 nanocrystals (f) with various Tb concentrations.
Nanomaterials 08 00532 g010

