Cell Labeling for 19F MRI: New and Improved Approach to Perfluorocarbon Nanoemulsion Design


Abstract
:1. Introduction

2. Experimental Section
2.1. Materials
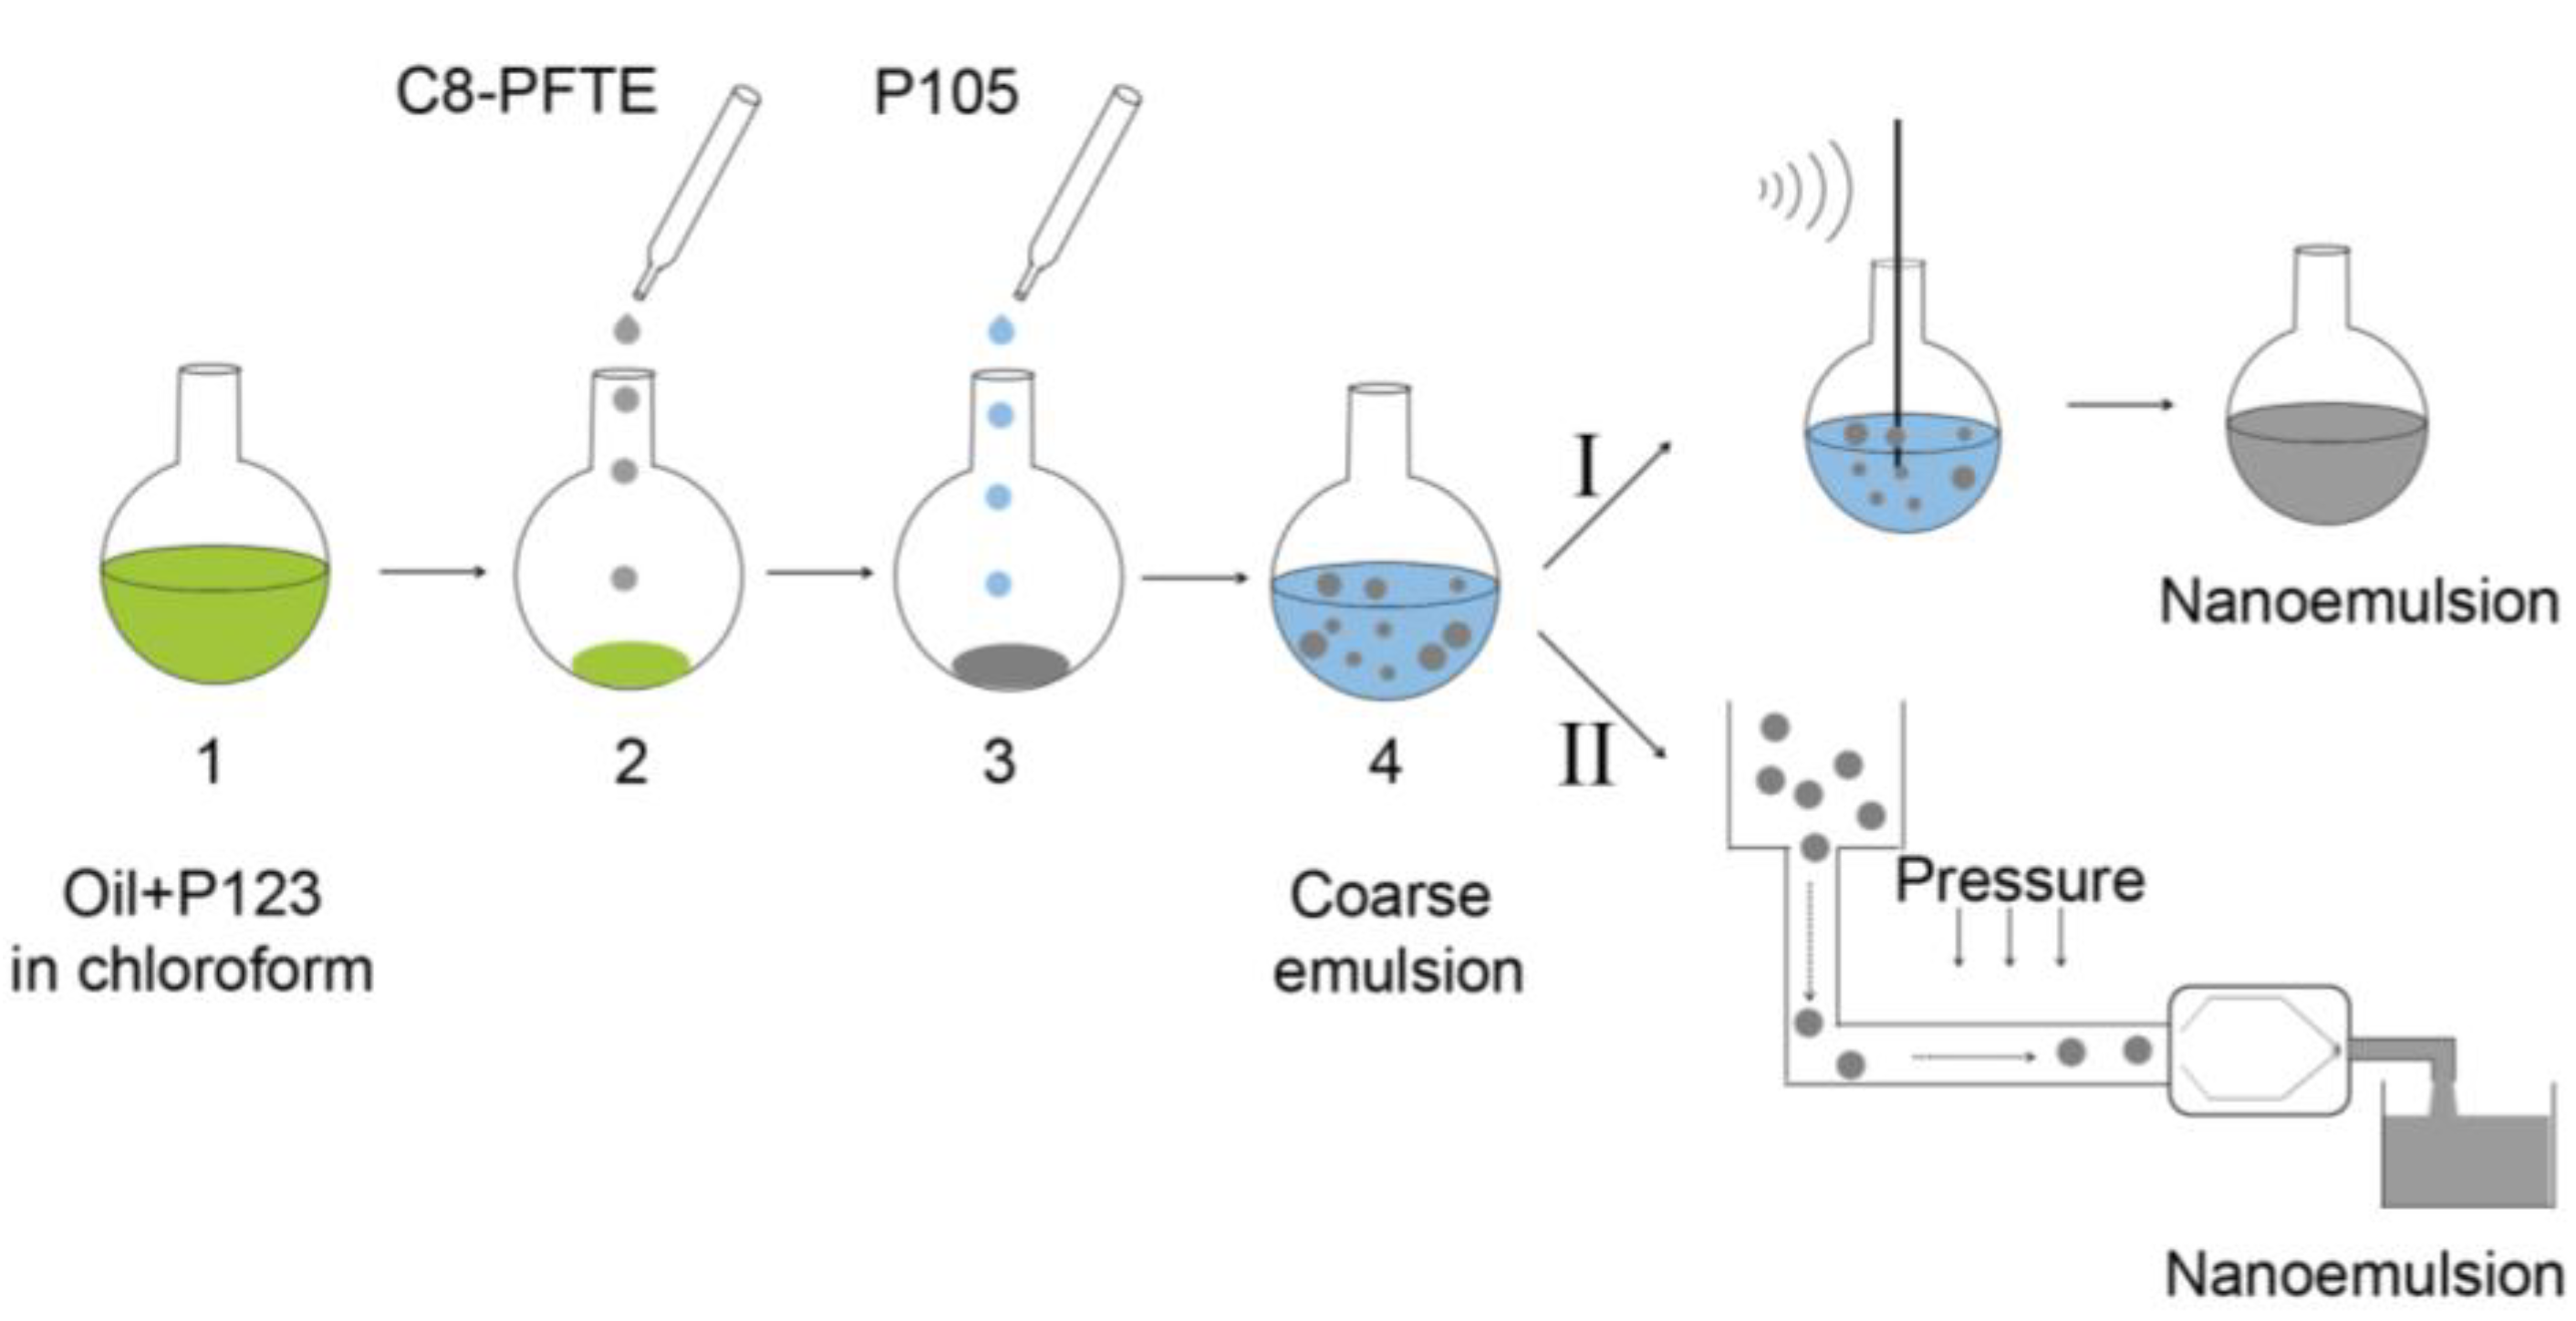
2.2. Nanoemulsion Preparation Using Probe Sonication Method
2.3. Nanoemulsion Preparation Using High Shear Microfluidization Method
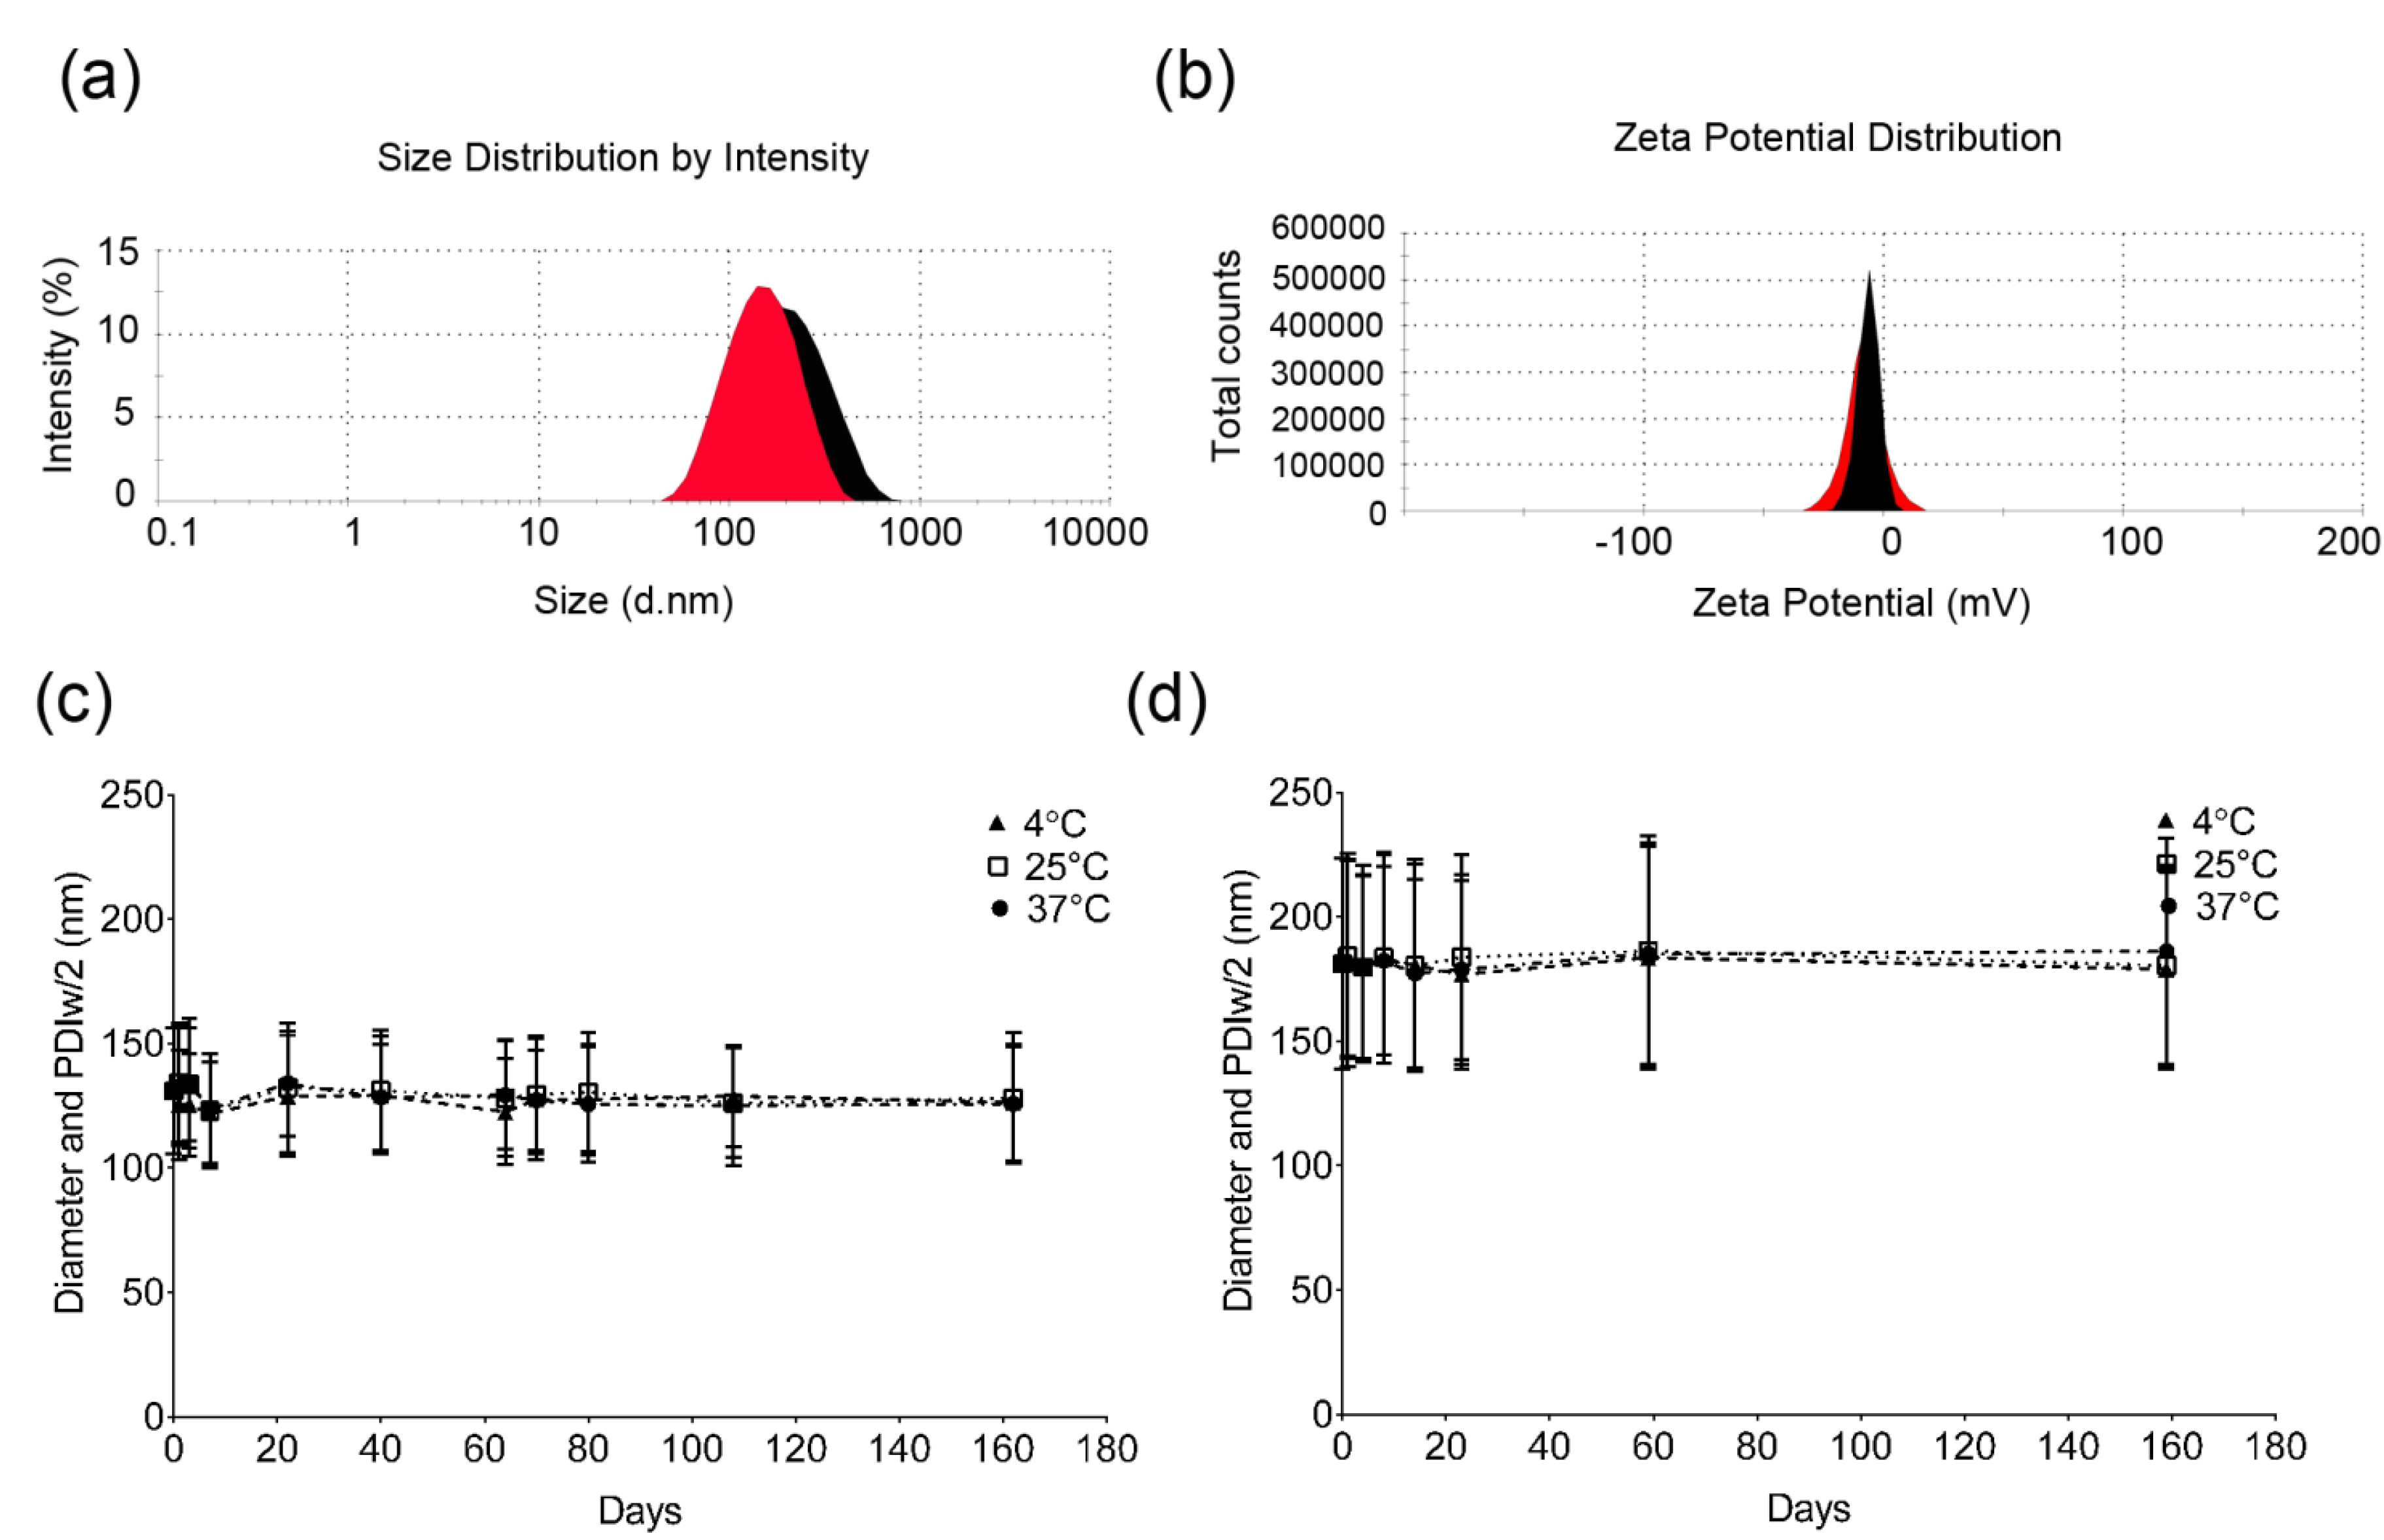
2.4. Droplet Size and Zeta Potential Measurements of Nanoemulsions
2.5. Physical Stability of Nanoemulsion M2 in Cell Culture Relevant Conditions
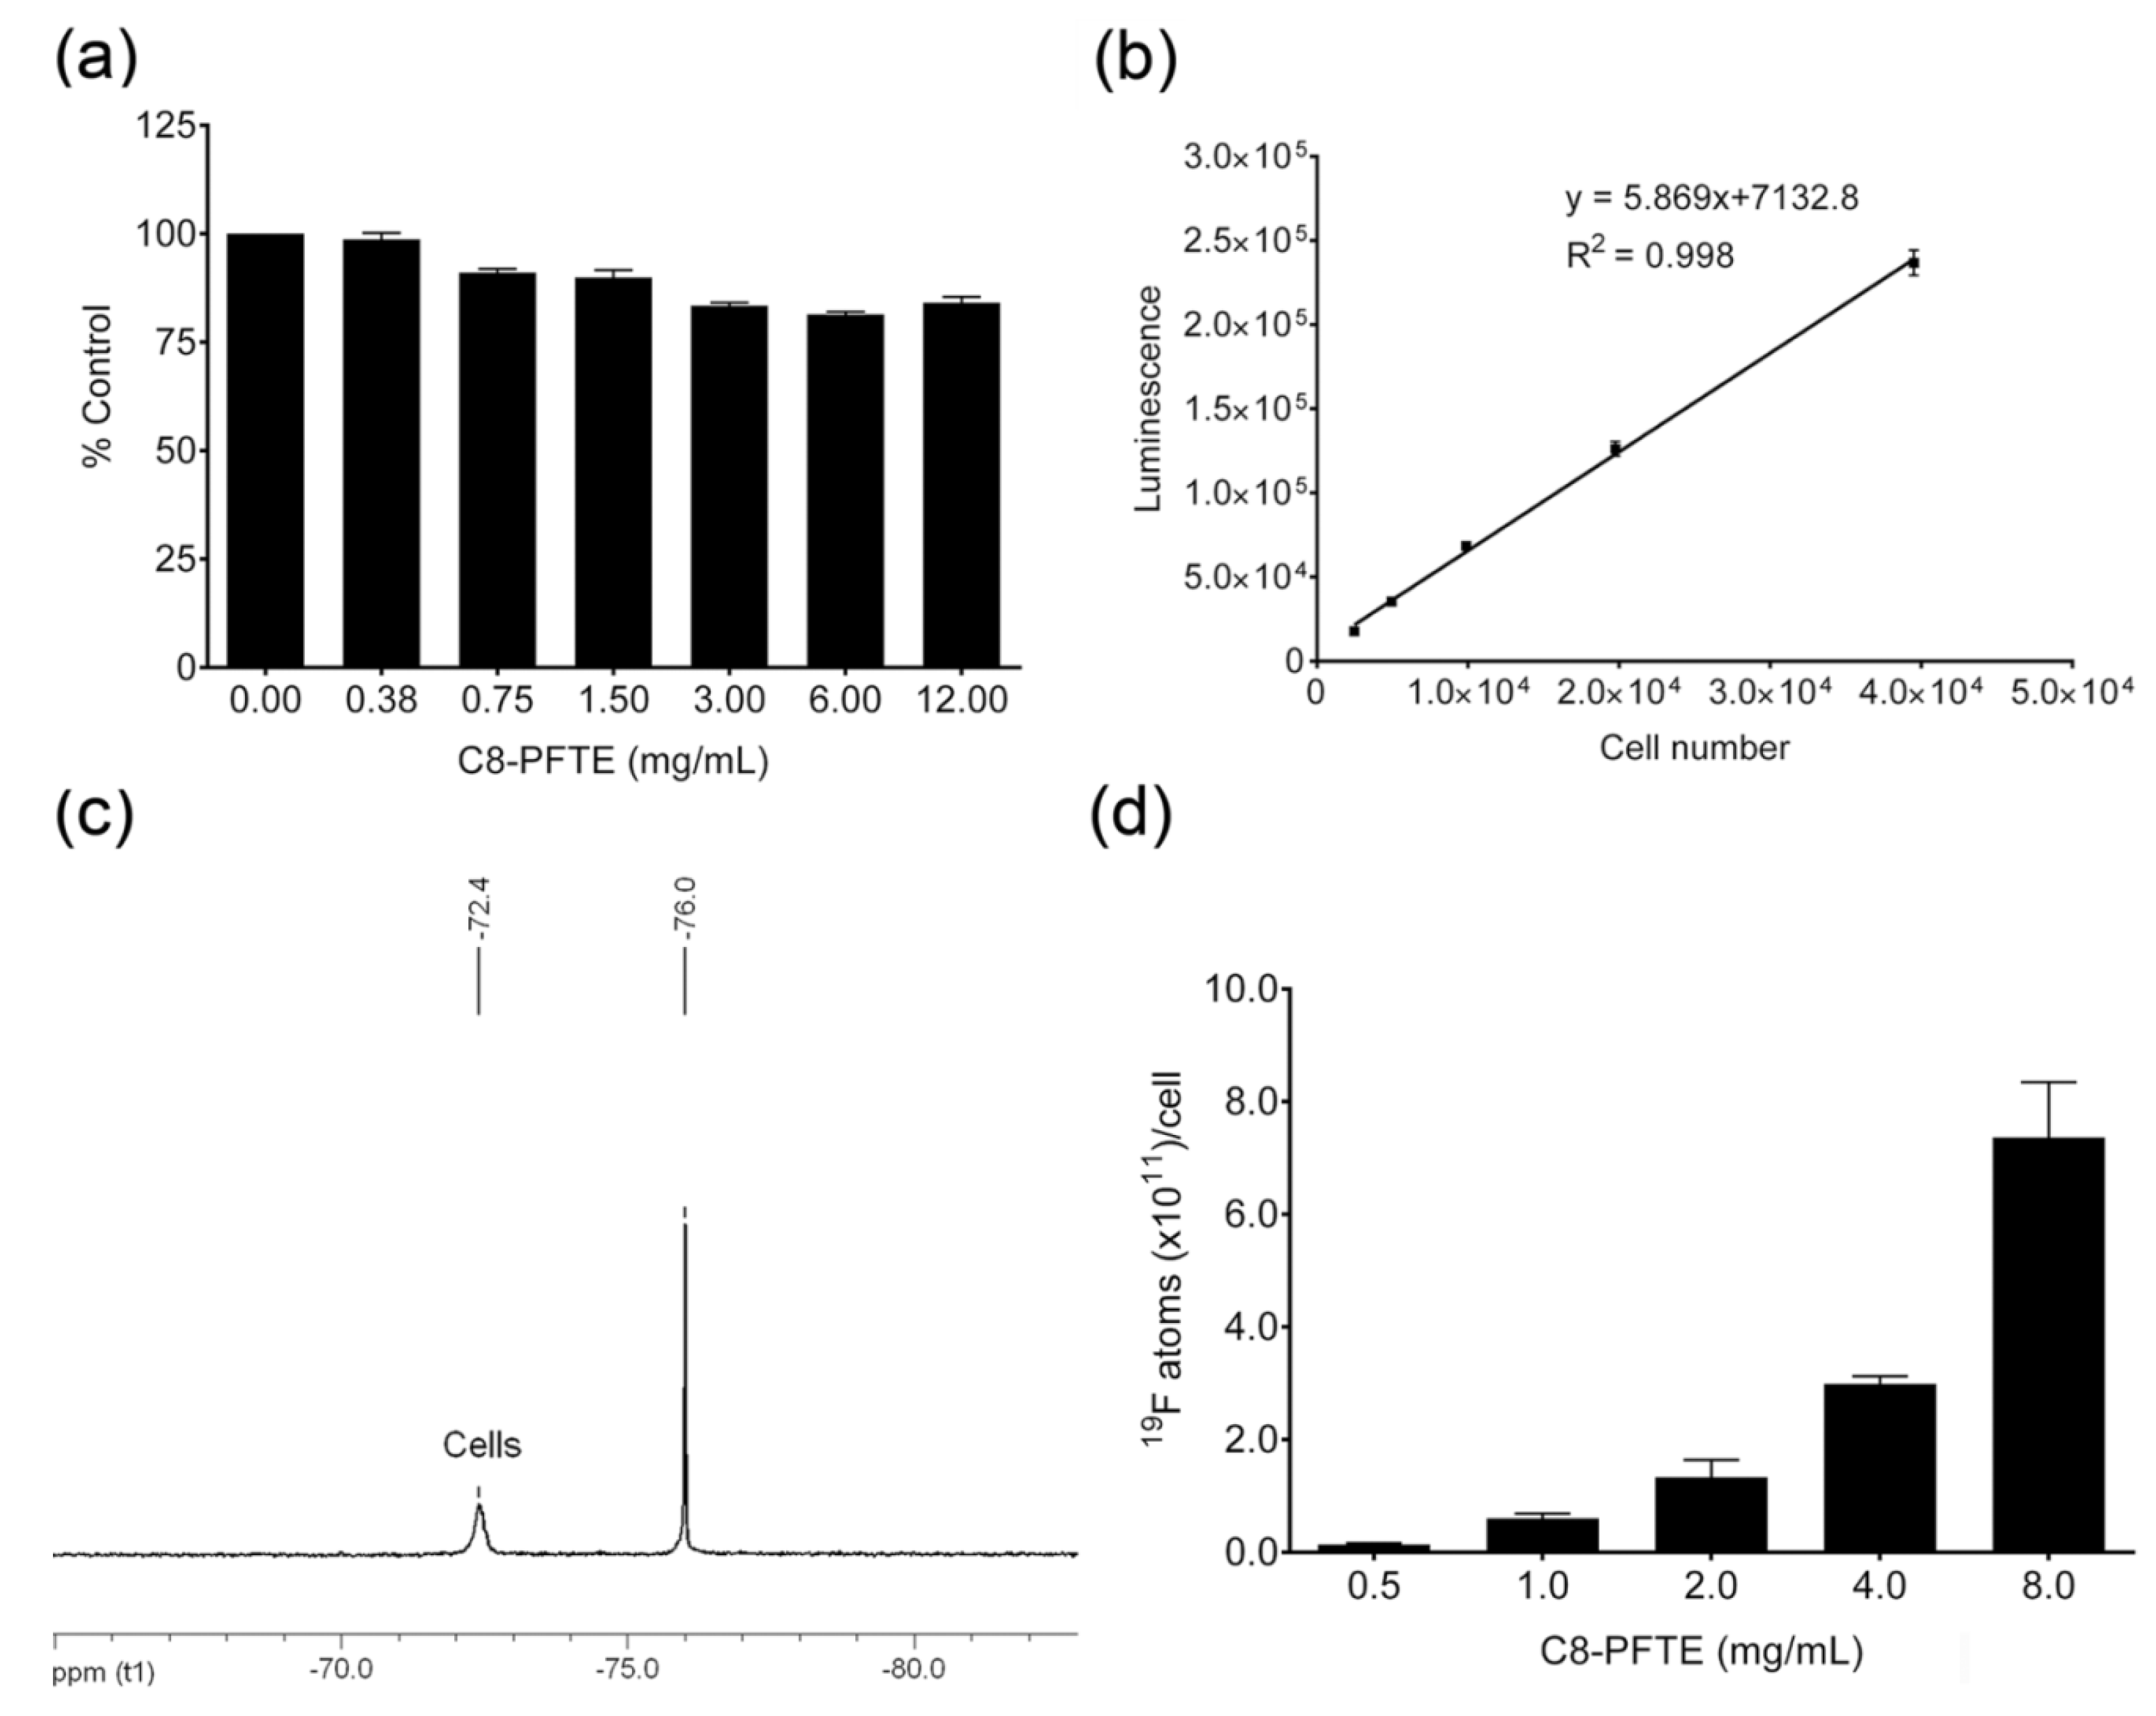
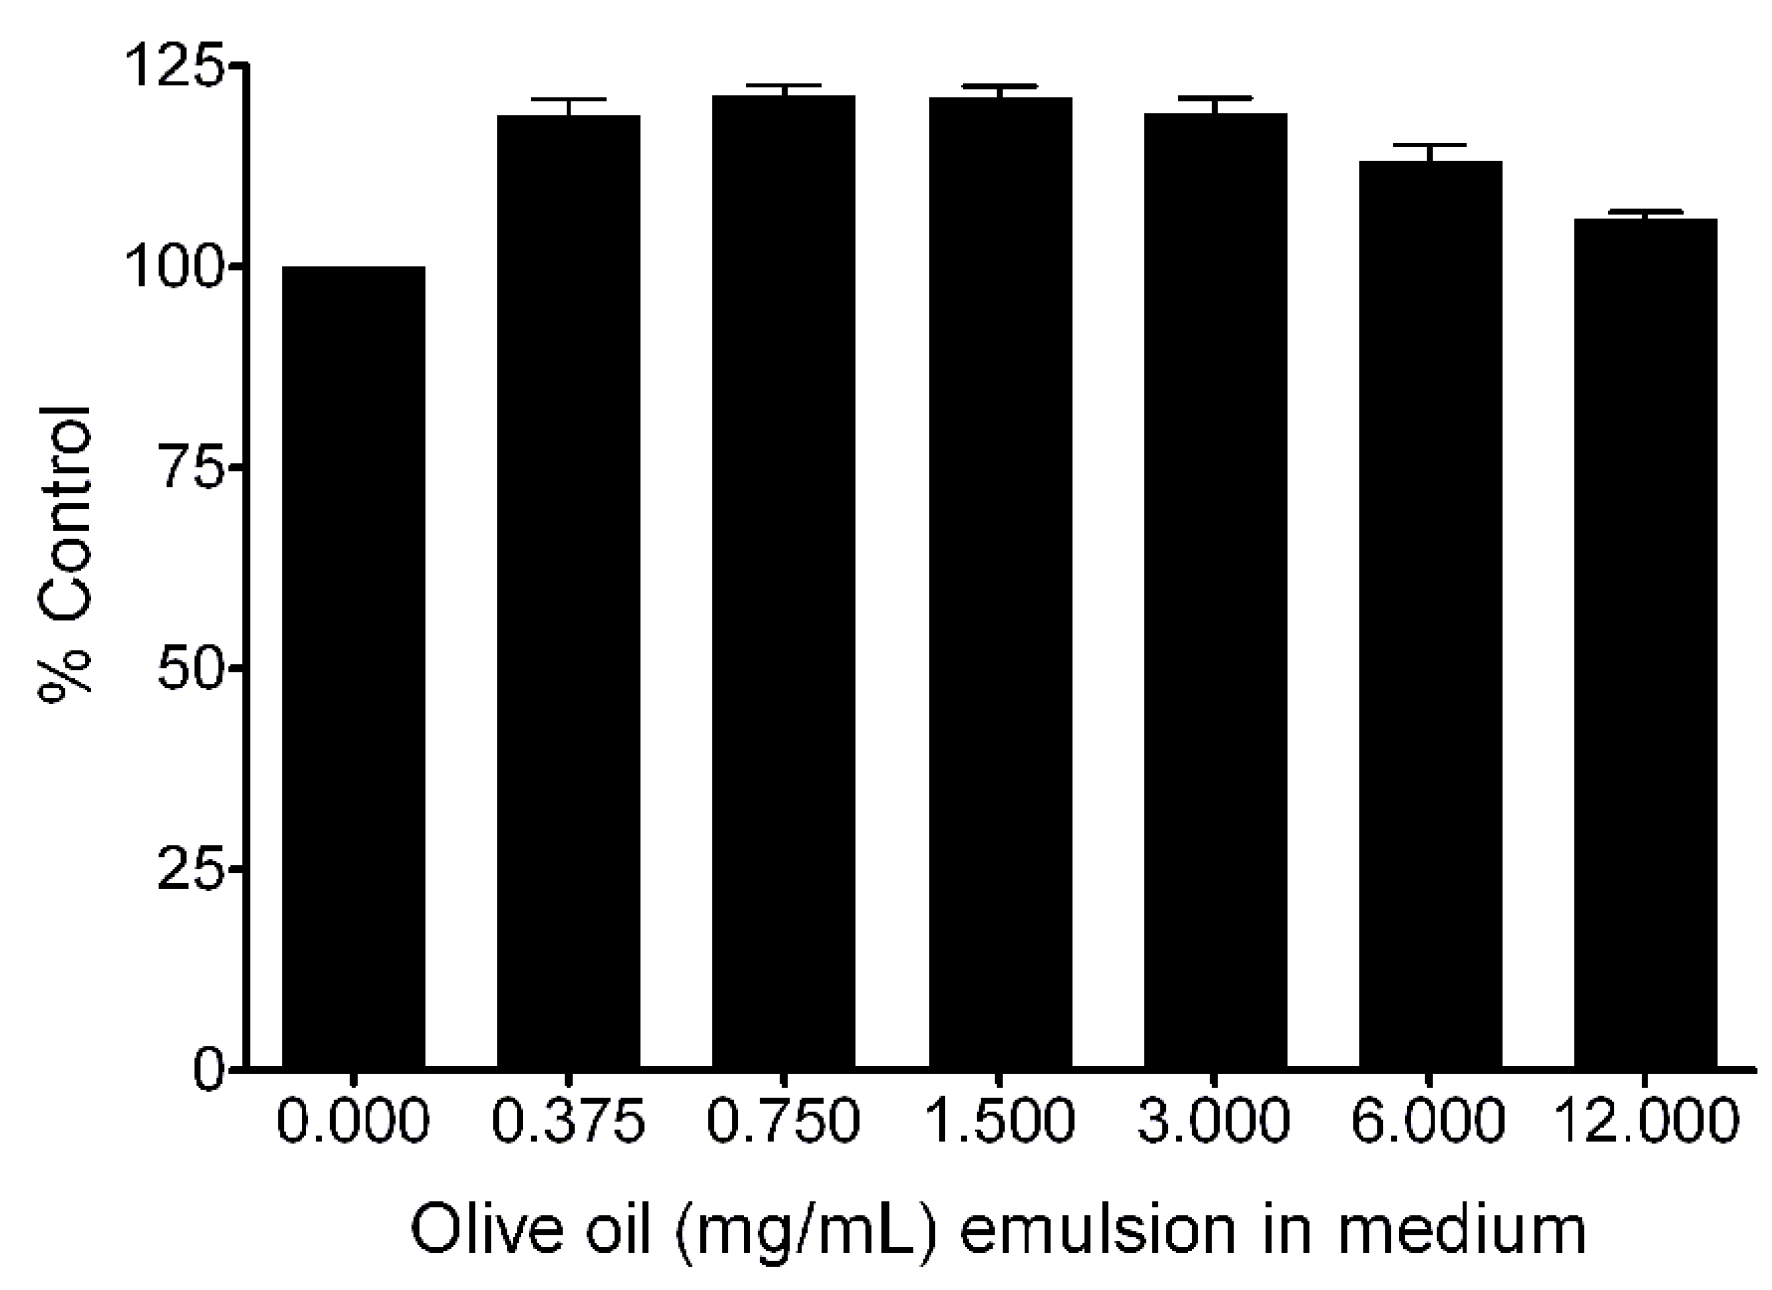
2.6. In Vitro Cytotoxicity and Labeling with Nanoemulsion M2
2.7. 19F NMR of Nanoemulsion M2 and Labeled Cells
2.8. Statistical Analysis
3. Results and Discussion
3.1. Formulation Development of C8-PFTE
3.1.1. Selection and Optimization of Surfactants

| Formulation | Surfactant 1 Pluronic® | Surfactant 2 Pluronic® | Droplet size ± PDIw/2 (nm) | PDI | Visual Observation |
|---|---|---|---|---|---|
| S1 | F127 | P123 | 180.0 ± 29.5 | 0.11 | Gelationa,b |
| S2 | F127 | P105 | 173.0 ± 25.4 | 0.08 | Thickening b |
| S3 | L121 | P105 | - | - | Phase Separation c |
| S4 | P123 | - | - | - | Gelationa |
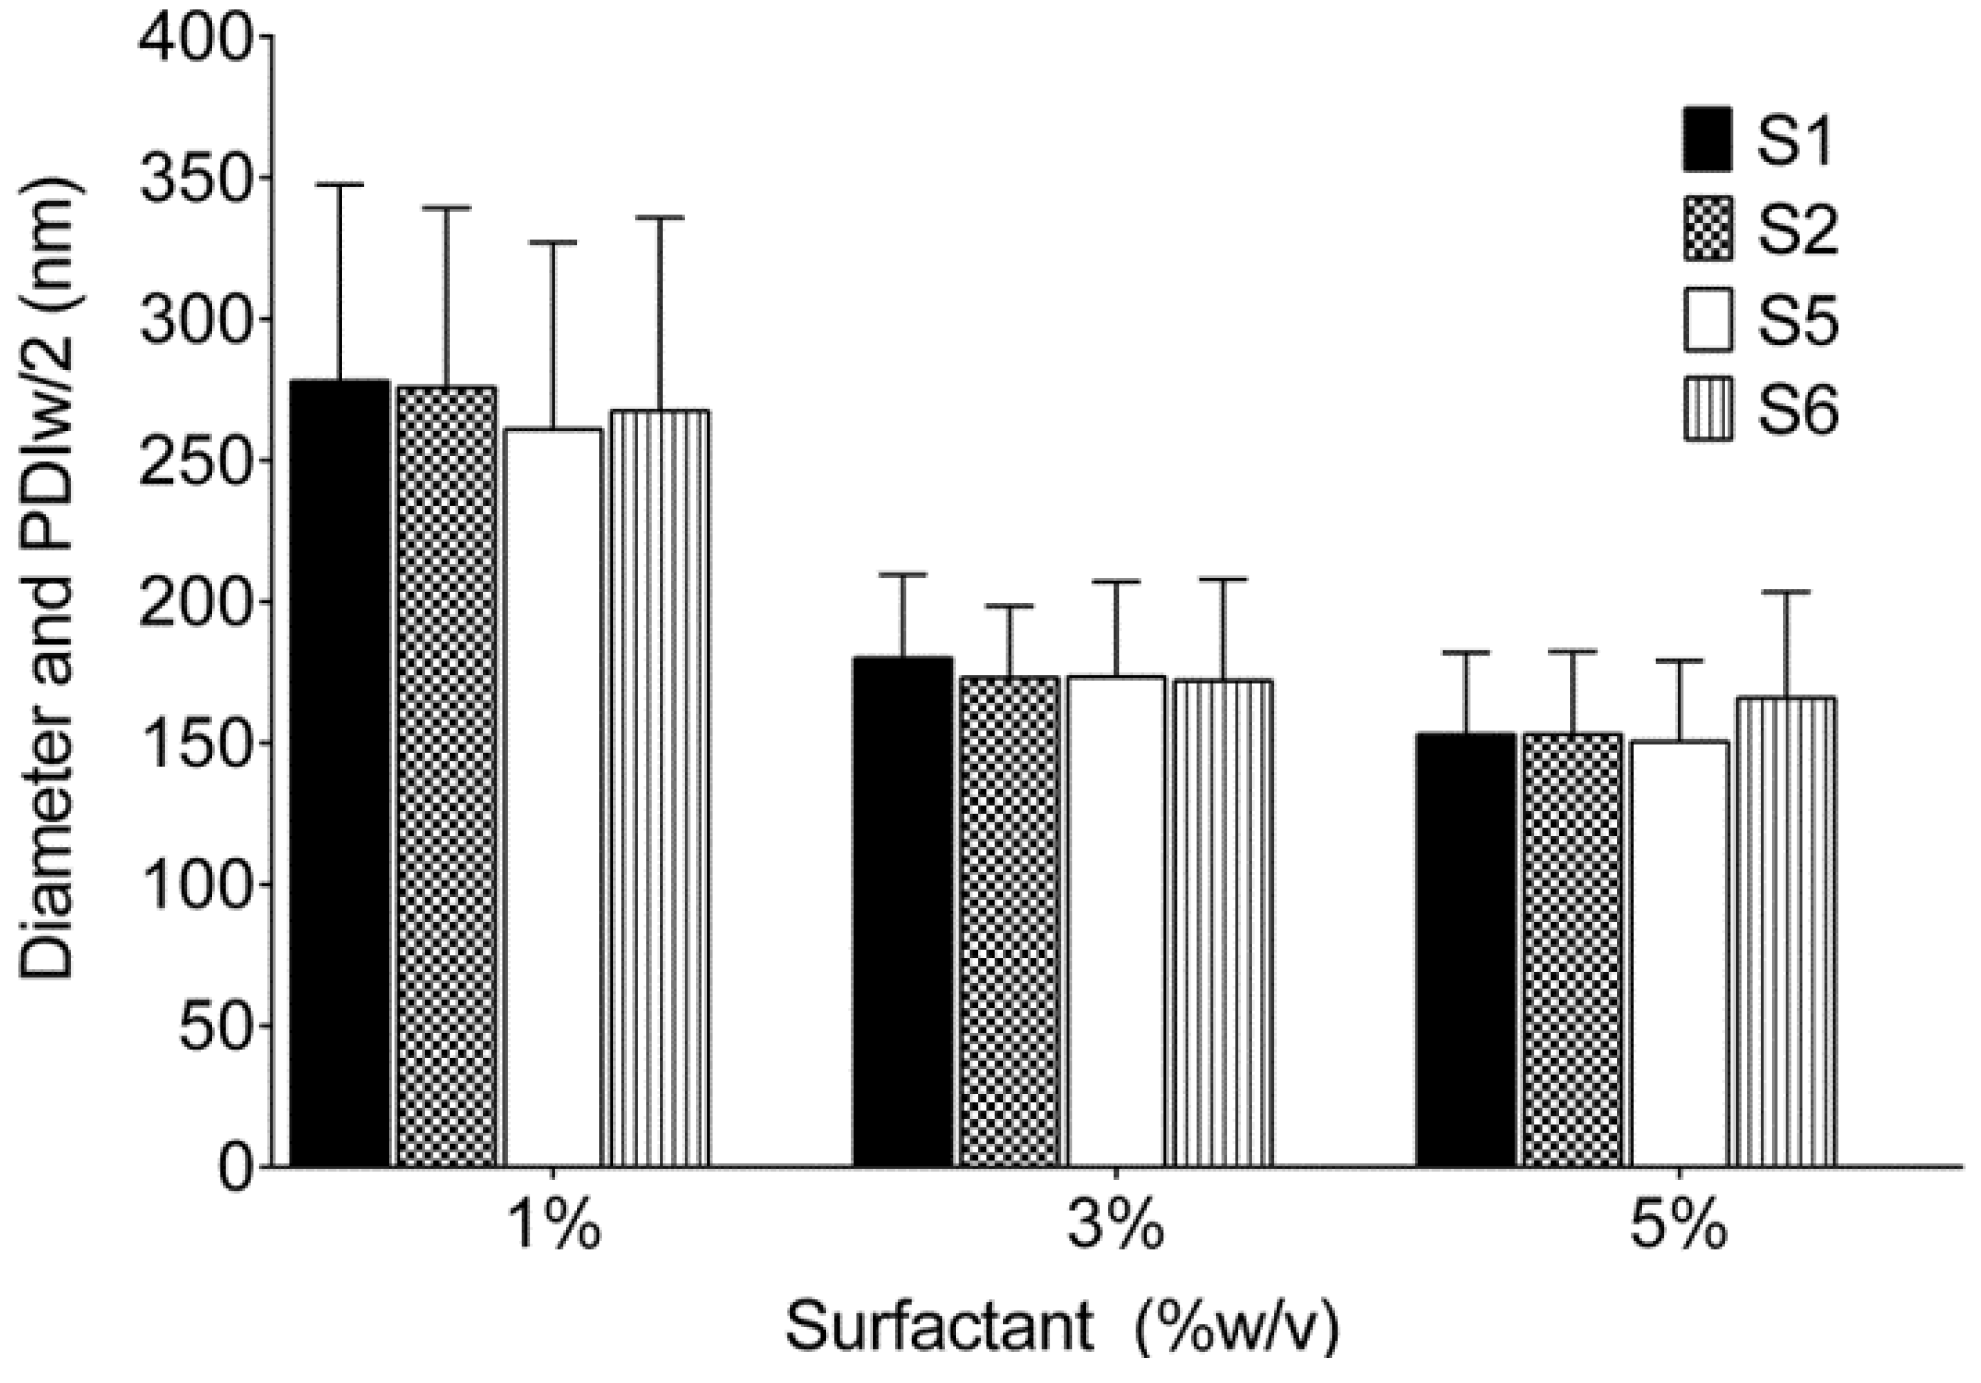
| S5 | P105 | - | 173.4 ± 33.7 | 0.15 | Homogenous |
| S6 | P105 | P123 | 172.0 ± 35.9 | 0.17 | Homogenous |


3.1.2. Optimization of Relative Amount of Pluronic® P123 and P105
| Formulation | P123:P105 | HLB | Droplet diameter ± PDIw/2 (nm) | PDI | Zeta Potential ± SD (mV) | Stability |
|---|---|---|---|---|---|---|
| S7 | 1:1 | 12.25 | 148.8 ± 27.3 | 0.13 | −8.88 ± 1.97 | Stable |
| S8 | 3:2 | 11.7 | 152 ± 26.8 | 0.12 | −9.04 ± 2.08 | Stable |
| S9 | 2:3 | 12.8 | 159 ± 33.7 | 0.19 | −11 ± 3.45 | Stable |

3.2. Preparation and Characterization of Microfluidized Nanoemulsions

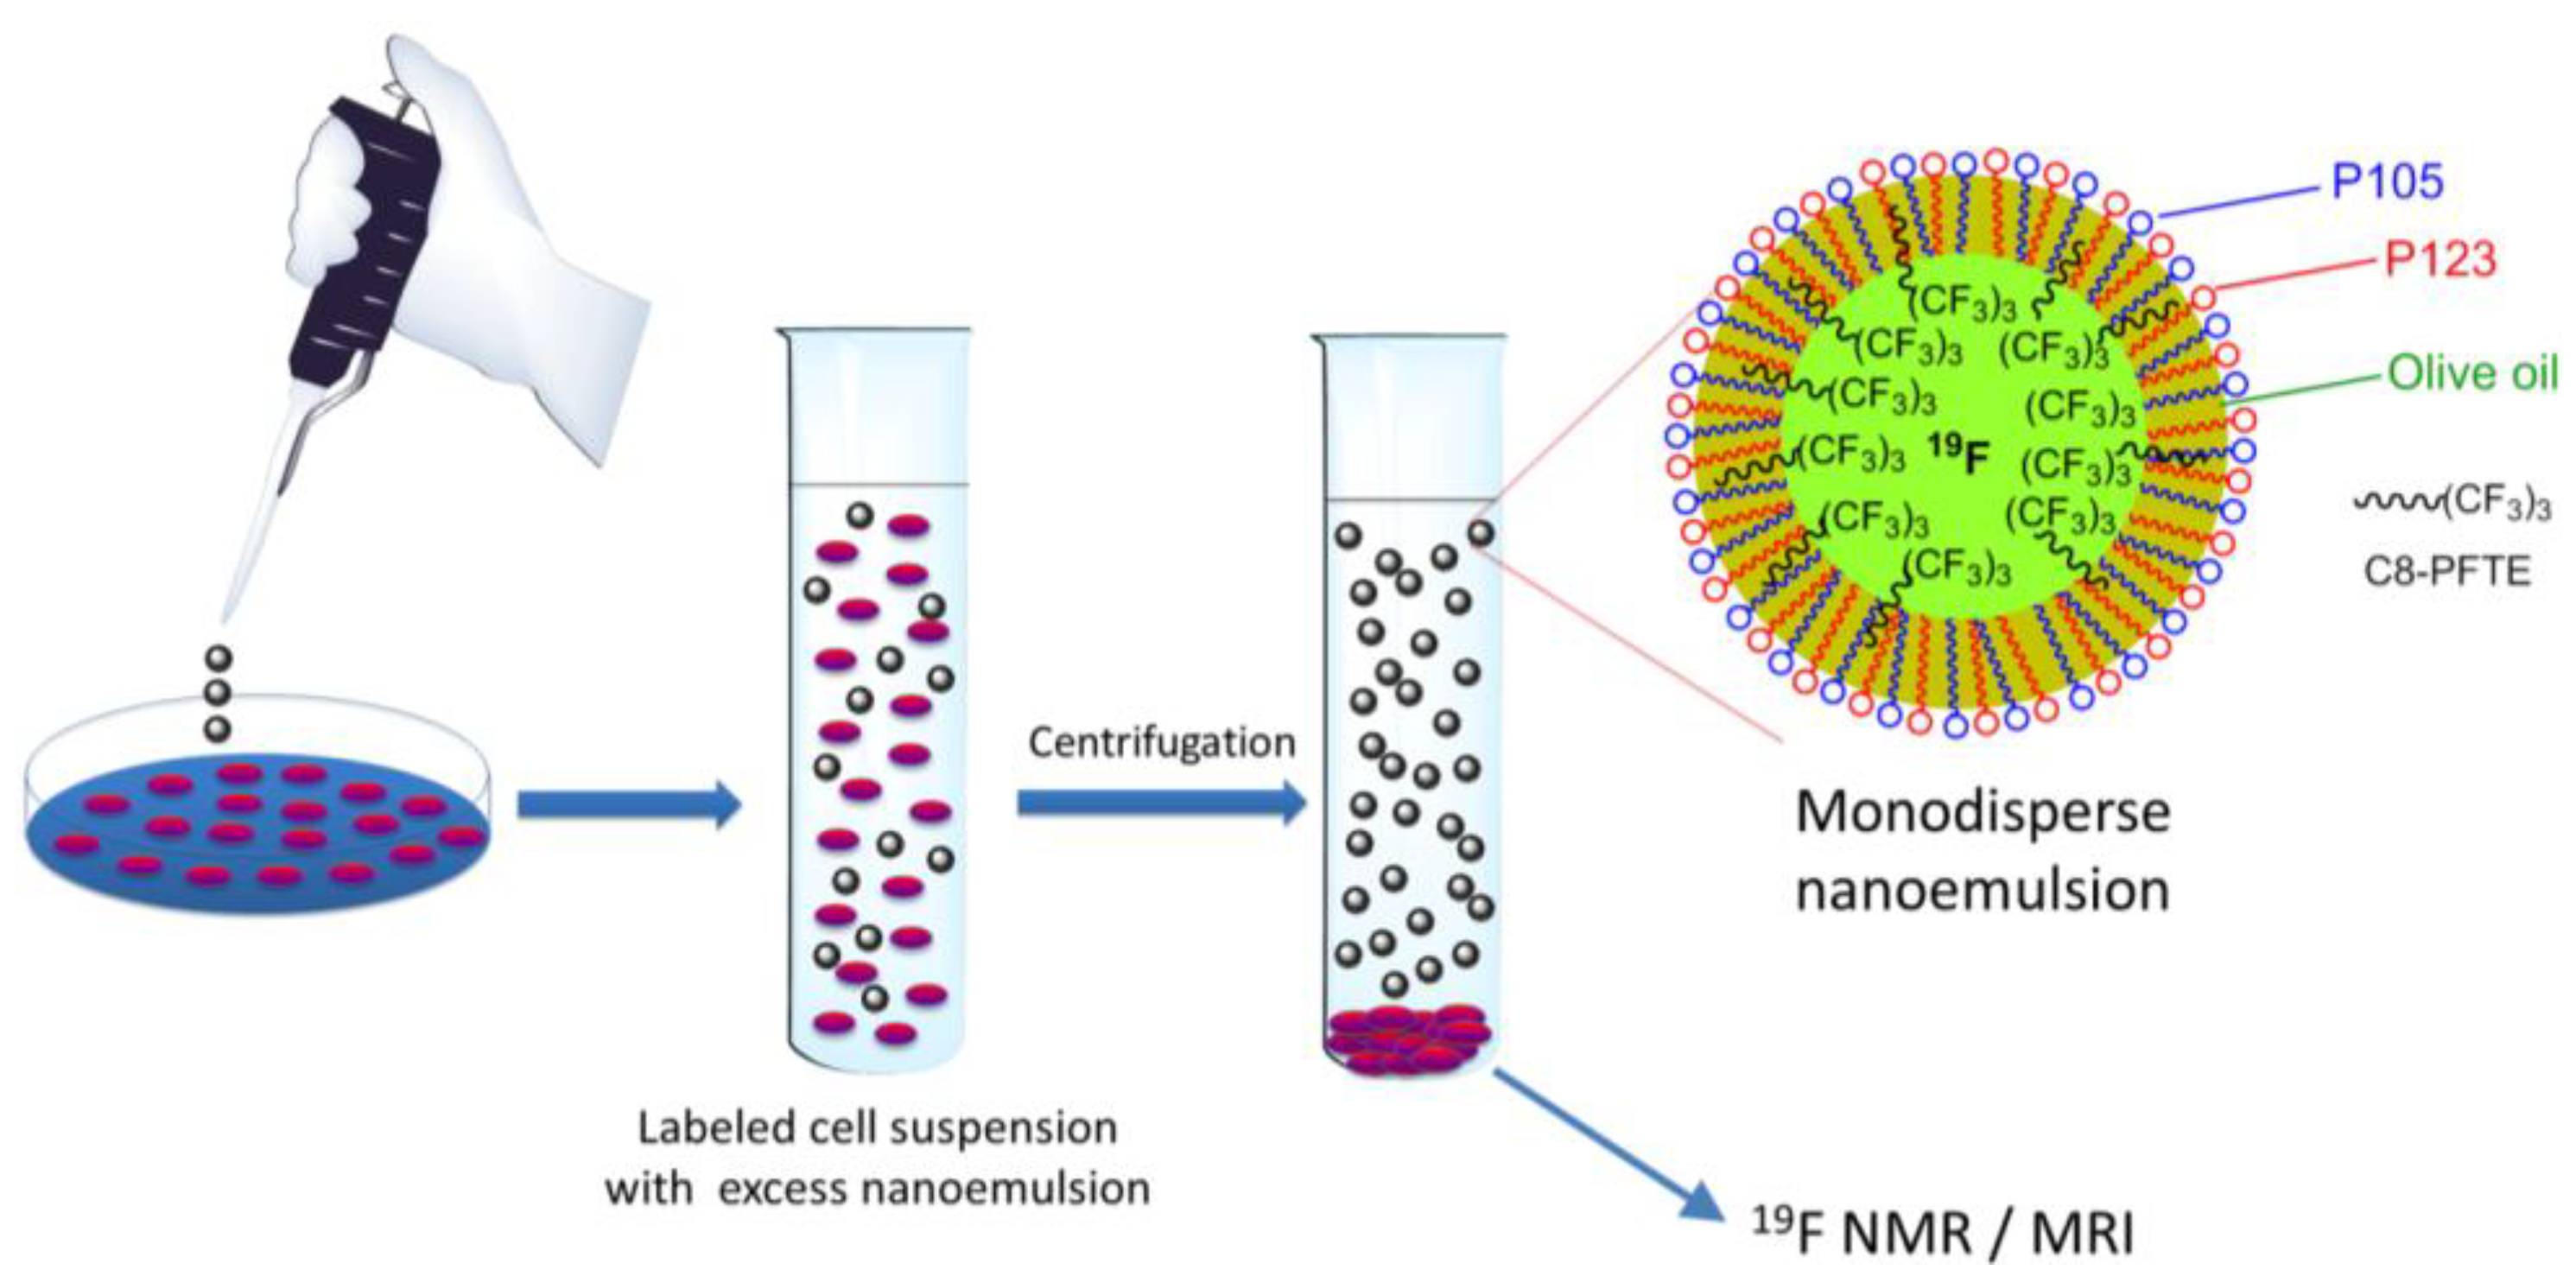
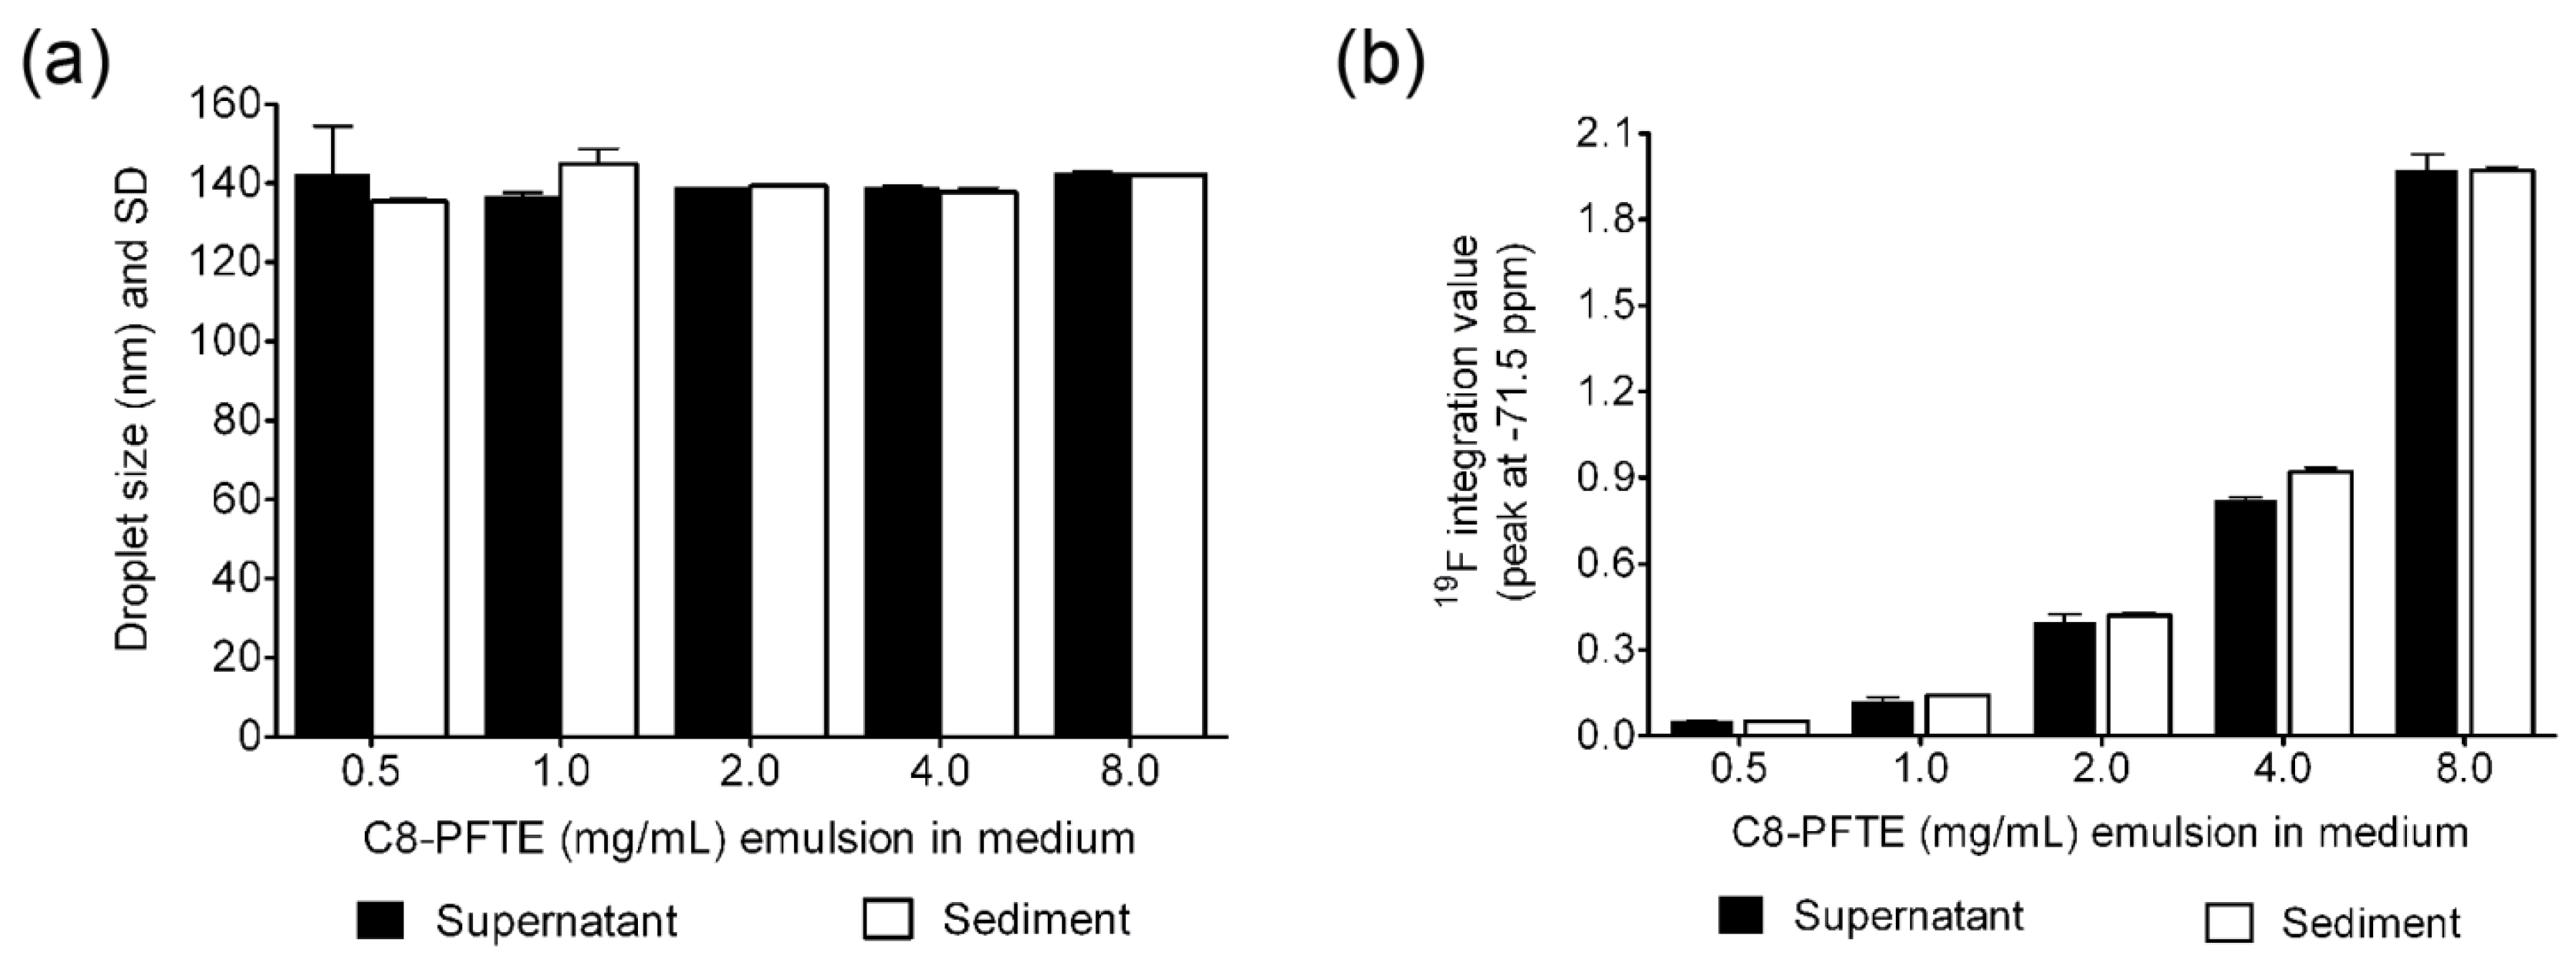
In Vitro Cell Labeling and Centrifugal Stability of Nanoemulsion M2

| C8-PFTE (mg/mL) emulsion in medium | Before centrifugation Mean diameter, nm (PDI) | After centrifugation Mean diameter, nm (PDI) | |
|---|---|---|---|
| Supernatant | Sediment | ||
| 8 (high) | 136.7 (0.152) | 142.1 (0.131) | 142.6 (0.137) |
| 4 (medium) | 134.6 (0.122) | 138.2 (0.17) | 135.7 (0.124) |
| 0.5 (low) | 129 (0.147) | 130.8 (0.159) | 129.7 (0.145) |


4. Conclusions
Acknowledgments
Conflicts of Interest
References
- Riess, J.G.; Krafft, M.P. Fluorinated materials for in vivo oxygen transport (blood substitutes), diagnosis and drug delivery. Biomaterials 1998, 19, 1529–1539. [Google Scholar] [CrossRef]
- Ahrens, E.T.; Zhong, J. In vivo MRI cell tracking using perfluorocarbon probes and fluorine-19 detection. NMR Biomed. 2013, 26, 860–871. [Google Scholar] [CrossRef]
- Janjic, J.M.; Ahrens, E.T. Fluorine-containing nanoemulsions for MRI cell tracking. Rev. Nanomed. Nanobiotechnol. 2009, 1, 492–501. [Google Scholar] [CrossRef]
- Winter, P.M.; Neubauer, A.M.; Caruthers, S.D.; Harris, T.D.; Robertson, J.D.; Williams, T.A.; Schmieder, A.H.; Hu, G.; Allen, J.S.; Lacy, E.K.; et al. Endothelial α(v)β3 integrin-targeted fumagillin nanoparticles inhibit angiogenesis in atherosclerosis. Arterioscler. Thromb. Vasc. Biol. 2006, 26, 2103–2109. [Google Scholar] [CrossRef]
- Lim, Y.T.; Cho, M.Y.; Kang, J.H.; Noh, Y.W.; Cho, J.H.; Hong, K.S.; Chung, J.W.; Chung, B.H. Perfluorodecalin/(InGaP/ZnS quantum dots) nanoemulsions as 19F MR/optical imaging nanoprobes for the labeling of phagocytic and nonphagocytic immune cells. Biomaterials 2010, 31, 4964–4971. [Google Scholar] [CrossRef]
- O’Hanlon, C.E.; Amede, K.G.; O’Hear, M.R.; Janjic, J.M. NIR-labeled perfluoropolyether nanoemulsions for drug delivery and imaging. J. Fluor. Chem. 2012, 137, 27–33. [Google Scholar] [CrossRef]
- Patel, S.K.; Patrick, M.J.; Pollock, J.A.; Janjic, J.M. Two-color fluorescent (NIR and visible) triphasic perfluorocarbon nanoemuslions. J. Biomed. Opt. 2013, 18, 101312. [Google Scholar] [CrossRef]
- Patel, S.K.; Zhang, Y.; Pollock, J.A.; Janjic, J.M. Cyclooxgenase-2 inhibiting perfluoropoly (ethylene glycol) ether theranostic nanoemulsions—In vitro study. PLoS One 2013, 8, e55802. [Google Scholar] [CrossRef]
- Janjic, J.M.; Srinivas, M.; Kadayakkara, D.K.; Ahrens, E.T. Self-delivering nanoemulsions for dual fluorine-19 MRI and fluorescence detection. J. Am. Chem. Soc. 2008, 130, 2832–2841. [Google Scholar] [CrossRef]
- Hitchens, T.K.; Ye, Q.; Eytan, D.F.; Janjic, J.M.; Ahrens, E.T.; Ho, C. 19F MRI detection of acute allograft rejection with in vivo perfluorocarbon labeling of immune cells. Magn. Reson. Med. 2011, 65, 1144–1153. [Google Scholar] [CrossRef]
- Van Heeswijk, R.B.; de Blois, J.; Kania, G.; Gonzales, C.; Blyszczuk, P.; Stuber, M.; Eriksson, U.; Schwitter, J. Selective in vivo visualization of immune-cell infiltration in a mouse model of autoimmune myocarditis by fluorine-19 cardiac magnetic resonance. Circ.Cardiovasc.Imaging 2013, 6, 277–284. [Google Scholar] [CrossRef]
- Balducci, A.; Wen, Y.; Zhang, Y.; Helfer, B.M.; Hitchens, T.K.; Meng, W.S.; Wesa, A.K.; Janjic, J.M. A novel probe for the non-invasive detection of tumor-associated inflammation. Oncoimmunology 2013, 2, e23034. [Google Scholar] [CrossRef]
- Ahrens, E.T.; Flores, R.; Xu, H.; Morel, P.A. In vivo imaging platform for tracking immunotherapeutic cells. Nat. Biotechnol. 2005, 23, 983–987. [Google Scholar] [CrossRef]
- Srinivas, M.; Turner, M.S.; Janjic, J.M.; Morel, P.A.; Laidlaw, D.H.; Ahrens, E.T. In vivo cytometry of antigen-specific t cells using 19F MRI. Magn. Reson. Med. 2009, 62, 747–753. [Google Scholar] [CrossRef]
- Pittsburgh, C.I. Celsense, Pitt Trial to “See” Cells Fight Cancer. Available online: http://www.post-gazette.com/stories/business/news/celsense-pitt-trial-to-see-cells-fight-cancer-305182/ (accessed on 10 September 2013).
- Helfer, B.M.; Balducci, A.; Nelson, A.D.; Janjic, J.M.; Gil, R.R.; Kalinski, P.; de Vries, I.J.; Ahrens, E.T.; Mailliard, R.B. Functional assessment of human dendritic cells labeled for in vivo (19)F magnetic resonance imaging cell tracking. Cytotherapy 2010, 12, 238–250. [Google Scholar] [CrossRef]
- McClements, D.J. Nanoemulsions versus microemulsions: Terminology, differences, and similarities. Soft Matter. 2012, 8, 1719–1729. [Google Scholar] [CrossRef]
- Wooster, T.J.; Golding, M.; Sanguansri, P. Impact of oil type on nanoemulsion formation and Ostwald ripening stability. Langmuir 2008, 24, 12758–12765. [Google Scholar]
- Klein, D.H.; Burtner, D.B.; Trevino, L.A.; Arlauskas, R.A. Particle size distribution of concentrated perfluorocarbon emulsions by sedimentation field flow fractionation. Biomater. Artif. Cells Immobil. Biotechnol. 1992, 20, 859–864. [Google Scholar]
- Jiang, Z.X.; Yu, Y.B. The design and synthesis of highly branched and spherically symmetric fluorinated oils and amphiles. Tetrahedron 2007, 63, 3982–3988. [Google Scholar] [CrossRef]
- Janjic, J.M.; Ahrens, E.T. Compositions and Methods for Producing Cellular Labels for Nuclear Magnetic Resonance Techniques. U.S. Patent 8,227,610, 12 March 2009. [Google Scholar]
- Soman, N.R.; Lanza, G.M.; Heuser, J.M.; Schlesinger, P.H.; Wickline, S.A. Synthesis and characterization of stable fluorocarbon nanostructures as drug delivery vehicles for cytolytic peptides. Nano Lett. 2008, 8, 1131–1136. [Google Scholar] [CrossRef]
- Partlow, K.C.; Chen, J.; Brant, J.A.; Neubauer, A.M.; Meyerrose, T.E.; Creer, M.H.; Nolta, J.A.; Caruthers, S.D.; Lanza, G.M.; Wickline, S.A. 19F magnetic resonance imaging for stem/progenitor cell tracking with multiple unique perfluorocarbon nanobeacons. FASEB J. 2007, 21, 1647–1654. [Google Scholar] [CrossRef]
- Strickley, R.G. Solubilizing excipients in oral and injectable formulations. Pharm. Res. 2004, 21, 201–230. [Google Scholar] [CrossRef]
- Rowe, R.C.; Sheskey, P.J.; Cook, W.G.; Fenton, M.E. American Pharmacists Association, Handbook of Pharmaceutical Excipients, 7th ed.; APhA/Pharmaceutical Press: London, UK, 2012; p. 1033. [Google Scholar]
- Reimund, J.M.; Rahmi, G.; Escalin, G.; Pinna, G.; Finck, G.; Muller, C.D.; Duclos, B.; Baumann, R. Efficacy and safety of an olive oil-based intravenous fat emulsion in adult patients on home parenteral nutrition. Aliment. Pharmacol. Ther. 2005, 21, 445–454. [Google Scholar]
- Heurtault, B.; Saulnier, P.; Pech, B.; Proust, J.E.; Benoit, J.P. Physico-chemical stability of colloidal lipid particles. Biomaterials 2003, 24, 4283–4300. [Google Scholar] [CrossRef]
- Putyatina, T.K.; Aprosin, U.D.; Afonin, N.I. The elimination peculiarities of perfluorocarbon emulsions stabilized with egg yolk phospholipid. Artif. Cells Blood Substit. Immobil. Biotechnol. 1994, 22, 1281–1285. [Google Scholar] [CrossRef]
- Maa, Y.F.; Hsu, C.C. Performance of sonication and microfluidization for liquid-liquid emulsification. Pharm. Dev. Technol. 1999, 4, 233–240. [Google Scholar] [CrossRef]
- Hatton, T.A.; Alexandridis, P. Poly(ethylene oxide)-poly(propylene oxide )-poly (ethylene oxide) block copolymer surfactants in aqueous solutions and at interfaces: Thermodynamics, structure, dynamics, and modeling. Colloids Surfaces A: Physicochem. Eng. Asp. 1995, 96, 1–46. [Google Scholar] [CrossRef]
- Uskokovic, V.; Odsinada, R.; Djordjevic, S.; Habelitz, S. Dynamic light scattering and zeta potential of colloidal mixtures of amelogenin and hydroxyapatite in calcium and phosphate rich ionic milieus. Arch. Oral Biol. 2011, 56, 521–532. [Google Scholar] [CrossRef]
- Hu, L.; Chen, J.; Yang, X.; Caruthers, S.D.; Lanza, G.M.; Wickline, S.A. Rapid quantification of oxygen tension in blood flow with a fluorine nanoparticle reporter and a novel blood flow-enhanced-saturation-recovery sequence. Magn. Reson. Med. 2013, 70, 176–183. [Google Scholar] [CrossRef]
- Zhong, J.; Mills, P.H.; Hitchens, T.K.; Ahrens, E.T. Accelerated fluorine-19 MRI cell tracking using compressed sensing. Magn. Reson. Med. 2013, 69, 1683–1690. [Google Scholar] [CrossRef]
- Kadayakkara, D.K.; Janjic, J.M.; Pusateri, L.K.; Young, W.B.; Ahrens, E.T. In vivo observation of intracellular oximetry in perfluorocarbon-labeled glioma cells and chemotherapeutic response in the CNS using fluorine-19 MRI. Magn. Reson. Med. 2010, 64, 1252–1259. [Google Scholar] [CrossRef]
- Srinivas, M.; Heerschap, A.; Ahrens, E.T.; Figdor, C.G.; de Vries, I.J. 19F MRI for quantitative in vivo cell tracking. Trends Biotechnol. 2010, 28, 363–370. [Google Scholar] [CrossRef]
Appendix
Experimental Materials
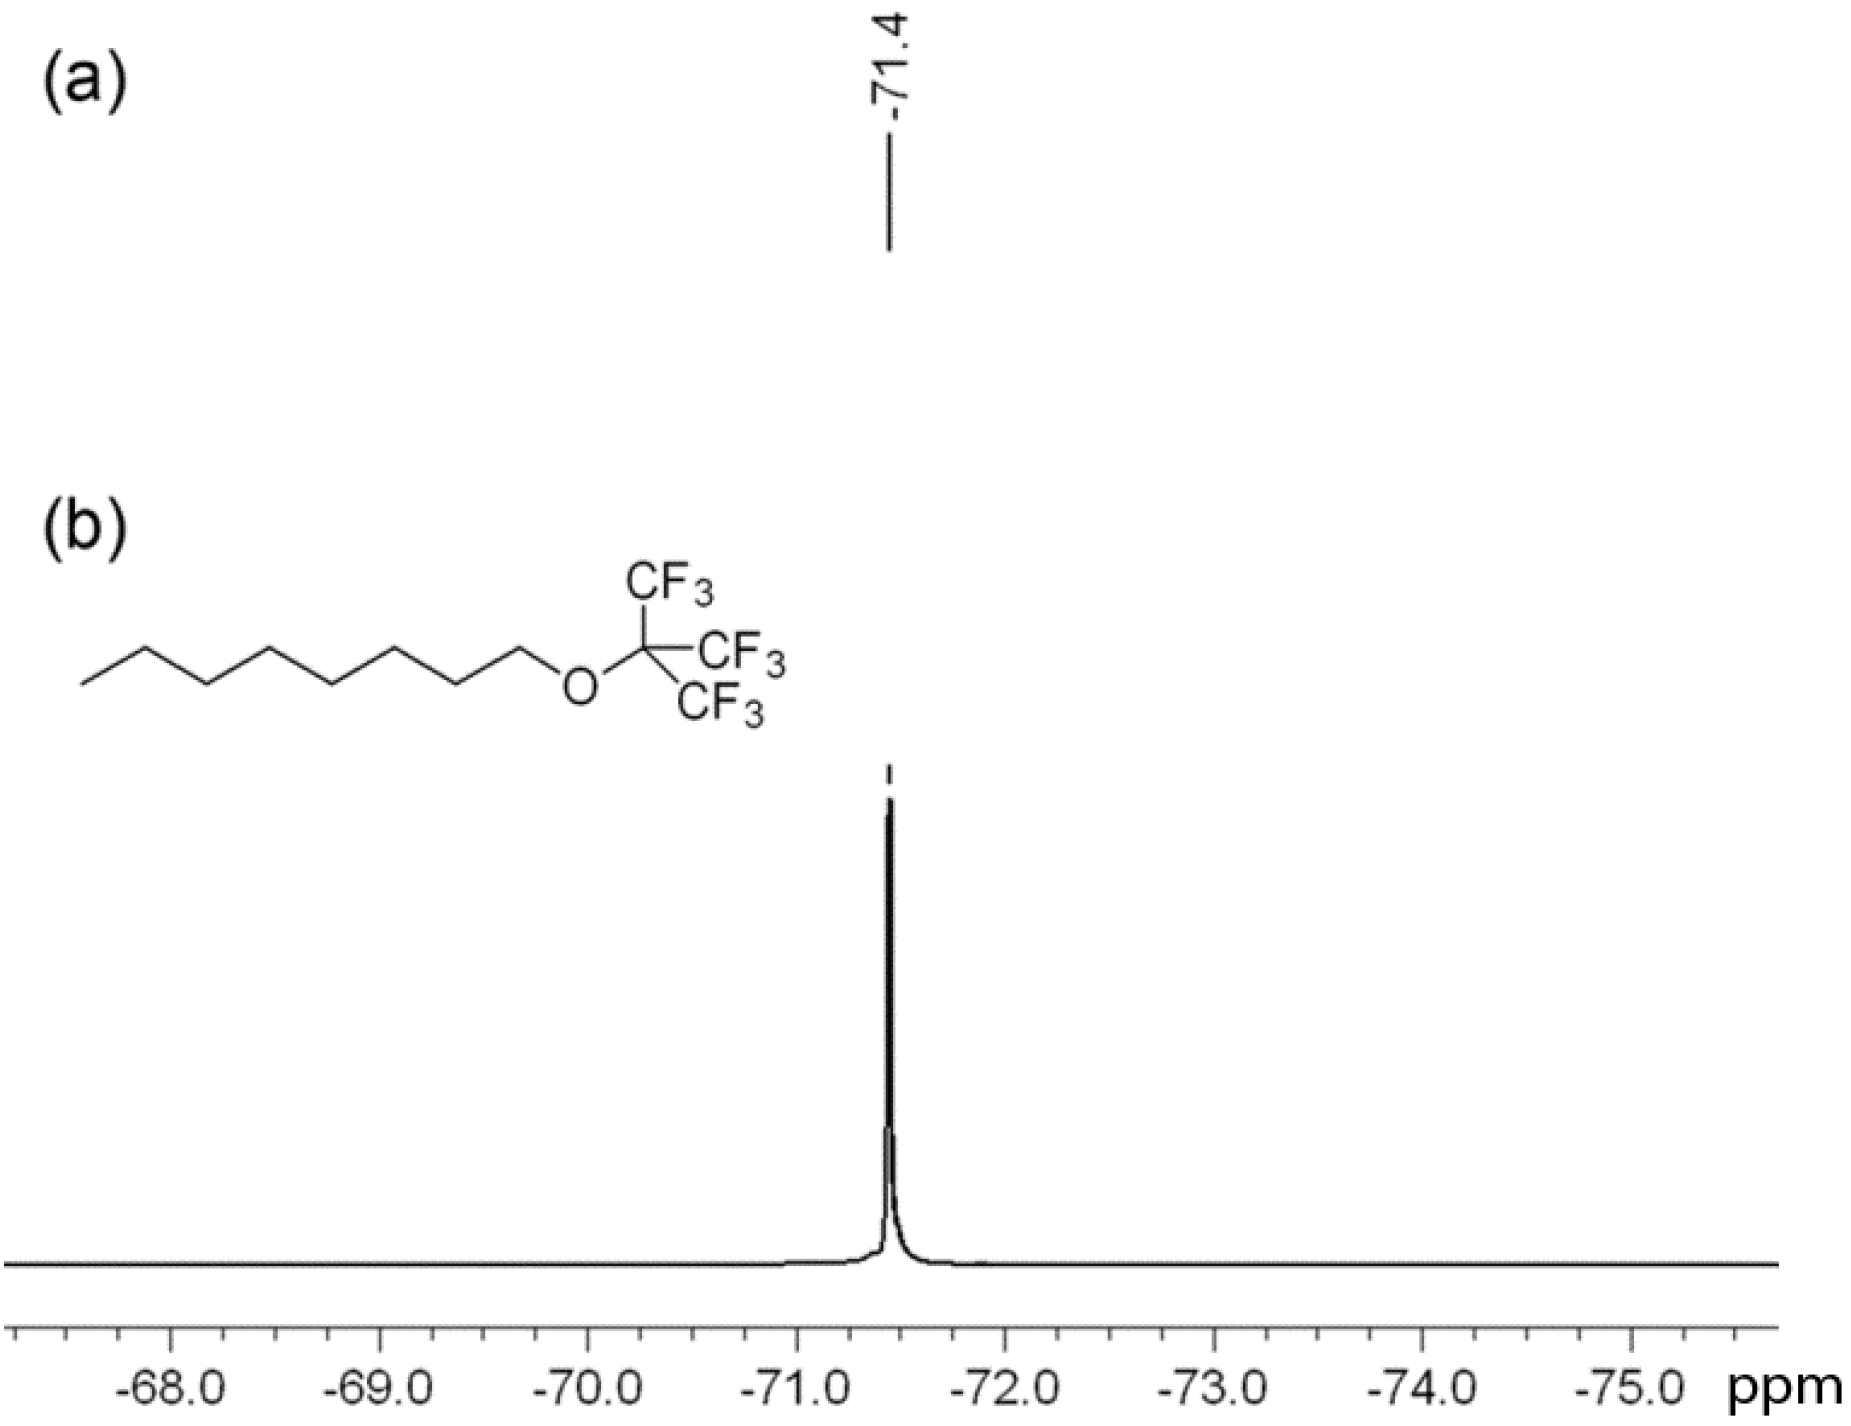
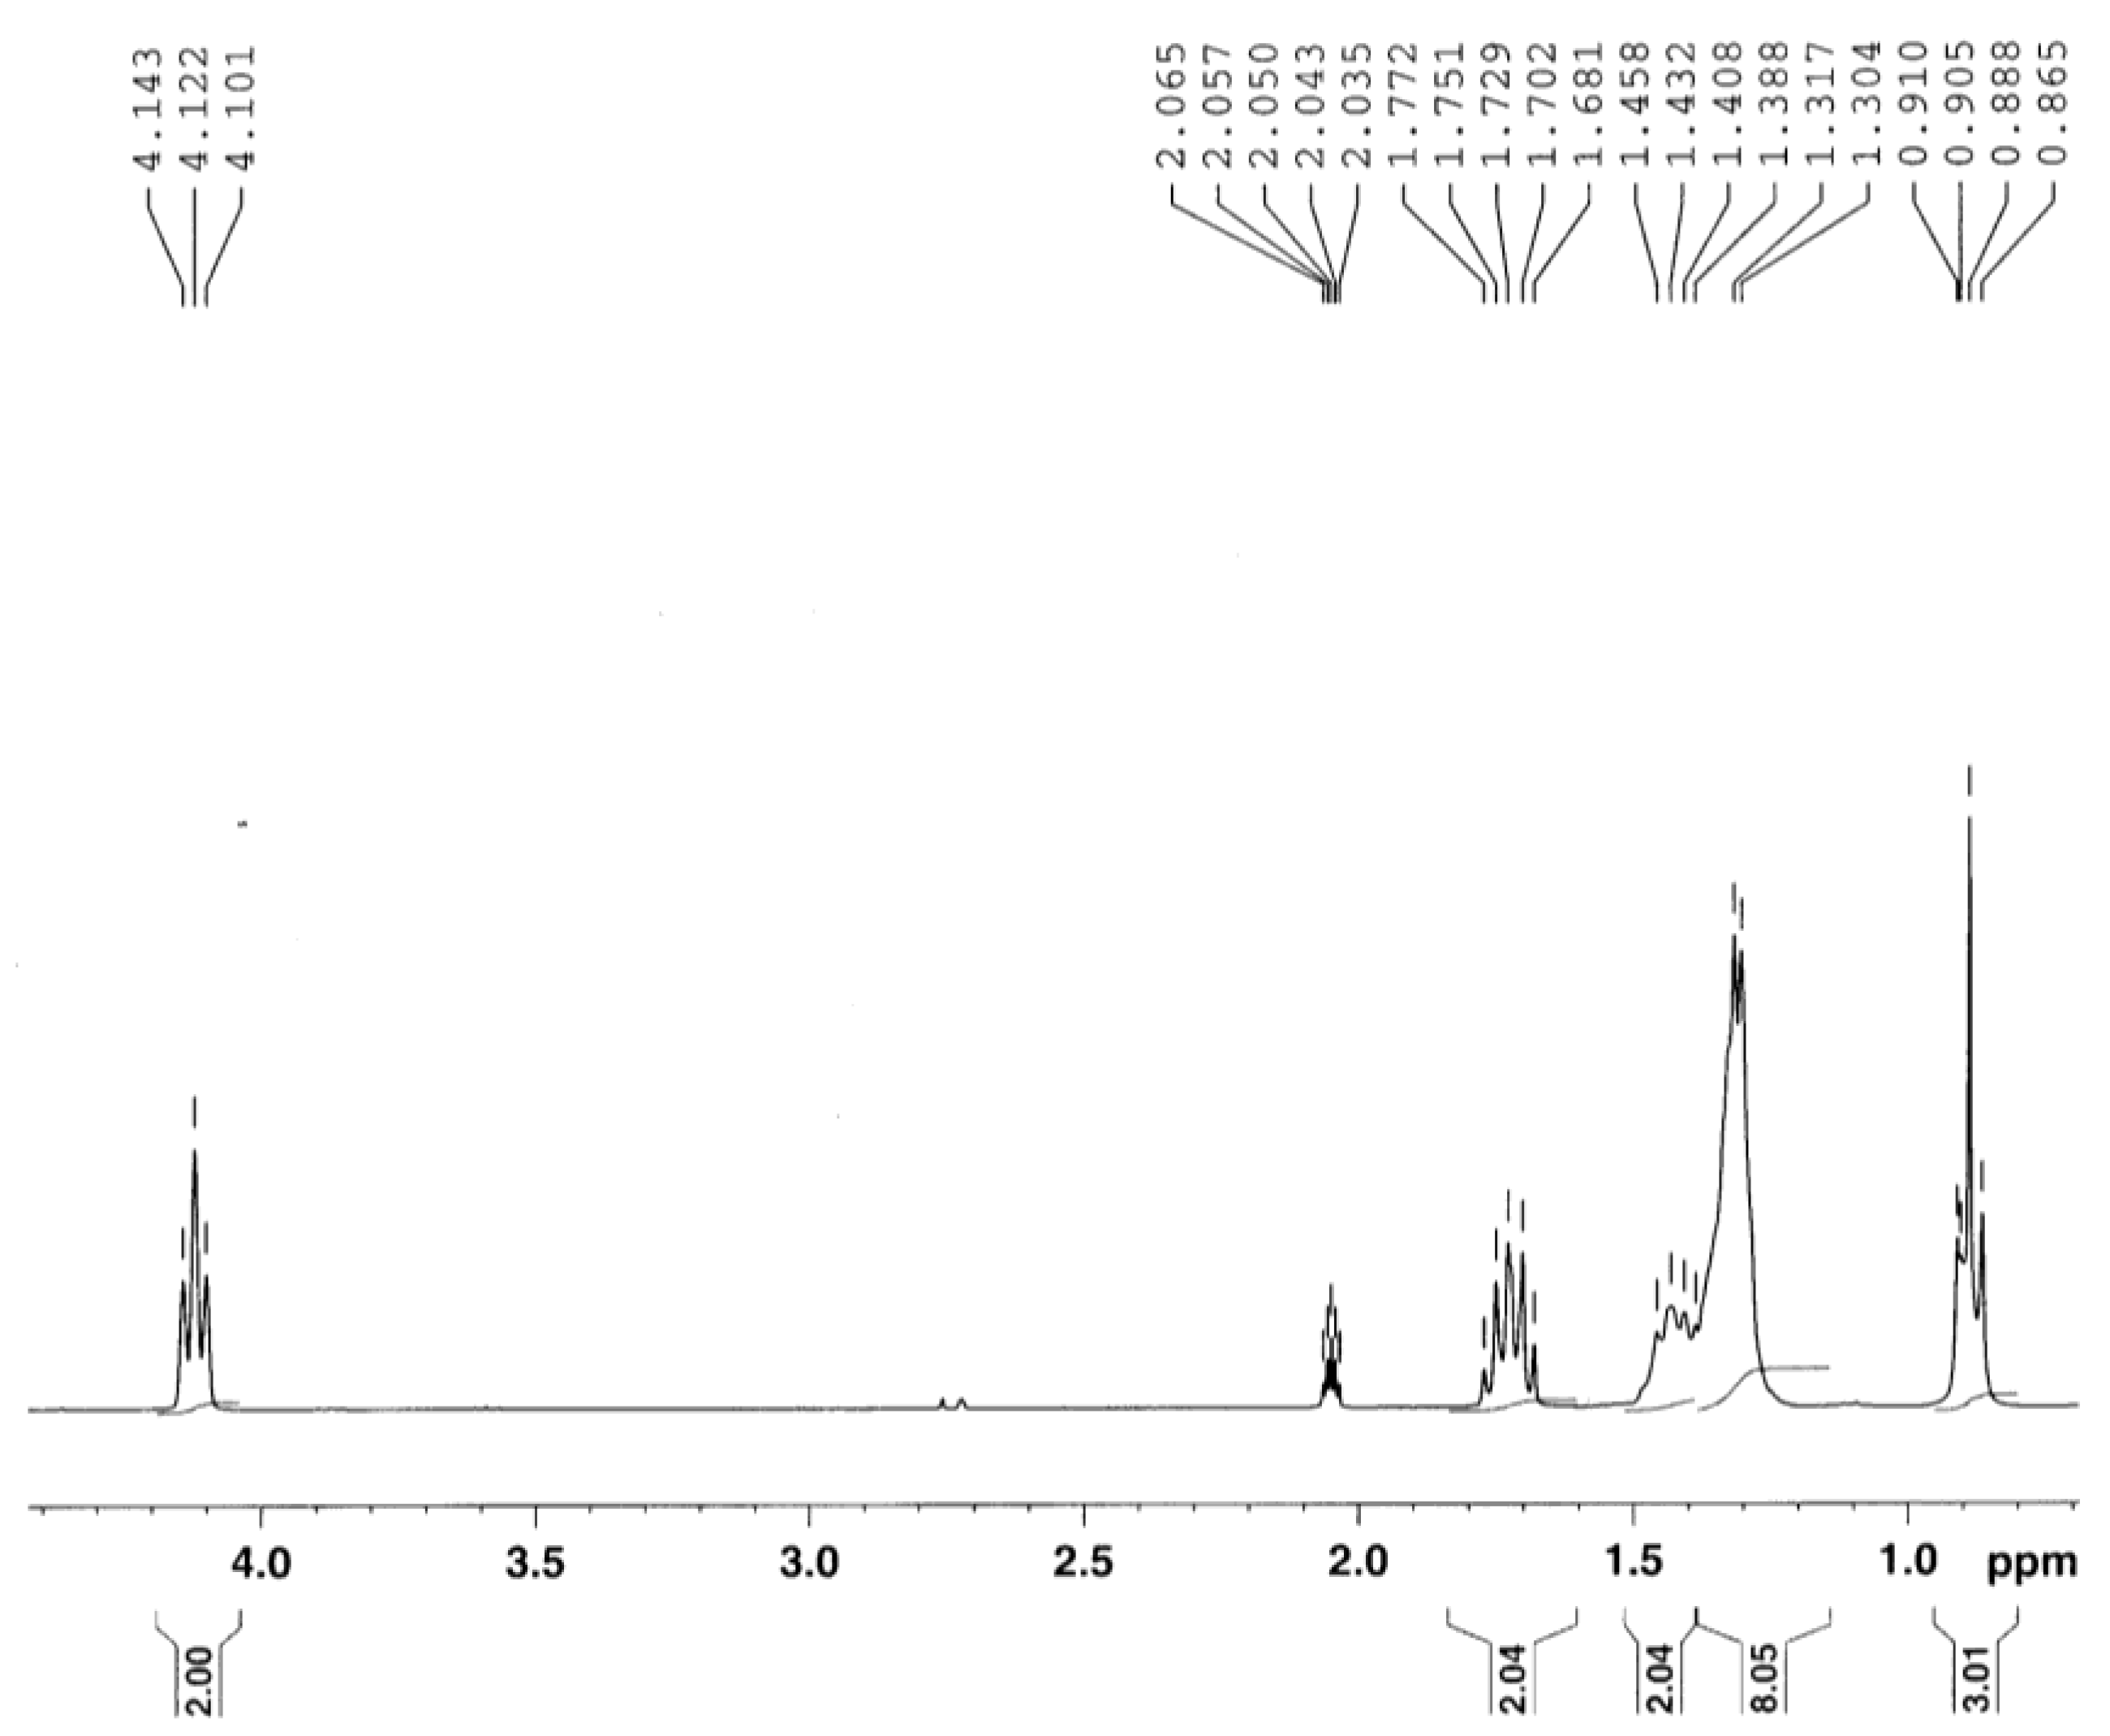
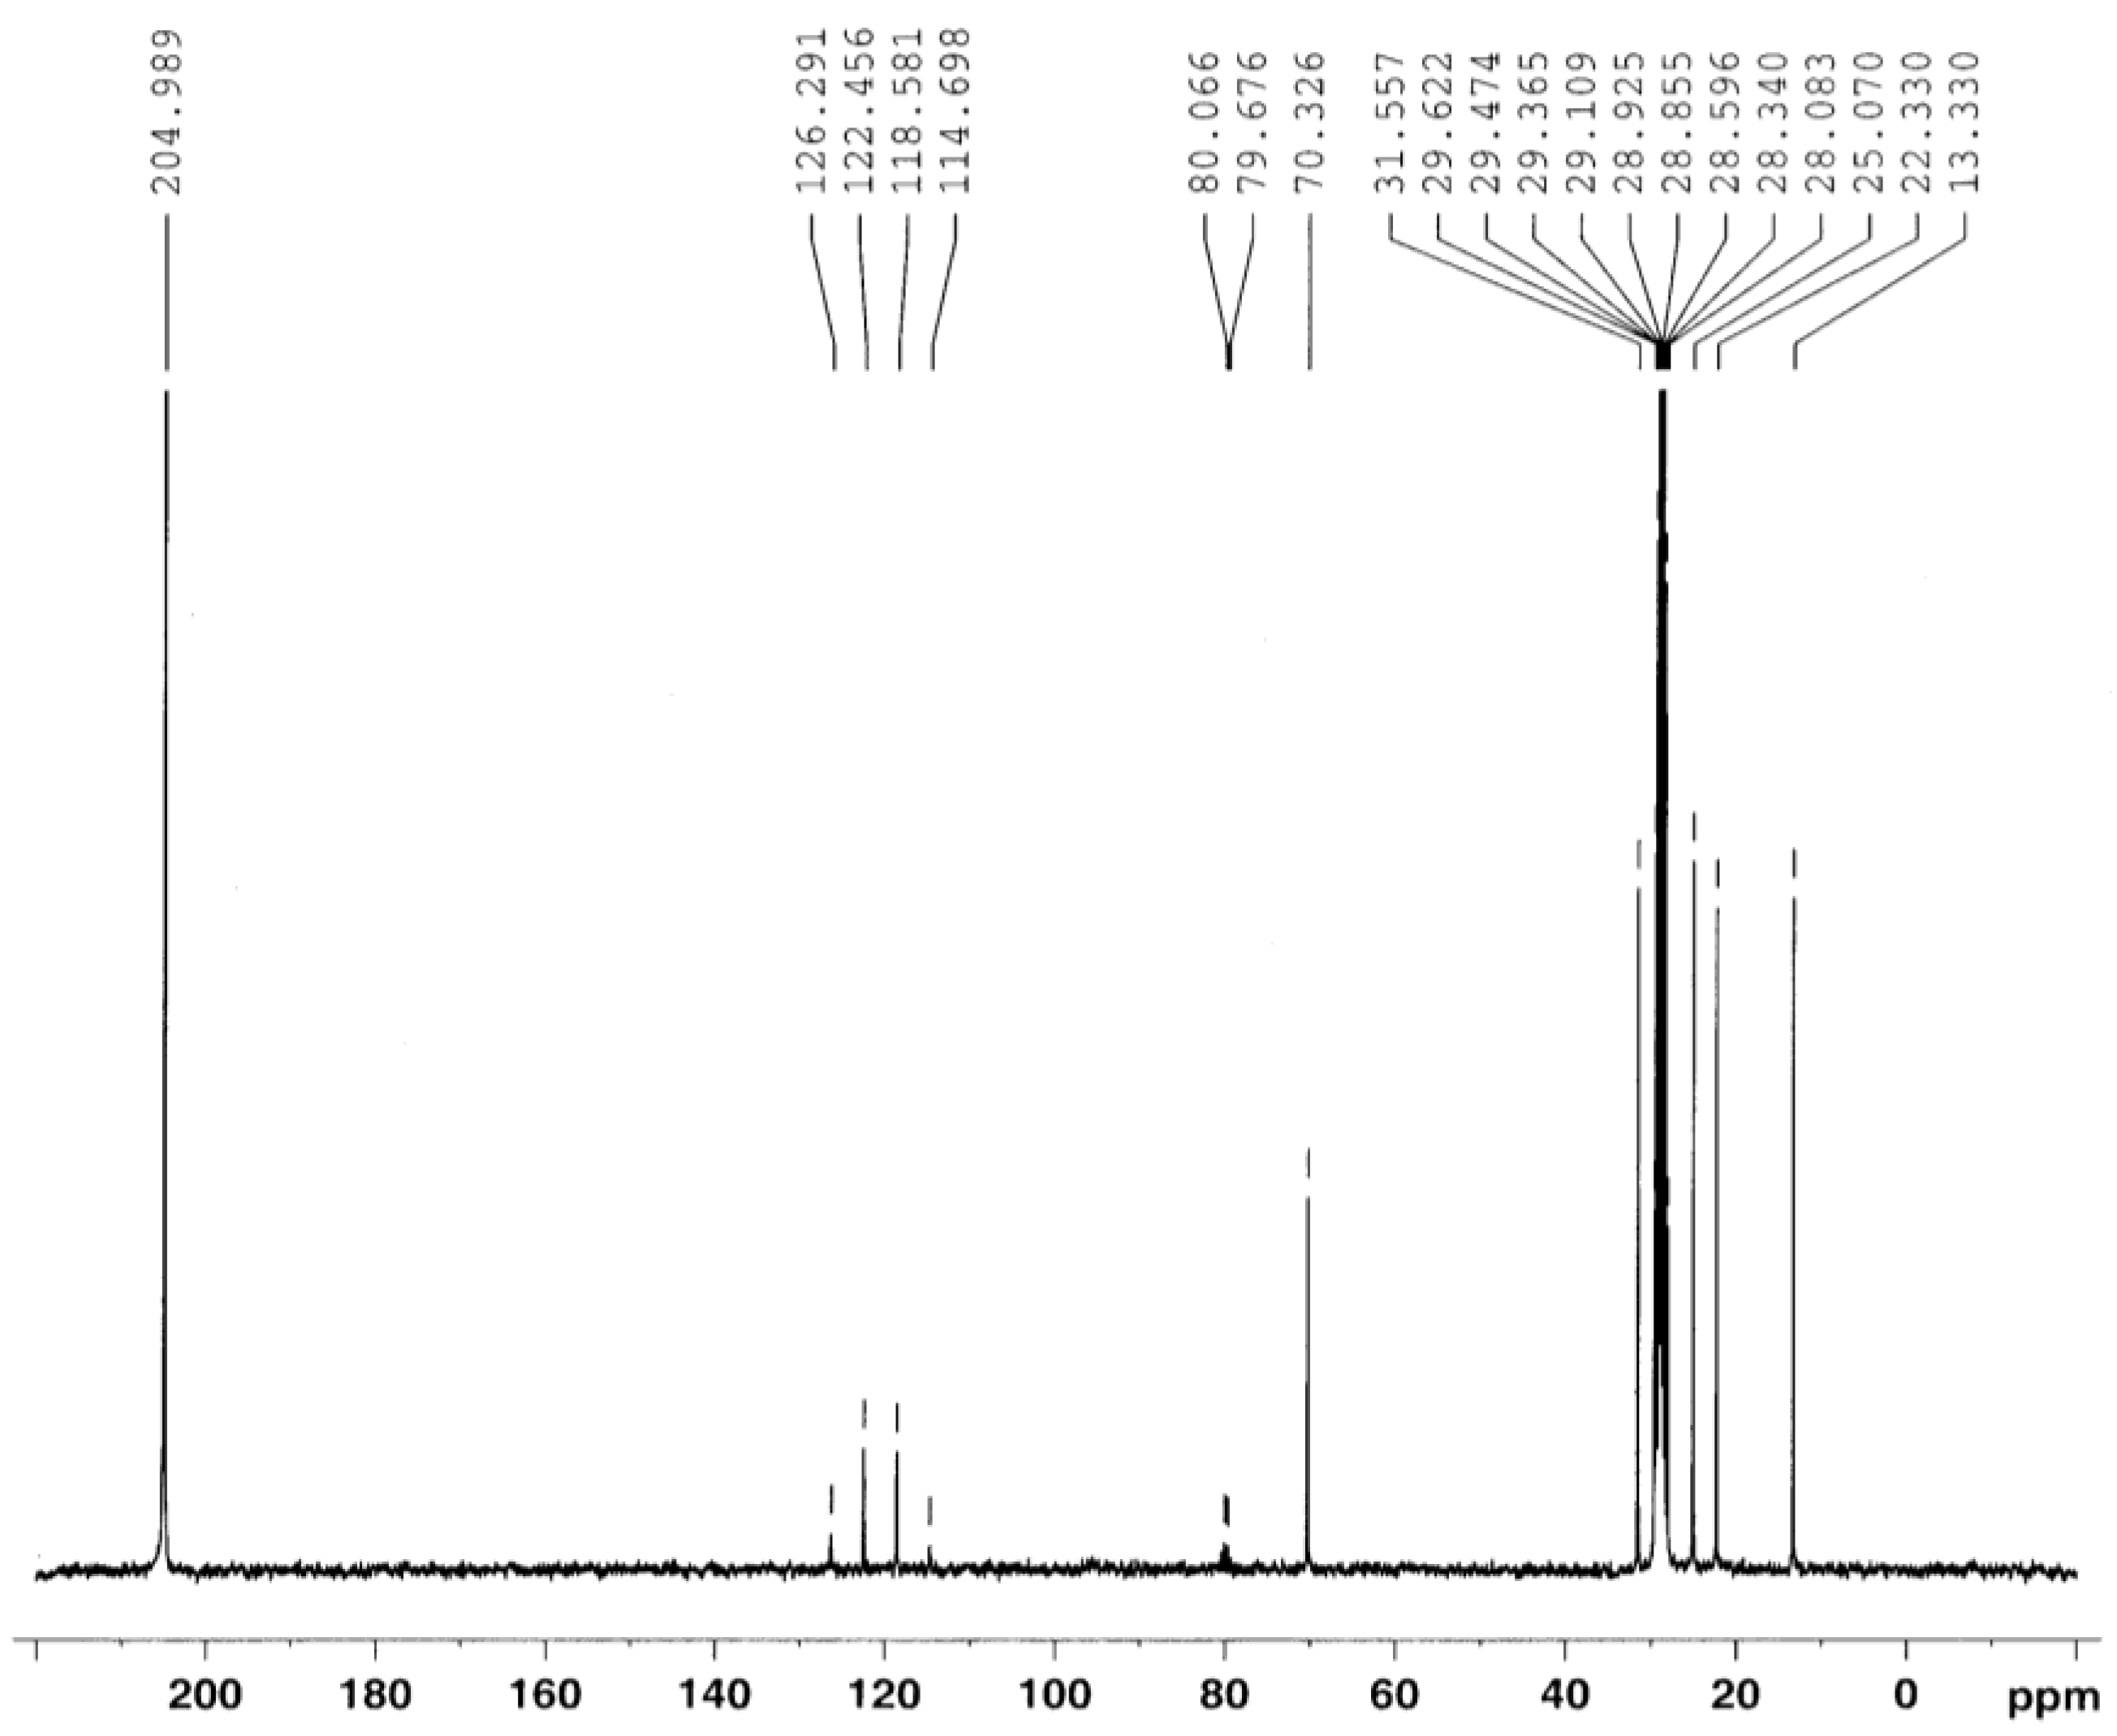
Synthesis of C8-PFTE (1-((1,1,1,3,3,3-hexafluoro-2-(trifluoromethyl)propan-2-yl)oxy)octane)

1H and 13C NMR spectra


| PFTE (mg/mL) emulsion | Before | After (media) | After (cells) | |||
|---|---|---|---|---|---|---|
| Diameter (nm) | PDI | Diameter (nm) | PDI | Diameter (nm) | PDI | |
| 0.5 | 128.3 | 0.158 | 124.8 | 0.131 | 135.6 | 0.135 |
| 1 | 132.9 | 0.118 | 129.7 | 0.161 | 137.8 | 0.161 |
| 2 | 138.1 | 0.154 | 135.3 | 0.115 | 140.6 | 0.138 |
| 4 | 135.3 | 0.137 | 140.3 | 0.121 | 141.3 | 0.134 |
| 8 | 142.1 | 0.18 | 142.8 | 0.119 | 146.1 | 0.134 |
© 2013 by the authors; licensee MDPI, Basel, Switzerland. This article is an open access article distributed under the terms and conditions of the Creative Commons Attribution license (http://creativecommons.org/licenses/by/3.0/).
Share and Cite
Patel, S.K.; Williams, J.; Janjic, J.M. Cell Labeling for 19F MRI: New and Improved Approach to Perfluorocarbon Nanoemulsion Design. Biosensors 2013, 3, 341-359. https://doi.org/10.3390/bios3030341
Patel SK, Williams J, Janjic JM. Cell Labeling for 19F MRI: New and Improved Approach to Perfluorocarbon Nanoemulsion Design. Biosensors. 2013; 3(3):341-359. https://doi.org/10.3390/bios3030341
Chicago/Turabian StylePatel, Sravan K., Jonathan Williams, and Jelena M. Janjic. 2013. "Cell Labeling for 19F MRI: New and Improved Approach to Perfluorocarbon Nanoemulsion Design" Biosensors 3, no. 3: 341-359. https://doi.org/10.3390/bios3030341