1. Introduction
Magnetic particles have many applications in biological research and are used very successfully as a solid phase to aid separation [
1]. Examples include the removal of tumour cells from bone marrow, isolation of T-cells, viruses and organelles. In immunoassays magnetic particles are used extensively as a solid phase e.g., Immulite Diagnostics Products Corporation, Siemens, Erlangen, Germany; FastPack, Qualigen, Carlsbad, CA and in molecular genetics in various kits for the isolation of nucleic acid. Recently attention has focused on using magnetic particles, ferromagnetic (permanently magnetized) or paramagnetic particles (PMP) (magnetic only when in a magnetic field), as labels that are detected directly by virtue of their magnetic properties. Magnetic particles have a number of advantages in use as labels in immunoassays including their stability and that they are not affected by the sample matrix. These properties are particularly suitable for labels used in the development of point-of-care tests.
Paper-based point-of-care diagnostics including lateral flow assays are affordable, user friendly, rapid, robust and scalable for manufacturing. Lateral flow assays have a large potential for use by unskilled personnel in a wide variety of settings including those that are resource-limited [
2]. Lateral flow devices have been previously modified such that a wide variety of sample types can be evaluated. In addition the automation of production is well supported and cost of test strips is very low. This makes the combination of a lateral flow assays for use with magnetic particles an attractive proposition for development.
Lateral flow assays have been quantified using a range of techniques [
3]; however optical methods have a disadvantage in that they measure only those particles present on the membrane surface. In contrast the Resonant Coil Magnetometer (RCM) will measure particles present in the antibody (Ab) capture line throughout the membrane. The results are therefore truly quantitative of the whole test not only the proportion detected on the surface of the LF strip. Additional advantages are that the label is stable and therefore LF strips can be reanalyzed if required. For chemiluminescent labels the label is consumed when the chemical reaction takes place so no further measurements are possible. Although fluorescent labels can be re-stimulated and multiple measurements made in a short time period to improve the measurement signal to noise ratio, many fluorescent labels decompose on prolonged re-stimulation because of photo-bleaching.
A range of sensors have been developed by commercial and research groups to quantify magnetic particles for example MagnaBioSciences, LLC, Quantum Design, San Diego, CA, USA [
4], LifeAssays AB, Lund, Sweden [
5], Senova Immunoassay Systems, Jena, Germany [
6], Magnotech, Philips, Amsterdam, The Netherlands [
7], Magnisense, Paris, France [
8] and MagArray Inc., Sunnyvale, CA, USA [
9]. A number of Giant Magnetoresistance based (GMR) sensors are being developed as fully integrated systems which can detect a small number of PMPs [
10]. The RCM measurements are produced from the interaction of many PMPs; this means that the results will not be influenced by variability in PMP size or magnetite concentration that devices that measure few particles could be susceptible to [
11]. In addition only PMPs that are non-aggregated can flow through nitrocellulose membranes and give results at the test and control line. In contrast PMPs in solution will still give results, however the data may be variable dependent on the level of aggregation present and therefore this needs to be monitored, particularly during conjugation to the biological recognition element. A review of GMR sensors in development [
12] describes the use of PMPs 40–2800 nm by this technique and the need to maintain PMPs in a mono-dispersed non-aggregated state. The data show a relatively narrow range of size distribution; however the presence of even doublet or triplet PMPs may cause variability in results. In CMOS Hall sensors the resulting bead signal is very small; this is managed by the use of miniaturized Hall-effect sensors which can be prone to problems from fabrication imperfections such as contact misalignment [
13]. For GMR sensors the sensing spot has a very small footprint and can detect single beads if they are very closely connected with the sensor. This would be difficult to achieve for a relatively widespread line of PMPs diffused through the lateral flow strip. Our, relatively simple and cheaper arrangement measures the changes in a perturbed high frequency inductive field, and does not have to be so precisely aligned, making the mechanics less critical and expensive.
The RCM is capable of detecting PMPs of a wide range of sizes and commercial suppliers from 2.8 µm to 0.250 µm [
14]. GMR and Hall sensors can also detect a range of PMP sizes but individual sensors cannot detect the full range of PMPs, the RCM therefore has flexibility with the size of PMP used [
14]. As the RCM is not fully integrated this device also has flexibility in the type of immunoassay conducted. The main advantages of the RCM device in comparison with GMRs and CMOS Hall sensors is in the speed of the assay time, with RCM measurements being collected over 1–2 min [
14] the cost of the device, with component parts estimated at approximately $100 and the applicability of the sensor to be a hand-held device [
11]. A detailed review of the merits of different magnetic sensors is described elsewhere [
10,
11].
Much debate exists over the usefulness of prostate specific antigen (PSA) as a biomarker for the detection of prostate cancer, however the data suggest that it can provide useful information in assisting in the diagnosis of this disease with PSA concentrations 4–10 ng/mL having a 25% positive predictive value, to greater than 80% in men with a PSA >20 ng/mL [
15]. In this study we investigate the development of magneto-immunoassays in lateral flow format with PMPs as labels to quantify total prostate specific antigen (PSA
T). The aim of this investigation is to demonstrate that the RCM can be used to quantify analytes in immunoassays in lateral flow format giving the potential for performing PSA
T assays in the doctors’ surgery.
The RCM is a sensor developed at the University of The West of England to quantify PMPs [
14,
16], This sensor has the potential to be developed as an inexpensive device for use in the field or at the point-of-care. The RCM is based on a Frequency Locked Loop design. The original observations reported an RCM with a helical coil, further work with oval and rectangular coils [
17] showed a direct correlation between number of PMPs and decrease in the measured resonant frequency. It has also been shown experimentally that a single hand-wound flat spiral coil produces a linear decrease in resonant frequency when an increasing number of PMPs are placed next to it [
18].
From the formula shown below Equation (1), for a resonant tuned circuit that is tuning a Voltage Controlled Oscillator (VCO), it can be seen that the higher the resonant frequency (F), and the smaller the inductance of the coils (L) in relation to the value of the capacitance (C), very small changes in inductance due to PMPs would result in large changes in frequency.
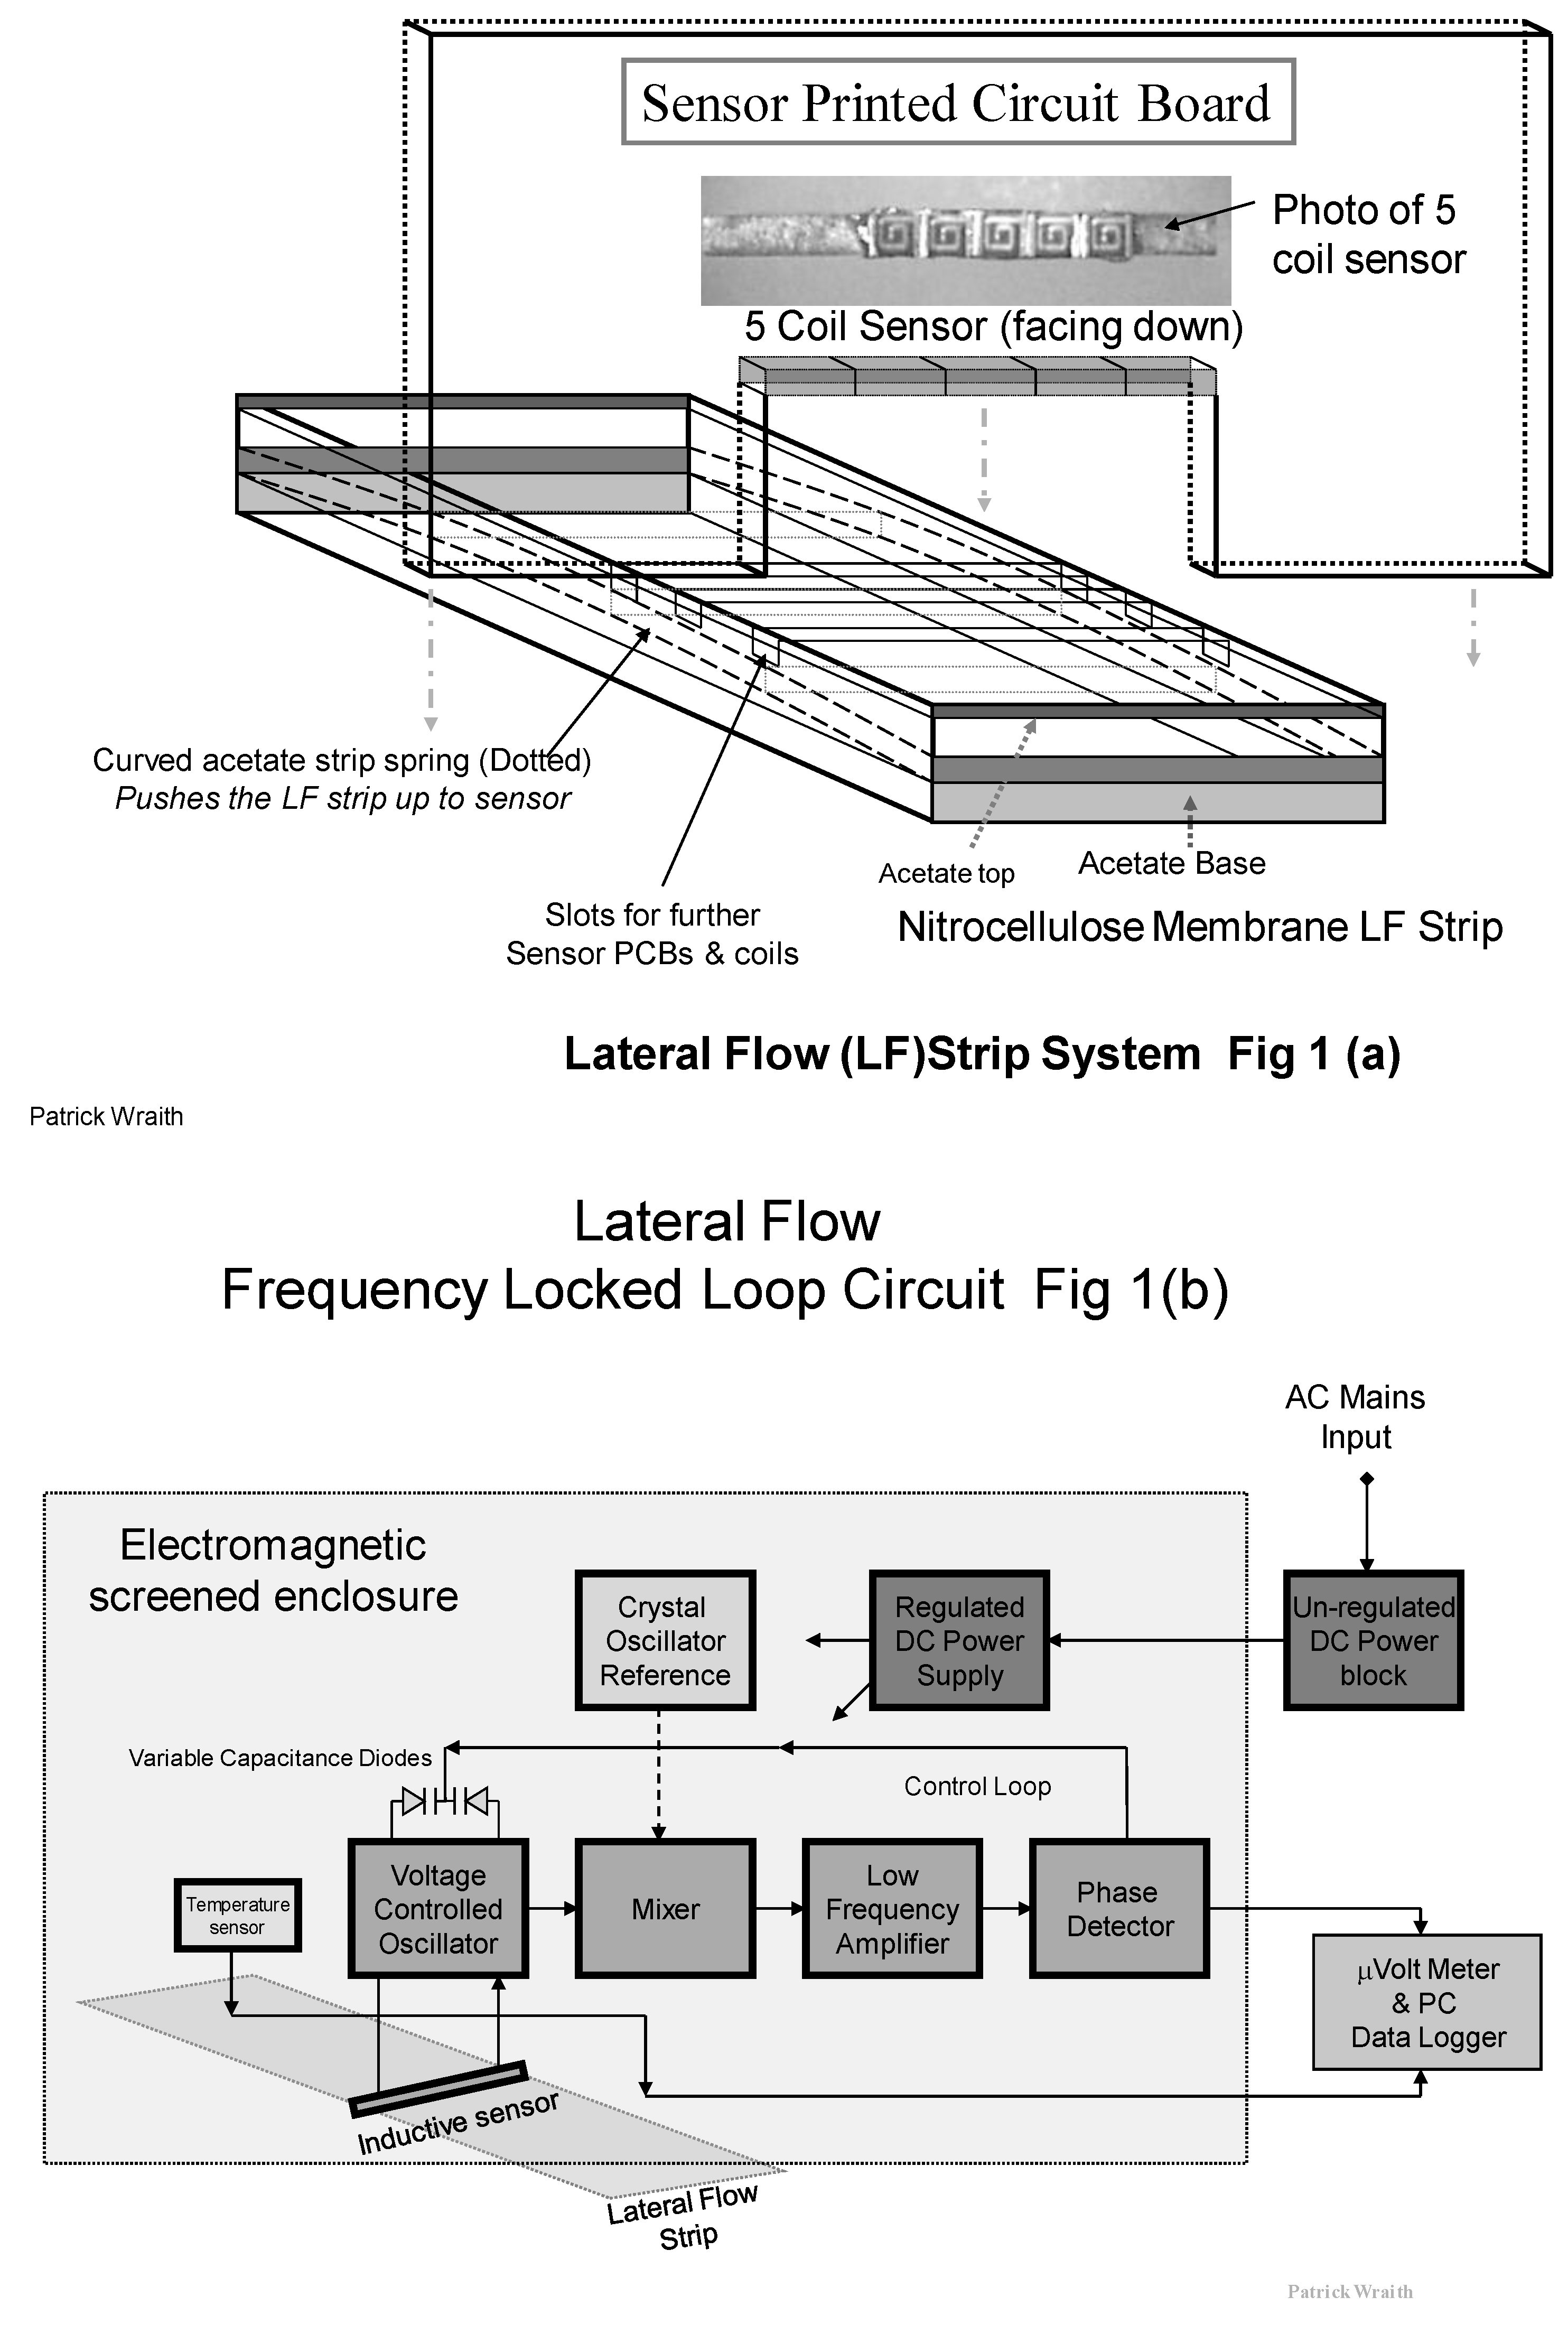
The prototype RCM for use with lateral flow assays used in this study is based upon a
Frequency
Locked
Loop circuit shown in
Figure 1b, where the Very High Frequency (VHF) Voltage Controlled Oscillator (VCO) is pulled into frequency lock with a crystal controlled fixed reference signal. An inductive sensor forms the tuning inductance of the VCO along with associated. The crystal reference oscillator produces a very stable signal at 60 MHz. This VCO signal at 59.94 MHz and the reference signals at 60 MHz are mixed together at VHF to produce a very
Low difference
Frequency of 60 KHz. This LF contains the same variations as those produced by the small changes in inductance at VHF due to the PMPs. If a sample strip with paramagnetic particles influences the sensor, the field permeability of the associated field and the sensor inductances are very slightly increased. This tends to decrease the VCO frequency, resulting in a corresponding increase in the LF. A positive Direct Current (DC) error voltage is produced from the phase detector, and this DC is applied back to the variable-capacitance diodes to increase the VCO frequency back to normal lock with the crystal reference. This frequency correction is done within milliseconds and the Frequency Locked Loop is continuously tracking the crystal reference. It is the change in DC that is a measure of the PMPs present on the test and control lines in the nitrocellulose membrane strip and is measured on a Milli-Voltmeter and data logger.
The sensitivity of this system is such that the frequency changes occurring at the Radio Frequency around 60 MHz are only of a few KHz or less. This is a change of frequency in the order of only 0.0016% and is difficult to detect By converting the RF to a very low frequency using a Radio Frequency Mixer stage to heterodyne the crystal Reference and the VCO frequencies together, the (low) difference frequency, applied to a phase (PD) detector circuit, produces a DC error voltage that delivers the measured sensor output changes relative to the quantity of PMPs.
The frequency and phase shift is now 1000 times larger in relation to the LF, than it was at VHF i.e., 1.6%, thus greatly improving the signal to noise ratio of the electrical signals, and improving the possible detection resolution. The low frequency signal is also amplitude limited prior to the Phase Detector, to remove any variations in signal strength and remove impulse noise before detection. This is further improves on the detection resolution. This magnetic sensor is sensitive to changes in the order of femto-henries. There may be small temperature fluctuations due to dimensional changes and for this reason a temperature sensor is mounted nearby in order to create a DC reference which changes in proportion to this variation and provides a more temperature stable differential voltage measurement to the micro-voltmeter and logging Personal Computer (PC).
The VCO frequency stability is sensitive to supply variations, so a DC voltage regulator circuit is included to stabilize the supply from an external AC to DC Mains power block.
The Frequency Locked Loop (FLL) circuit is built on a vertically mounted Printed Circuit Board (PCB) such that the inductive sensor coils are located across the top of the strip. See
Figure 1a. The inductance (L) of the resonant VCO tuned circuit is shared between five tiny surface mount inductors, rather than a single coil, to spread the field pattern across the capture line of PMPs.
The strip is inserted into the rectangular slide, and a flattened loop of acetate strip is used as a spring to push the PMP capture line upward onto the lateral flow strip into critically precise proximity to the inductive field from the surface mount coils. This design of sensor produces a rectangular “curtain” sense field which closely and efficiently matches the width and length of the PMP line.
As a result of this “curtain field” pattern the RF radiation of the field does not extend far outward along the strip. This arrangement may allow us to co-locate duplicate FLL sensor circuits along the strip for simultaneous measurement from other capture lines such as for reference purposes, without RF interference between the circuits. A diagram showing the RCM design used in this study is shown in
Figure 1a.
Figure 1.
(a) Diagram of the five coil surface mount sensor and its location and assembly in the Resonant Coil Magnetometer (RCM); (b) Diagram of the Phase Locked Loop (FLL) circuit used with the RCM with the inductive sensor comprised of an array of five flat spiral coils.
Figure 1.
(a) Diagram of the five coil surface mount sensor and its location and assembly in the Resonant Coil Magnetometer (RCM); (b) Diagram of the Phase Locked Loop (FLL) circuit used with the RCM with the inductive sensor comprised of an array of five flat spiral coils.
2. Experimental Section
2.1. Materials
PMPs are available from several manufacturers in a range of sizes from a few nanometers to several microns. The PMPs used throughout this study were 760 nm carboxylic acid modified particles obtained from Seradyn Inc., Indianapolis, IL, USA. The primary protein layer used to prepare the PMP conjugate was goat anti-mouse antibody purchased from Dako, UK, Ltd., Ely. Monoclonal antibodies for total PSA (total PSA capture antibody, PSATCAPTURE and PSA detecting antibody PSATDETECTION) were supplied as a gift by Randox Laboratories Ltd. (Crumlin, County Antrim, Northern Ireland). The control line rabbit anti-mouse antibody was purchased from Dako Ltd., Ely, Cambridgeshire, UK.
Lateral flow assays for total PSA were calibrated with the WHO international standard preparation of total PSA 96/670 (PSAT), National Institute for Biological Standards and Control (NIBSC), Potters Bar, Hertfordshire, UK. Twenty five serum samples from anonymous patients were obtained from a urology out-patients clinic (Bristol Royal Infirmary), stored at 4 °C and tested within two weeks in the magneto-immunoassay for total PSA. Approval was obtained from the Central and South Bristol Ethics Committee (05/Q2006/57) and from the UWE (University of The West of England, Bristol, UK) ethics committee (221) to enable the collection and testing of the serum samples. Control HIV negative human AB male serum was purchased from BioWest Ltd., East Sussex, UK.
The Immulite total PSA assay (Catalogue number L2KPS6) was performed on an Immulite 2000 Analyser (Diagnostic Products Corporation, DPC, Los Angeles, CA, USA). This is a sandwich immunoassay where the solid phase bound complex is detected by the addition of a chemiluminescent substrate, measured using the Immulite 2000 Analyzer.
The FastPack PSA assay is a sandwich immunoassay with a chemiluminescent label where antibody coated PMPs are used to facilitate the washing steps. The label is quantified using the FastPack bench top analyser (Qualigen Inc, Carlsbad, CA, USA).
2.2. Resonant Coil Magnetometer (RCM)
Voltage readings in millivolts (mV) were taken with the surface mounted resonant coil magnetometer (RCM) using a voltage meter (Thurby Thander Instruments, S.J. Electronics, Telford Way Industrial Estate, Kettering, Essex, UK). Magnetometer readings were taken every ten seconds for 100 s for each membrane without PMPs and every ten seconds for 100 s with PMPs at the test line and control line.
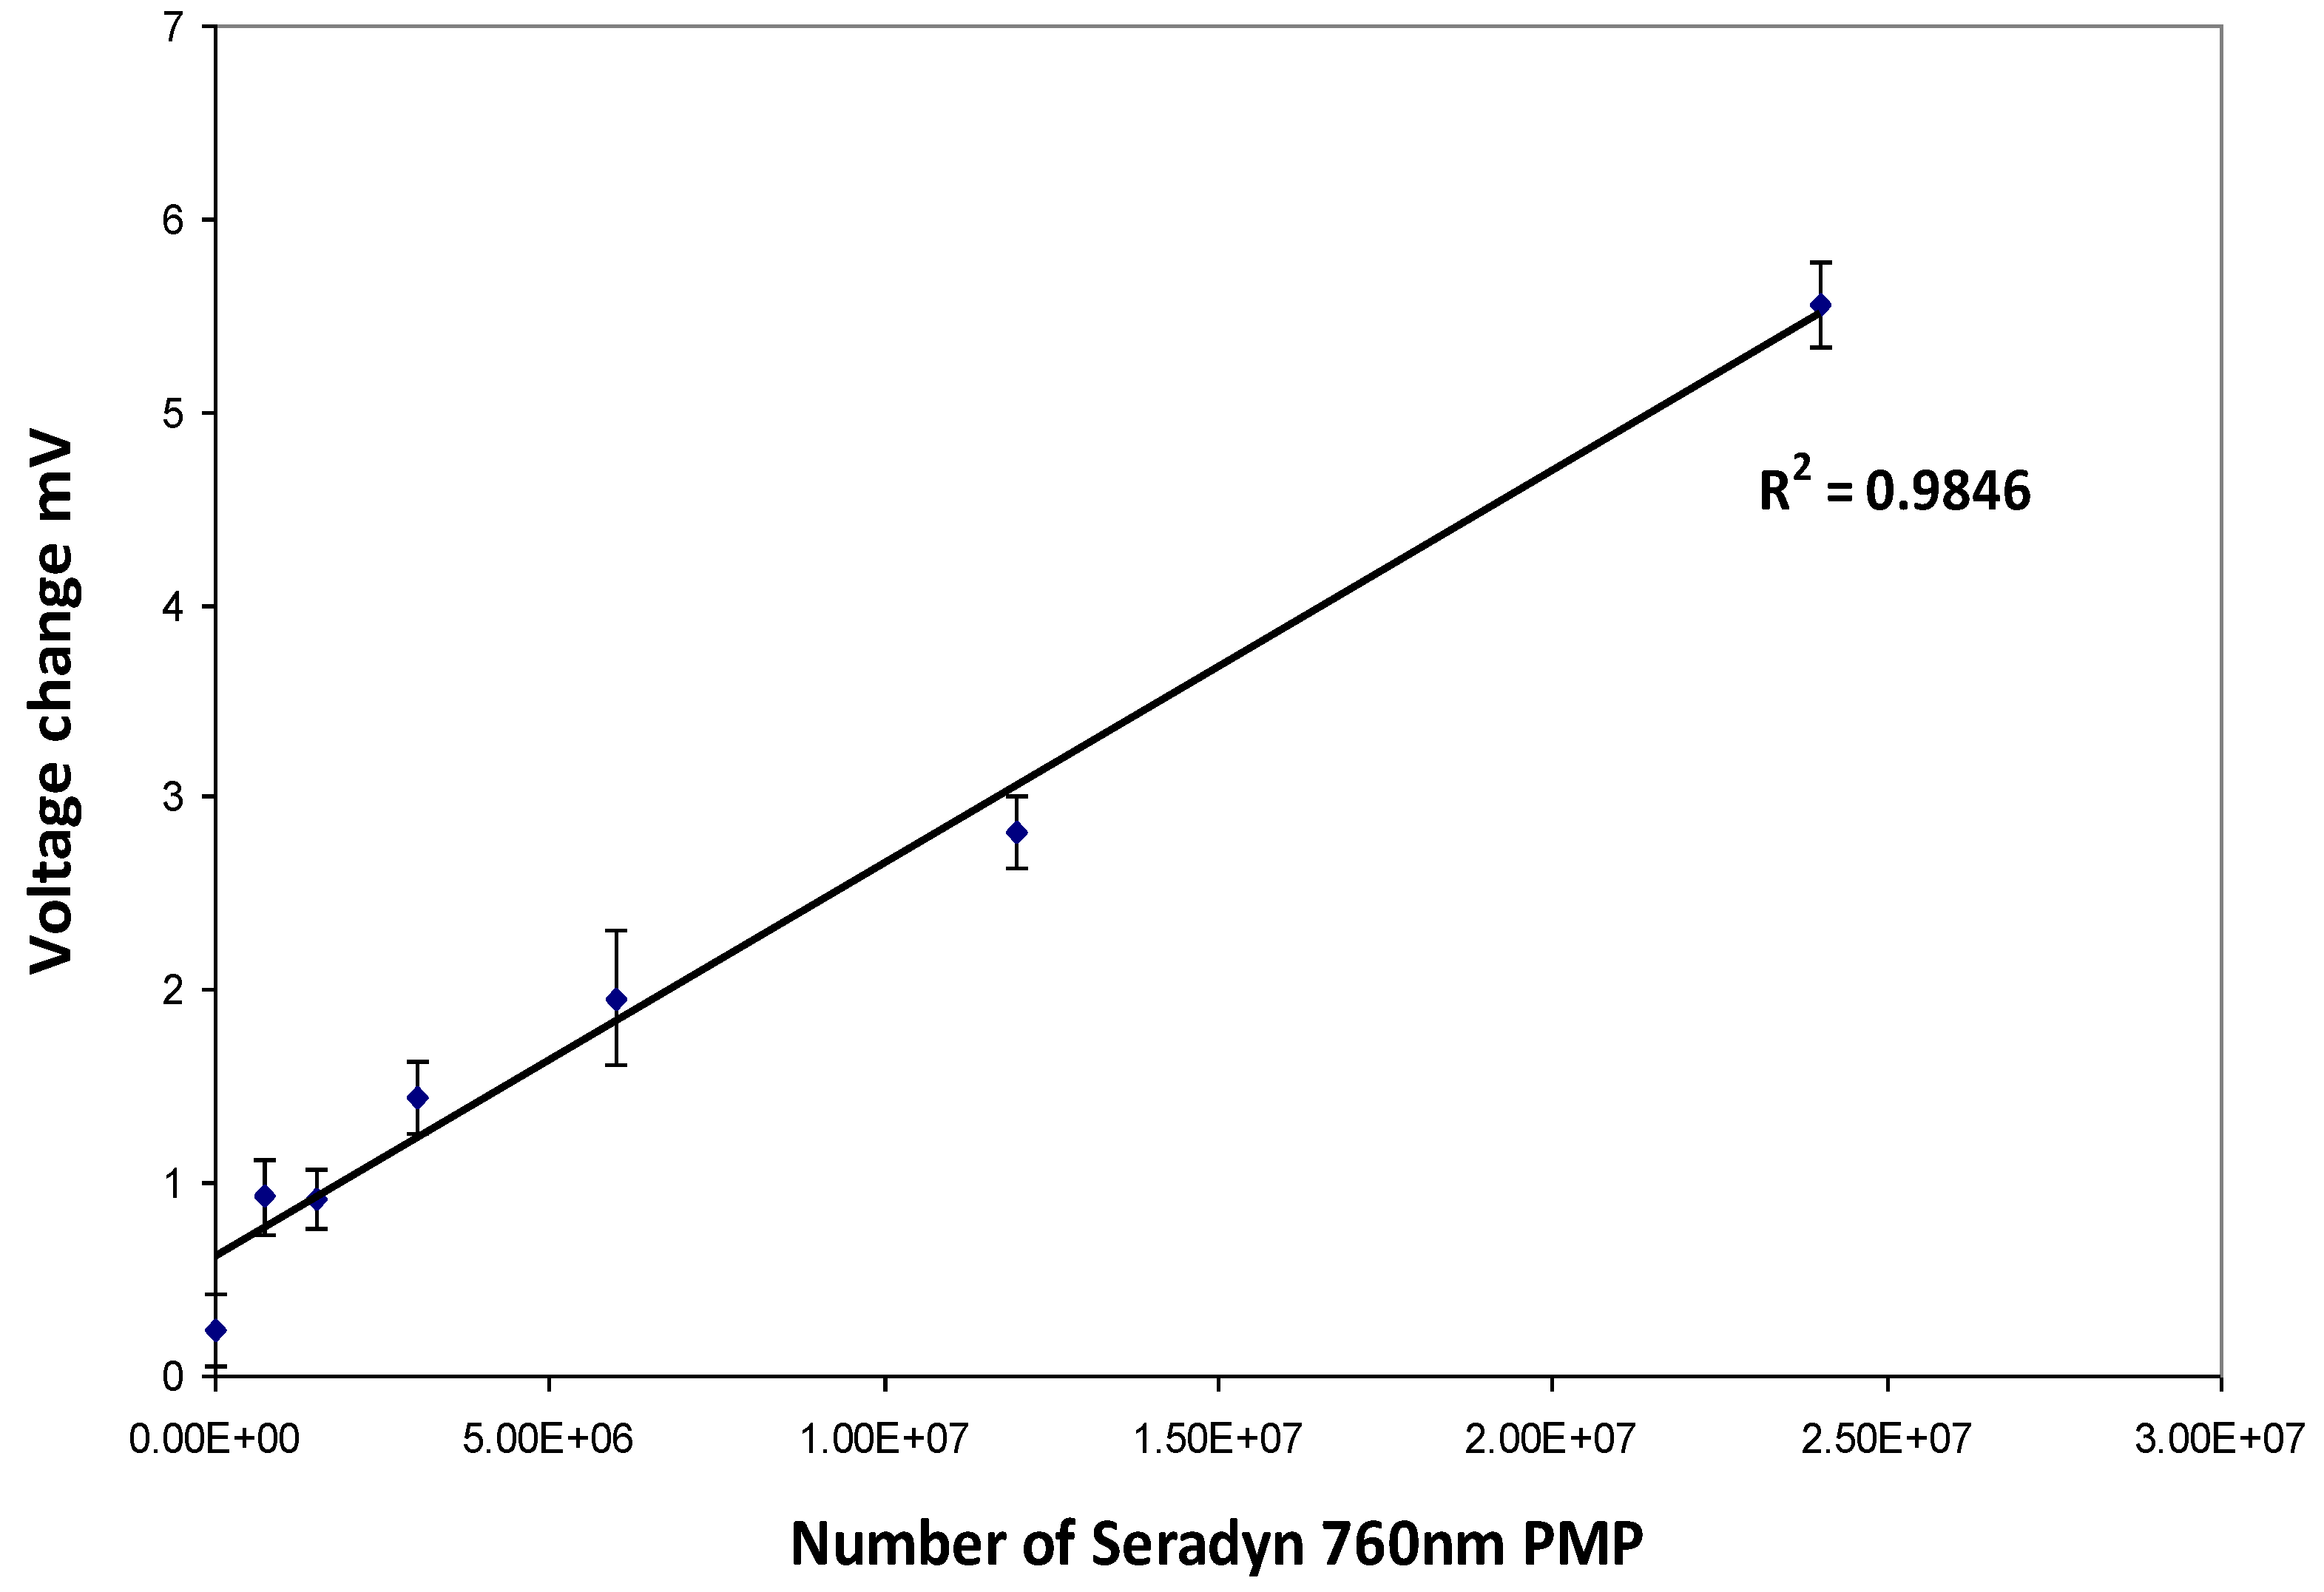
2.3. Deposition of Naked Particles on Nitrocellulose Membranes
Strips with a range of Seradyn 760 nm PMP dilutions were prepared with a BioDot AD3200 (BioDot Ltd., Kingley Centre, Chichester, UK) by non-contact deposition. PMPs were dispensed at a rate of 1.7969 µL/cm. Calibration curves were produced by plotting particle numbers against change in voltage (mV) measured using the RCM.
2.4. Lateral Flow Assay for Total PSA and Free PSA
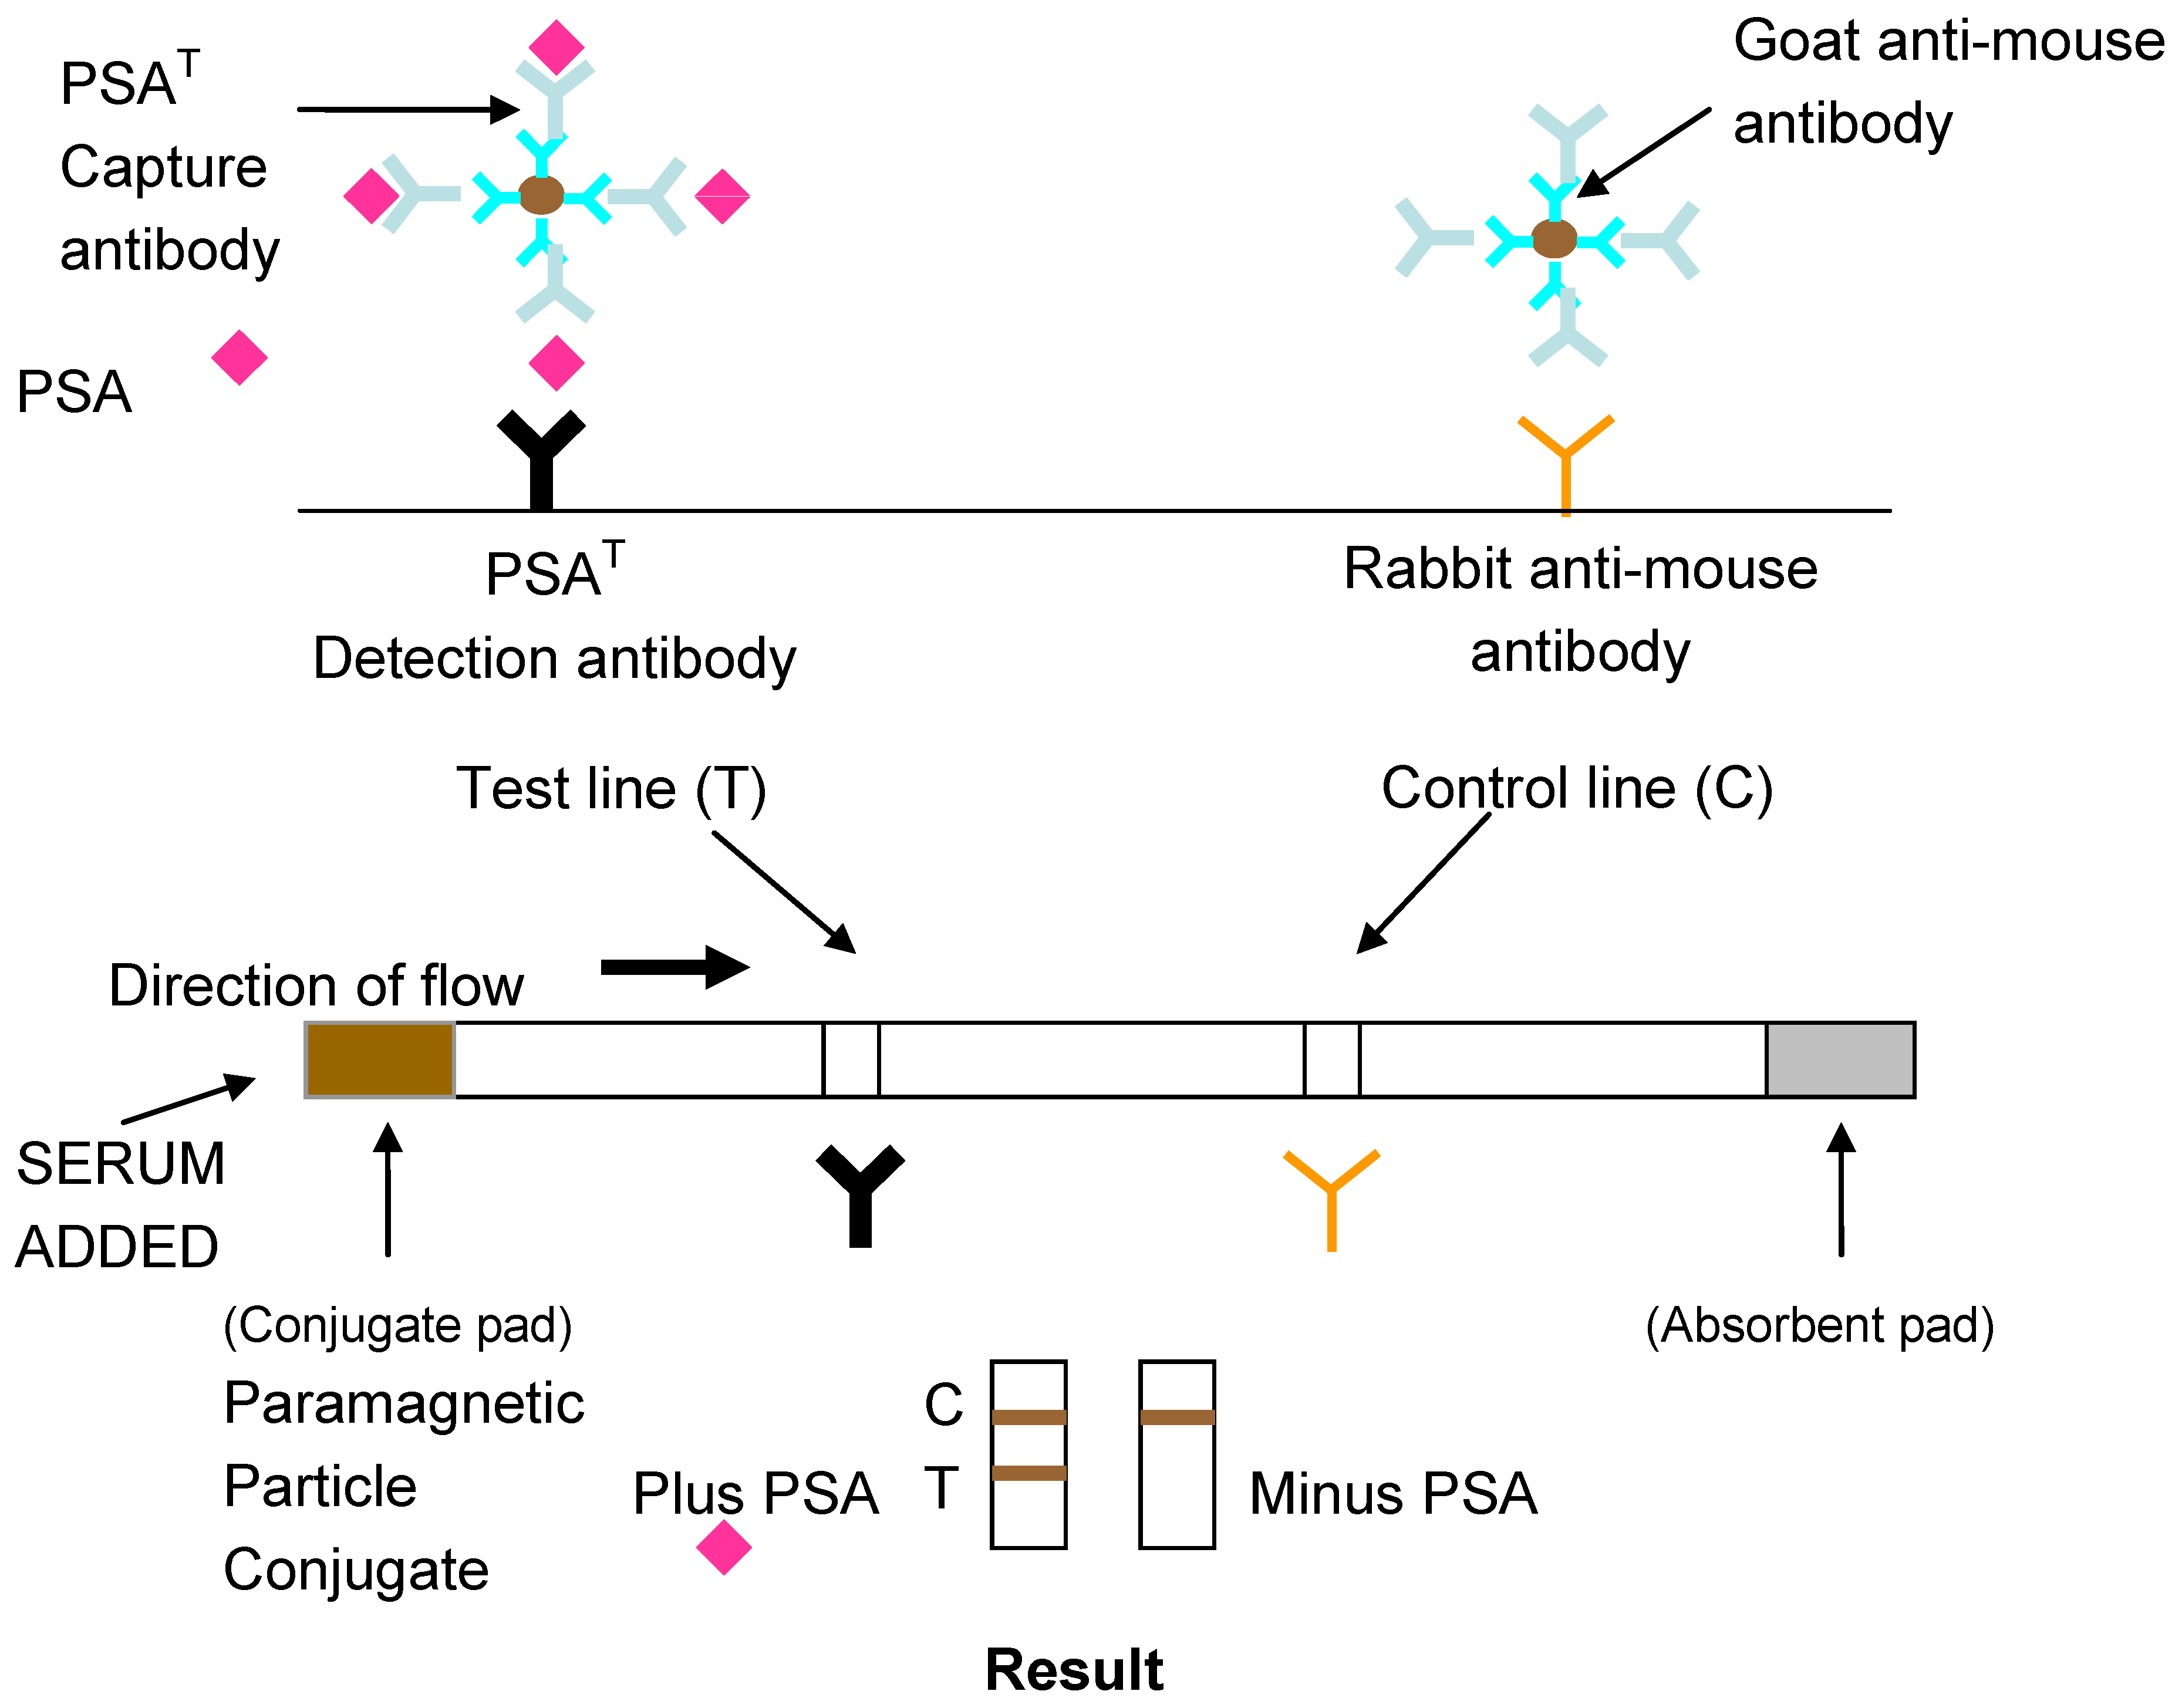
The development of lateral flow assays to detect specific epitopes of an antigen is possible with the use of monoclonal antibodies to prepare the conjugate and antibody capture lines. A layer of anti-mouse antibody was absorbed on the conjugate to ensure the correct orientation of the capture antibody on the PMPs. Previous work has shown this to increase the detection sensitivity of lateral flow assays [
19]. A schematic diagram of the design of the lateral flow assay for total PSA using monoclonal antibodies is shown in
Figure 2.
Figure 2.
Lateral flow Magneto-immunoassay for Total or Free Prostate Specific Antigen (PSA).
Figure 2.
Lateral flow Magneto-immunoassay for Total or Free Prostate Specific Antigen (PSA).
2.4.1. Antibody Conjugation to PMP
The passive adsorption of monoclonal antibody to PMPs was carried out as a two-step process using an adaptation of a protocol for passive adsorption described by Interfacial Dynamics (IDC, Molecular Probes Inc., Eugene, OR, USA). All washes were performed using a Dynal magnetic separator (Dynal MPC-S, Dynal Biotech UK, Bromborough, Wirral). Firstly goat anti-mouse IgG (Dako, UK, Ltd., Ely) was adsorbed. The PMPs (5 mg containing approximately 1 × 10⁹ PMPs) were washed twice using the 1 mL of 0.025 M MES (2-[N-Morpholino] ethanesulfonic acid buffer), (Sigma-Aldrich, Poole, Dorset), pH 6.3 and resuspended in 0.5 mL of the same buffer. The PMP solution was sonicated with three bursts of 2 s; setting 6 of a MSE Soniprep 150 sonicator (Henderson Biomedical Ltd., Lower Sydenham) to ensure that the particles were mono-dispersed. Goat anti-mouse IgG, 40 µL (equivalent to 56 µg) was then added to the particles in 0.5 mL of 0.025 M MES buffer pH 6, the solution was then incubated at room temperature (RT) overnight with continuous mixing.
The supernatant was removed and the PMPs were washed twice with 1 mL of 0.025 M MES buffer pH 6.3 (Sigma-Aldrich, Poole, Dorset) and resuspended in 0.5 mL of the same buffer. The supernatant, containing excess anti-mouse IgG and 50 µL of the resuspended goat anti-mouse conjugated PMPs were kept for protein analysis using the BCA protein assay [
20].
PSA capture antibody 20–80 µL (46–184 µg) was added to the remaining goat anti-mouse conjugated PMPs and the solution was then incubated at room temperature overnight with continuous mixing. The PMPs were then washed ×2 in phosphate buffered saline (PBS), pH 7.2 and resuspended in 0.5 mL of storage buffer, 0.1 M PBS/0.1% glycine/0.1% sodium azide. The supernatant, washes and 50 µL of the goat anti-mouse/monoclonal antibody conjugated PMPs were kept for analysis in the BCA protein assay (Pierce Chemical Company, Rockford, IL, USA). Fifty microlitres of 10% sterile BSA was then added to the conjugate to produce a final concentration of 1% BSA for storage purposes.
2.4.2. Preparation of Nitrocellulose Membranes
Test and control lines were prepared using nitrocellulose membrane HF07504 (Millipore Corporation, Billerica, MA, USA) which has a nominal pore size of 13–17 μm. Two antibody lines were deposited onto each membrane. The deposition of antibody lines was undertaken using mechanical deposition using the BioDot AD 3200. Antibody dilutions were prepared in PBS containing 1% BSA.
After antibody deposition, membranes were blocked in PBS/1% BSA for 20 min, washed three times in PBS and soaked in PBS for at least 30 min. The glass fiber conjugate pad (Millipore Corporation, Billerica, MA, USA) was also blocked in PBS/1% BSA for 20 min prior to use.
Once blocked in PBS/1% BSA, the lateral flow assay was constructed by hand as follows, membranes were placed onto backing card (Schleicher & Schuell, Dassel, Germany) containing a layer of adhesive which secured the prepared nitrocellulose membrane in position. The adhesive layer was protected by a layer of waxed paper which could be removed in sections to enable accurate positioning of the lateral flow assay components. The blocked conjugate pad and the absorbent pad (Millipore Corporation, Billerica, MA, USA) were placed on the backing card after removal of additional sections of the waxed paper so that they overlapped the nitrocellulose membrane by 1–2 mm. The prepared lateral flow material was marked into 0.9 cm widths and cut into strips using a sharp pair of scissors.
2.4.3. Lateral Flow Assay
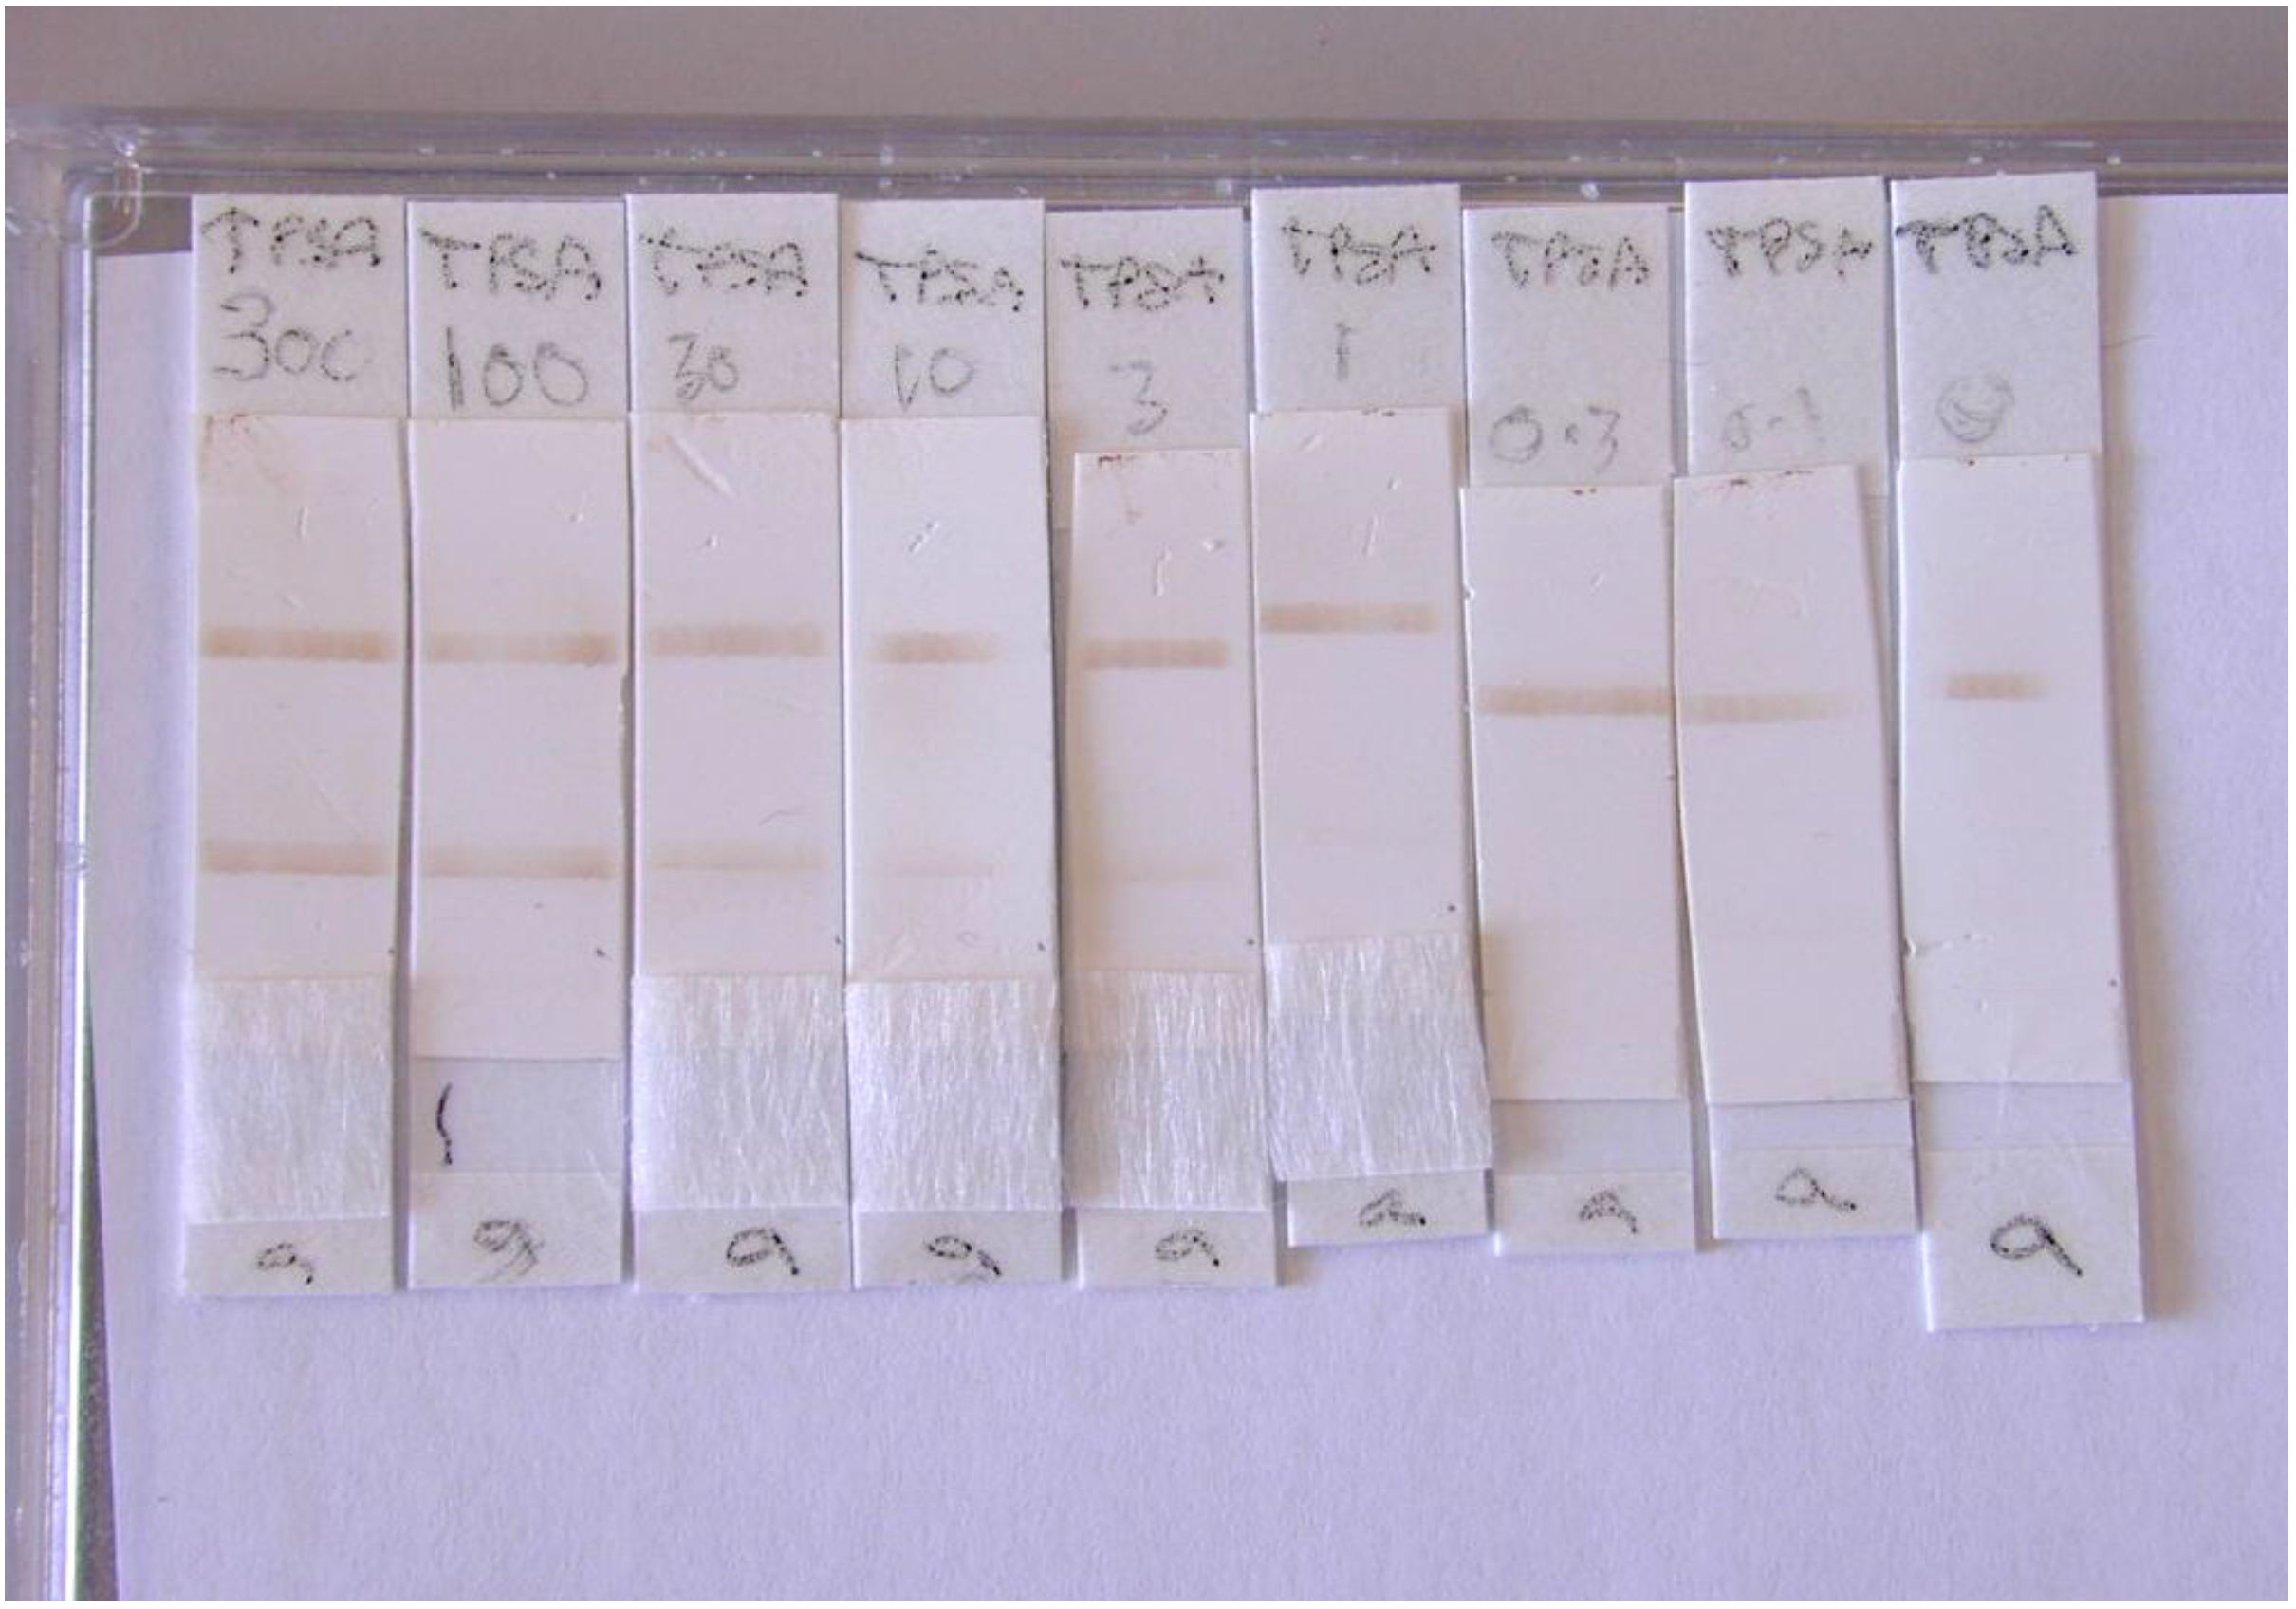
A range of total PSA96/670 (PSAT) concentrations 300 to 0.01 ng/mL were prepared by dilution in PBS/1% BSA/0.05% Tween 20, a different dilution was applied to each lateral flow assay strip. In each assay, 5 μL of PMP conjugate containing approximately 5 × 10⁶ PMPs was added to the conjugate pad followed immediately with 60 µL of PSAT standard. The assay was stopped after 5 min once all visible conjugate had flowed through the membrane past the test and control lines by removal of the wicking pad.
Multiple lateral flow assays for total PSA were performed (n = 3) and measurements at the control and test capture lines were made using the RCM and scanning densitometer (Shimadzu Dual Wavelength Flying Spot Scanning Densitometer, Manchester, UK) in comparison to control membrane without PMPs.
2.4.4. Scanning Densitometer
An initial wavelength scan performed with PMPs identified the optimum absorbance for PMPs to be 380 nm, therefore all lateral flow strips were scanned at this wavelength. The peak height values at test and control lines were measured for each LF assay strip.
2.4.5. RCM
The voltage response was logged and the change in voltage was determined by Equation (2). As described in [
14].
where V1 is the average voltage of reading taken every ten seconds for 100 s for each membrane without PMPs and V2 is the average voltage reading taken every ten seconds for 100 s with PMPs at the test line or control line.
2.4.6. Data Manipulation
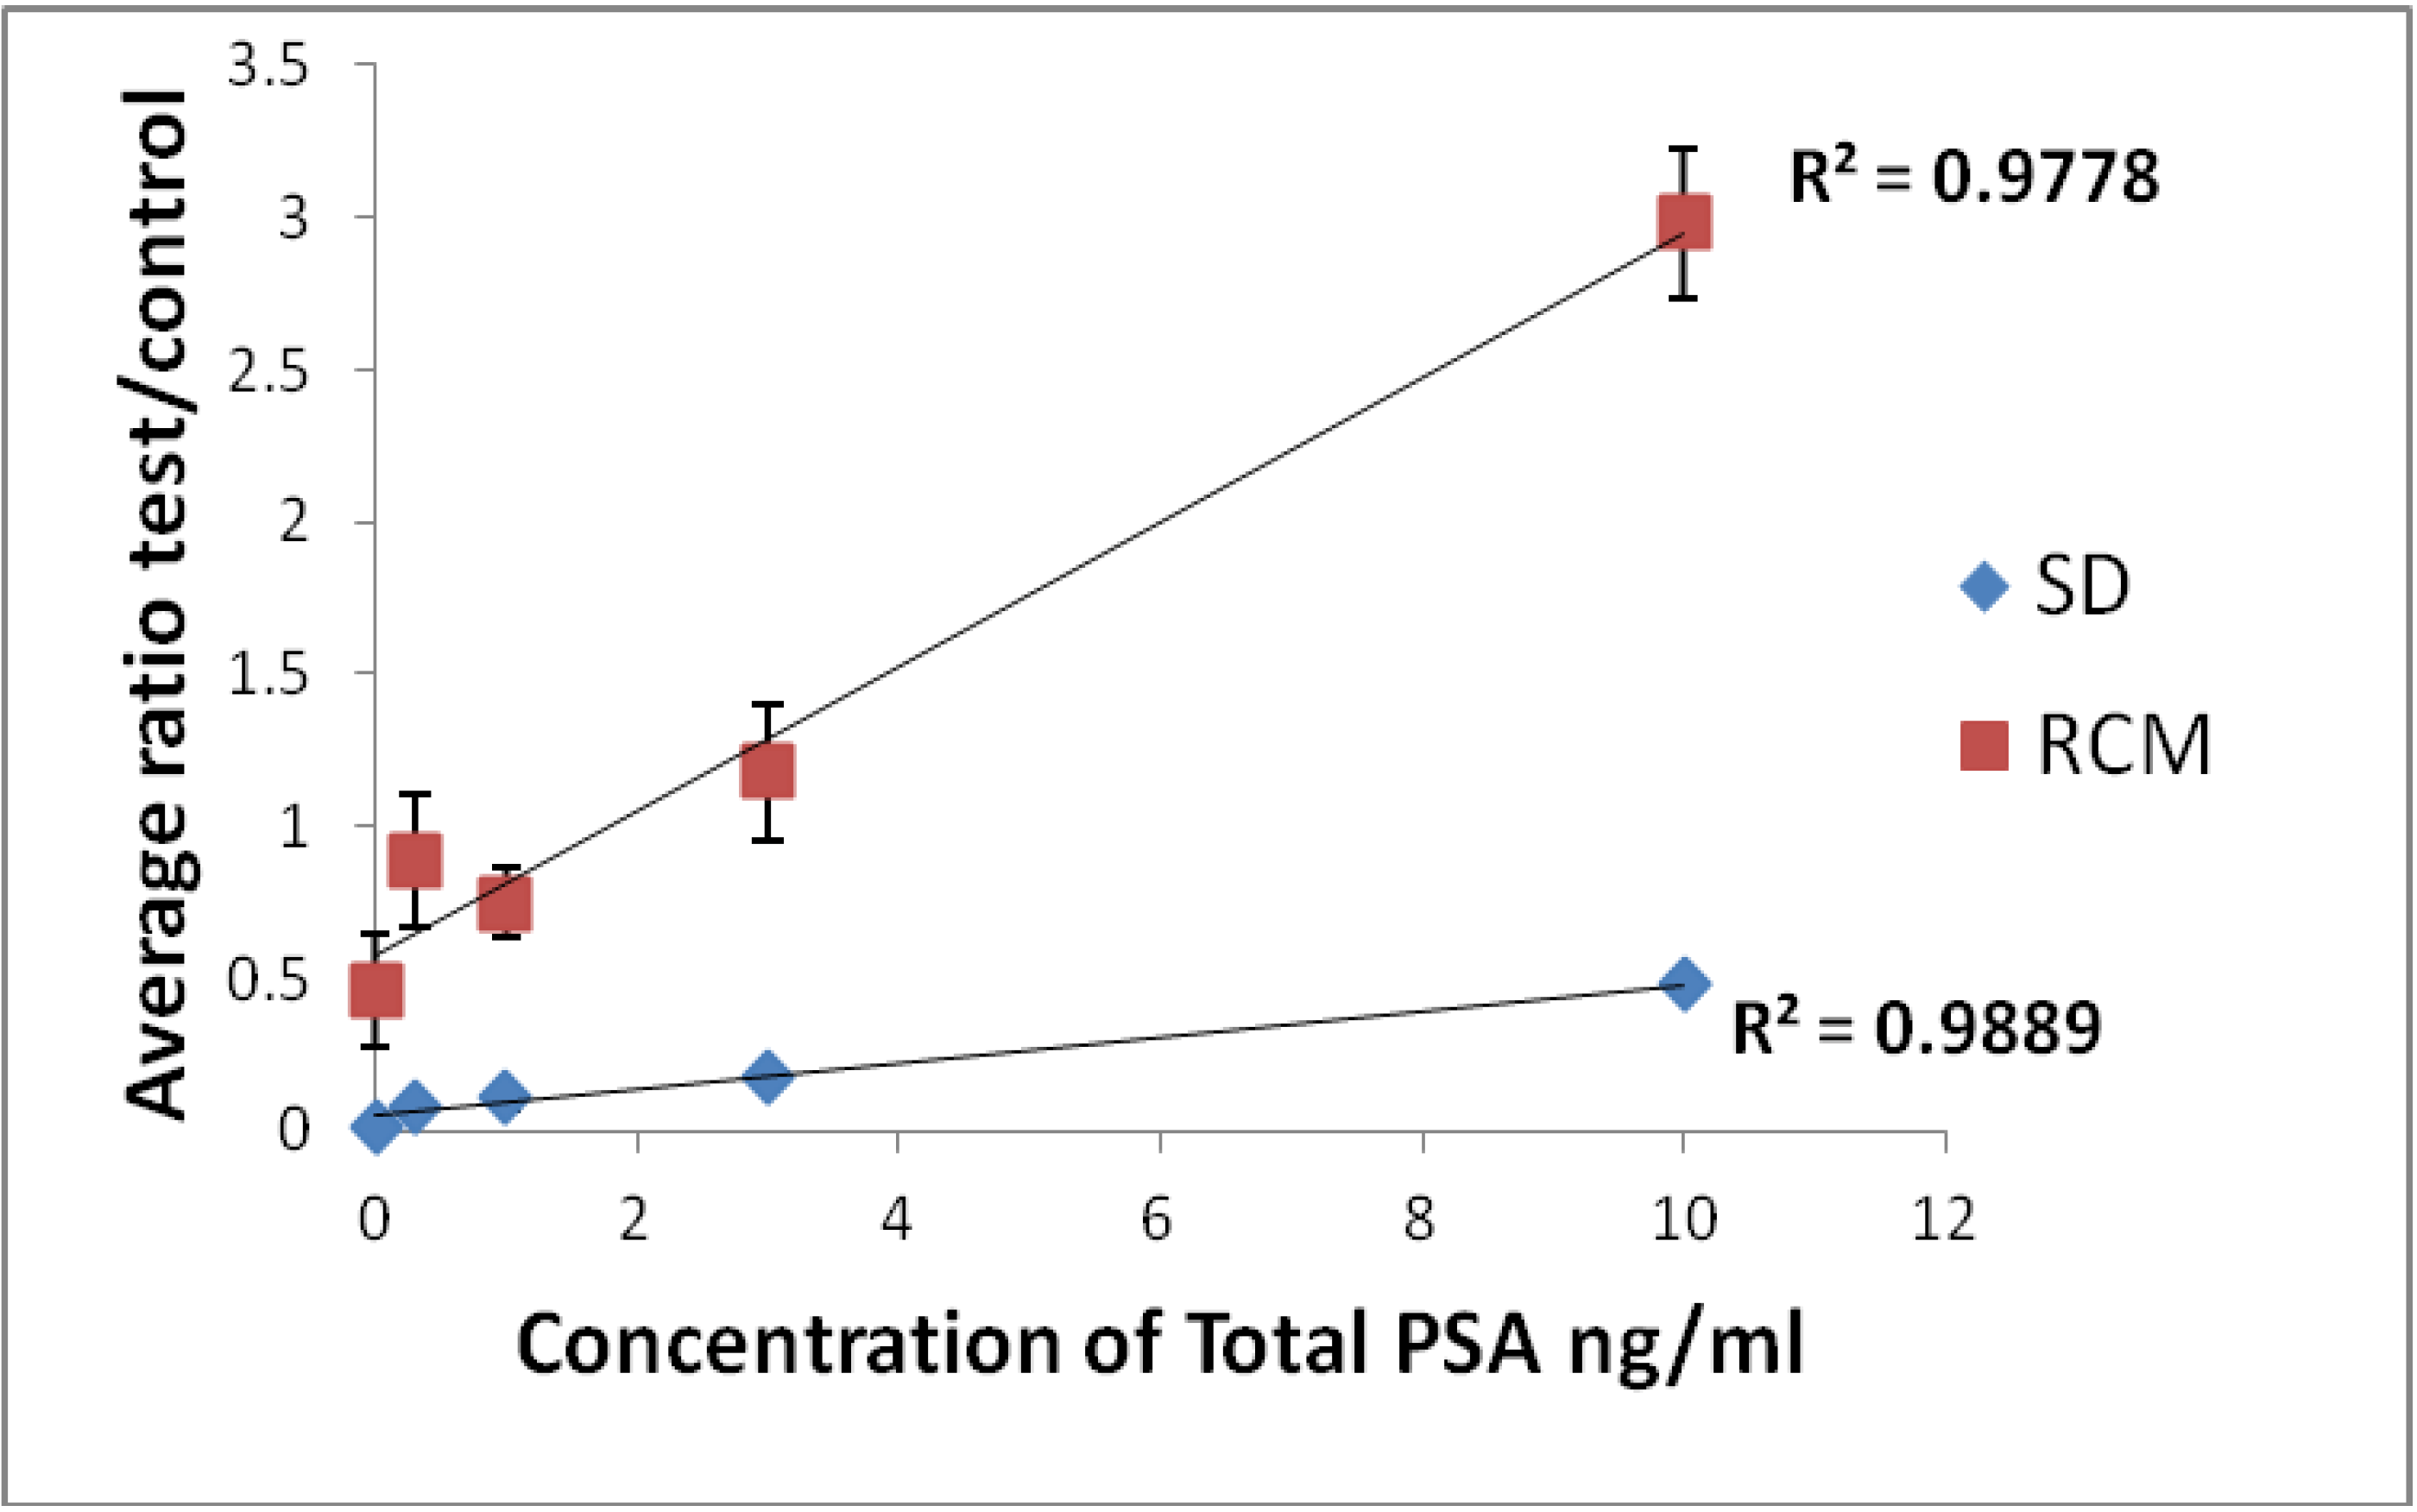
The peak height values measured by the scanning densitometer and the change in voltage (mV) recorded by the RCM for the test and control lines was then expressed as a ratio for each LF assay strip and was plotted against PSA concentration (ng/mL). The use of test to control line ratios has advantages for use in quantitative lateral flow assays in that the influence of any factor which affects the PMP flow rate on any individual assay strip is minimized [
21]. This process also allowed comparison of data obtained with the same LF assay strips measured using the scanning densitometer.
2.4.7. Statistics
All dose response plots were analyzed by regression analysis and the coefficient of determination, R
2 was also obtained [
22]. The coefficient of determination was calculated using data from replicate assays and assay sensitivity was determined from the slope of the dose response plots. The data obtained from the lateral flow assay measured using the RCM and the FastPack assay were compared with the data obtained from the Immulite assay (DPC, West Sacramento, CA, USA) to determine agreement (Kappa coefficient), diagnostic accuracy and associated sensitivity and specificity [
23,
24,
25].
4. Conclusions
In this investigation the aim of the study was to confirm that PMPs can be conjugated, used in lateral flow and that PMPs collected at capture lines can be quantified using the RCM.
Using a standard PSA preparation, a magneto-immunoassay was developed to clinically relevant limits of detection (0.5–10 ng/mL) with numbers of PMPs bound at test and control lines quantifiable using the RCM by virtue of the magnetic properties of the PMPs.
The assays developed were optimized to confirm detection of PMPs captured at test and control lines in lateral flow assays by the RCM i.e., with the greatest number of PMP bound at test and control lines. Improvements in assay limit of detection, linear range, sensitivity and reproducibility will be achieved through further investigation of levels of antibody coating of PMPs, methods of PMP conjugation and mechanical construction of lateral flow assay strips. Further development of the RCM to detect lower numbers of particles and mechanical positioning of the test and control lines within the RCM will also assist in the improvement in assay sensitivity and characteristics.
New developments in lateral flow assay materials [
3] may also provide greater reproducibility in results which have so far limited the use of this technology for quantitative assessments.
Multi-analyte lateral flow assays using latex or gold are already used and this could therefore be applied to magneto-immunoassays. The measurement of free and total PSA as a ratio has been reported to be more predictive of prostate cancer [
37]. In addition, several other analytes have been proposed as potential markers to aid in the diagnosis and prognosis of prostate cancer in particular other members of the Kallikrein family of proteins [
38]. The inclusion of new biomarkers [
39] in lateral flow in series or in parallel that correlate with the presence of prostate cancer to produce a profile, may lead to improvements in the diagnosis and prognosis of prostate cancer. The RCM design described could be modified to allow for colocation of duplicate FLL circuits which would enable multi-analyte quantitation.
This investigation shows promise for use of the RCM as an affordable device to quantify multiple analytes in lateral flow, at the point-of-care in a clinic or doctor’s surgery.


