
Different Phases of Breast Cancer Cells: Raman Study of Immortalized, Transformed, and Invasive Cells

Abstract
:1. Introduction
2. Materials and Methods
2.1. Selection of Cell Lines and Cell Culturing
2.2. For Live Cell Experiments
2.3. Preparation of Cells for Fixed Cell Experiments
2.4. Raman Microspectroscopy
2.4.1. Raman Spectroscopy of Live Cells
2.4.2. Raman Imaging of Fixed Cells
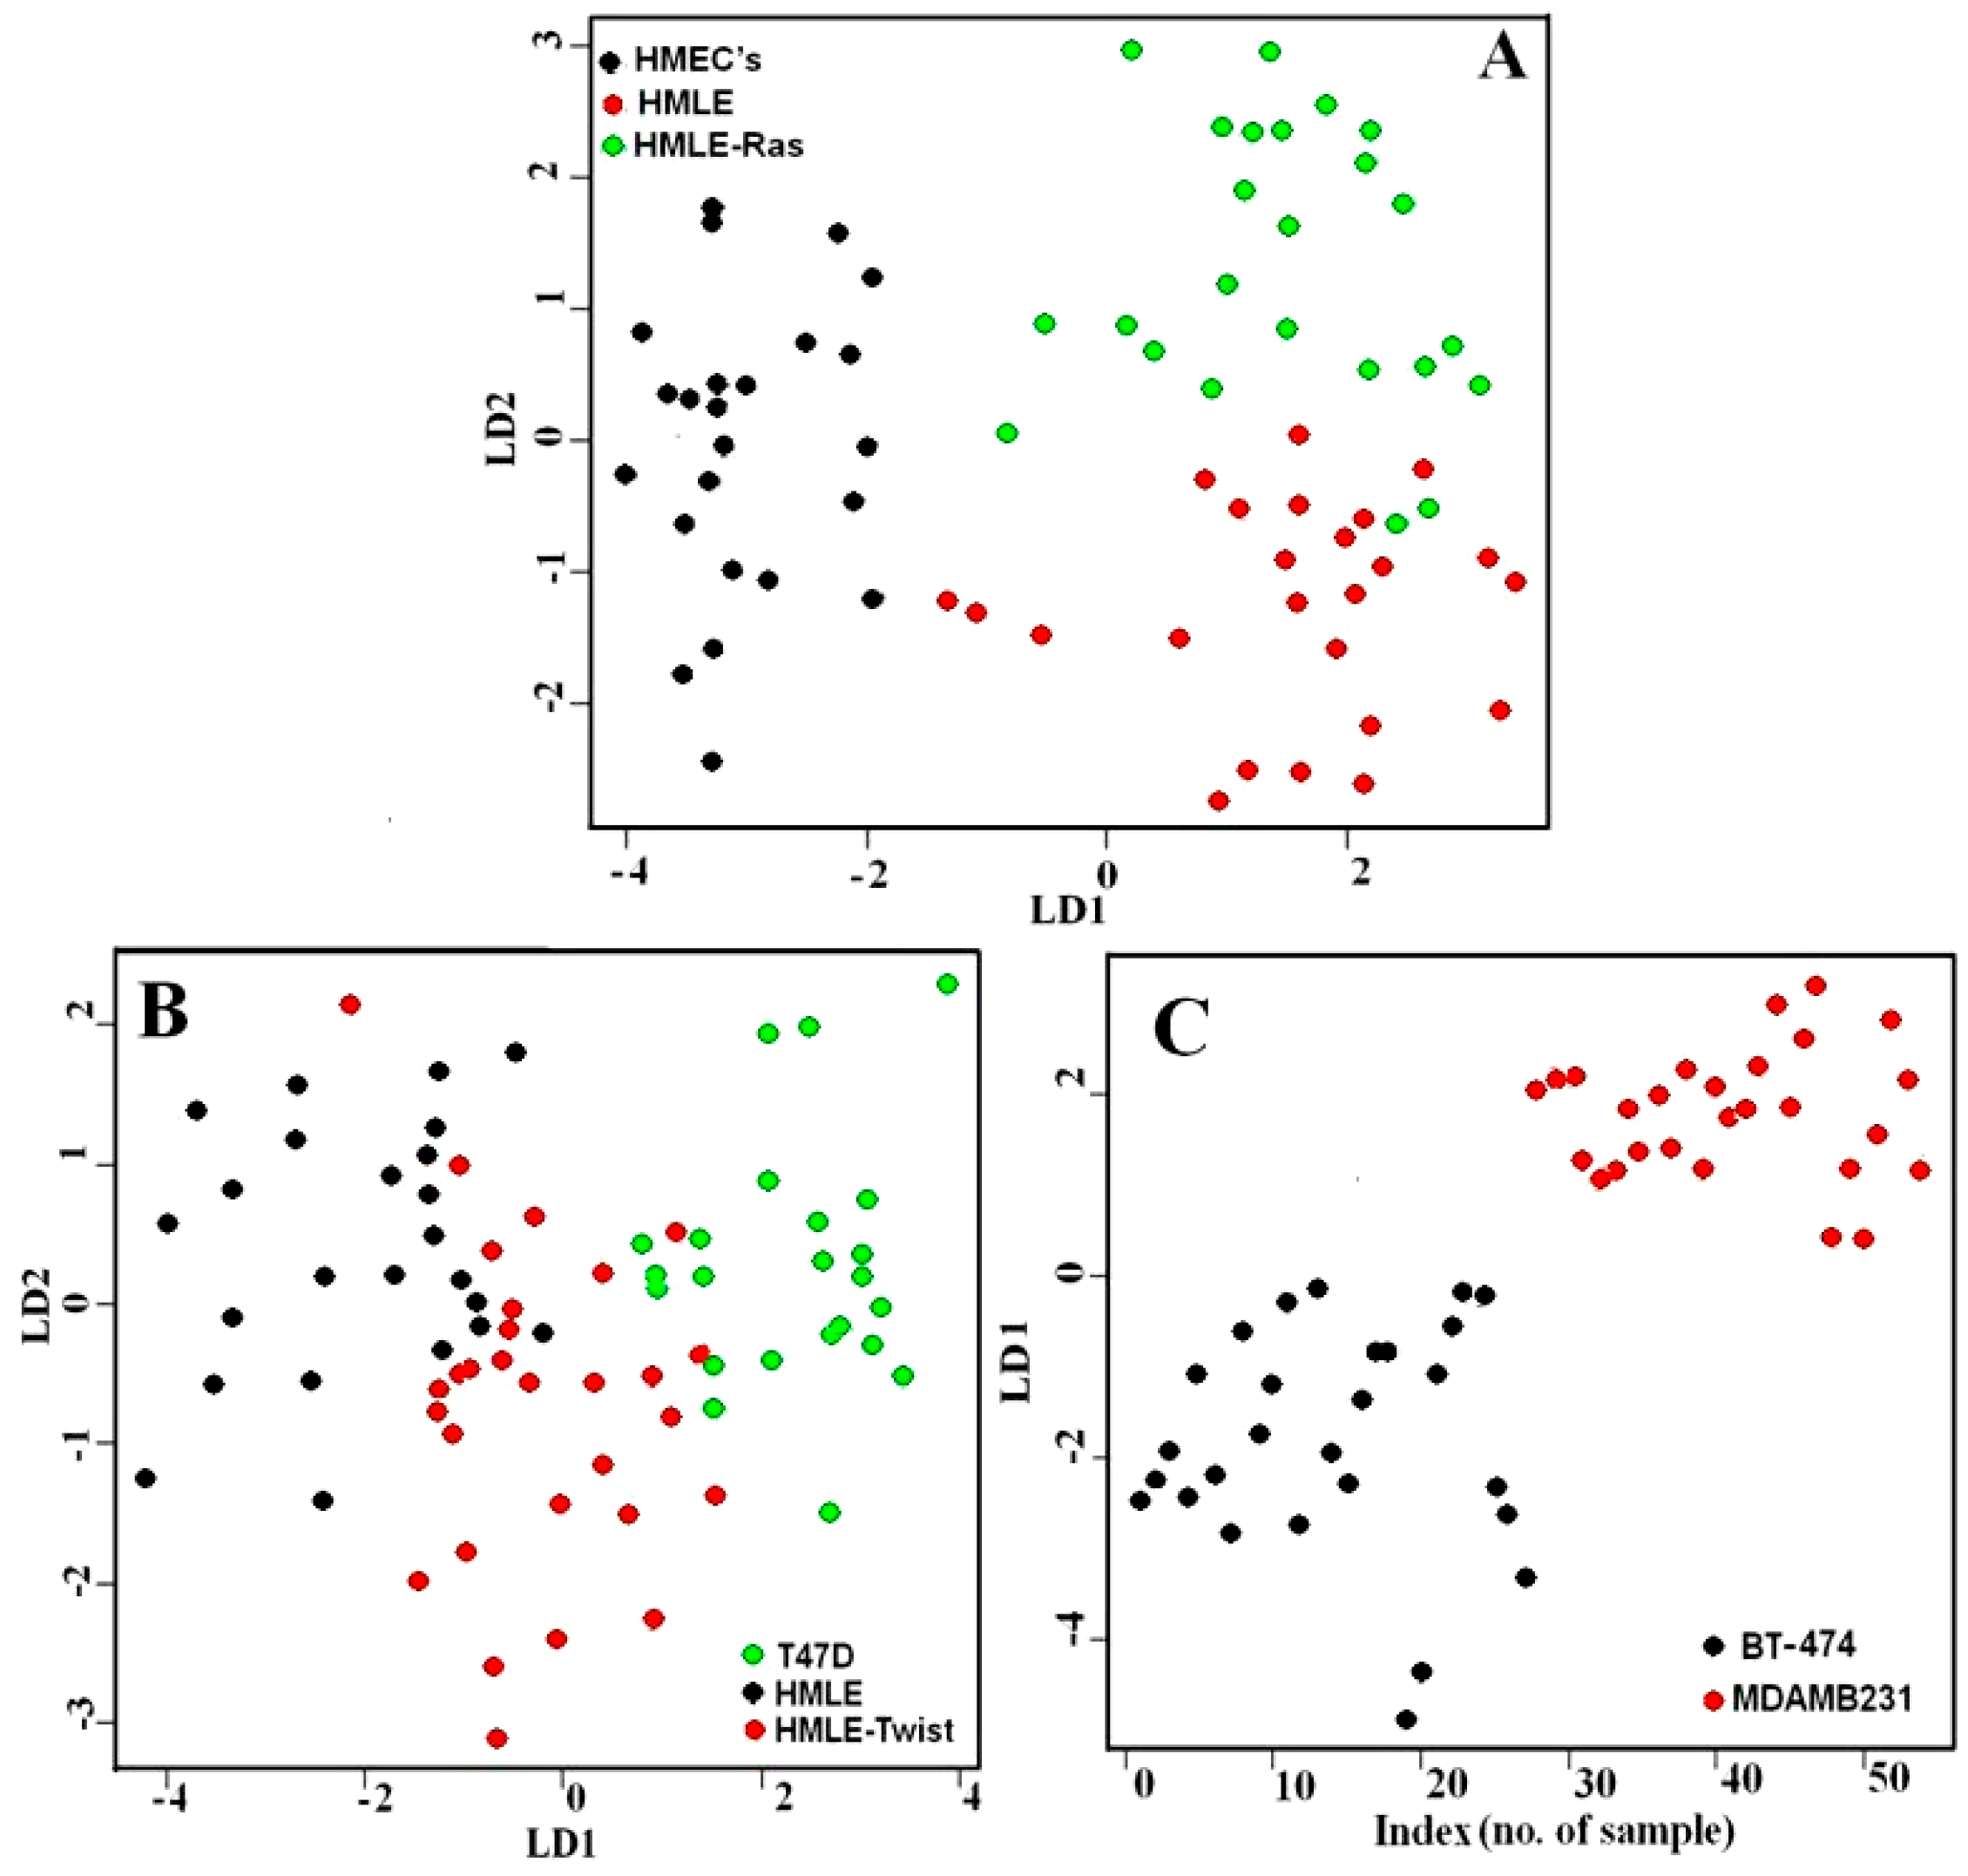
2.4.3. Data Analysis
2.5. Lipid Staining
3. Results and Discussion
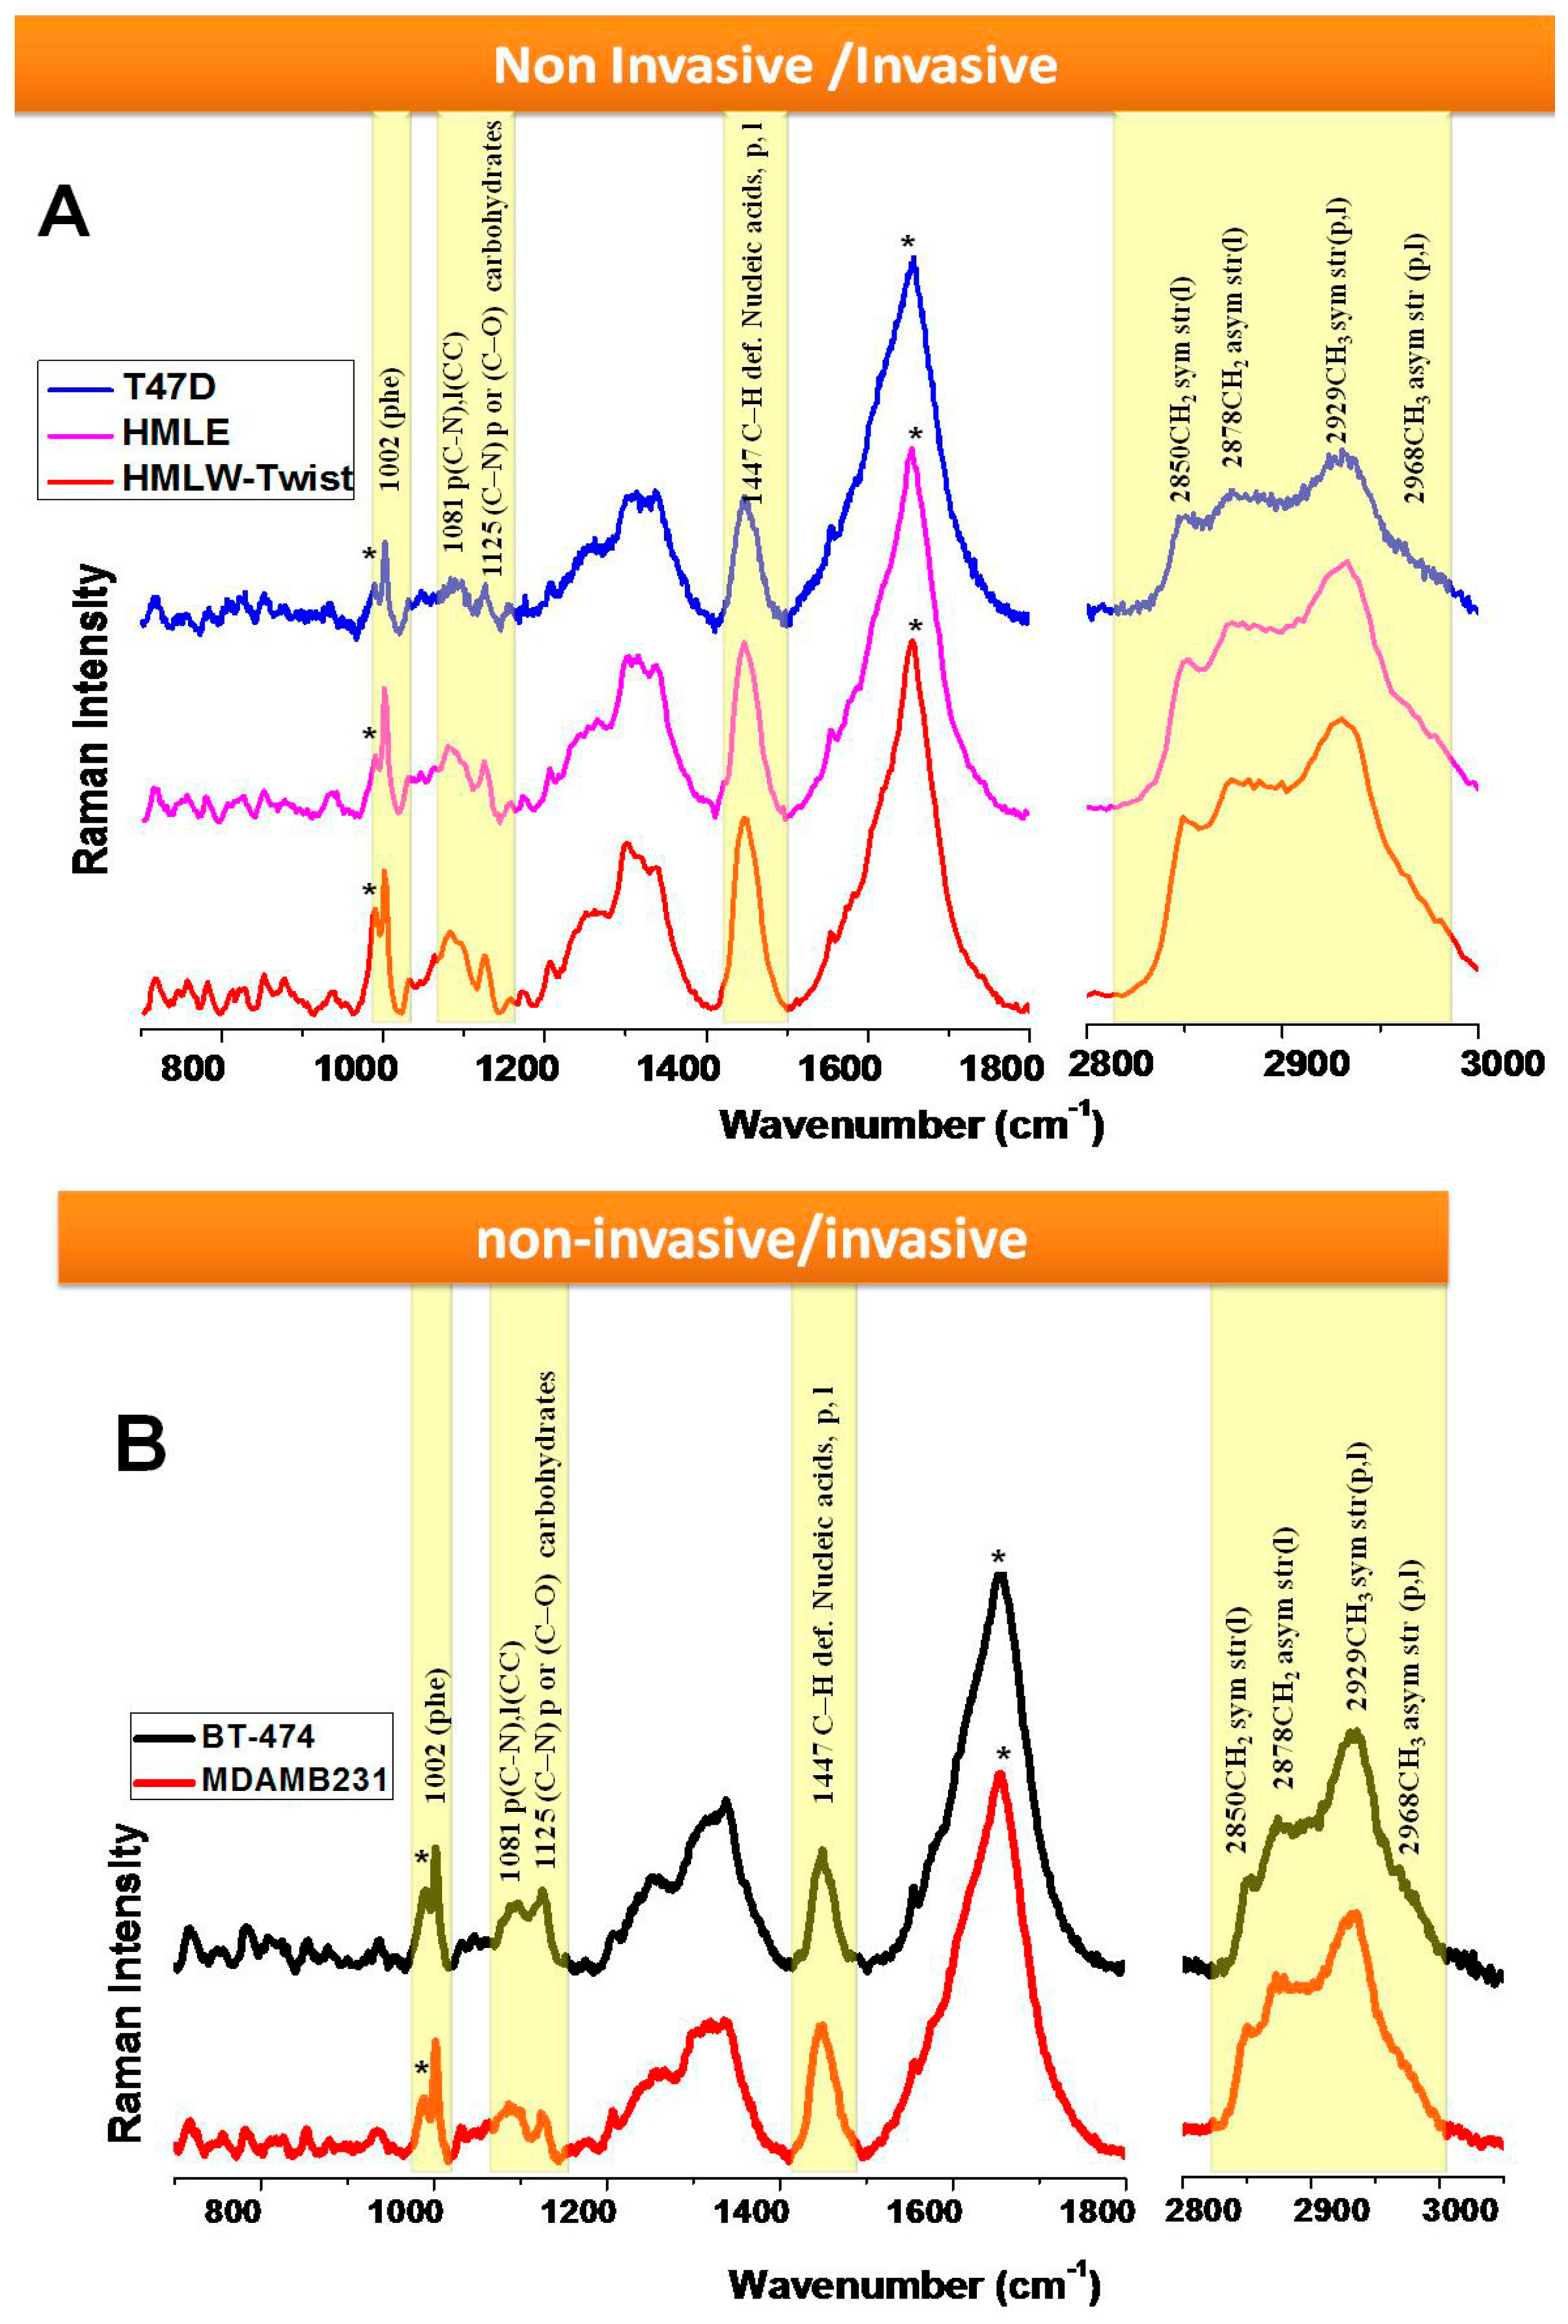
3.1. Comparison between Primary (Normal), Immortalized, and Transformed Cells (in Live Conditions)
3.2. Comparison between Non-Invasive and Invasive Cells (in Live Conditions)
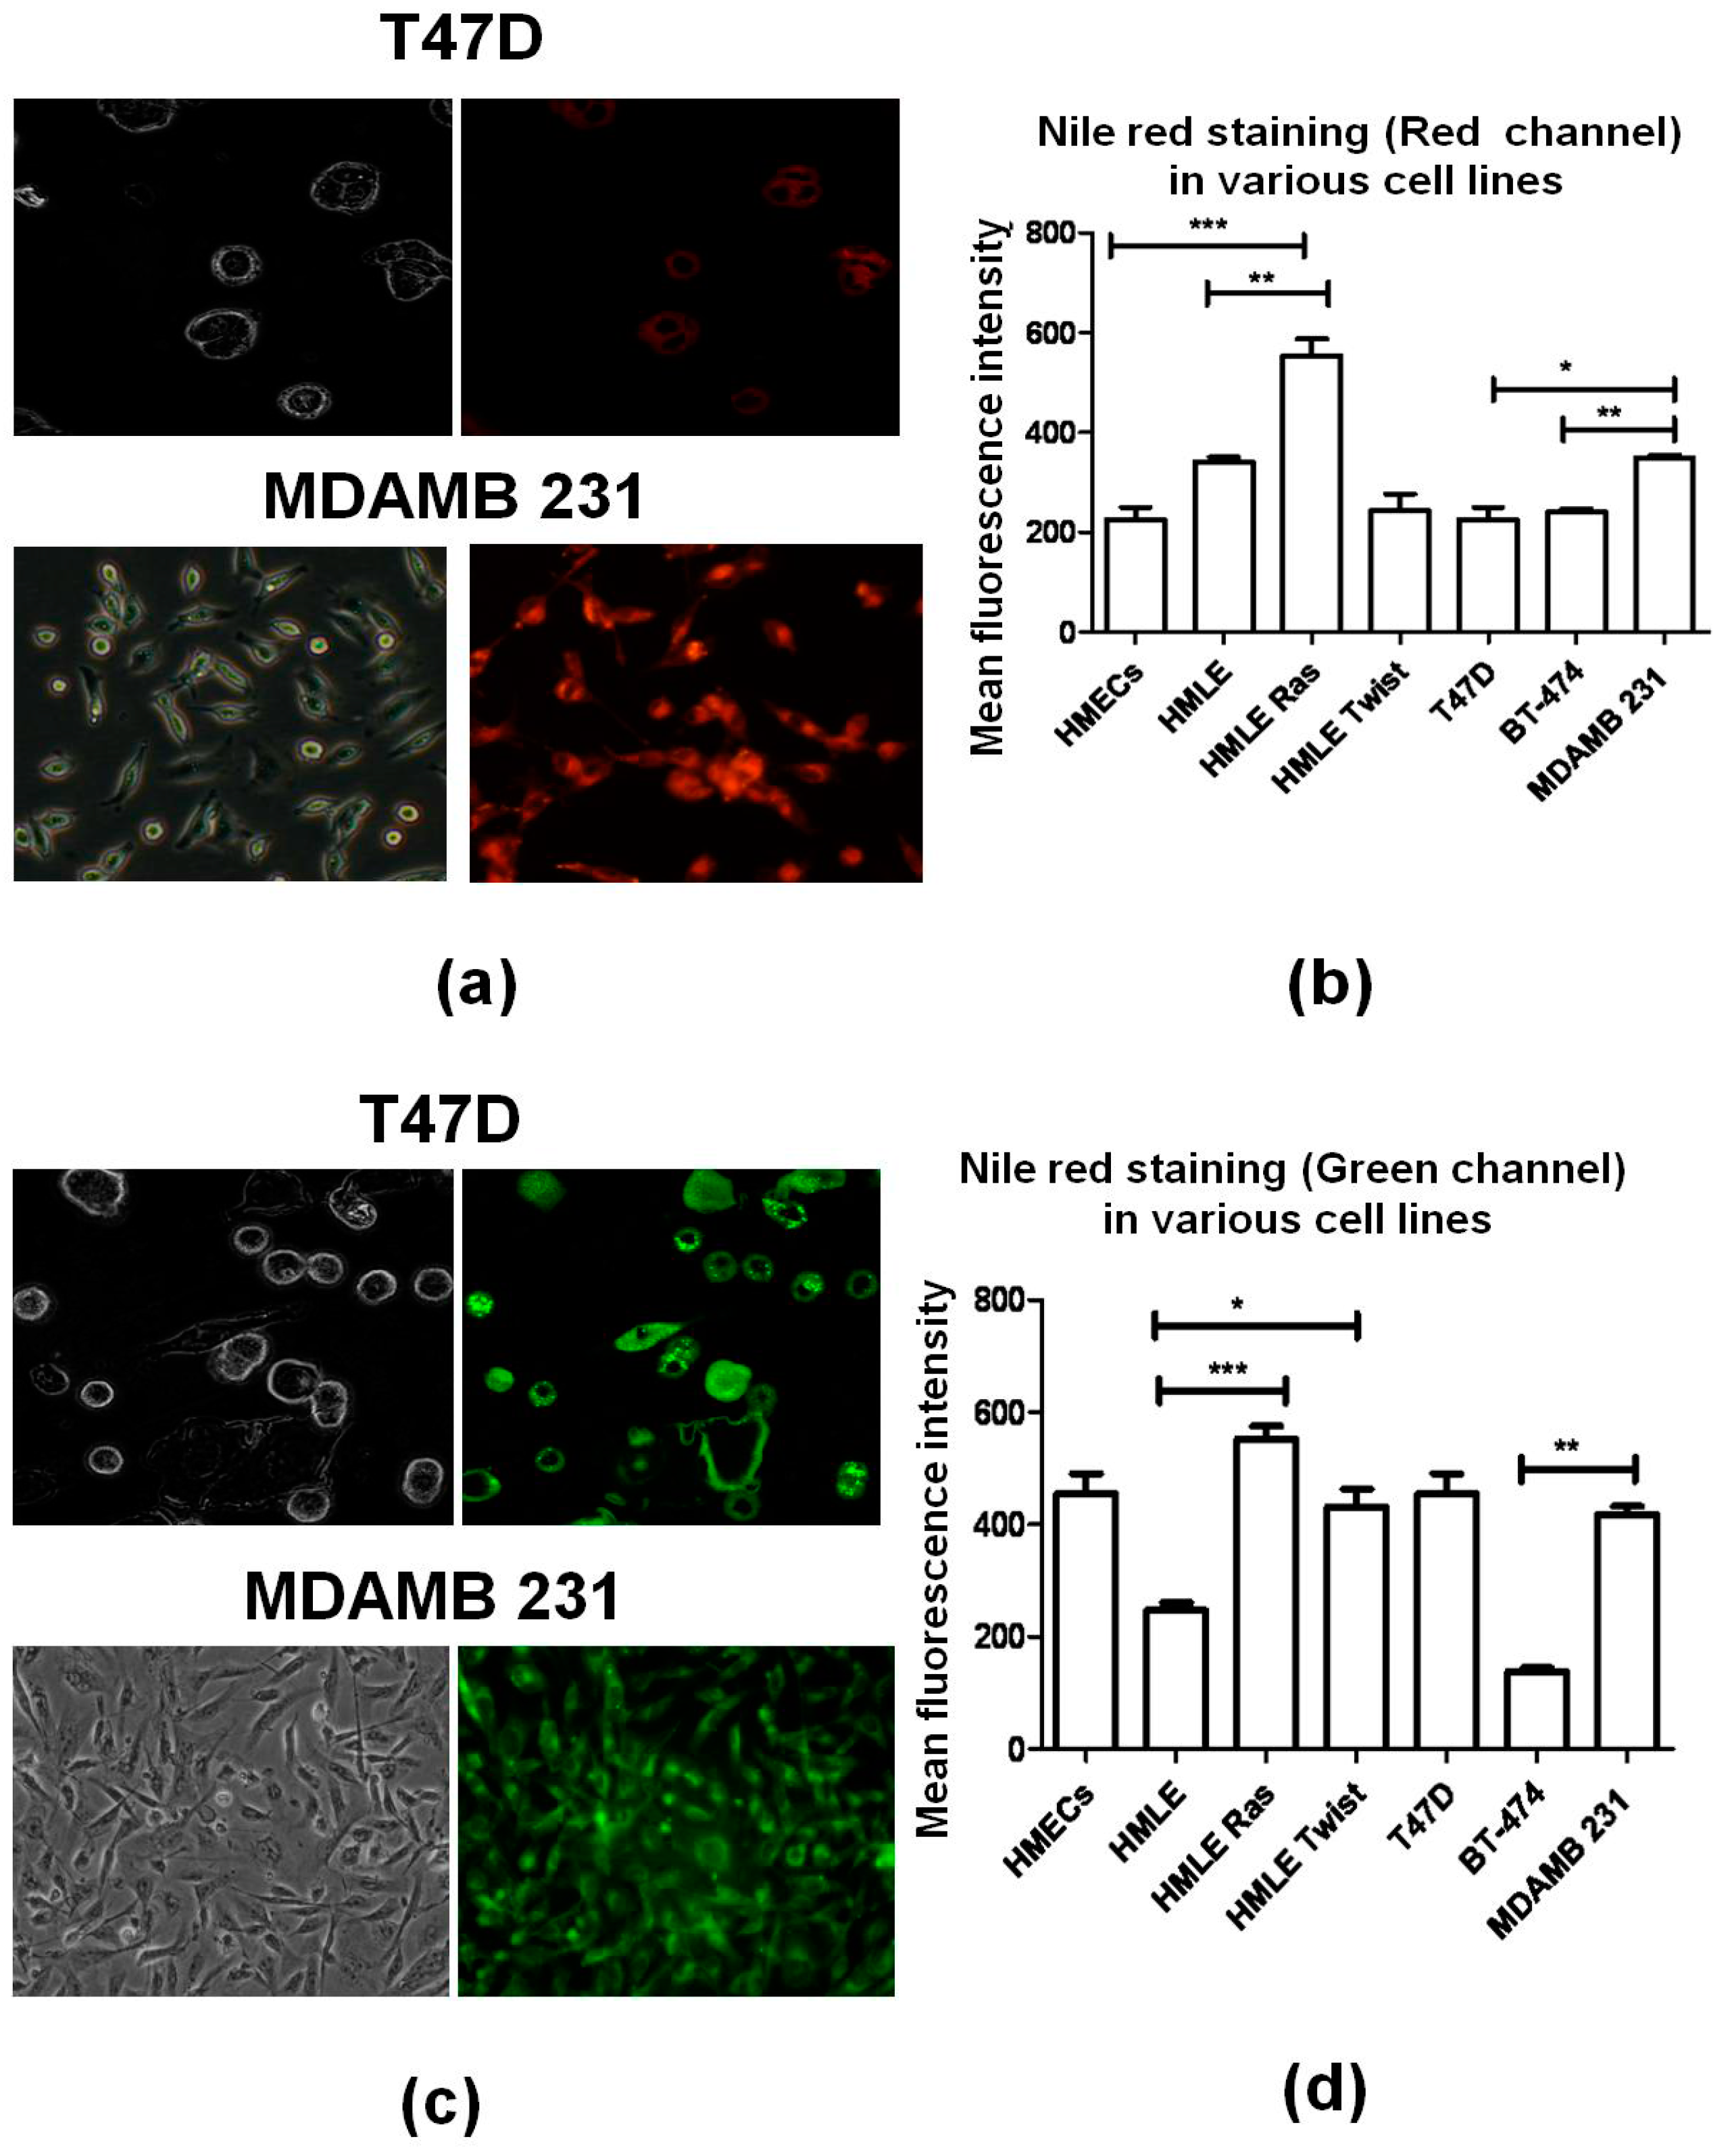
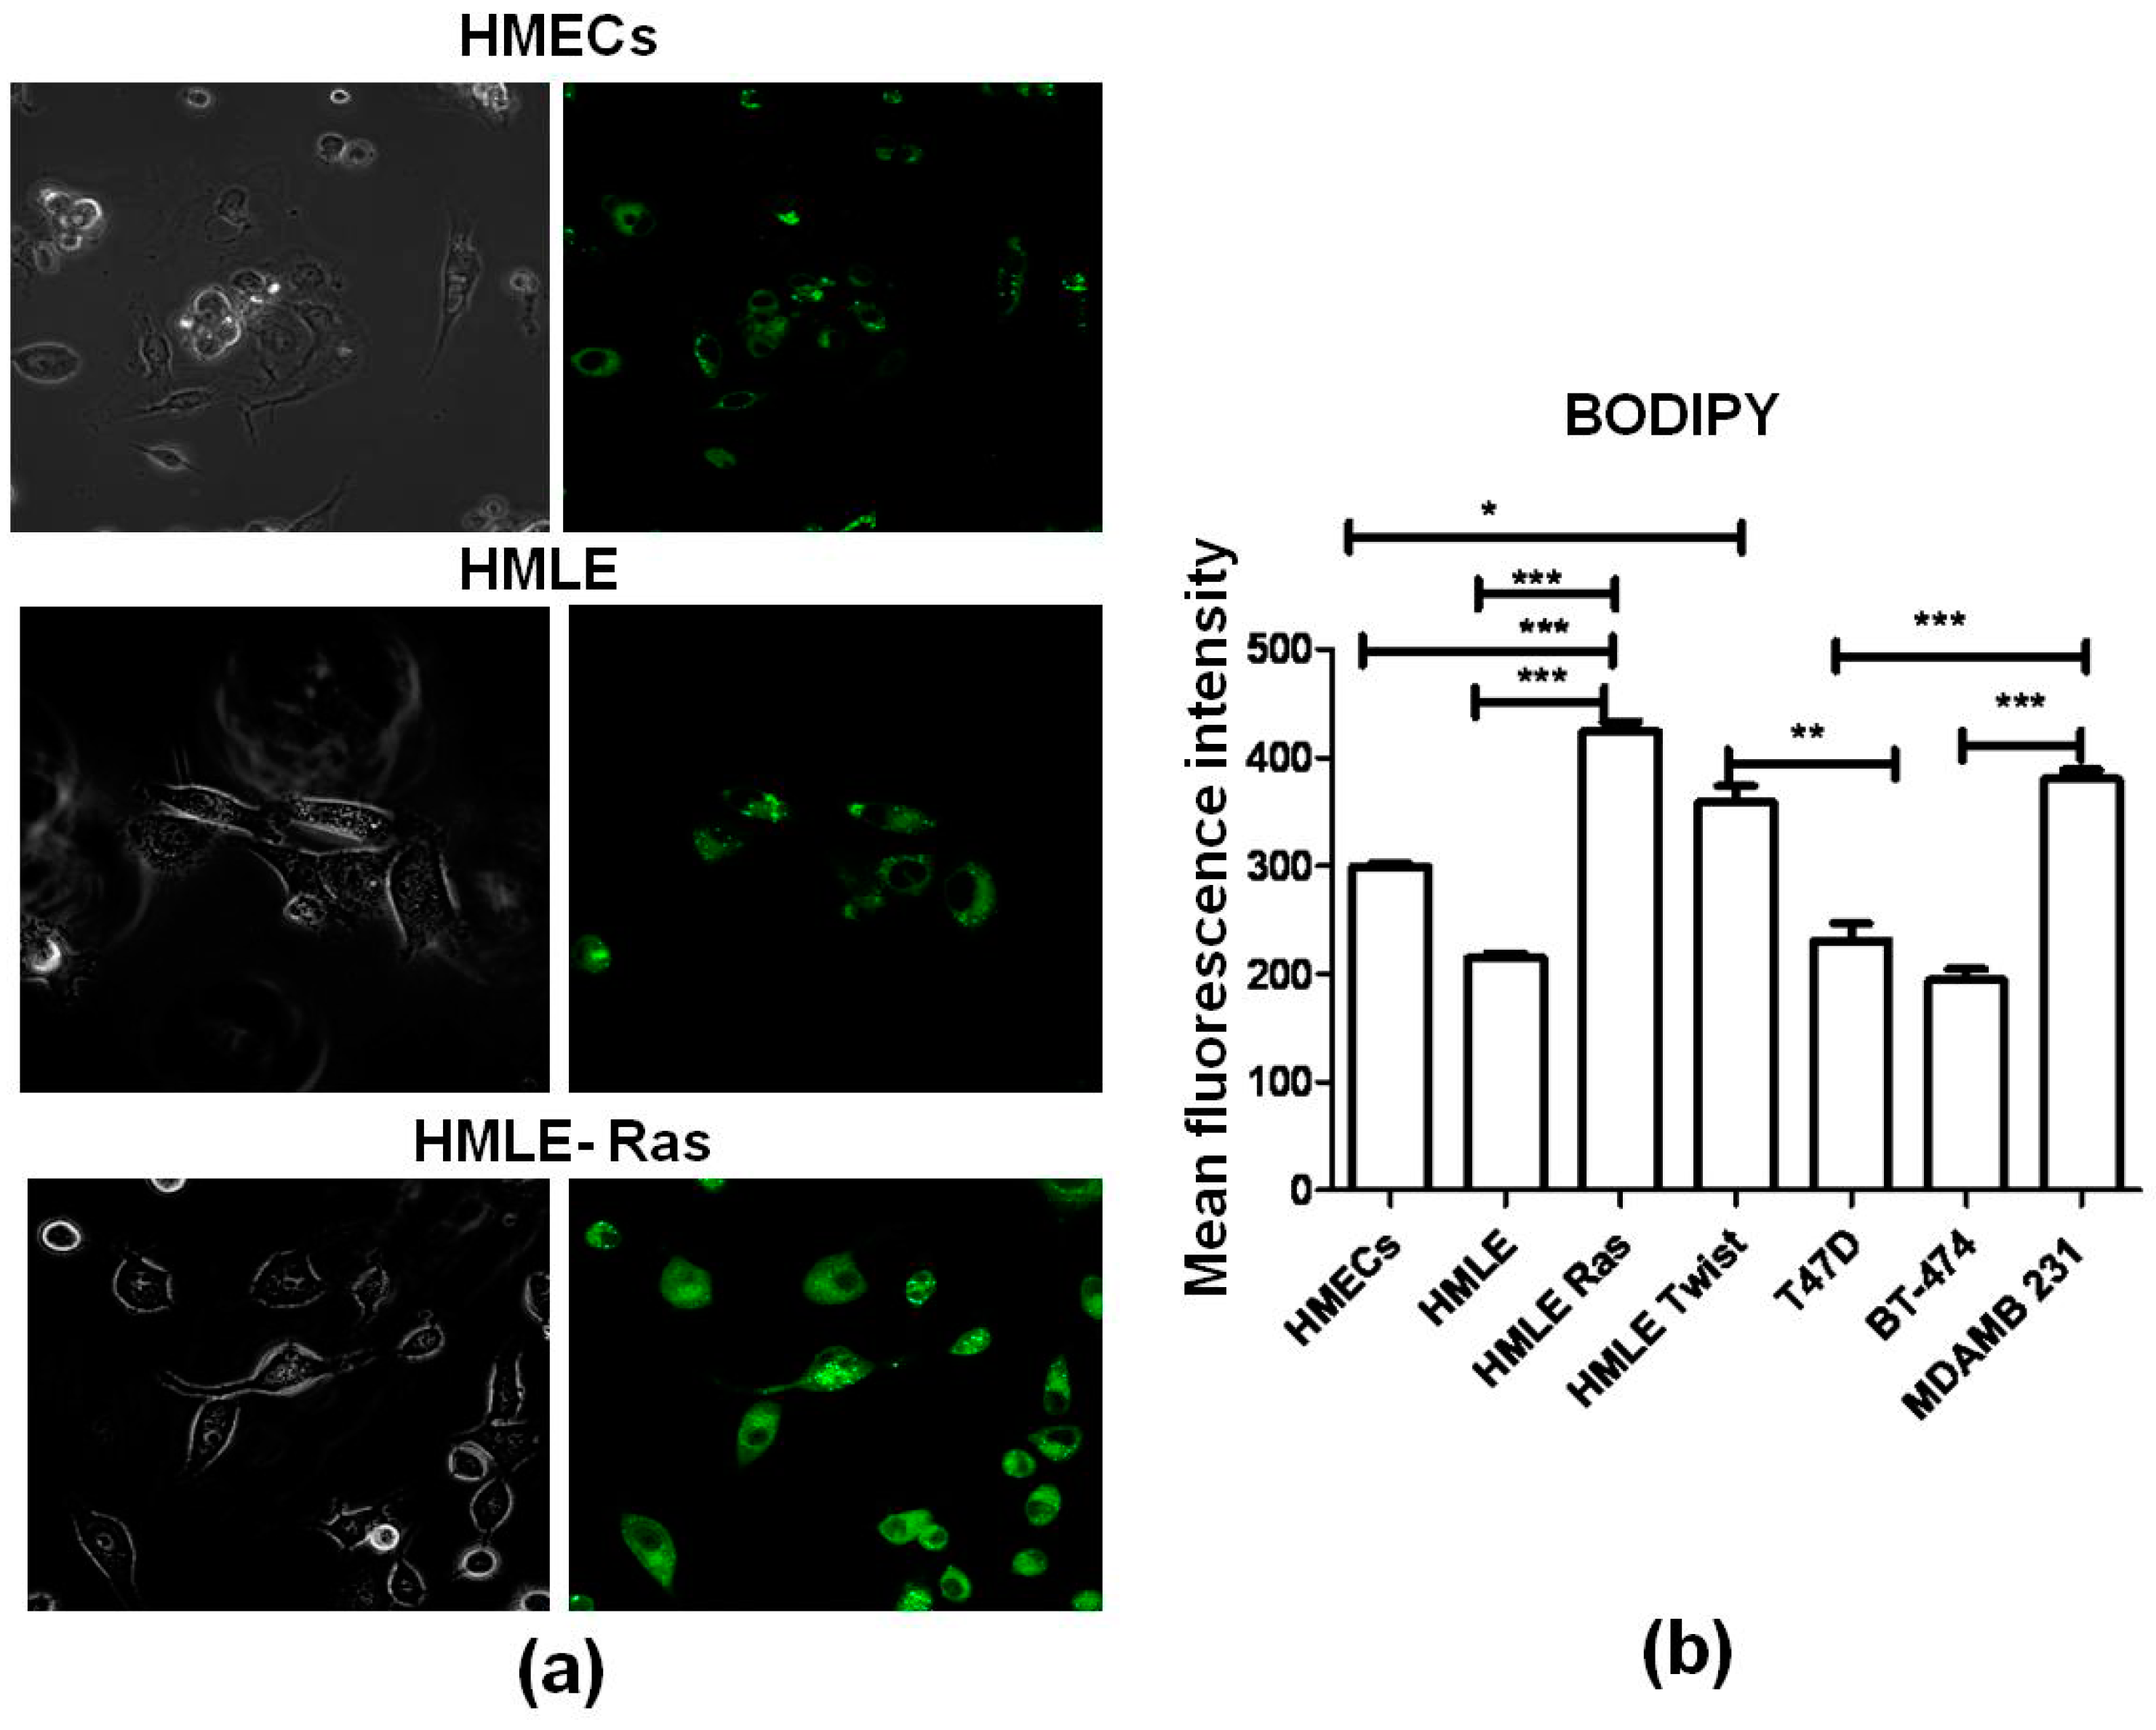
3.3. Lipid Staining Assays
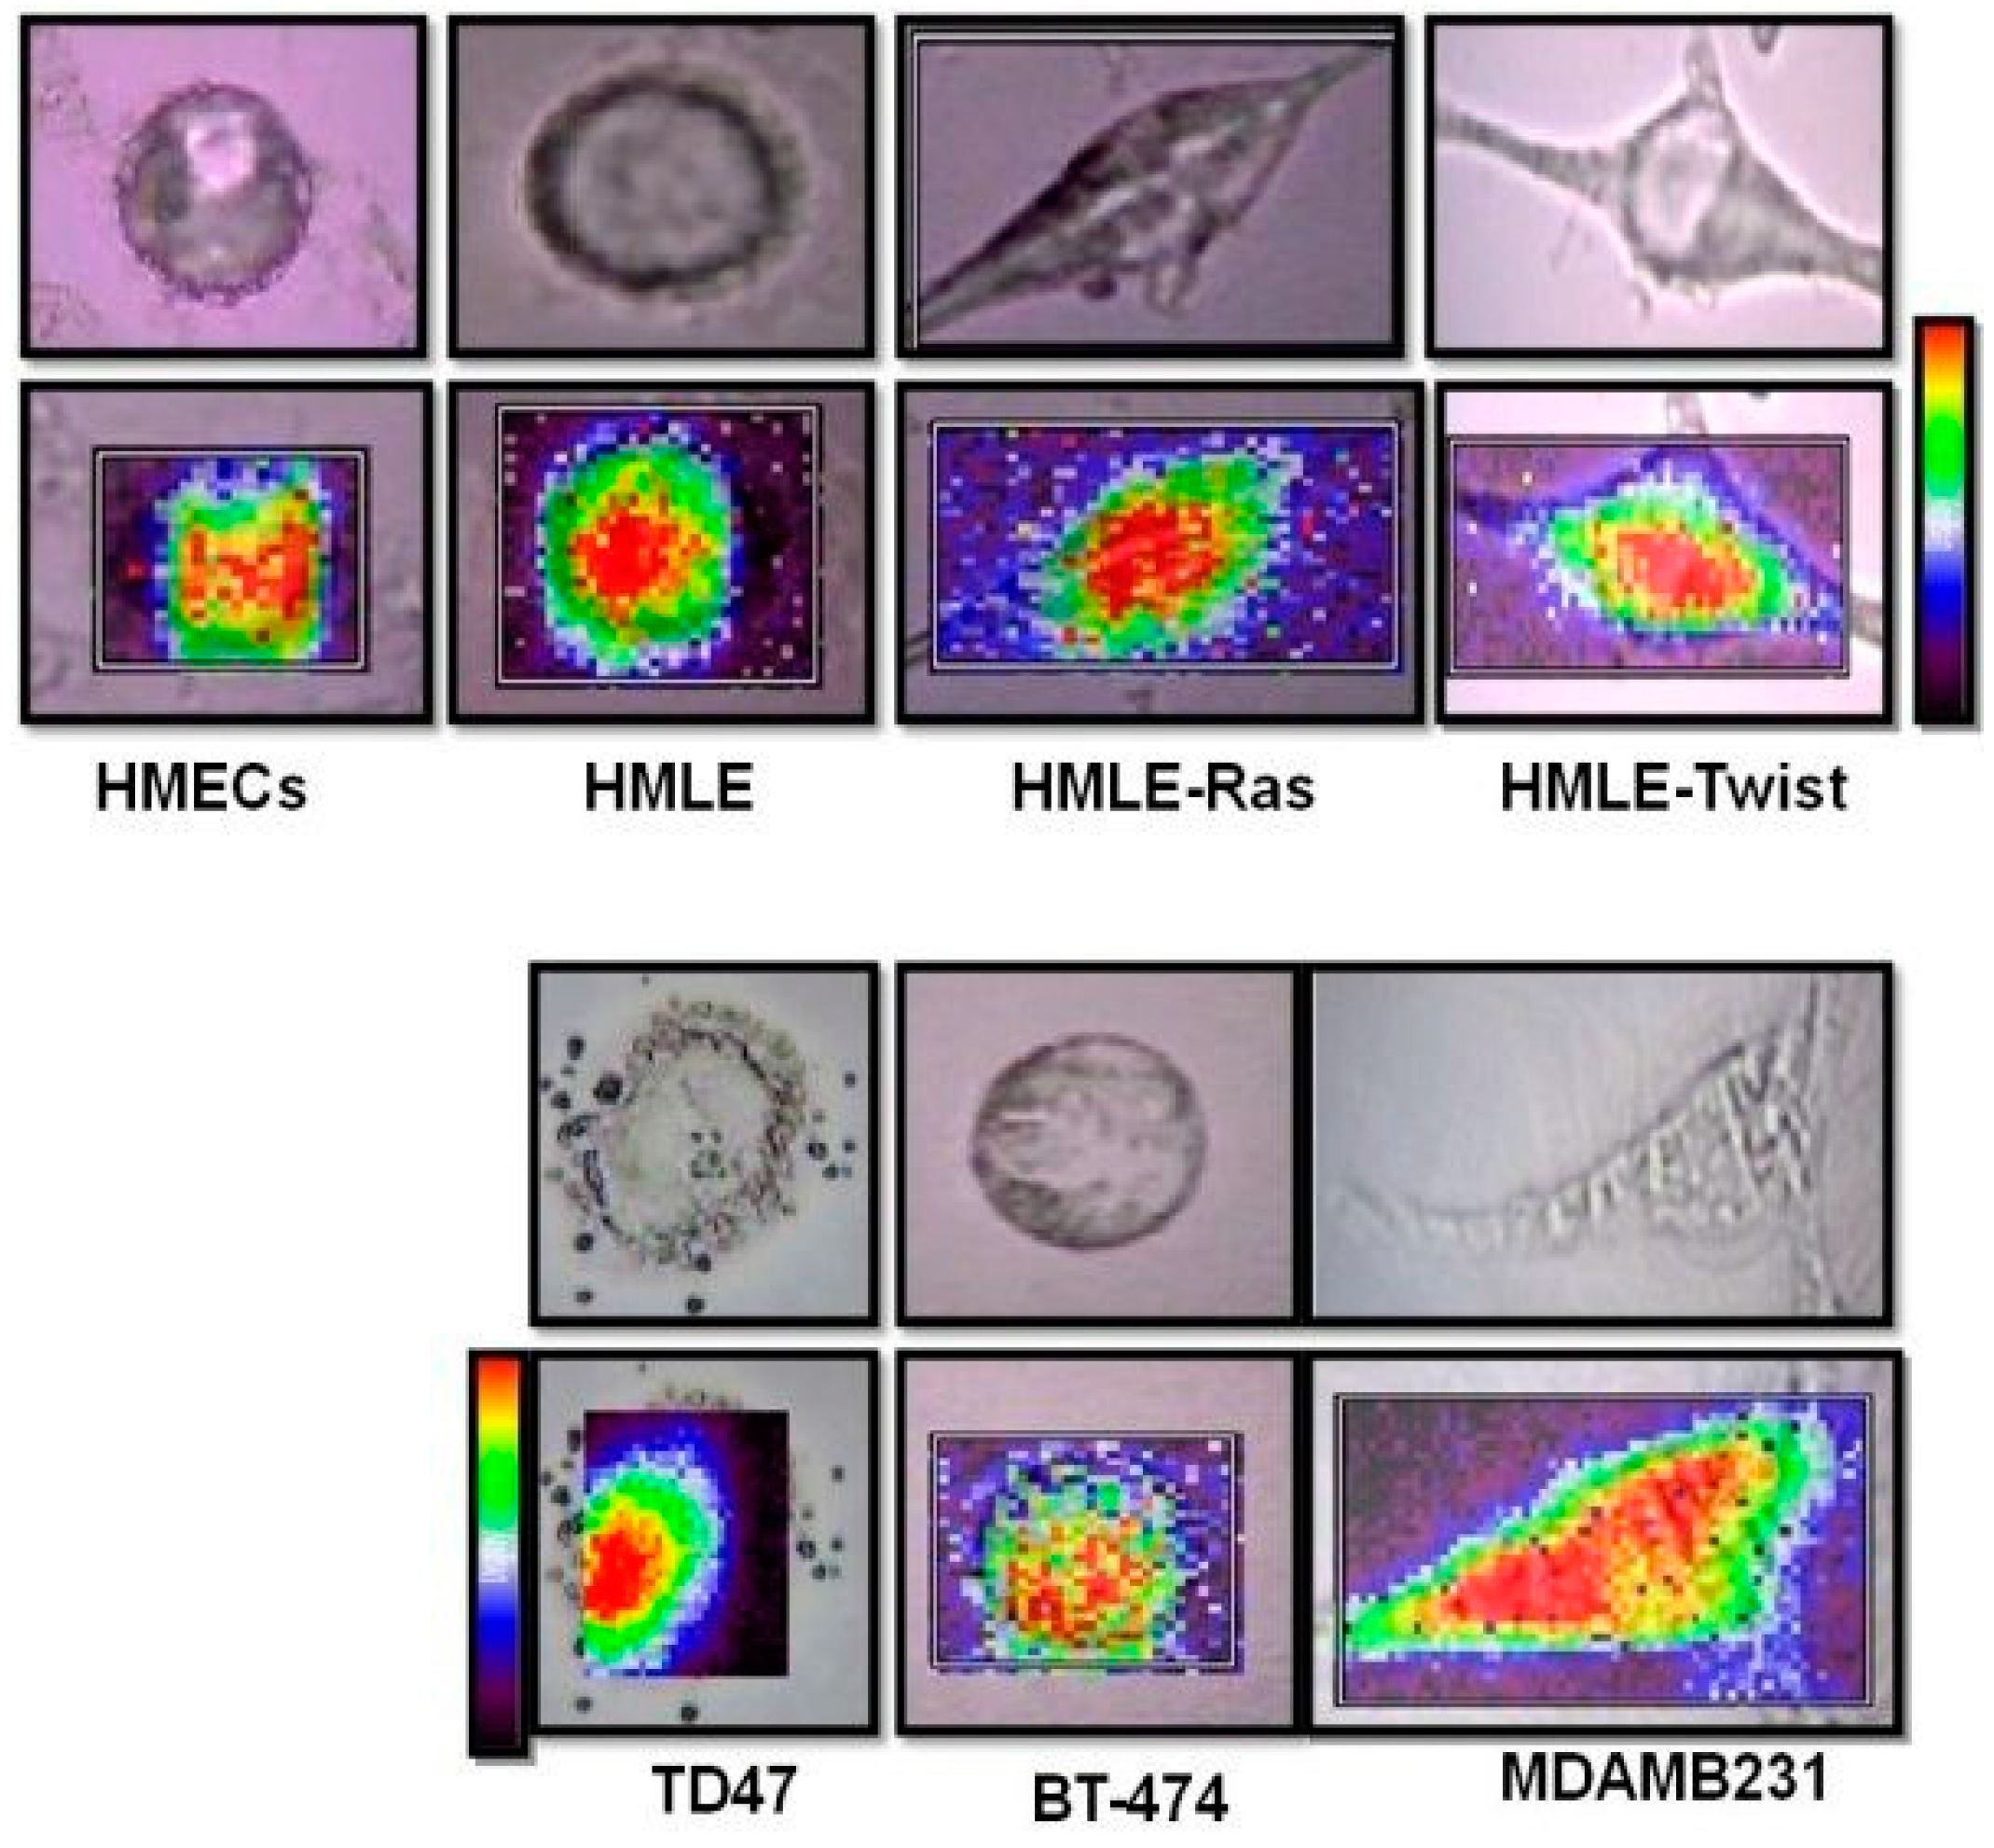
3.4. Raman Imaging of Fixed Cells
4. Discussion
5. Conclusions
Supplementary Materials
Acknowledgments
Author Contributions
Conflicts of Interest
References
- Hanahan, D.; Weinberg, R.A. The hallmarks of cancer. Cell 2000, 100, 57–70. [Google Scholar] [CrossRef]
- Cancer Research UK (January 2007). UK Cancer Incidence Statistics by Age. Retrieved 2007-06-25. Available online: http://www.cancerresearchuk.org/health-professional/cancer-statistics/incidence/age (accessed on 9 November 2016).
- Breast Cancer Cases Shoot Up in India. Available online: http://healthmeup.com/news-buzz/breast-cancer-cases-shoot-up-in-india/17097 (accessed on 9 November 2016).
- Sariego, J. Breast cancer in the young patient. Am. Surg. 2010, 76, 1397–1401. [Google Scholar] [CrossRef]
- Merck Manual of Diagnosis and Therapy (February 2003). Breast Disorders: Breast Cancer. Available online: http://www.merckmanuals.com/home/womens_health_issues/breast_disorders/breast_cancer.html (accessed on 9 November 2016).
- Lieber, C.A.; Majumder, S.K.; Billheimer, D.; Ellis, D.L.; Mahadevan-Jansen, A. Raman microspectroscopy for skin cancer detection in vitro. J. Biomed. Opt. 2008, 13, 024013. [Google Scholar] [CrossRef] [PubMed]
- Caspers, P.J.; Lucassen, G.W.; Wolthuis, R.; Bruining, H.A.; Puppels, G.J. In vitro and in vivo Raman spectroscopy of human skin. BioSpectroscopy 1998, 1994, S31–S39. [Google Scholar] [CrossRef]
- Krafft, C.; Sobottka, S.B.; Schackert, G.; Salzer, R. Near infrared Raman spectroscopic mapping of native brain tissue and intracranial tumors. Analyst 2005, 130, 1070–1077. [Google Scholar] [CrossRef] [PubMed]
- Gautam, R.; Vanga, S.; Madan, A.; Nongthomba, U.; Umapathy, S. Raman Spectroscopic Studies on Screening of Myopathies. Anal. Chem. 2015, 87, 2187–2194. [Google Scholar] [CrossRef] [PubMed]
- Gautam, R.; Samuel, A.; Sil, S.; Chaturvedi, D.; Dutta, A.; Ariese, F.; Umapathy, S. Raman and Infrared Imaging: Applications and Advancements. Curr. Sci. 2015, 108, 341–356. [Google Scholar]
- Kumar, S.; Matange, N.; Visweswariah, S.S.; Umapathy, S. Linking carbon metabolism to carotenoid production in mycobacteria using Raman spectroscopy. FEMS Microbiol. Lett. 2015, 362, 1–6. [Google Scholar] [CrossRef] [PubMed]
- Devpura, S.; Thakur, J.S.; Sarkar, F.H.; Sakr, W.A.; Naik, V.M.; Naik, R. Detection of benign epithelia, prostatic intraepithelial neoplasia, and cancer regions in radical prostatectomy tissues using Raman spectroscopy. Vib. Spectrosc. 2010, 53, 227–232. [Google Scholar] [CrossRef]
- Crow, P.; Barrass, B.; Kendall, C.A.; Hart-Prieto, M.; Wright, M.; Persad, R.; Stone, N. The use of Raman spectroscopy to differentiate between different prostatic adenocarcinoma cell lines. Br. J. Cancer 2005, 92, 2166–2170. [Google Scholar] [CrossRef] [PubMed]
- Crow, P.; Stone, N.; Kendall, C.A.; Uff, J.S.; Barr, J.A.M.; Wright, M. The use of Raman spectroscopy to identify and grade prostatic adenocarcinoma in vitro. Br. J. Cancer 2003, 89, 106–108. [Google Scholar] [CrossRef] [PubMed]
- Espina, R.; Yu, L.; Wang, J.; Tong, Z.; Vashishtha, S.; Talaat, R.; Scatina, J.; Mutlib, A. Nuclear magnetic resonance spectroscopy as a quantitative tool to determine the concentrations of biologically produced metabolites: Implications in metabolites in safety testing. Chem. Res. Toxicol. 2009, 22, 299–310. [Google Scholar] [CrossRef] [PubMed]
- Sahu, K.R.; Mordechai, S. Fourier Transform Infrared Spectroscopy in Cancer Detection. Future Oncol. 2005, 1, 635–647. [Google Scholar] [CrossRef] [PubMed]
- Keren, S.; Zavaleta, C.; Cheng, Z.; de la Zerda, A.; Gheysens, O.; Gambhir, S.S. Noninvasive molecular imaging of small living subjects using Raman spectroscopy. Proc. Natl. Acad. Sci. USA 2008, 105, 5844–5849. [Google Scholar] [CrossRef] [PubMed]
- Smith, W.E.; Dent, G. Modern Raman Spectroscopy: A Practical Approach; John Wiley and Sons: Chichester, UK, 2005. [Google Scholar]
- Ellis, D.I.; Goodacre, R. Metabolic fingerprinting in disease diagnosis: Biomedical applications of infrared and Raman spectroscopy. Analyst 2006, 131, 875–885. [Google Scholar] [CrossRef] [PubMed]
- Devpura, S.; Thakur, J.S.; Sethi, S.; Naik, V.M.; Naik, R. Diagnosis of Head and Neck Squamous Cell Carcinoma using Raman Spectroscopy: Tongue/Floor of Mouth tissues. J. Raman Spectrosc. 2012, 43, 490–496. [Google Scholar] [CrossRef]
- Lyng, F.M.; Faoláin, E.Ó.; Conroy, J.; Meabe, A.D.; Knief, P.; Duffy, B.; Hunter, M.B.; Byrne, J.M.; Kelehan, P.; Byrne, H.J. Vibrational spectroscopy for cervical cancer pathology, from biochemical analysis to diagnostic tool. Exp. Mol. Pathol. 2007, 82, 121–129. [Google Scholar] [CrossRef] [PubMed]
- Pandey, R.; Paidi, S.K.; Kang, J.W.; Spegazzini, N.; Dasari, R.R.; Valdez, T.A.; Barman, I. Discerning the differential molecular pathology of proliferative middle ear lesions using Raman spectroscopy. Sci. Rep. 2015, 5, 13305. [Google Scholar] [CrossRef] [PubMed]
- Wu, Y.; McEwen, G.D.; Harihar, S.; Baker, S.M.; DeWald, D.B.; Zhou, A. BRMS1 expression alters the ultrastructural, biomechanical and biochemical properties of MDA-MB-435 human breast carcinoma cells: An AFM and Raman microspectroscopy study. Cancer Lett. 2010, 293, 82–91. [Google Scholar] [CrossRef] [PubMed]
- Nieva, C.; Marro, M.; Santana-Codina, N.; Rao, S.; Petrov, D.; Sierra, A. The lipid phenotype of breast cancer cells characterized by Raman microspectroscopy: Towards a stratification of malignancy. PLoS ONE 2012, 7, e46456. [Google Scholar] [CrossRef] [PubMed]
- Santana, N.; Nieva, C.; Sierra, A.; Marro, M.; Rao, S.; Petrov, D. Raman microspectroscopy is a tool to identify the metastatic ability of breast tumors. In Proceedings of the 2011 International Workshop on Bio Photonics, Parma, Italy, 8–10 June 2011; pp. 978–980.
- Hartsuiker, L.; Zeijen, N.J.L.; Terstappen, L.W.M.M.; Otto, C. A comparison of breast cancer tumor cells with varying expression of the Her2/Neu receptor by Raman microspectroscopic imaging. Analyst 2010, 135, 3220–3226. [Google Scholar] [CrossRef] [PubMed]
- Depciuch, J.; Kaznowska, E.; Szmuc, K.; Zawlik, I.; Cholewa, M.; Heraud, P.; Cebulski, J. Comparing paraffined and deparaffinized breast cancer tissue samples and an analysis of Raman spectroscopy and infrared method. Infrared Phys. Technol. 2016, 76, 217–226. [Google Scholar] [CrossRef]
- Depciuch, J.; Kaznowska, E.; Zawlik, I.; Wojnarowska, R.; Cholewa, M.; Heraud, P.; Cebulski, J.C. Application of Raman Spectroscopy and Infrared spectroscopy in the Identification of Breast Cancer. Appl. Spectrosc. 2016, 70, 251–263. [Google Scholar] [CrossRef] [PubMed]
- González-Solís, J.L.; Luévano-Colmenero, G.H.; Vargas-Mancilla, J. Surface enhanced Raman spectroscopy in breast cancer cells. Laser Ther. 2013, 22, 37–42. [Google Scholar] [PubMed]
- Haka, A.S.; Shafer-Peltier, K.E.; Fitzmaurice, M.; Crowe, J.; Dasari, R.R.; Feld, M.S. Diagnosing breast cancer by using Raman spectroscopy. Proc. Natl. Acad. Sci. USA 2005, 102, 12371–12376. [Google Scholar] [CrossRef] [PubMed]
- Kalluri, R.; Neilson, E.G. Epithelial-mesenchymal transition and its implications for fibrosis. J. Clin. Investig. 2003, 112, 1776–1784. [Google Scholar] [CrossRef] [PubMed]
- Gout, S.; Huot, J. Role of Cancer Microenvironment in Metastasis: Focus on Colon Cancer. Cancer Microenviron. 2008, 1, 69–83. [Google Scholar] [CrossRef] [PubMed]
- Mani, S.A.; Guo, W.; Liao, M.J.; Eaton, E.N.; Ayyanan, A.; Zhou, A.Y.; Brooks, M.; Reinhard, F.; Zhang, C.C.; Shipitsin, M.; et al. The epithelial-mesenchymal transition generates cells with properties of stem cells. Cell 2008, 133, 704–715. [Google Scholar] [CrossRef] [PubMed]
- Brinton, L.A.; Devesa, S.S. Etiology and pathogenesis of breast cancer: Incidence, demographics and environmental factors. In Diseases of the Breast; Harris, J.R., Lippman, M.E., Morrow, M., Hellman, S., Eds.; Lippincott-Raven: Philadelphia, PA, USA, 1996; pp. 159–212. [Google Scholar]
- Early Breast Cancer Trialists Collaborative Group. Worldwide evidence. In Treatment of Early Breast Cancer; Oxford University Press: Oxford, UK, 1990. [Google Scholar]
- Kamby, C. The pattern of metastasis in human breast cancer—Methodological aspects and influence of prognostic factors. Cancer Treat. Rev. 1990, 17, 37–61. [Google Scholar] [CrossRef]
- Fearon, E.R.; Vogelstein, B. A genetic model for colorectal tumorigenesis. Cell 1990, 61, 759–767. [Google Scholar] [CrossRef]
- Wong, S.Y.; Hynes, R.O. Lymphatic or Hematogenous Dissemination: How Does a Metastatic Tumor Cell Decide? Cell Cycle 2006, 5, 812–817. [Google Scholar] [CrossRef] [PubMed]
- Chaffer, C.L.; Weinberg, R.A. A Perspective on Cancer Cell Metastasis. Science 2011, 331, 1559–1564. [Google Scholar] [CrossRef] [PubMed]
- Elenbaas, B.; Spirio, L.; Koerner, F.; Fleming, M.D.; Zimonjic, D.B.; Donaher, J.L.; Popescu, N.C.; Hahn, W.C.; Weinberg, R.A. Human breast cancer cells generated by oncogenic transformation of primary mammary, epithelial cells. Genes Dev. 2001, 15, 50–65. [Google Scholar] [CrossRef] [PubMed]
- Saxena, M.; Stephens, M.A.; Pathak, H.; Rangarajan, A. Transcription factors that mediate epithelial-mesenchymal transition lead to multidrug resistance by upregulating ABC transporters. Cell Death Dis. 2011, 2, e179. [Google Scholar] [CrossRef] [PubMed]
- Dey, D.; Saxena, M.; Paranjape, A.N.; Krishnan, V.; Giraddi, R.; Kumar, M.V.; Mukherjee, G.; Rangarajan, A. Phenotypic and Functional Characterization of Human Mammary Stem/Progenitor Cells in Long Term Culture. PLoS ONE 2009, 4, e5329. [Google Scholar] [CrossRef] [PubMed]
- Strober, W. Trypan Blue Exclusion Test of Cell Viability. Curr. Protoc. Immunol. 2001. [Google Scholar] [CrossRef]
- Yu, C.X.; Gestl, E.; Eckert, K.; Allara, D.; Irudayaraj, J. Characterization of human breast epithelial cells by confocal Raman microspectroscopy. Cancer Detect. Prev. 2006, 30, 515–522. [Google Scholar] [CrossRef] [PubMed]
- Wu, Y.; McEwen, G.D.; Harihar, S.; Baker, S.M.; DeWald, D.B.; Zhou, A. BRMS1 expression alters the ultrastructural, biomechanical and biochemical properties of MDA-MB-435 human breast carcinoma cells: An AFM and Raman microspectroscopy study. Cancer Lett. 2010, 293, 82–91. [Google Scholar] [CrossRef] [PubMed]
- Matthews, Q.; Jirasek, A.; Lum, J.; Duan, X.; Brolo, A.G. Variability in Raman Spectra of Single Human Tumor Cells Cultured in Vitro: Correlation with Cell Cycle and Culture Confluency. Appl. Spectrosc. 2010, 64, 871–887. [Google Scholar] [CrossRef] [PubMed]
- Gautam, R.; Vanga, S.; Ariese, F.; Umapathy, S. Review of multidimensional data processing approaches for Raman and infrared spectroscopy. EPJ Tech. Instrum. 2015, 2, 1–38. [Google Scholar] [CrossRef]
- Kumar, S.; Verma, T.; Mukherjee, R.; Ariese, F.; Somasundaram, K.; Umapathy, S. Raman and infra-red microspectroscopy: Towards quantitative evaluation for clinical research by ratiometric analysis. Chem. Soc. Rev. 2016, 45, 1879–1900. [Google Scholar] [CrossRef] [PubMed]
- Ricard, L.; Abbate, S.; Zerbi, G. Conformationally Dependent Fermi Resonance and Long-Range Interactions between σ bonds in polymethylene systems derived from their Raman spectra. J. Phys. Chem. 1985, 89, 4793–4799. [Google Scholar] [CrossRef]
- Walther, T.C.; Farese, R.V., Jr. Lipid Droplets and Cellular Lipid Metabolism. Annu. Rev. Biochem. 2012, 81, 687–714. [Google Scholar] [CrossRef] [PubMed]
- Listenberger, L.L.; Brown, D.A. Fluorescent Detection of Lipid Droplets and Associated Proteins. Curr. Protoc. Cell Biol. 2007, 35, 24.2.1–24.2.11. [Google Scholar]
- Li, Y.C.; Park, M.J.; Ye, S.K.; Kim, C.W.; Kim, Y.N. Elevated levels of cholesterol-rich lipid rafts in cancer cells are correlated with apoptosis sensitivity induced by cholesterol-depleting agents. Am. J. Pathol. 2006, 168, 1107–1118. [Google Scholar] [CrossRef] [PubMed]
- Klapper, M.; Ehmke, M.; Palgunow, D.; Böhme, M.; Matthäus, C.; Bergner, G.; Dietzek, B.; Popp, J.; Döring, F. Fluorescence-based fixative and vital staining of lipid droplets in Caenorhabditis elegans reveal fat stores using microscopy and flow cytometry approaches. J. Lipid Res. 2011, 52, 1281–1293. [Google Scholar] [CrossRef] [PubMed]
- Nan, X.; Cheng, J.X.; Xie, X.S. Vibrational imaging of lipid droplets in live fibroblast cells with coherent anti-Stokes Raman scattering microscopy. J. Lipid Res. 2003, 44, 2202–2208. [Google Scholar] [CrossRef] [PubMed]
- Mbaye, F.; Fall, M.; Dem, A.; Sembène, M. Biological evolution of tryptophan and phenylalanine in the occurrence of breast cancer in Senegalese women. Int. J. Med. Med. Sci. 2012, 4, 103–109. [Google Scholar]
- Swinnen, J.V.; Roskams, T.; Joniau, S.; van Poppel, H.; Oyen, R.; Baert, L.; Heyns, W.; Verhoeven, G. Overexpression of fatty acid synthase is an early and common event in the development of prostate cancer. Int. J. Cancer 2002, 98, 19–22. [Google Scholar] [CrossRef] [PubMed]
- Kuhajda, F.P.; Jenner, K.; Wood, F.D.; Hennigar, R.A.; Jacobs, L.B.; Dick, J.D.; Pasternack, G.R. Fatty acid synthesis: A potential selective target for antineoplastic therapy. Proc. Natl. Acad. Sci. USA 1994, 91, 6379–6383. [Google Scholar] [CrossRef] [PubMed]
- Chajes, V.; Lanson, M.; Fetissof, F.; Lhuillery, C.; Bougnoux, P. Membrane fatty acids of breast carcinoma: Contribution of host fatty acids and tumor properties. Int. J. Cancer 1995, 63, 169–175. [Google Scholar] [CrossRef] [PubMed]
- Ramos, C.V.; Taylor, H.B. Lipid-rich carcinoma of the breast. A clinicopathologic analysis of 13 examples. Cancer 1974, 33, 812–819. [Google Scholar] [CrossRef]
- Tsubura, A.; Yuri, T.; Yoshizawa, K.; Uehara, N.; Takada, H. Role of fatty acids in malignancy and visual impairment: Epidemiological evidence and experimental studies. Histol. Histopathol. 2009, 24, 223–234. [Google Scholar] [PubMed]
- Machalekova, K.; Kajo, K.; Bencat, M. Unusual Occurrence of Rare Lipid-Rich Carcinoma and Conventional Invasive Ductal Carcinoma in the One Breast: Case Report. Case Rep. Pathol. 2012, 2012, 387045. [Google Scholar] [CrossRef] [PubMed]
- Murai, T. The Role of Lipid Rafts in Cancer Cell Adhesion and Migration. Int. J. Cell Biol. 2012, 2012, 763283. [Google Scholar] [CrossRef] [PubMed]
- Bagga, D.; Anders, K.H.; Wang, H.; Glaspy, J.A. Long-Chain n-3-to-n-6 Polyunsaturated Fatty Acid Ratios in Breast Adipose Tissue from Women with and without Breast Cancer. Nutr. Cancer 2002, 42, 180–185. [Google Scholar] [CrossRef] [PubMed]
- Vazquez-Martin, A.; Colomer, R.; Brunet, J.; Lupu, R.; Menendez, J.A. Overexpression of fatty acid synthase gene activates HER1/HER2 tyrosine kinase receptors in human breast epithelial cells. Cell Prolif. 2008, 41, 59–85. [Google Scholar] [CrossRef] [PubMed]
- Hilvo, M.; Denkert, C.; Lehtinen, L.; Muller, B.; Brockmoller, S.; Seppanen-Laakso, T.; Budczies, J.; Bucher, E.; Yetukuri, L.; Castillo, S.; et al. Novel theranostic opportunities offered by characterization of altered membrane lipid metabolism in breast cancer progression. Cancer Res. 2011, 71, 3236–3245. [Google Scholar] [CrossRef] [PubMed]
- Guo, D.; Reinitz, F.; Youssef, M.; Hong, C.; Nathanson, D.; Akhavan, D.; Kuga, D.; Amzajerdi, A.N.; Soto, H.; Zhu, S.; et al. An LXR Agonist Promotes Glioblastoma Cell Death through Inhibition of an EGFR/AKT/SREBP-1/LDLR–Dependent Pathway. Cancer Discov. 2011, 1, 442–456. [Google Scholar] [CrossRef] [PubMed]
- Bhalla, K.; Hwang, B.J.; Dewi, R.E.; Ou, L.; Twaddel, W.; Fang, H.B.; Vafai, S.B.; Vazquez, F.; Puigserver, P.; Girnun, L.B.G.D. PGC1α promotes tumor growth by inducing gene expression programs supporting Lipogenesis. Cancer Res. 2011, 71, 6888–6898. [Google Scholar] [CrossRef] [PubMed]


| Raman Shift (cm−1) | Molecular Assignment [44,45,46] |
|---|---|
| 756 | Tryptophan |
| 782 | cytosine and thymine |
| 810 | C05–O–P–O–C′3 phosphodiester bands |
| 825 | tyrosine (p) |
| 851 | ring breathing of tyrosine |
| 876 | Tryptophan |
| 936 | skeletal mode of polysaccharides |
| 986 | C–C or C–O in ribose |
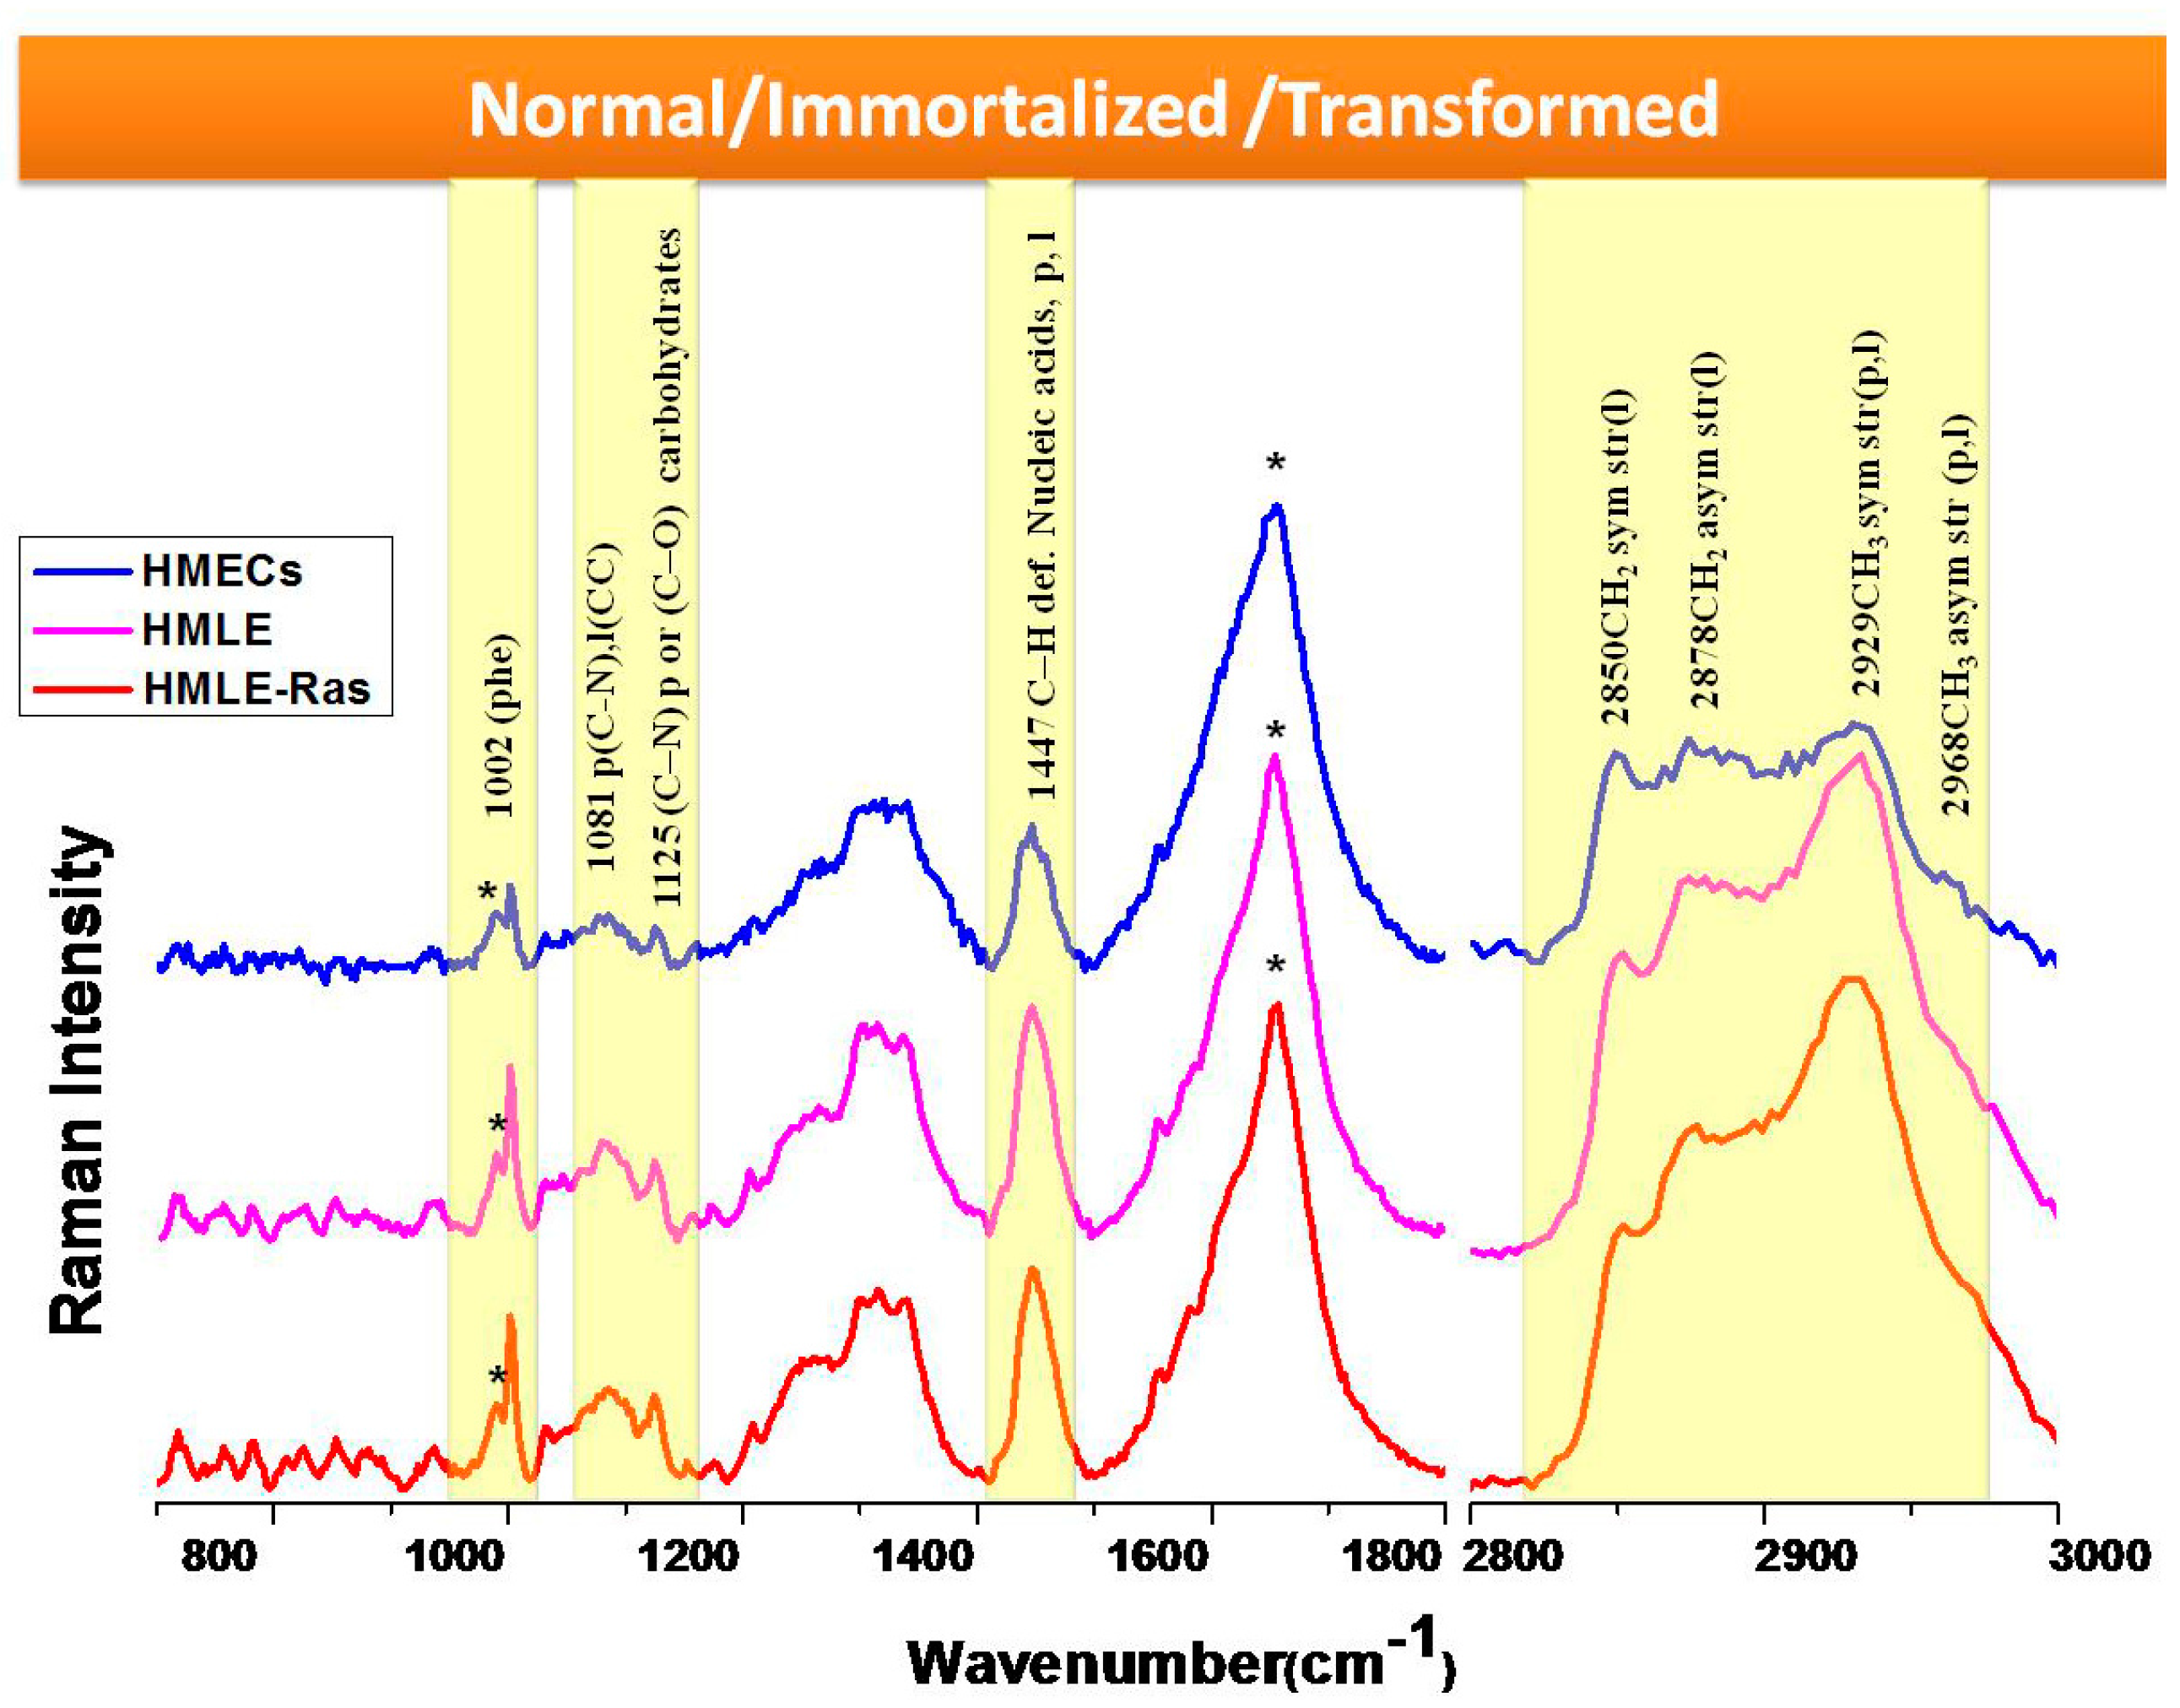
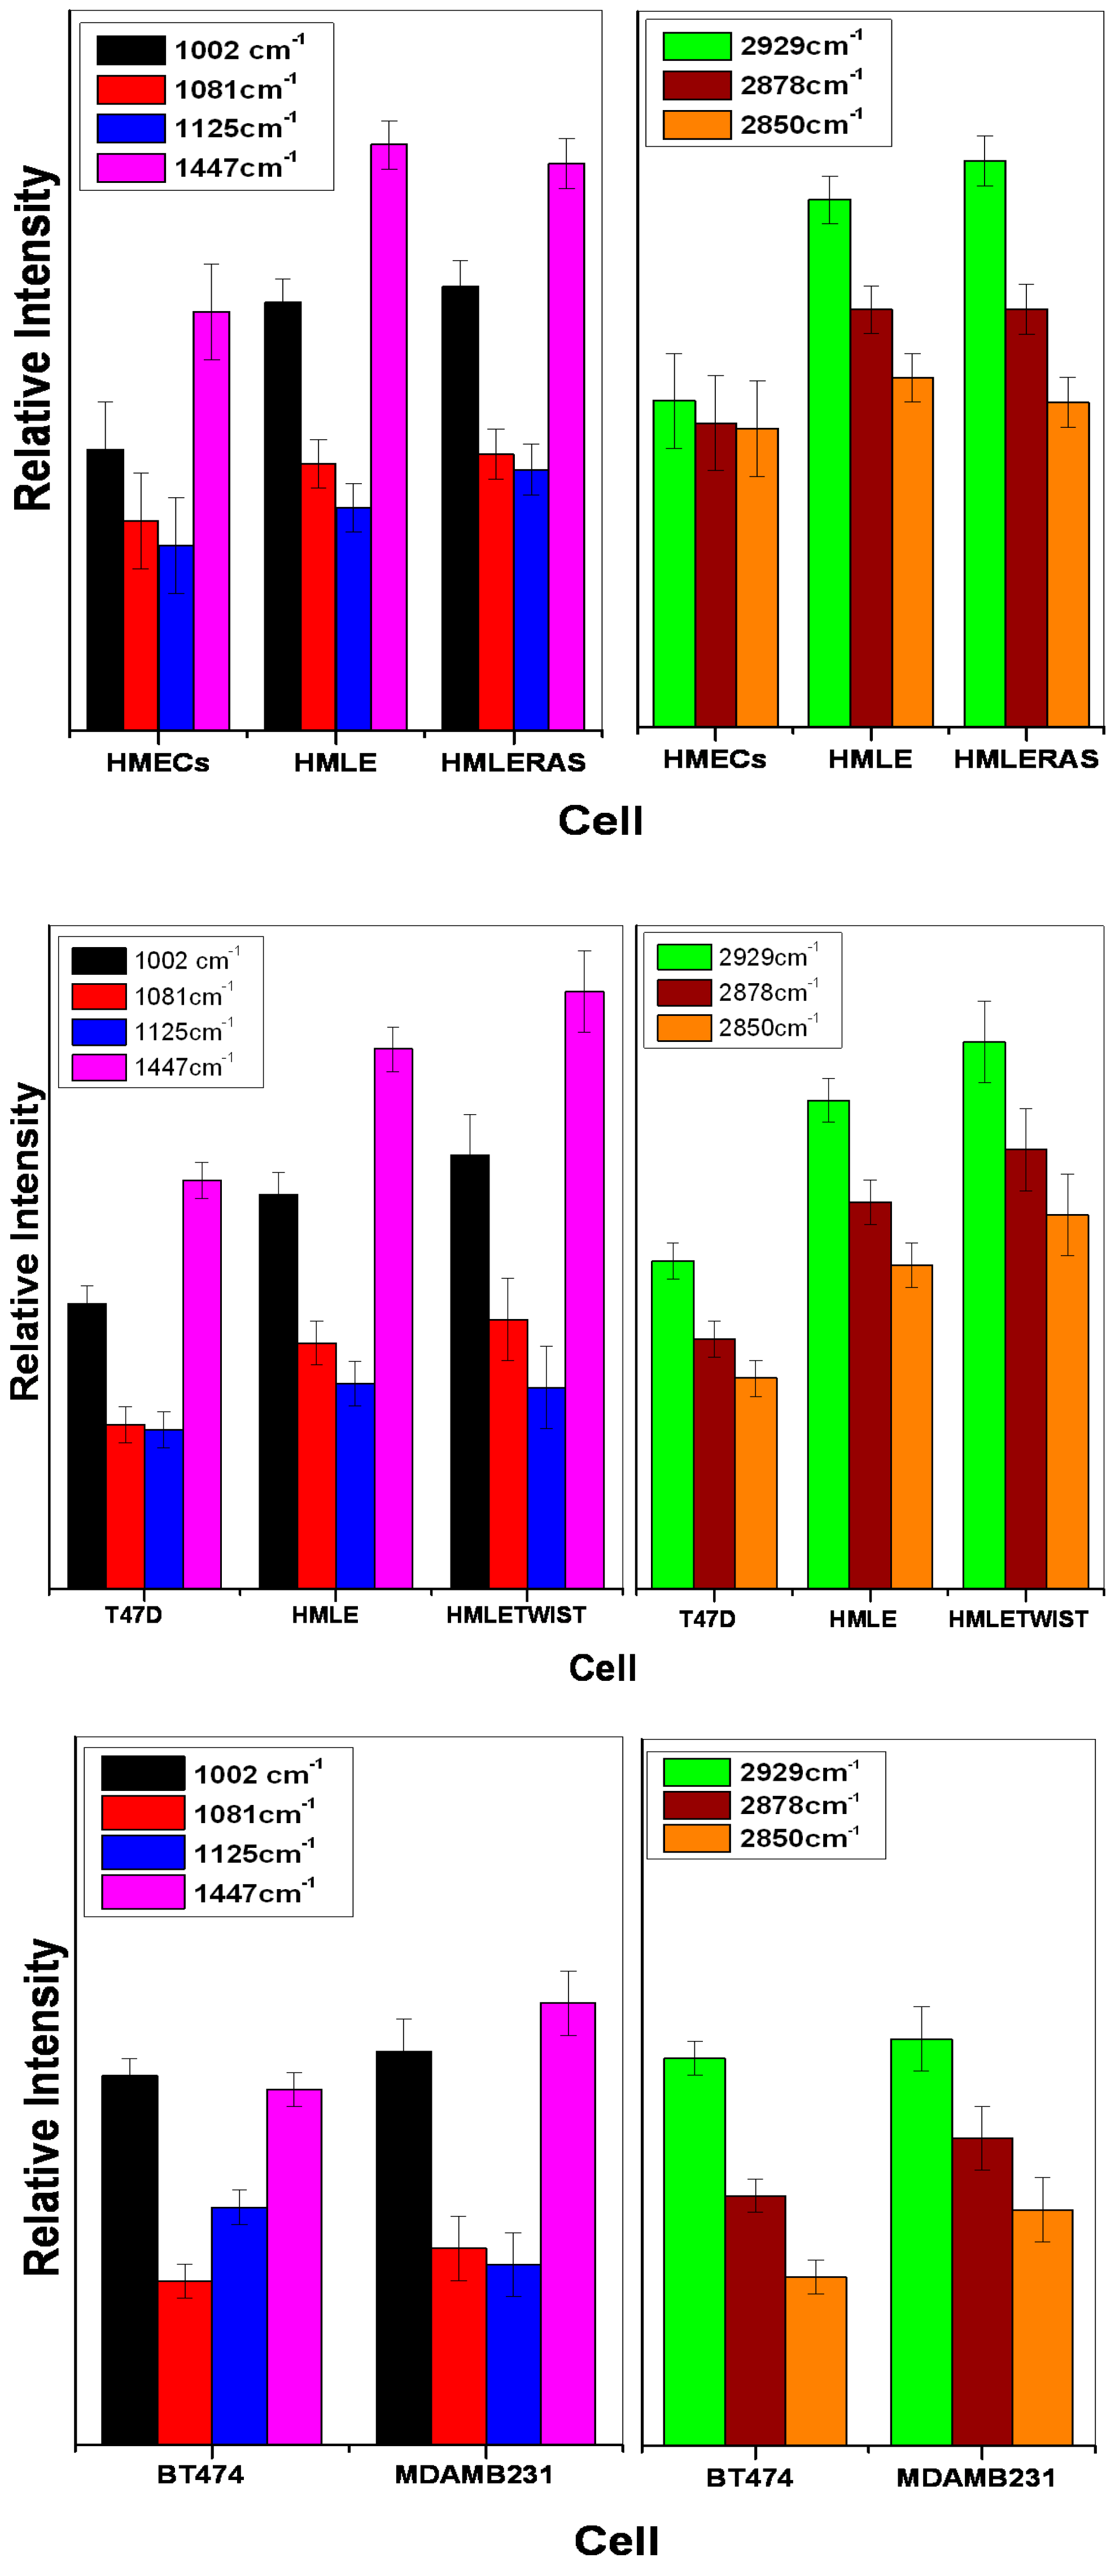
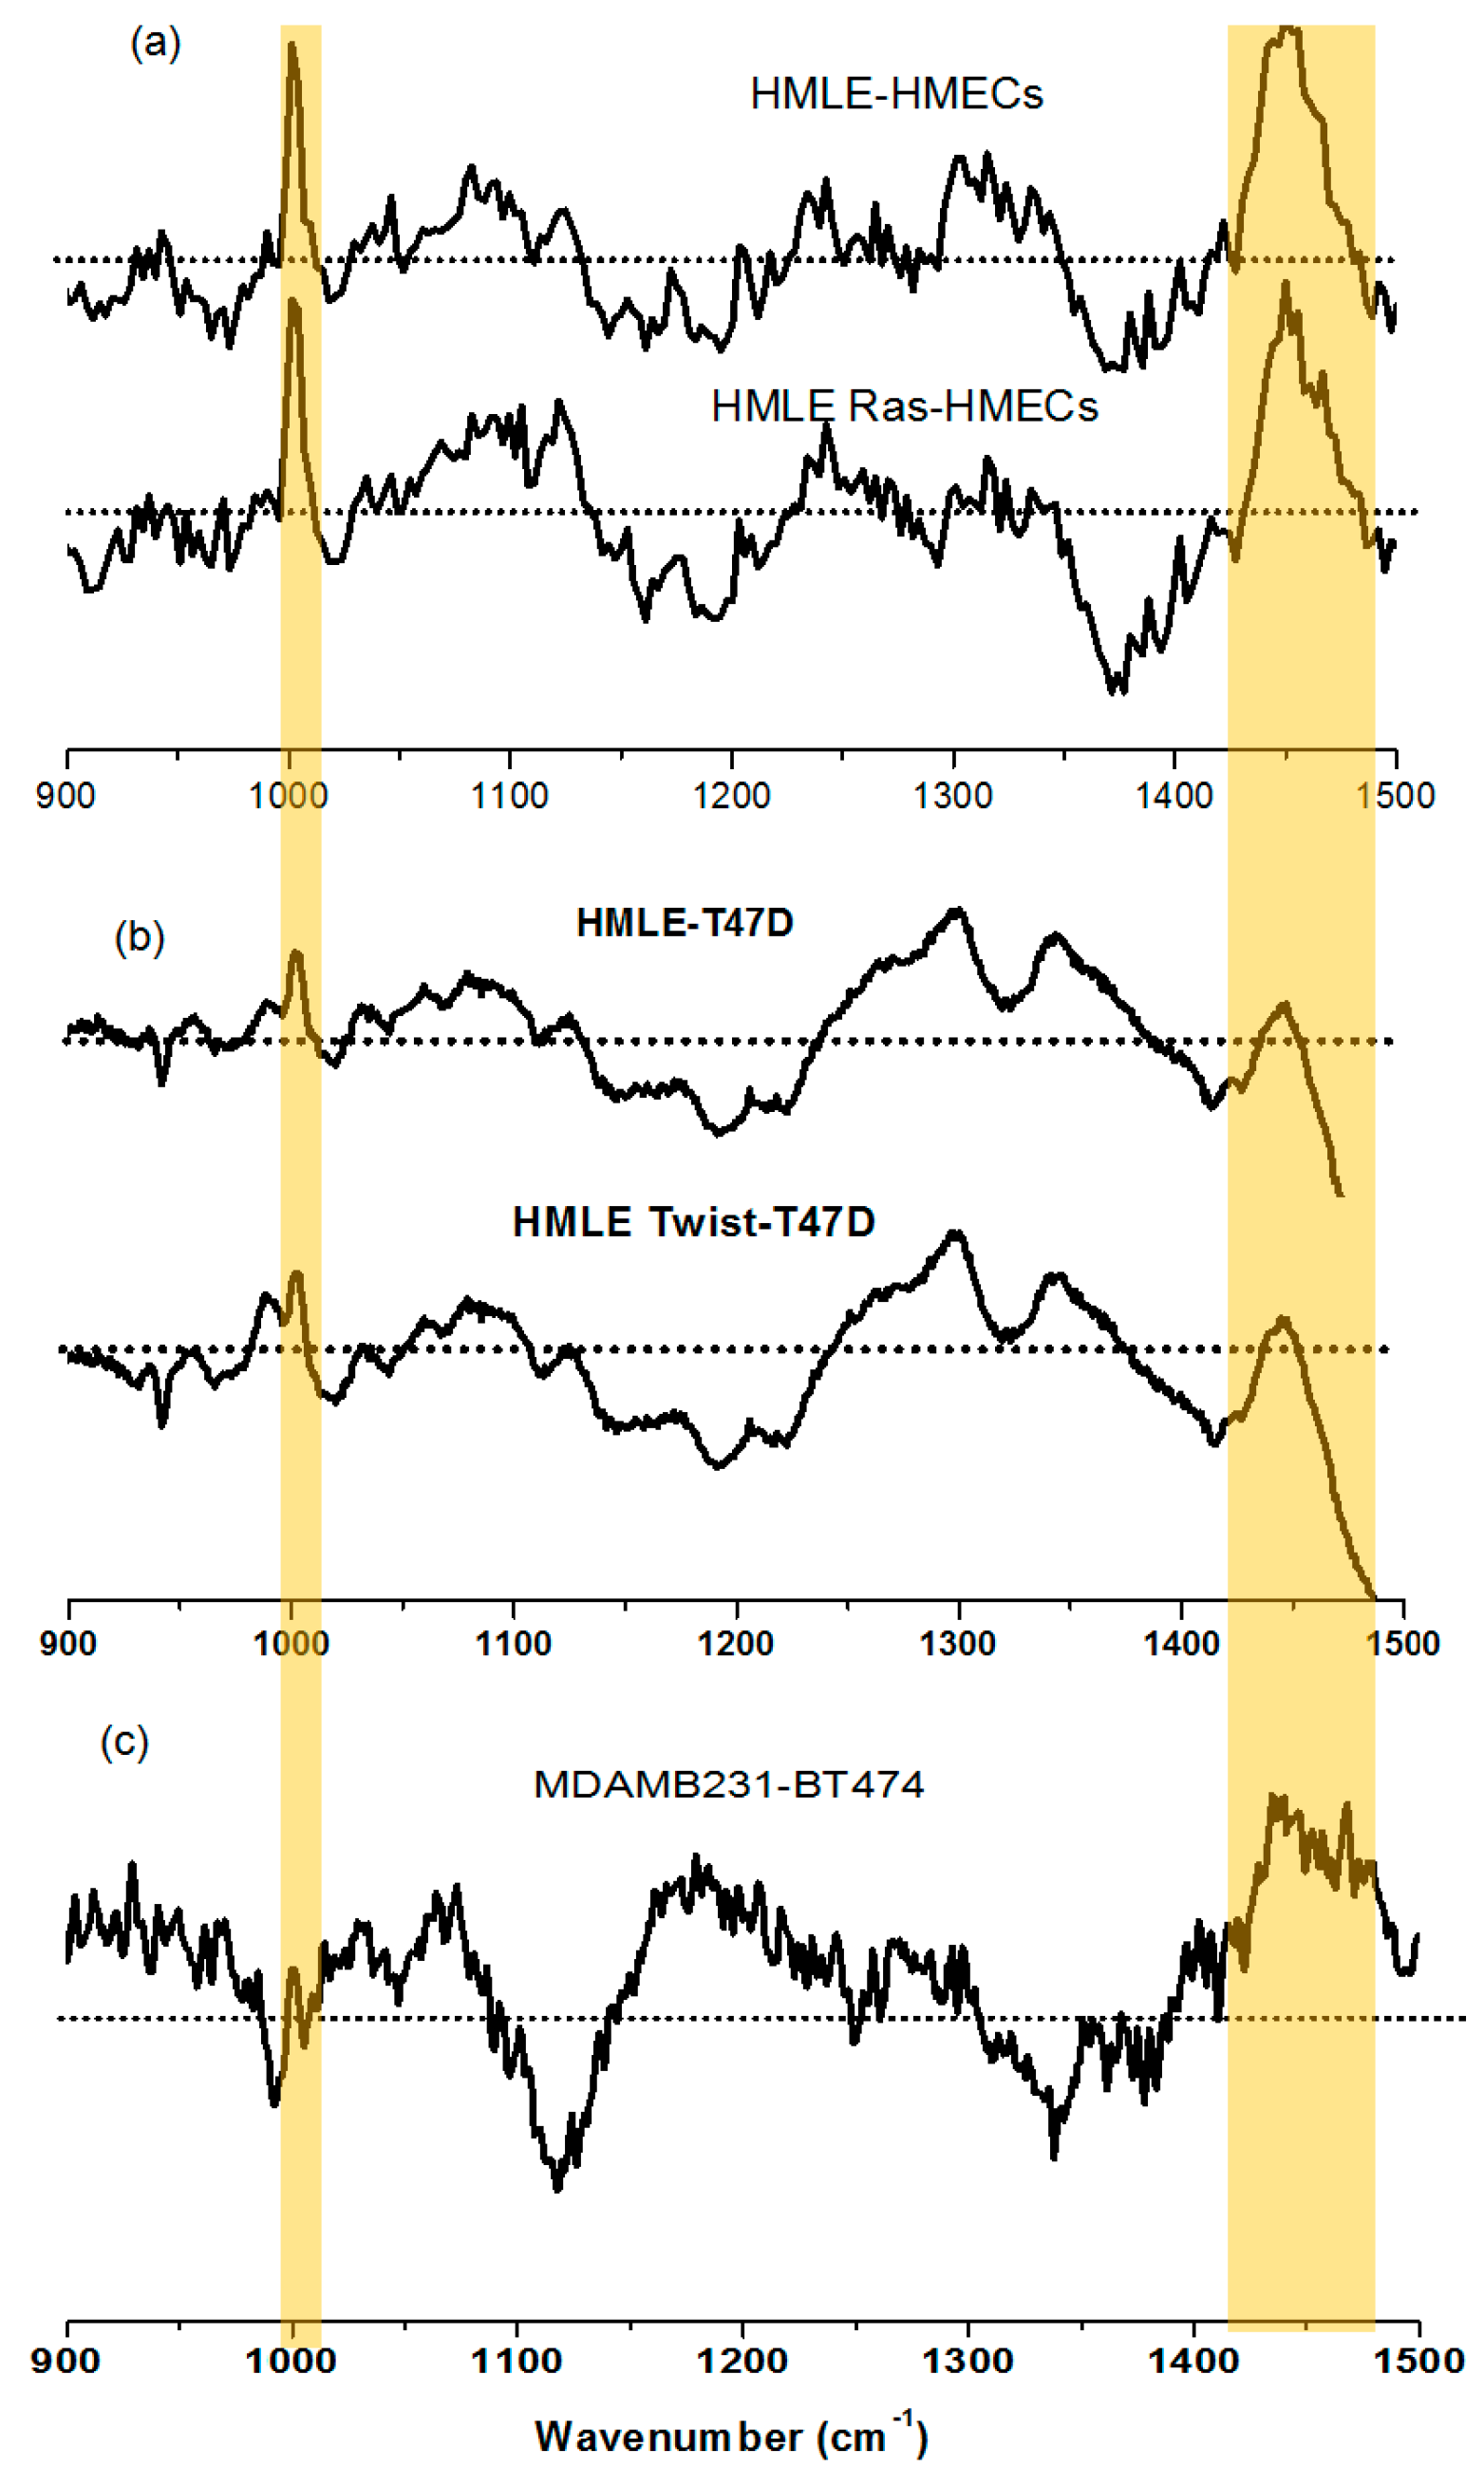
| 1002 | ring breathing of phenylalanine |
| 1031 | C–H in phenylalanine |
| 1065 | C–N, C–C stretch (p) |
| 1081 | C–N (p), CC (l) |
| 1095 | O–P–O symmetric stretching |
| 1125 | C–N str in protein or C–O str in carbohydrates |
| 1155, 1176 | Carotenoids |
| 1209 | stretching mode in phenylalanine and tyrosine |
| 1254 | amide III β sheet |
| 1268 | amide III (α helix of protein) |
| 1302 | CH2 deformation of phospholipids |
| 1318, 1339 | CH2 twist and bend (nucleic acids, proteins, lipids) |
| 1447 | C–H def. nucleic acids, proteins, lipids |
| 1582 | adenine, guanine (nucleic acid) |
| 1606, 1665 | aromatic amino acids (p) |
| 1654 | amide I (p) |
| 2850 | CH2symstr (l) |
| 2878 | CH2asymstr (l) |
| 2929 | CH3symstr (p,l) |
| 2968 | CH3asymstr (p,l) |
© 2016 by the authors; licensee MDPI, Basel, Switzerland. This article is an open access article distributed under the terms and conditions of the Creative Commons Attribution (CC-BY) license (http://creativecommons.org/licenses/by/4.0/).
Share and Cite
Chaturvedi, D.; Balaji, S.A.; Bn, V.K.; Ariese, F.; Umapathy, S.; Rangarajan, A. Different Phases of Breast Cancer Cells: Raman Study of Immortalized, Transformed, and Invasive Cells. Biosensors 2016, 6, 57. https://doi.org/10.3390/bios6040057
Chaturvedi D, Balaji SA, Bn VK, Ariese F, Umapathy S, Rangarajan A. Different Phases of Breast Cancer Cells: Raman Study of Immortalized, Transformed, and Invasive Cells. Biosensors. 2016; 6(4):57. https://doi.org/10.3390/bios6040057
Chicago/Turabian StyleChaturvedi, Deepika, Sai A. Balaji, Vinay Kumar Bn, Freek Ariese, Siva Umapathy, and Annapoorni Rangarajan. 2016. "Different Phases of Breast Cancer Cells: Raman Study of Immortalized, Transformed, and Invasive Cells" Biosensors 6, no. 4: 57. https://doi.org/10.3390/bios6040057