
Non-Response to Antibiotic Treatment in Adolescents for Four Common Infections in UK Primary Care 1991–2012: A Retrospective, Longitudinal Study

 ,
,
Abstract
:1. Introduction
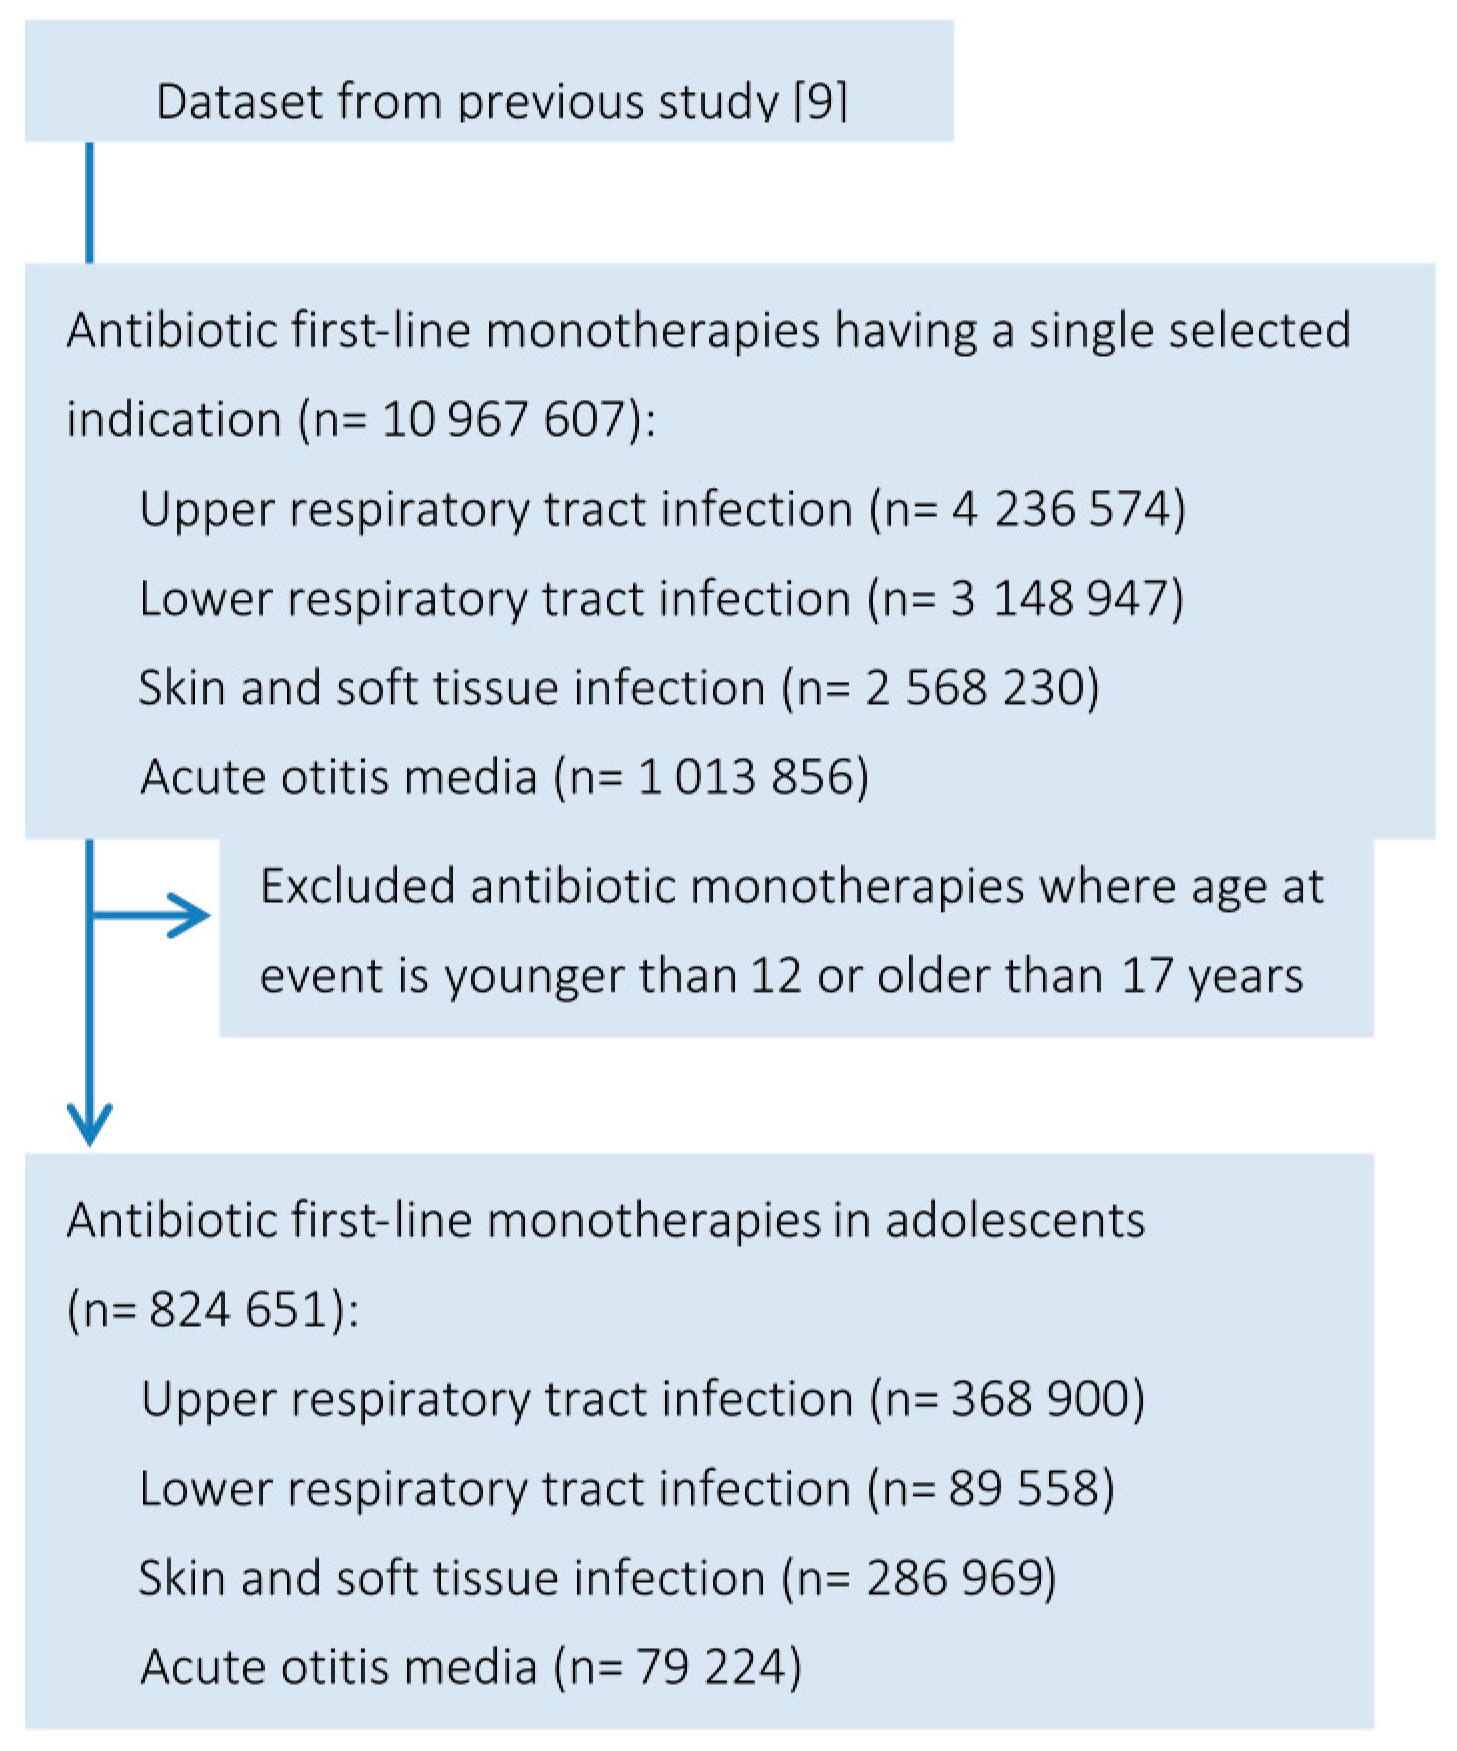
2. Methods
2.1. Data Source
2.2. Classification of Infection
2.3. Identification of Antibiotic Treatments
2.4. Infection Rates and Antibiotic Prescription over Time
2.5. Antibiotic Treatment Non-Response Rates
2.6. Statistical Analysis
3. Results
3.1. Baseline Characteristics
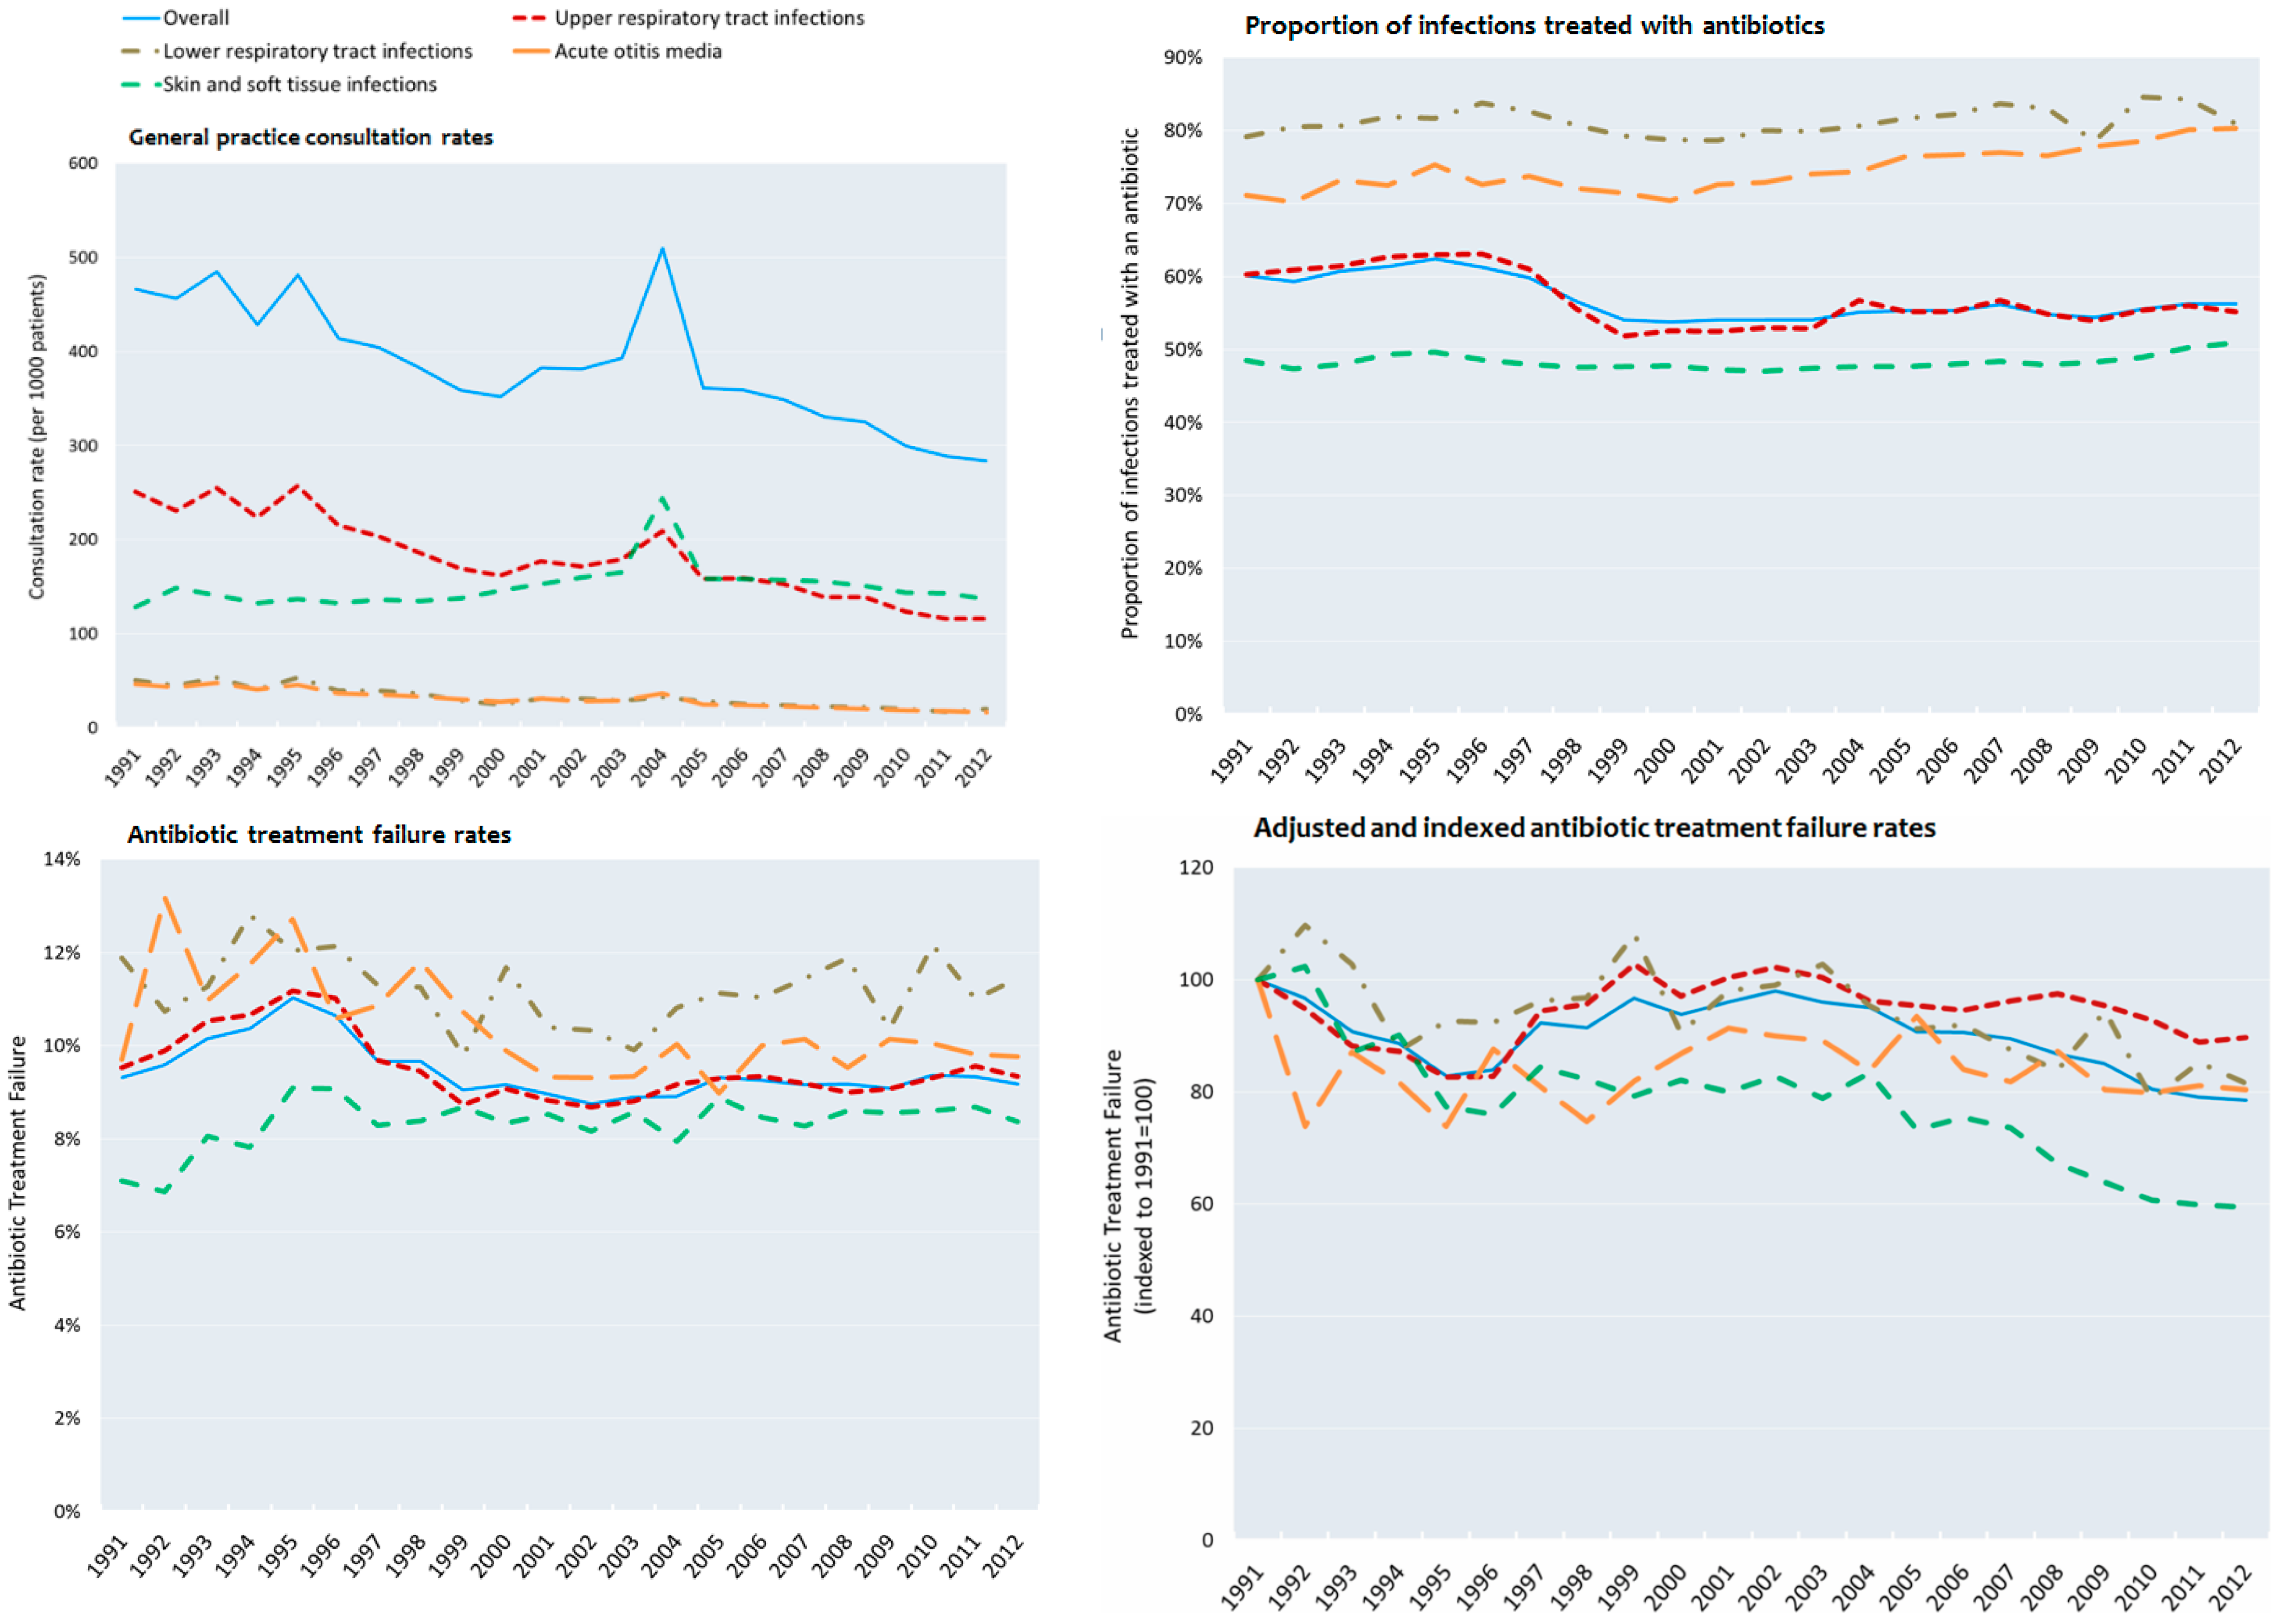
3.2. Consultation Rates
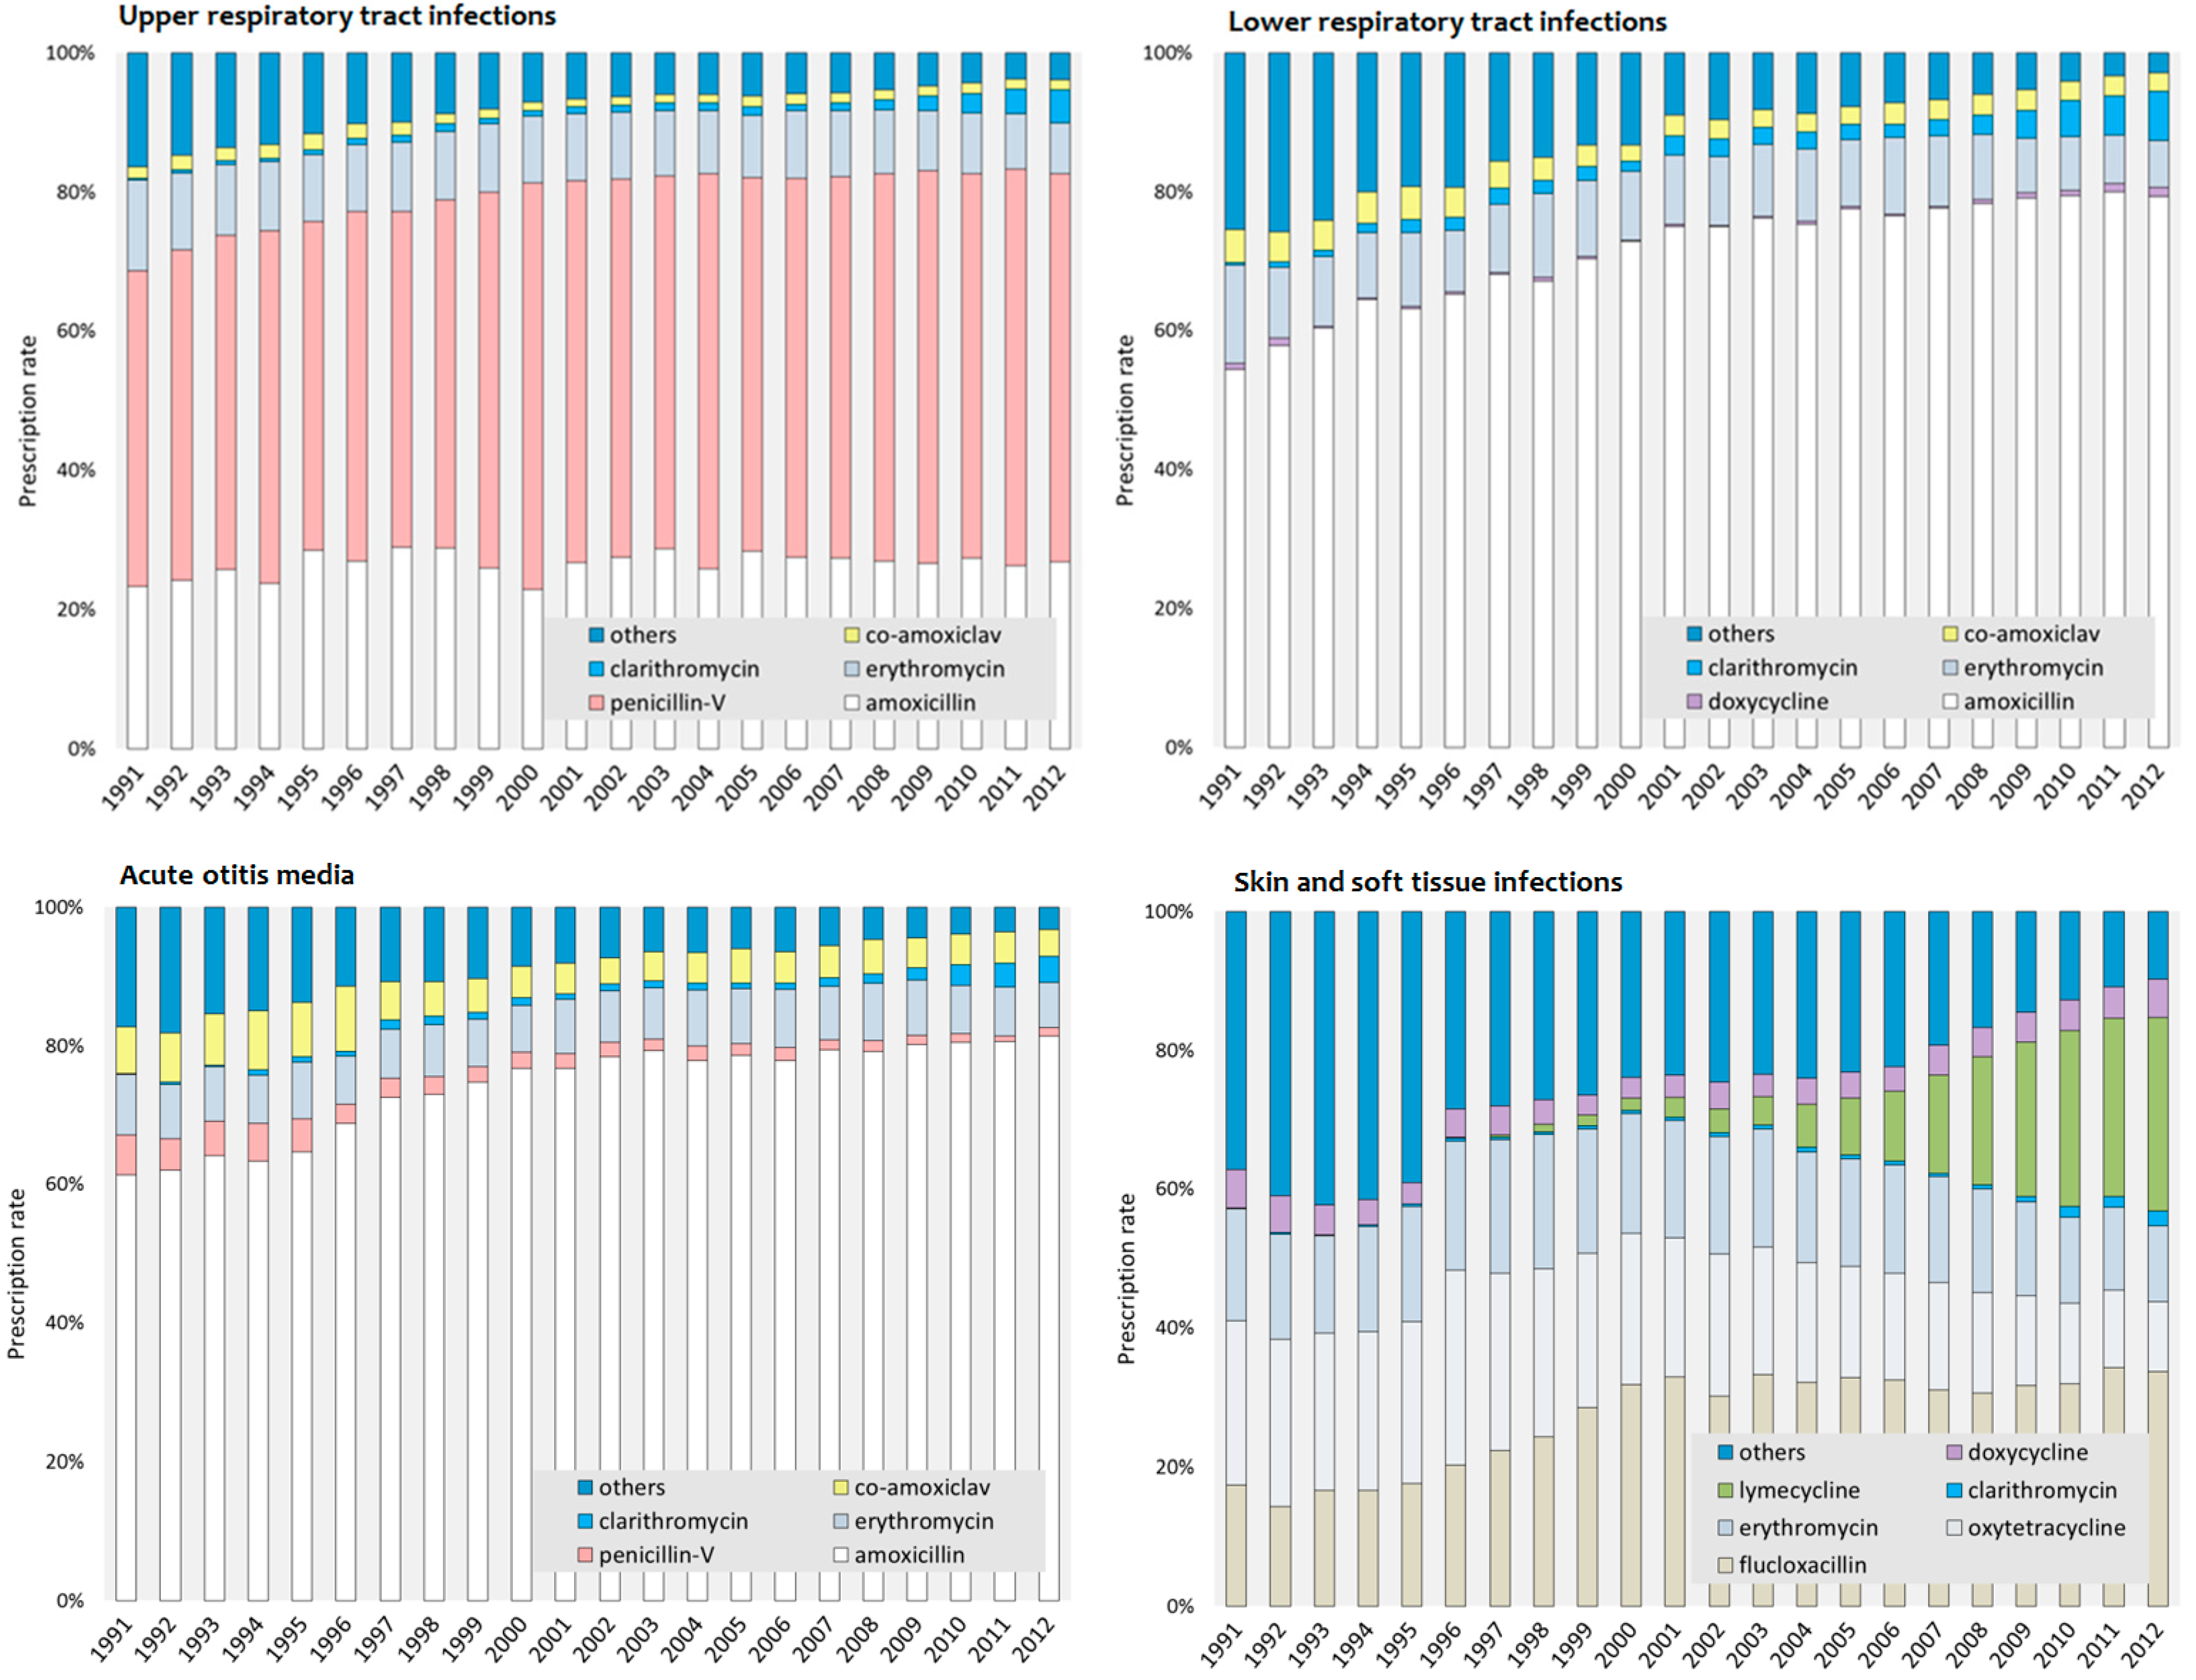
3.3. Most Commonly Prescribed Antibiotics in Adolescents
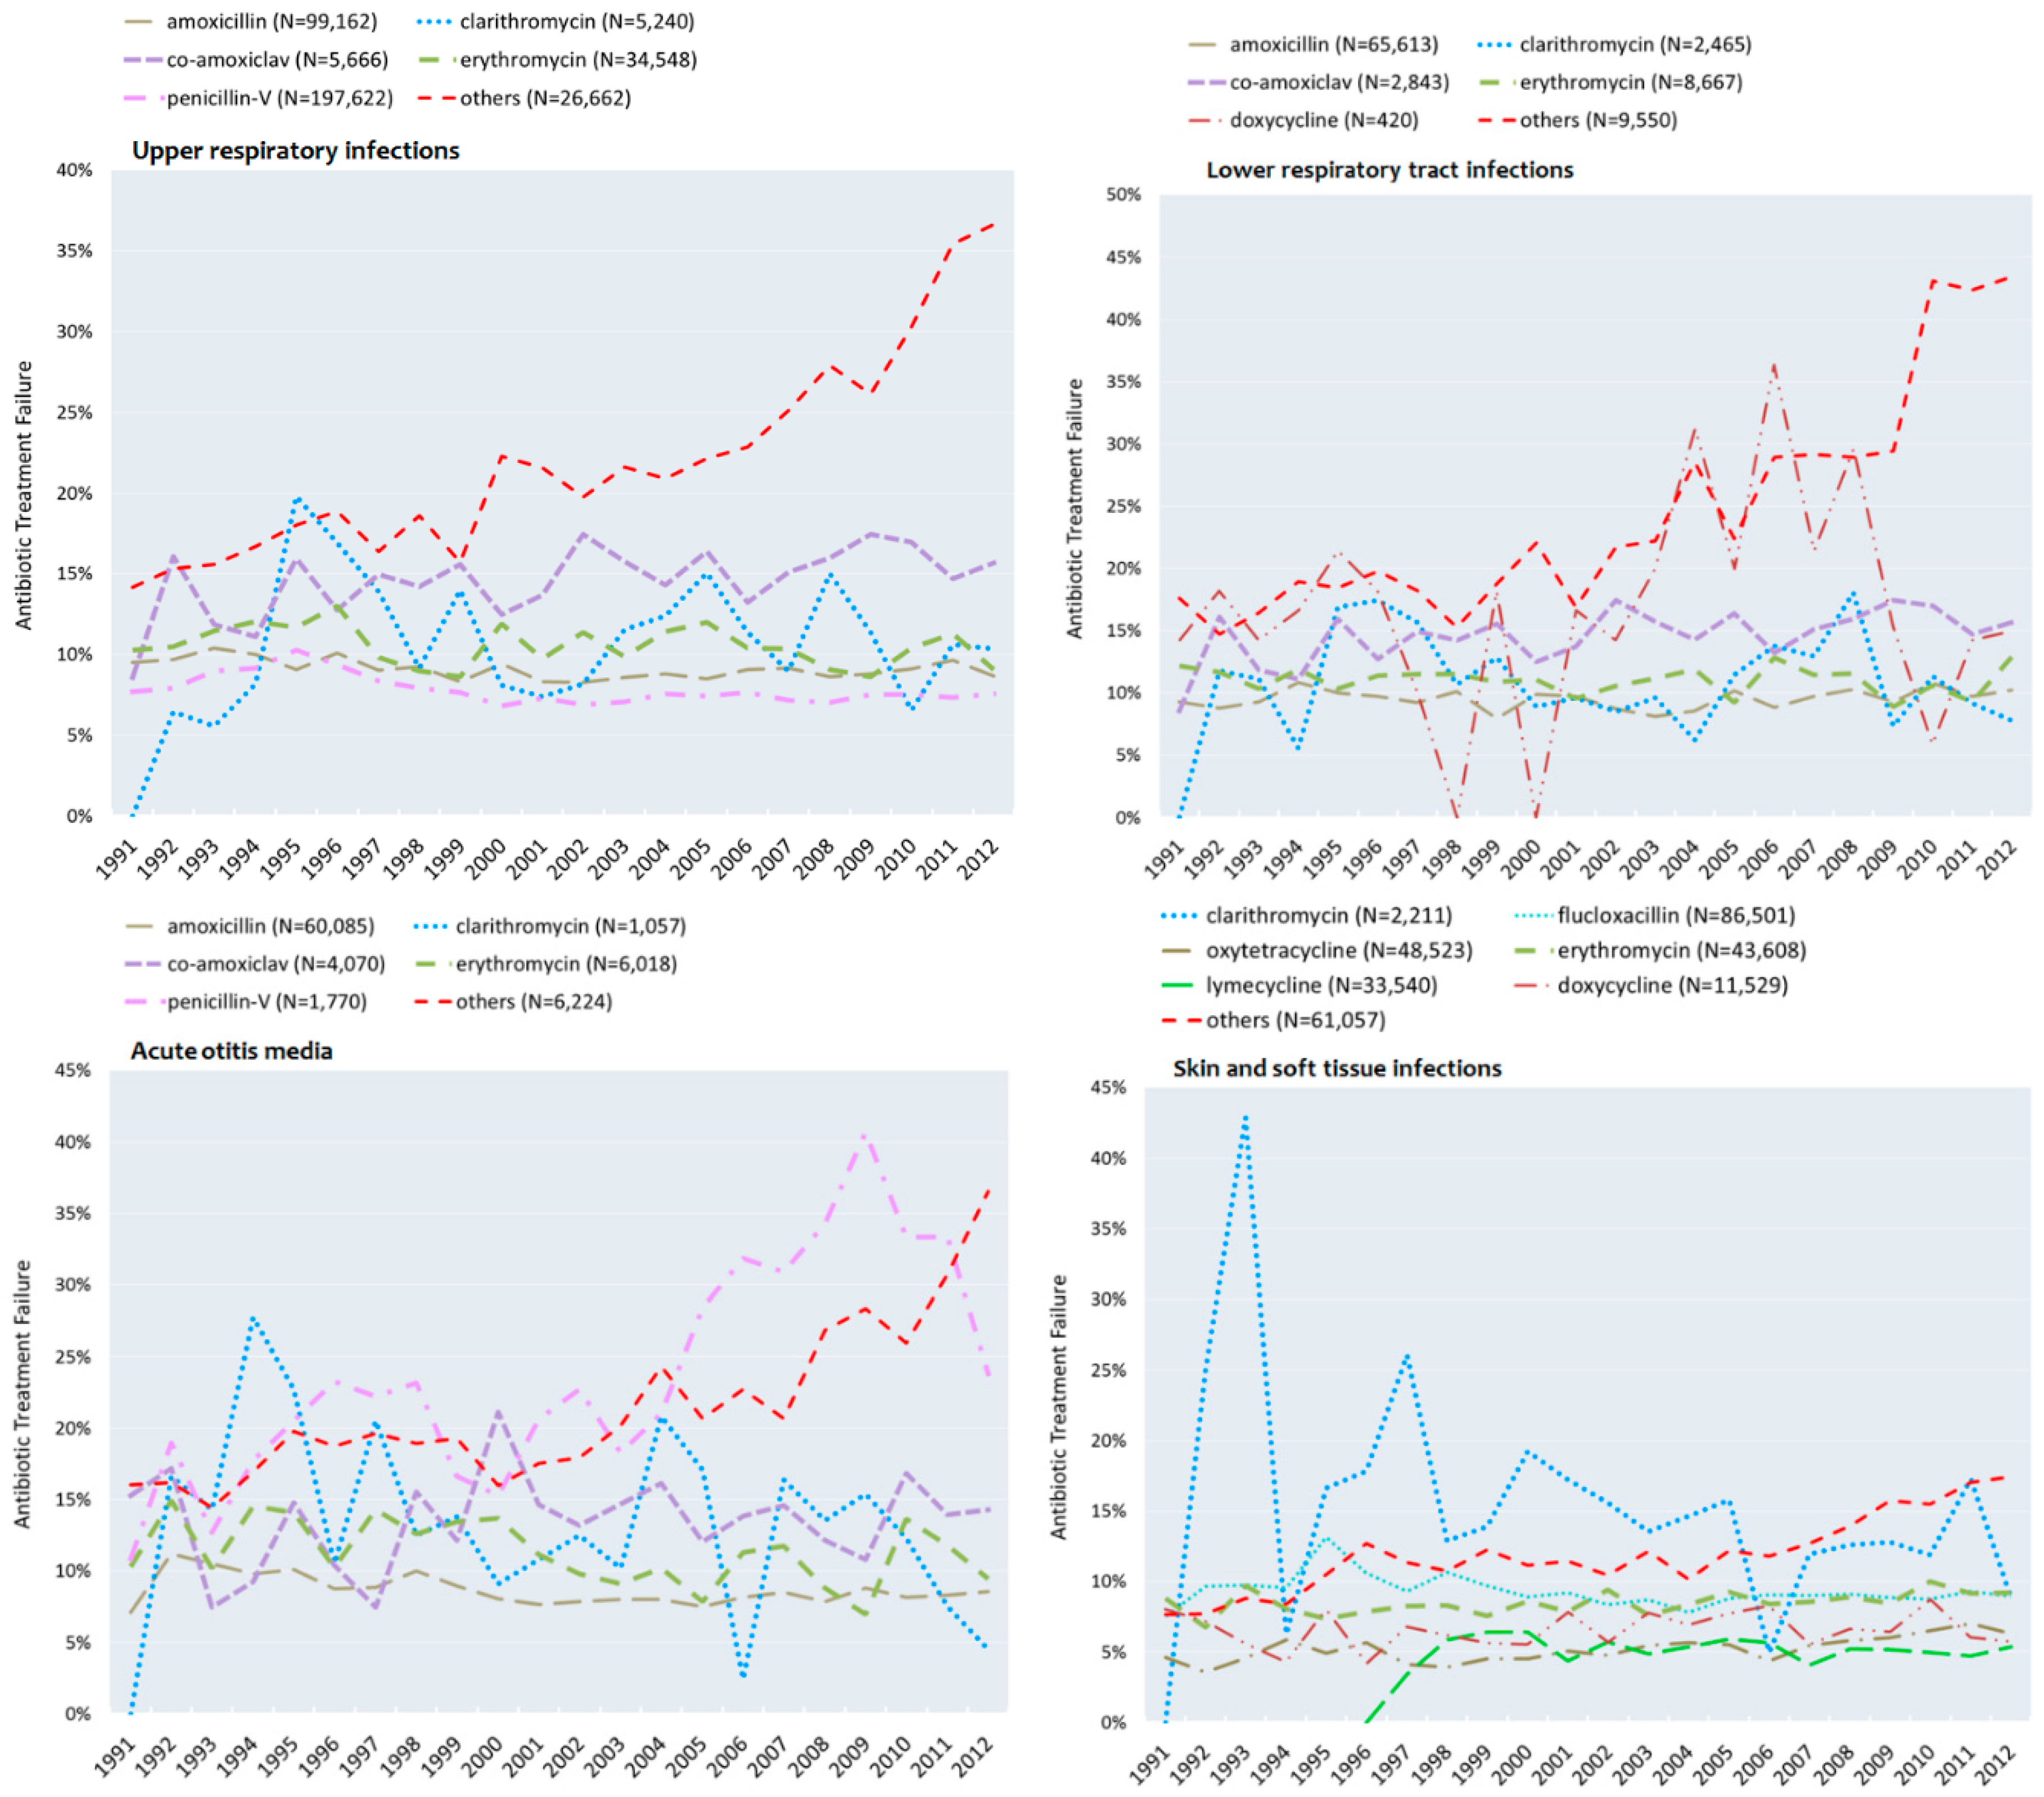
3.4. Failure to Respond to Antibiotics in Adolescents
3.5. Adjusted Rates of Non-Response of Antibiotic Treatment
4. Discussion
5. Limitations
6. Conclusions
Acknowledgments
Author Contributions
Conflicts of Interest
References
- Bulla, A.; Hitze, K.L. Acute respiratory infections: A review. Bull. World Health Organ. 1978, 56, 481–498. [Google Scholar] [PubMed]
- Butler, C.C.; Hillier, S.; Roberts, Z.; Dunstan, F.; Howard, A.; Palmer, S. Antibiotic-resistant infections in primary care are symptomatic for longer and increase workload: Outcomes for patients with E. coli UTIs. Br. J. Gen. Pract. 2006, 56, 686–692. [Google Scholar] [PubMed]
- World Health Organization. Antimicrobial Resistance: Global Report on Surveillance; WHO Press: Geneva, Switzerland, 2014. [Google Scholar]
- Simpson, S.A.; Wood, F.; Butler, C.C. General practitioners’ perceptions of antimicrobial resistance: A qualitative study. J. Antimicrob. Chemother. 2007, 59, 292–296. [Google Scholar] [CrossRef] [PubMed]
- Costelloe, C.; Metcalfe, C.; Lovering, A.; Mant, D.; Hay, A.D. Effect of antibiotic prescribing in primary care on antimicrobial resistance in individual patients: Systematic review and meta-analysis. BMJ 2010, 18, 340–2096. [Google Scholar] [CrossRef] [PubMed]
- Cosby, J.L.; Francis, N.; Butler, C.C. The role of evidence in the decline of antibiotic use for common respiratory infections in primary care. Lancet Infect. Dis. 2007, 7, 749–756. [Google Scholar] [CrossRef]
- Gonzales, R.; Malone, D.C.; Maselli, J.H.; Sande, M.A. Excessive antibiotic use for acute respiratory infections in the United States. Clin. Infect. Dis. 2001, 33, 757–762. [Google Scholar] [CrossRef] [PubMed]
- Grossman, Z.; del Torso, S.; Hadjipanayis, A.; van Esso, D.; Drabik, A.; Sharland, M. Antibiotic prescribing for upper respiratory infections: European primary paediatricians’ knowledge, attitudes and practice. Acta Paediatr. 2012, 101, 935–940. [Google Scholar] [CrossRef] [PubMed]
- Kacou-N'douba, A.; Guessennd-Kouadio, N.; Kouassi-M'bengue, A.; Dosso, M. Evolution of S. pneumoniae antibiotic resistance in Abidjan: Update on nasopharyngeal carriage from 1997–2001. Med. Mal. Infect. 2004, 34, 83–85. [Google Scholar] [CrossRef] [PubMed]
- Coenen, S.; Goossens, H. Antibiotic treatment failure in primary care. BMJ 2014, 349, g5970. [Google Scholar] [CrossRef] [PubMed]
- Currie, C.J.; Berni, E.; Jenkins-Jones, S.; Poole, C.D.; Ouwens, M.; Driessen, S.; de Voogd, H.; Butler, C.C.; Morgan, C.L. Antibiotic treatment failure in four common infections in UK primary care 1991–2012: Longitudinal analysis. BMJ 2014, 349, g5493. [Google Scholar] [CrossRef] [PubMed]
- Herrett, E.; Gallagher, A.M.; Bhaskaran, K.; Forbes, H.; Mathur, R.; van Staa, T.; Smeeth, L. Data resource profile: Clinical Practice Research Datalink (CPRD). Int. J. Epidemiol. 2015, 44, 827–836. [Google Scholar] [CrossRef] [PubMed]
- Hagell, A.; Coleman, J.; Brooks, F. Key Data on Adolescence 2013; Association for Young People’s Health: London, UK, 2013. [Google Scholar]
- Public Health England. Management of Infection Guidance for Primary Care for Consultation and Local Adaptation 2015. Available online: https://www.gov.uk/government/uploads/system/uploads/attachment_data/file/455298/230415_Managing_Common_Infections_-_full_guide_with_rationale.pdf (accessed on 13 February 2016).
- Hawker, J.I.; Smith, S.; Smith, G.E.; Morbey, R.; Johnson, A.P.; Fleming, D.M.; Shallcross, L.; Hayward, A.C. Trends in antibiotic prescribing in primary care for clinical syndromes subject to national recommendations to reduce antibiotic resistance, UK 1995–2011: Analysis of a large database of primary care consultations. J. Antimicrob. Chemother. 2014, 69, 3423–3430. [Google Scholar] [CrossRef] [PubMed]


| Baseline Characteristic | Upper Respiratory | Lower Respiratory | Skin and Soft Tissue | Acute Otitis Media | Overall | |||||
|---|---|---|---|---|---|---|---|---|---|---|
| 1991–1995 | 2008–2012 | 1991–1995 | 2008–2012 | 1991–1995 | 2008–2012 | 1991–1995 | 2008–2012 | 1991–1995 | 2008–2012 | |
| No of patients, n | 32,150 | 73,528 | 10,063 | 20,259 | 13,768 | 66,937 | 8614 | 18,179 | 50,157 | 151,200 |
| Antibiotic monotherapies, n | 52,830 | 99,726 | 13,258 | 23,529 | 22,566 | 100,719 | 10,917 | 20,714 | 99,571 | 244,688 |
| Male, n (%) | 14,745 (45.9%) | 30,354 (41.3%) | 5411 (53.8%) | 10,754 (53.1%) | 7635 (55.5%) | 33,426 (49.9%) | 4309 (50.0%) | 8510 (46.8%) | 25,151 (50.1%) | 71,113 (47.0%) |
| Female, n (%) | 17,405 (54.1%) | 43,174 (58.7%) | 4652 (46.2%) | 9505 (46.9%) | 6133 (44.5%) | 33,511 (50.1%) | 4305 (50.0%) | 9669 (53.2%) | 25,006 (49.9%) | 80,087 (53.0%) |
| Age, years, mean (SD) | 14.4 (1.7) | 14.7 (1.7) | 14.4 (1.7) | 14.6 (1.7) | 15.1 (1.5) | 15.1 (1.5) | 13.9 (1.6) | 14.1 (1.7) | 14.5 (1.7) | 14.8 (1.7) |
| Smoking, n (%): | ||||||||||
| Never or not known | 24,285 (46.0%) | 63,936 (64.1%) | 6032 (45.5%) | 15,446 (65.6%) | 11,216 (49.7%) | 71,795 (71.3%) | 4841 (44.3%) | 12,127 (58.5%) | 46,374 (46.6%) | 163,304 (66.7%) |
| Ex–smoker | 1575 (3.0%) | 1085 (1.1%) | 467 (3.5%) | 277 (1.2%) | 634 (2.8%) | 863 (0.9%) | 318 (2.9%) | 120 (0.6%) | 2994 (3.0%) | 2345 (0.9%) |
| Current | 12,918 (24.5%) | 8646 (8.7%) | 3520 (26.6%) | 2645 (11.2%) | 4481 (19.9%) | 5044 (5.0%) | 2445 (22.4%) | 1085 (5.2%) | 23,364 (23.5%) | 17,420 (7.1%) |
| BMI, kg·m−2, mean (SD) | 21.7 (4.4) | 23.0 (5.5) | 21.5 (4.6) | 22.8 (5.6) | 21.6 (3.9) | 22.9 (5.2) | 21.5 (4.7) | 23.3 (6.1) | 21.6 (4.4) | 22.9 (5.4) |
| Blood pressure, mmHg, mean (SD): | ||||||||||
| Systolic | 112.3 (12.3) | 111.8 (12.4) | 112.2 (13.0) | 112.0 (12.7) | 113.8 (12.4) | 112.6 (12.5) | 111.9 (13.6) | 111.6 (12.7) | 112.6 (12.6) | 112.1 (12.5) |
| Diastolic | 69.0 (8.8) | 68.1 (8.7) | 68.7 (8.6) | 68.2 (9.1) | 69.6 (8.5) | 68.1 (8.6) | 68.2 (8.9) | 68.1 (9.1) | 69.0 (8.7) | 68.1 (8.7) |
| Co–medications, n (%): | ||||||||||
| Systemic corticosteroid | 201 (0.4%) | 932 (0.9%) | 370 (2.8%) | 1881 (8.0%) | 63 (0.3%) | 348 (0.3%) | 40 (0.4%) | 97 (0.5%) | 674 (0.6%) | 3258 (1.3%) |
| Bronchodilator | 3181 (6.0%) | 7058 (7.1%) | 2,951 (22.3%) | 6917 (29.4%) | 856 (3.8%) | 3963 (3.9%) | 551 (5.0%) | 1138 (5.5%) | 7539 (7.6%) | 19,076 (7.8%) |
| Inhaled corticosteroid | 1673 (3.2%) | 4444 (4.5%) | 1296 (9.8%) | 3840 (16.3%) | 418 (1.9%) | 2560 (2.5%) | 334 (3.1%) | 758 (3.7%) | 3721 (3.7%) | 11,602 (4.7%) |
| Infection Site | Antibiotic | Therapy Rates | Antibiotic Treatment Non-Response Rates | ||||||
|---|---|---|---|---|---|---|---|---|---|
| Average 1991–1995 | Average 2008–2012 | Average 1991–1995 | Average 2008–2012 | ||||||
| % (Rank Order) | % (Rank Order) | % (Rank Order) | % (Rank Order) | ||||||
| URTIs | Penicillin-V | 47.9 | (1) | 56.0 | (1) | 8.8% | (2) | 7.4% | (1) |
| Amoxicillin | 25.6 | (2) | 26.8 | (2) | 9.7% | (3) | 9.0% | (2) | |
| Others a | 13.5 | (3) | 4.5 | (4) | 16.0% | (6) | 31.3% | (6) | |
| Erythromycin | 10.5 | (4) | 8.4 | (3) | 11.2% | (4) | 9.7% | (3) | |
| Co-amoxiclav | 2.0 | (5) | 1.5 | (6) | 12.7% | (5) | 16.2% | (5) | |
| Clarithromycin | 0.5 | (6) | 2.8 | (5) | 8.0% | (1) | 10.8% | (4) | |
| LRTIs | Amoxicillin | 60.9 | (1) | 79.1 | (1) | 9.6% | (2) | 10.1% | (1) |
| Others b | 22.3 | (2) | 4.5 | (4) | 17.2% | (6) | 37.4% | (6) | |
| Erythromycin | 10.6 | (3) | 7.9 | (2) | 11.3% | (3) | 10.7% | (2) | |
| Co-amoxiclav | 4.5 | (4) | 2.9 | (5) | 12.6% | (4) | 13.8% | (4) | |
| Clarithromycin | 1.2 | (5) | 4.8 | (3) | 9.1% | (1) | 10.7% | (3) | |
| Doxycycline | 0.5 | (6) | 0.9 | (6) | 17.0% | (5) | 16.0% | (5) | |
| SSTIs | Others c | 40.4 | (1) | 13.0 | (3) | 8.6% | (4) | 15.9% | (7) |
| Oxytetracycline | 23.2 | (2) | 12.1 | (5) | 4.7% | (1) | 6.3% | (2) | |
| Flucloxacillin | 16.6 | (3) | 32.4 | (1) | 9.9% | (5) | 9.0% | (4) | |
| Erythromycin | 15.4 | (4) | 12.8 | (4) | 8.2% | (3) | 9.1% | (5) | |
| Doxycycline | 4.2 | (5) | 4.6 | (6) | 6.6% | (2) | 6.7% | (3) | |
| Clarithromycin | 0.2 | (6) | 1.3 | (7) | 18.2% | (6) | 12.7% | (6) | |
| Lymecycline | - | - | 23.8 | (2) | - | - | 5.1% | (1) | |
| AOM | Amoxicillin | 63.4 | (1) | 80.3 | (1) | 9.7% | (1) | 8.4% | (1) |
| Others d | 15.6 | (2) | 4.0 | (4) | 16.7% | (6) | 29.7% | (5) | |
| Erythromycin | 7.9 | (3) | 7.5 | (2) | 12.8% | (3) | 10.1% | (2) | |
| Co-amoxiclav | 7.6 | (4) | 4.5 | (3) | 12.8% | (2) | 13.6% | (4) | |
| Penicillin-V | 5.0 | (5) | 1.2 | (6) | 16.2% | (4) | 33.1% | (6) | |
| Clarithromycin | 0.5 | (6) | 2.5 | (5) | 16.3% | (5) | 10.7% | (3) | |
© 2016 by the authors; licensee MDPI, Basel, Switzerland. This article is an open access article distributed under the terms and conditions of the Creative Commons Attribution (CC-BY) license (http://creativecommons.org/licenses/by/4.0/).
Share and Cite
Berni, E.; Scott, L.A.; Jenkins-Jones, S.; De Voogd, H.; Rocha, M.S.; Butler, C.C.; Morgan, C.L.; Currie, C.J. Non-Response to Antibiotic Treatment in Adolescents for Four Common Infections in UK Primary Care 1991–2012: A Retrospective, Longitudinal Study. Antibiotics 2016, 5, 25. https://doi.org/10.3390/antibiotics5030025
Berni E, Scott LA, Jenkins-Jones S, De Voogd H, Rocha MS, Butler CC, Morgan CL, Currie CJ. Non-Response to Antibiotic Treatment in Adolescents for Four Common Infections in UK Primary Care 1991–2012: A Retrospective, Longitudinal Study. Antibiotics. 2016; 5(3):25. https://doi.org/10.3390/antibiotics5030025
Chicago/Turabian StyleBerni, Ellen, Laura A. Scott, Sara Jenkins-Jones, Hanka De Voogd, Monica S. Rocha, Chris C. Butler, Christopher Ll. Morgan, and Craig J. Currie. 2016. "Non-Response to Antibiotic Treatment in Adolescents for Four Common Infections in UK Primary Care 1991–2012: A Retrospective, Longitudinal Study" Antibiotics 5, no. 3: 25. https://doi.org/10.3390/antibiotics5030025