Polyurethane Organosilicate Nanocomposites as Blood Compatible Coatings

Abstract
:1. Introduction
2. Results and Discussion
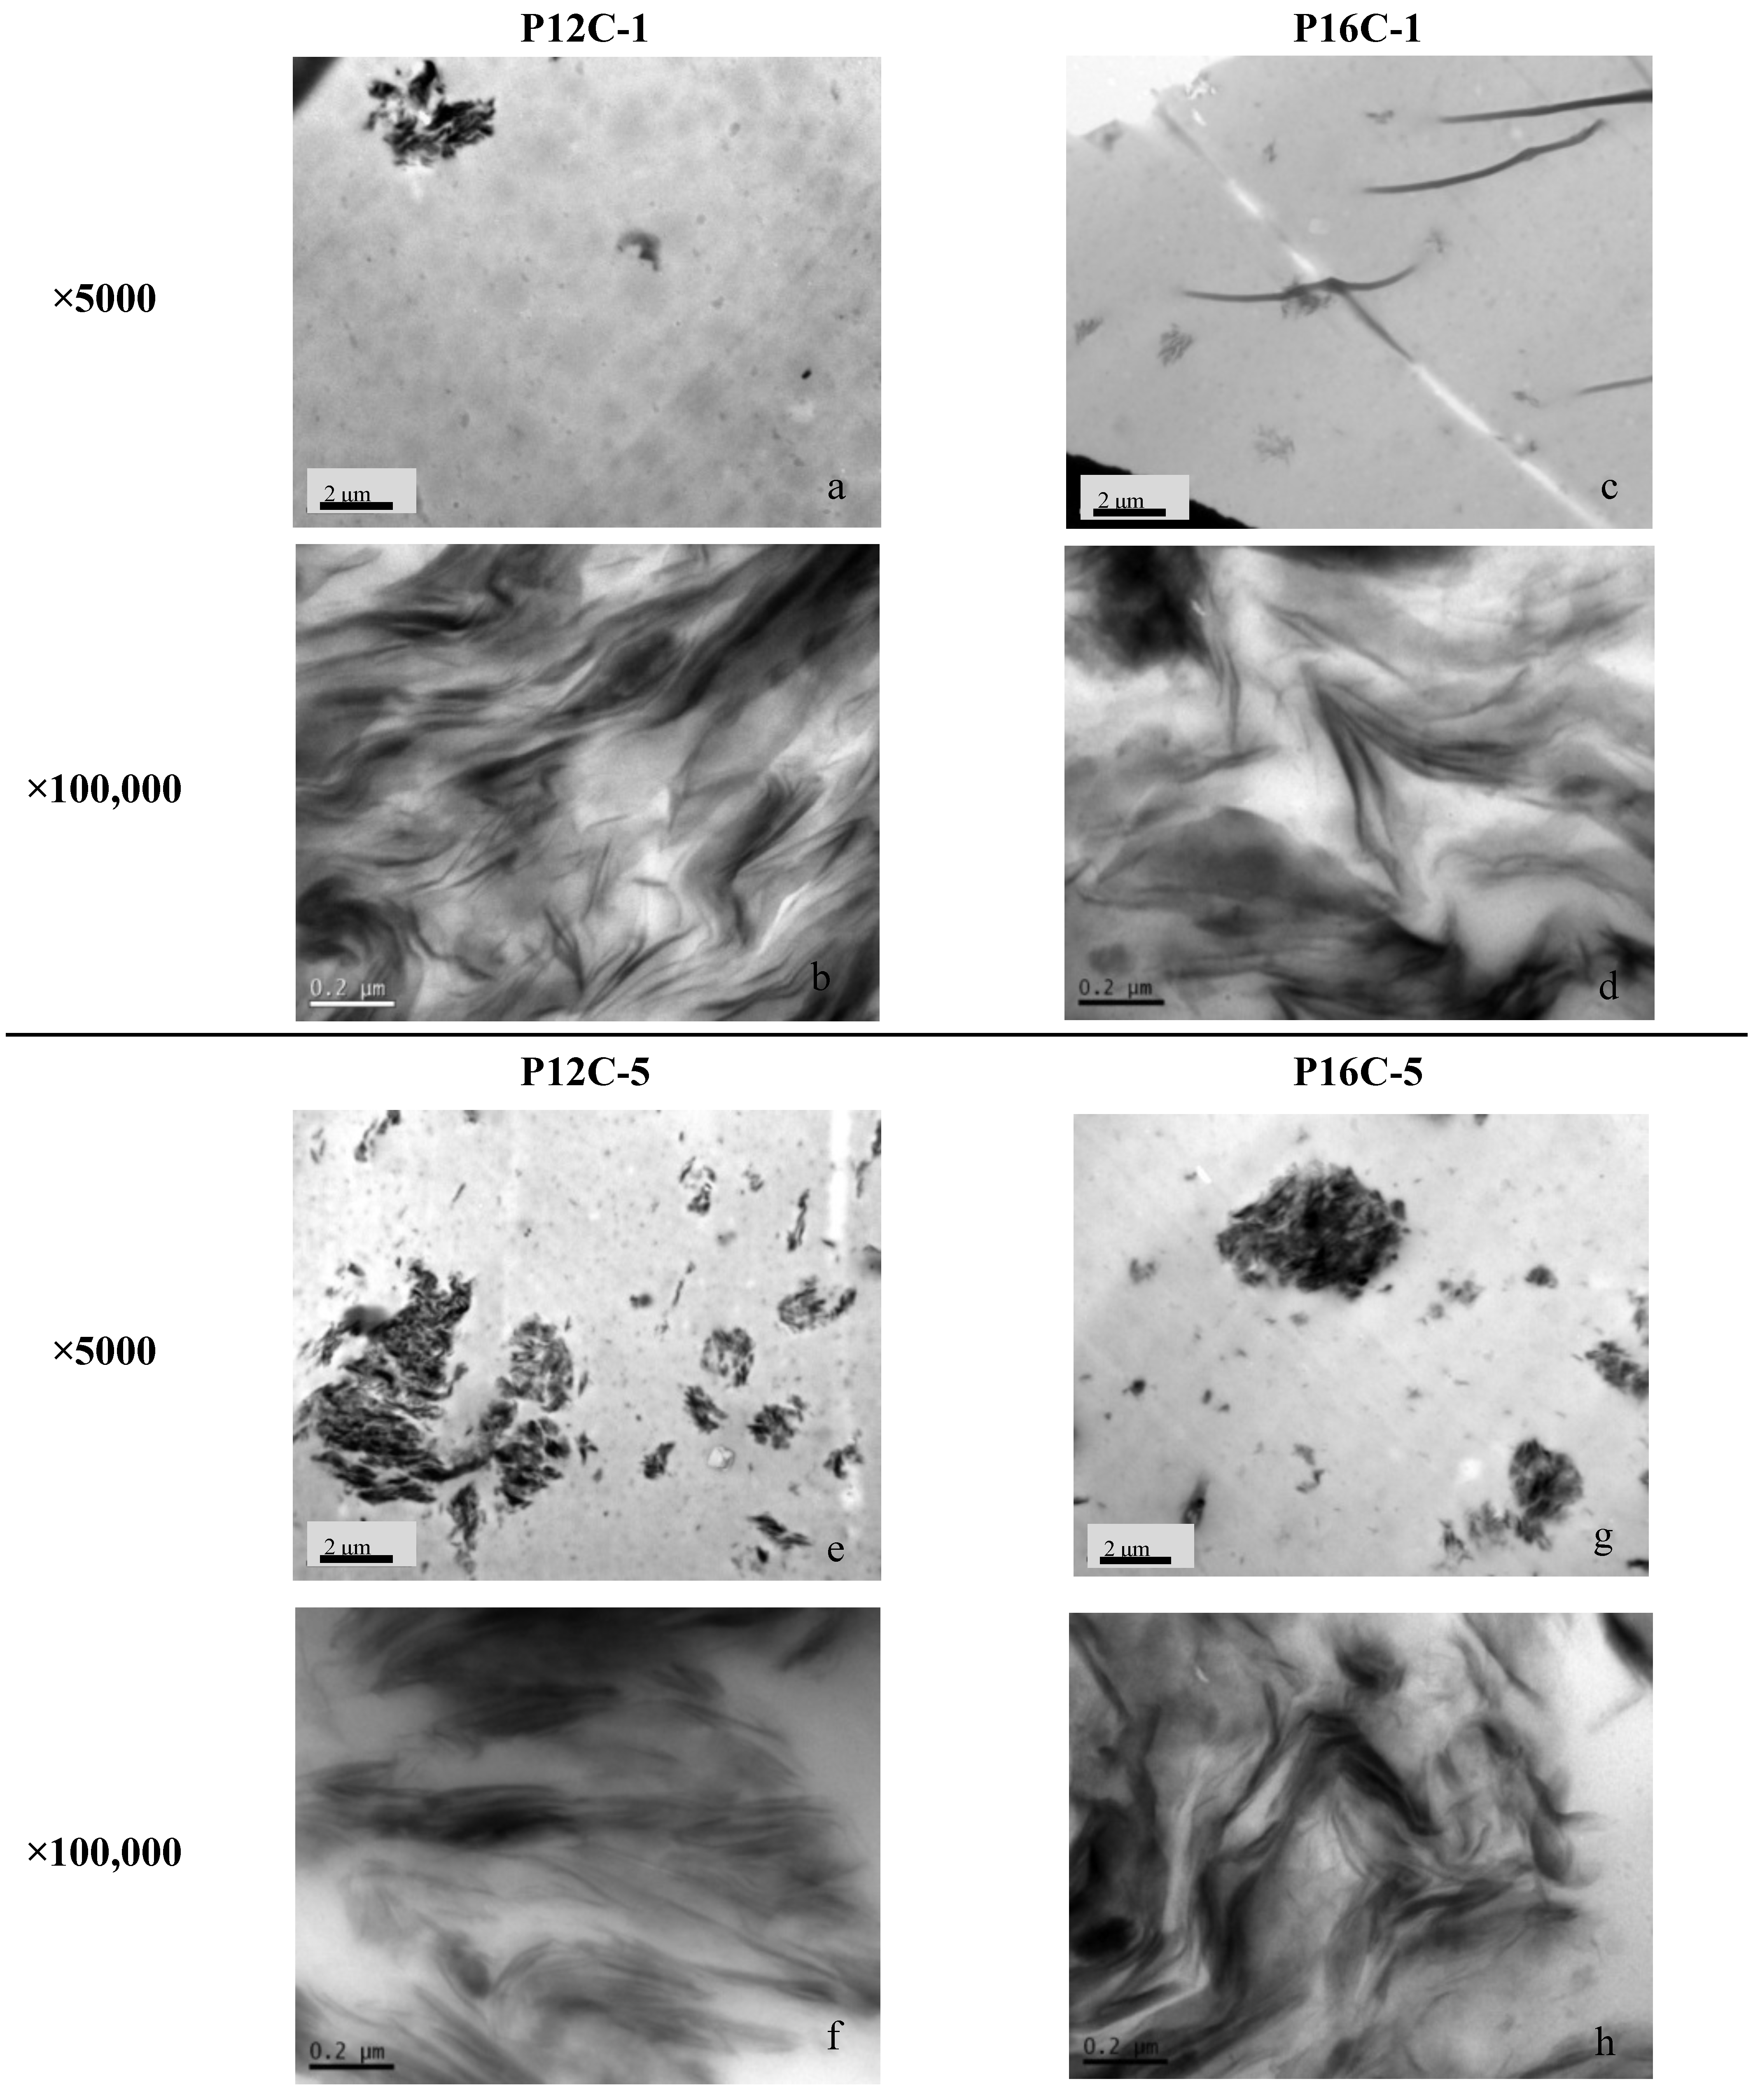
2.1. Silicate Dispersion

| Material | 2θ | Silicate spacing (nm) |
|---|---|---|
| PU | - | - |
| P12C-1 | - | - |
| P12C-5 | 3.47 | 2.55 |
| P16C-1 | - | - |
| P16C-5 | 2.71 | 3.26 |

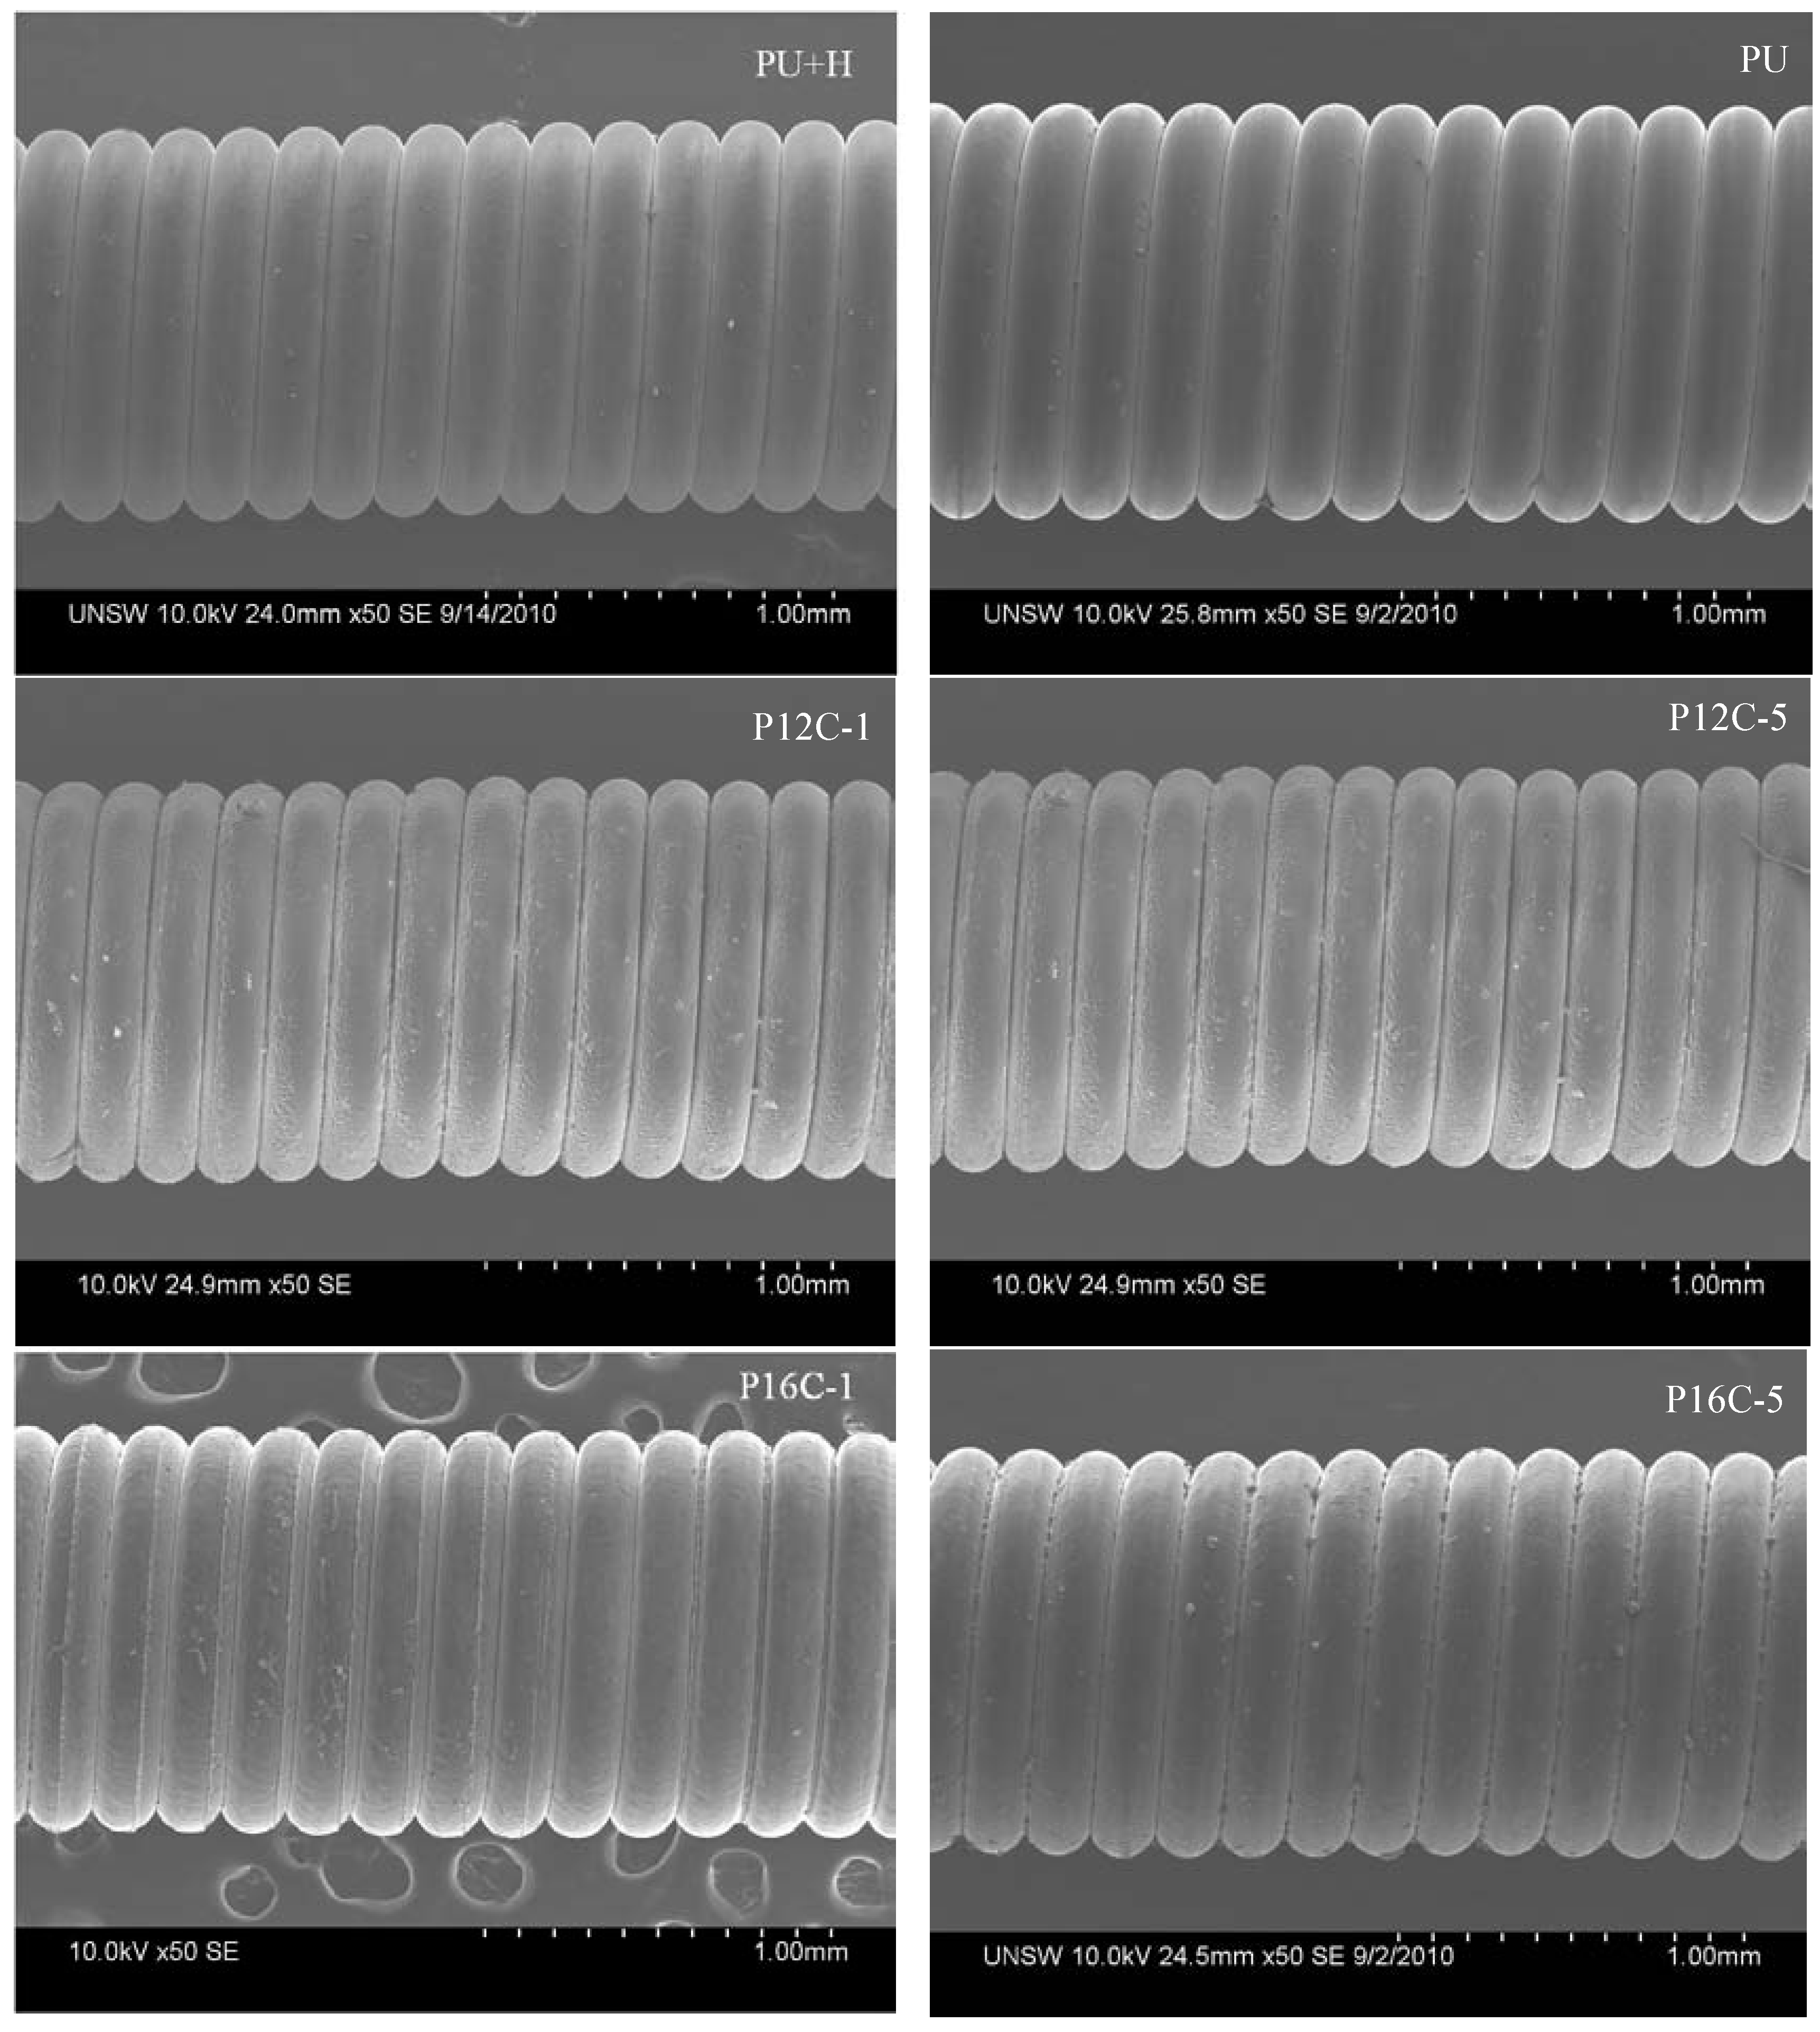
2.2. SEM

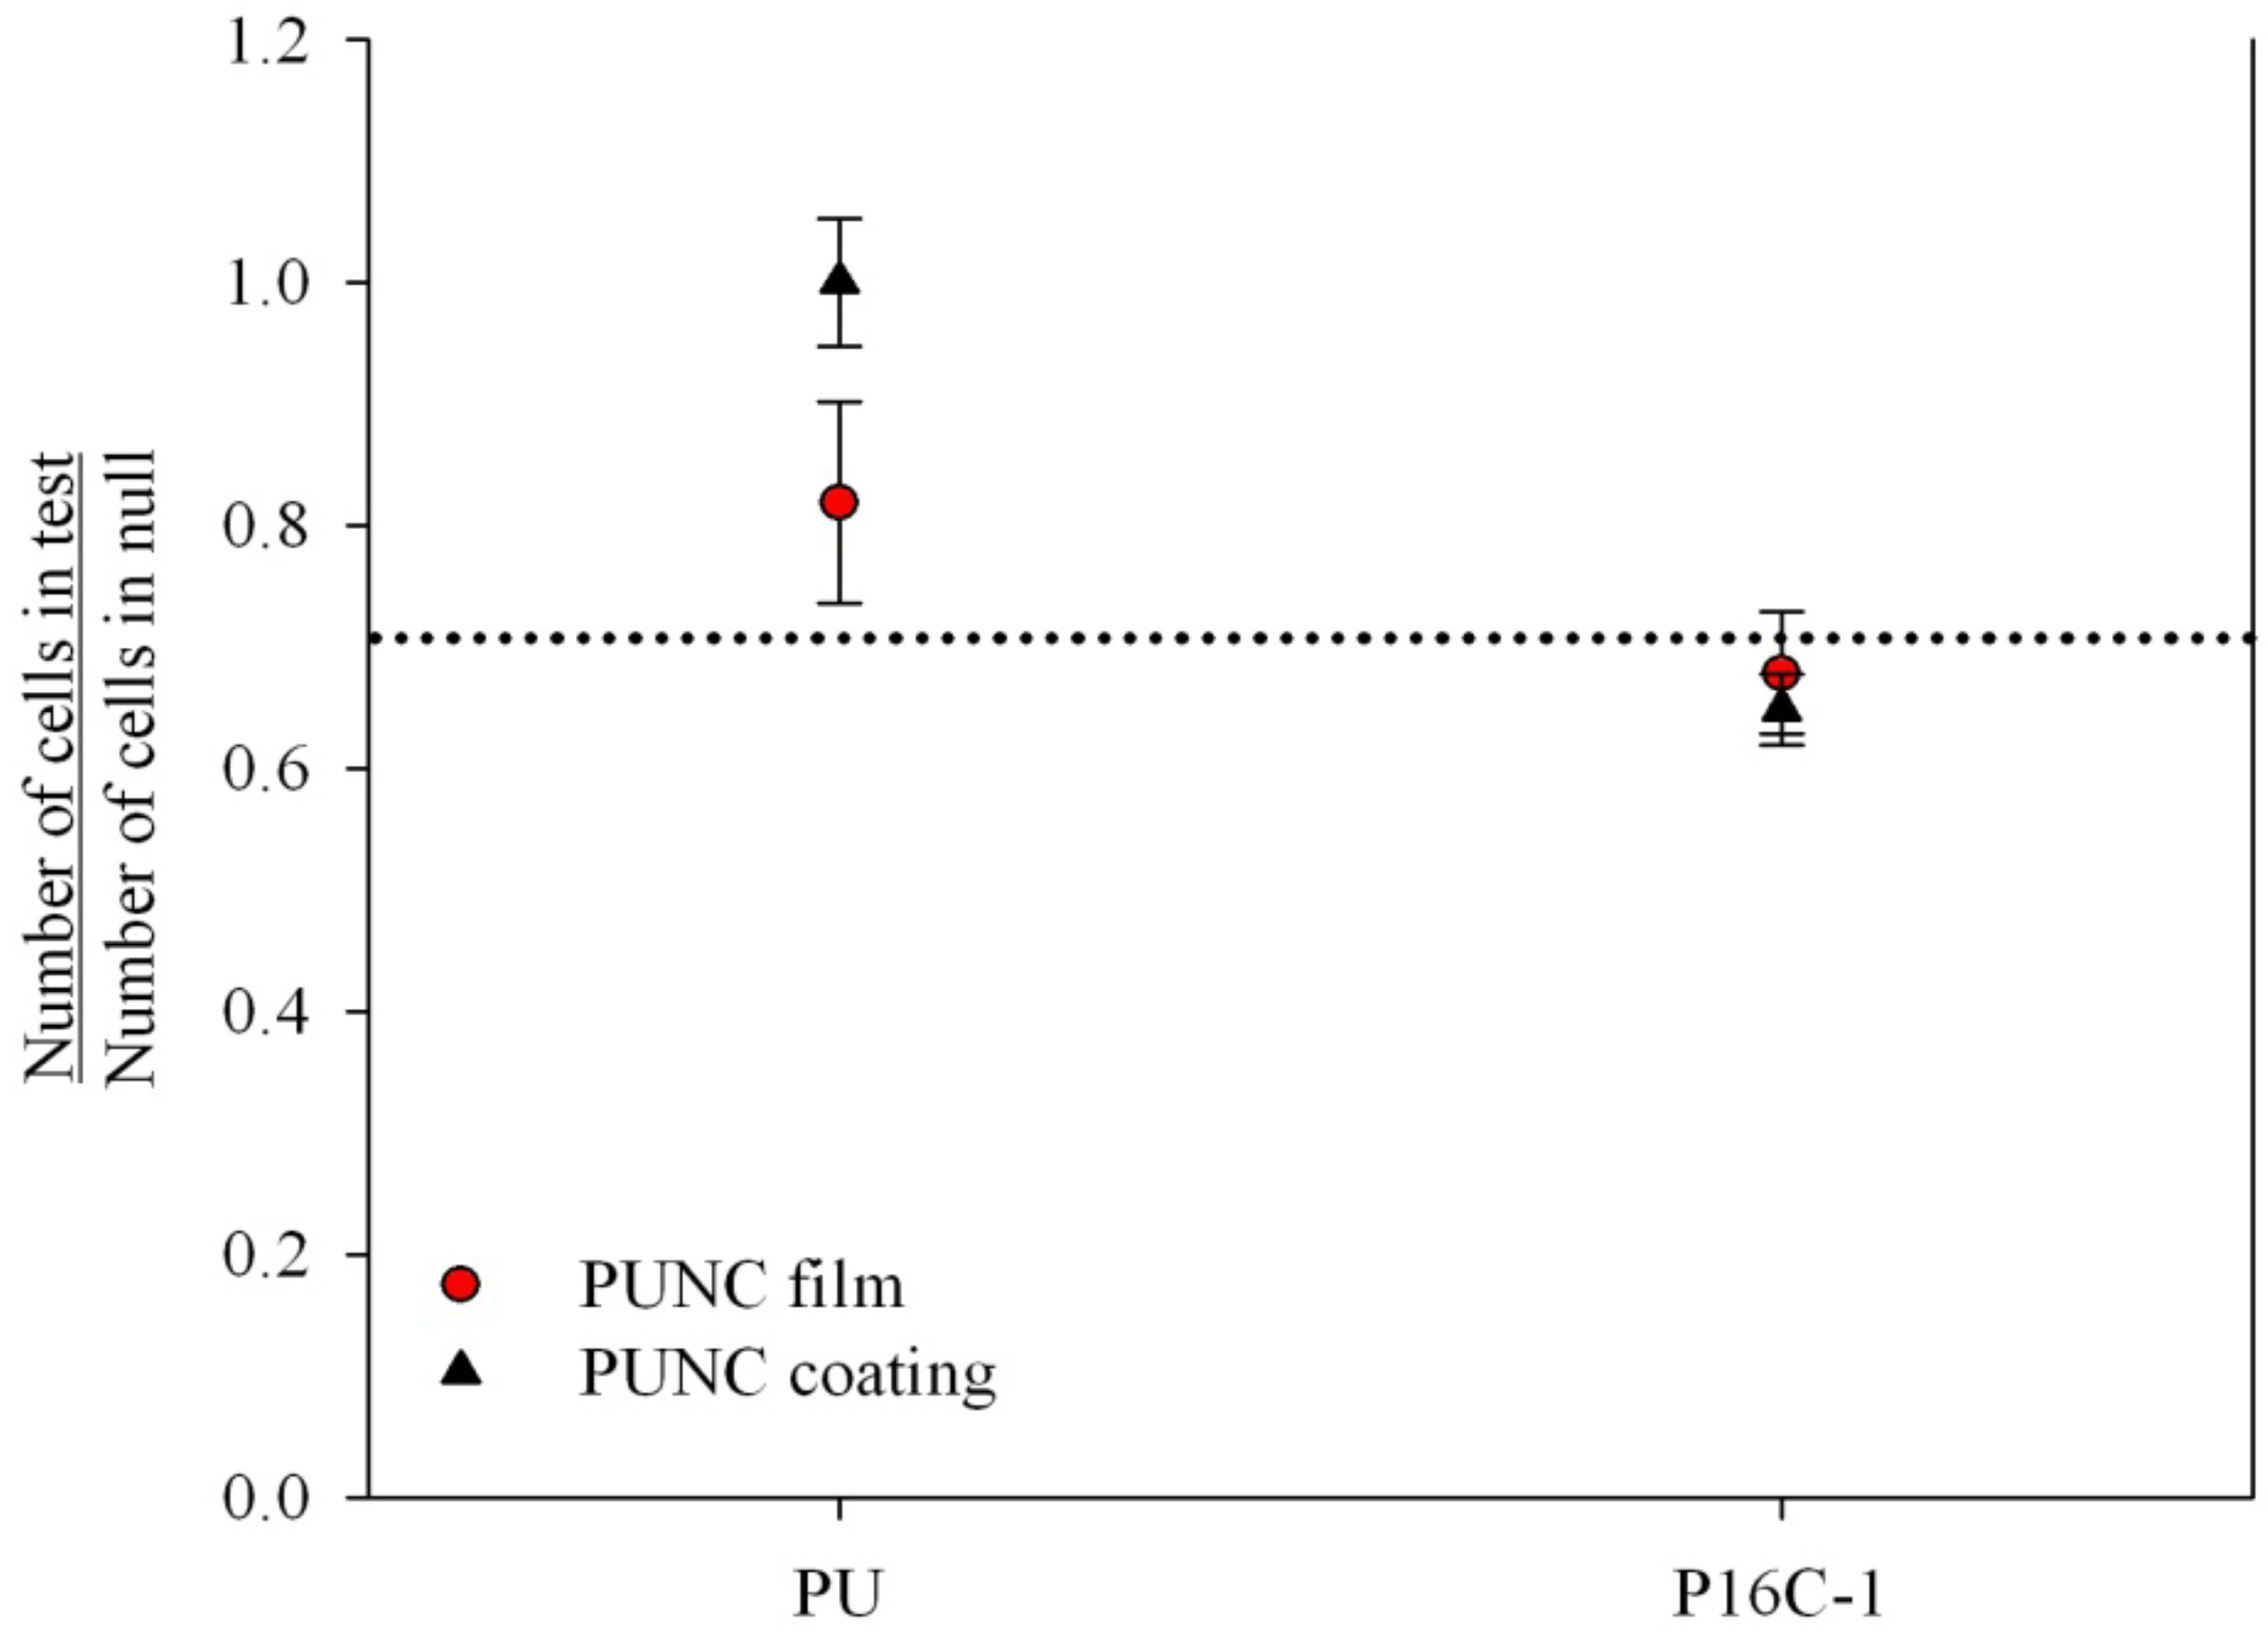
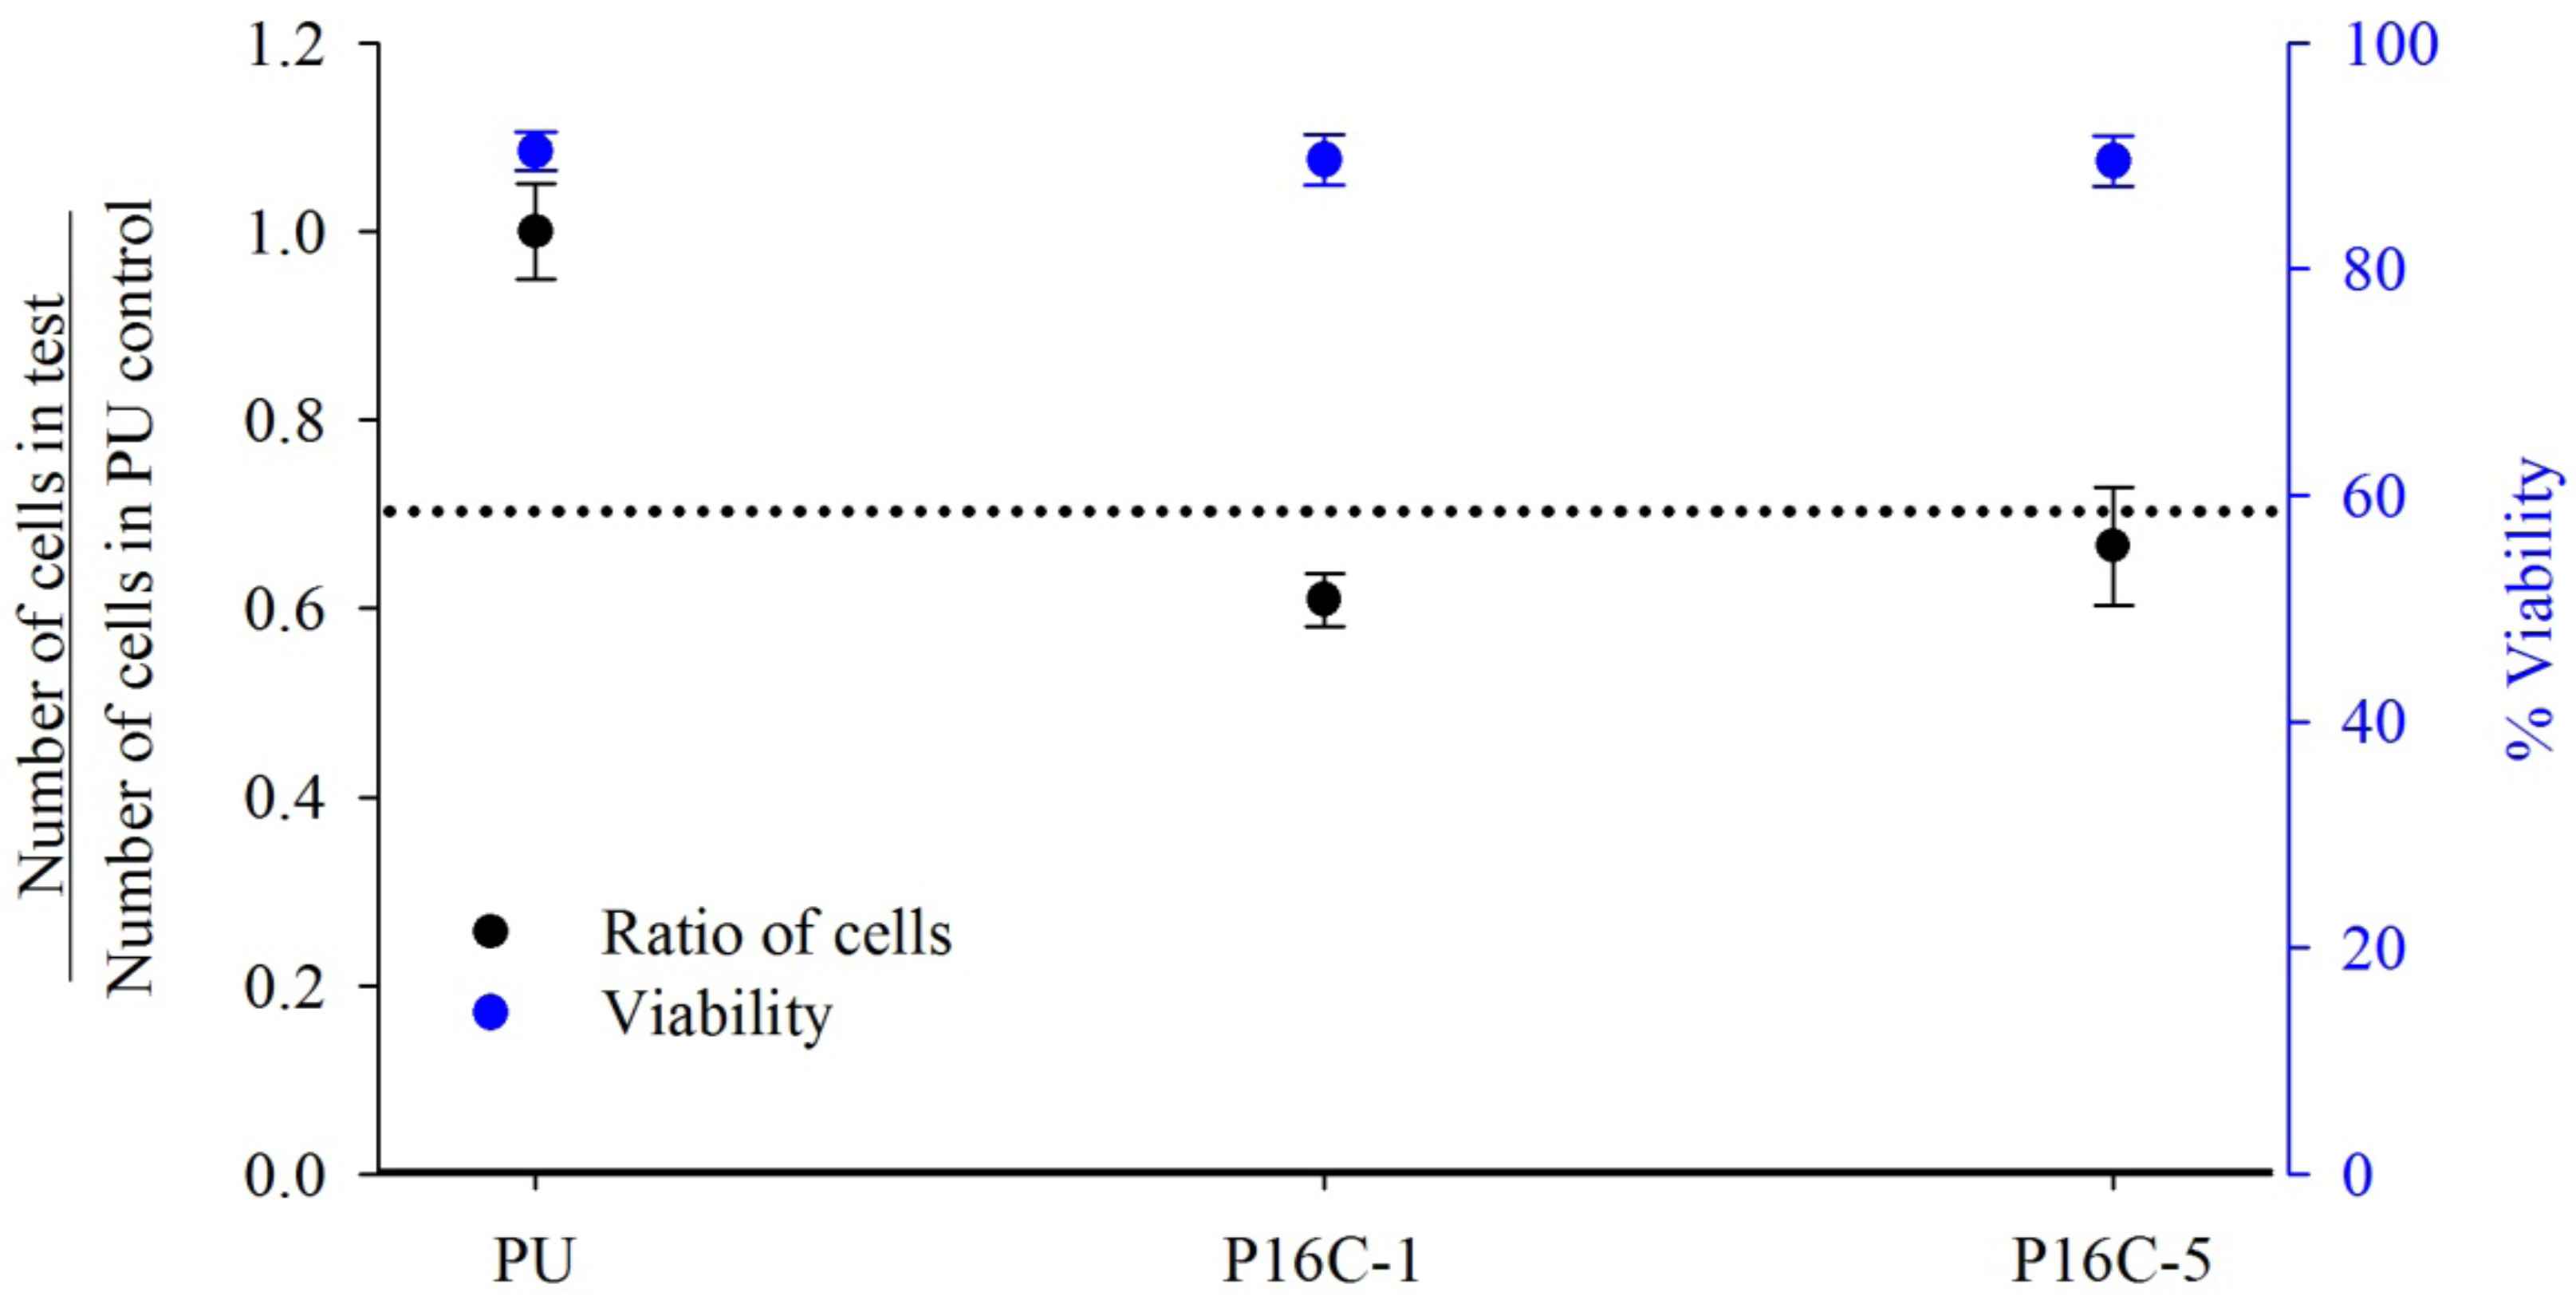
2.3. Cell Growth Inhibition (CGI)


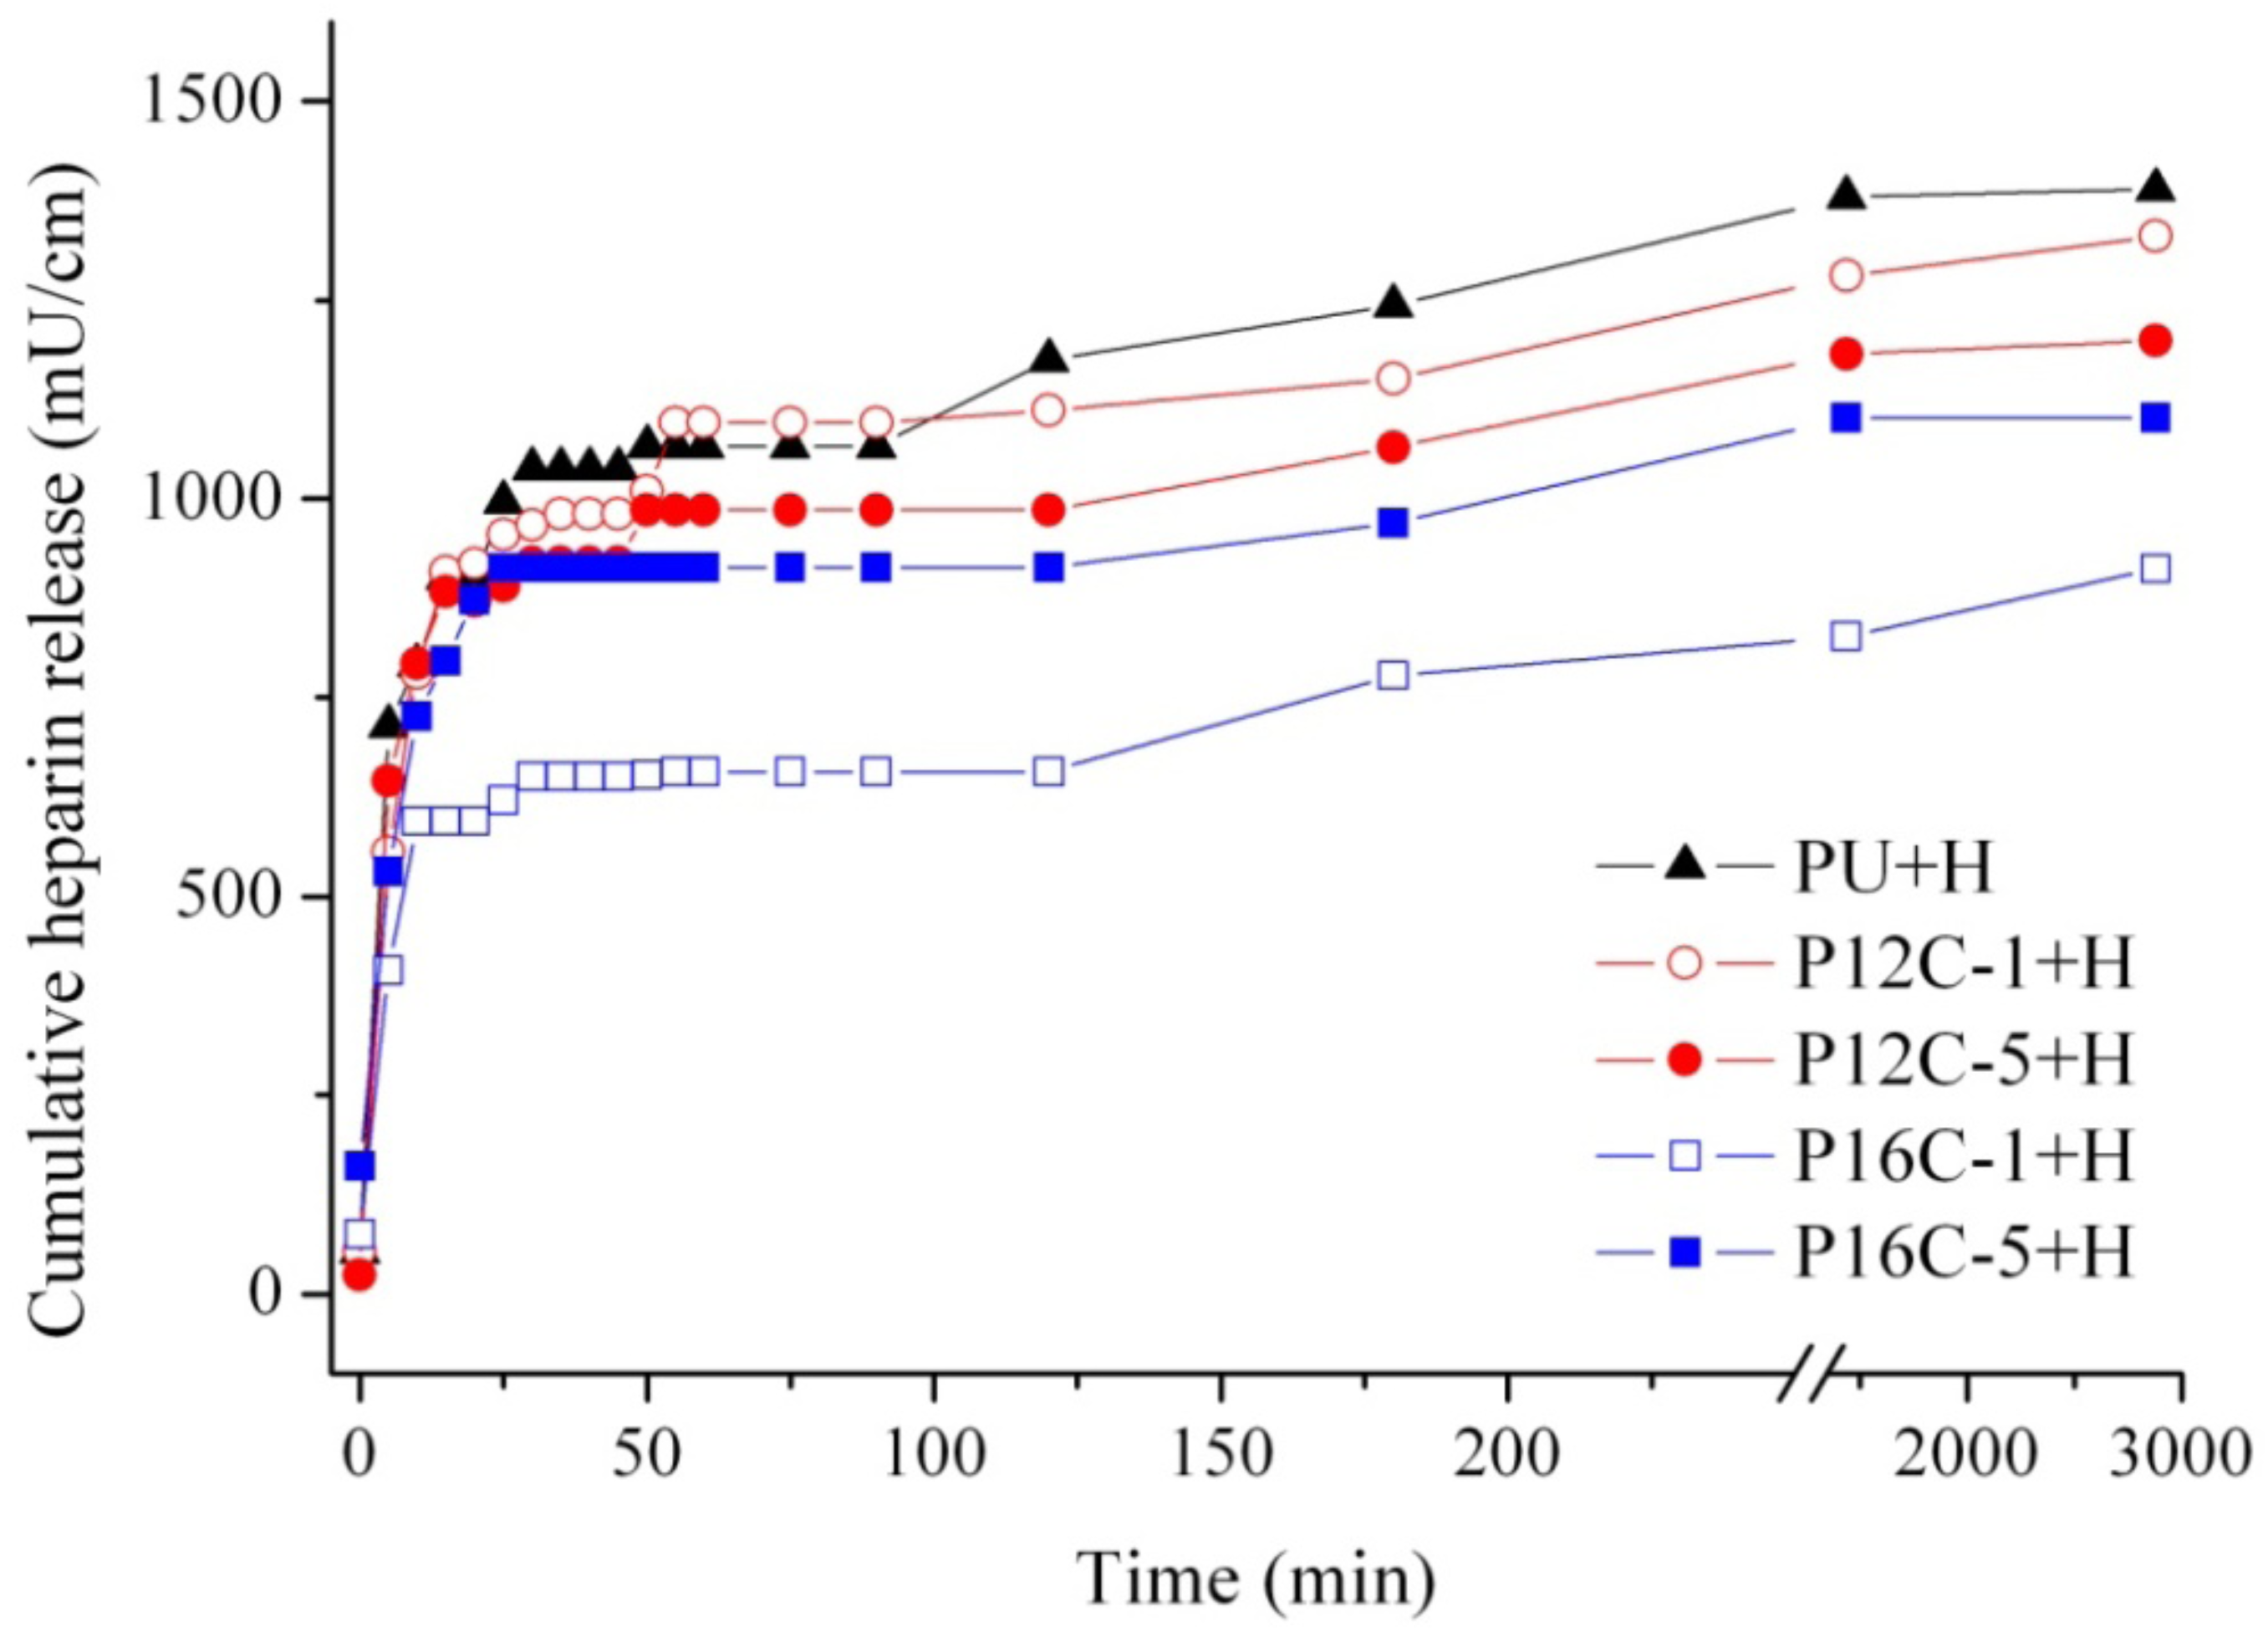
2.4. In vitro Heparin Release
| Material | Total heparin released (% released ± SD) | |
|---|---|---|
| 24 h | 48 h | |
| PU + H | 25 ± 2 | 25 ± 2 |
| P12C-1 + H | 23 ± 1 | 24 ± 4 |
| P12C-5 + H | 21 ± 2 | 21 ± 5 |
| P16C-1 + H | 15 * | 16 ± 2 |
| P16C-5 + H | 20 | 20 ± 2 |

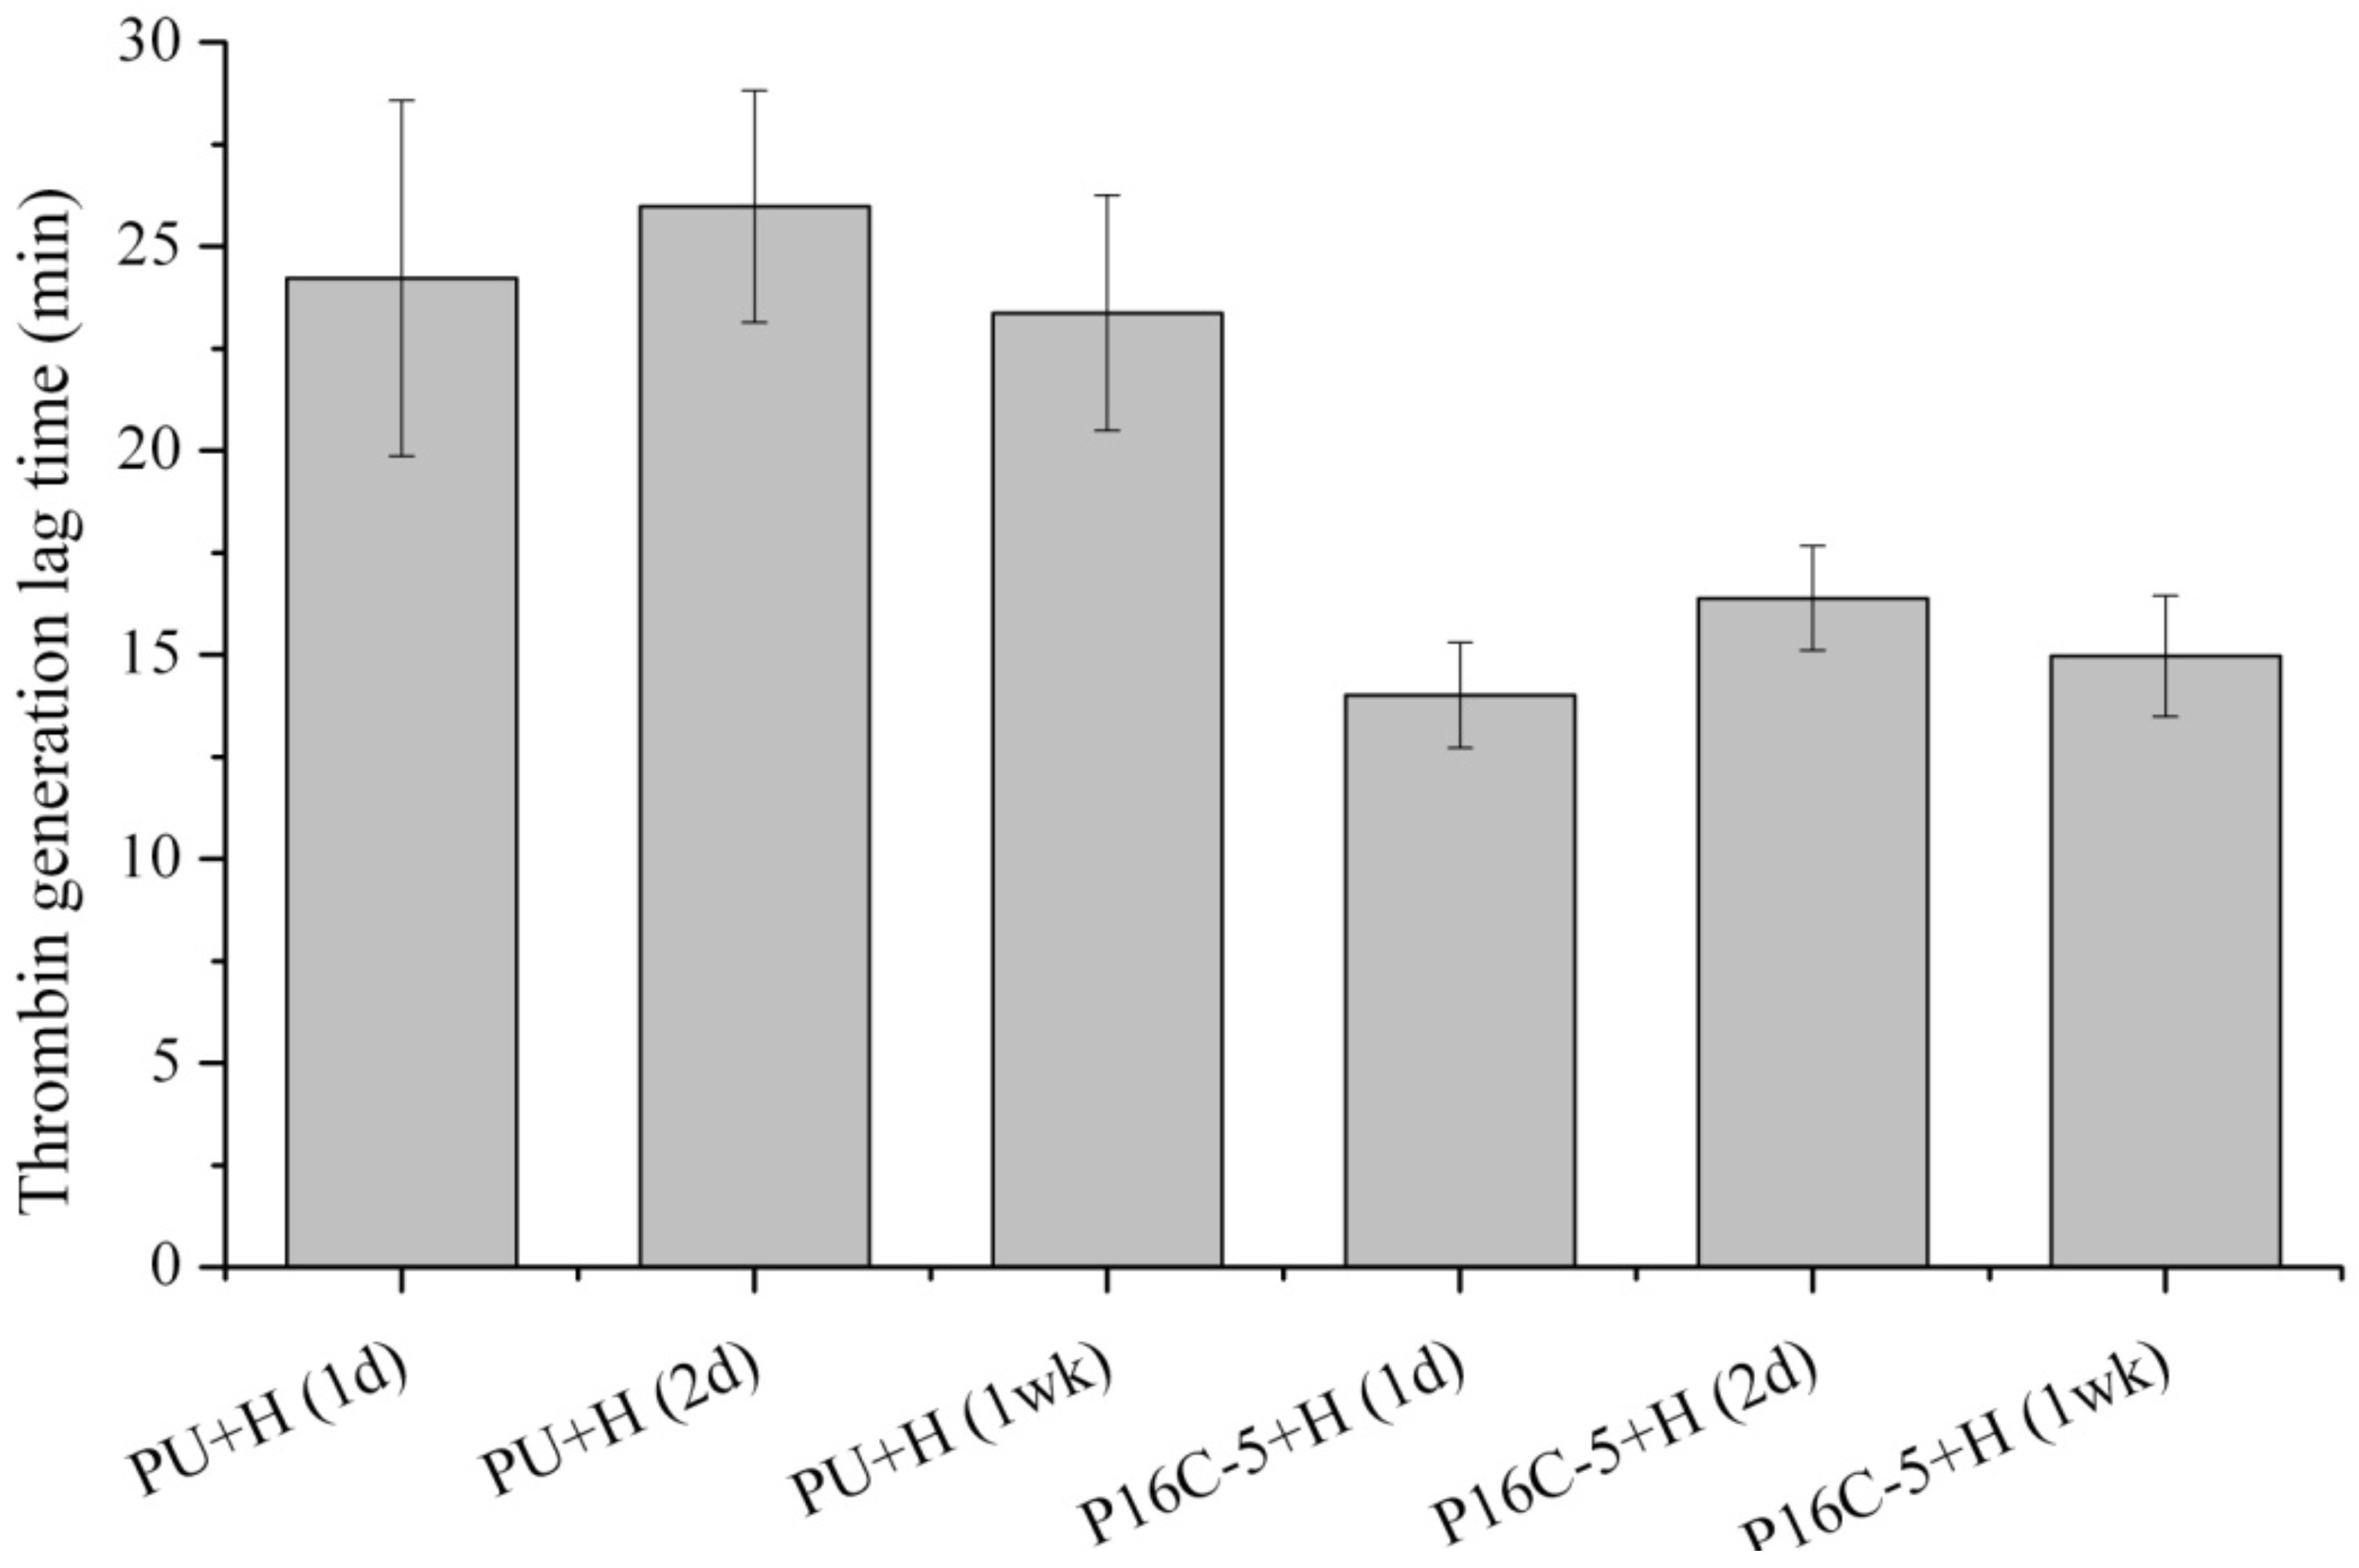
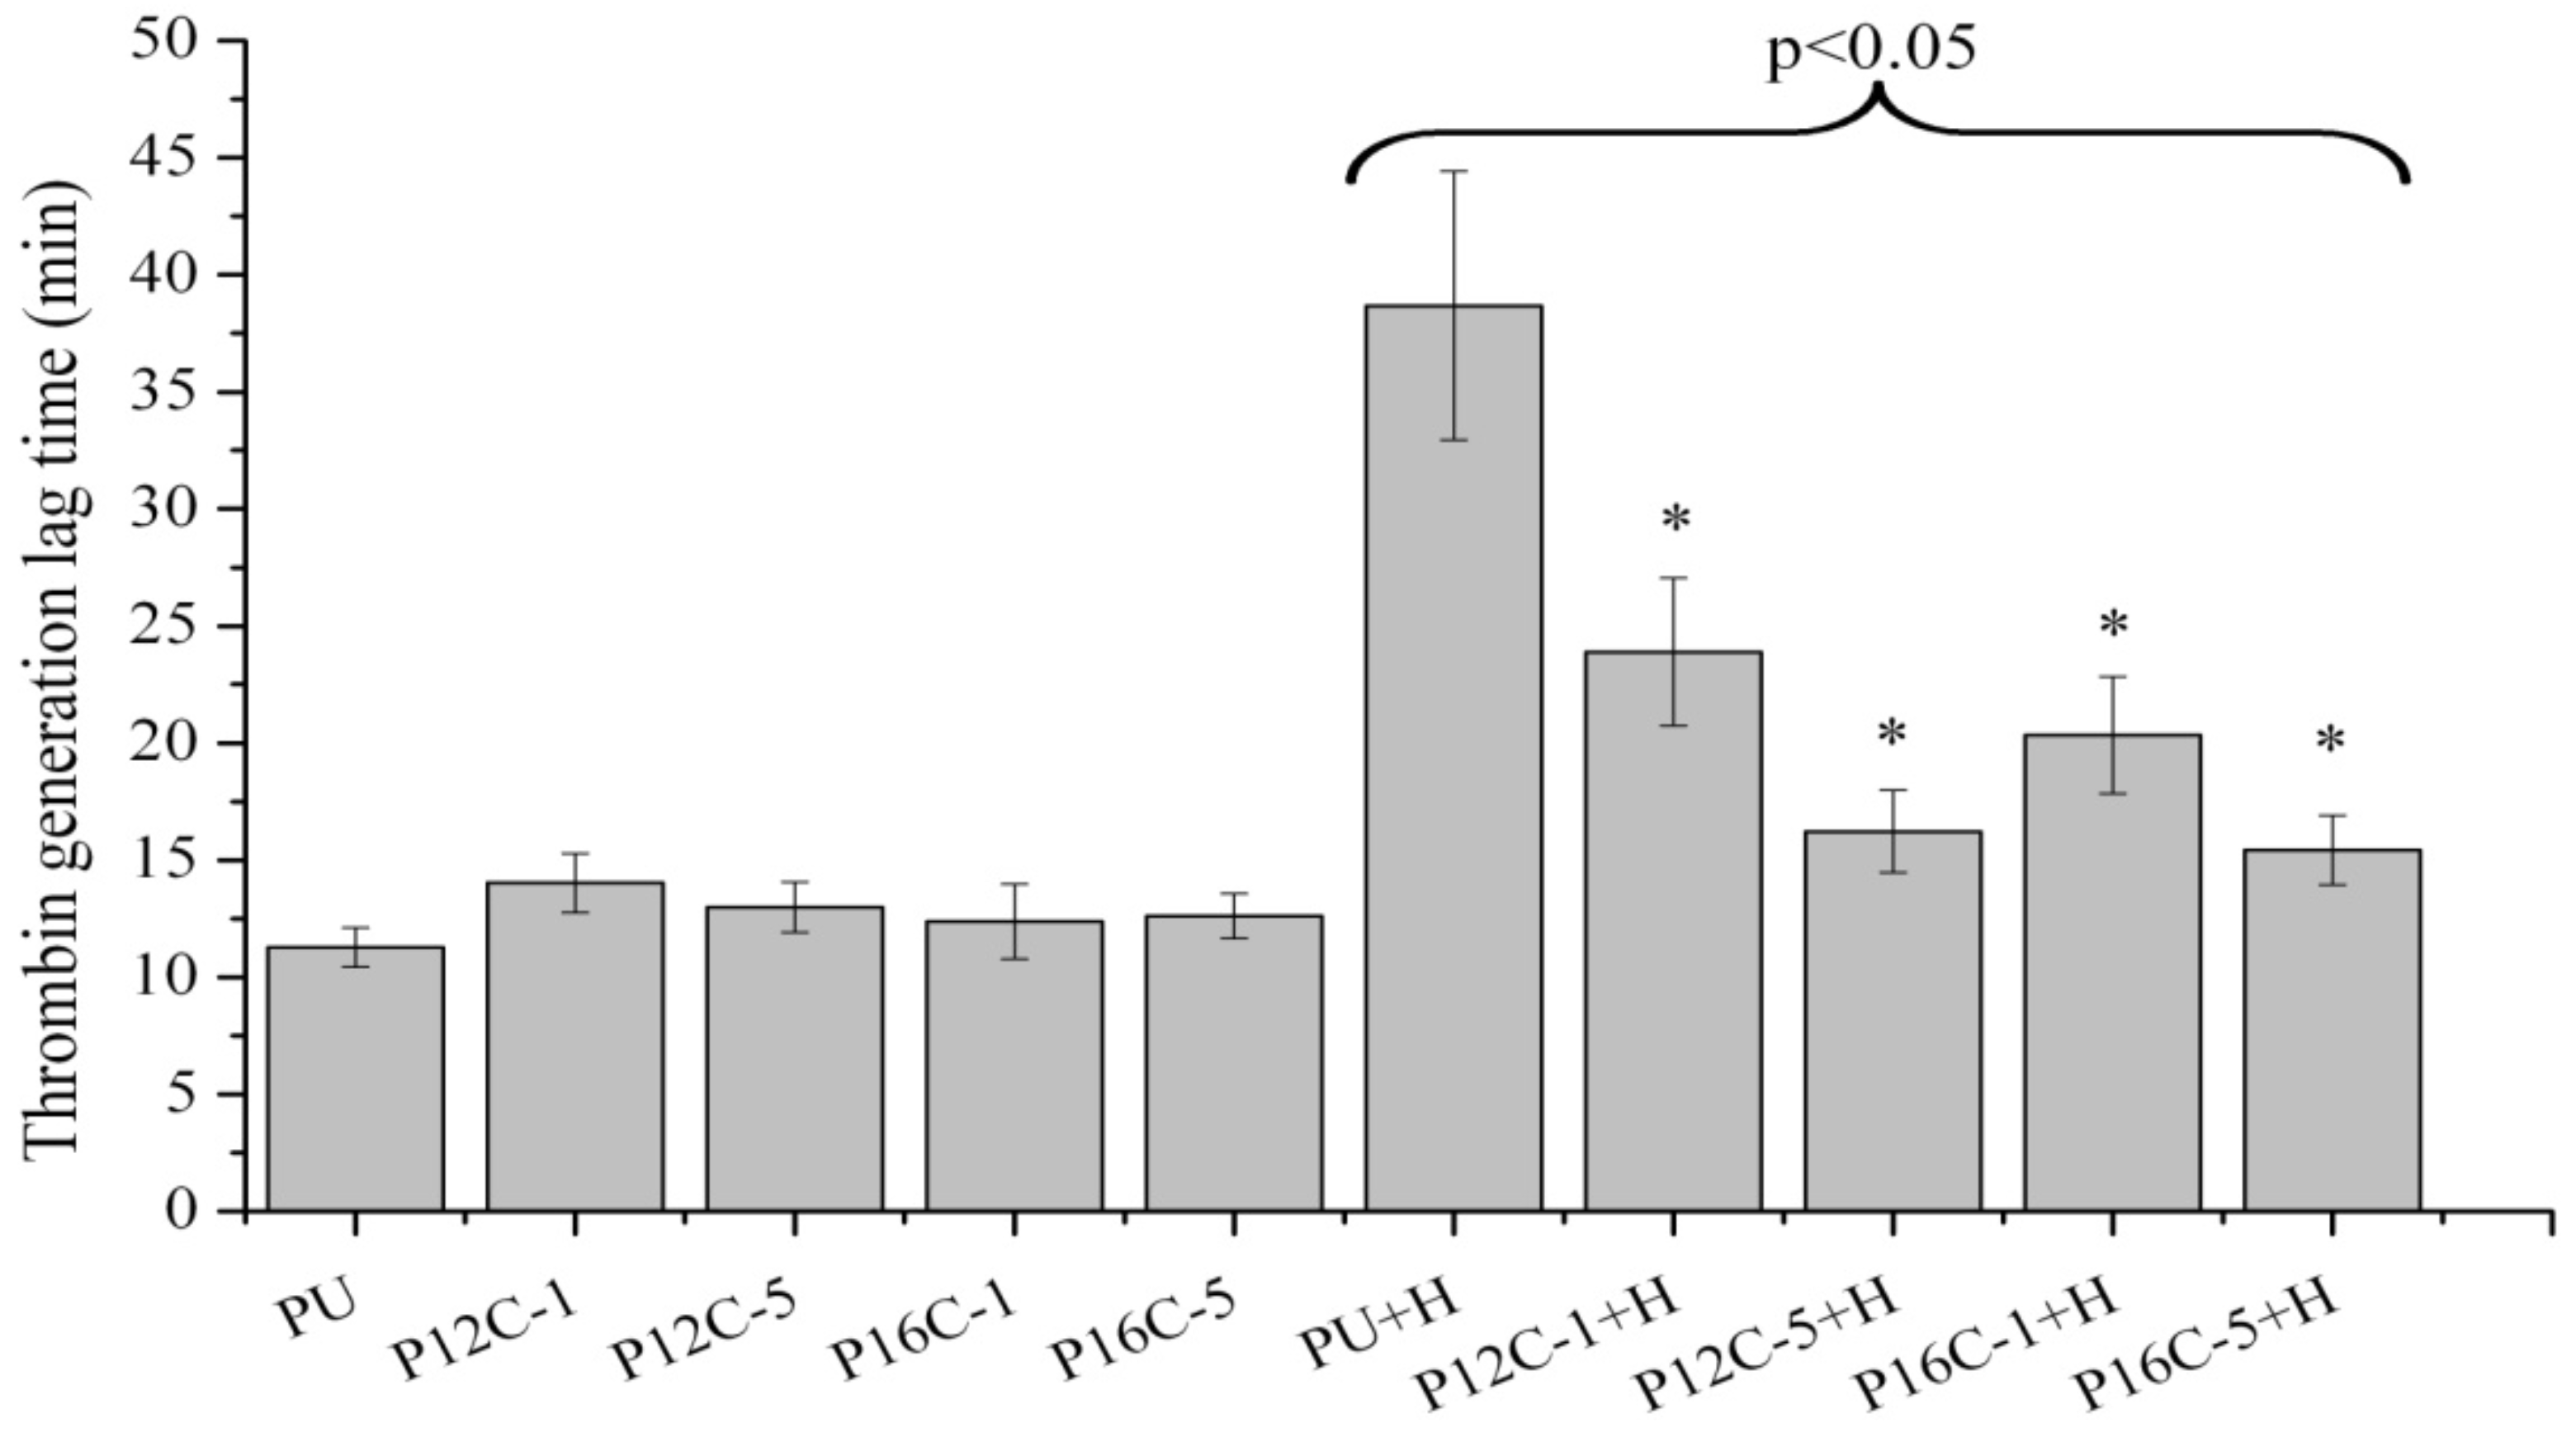
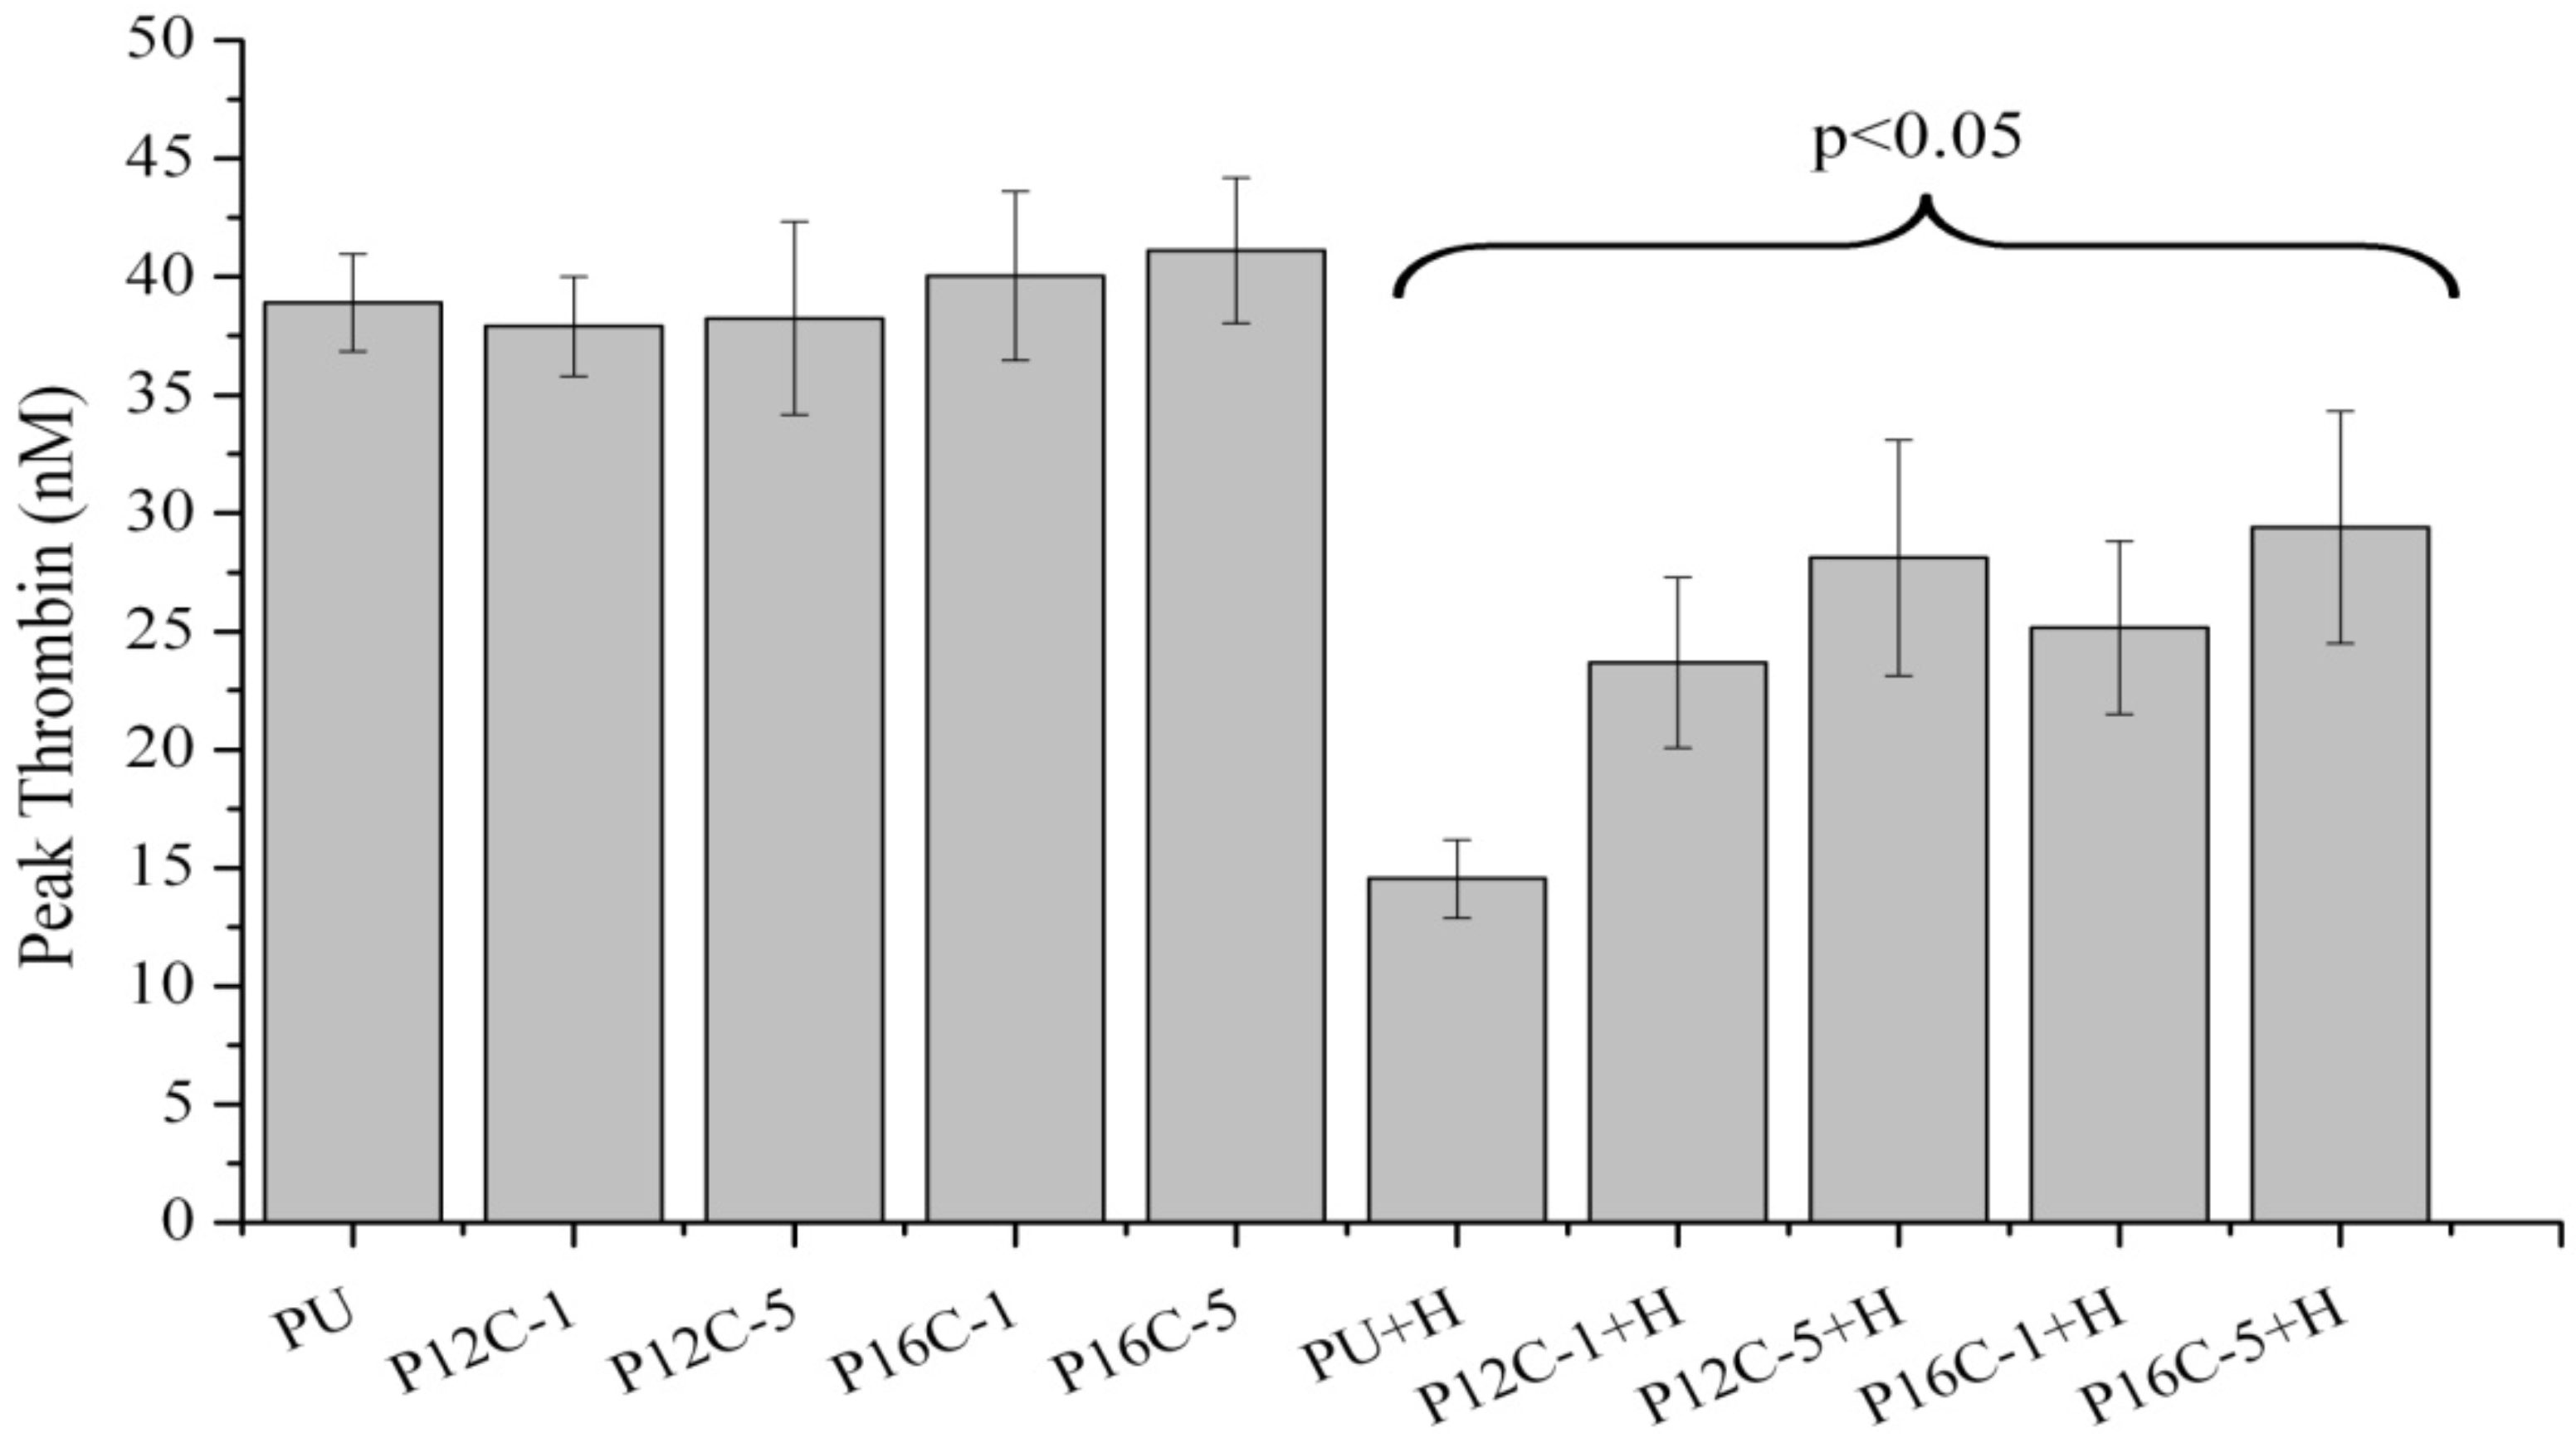
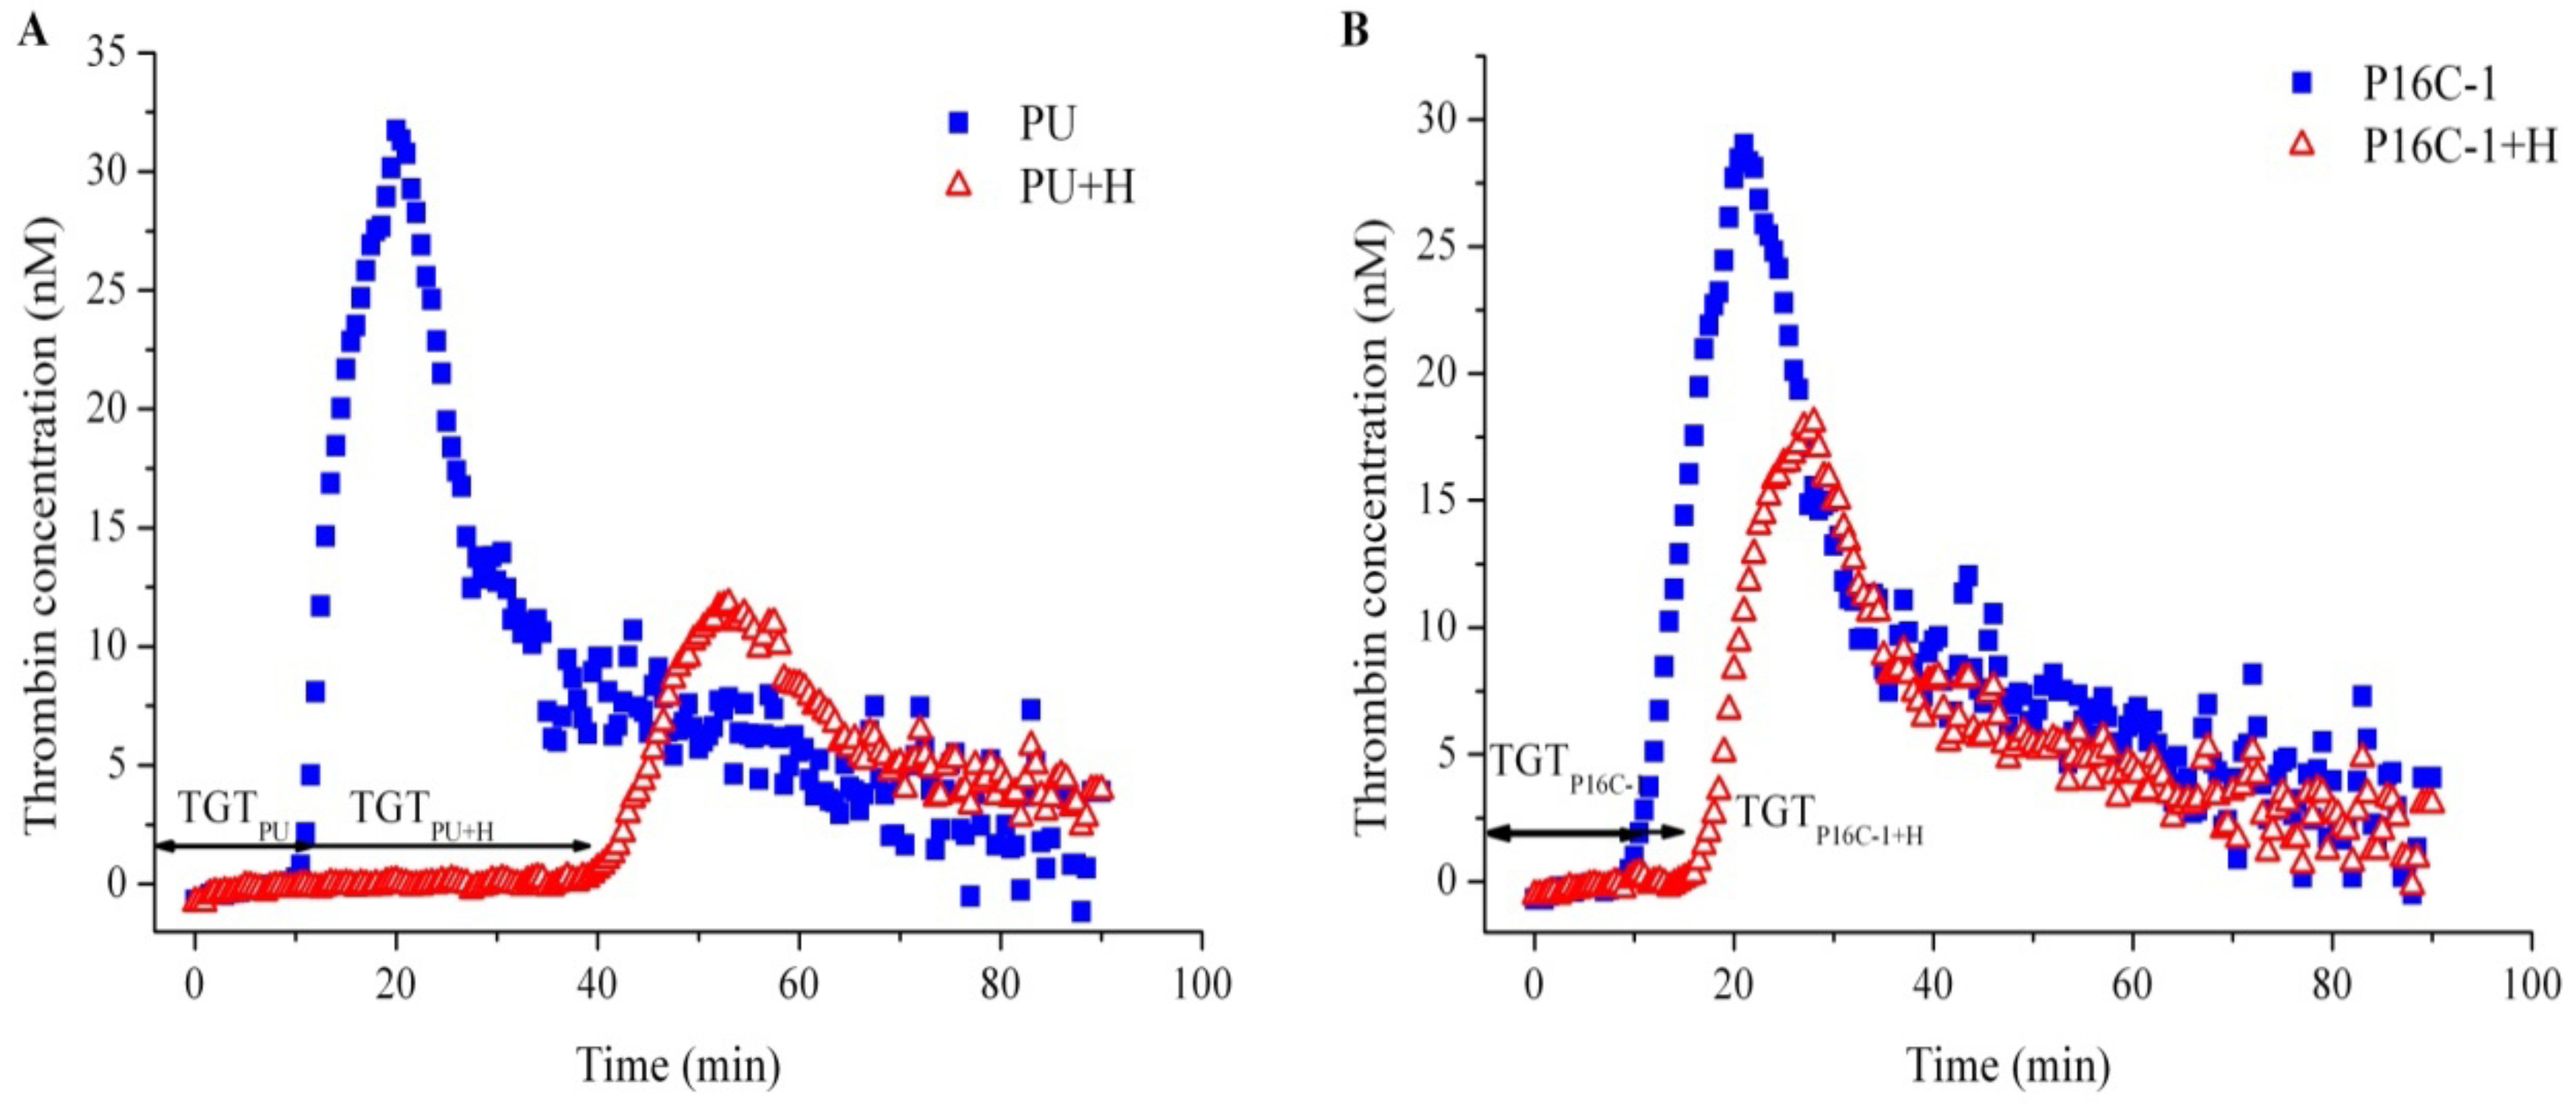
2.5. Blood Compatibility


3. Experimental Section
3.1. Materials
3.2. Modification of Silicates
3.3. Nanocomposite Preparation and Coating
| Material ID | Tested a | OMS | Loadings (g/100g PU) | |
|---|---|---|---|---|
| Clay | Heparin | |||
| PU | F,C | - | - | - |
| P12C-1 | F,C | 12CH3MMT | 1 | - |
| P12C-5 | F,C | 12CH3MMT | 5 | - |
| P16C-1 | F,C | 16CH3MMT | 1 | - |
| P16C-5 | F,C | 16CH3MMT | 5 | - |
| PU + H | C | - | - | 10 |
| P12C-1 + H | C | 12CH3MMT | 1 | 10 |
| P12C-5 + H | C | 12CH3MMT | 5 | 10 |
| P16C-1 + H | C | 16CH3MMT | 1 | 10 |
| P16C-5 + H | C | 16CH3MMT | 5 | 10 |
3.4. X-ray Diffraction

3.5. Transmission Electron Microscope (TEM)
3.6. Scanning Electron Microscope (SEM)
3.7. Cell Growth Inhibition (CGI) Assay
3.8. In vitro Heparin Release
3.9. Thrombin Generation Assay

4. Conclusions
Acknowledgments
References
- Hehrlein, C.; Arab, A.; Bode, C. Drug-eluting stent: The “magic bullet” for prevention of restenosis? Basic Res. Cardiol. 2002, 97, 417–423. [Google Scholar] [CrossRef]
- Coronary Stenting: A Literature Review; Australian Health Technology Advisory Committee: Canberra, Australia, 1997.
- Knetsch, M.L.W. Blood-contacting surfaces. In Biomaterials Fabrication and Processing; Chu, P.K., Liu, X., Eds.; CRC Press: Boca Raton, Florida, 2008. [Google Scholar]
- Ikada, Y. Surface modification of polymers for medical applications. Biomaterials 1994, 15, 725–736. [Google Scholar] [CrossRef]
- Han, D.K.; Park, K.D.; Ahn, K.D.; Jeong, S.Y.; Kim, Y.H. Preparation and surface characterization of PEO-grafted and heparin immobilized polyurethanes. J. Biomed. Mater. Res. 1989, 23, 87–104. [Google Scholar] [CrossRef]
- Du, Y.J.; Klement, P.; Berry, L.R.; Tressel, P.; Chan, A.K.C. In vivo rabbit acute model tests of polyurethane catheters coated with a novel antithrombin-heparin covalent complex. Thromb. Haemost. 2005, 94, 366–372. [Google Scholar] [CrossRef]
- Zhou, Z.; Meyerhoff, M.E. Preparation and characterization of polymeric coatings with combined nitric oxide release and immobilized active heparin. Biomaterials 2005, 26, 6506–6517. [Google Scholar] [CrossRef]
- Riedl, C.R.; Witkowski, M.; Plas, E.; Pflueger, H. Heparin coating reduces encrustation of ureteral stents: A preliminary report. Int. J. Antimicrobial Agents 2002, 19, 507–510. [Google Scholar]
- Fu, J.; Ji, J.; Fan, D.; Shen, J. Construction of antibacterial multilayer films containing nanosilver via layer-by-layer assembly of heparin and chitosan-silver ions complex. J. Biomater. Res. 2006, 79, 665–674. [Google Scholar]
- Tan, Q.; Ji, J.; Barbosa, M.A.; Fonseca, C.; Shen, J. Constructing thromboresistant surface on biomedical stainless steel via layer-by-layer deposition anticoagulant. Biomaterials 2003, 24, 4699–4705. [Google Scholar] [CrossRef]
- Tan, Q.; Ji, J.; Zhao, F.; Fan, D.Z.; Sun, F.Y.; Shen, J.C. Fabrication of thromboresistant multilayer thin film on plasma treated poly(vinyl chloride) surface. J. Mater. Sci-Mater. Med. 2005, 16, 687–692. [Google Scholar] [CrossRef]
- Van der Heiden, A.P.; Goebbels, D.; Pijpers, A.P.; Koole, L.H. A photochemical method for the surface modification of poly(etherurethanes) with phosphorylcholine-containing compounds to improve hemocompatibility. J. Biomater. Res. 1997, 37, 282–290. [Google Scholar]
- Desai, N.P.; Hubbell, J.A. Solution technique to incorporate polyethylene oxide and other water-soluble polymers into surfaces of polymeric biomaterials. Biomaterials 1991, 12, 144–153. [Google Scholar]
- Mazid, M.A.; Scott, E.; Nai-Hong, L. New biocompatible polyurethane-type copolymer with low molecular weight heparin. Clin. Mater. 1991, 8, 71–80. [Google Scholar] [CrossRef]
- Labarre, D.; Jozefowicz, M.; Boffa, M.C. Properties of heparin-poly (methyl methacrylate) copolymers. II. J. Biomed. Mater. Res. 1977, 11, 283–295. [Google Scholar]
- Moon, H.T.; Lee, L.K.; Han, J.K.; Byun, Y. A novel formulation for controlled release of heparin-DOCA conjugate dispersed as nanoparticles in polyurethane film. Biomaterials 2001, 22, 281–289. [Google Scholar] [CrossRef]
- Huang, X.; Brazel, C.S. On the importance and mechanisms of burst release in matrix-controlled drug delivery systems. J. Control. Release 2001, 73, 121–136. [Google Scholar] [CrossRef]
- Deconinck, E.; Sohier, J.; Scheerder, I.D.; Van den Mooter, G. Pharmaceutical aspects of drug eluting stents. J. Pharm. Sci. 2008, 97, 5047–5060. [Google Scholar] [CrossRef]
- Chen, M.C.; Chang, Y.; Liu, C.T.; Lai, W.Y.; Peng, S.F.; Hung, Y.W.; Tsai, H.W.; Sung, H.W. The characteristics and in vivo suppression of neointimal formation with sirolimus-eluting polymeric stents. Biomaterials 2009, 30, 79–88. [Google Scholar] [CrossRef]
- Lee, P.I. Effect of non-uniform initial drug concentration distribution on the kinetics of drug release from glassy hydrogel matrices. Polymer 1984, 25, 973–978. [Google Scholar] [CrossRef]
- Endo, M.; Koyama, S.; Matsuda, Y.; Hayashi, T.; Kim, Y.A. Thrombogenicity and blood coagulation of a microcatheter prepared from carbon nanotubes-nylon based composite. Nano lett. 2004, 5, 101–105. [Google Scholar]
- Kannan, R.Y.; Salacinski, H.J.; Groot, J.D.; Clatworthy, I.; Bozec, L.; Horton, M.; Butler, P.E.; Seifalian, A.M. The antithrombogenic potential of a polyhedral oligomeric silsesquioxane (POSS) nanocomposite. Biomacromolecules 2006, 7, 215–223. [Google Scholar] [CrossRef]
- Zhou, N.; Fang, S.; Xu, D.; Zhang, J.; Mo, H.; Shen, J. Montmorillonite-phosphatidyl choline/PDMS films: A novel antithrombogenic material. Appl. Clay Sci. 2009, 46, 401–403. [Google Scholar] [CrossRef]
- Koh, L.B.; Rodriguez, I.; Zhou, J. Platelet adhesion studies on nanostructured poly(lactic-co-glycolic-acid)-carbon nanotube composite. J. Biomater. Res. 2008, 86, 394–401. [Google Scholar]
- Asmatulu, R.; Claus, R.O.; Mecham, J.B.; Corcoran, S.G.; Wang, Y.X. Nanocomposite thin film coatings for protection of materials surfaces. MRS Proc. 2005, 872, J13.14.1–J13.14.6. [Google Scholar]
- Zaporojtchenko, V.; Podschun, R.; Schürmann, U.; Kulkarni, A.; Faupel, F. Physico-chemical and antimicrobial properties of co-sputtered Ag–Au/PTFE nanocomposite coatings. Nanotechnol. 2006, 17, 4904. [Google Scholar] [CrossRef]
- Lamba, N.M.K.; Woodhouse, K.A.; Cooper, S.L. Polyurethanes in Biomedical Applications; Schapiro, F., Ed.; CRC Press: Boca Raton, FL, USA, 1997. [Google Scholar]
- Poole-Warren, L.A.; Farrugia, B.; Fong, N.; Hume, E.; Simmons, A. Controlling cell-material interactions with polymer nanocomposites by use of surface modifying additives. Appl. Surf. Sci. 2008, 255, 519–522. [Google Scholar] [CrossRef]
- Zhu, H.; Kumar, A.; Ozkan, J.; Bandara, R.; Ding, A.; Perera, I.; Steinberg, P.; Kumar, M.; Lao, W.; Griesser, S.S.; et al. Fimbrolide-coated antimicrobial lenses: Their in vitro and in vivo effects. Optometry Vision Sci. 2008, 85, 292–300. [Google Scholar]
- Baveja, J.K.; Willcox, M.D.P.; Hume, E.B.H.; Kumar, N.; Odell, R.; Poole-Warren, L.A. Furanones as potential anti-bacterial coatings on biomaterials. Biomaterials 2004, 25, 5003–5012. [Google Scholar] [CrossRef]
- Styan, K.E.; Martin, D.J.; Poole-Warren, L.A. In vitro fibroblast response to polyurethane organosilicate nanocomposites. J. Biomed. Mater. Res. Part A 2008, 86, 571–582. [Google Scholar]
- Joshi, G.V.; Patel, H.; Bajaj, H.; Jasra, R. Intercalation and controlled release of vitamin B6 from montmorillonite-vitamin B6 hybrid. Colloid Polym. Sci. 2009, 287, 1071–1076. [Google Scholar] [CrossRef]
- Suggs, L.J.; Shive, M.S.; Garcia, C.A.; Anderson, J.M.; Mikos, A.G. In vitro cytotoxicity and in vivo biocompatibility of poly(propylene fumarate-co-ethylene glycol) hydrogels. J. Biomed. Mater. Res. 1999, 46, 22–32. [Google Scholar] [CrossRef]
- Rosengren, A.; Faxius, L.; Tanaka, N.; Watanabe, M.; Bjursten, L.M. Comparison of implantation and cytotoxicity testing for initially toxic biomaterials. J. Biomed. Mater. Res. Part A 2005, 75, 115–122. [Google Scholar]
- Bounameaux, H. Unfractionated versus low-molecular-weight heparin in the treatment of benous thromboembolism. Vasc. Med. 1998, 3, 41. [Google Scholar]
- Munro, M.S.; Eberhart, R.C.; Maki, N.J.; Brink, B.E.; Fry, W.J. Thromboresistant alkyl derivatized polyurethanes. ASAIO. 1983, 6, 65–75. [Google Scholar]
- Duncan, A.C.; Sefton, M.V.; Brash, J.L. Effect of C4-, C8- and C18- alkylation of poly(vinyl alcohol) hydrogels on the adsorption of albumin and fibrinogen from buffer and plasma: Limited correlation with platelet interactions. Biomaterials 1997, 18, 1585–1592. [Google Scholar] [CrossRef]
- Courtney, J.M.; Lamba, N.M.K.; Sundaram, S.; Forbes, C.D. Biomaterials for blood-contacting applications. Biomaterials 1994, 15, 737–744. [Google Scholar] [CrossRef]
- Heuck, C.C.; Schiele, U.; Horn, D.; Fronda, D.; Ritz, E. The role of surface charge on the accelerating action of heparin on the antithrombin III-inhibited activity of α-Thrombin. J. Biol. Chem. 1985, 260, 4598–4603. [Google Scholar]
- Biological Evaluation of Medical Devices; AS-ISO-10993, Standards Australia International Ltd: Sydney, Austrilia, 2004.
- Jaques, L.B.; Monkhouse, F.C.; Stewart, M. A method for the determination of heparin in blood. J. Physiol. 1949, 109, 41–48. [Google Scholar]
- Hemker, H.C.; Giesen, P.; AlDieri, R.; Regnault, T.; de Smed, E.; Wagenvoord, R. The calibrated automated thrombogram (CAT): A universal routine test for hyper- and hypocoagulability. Pathophysiol. Haemost. Thromb. 2002, 32, 249–253. [Google Scholar] [CrossRef]
© 2012 by the authors; licensee MDPI, Basel, Switzerland. This article is an open-access article distributed under the terms and conditions of the Creative Commons Attribution license (http://creativecommons.org/licenses/by/3.0/).
Share and Cite
Chung, J.H.Y.; Knetsch, M.L.W.; Koole, L.H.; Simmons, A.; Poole-Warren, L.A. Polyurethane Organosilicate Nanocomposites as Blood Compatible Coatings. Coatings 2012, 2, 45-63. https://doi.org/10.3390/coatings2010045
Chung JHY, Knetsch MLW, Koole LH, Simmons A, Poole-Warren LA. Polyurethane Organosilicate Nanocomposites as Blood Compatible Coatings. Coatings. 2012; 2(1):45-63. https://doi.org/10.3390/coatings2010045
Chicago/Turabian StyleChung, Johnson H. Y., Menno L. W. Knetsch, Leo H. Koole, Anne Simmons, and Laura A. Poole-Warren. 2012. "Polyurethane Organosilicate Nanocomposites as Blood Compatible Coatings" Coatings 2, no. 1: 45-63. https://doi.org/10.3390/coatings2010045