Article

Photocatalytic Activity of Reactively Sputtered Titania Coatings Deposited Using a Full Face Erosion Magnetron

1
Surface Engineering Group, Manchester Metropolitan University, Manchester, M1 5GD, UK
2
Millennium Inorganic Chemicals Ltd., a Cristal Global Company Grimsby, Lincolnshire, DN40 2PR, UK
3
Dalton Research Institute, Manchester Metropolitan University, Manchester, M1 5GD, UK
*
Author to whom correspondence should be addressed.
Coatings 2013, 3(4), 177-193; https://doi.org/10.3390/coatings3040177
Submission received: 19 July 2013 / Revised: 22 September 2013 / Accepted: 14 October 2013 / Published: 25 October 2013

Abstract

:
Titanium dioxide (titania) is widely used as a photocatalyst for its moderate band gap, high photoactivity, recyclability, nontoxicity, low cost and its significant chemical stability. The anatase phase of titania is known to show the highest photocatalytic activity, however, the presence of this phase alone is not sufficient for sustained activity. In this study TiO2 coatings were deposited onto glass substrates by mid-frequency pulsed magnetron sputtering from metallic targets in reactive mode using a Full Face Erosion (FFE) magnetron, which allows the magnetic field to be modulated during the deposition process. The as-deposited coatings were analysed by scanning electron microscopy (SEM), energy dispersive X-ray spectroscopy (EDX) and micro-Raman spectroscopy. Selected coatings were then annealed at temperatures in the range of 400–700 °C and re-analysed. The photocatalytic activity of the coatings was investigated through measurements of the degradation of organic dyes, such as methyl orange, under the influence of UV and fluorescent light sources. It has been demonstrated that, after annealing, the pulsed magnetron sputtering process produced photo-active surfaces and that the activity of the coatings under exposure to fluorescent lamps was some 35%–45% of that observed under exposure to UV lamps.

1. Introduction

Titania (titanium dioxide) is a commercially important material with a wide range of applications, such as pigments, electronic data storage, sun screen and UV absorbers, anti-fogging screens, air and water purification devices and ‘self-cleaning’ windows [1,2,3]. Self-cleaning glass has a surface coating that keeps itself free of dirt and grime through natural photo-induced processes. The coating is commonly based on thin film titanium dioxide. The glass cleans itself in two stages. The photocatalytic stage of the process breaks down any organic material on the glass using ultraviolet radiation in sunlight. Oxygen vacancies created on the surface then makes the glass hydrophilic. Rain water will then form ‘sheets’ over the hydrophilic surface and rinse away the residue of the organic dirt [4,5,6]. Titanium dioxide in nature exists in one of three crystalline forms, anatase, rutile and brookite, and in thin film form, its structure is known to be highly sensitive to deposition conditions. Rutile is the thermodynamically stable form of titania; anatase is transformed to rutile at high deposition or post-annealing temperatures (in most cases above 700 °C) [7,8,9,10,11,12,13,14]. Brookite is very rarely found in thin film form. Of these phases, it is the anatase form, or anatase/rutile mixed phase structures that are found to have the highest photocatalytic activity.
In this study, TiO2 coatings were deposited onto glass substrates by mid-frequency (100–350 kHz) pulsed magnetron sputtering from metallic targets in reactive mode [15,16,17,18,19,20,21,22,23]. This technique is known to produce all forms of titania surfaces including highly photo-active anatase [24]. The full face erosion (FFE) magnetron used for the process, has the capability to oscillate the central pole at various speeds during operation. Consequently, the plasma sweeps across the central region of the target. This is designed to increase the area of the target that is sputtered, which improves target utilisation and, by keeping the central region of the target clean, also improves process stability by reducing the tendency for arcing particularly when depositing oxides [25]. This is a recent design of magnetron and the operating characteristics have not yet been investigated in detail. Thus, the influence of moving the central pole on the deposition process and the growing film is not fully understood.
A number of methods have been developed for the assessment of the photocatalytic activity of surfaces. For instance, for titania-based doped coatings the photocatalytic degradation of malic acid under UV and visible light irradiation were proposed [26,27]. Also, it was demonstrated that titania photocatalysts exhibit a significant level of activity against a broad spectrum of microorganisms [28]. However, the most widely used techniques for measuring photoactivity are based on photo-oxidation of organic films (such as stearic acid) or organic dyes. Depending on the property of the film layer a specific photocatalytic activity test, dry or wet is selected. For instance, whilst stearic acid (dry method) can produce non-continuous contacts between the stearic acid and the surface of the film [29,30,31,32,33], using methyl orange [34,35,36] or methylene blue [37] dyes can result in the production of continuous contact between the surface of the film and the solution. The latter method suits a photocatalytic test in which an electron exchange is involved and that was the major testing technique used for this study.

2. Experimental

The titania coatings were deposited by reactive DC or mid-frequency pulsed magnetron sputtering from a 375 mm × 125 mm Full Face Erosion magnetron. The target was 99.5% purity Ti and the reactive sputtering process was controlled by optical emission monitoring (the 503 nm Ti line was monitored and held at 20% of the full metal signal, as this had previously been shown to produce transparent titania coatings [38,39]). After achieving a base pressure of 1 × 10⁻³ Pa, argon was introduced to the chamber at 17.7 SCCM. The pumping set was then throttled in order to achieve the desired coating pressure (typically 0.1–0.2 Pa). Coatings were deposited at an average power of 1.3 kW in either DC, or pulsed DC magnetron sputtering mode at frequencies of 100, 225 or 350 kHz and a duty of 50%. The magnetron was operated at four different FFE configurations (0, i.e., static, 20, 150 or 300 rpm). These speeds were chosen to study the potential effect of FFE oscillation speed on the deposition process. In the static configuration the FFE magnetron is identical to a planar magnetron; 20 rpm results in minimal disturbance to the plasma; 150 rpm is the mid-range speed and 300 rpm generates maximum plasma disturbance during each cycle. For these experiments a fixed run time of one hour was used. The target-to-substrate distance was 110 mm. The coatings were deposited onto 4 mm float glass samples, size 150 mm × 150 mm, as well as glass microscope slides, all of which were ultrasonically pre-cleaned in iso-propanol.
The as-deposited coatings were analysed by scanning electron microscopy (SEM, Zeiss Supra 40, Zeiss, Cambridge, UK), energy dispersive X-ray spectroscopy (EDX, Edax Trident, EDAX, Leicester, UK), and micro-Raman spectroscopy (Renishaw Invia, 514 nm laser, Renishaw, Gloucestershire, UK). Selected coatings were annealed in air at temperatures in the range 400–700 °C for 10 min and re-analysed. Also, the coating thickness was measured by Dektak surface profilometry.
The photocatalytic activity of TiO2 films can vary significantly and is dependent on many factors, such as film thickness, roughness, crystallite size and crystal phase [40]. In this study the photocatalytic activity was assessed in two ways. An initial scan of the samples was made using the photo-reduction reaction of resazurin (Rz) dye [41,42]. In brief, the formulation consists of: the redox dye, resazurin; a sacrificial electron donor, glycerol; and a polymer, hydroxyethyl cellulose, dissolved in water. Upon irradiation of the ink on a photocatalytic surface with ultra-violet radiation, the photogenerated electrons reduce the blue Rz to the pink resorufin (Rf) while the photogenerated holes oxidise the glycerol to glyceralaldehyde. This process occurs in minutes on an active surface, making this test particularly suited to “on the spot” tests, but it cannot be readily quantified. Two drops of Rz solution were applied to the surface of the samples (typically 20 mm × 20 mm) using a pipette. Then, a microscope slide (20 mm × 20 mm) was placed onto the dye spot to spread the dye evenly over the whole sample surface. The coatings were irradiated at an integrated power flux of 4 mW/cm2 with two 15 W 365 nm BLB lamps (Sankyo Denki; Farnell, Leeds, UK) until a blue-to-pink colour change was observed for the dye, or for a total period of 40 min (bulb to sample separation = 100 mm). Based on the ‘pass/fail’ Rz test, selected samples were then re-tested against methyl orange solutions. Methyl orange (MeO 99.9% pure, Alfa Aesar) was used as a simple model of a series of common azo-dyes widely used in industry [43]. When it is dissolved in distilled water, the MeO UV-vis spectrum shows a strong absorption peak at approximately 464 nm. Changes in this reference peak were used to monitor the photocatalytic degradation of MeO by the titania coatings. Experiments were carried out at room temperature in air. The coatings were again irradiated at 4 mW/cm2 with 365 nm BLB lamps. Samples of the MeO (0.06 M) solution were taken before testing and then at 30 min intervals up to a total time of 4 hours and analysed using a Perkin-Elmer UV-vis spectrophotometer. Spectra were taken in the range of 350–550 nm to monitor the absorption peak in this region. Also, tests were carried out using two 15 W fluorescent (Fl) tubes in place of the UV tubes to simulate typical laboratory environments. The integrated power flux to the coatings with the Fl tubes was 6.4 mW/cm2, of which the UV component (300–400 nm) was 0.5 mW/cm2. In all other ways the tests were identical to the UV tests. A comparison of the spectra from the two light sources is given in Figure 1.
Figure 1. Spectra from UV and fluorescent tubes used for photocatalytic testing.
Coatings 03 00177 g001

3. Results

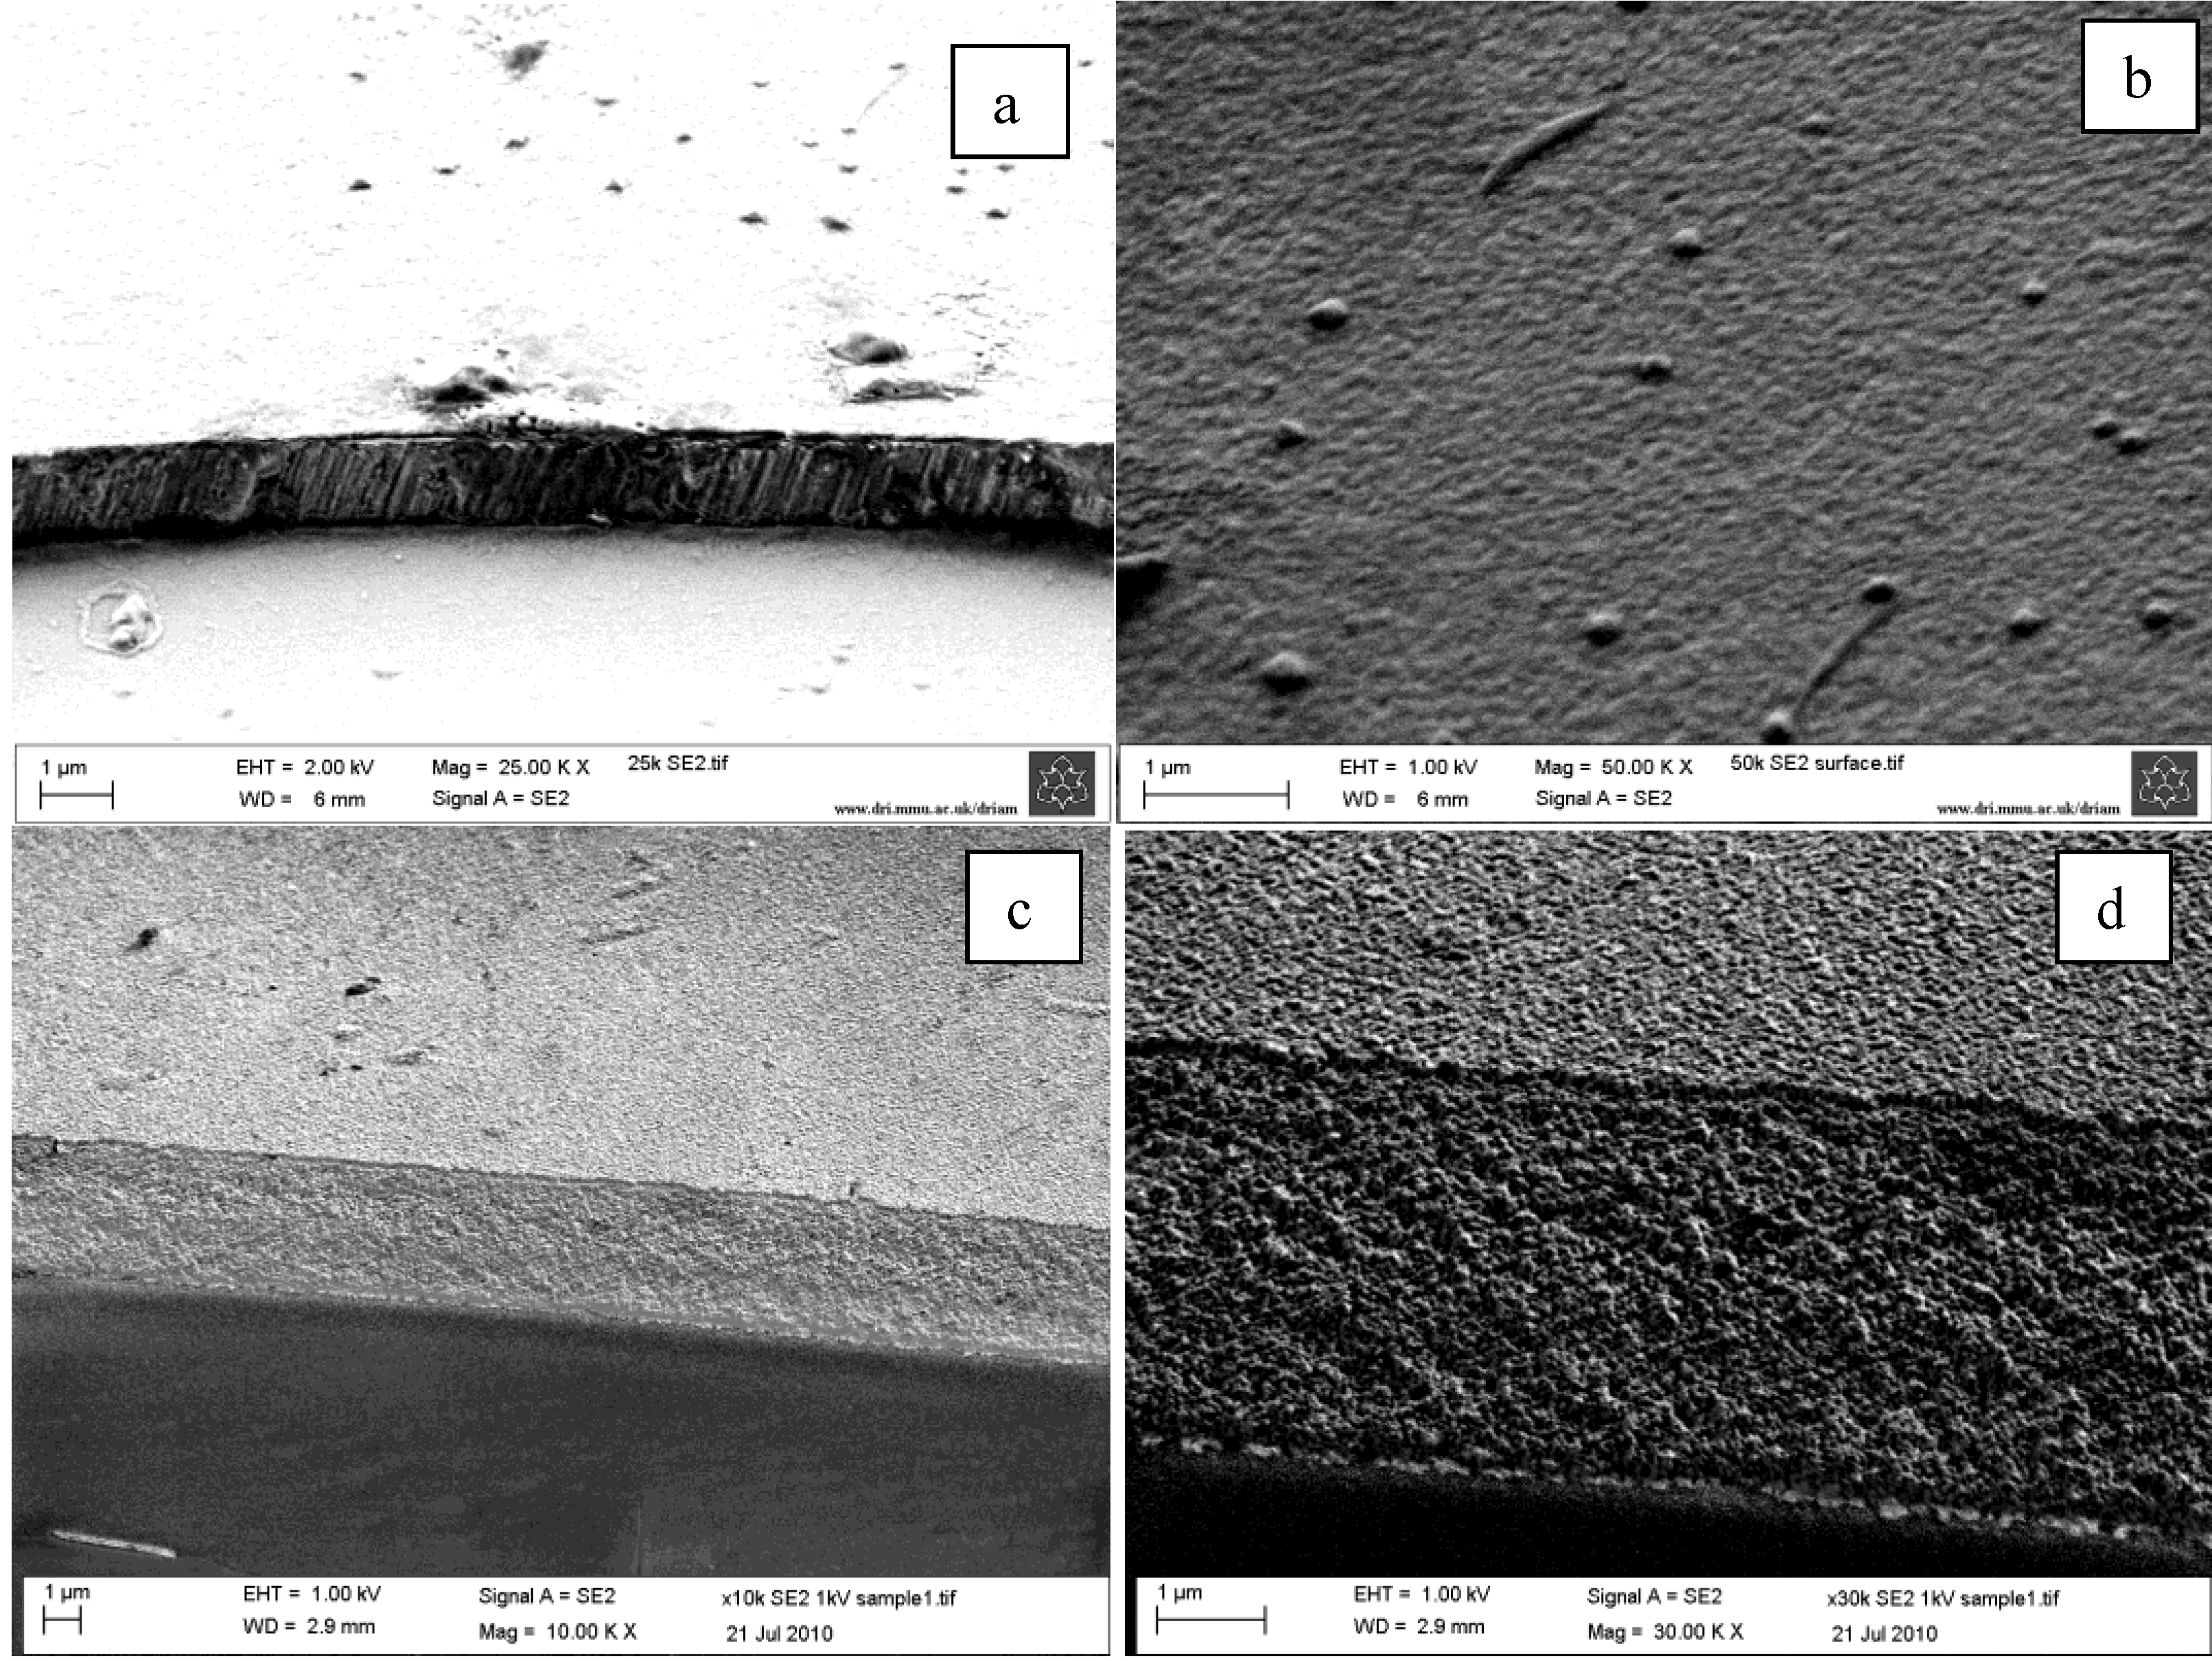
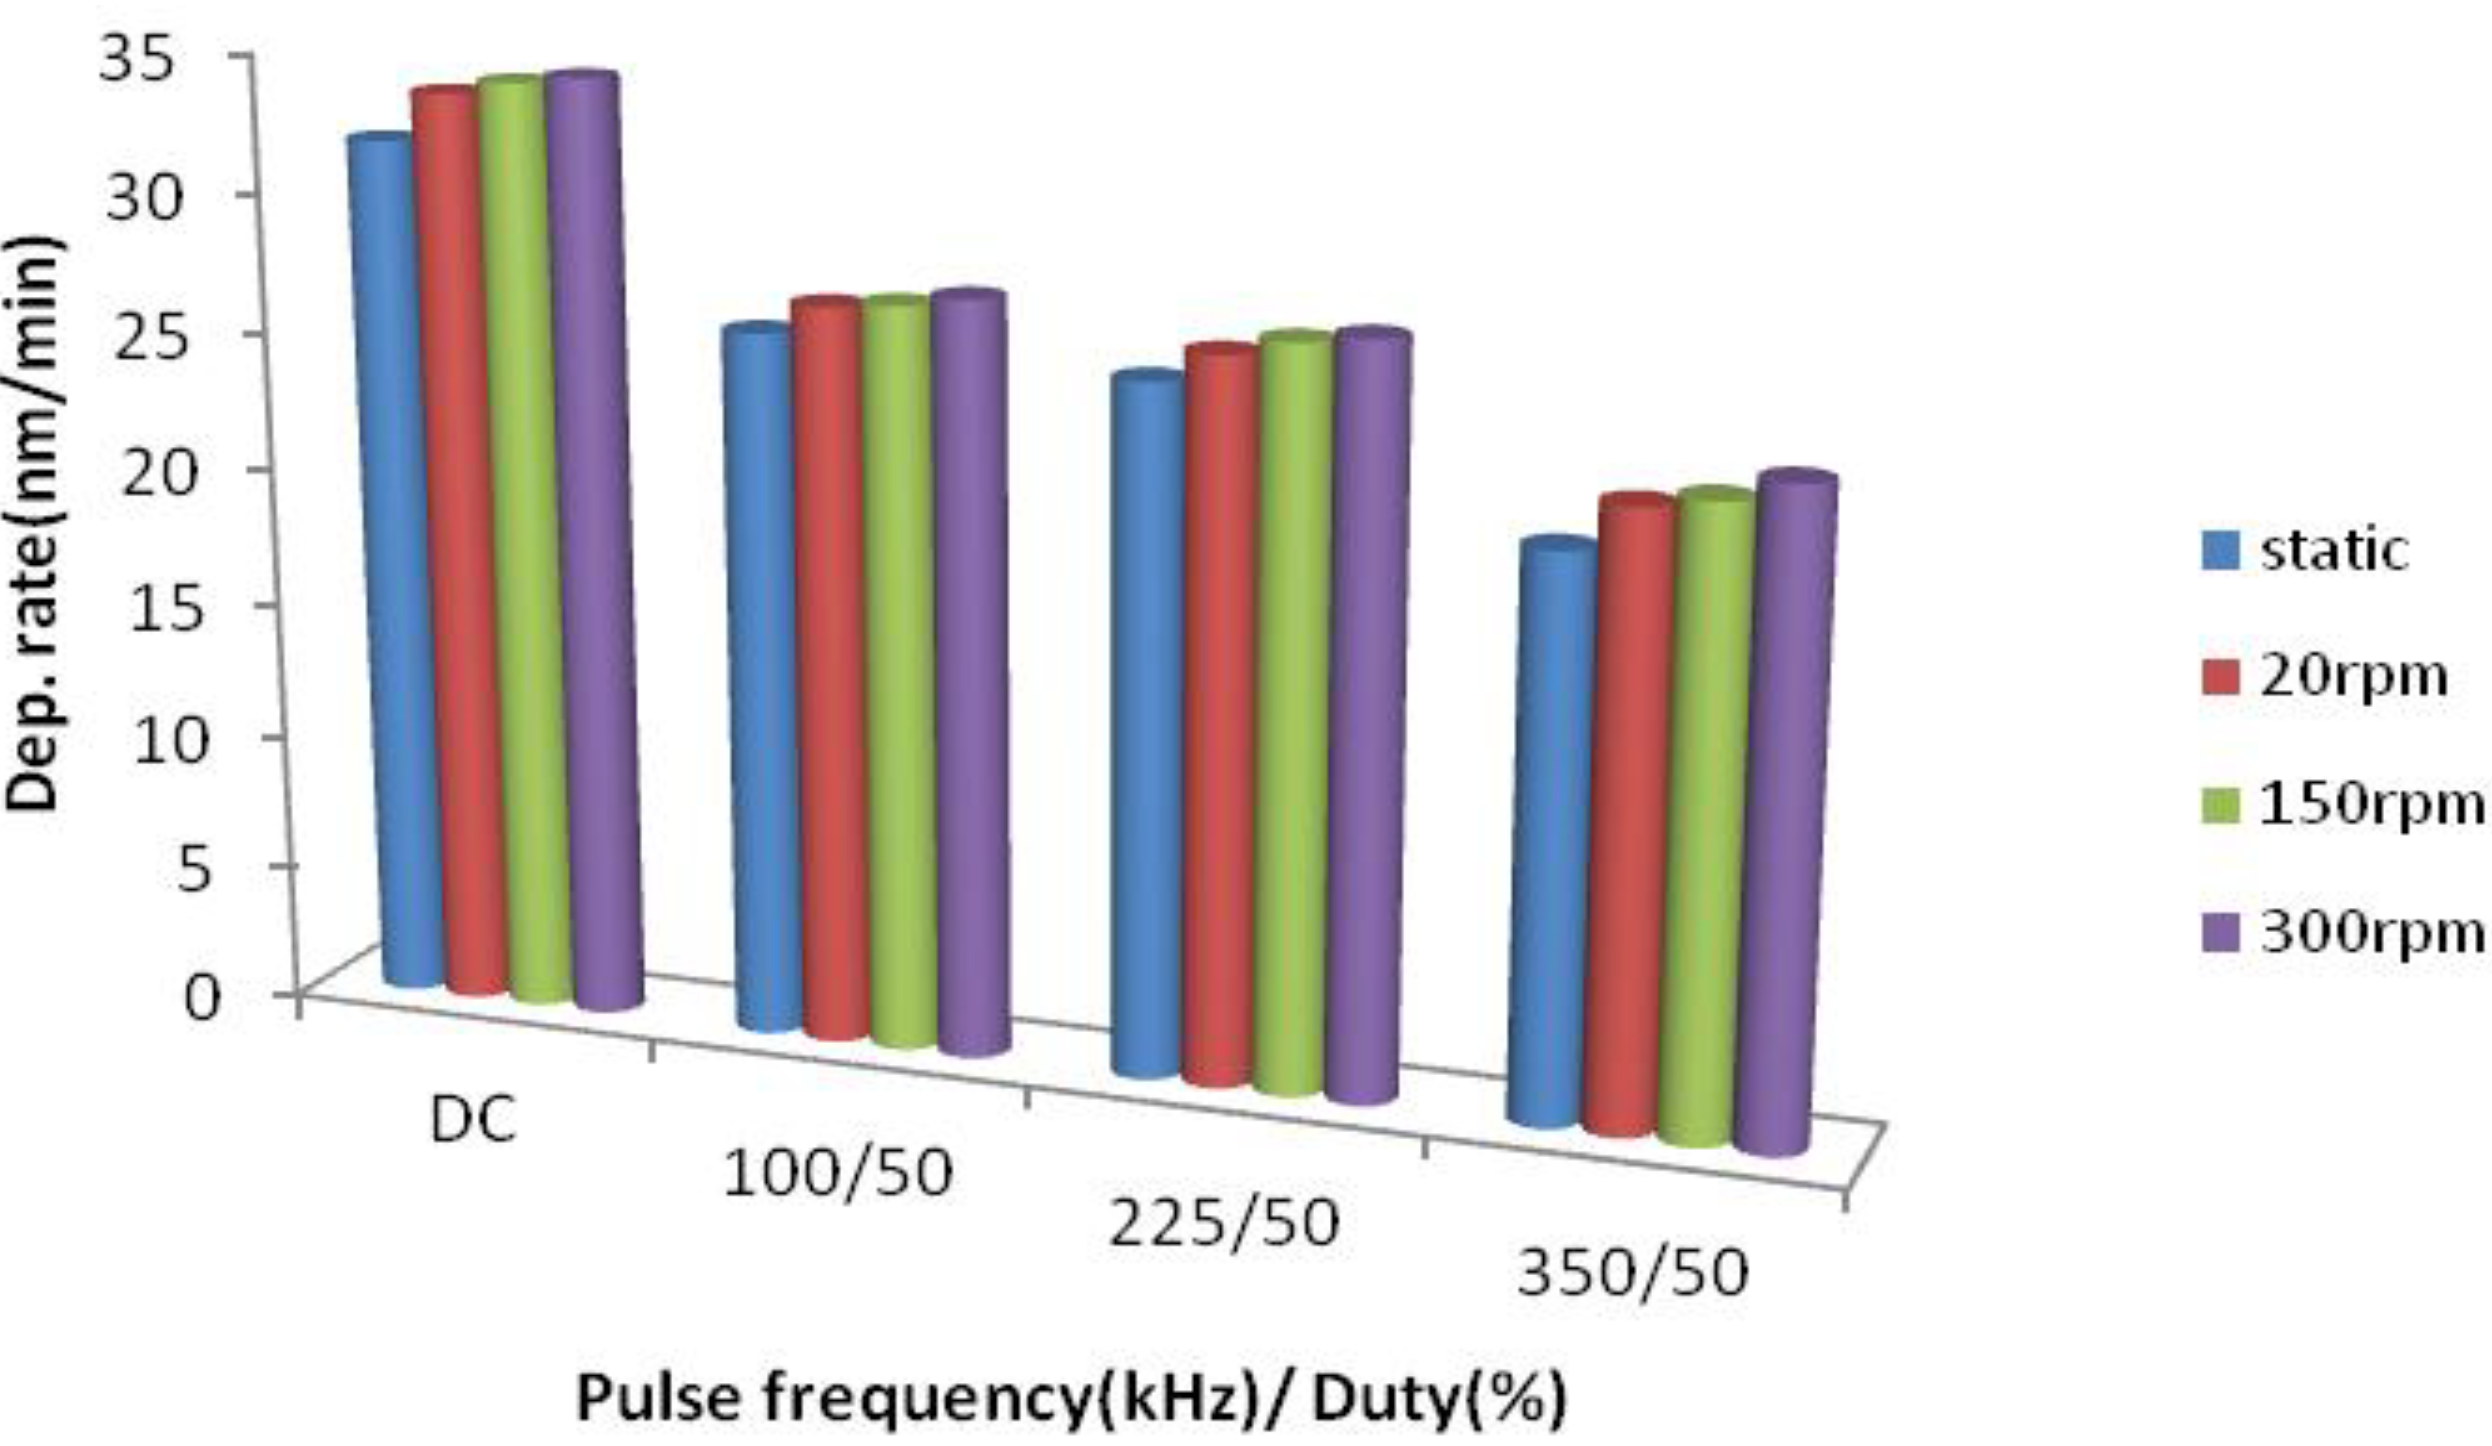
3.1. Coating Structures, Compositions and Deposition Rates

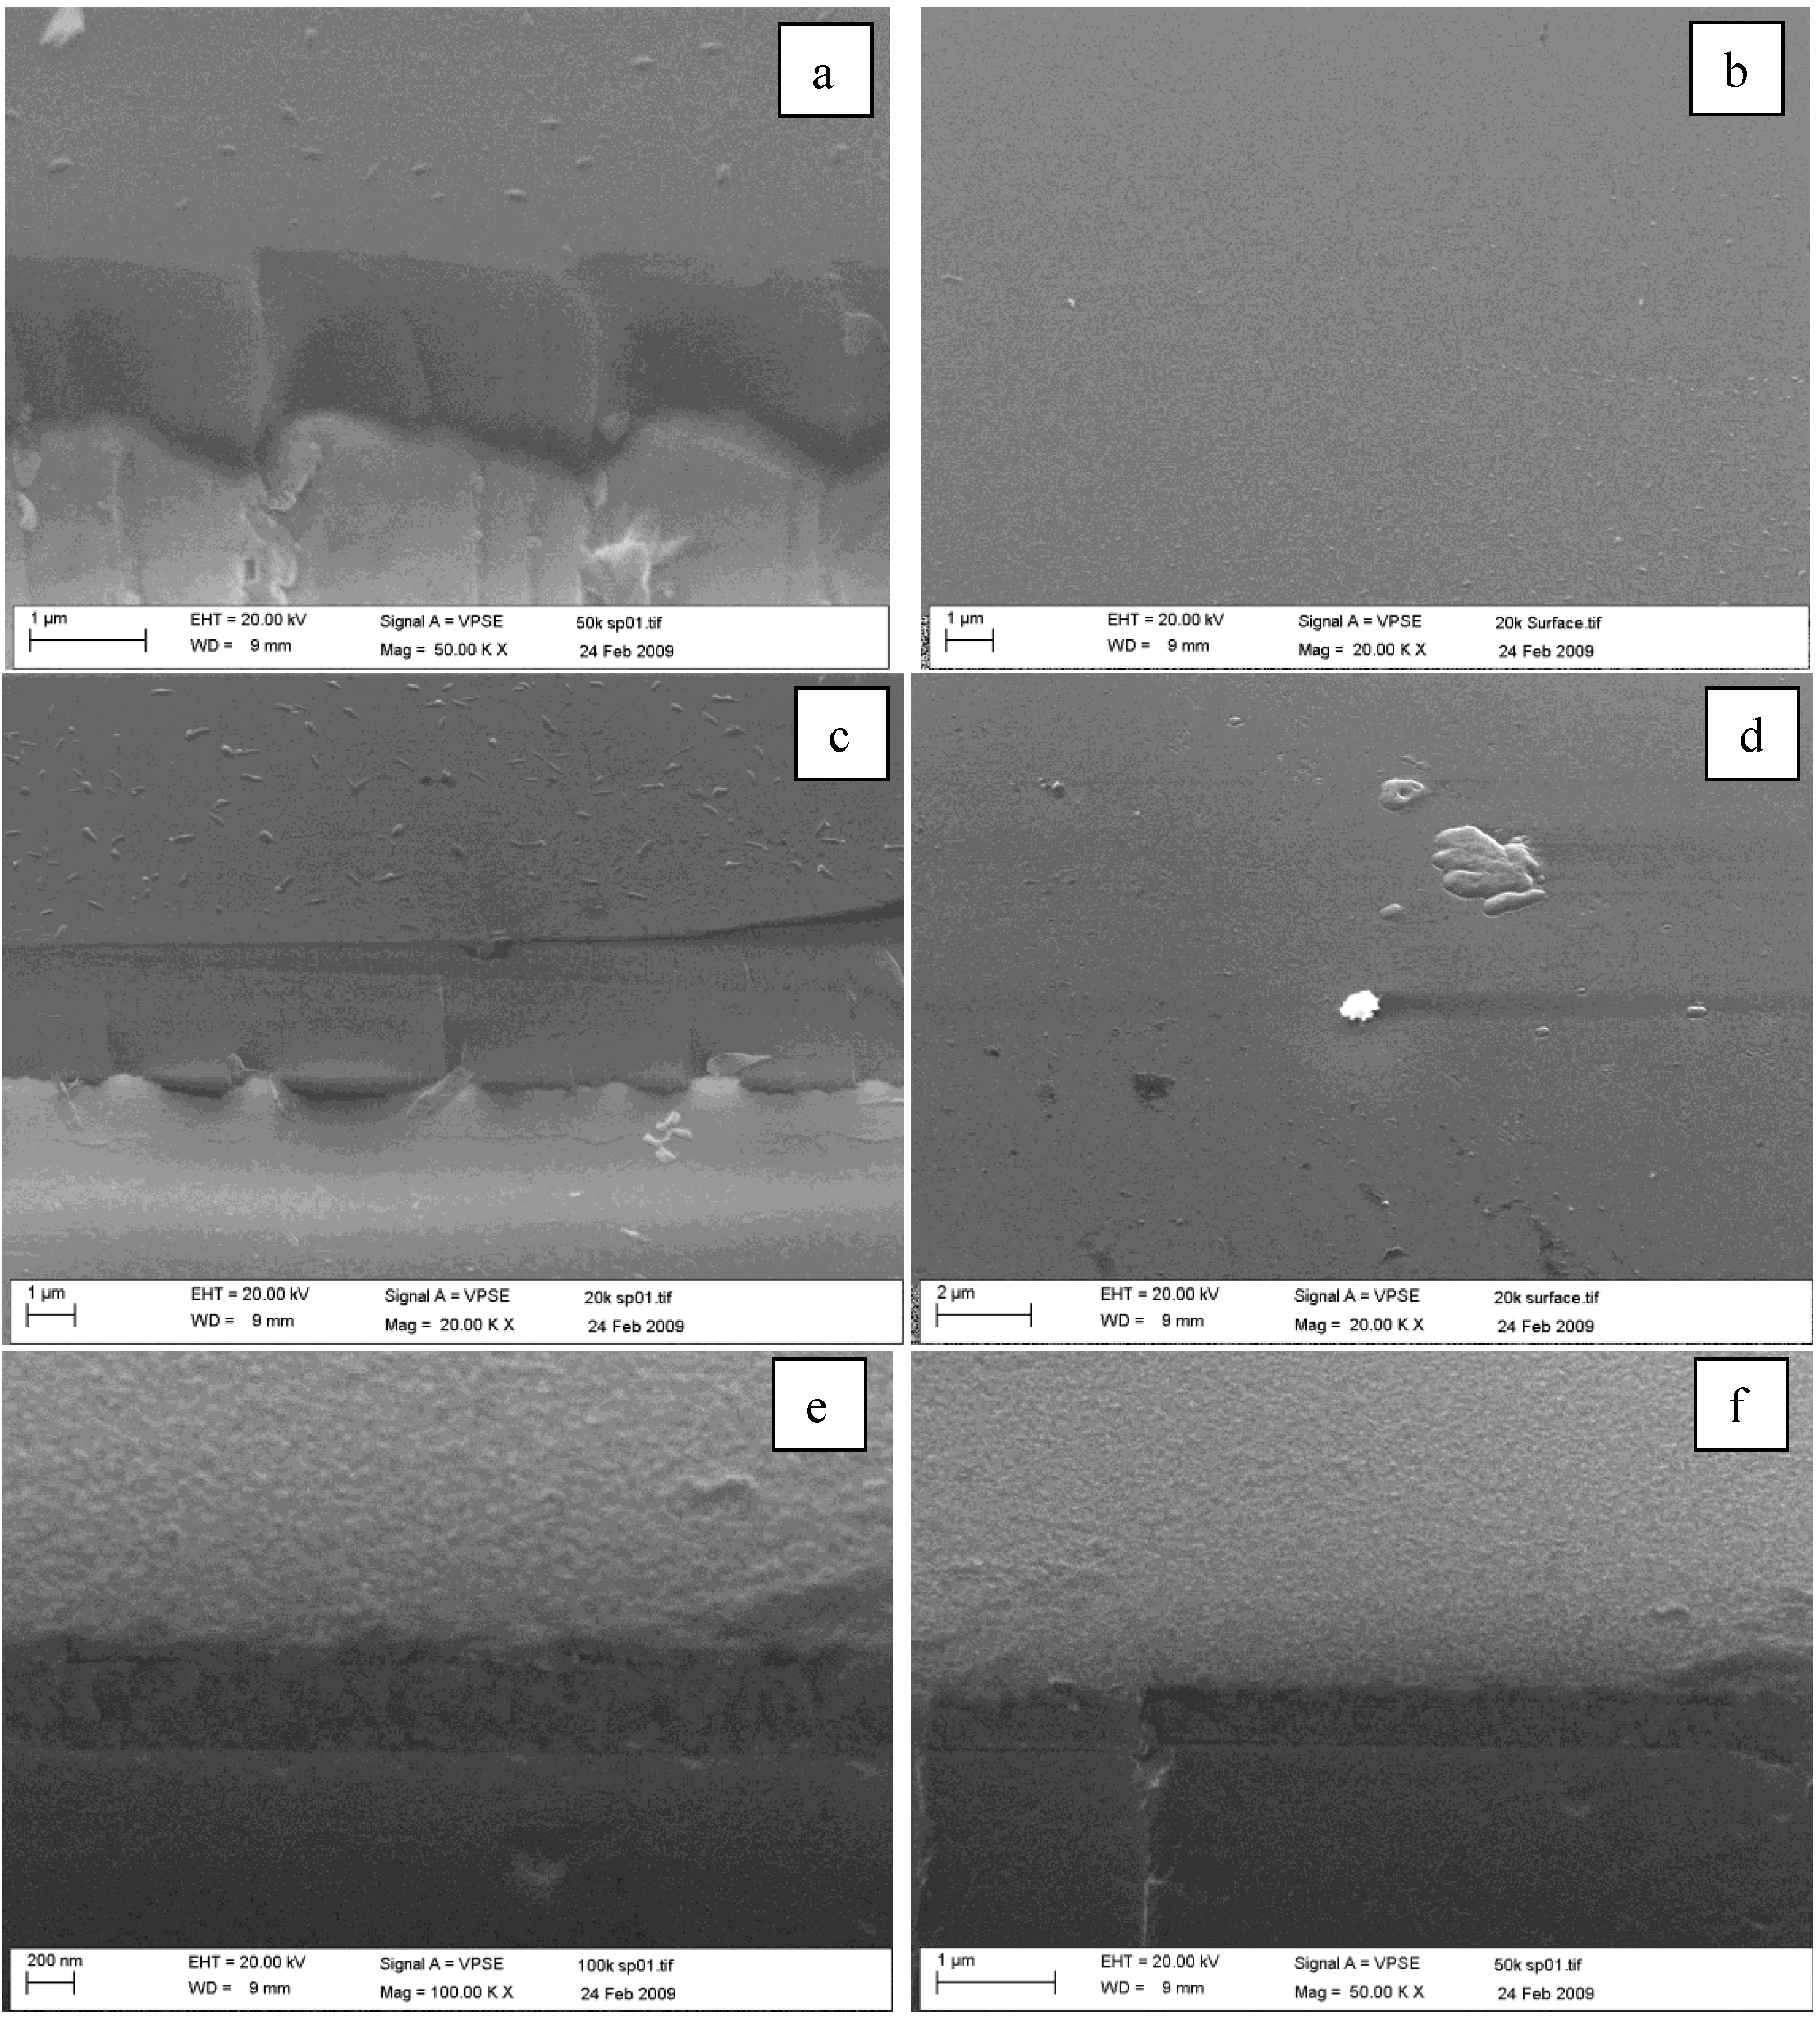
3.1.1. As-Deposited Coatings

Coatings were deposited under a range of operating conditions, as listed in Table 1. Estimates of deposition rates and Ra roughness values of as-deposited coatings (from the Dektak surface profilometer) are presented in Table 1. The variation in deposition rate across the process envelope is significant, ranging from 20.4 to 34.4 nm/min. Furthermore, it is apparent that deposition rate decreases with increasing pulse frequency, but increases with increasing FFE speed (see Figure 2). The reduction in deposition rate with pulse frequency has been observed and is described elsewhere [44]. The influence of FFE oscillation speed on deposition rate has not, though, been previously reported. Although the mechanism resulting in the increase in deposition rate with oscillation speed is complex and needs further investigation, it is likely that the increase may be due to keeping the poisoned regions cleaner at higher speeds and the broader racetrack region means sputtering takes place from a greater surface area of the target.
Table 1. Compositional and structural properties of reactively sputtered titania coatings at various operating parameters and annealing temperatures.
Sample NoFrequency, (kHz)FFE Oscillation Speed, rpmDeposition Rate, nm/minRa Value, nmPost-annealed Coatings
400 °C500 °C600 °C700 °C
S1DC31.89AMAMRURU
S2DC2033.611AMAMRURU
S3DC15034.115AMAMRURU
S4DC30034.428AMANANAN
S510025.817AMAMANAN/RU
S61002026.920AMANANAN
S710015027.121AMANANAN
S810030027.519AMAN/RUAN/RUAN/RU
S922525.127AMANANAN/RU
S102252026.229AMAN/RUAN/RUAN/RU
S1122515026.829AMAN/RUAN/RUAN/RU
S1222530027.130AMAN/RUAN/RUAN/RU
S1335020.415AMAMRU/ANRU
S143502022.19AMAMRURU
S1535015022.511AMAMRURU
S1635030023.312AMAMRURU
Notes: Structures determined by Raman spectroscopy. AM: Amorphous; AN: Anatase; RU: Rutile; AN/RU: Mixed phase with predominating anatase structure; RU/AN: Mixed phase with predominating rutile structure; FFE: Full Face Erosion magnetron.
Figure 2. Variation in deposition rate for titania coatings produced by DC and pulsed DC reactive magnetron sputtering using a Full Face Erosion (FFE) magnetron. Apparently, deposition rate decreases with increasing pulse frequency, but increases with increasing FFE speed.
Coatings 03 00177 g002
Figure 3 shows the effect of FFE oscillation speed on the structure of the as-deposited films while operating the magnetron discharge at 350 kHz pulse frequency. At 300 rpm the Raman spectra indicates a weak rutile structure, whereas in the static case, the structure appears to be amorphous. Figure 4a–d is SEM micrograph of the surface and fracture sections of samples S13 and S16, respectively. Both have similar dense structures, but the difference in deposition rate observed with the FFE magnetic field stationary and rotating at 300 rpm is apparent from the difference in film thickness between the samples.
Figure 3. Raman spectra for titania samples S13 (FFE static) and S16 (FFE 300rpm) deposited at 350 kHz onto glass substrates—As-deposited. (Notes: A: Anatase; R: Rutile).
Coatings 03 00177 g003
Figure 4. (a,b) Scanning electron microscopy (SEM) micrographs of as-deposited sample S13 produced at 350 kHz onto glass substrates—FFE. Static—as-deposited; (c,d) SEM micrographs of as-deposited sample S16 produced at 350 kHz onto glass substrates—FFE. 300 rpm—as-deposited.
Coatings 03 00177 g004

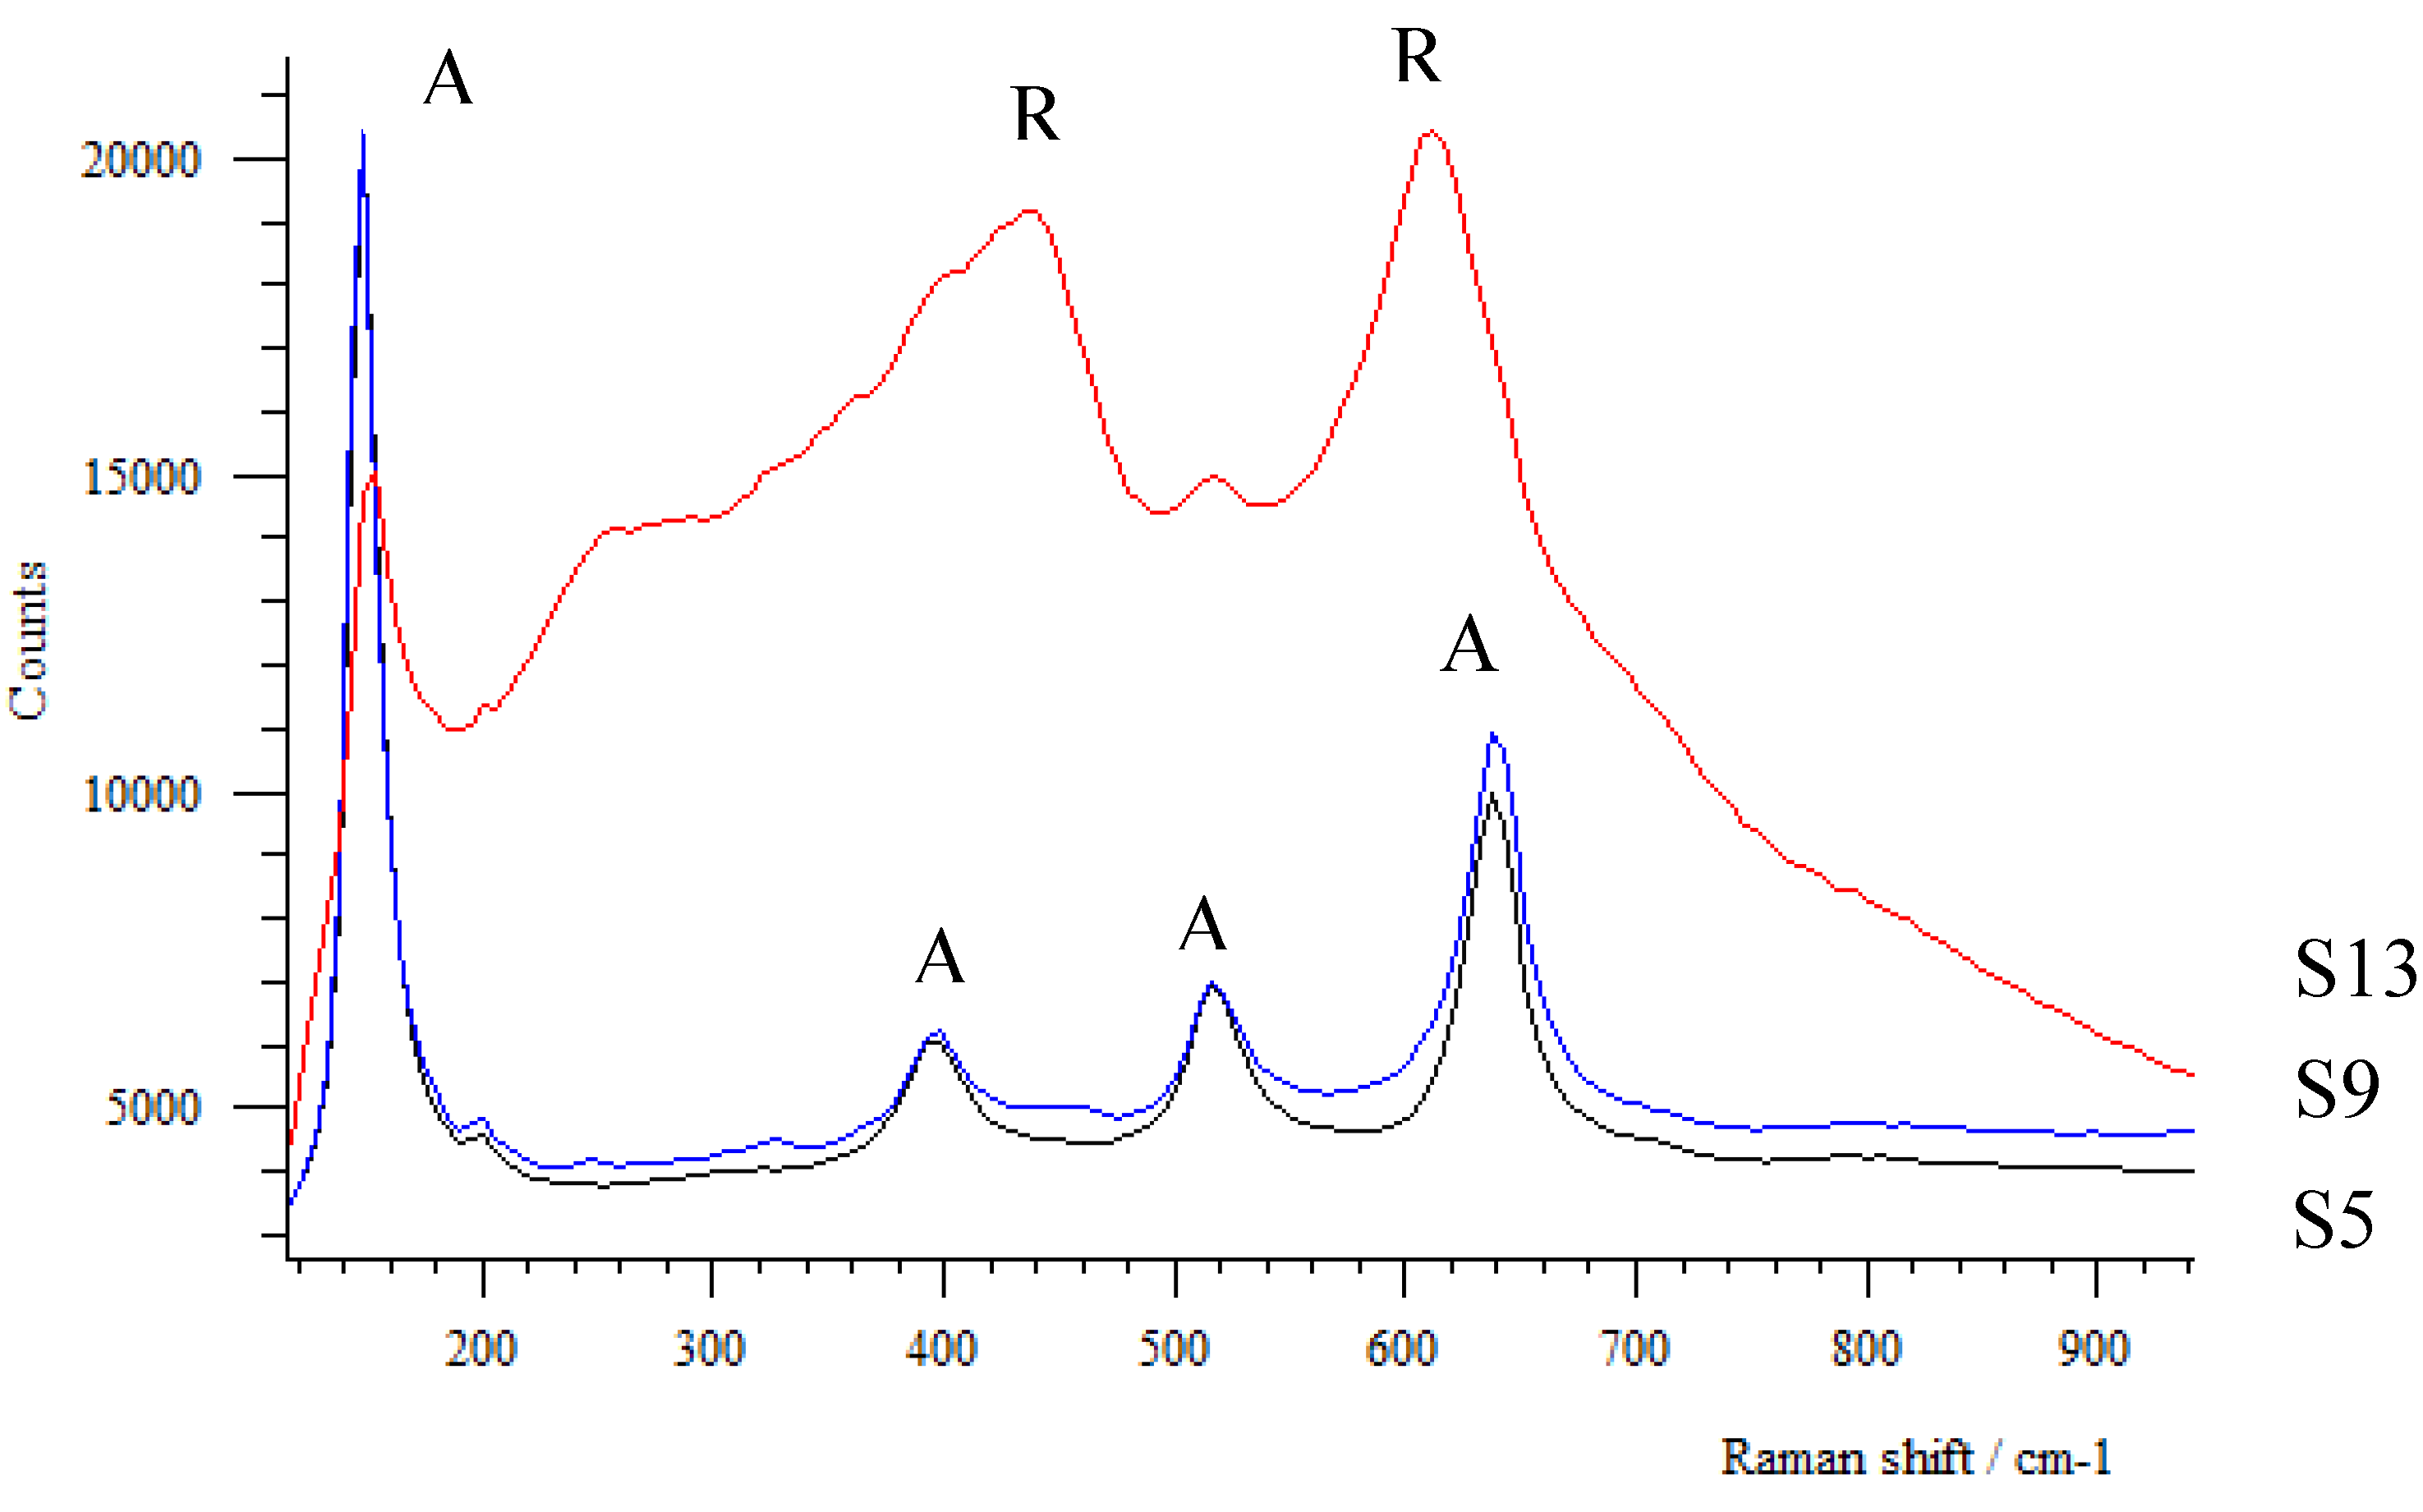
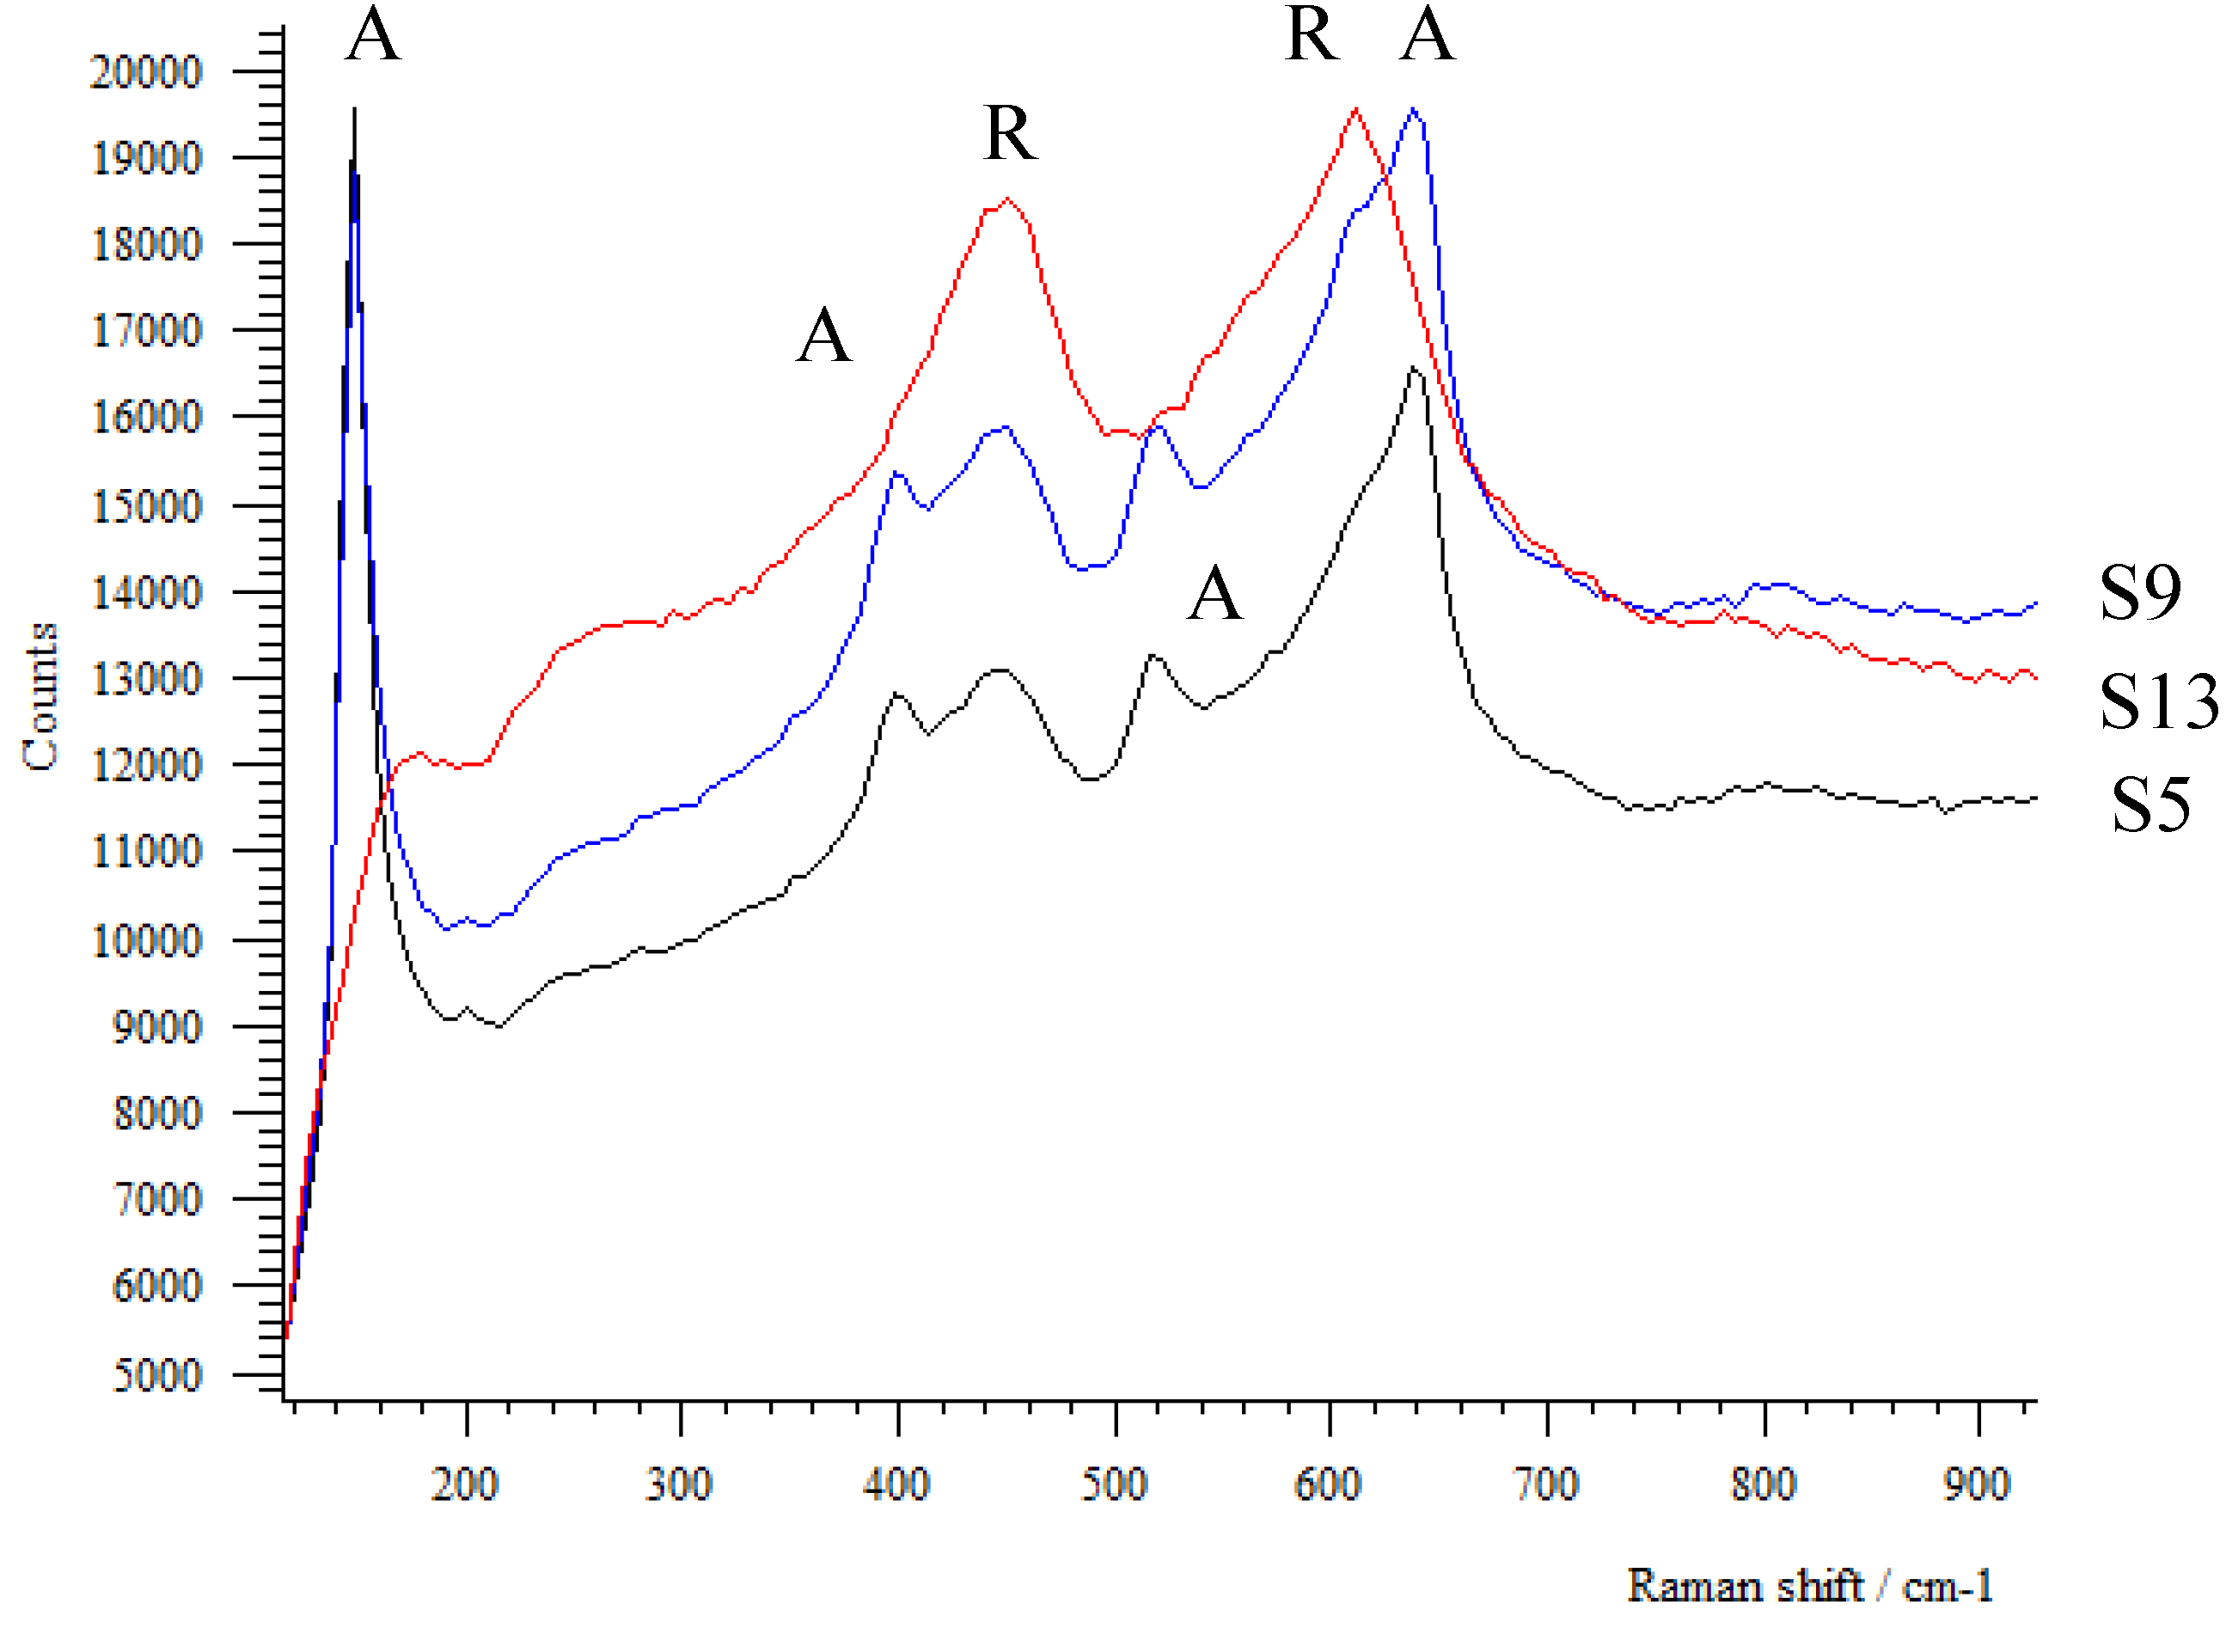
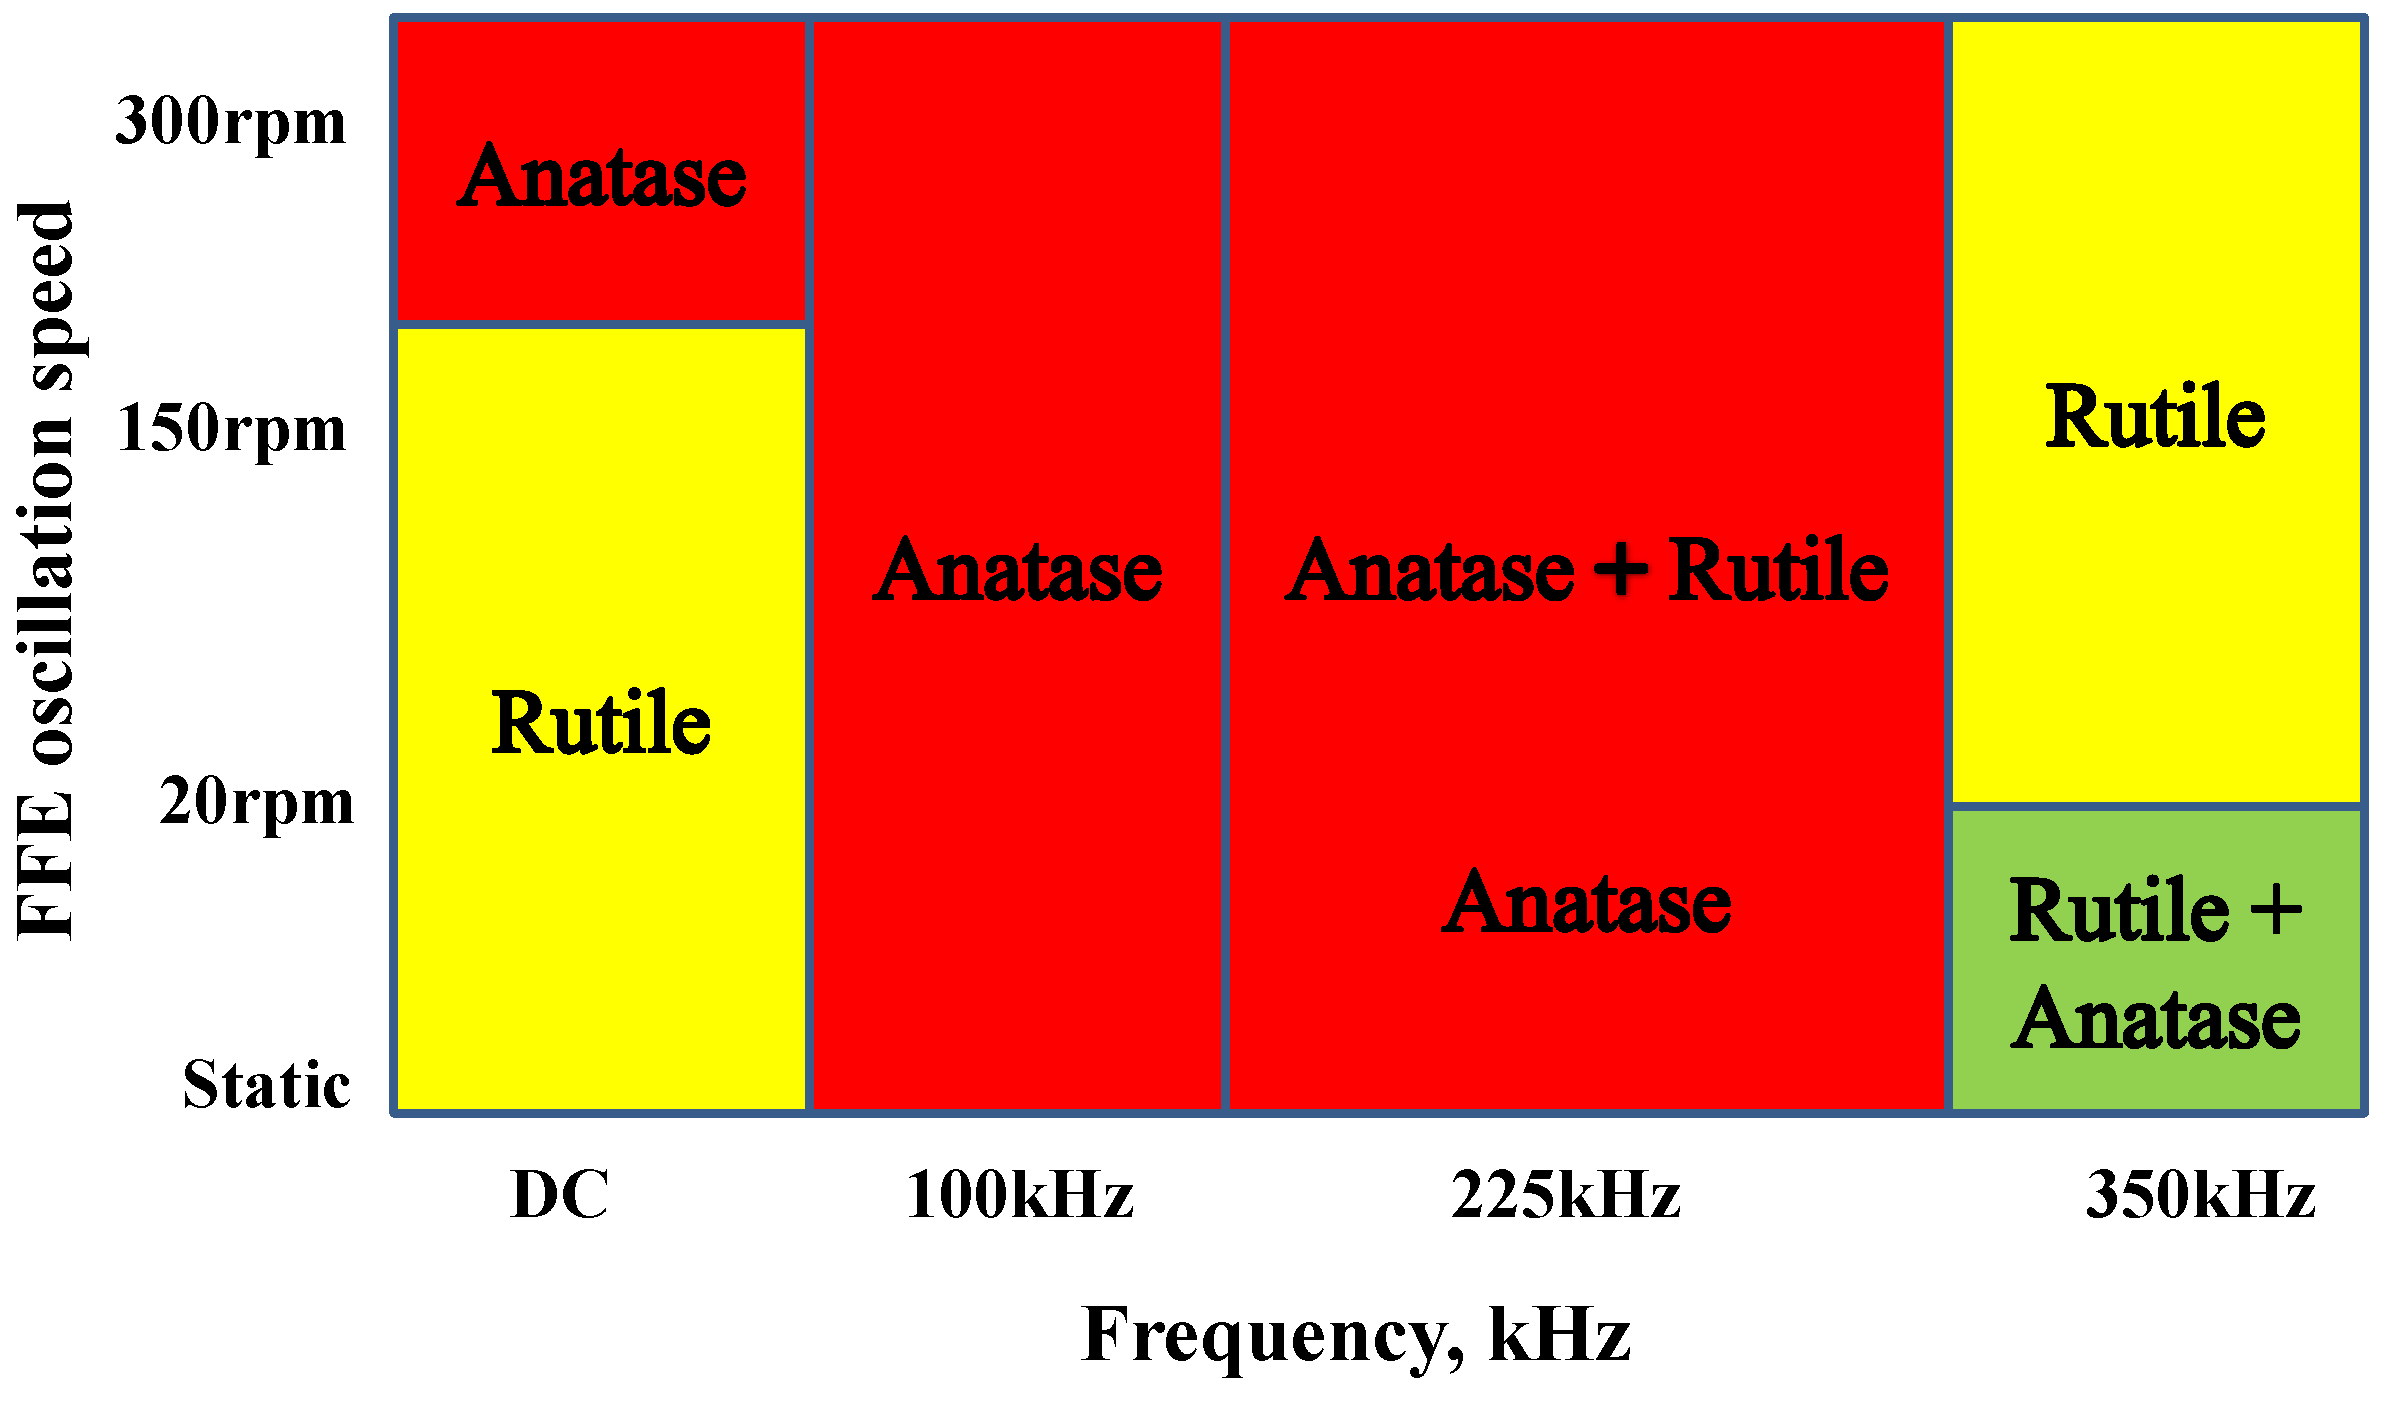
3.1.2. Annealed Coatings

The titania coatings were post-deposition annealed in air at temperatures in the range 400–700 °C and analysed by Raman spectroscopy and SEM. Table 1 describes the predominant crystal structure that formed after annealing for 10 min (as estimated from the relative intensities of the peaks in the spectra obtained from Raman spectroscopy) as a function of deposition conditions and annealing temperature.
From Table 1 it is clear that annealing temperature has a significant impact on the structure of the deposited films. The data imply that, significant structural transitions in these coatings generally occur between approximately 600 °C and 700 °C. Crystallisation and grain growth are time and temperature dependent processes. The relatively short time of 10 min for annealing was, therefore, selected to allow structural evolution to be monitored as a function of temperature, since annealing for long periods of time would be likely to produce batches of coatings all with similar structures.
Figure 5 shows the Raman spectra for samples S5, S9 and S13 annealed at 600 °C. S5 and S9 appear to be anatase and S13 shows evidence of a mixed rutile/anatase structure. However, further noticeable structural changes occurred when these samples were annealed at 700 °C, as can be seen in Figure 6. While operating at 350 kHz with the FFE central pole static (S13) formed a strongly rutile structure after annealing, varying the discharge frequency to either 100 or 225 kHz (S5 and S9) resulted in the production of a mixed phase structure, which was predominantly anatase. The SEM micrographs of samples S5, S9 and S13 are shown in Figure 7a–f. Whilst S5 and S9 show smooth surfaces (except for a few defects) and almost featureless glassy fracture sections, S13 is somewhat rougher in appearance. S13 is also thinner, due to the lower deposition rate experienced at 350 kHz.
Figure 5. Raman spectra for samples S5, S9 and S13 produced at 100, 225 and 350 kHz onto glass substrates—FFE. Static—Annealed at 600 °C.
Coatings 03 00177 g005
Figure 6. Raman spectra for samples S5, S9 and S13 produced at 100, 225 and 350 kHz onto glass substrates—FFE. Static—Annealed at 700 °C.
Coatings 03 00177 g006
Figure 7. (a,b) SEM micrographs of sample S5 produced at 100 kHz onto glass substrates—FFE. Static—annealed at 700 °C—structure: predominantly anatase with rutile structure. (c,d) SEM micrographs of sample S9 produced at 225 kHz onto glass substrates—FFE. Static—annealed at 700 °C—structure: predominantly anatase with rutile structure. (e,f) SEM micrographs of sample S13 produced at 350 kHz onto glass substrates—FFE. Static—annealed at 700 °C—structure: Rutile structure.
Coatings 03 00177 g007

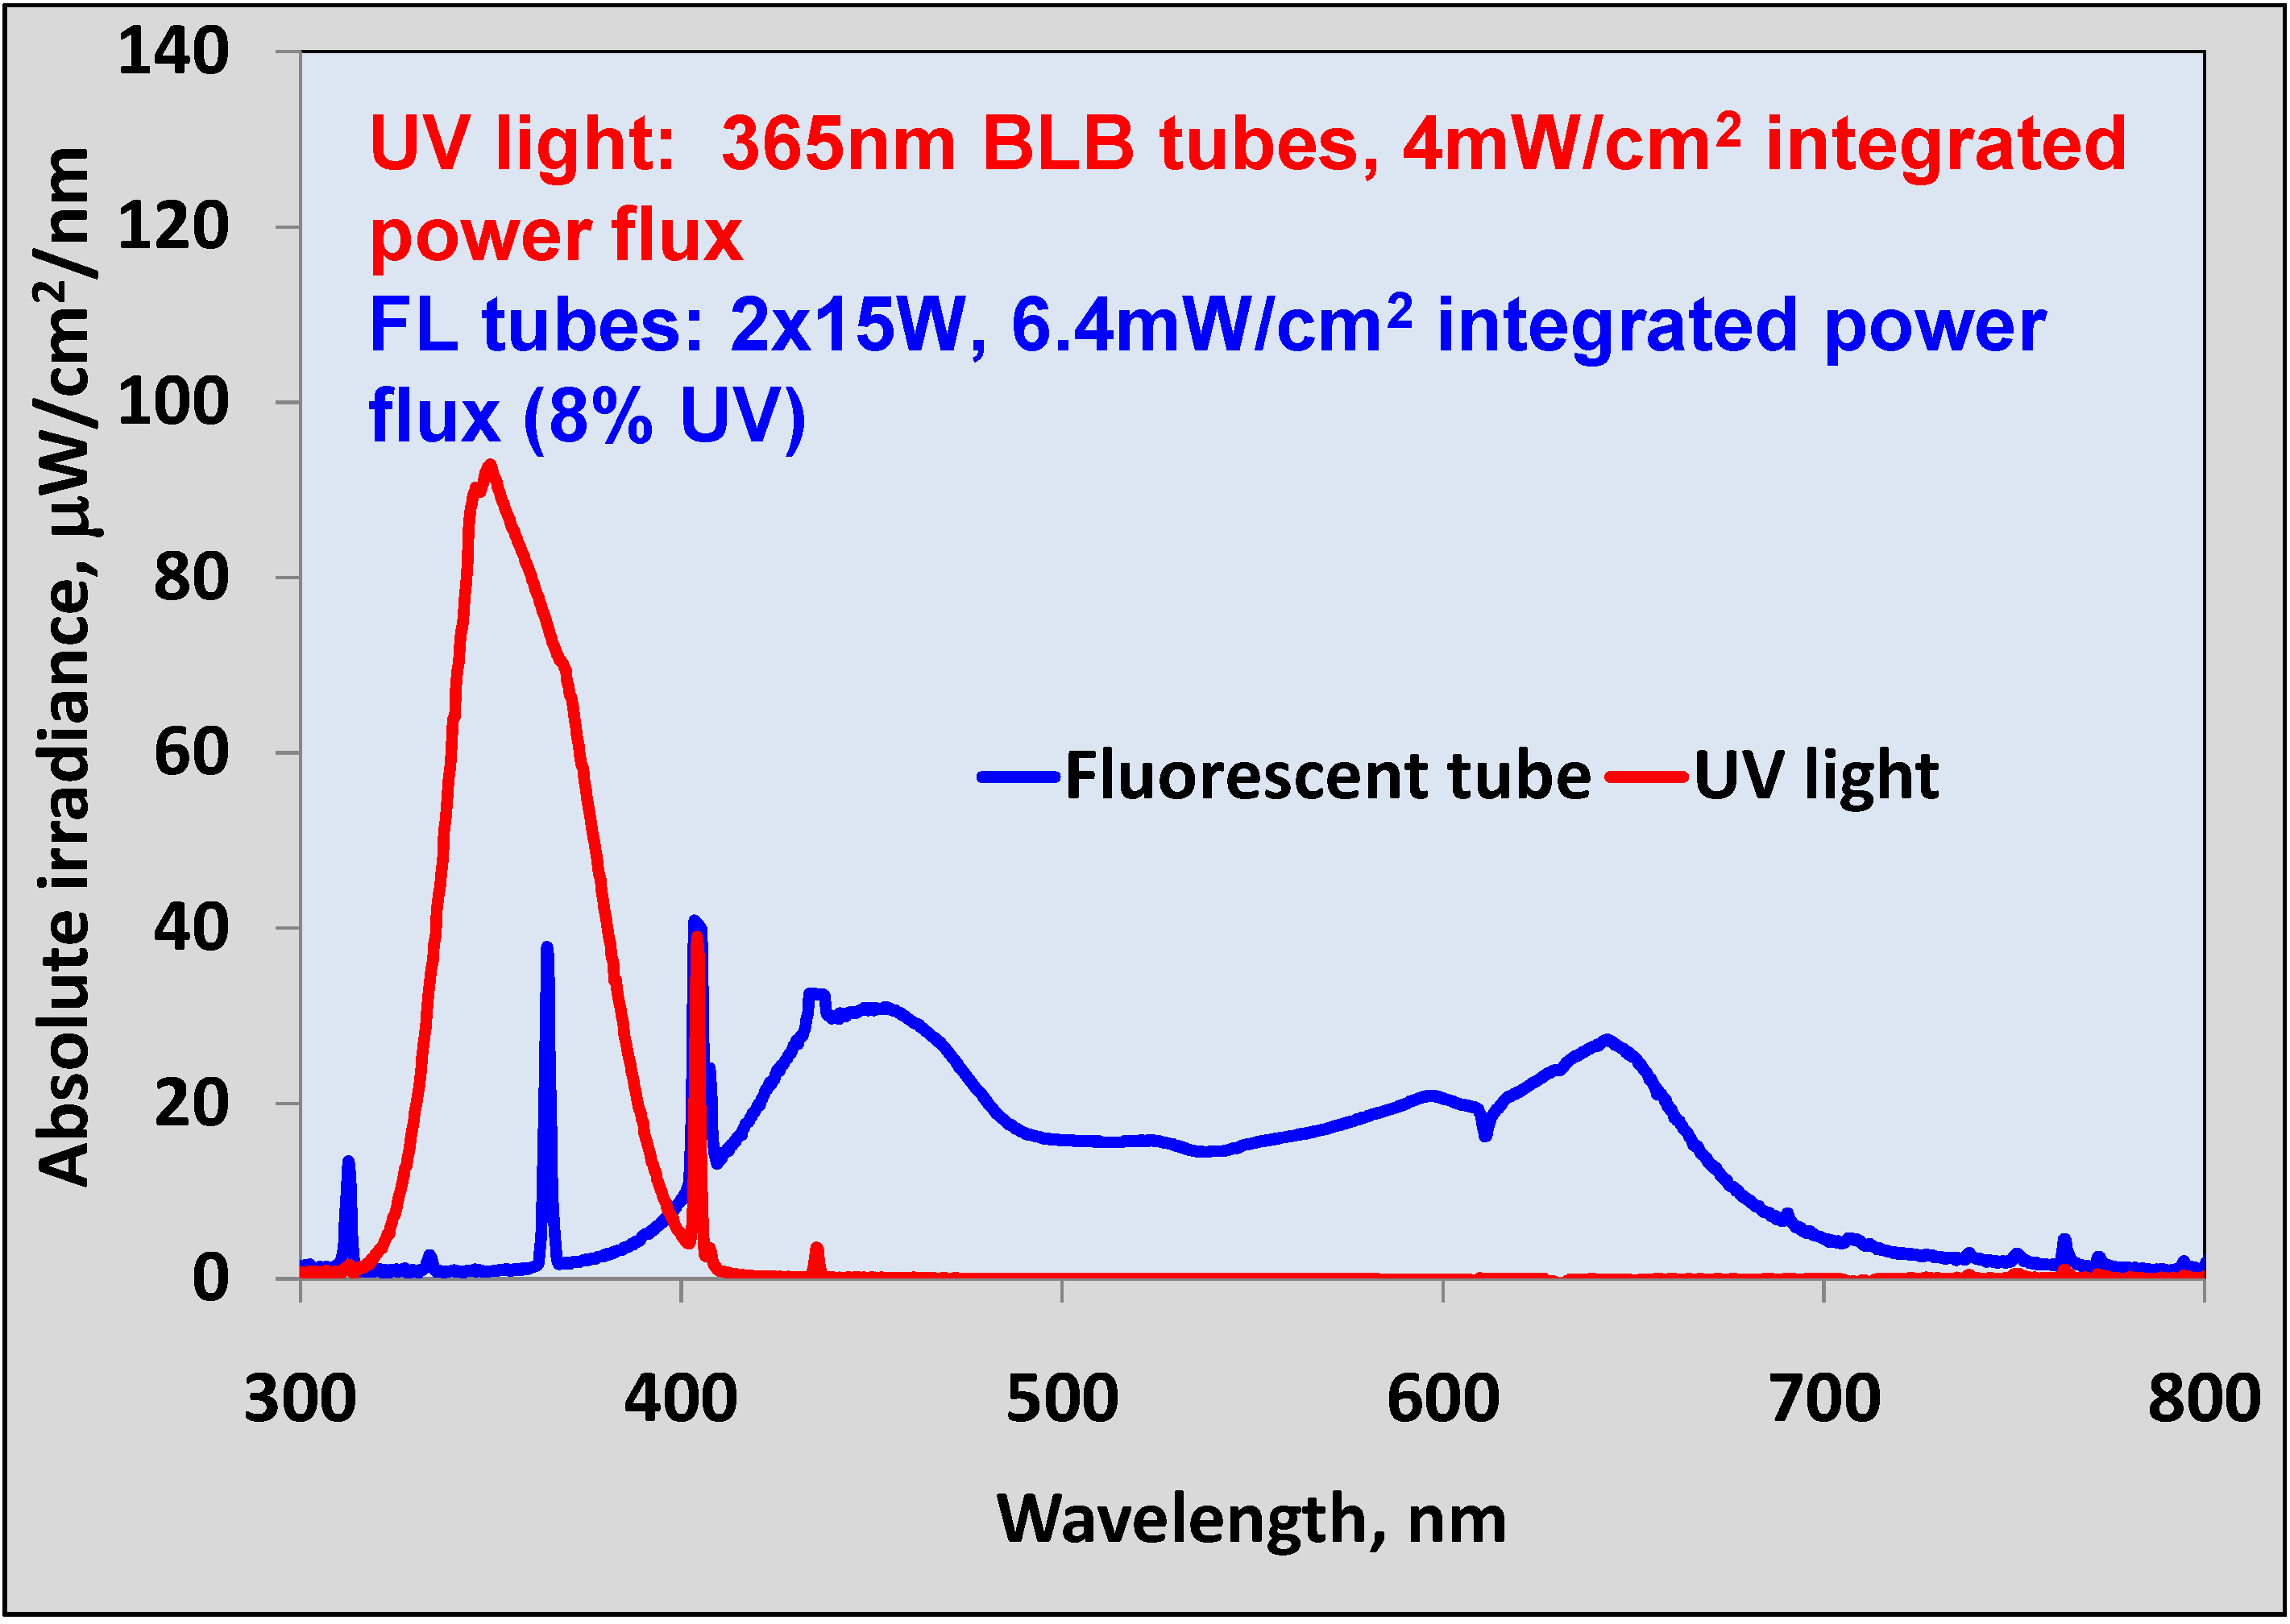
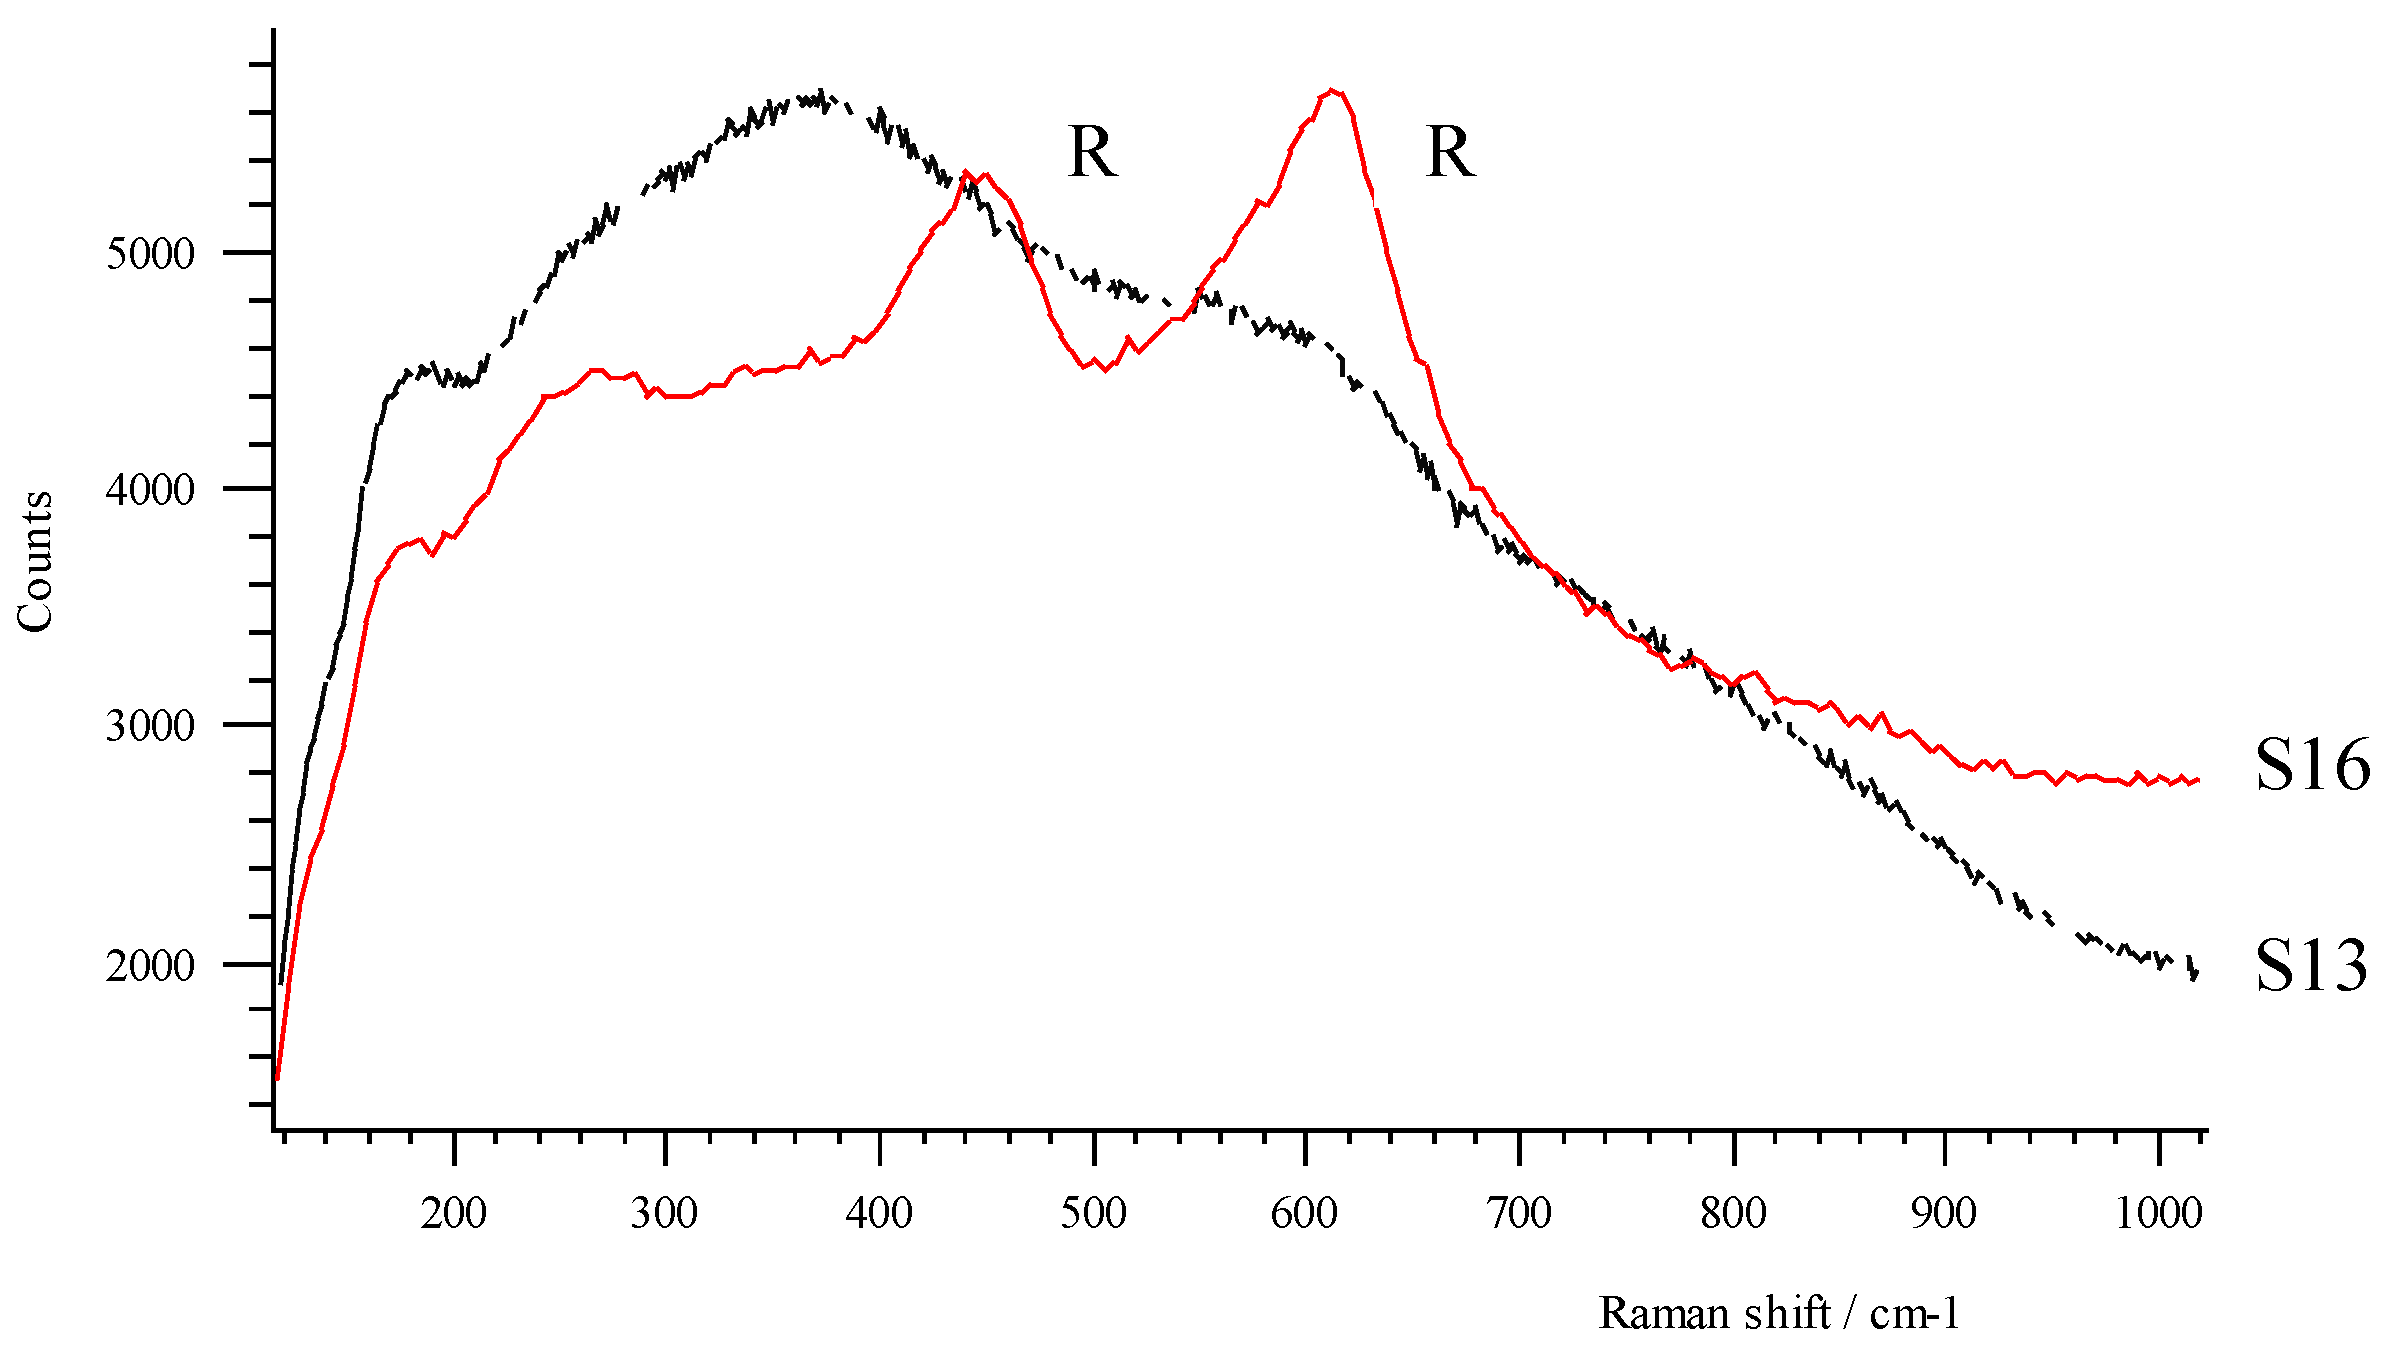
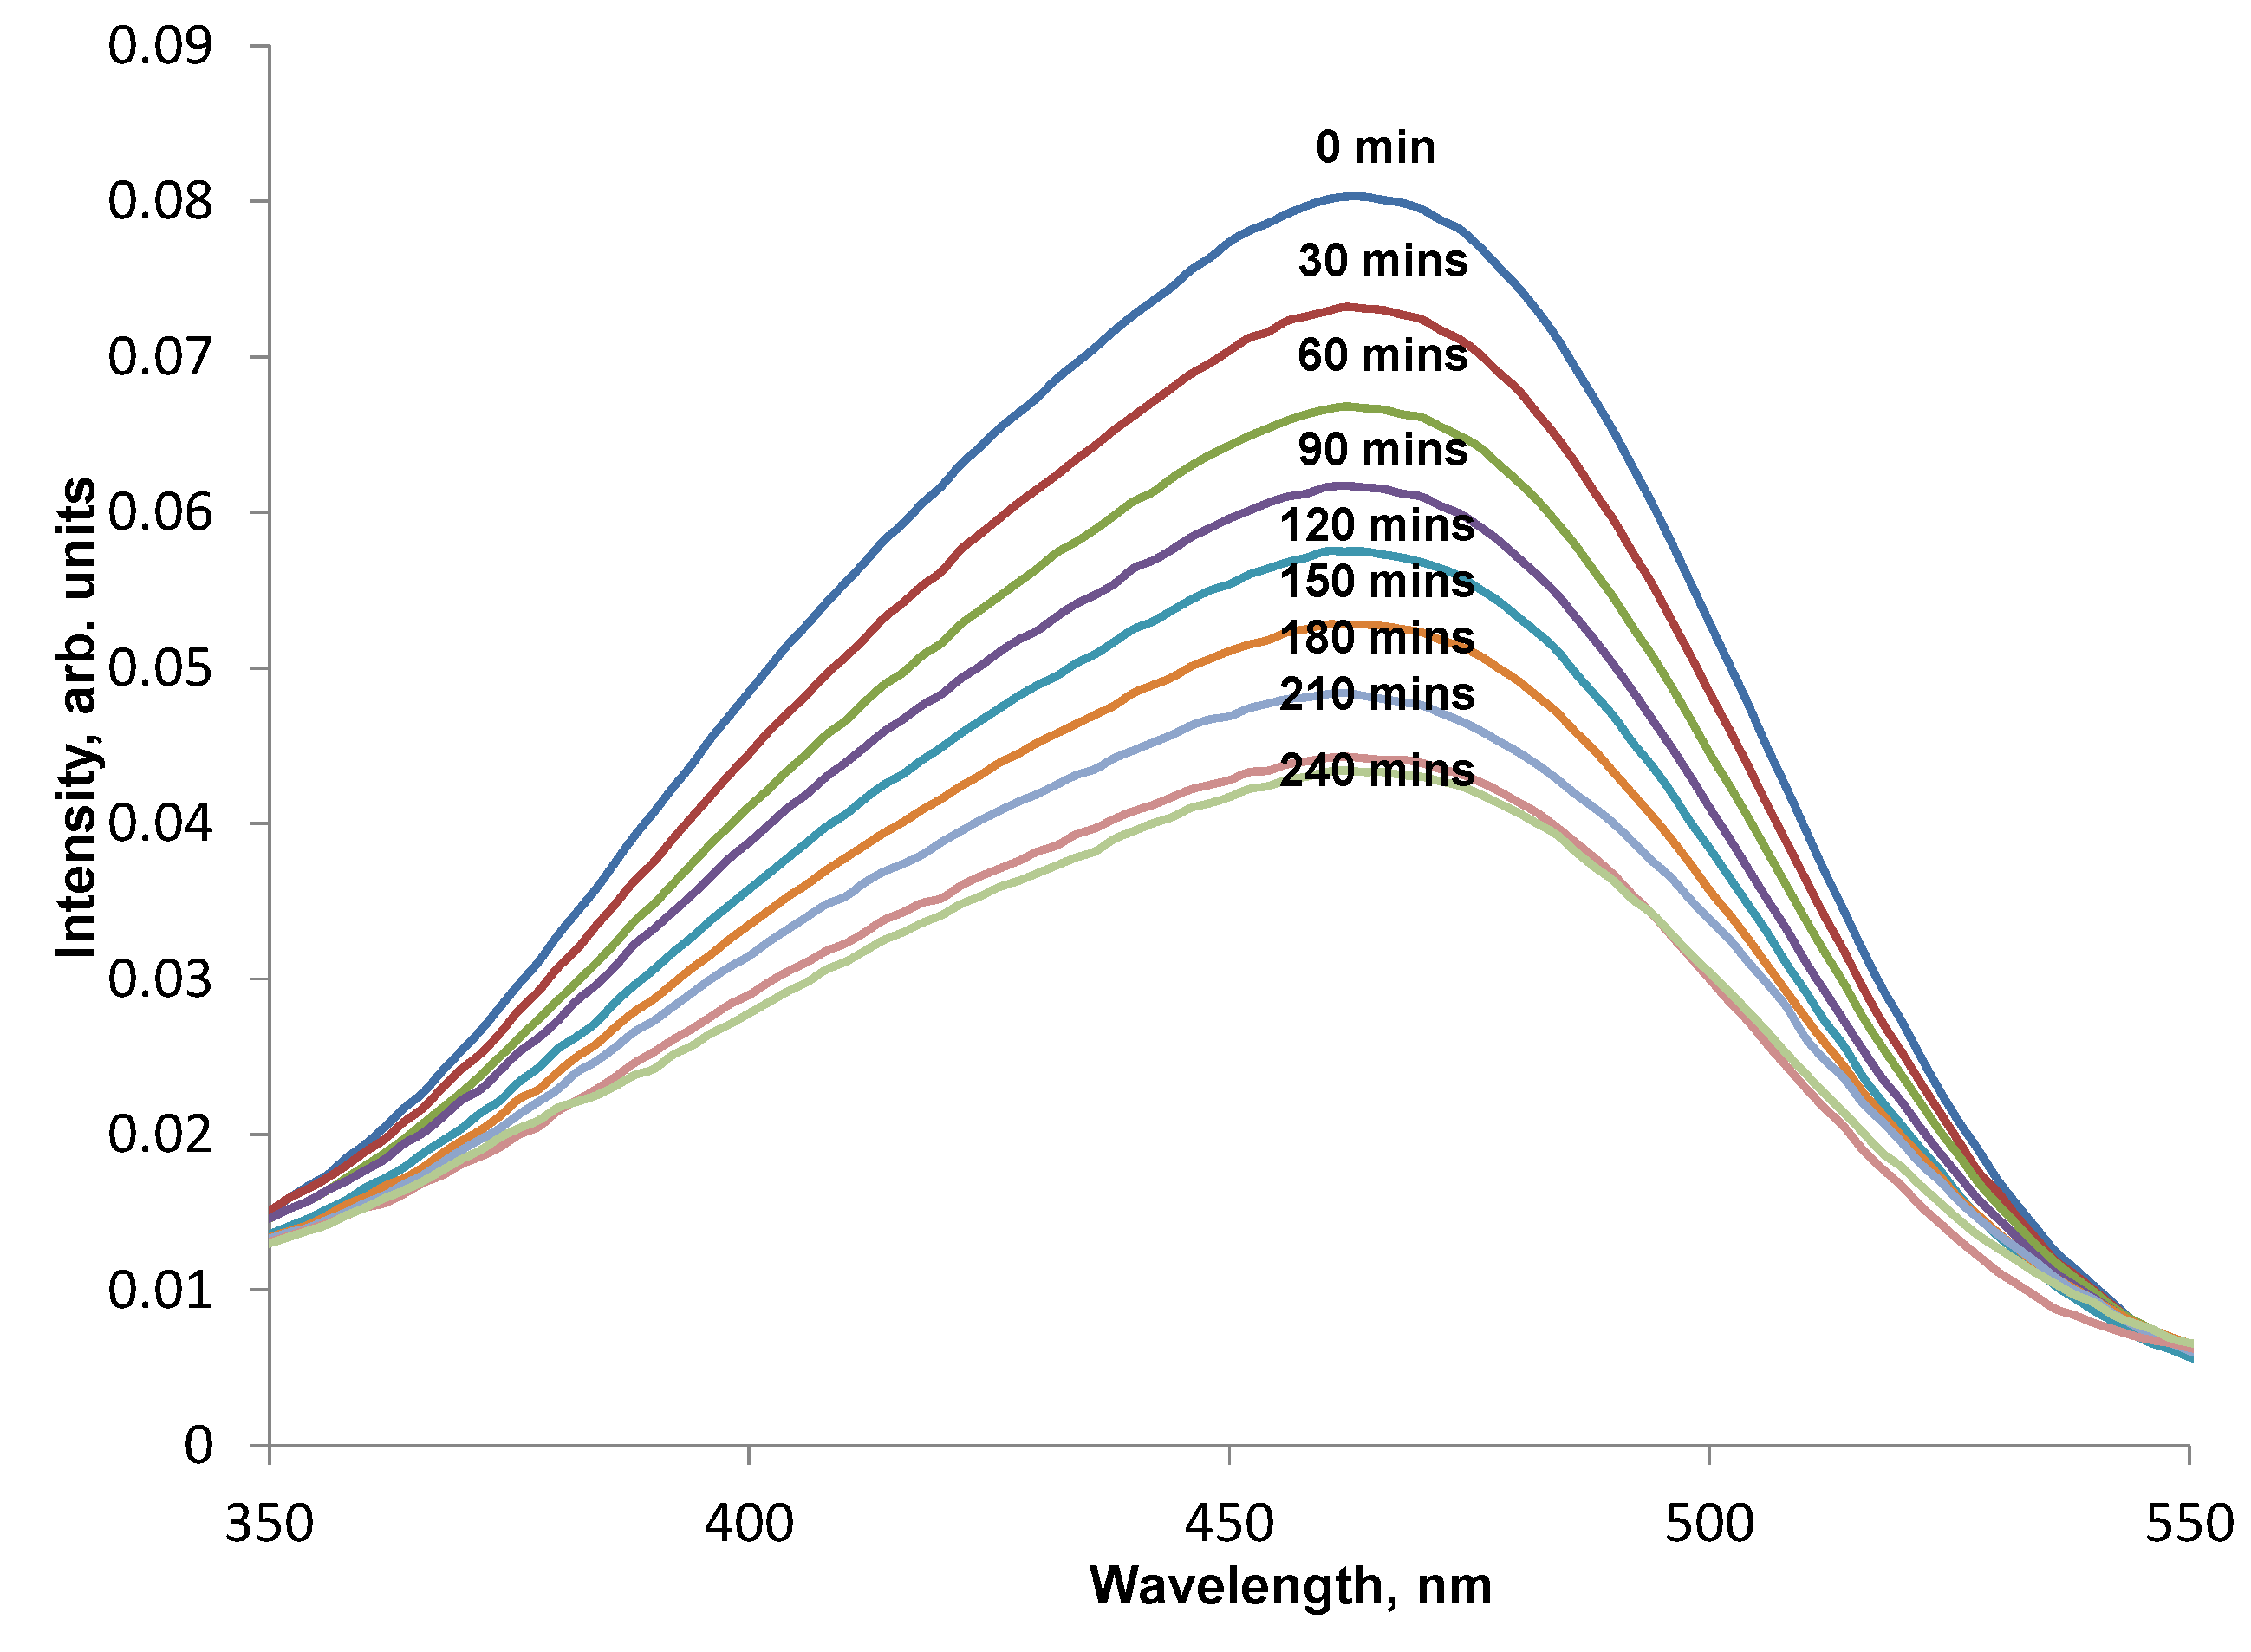
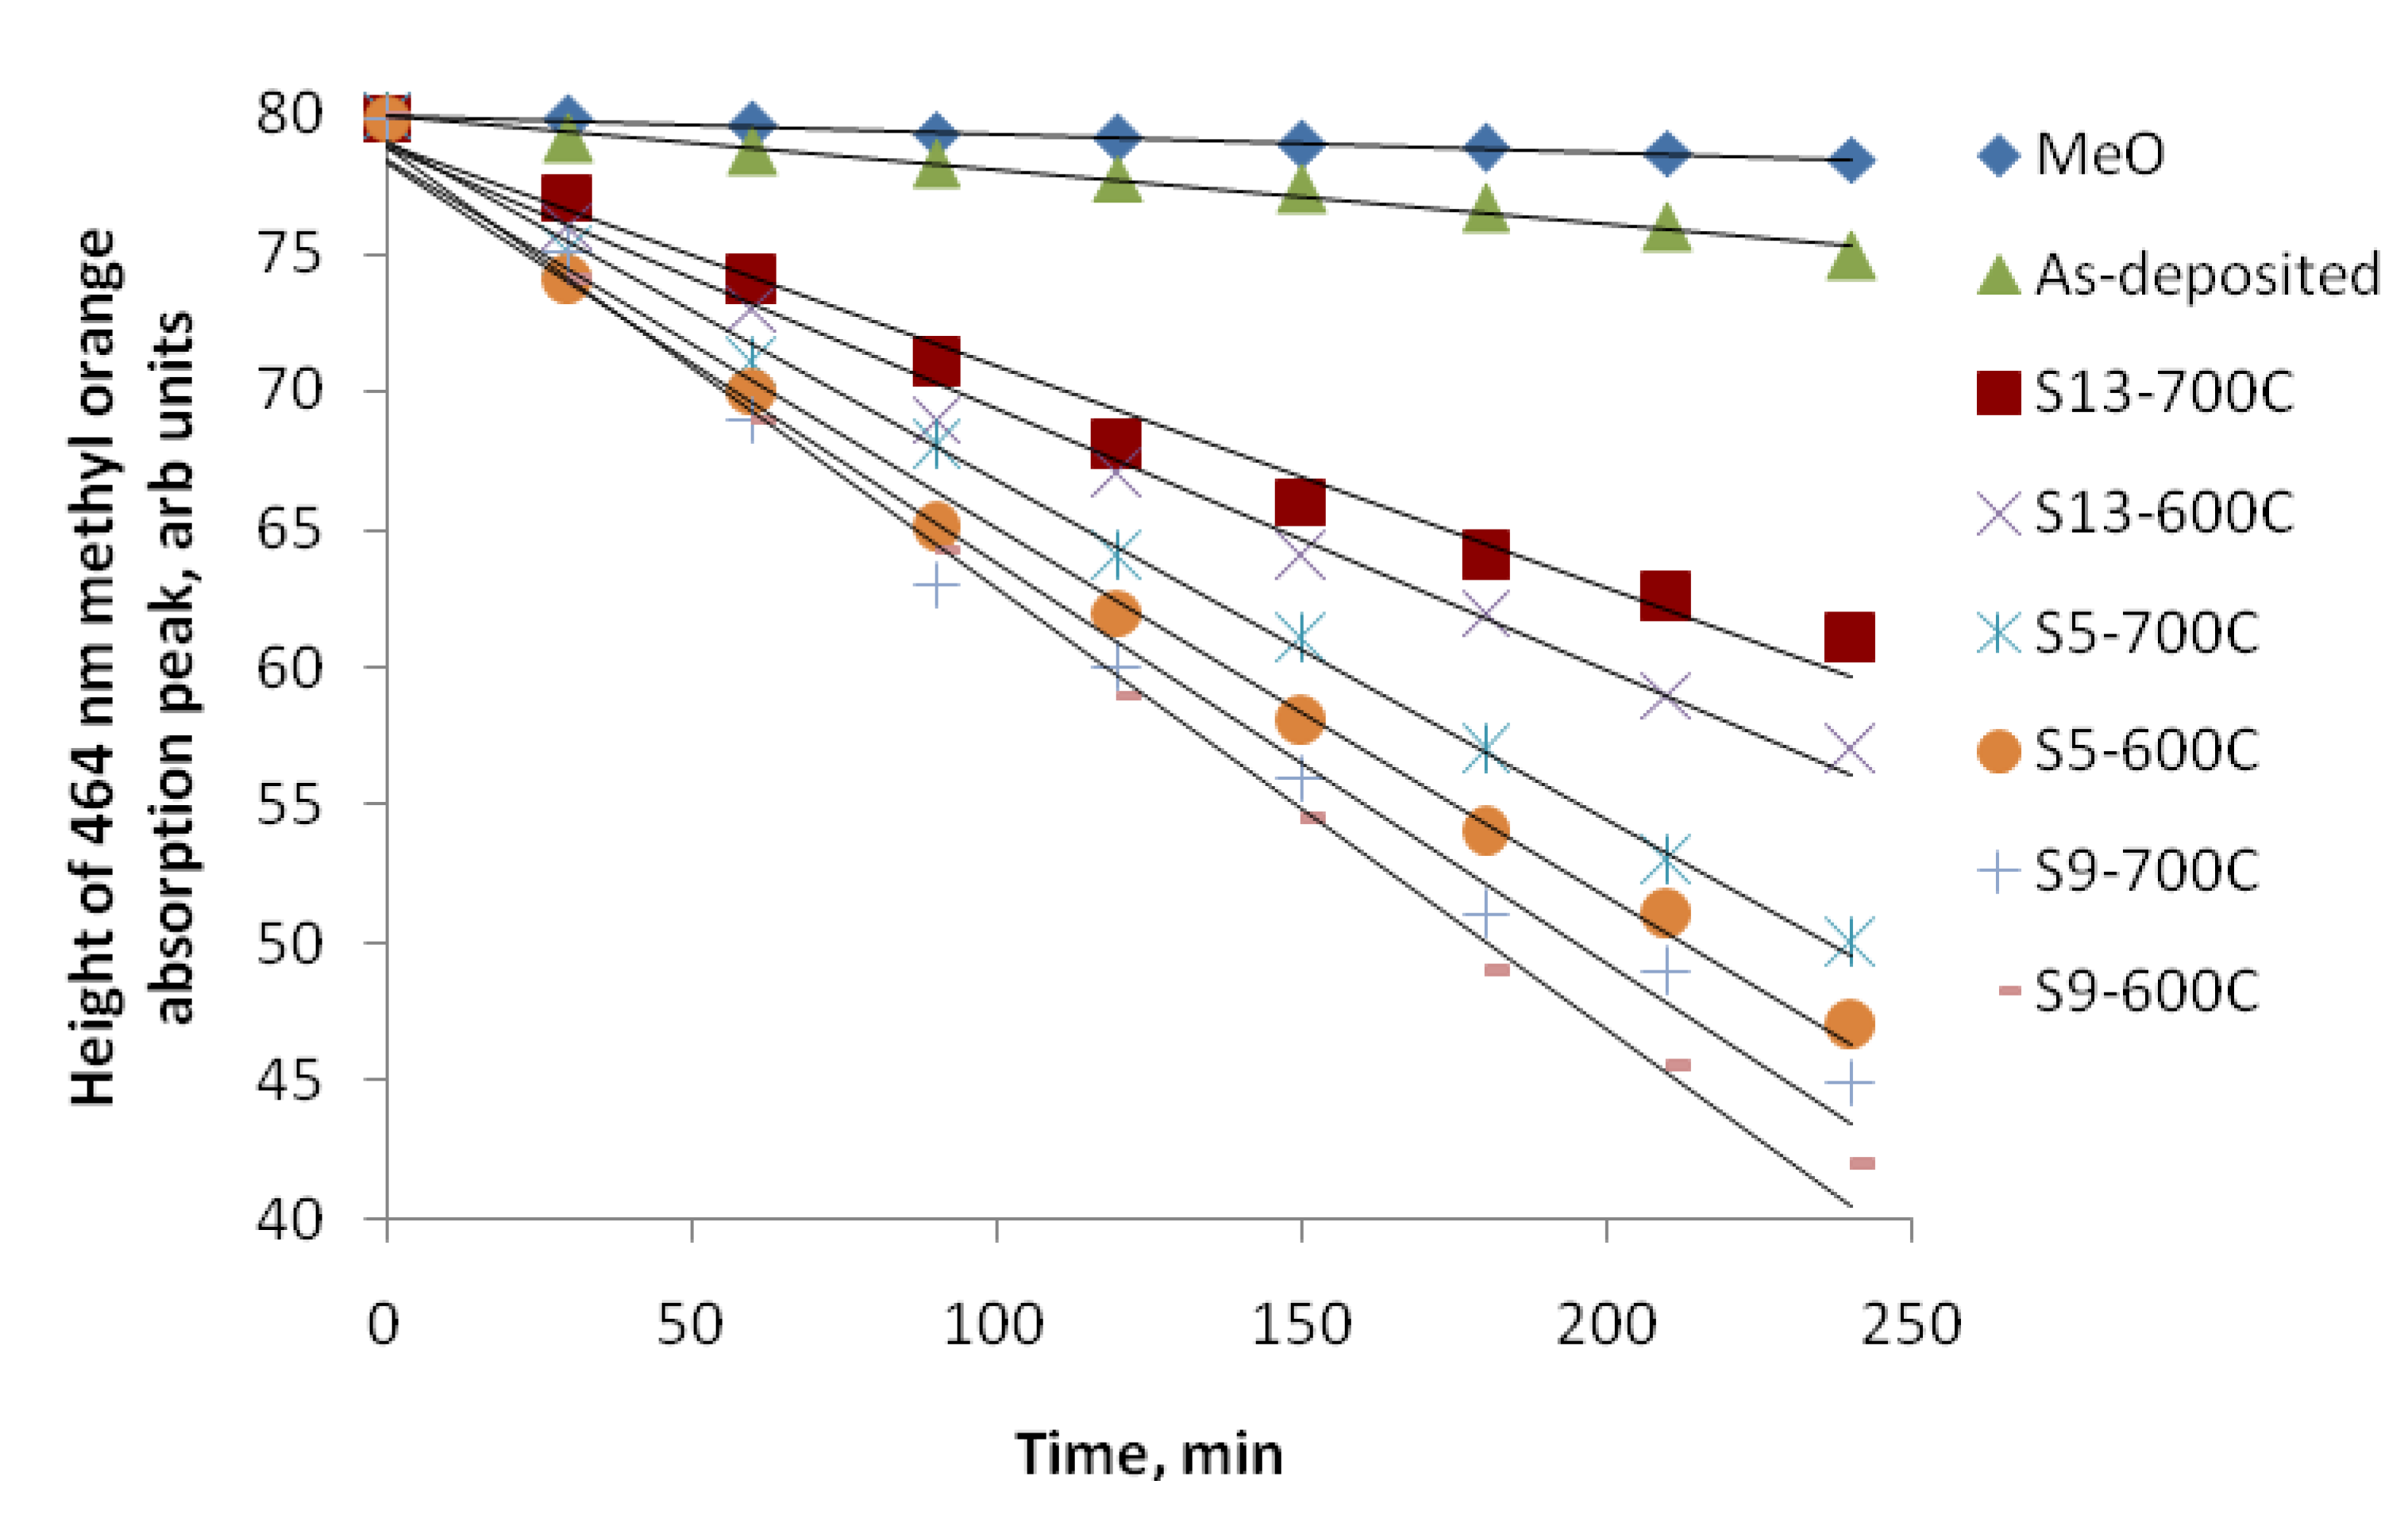
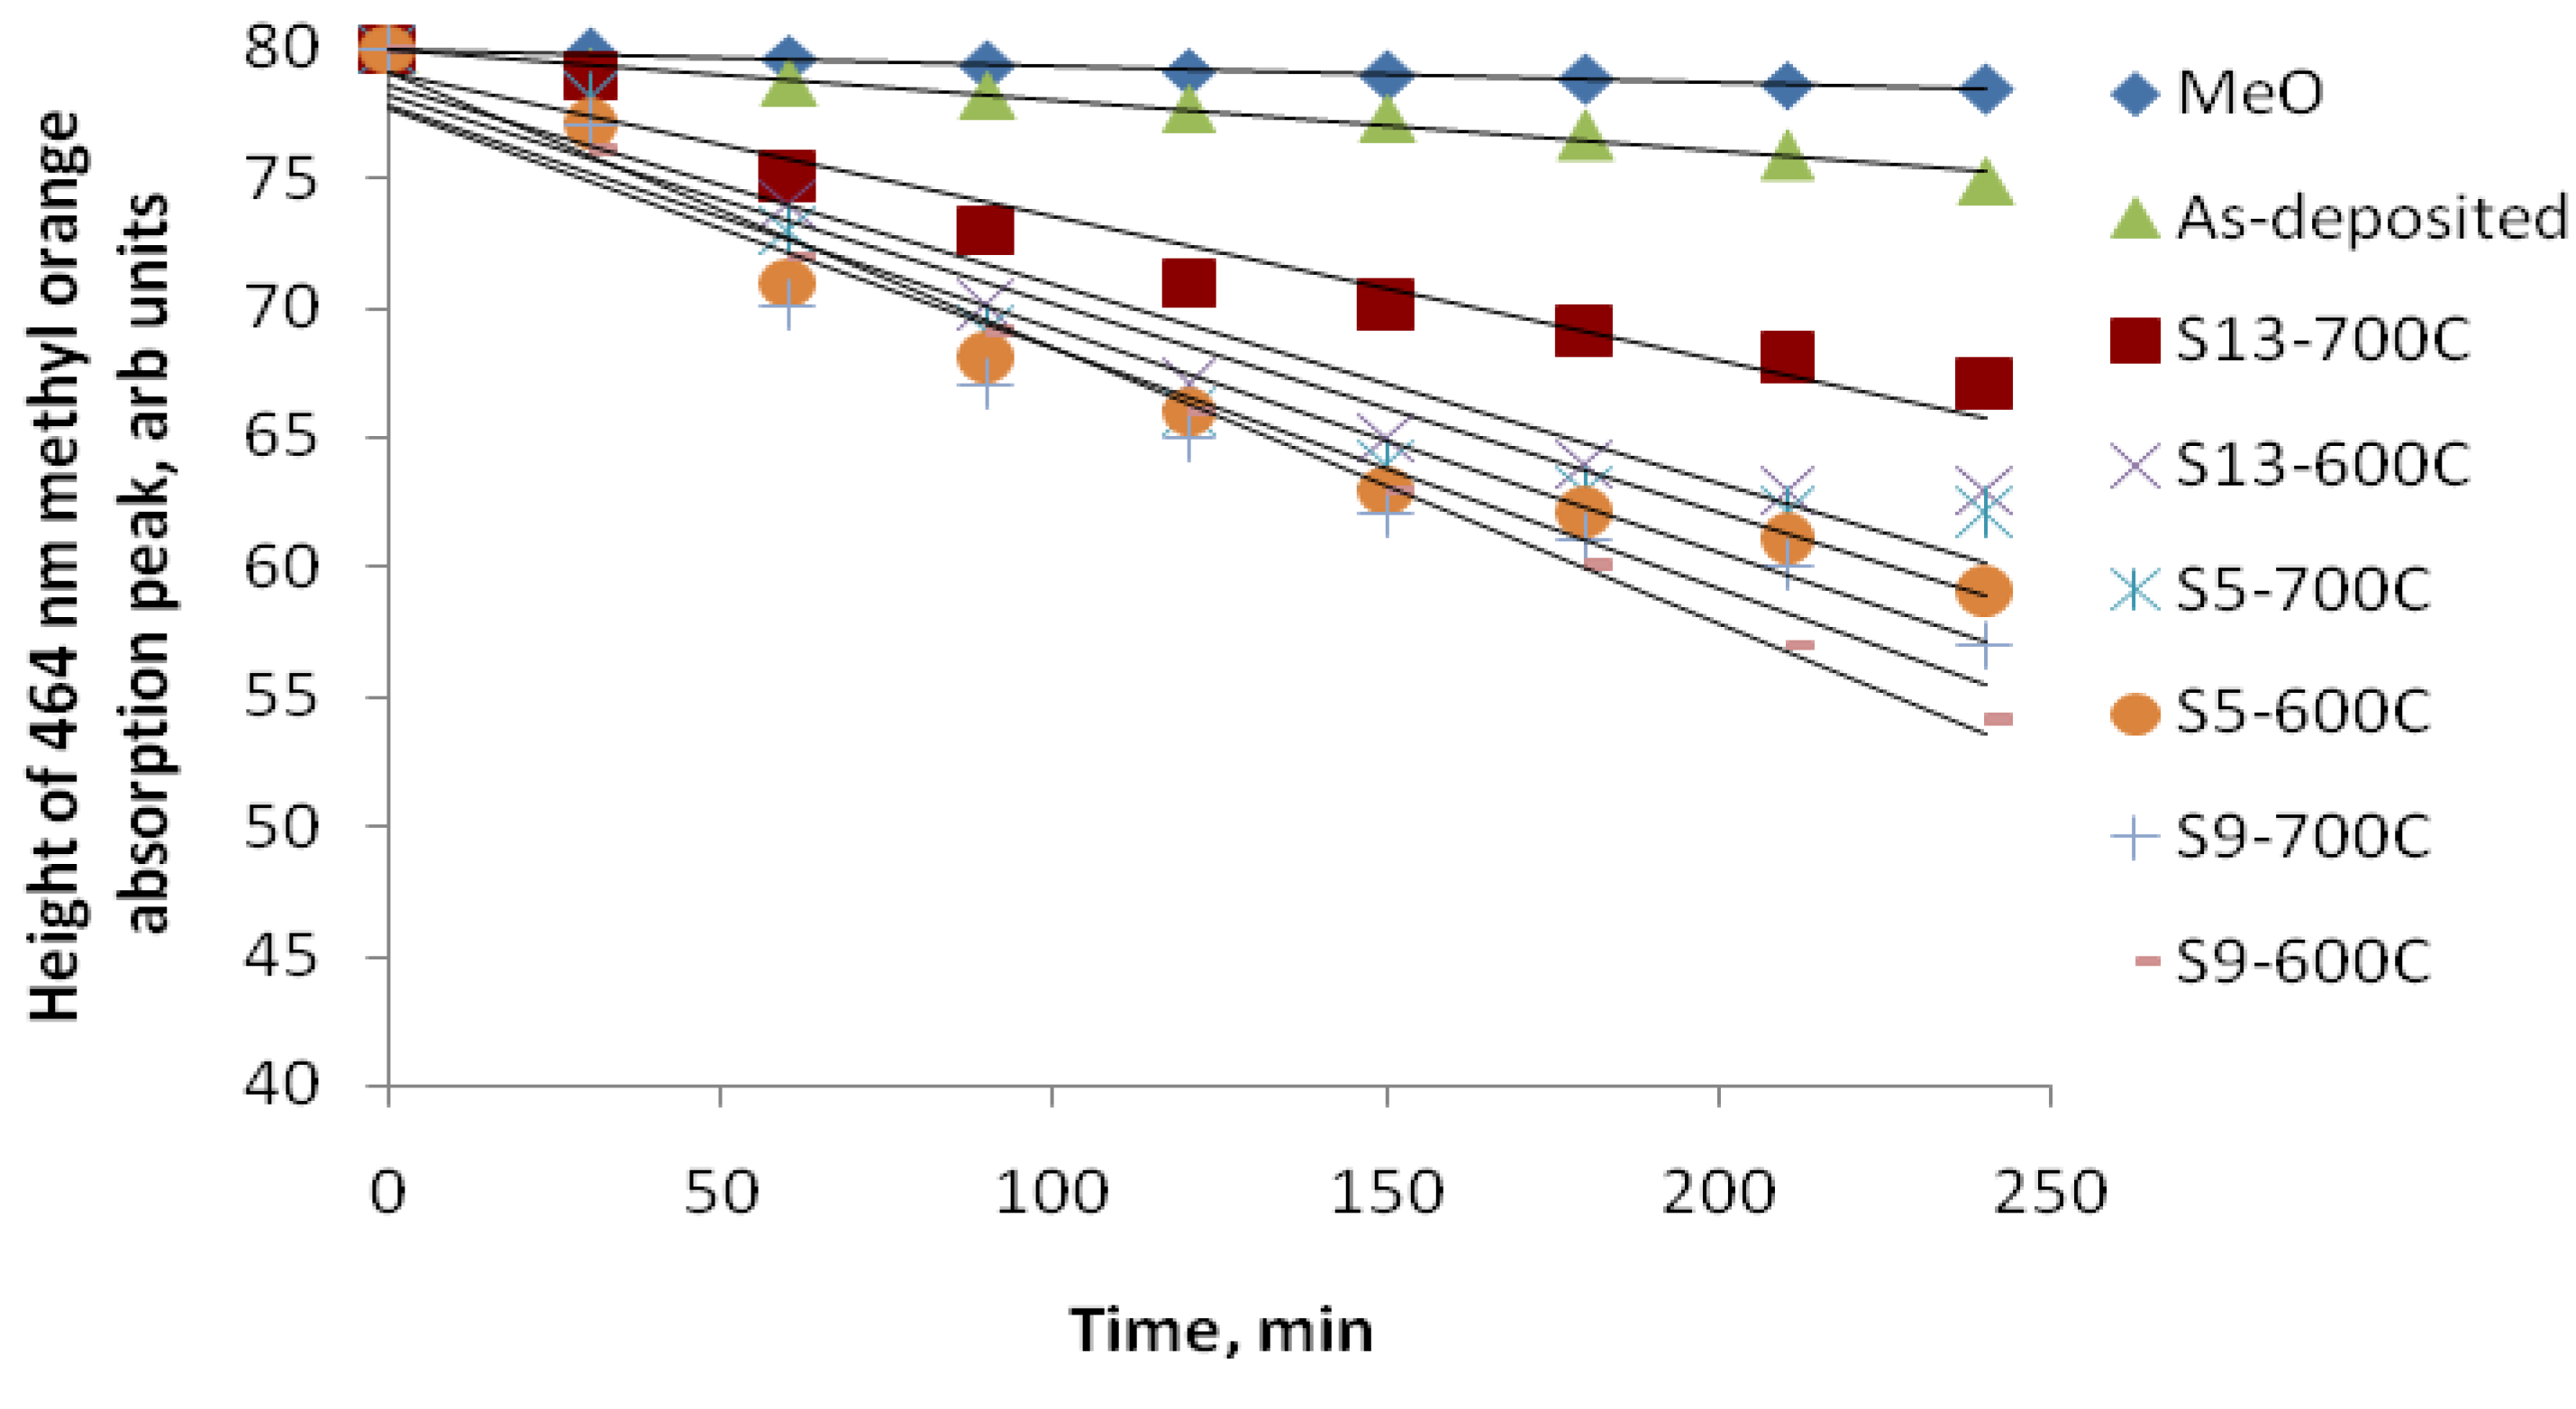
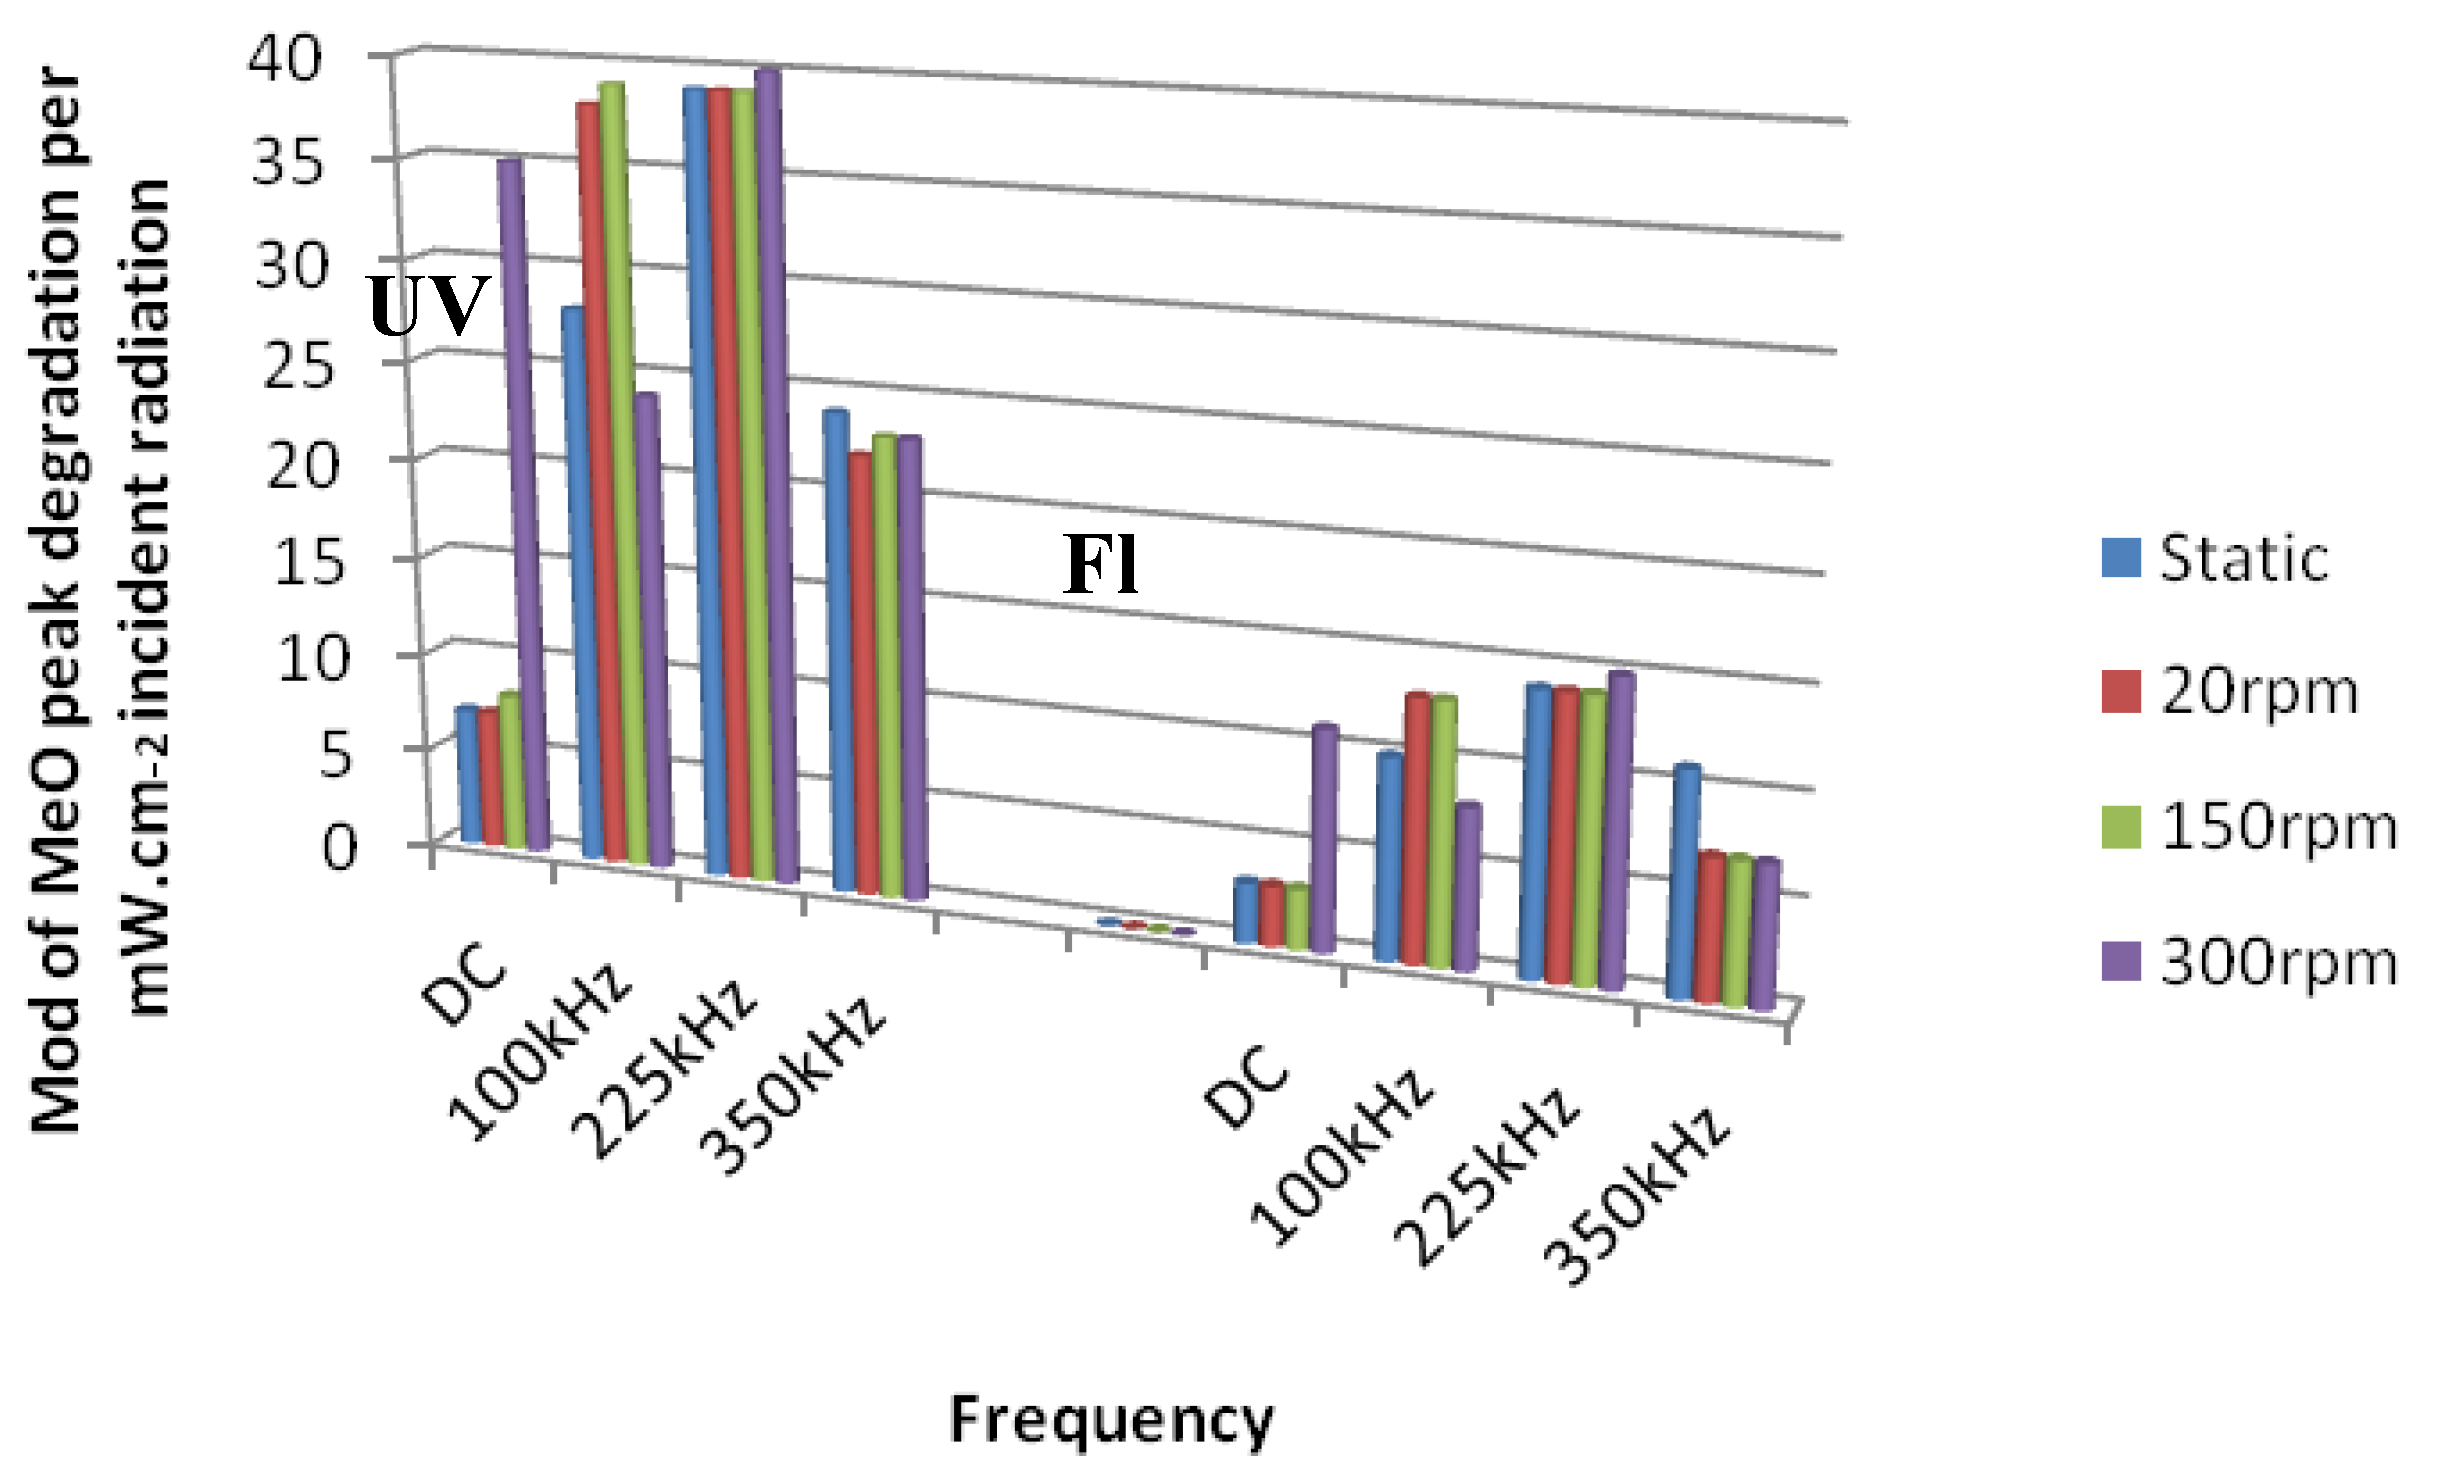
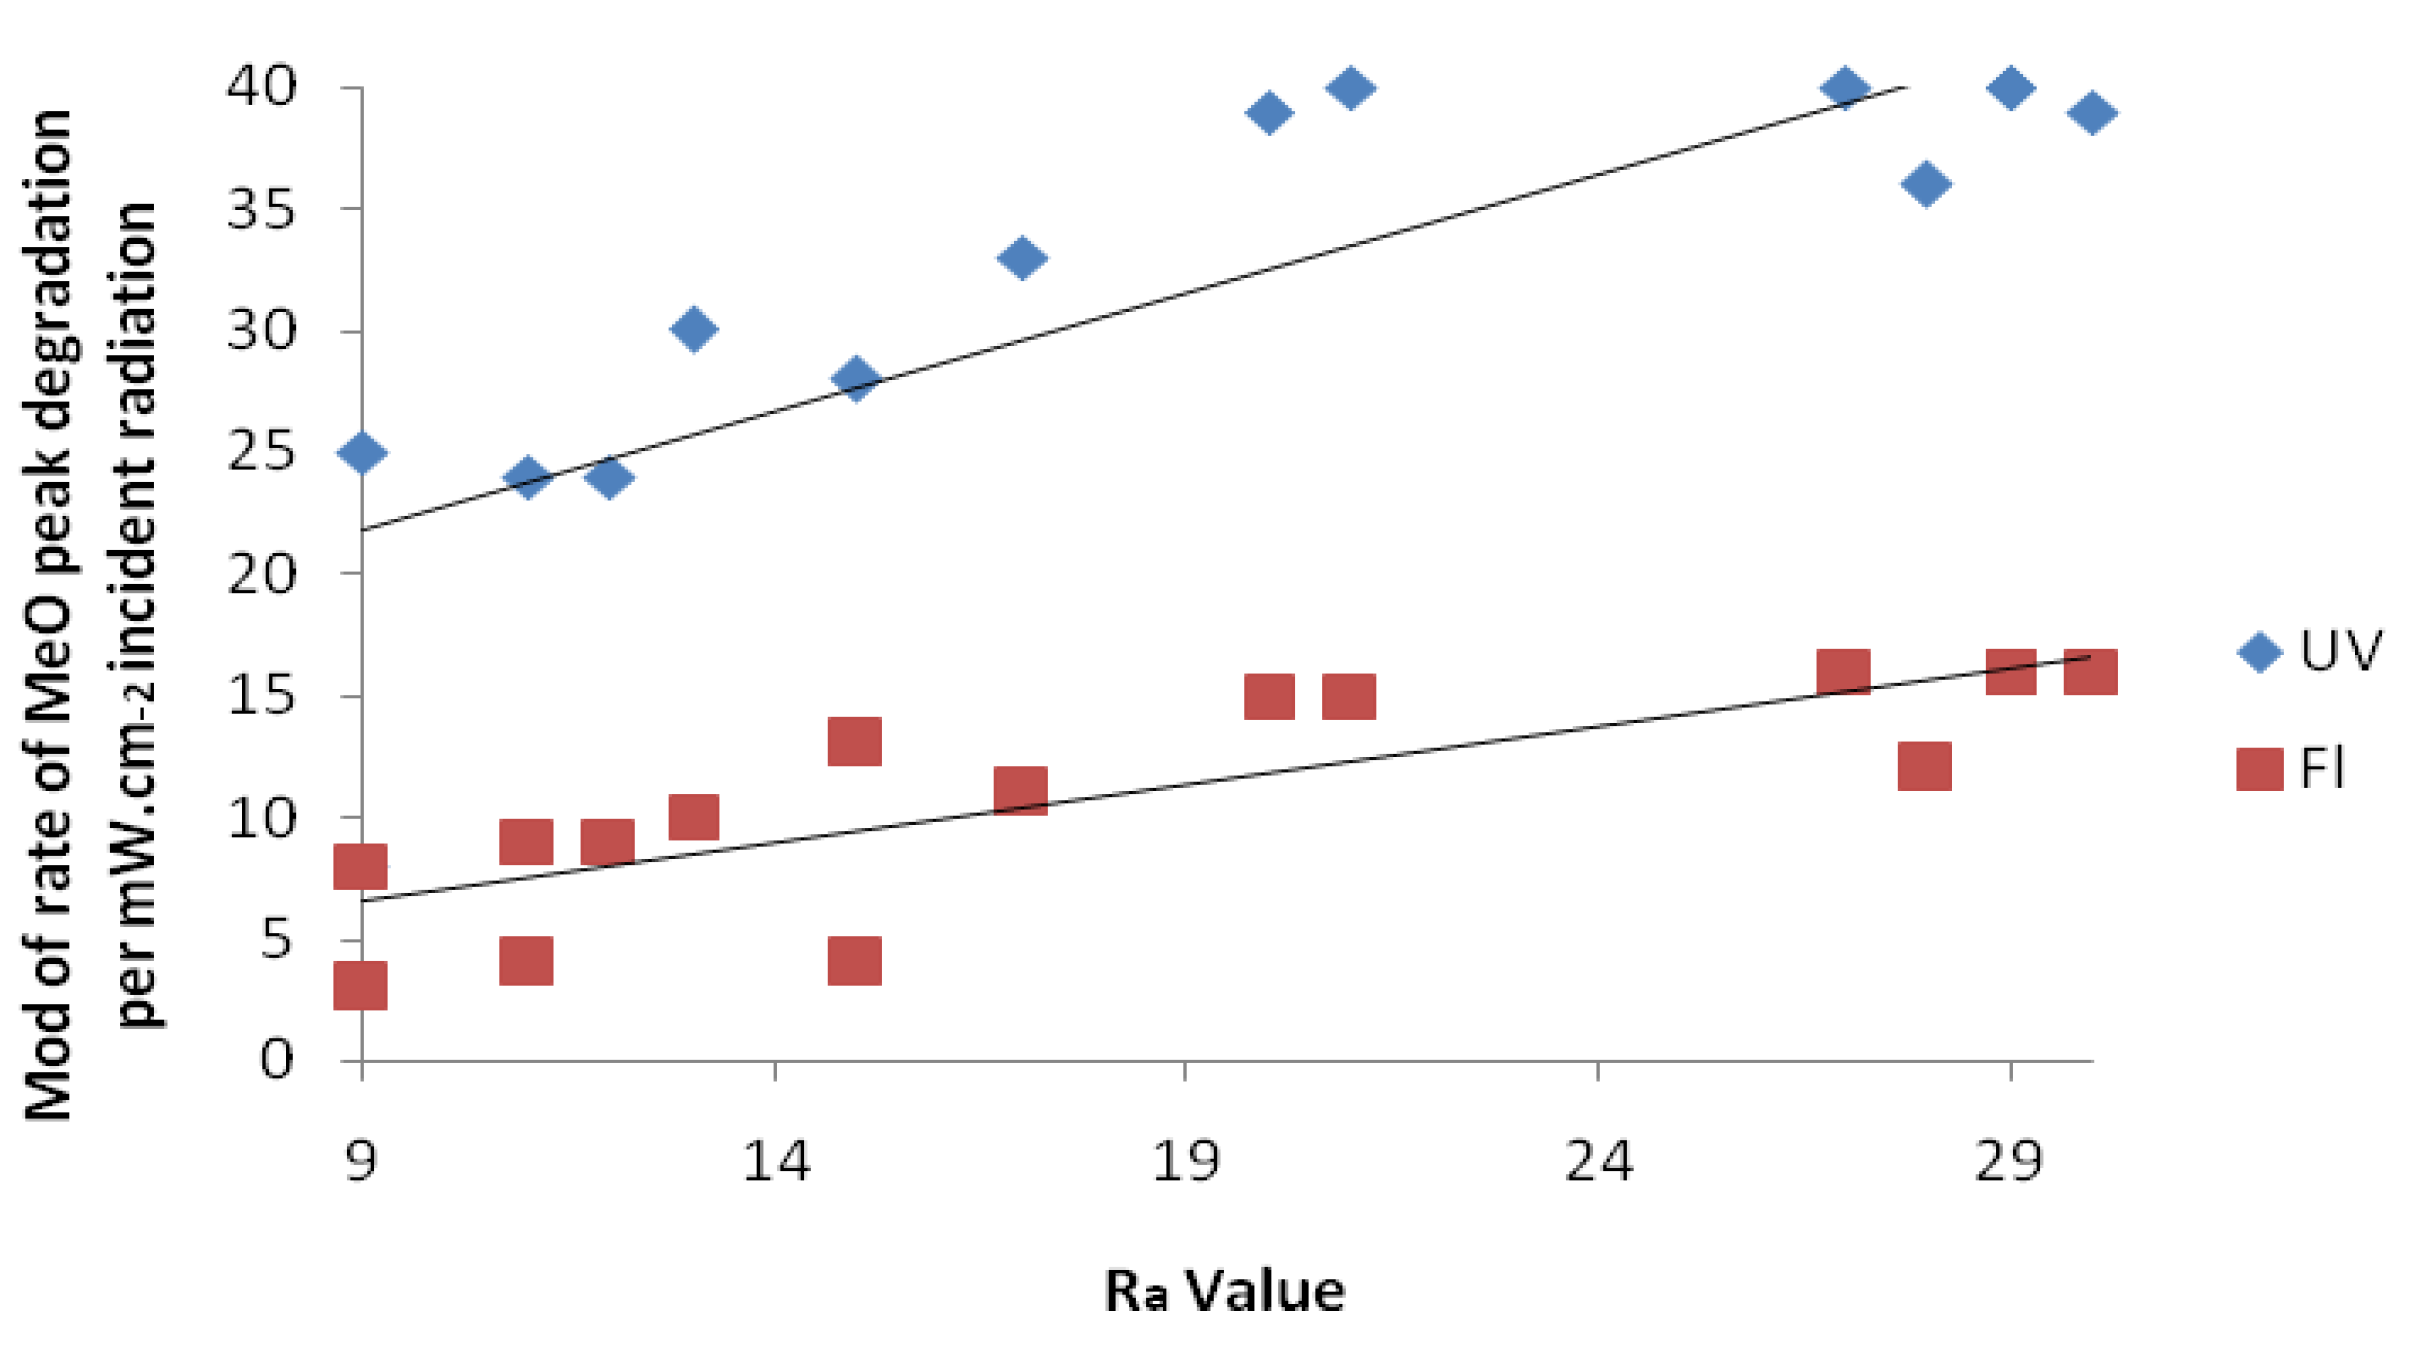
3.2. Assessment of Photocatalytic Activity

As mentioned above, in this study the photocatalytic activity was assessed in two ways. An initial scan of the samples was made using the photo-reduction reaction of resazurin dye. For the as-deposited coatings, the Rz showed no colour change after 40 min exposure to the UV lamps, indicating no discernible level of activity. In contrast, for the TiO2 coatings annealed at 600 °C and 700 °C, there was a rapid blue to pink colour change within 2–3 min of exposure to the UV lamps indicating a high photocatalytic activity for the samples. However, it was not possible to differentiate between activity levels for different samples from the Rz tests. In order to do this, methyl orange tests were also carried out. Prior to testing the coatings, a sample of MeO was exposed to both light sources to measure the natural rate of degradation of the dye without contact with a photocatalyst. In addition, an as-deposited titania coating was also tested to give a baseline for the level of activity of an amorphous sample. This sample showed little activity, however, the TiO2 coatings annealed at 600 or 700 °C showed significant decreases in the magnitude of the MeO 464 nm absorption peak. An example of the effect is shown in Figure 8 for sample S5, which had a predominantly anatase structure after annealing at this temperature. These data and those from other tests were re-plotted to show the height of the peak as a function of exposure time to allow the relative degradation rates of the dye to be assessed. Figure 9 and Figure 10, compare the results for coatings S5, S9 and S13 annealed at 600 °C and 700 °C with the amorphous titania sample and MeO without photocatalyst present (Figure 9 shows the results for exposure to UV lamps and Figure 10 shows the results for exposure to fluorescent lamps).
The data for the annealed coatings tested here show strong negative correlations of the form ‘y = −mx + c’; where the gradient, −m, gives the degradation rate of the methyl orange and c is the initial concentration of the dye, which was kept constant for all tests. Linear regression analysis was, therefore, used to obtain values for −m in each case, which can be used as a comparison of the photocatalytic activity of different coatings. These values are also included in Table 2. For convenience, modulus values of m (|m|) are given in the table, and the degradation rates of the 464 nm methyl orange absorption peak following exposure to 365 nm UV lamps and fluorescent (Fl) lamps will be referred to as |MeO|UV and |MeO|Fl, respectively. However, as the power flux to the samples varied for the different bulb types (4 mW/cm2 for UV and 6.4 mW/cm2 for the fluorescent tubes), these values have also been normalised to give the rate of decrease of peak height per milliwatt per cm2 of incident radiation. Normalised values of |m| are presented as a function of frequency, FFE oscillation speed and lamp type in Figure 11. This figure shows the results for the coatings annealed at 600 °C, as these were marginally more active than those annealed at 700 °C.
Figure 8. Photocatalytic degradation of 464 nm methyl orange absorption peak by titania sample S5 after annealing at 600 °C under exposure to 365 nm UV lamps at 4 mW/cm2.
Coatings 03 00177 g008
Figure 9. Degradation of 464 nm methyl orange (MeO) absorption peak as a function of exposure time to UV lamps for titania samples S5, S9 and S13, annealed at 600–700 °C, compared to an as-deposited coating and MeO without the presence of a photocatalyst. Linear regression analysis trendlines are also shown. Overall, the TiO2 coatings annealed at 600 °C showed the highest levels of activity in terms of the magnitude of the MeO 464 nm absorption peak as a function of exposure time to UV radiation. This may be related to the greater contribution of anatase phase in these samples.
Coatings 03 00177 g009
Figure 10. Degradation of 464 nm methyl orange absorption peak as a function of exposure time to fluorescent lamps for titania samples S5, S9 and S13, annealed at 600–700 °C, compared to an as-deposited coating and MeO without the presence of a photocatalyst. Linear regression analysis trendlines are also shown. The TiO2 coatings annealed at 600 °C showed the highest levels of activity in terms of the magnitude of the MeO 464 nm absorption peak as a function of exposure time to fluorescent lamps.
Coatings 03 00177 g010
Table 2. Modulus values of degradation rates of 464 nm methyl orange (MeO) absorption peak following exposure of annealed titania samples to 365 nm UV lamps and fluorescent (Fl) lamps solution.
Sample NoPredominant Structure at 600 °CMeO gradient, UVNormalised MeO UV rate, arbitrary units(min/mW·cm−2)MeO gradient, FlNormalised MeO Fl rate, arbitrary units(min/mW·cm−2)
S1RU0.0300.0080.0200.003
S2RU0.0320.0080.0220.004
S3RU0.0350.0090.0250.004
S4AN0.1420.0360.0730.012
S5AN0.1310.0330.0670.011
S6AN0.1560.0390.0890.015
S7AN0.1580.0400.0900.015
S8AN/RU0.1210.0300.0580.010
S9AN0.1580.0400.0960.016
S10AN/RU0.1590.0400.0960.016
S11AN/RU0.1600.0400.0960.016
S12AN/RU0.1570.0390.0940.016
S13RU/AN0.1100.0280.0750.013
S14RU0.0990.0250.0490.008
S15RU0.0970.0240.0510.009
S16RU0.0950.0240.0510.009
Figure 11. Comparison of methyl orange degradation rates by titania coatings annealed at 600°C listed in Table 2 as a function of frequency, FFE oscillation speed and lamp type (*1000 ). The plot on the left represents the results for exposure to UV lamps and the plot on the right indicates the results for exposure to fluorescent lamps. Overall, the best activity levels under both UV and fluorescent light sources were obtained for the coatings deposited at pulse frequencies of 225 kHz at an FFE speed of 300 rpm and then annealed at 600°C. However, operating at frequencies of 100–225 kHz at all given FFE oscillation speeds led to the production of layers which were similarly effective at degrading organic dyes, such as methyl orange, under the influence of UV and fluorescent light sources.
Coatings 03 00177 g011

4. Discussion

In the present work, titania films were deposited by DC and pulsed DC reactive magnetron sputtering using a full face erosion magnetron. This study indicated how the structures that form are dependent on both the deposition conditions (pulse frequency and FFE oscillation speed) and the post deposition annealing temperature. Deposited coatings that predominantly contained the anatase phase showed a dense structure and smooth surface with numerous random defects, whereas the surface features appeared somewhat rougher, but more regular in coatings that predominantly contained the rutile structure. It is interesting to note, however, that in this set of experiments, Ra values for coatings which formed anatase structures were greater than those which formed the rutile phase. As an example, this effect can be seen in samples S4, S7 and S10 (all with anatase structures) produced at DC, 100 and 225 kHz with Ra values of 28, 21 and 29 nm, respectively. These results can be compared to those which formed rutile structures, such as S1 and S14 produced at DC and 350 kHz with Ra values of 9 nm each (See Table 1).
Regarding the photocatalytic activity of the annealed samples, the resazurin test initially provided a quick indication of whether the surfaces were active or not, but was not capable in these tests of differentiating between different levels of activity. Photocatalytic activity of the coatings annealed at 400 to 700 °C was, therefore, quantified by the methyl orange test. The TiO2 coatings annealed at 600 °C showed the highest levels of activity in terms of the degradation of the MeO 464 nm absorption peak as a function of exposure time to UV radiation. This may be related to the greater contribution of anatase in these samples. It is interesting to note that reasonable levels of activity were also observed for the coatings exposed to the fluorescent tubes. The normalised level of activity for these coatings were around 35%–45%, in some cases, of those recorded for the samples exposed to the 365 nm UV tubes. However, only 8% of the power flux from the fluorescent tubes is in the range 300–400 nm, which implies that the coatings may display some level of activity in the visible range (although a UV filter would be needed to confirm this). This may be a result of the mixed anatase/rutile structures, but it has important implications for possible applications in situations where surfaces are illuminated by artificial lighting.
It is also apparent from the results presented here that photocatalytic activity is also dependent on surface roughness [45]. Indeed, there is a clear correlation between Ra value and photocatalytic activity, as can be seen in Figure 12. This might be expected, as an increase in Ra value implies an increase in the surface area of the coating in contact with the MeO solution. From Table 1 it can also be noted that the Ra value, in turn, is weakly dependant on the thickness of the films (i.e., deposition rate).
Figure 12. Comparison of methyl orange degradation rates as a function of Ra values (nm) and exposure time to UV and fluorescent lamps (*1000) for coatings annealed at 600°C listed in Table 1. It can be seen that there is a clear correlation between Ra value and photocatalytic activity.
Coatings 03 00177 g012
Considering Figure 11, it appears that pulse frequency is the most significant factor in determining crystalline structure and, therefore, photocatalytic activity level after these coatings had been annealed. FFE oscillation speed had a marginal, secondary effect, on activity levels. Overall, the best activity levels under both UV and fluorescent light sources were obtained for the coatings deposited at pulse frequencies of 225 kHz at an FFE speed of 300 rpm and then annealed at 600 °C. However, operating at frequencies of 100–225 kHz at all given FFE oscillation speeds led to the production of layers which were similarly effective at degrading methyl orange, under the influence of UV and fluorescent light sources.
Considering the various structures that formed after the annealing of these films, it is then possible to distinguish an optimum area for the formation of anatase coatings with highest level of activity, which is shown in Figure 13. This clarifies, in the form of a zone diagram, the relationship between pulse frequency, FFE oscillation speed and the resultant titania structures that formed after being annealed at 600 °C. It can be seen that by manipulating pulse frequency and FFE oscillation speed, titania coatings of all structures (amorphous, anatase, rutile and mixed phase) can be achieved.
The well-known Löbl model [46] showed the relationship between the energy of particles impinging on the substrate, substrate temperature and the phases of PVD titania coatings. Figure 13 can be described as an alternative model that complies with that of Löbl, in which new influential factors in pulse magnetron sputtering have been considered. Figure 13 shows that in the range of 100–225 kHz (50% duty) with FFE oscillation speed of 0–150 rpm the formation of anatase is preferred. In contrast; operating at higher FFE oscillation speed led to an apparent increase in the contribution of rutile phase in the deposited films and this contribution was even higher for coatings produced at 350 kHz. The underlying mechanisms behind the observed structural changes will be the subject of future papers.
Figure 13. Zone diagram showing relationship between coating structure, frequency, and the FFE oscillation speed of titania coatings at annealing temperature of 600 °C. An optimum area for the formation of anatase coatings with high, mid and low level of activity has been highlighted in red, green and yellow colours, respectively. Considering the various structures that formed after the annealing of these coatings, it is then possible to distinguish an optimum area for the formation of anatase coatings with highest level of activity, which is shown in this figure.
Coatings 03 00177 g013

5. Conclusions

The present study demonstrated that the pulsed magnetron sputtering technique using a Full Face Erosion (FFE) magnetron produces coatings of uniform thickness at reasonable deposition rates. It was also found that the structures of the coatings are strongly dependent on both the deposition conditions (pulse frequency and FFE oscillation speed) and the post deposition annealing temperature. In the latter case, for many samples significant structural transitions occurred over the range of approximately 600–700 °C. After annealing at 600 °C samples with predominantly anatase structures were produced in which the contribution of the rutile phase can become more dominant by further increasing the annealing temperature. Furthermore, it was found that for the TiO2 coatings annealed at 600 °C or 700 °C, significant levels of photo-activity were observed under exposure to UV light. Also, the normalised level of activity for the coatings exposed to the fluorescent light source was around 35%–45%, of those samples exposed to the 365 nm UV tubes. Finally, it was demonstrated that the optimum frequency and duty to produce layers with high crystallinity in the anatase phase was in the range of 100–225 kHz (50% duty) at all given FFE oscillation speeds.

Conflicts of Interest

The authors declare no conflict of interest.

References

  1. Gloss, D.; Frach, P.; Zywitzki, O.; Klinkenberg, S.; Gottfried, C. Photocatalytic titanium dioxide thin films prepared by reactive pulse magnetron sputtering at low temperature. Surf. Coat. Technol. 2005, 200, 967–971. [Google Scholar] [CrossRef]
  2. Minemoto, T.; Negami, T.; Nishiwaki, S.; Takakuraa, H.; Hamakawa, Y. Preparation of Zn1−xMgxO films by radio frequency magnetron sputtering. Thin Solid Films 2000, 372, 173–176. [Google Scholar] [CrossRef]
  3. Fujishima, A.; Rao, T.N.; Tryk, D.A. Titanium dioxide photocatalysis. J. Photochem. Photobiol. 2000, 1, 1–21. [Google Scholar] [CrossRef]
  4. Kluth, O.; Rech, B.; Houben, L.; Wieder, S.; Schöpe, G.; Beneking, C.; Wagner, H.; Löffl, A.; Schock, H.W. Texture etched ZnO:Al coated glass substrates for silicon based thin film solar cells. Thin Solid Films 1999, 351, 247–253. [Google Scholar] [CrossRef]
  5. Fortunato, E.; Nunes, P.; Costa, D.; Brida, D.; Ferreira, I.; Martins, R. Characterisation of aluminium doped zinc oxide thin films deposited on polymeric substrates. Vacuum 2002, 64, 233–236. [Google Scholar] [CrossRef]
  6. Szyszka, B. Transparent and conductive aluminum doped zinc oxide films prepared by mid-frequency reactive magnetron sputtering. Thin Solid Films 1999, 251, 164–169. [Google Scholar] [CrossRef]
  7. Ding, X.Z.; Liu, X.H. Correlation between anatase-to-rutile transformation and grain growth in nanocrystalline titania powders. J. Mat. Res. 1998, 13, 2556–2559. [Google Scholar] [CrossRef]
  8. Sicha, J.; Musil, J.; Meissner, M.; Cerstvy, R. Nanostructure of photocatalytic TiO2 films sputtered at temperatures below 200 °C. Appl. Surf. Sci. 2008, 254, 3793–3800. [Google Scholar] [CrossRef]
  9. Rawat, R.S.; Aggarwal, V.; Hassan, M.; Lee, P.; Springham, S.V.; Tan, T.L.; Lee, S. Nano-phase titanium dioxide thin film deposited by repetitive plasma focus: Ion irradiation and annealing based phase transformation and agglomeration. Appl. Surf. Sci. 2008, 255, 2932–2941. [Google Scholar] [CrossRef]
  10. Bendavid, A.; Martin, P.J.; Preston, E.W. The effect of pulsed direct current substrate bias on the properties of titanium dioxide thin films deposited by filtered cathodic vacuum arc deposition. Thin Solid Films 2008, 517, 494–499. [Google Scholar] [CrossRef]
  11. Long, H.; Yang, G.; Chen, A.; Li, Y.; Lu, P. Growth and characteristics of laser deposited anatase and rutile TiO2 films on Si substrates. Thin Solid Films 2008, 517, 745–749. [Google Scholar] [CrossRef]
  12. Srivatsa, K.M.K.; Bera, M.; Basu, A. Pure brookite titania crystals with large surface area deposited by plasma enhanced chemical vapour deposition technique. Thin Solid Films 2008, 516, 7443–7446. [Google Scholar] [CrossRef]
  13. Fusi, M.; Russo, V.; Casari, C.S.; Bassi, A.L.; Bottani, C.E. Titanium oxide nanostructured films by reactive pulsed laser deposition. Appl. Surf. Sci. 2009, 255, 5334–5337. [Google Scholar] [CrossRef]
  14. Ribarsky, M.W. Titaniumm dioxide (TiO2) (Rutile). Handb. Opt. Constants Solids 1997, 1, 795–804. [Google Scholar]
  15. Henderson, P.S.; Kelly, P.J.; Arnell, R.D.; Bäcker, H.; Bradley, J.W. Investigation into the properties of titanium based films deposited using pulsed magnetron sputtering. Surf. Coat. Technol. 2003, 174, 779–783. [Google Scholar]
  16. Kelly, P.J.; Arnell, R.D. The influence of deposition parameters on the structure of Al, Zr and W coatings deposited by closed-field unbalanced magnetron sputtering. Surf. Coat. Technol. 1996, 86–87, 425–431. [Google Scholar] [CrossRef]
  17. Kelly, P.J.; Bradley, J.W. Pulsed magnetron sputtering—Process overview and applications. J. Opto. Adv. Mat. 2009, 11, 1101–1107. [Google Scholar]
  18. Yates, H.M.; Brook, L.A.; Ditta, I.B.; Evans, P.; Foster, H.A.; Sheel, D.W.; Steele, A. Photo-induced self-cleaning and biocidal behaviour of titania and copper oxide multilayers. J. Photochem. Photobiol. A Chem. 2008, 197, 197–205. [Google Scholar] [CrossRef]
  19. Zhang, W.; Li, Y.; Zhu, S.; Wang, F. Fe-doped photocatalytic TiO2 film prepared by pulsed DC reactive magnetron sputtering. J. Vac. Sci. Technol. 2003, A21, 1877–1882. [Google Scholar]
  20. Kok, Y.N.; Kelly, P.J. Properties of pulsed magnetron sputtered TiO2 coatings grown under different magnetron configurations and power deliver modes. Plasma Proc. Polym. 2007, 4, 299–304. [Google Scholar] [CrossRef]
  21. Zhao, L.; Jiang, Q.; Lian, J. Visible-light photocatalytic activity of nitrogen-doped TiO2 thin film prepared by pulsed laser deposition. Appl. Surf. Sci. 2008, 254, 4620–4625. [Google Scholar] [CrossRef]
  22. Rampaul, A.; Parkin, I.P.; O’Neill, S.A.; de Souza, J.; Mills, A.; Elliot, N. Titania and tungsten doped titania thin films on glass; active photocatalysts. Polyhedron 2003, 22, 35–44. [Google Scholar] [CrossRef]
  23. Park, S.E.; Joo, H.; Kang, J.W. Effect of impurities in TiO2 thin films on trichloroethylene conversion. Sol. Energy Mater. Sol. Cells 2004, 83, 39–53. [Google Scholar] [CrossRef]
  24. Ratova, M.; Kelly, P.J.; West, G.; Lordanova, I. Enhanced properties magnetron sputtered photocatalytic coatings via transition metal doping. Surf. Coat. Technol. 2013, 228, 544–549. [Google Scholar] [CrossRef]
  25. Kelly, P.J.; West, G.; Kok, Y.N.; Bradley, J.W.; Swindells, I.; Clarke, G.C.B. A comparison of the characteristics of planar and cylindrical magnetrons operating in pulsed DC and AC modes. Surf. Coat. Technol. 2007, 202, 952–956. [Google Scholar] [CrossRef]
  26. Fernández, A.; Lassaletta, G.; Jiménez, V.M.; Justo, A.; González-Elipe, A.R.; Herrmann, J.M.; Tahiri, H.; Ait-Ichou, Y. Preparation and characterization of TiO2 photocatalysts supported on various rigid supports (glass, quartz and stainless steel). Comparative studies of photocatalytic activity in water purification. Appl. Catal. B Env. 1995, 7, 49–63. [Google Scholar] [CrossRef]
  27. Zhu, J.; Deng, Z.; Chen, F.; Zhang, J.; Chen, H.; Anpo, M.; Huang, J.; Zhang, L. Hydrothermal doping method for preparation of Cr3+-TiO2 photocatalysts with concentration gradient distribution of Cr3+. Appl. Catal. B Env. 2006, 62, 329–325. [Google Scholar] [CrossRef]
  28. Kim, J.Y.; Park, C.; Yoon, J. Developing a testing method for antimicrobial efficacy on TiO2 photocatalytic products. Environ. Eng. Res. 2008, 13, 136–140. [Google Scholar] [CrossRef]
  29. Evans, P.; Pemble, M.E.; Sheel, D.W.; Yates, H.M. Multifunctional self-cleaning thermochromic films by atmospheric pressure chemical vapour deposition. J. Photochem. Photobiol. A Chem. 2007, 189, 387–397. [Google Scholar] [CrossRef]
  30. Evans, P.; English, T.; Hammond, D.; Pemble, M.E.; Sheel, D.W. The role of SiO2 barrier layers in determining the structure and photocatalytic activity of TiO2 films deposited on stainless steel. Appl. Catal. A Gen. 2007, 321, 140–146. [Google Scholar] [CrossRef]
  31. Kenanakis, G.; Giannakoudakis, Z.; Vernardou, D.; Savvakis, C.; Katsarakis, N. Photocatalytic degradation of stearic acid by ZnO thin films and nanostructures deposited by different chemical routes. J. Catal. Today 2010, 151, 34–38. [Google Scholar] [CrossRef]
  32. Brook, L.A.; Evans, P.; Foster, H.A.; Pembleb, M.E.; Steele, A.; Sheel, D.W.; Yates, H.M. Highly bioactive silver and silver/titania composite films grown by chemical vapour deposition. J. Photochem. Photobiol. A Chem. 2007, 187, 53–63. [Google Scholar] [CrossRef]
  33. Evans, P.; Pemble, M.E.; Sheel, D.W. Precursor-directed control of crystalline type in atmospheric pressure CVD growth of TiO2 on stainless steel. J. Chem. Mat. 2006, 18, 5750–5755. [Google Scholar] [CrossRef]
  34. Guettai, N.; Amar, H.A. Photocatalytic oxidation of methyl orange in presence of titanium dioxide in aqueous suspension, Part I, Parametric Study. Desalination 2005, 185, 427–437. [Google Scholar]
  35. Hazan, R.; Sreekantan, S.; Lockman, Z.; Mat, I. A study on photocatalytic degradation of methyl orange using carbon doped TiO2 nanotubes. J. Fund. Sci. 2010, 96, 355–365. [Google Scholar]
  36. Carcel, R.A.; Andronic, L.; Duta, A. Cd2+ modified TiO2 for methyl orange photodegradation. Rev. Roum. Chim. 2009, 54, 309–312. [Google Scholar]
  37. Kim, S.; Ehrman, S.H. Photocatalytic activity of a surface-modified anatase and rutile titania nanoparticle mixture. J. Col. Interf. Sci. 2009, 338, 304–307. [Google Scholar] [CrossRef]
  38. Onifade, A.A.; Kelly, P.J. The influence of deposition parameters on the structure and properties of magnetron-sputtered titania coatings. Thin Solid Films 2006, 494, 8–12. [Google Scholar] [CrossRef]
  39. Ohno, S.; Takasawa, N.; Sato, Y.; Yoshikawa, M.; Suzuki, K.; Frach, P.; Shugesato, Y. Photocatalytic TiO2 films deposited by reactive magnetron sputtering with unipolar pulsing and plasma emission control systems. Thin Solid Films 2006, 496, 126–130. [Google Scholar] [CrossRef]
  40. Evans, P.; Mantke, S.; Mills, A.; Robinson, A.; Sheel, D.W. A comparative study of three techniques for determining photocatalytic activity. J. Photochem. Photobiol. A Chem. 2007, 188, 387–391. [Google Scholar] [CrossRef]
  41. Mills, A.; McGrady, M. A study of new photocatalyst indicator inks. J. Photochem. Photobiol. A Chem. 2008, 193, 228–236. [Google Scholar] [CrossRef]
  42. Mills, A.; Hepburn, J.; McFarlane, M. A novel, fast-responding, indicator ink for thin film photocatalytic surfaces. ACS Appl. Mat. Interf. 2009, 1, 1163–1165. [Google Scholar] [CrossRef]
  43. Coutinho, C.A.; Gupta, V.K. Photocatalytic degradation of methyl orange using polymer-titania microcomposites. J. Col. Interf. Sci. 2009, 333, 64. [Google Scholar]
  44. Bates, R.I.; Arnell, R.D. Alloy coatings by dual magnetron sputter barrel plating. Surf. Coat. Technol. 1994, 68–69, 686–690. [Google Scholar] [CrossRef]
  45. Zywitzki, O.; Modes, T.; Frach, P.; Gloss, D. Effect of Structure and Roughness on Photocatalytic Properties of TiO2. In Proceedings of European Materials Research Society (EMRS): European Materials Research Society (E-MRS) Spring Meeting, Strasbourg, France, 28 May–1 June 2007.
  46. Löbl, P.; Huppertz, M.; Mergel, D. Nucleation and growth in TiO2 films prepared by sputtering and evaporation. Thin Solid Films 1994, 251, 72–79. [Google Scholar] [CrossRef]

