Review

Review on the Photocatalyst Coatings of TiO2: Fabrication by Mechanical Coating Technique and Its Application

1
Graduate School & Faculty of Engineering, Chiba University, 1-33, Yayoi-cho, Inage-ku, Chiba 263-8522, Japan
2
College of Mechanical Engineering, Tianjin University of Science and Technology, No.1038, Dagu Nanlu, Hexi District, Tianjin 300222, China
3
Chiba Industrial Technology Research Institute, 6-13-1, Tendai, Inage-ku, Chiba 263-0016, Japan
*
Author to whom correspondence should be addressed.
Coatings 2015, 5(3), 425-464; https://doi.org/10.3390/coatings5030425
Submission received: 18 June 2015 / Revised: 16 July 2015 / Accepted: 22 July 2015 / Published: 30 July 2015
(This article belongs to the Special Issue Novel Thin Film Materials for Photovoltaic Applications)

Abstract

:
This review presents the latest results of studies directed at photocatalyst coatings of titanium dioxide (TiO2) prepared by mechanical coating technique (MCT) and its application. Compared with traditional coating techniques, MCT is a simple, low cost and useful coating formation process, which is proposed and developed based on mechanical frictional wear and impacts between substrate materials and metal powder particles in the bowl of planetary ball mill. The formation process of the metal coatings in MCT includes four stages: The nucleation by adhesion, the formation and coalescence of discrete islands, formation and thickening of continuous coatings, exfoliation of continuous coatings. Further, two-step MCT was developed based on the MCT concept for preparing composite coatings on alumina (Al2O3) balls. This review also discusses the influence on the fabrication of photocatalyst coatings after MCT and improvement of its photocatalytic activity: oxidation conditions, coating materials, melt salt treatment. In this review, the oxidation conditions had been studied on the oxidation temperature of 573 K, 673 K, 773 K, 873 K, 973 K, 1173 K and 1273 K, the oxidation time of 0.5 h, 1 h, 3 h, 10 h, 15 h, 20 h, 30 h, 40 h, and 50 h. The photocatalyst coatings showed the highest photocatalytic activity with the oxidation condition of 1073 K for 15 h. The metal powder of Ti, Ni and Cr had been used as the coating materials. The composite metal powder could affect the surface structure and photocatalytic activity. On the other hand, the melt salt treatment with KNO3 is an effective method to form the nano-size structure and enhance photocatalytic activity, especially under visible light.

1. Introduction

In the field of materials science and engineering, the investigation into film materials had been the focus of much attention for a variety of new material properties, such as electrics and electronics, optics, thermotics, magnetic, and mechanics, among others [1]. In recent years, without the development of film materials, it would be very difficult to make any great progress in renewable energy, environment improvement, exploitation of space, and so on [2]. In general, the fabrication techniques for film materials can fall into several categories as shown in Table 1 [3]. From Table 1, it can be seen that the fabrication techniques include physical vapor deposition (PVD), chemical vapor deposition (CVD), liquid absorption coating, thermal spraying and mechanical coating. Many variations of these techniques have been developed to balance advantages and disadvantages of various strategies, also shown in Table 1. In these techniques, PVD and CVD are most widely applied, but they require large and complicated equipment and vacuum conditions, and they have high fabrication costs and encounter difficulty in formation on spherical substrate [4,5,6]. However, every coating technique has its advantages and limitations to some extent. The features of these coating techniques mean that they have different application fields. Their advantages and limitations are summarized in Table 1 [3]. In order to solve these problems, our group had proposed a novel coating fabrication technique to form the coating materials, named as mechanical coating technique (MCT), with the diagram schematic shown in Figure 1 [7,8]. The metal coatings on Al2O3 balls had been prepared by MCT, shown as Figure 2a, and the metal coatings could be treated by a thermal process, as shown in Figure 2b.
In recent years, TiO2 has been considered as one of the most promising photocatalysts for the potential material in environment purification, sterilization, self-cleaning surfaces, and hydrogen generation due to its high photocatalytic activity, excellent chemical stability, non-toxicity, and low cost [9,10,11,12]. However, the photoreaction efficiency of TiO2 is severely limited to its wider band gap (>3 eV), which hampers the exploitation of solar light in photocatalytic reactions, and in the low quantum efficiency of photocatalytic reactions, because of the high recombination probability of the generated electron-hole pairs [13,14,15]. Therefore, much effort had been devoted to shifting the absorption of TiO2 from UV to visible light range. The ions of transition metal, such as Cr3+, V5+, Fe3+, Ni2+ are employed to modify the electronic structure of TiO2 by introducing a donor and/or acceptor level in the band gap, which allows photons with some lower energy to excite photocatalyst and exhibit a higher photocatalytic activity under visible light [16,17]. On the other hand, the mixed-phase is another way to increase the charge transfer of electrons and holes between the phases of anatase and rutile, which has been paid much attention [18,19,20,21]. In our study, MCT had been used to fabricate the TiO2 photocatalyst coatings on Al2O3 balls [22,23]. Collision, friction and abrasion are used to effectively form metal coatings, such Ti, Fe, Zn, and TiO2, on ceramic grinding media [23,24,25].
Table 1. Film coating techniques.
Coating TechniqueCoating ProcessesFeatureDisadvantageApplication
Physical vapor deposition (PVD)Vacuum depositionResistance heating, Flash Evaporation, Vacuum Arc, Laser heating, High frequency heating, Electron beam heatingPossibility of thickness control; Coating of large area filmLarge equipment; Coating difficulty on complicated surfaceChemistry; Optics; Electron
MBE (Molecular Beam Epitaxy)Coating on complicated surface; Strong adhesionLarge equipment; Thermal processChemistry; Anticorrosive
Laser depositionSmall equipment; Coating on complicated surfaceSolution handling difficulty; Thermal processMachinery
Sputter depositionIon beam sputtering, DC sputtering, High frequency sputtering, Magnetron sputtering, Microwave ECR plasma depositionRapid coating; Large specific surface areaHeat treatment for coating; Crystalline changeMachinery; Automobile; Tool
Ion beam platingHigh frequency ion plating, Activated reactive evaporation, Arc ion platingHeat treatment needlessness; Possibility of nano-coatingLarge equipment; Coating difficulty on complicated surfaceChemistry; Optics; Electron
Ion beam depositionPossibility of thickness control; Coating of large area filmLarge equipment; Coating difficulty on complicated surfaceChemistry; Anticorrosive
Ionized cluster beam depositionCoating on complicated surface; Strong adhesionLarge equipment; Thermal processMachinery
Chemical vapor deposition (CVD)Thermal CVDAtmospheric pressure CVD, Low pressure CVDSmall equipment; Coating on complicated surfaceSolution handling difficulty; Thermal processMachinery; Automobile; Tool
Plasma CVDDC plasma CVD, High frequency plasma CVD, ERC plasma CVDRapid coating; Large specific surface areaHeat treatment for coating; Crystalline changeChemistry; Optics; Electron
Photo-excited CVDHeat treatment needlessness; Possibility of nano-coatingLarge equipment; Coating difficulty on complicated surfaceChemistry; Anticorrosive
Liquid absorption coatingPlatingElectroplating, Electroless platingPossibility of thickness control; Coating of large area filmLarge equipment; Coating difficulty on complicated surfaceMachinery
Anodic oxide coating, Painting, Sol-gel methodCoating on complicated surface; Strong adhesionLarge equipment; Thermal processMachinery; Automobile; Tool
Spin coating, Dip coating, Roll coating, Spry coatingSmall equipment; Coating on complicated surfaceSolution handling difficulty; Thermal processChemistry; Optics; Electron
Thermal sprayingFlame spraying, Electrical spraying (Arc, Plasma)Rapid coating; Large specific surface areaHeat treatment for coating; Crystalline changeChemistry; Anticorrosive
Mechanical coatingShot coating, Powder impact plating, Aerosol deposition, Gas depositionHeat treatment needlessness; Possibility of nano-coatingLarge equipment; Coating difficulty on complicated surfaceMachinery
Figure 1. Schematic diagram of fabricating metal coatings by mechanical coating technique (MCT).
Coatings 05 00425 g001
Figure 2. Appearance of samples by MCT and oxidized metal coatings. (a) Al2O3 objects before and after MCT; (b) The oxidized metal coatings.
Coatings 05 00425 g002
With the subsequent oxidation process, the Ti coatings are oxidized to form TiO2 coatings or TiO2/Ti composite coatings, shown as Figure 2 [26]. The improvement of photocatalytic activity of TiO2 coatings via the ions of transition metal and/or the mixed-phase had been studied in detail [27,28,29].
In this review, we present the latest results of studies directed at photocatalyst coatings of TiO2 prepared by MCT and its application.

2. A Novel Coating Technique for Composite Coatings: MCT

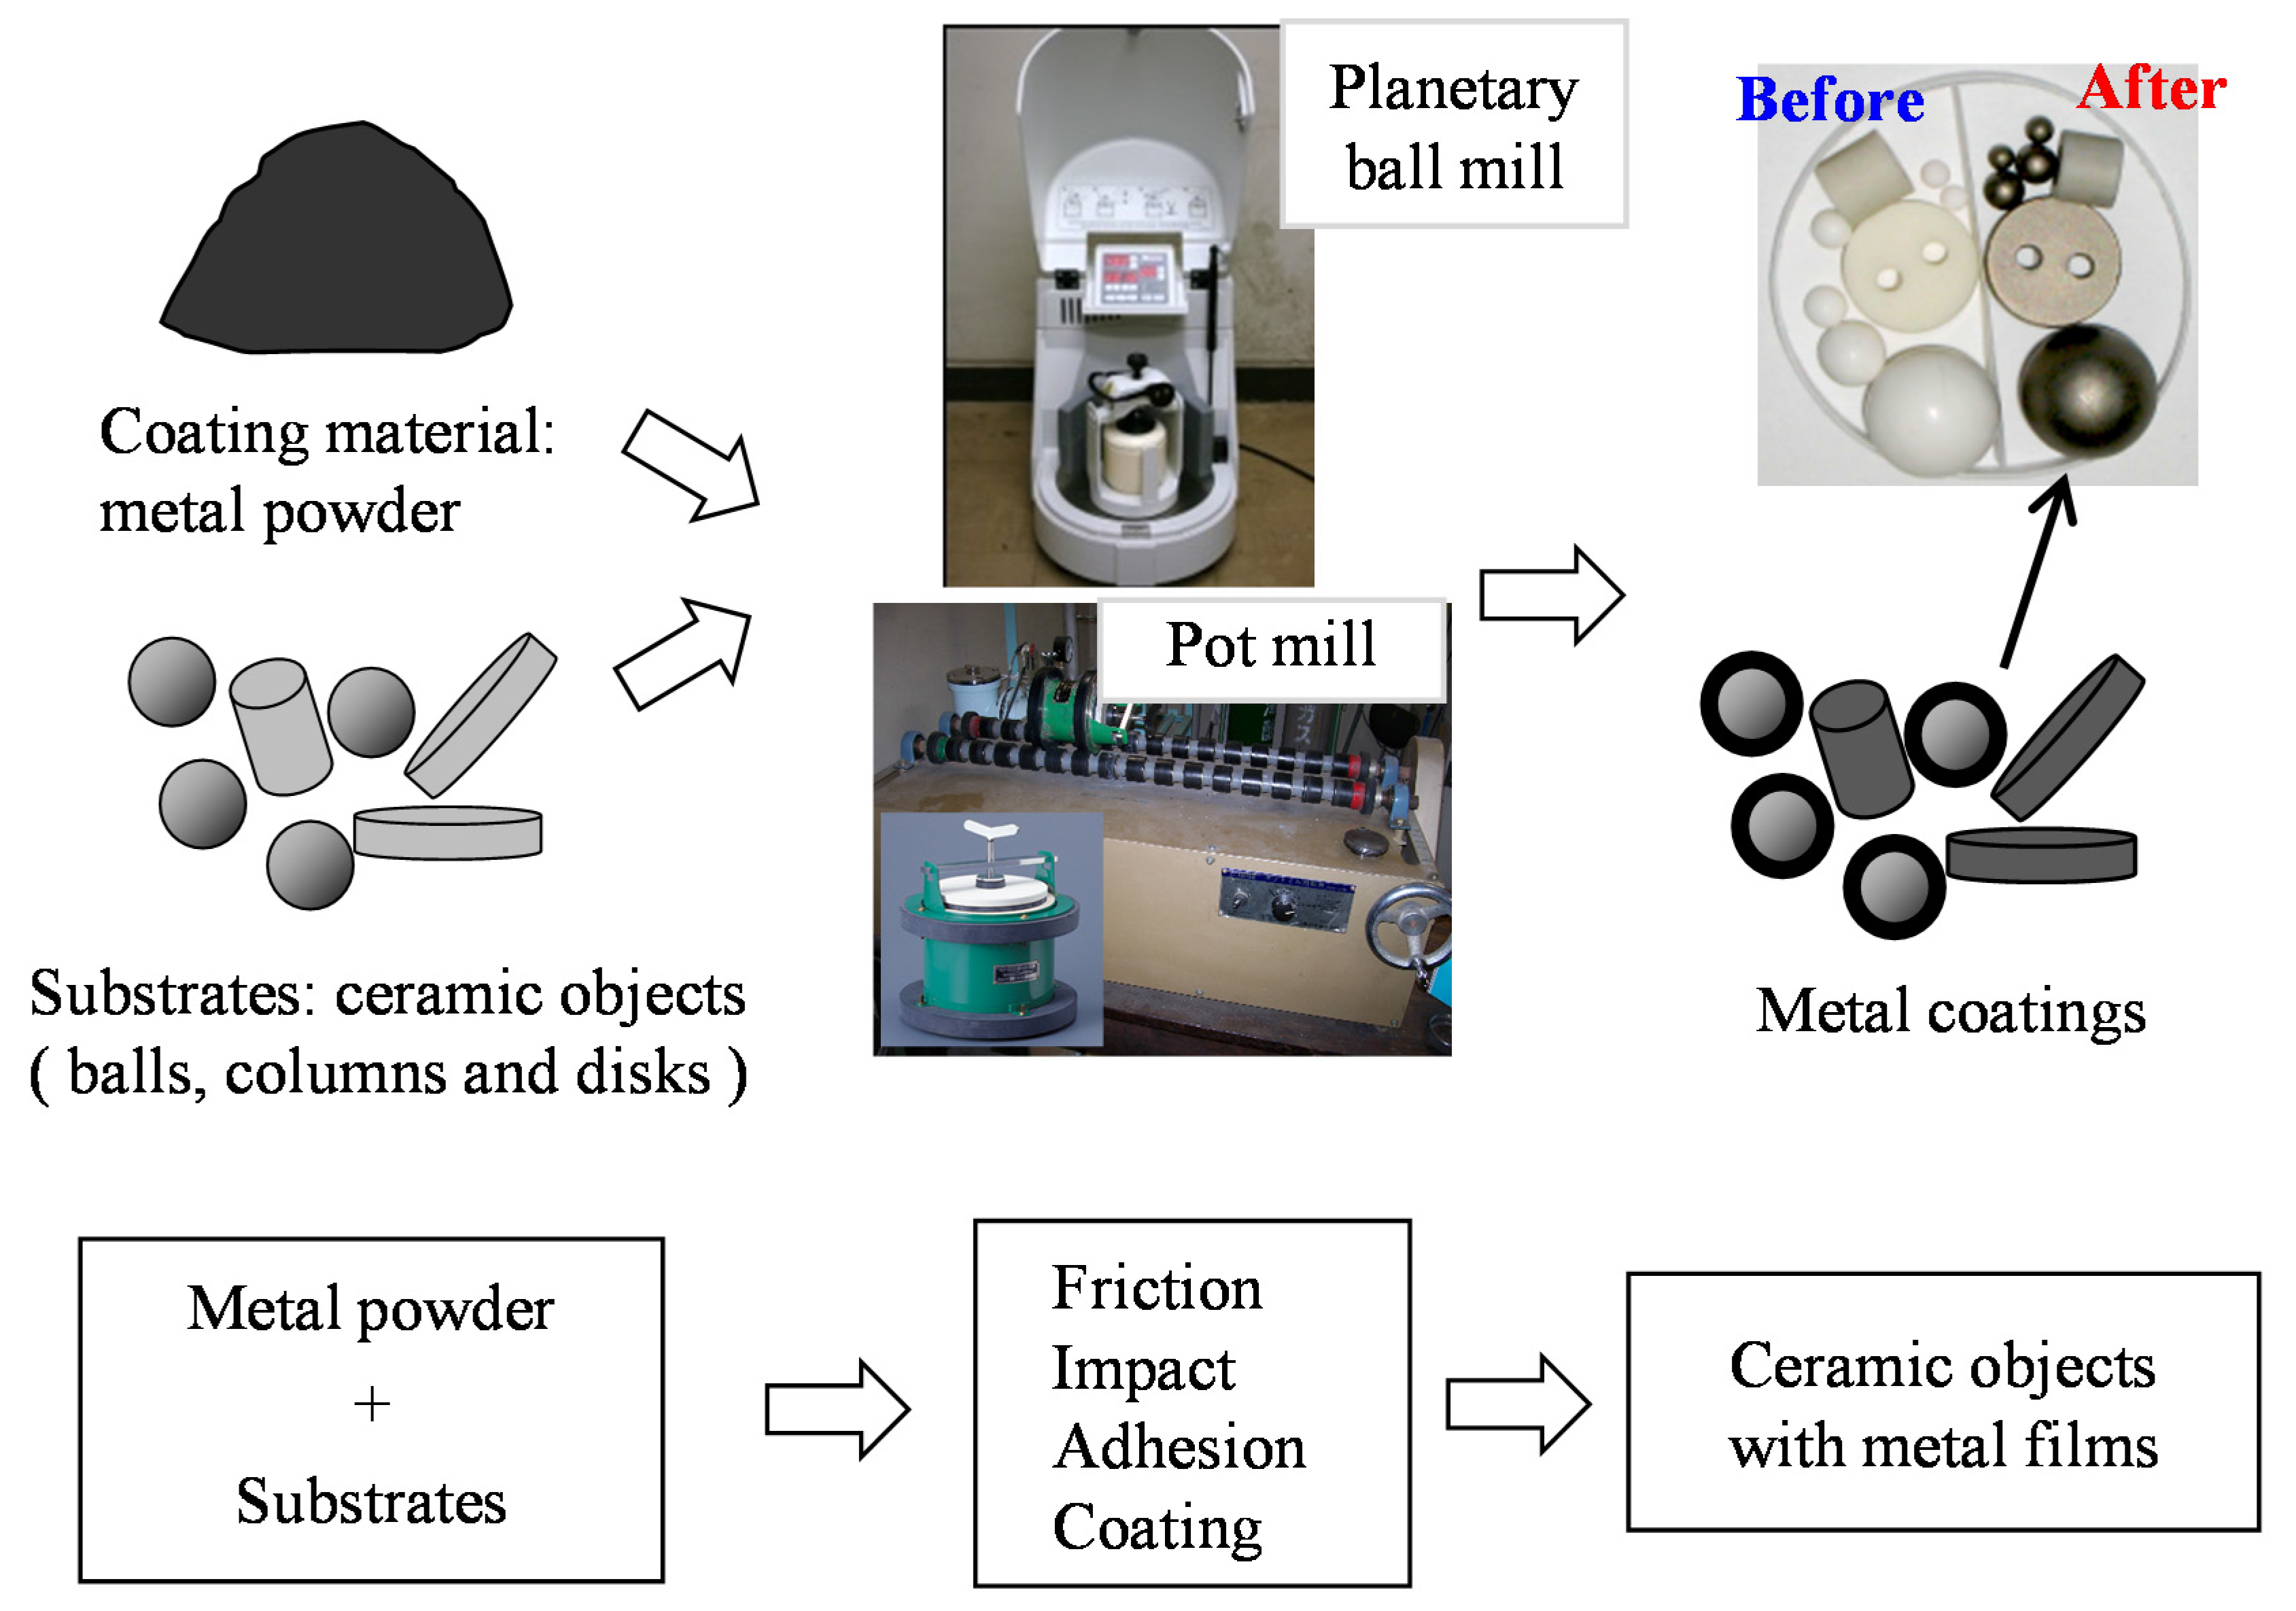
2.1. Proposal of MCT

MCT is a kind of mechanical alloying (MA), which is a powder processing technique that allows production of homogeneous materials starting from blended elemental powder mixtures [30]. In MCT, metal powder and ceramic grinding mediums (balls, buttons and columns) are used as the coating material and the substrates, respectively. Firstly, they are charged into a bowl made of alumina. The mechanical coating is performed by the planetary ball mill (Type: P6, Fritsch, Germany), shown in Figure 3a. The schematic diagram of its operational principle is shown in Figure 3b. In the process, the bowls rotate around their own axes and rotate the rotating support disk simultaneously. Therefore, centrifugal force is produced. Since the bowls and the rotating support disk rotate in opposite directions, the centrifugal force alternately acts in like and opposite directions, shown by way of the ball motion inside the ball mill (Figure 3b). In this condition, the grinding balls in the bowls run down the inner wall of the bowls, which produce friction effect. Subsequently, the ground material and grinding balls lift off and travel freely through the inner chamber of the bowls and impact the opposing inner wall, which results in impact effect.
Figure 3. Planetary ball mill and ball motion. (a) Planetary ball mill; (b) Schematic depicting the ball motion inside the ball mill.
Coatings 05 00425 g003
X-ray diffraction (XRD, JDX-3530, JEOL, Japan) with Cu-Kα radiation at 30 kV and 20 mA was used to determine the compositions and crystal structures. The surface morphologies and cross-sectional microstructures of the samples were observed by scanning electron microscopy (SEM) (JSM-5300, JEOL, Tokyo, Japan).

2.2. MCT and Its Influencing Parameters

At the early stage of MCT development, we fabricated Ti coatings on ceramic substrates such as Al2O3 balls by MCT. After that, we successfully use other coating materials (Cu, Ni, Fe, Zn, and TiO2) to fabricate the coatings by MCT. Figure 4 shows the influence parameters on the coating formation during the MCT, such as the physical factors, chemical factors, process factors and mechanical factors. At present, we focused on the influence parameters of coating materials, electronegativity of metal, plastic deformability of metal, MCT speed and time.
Figure 4. The influence parameters of MCT in theory.
Coatings 05 00425 g004

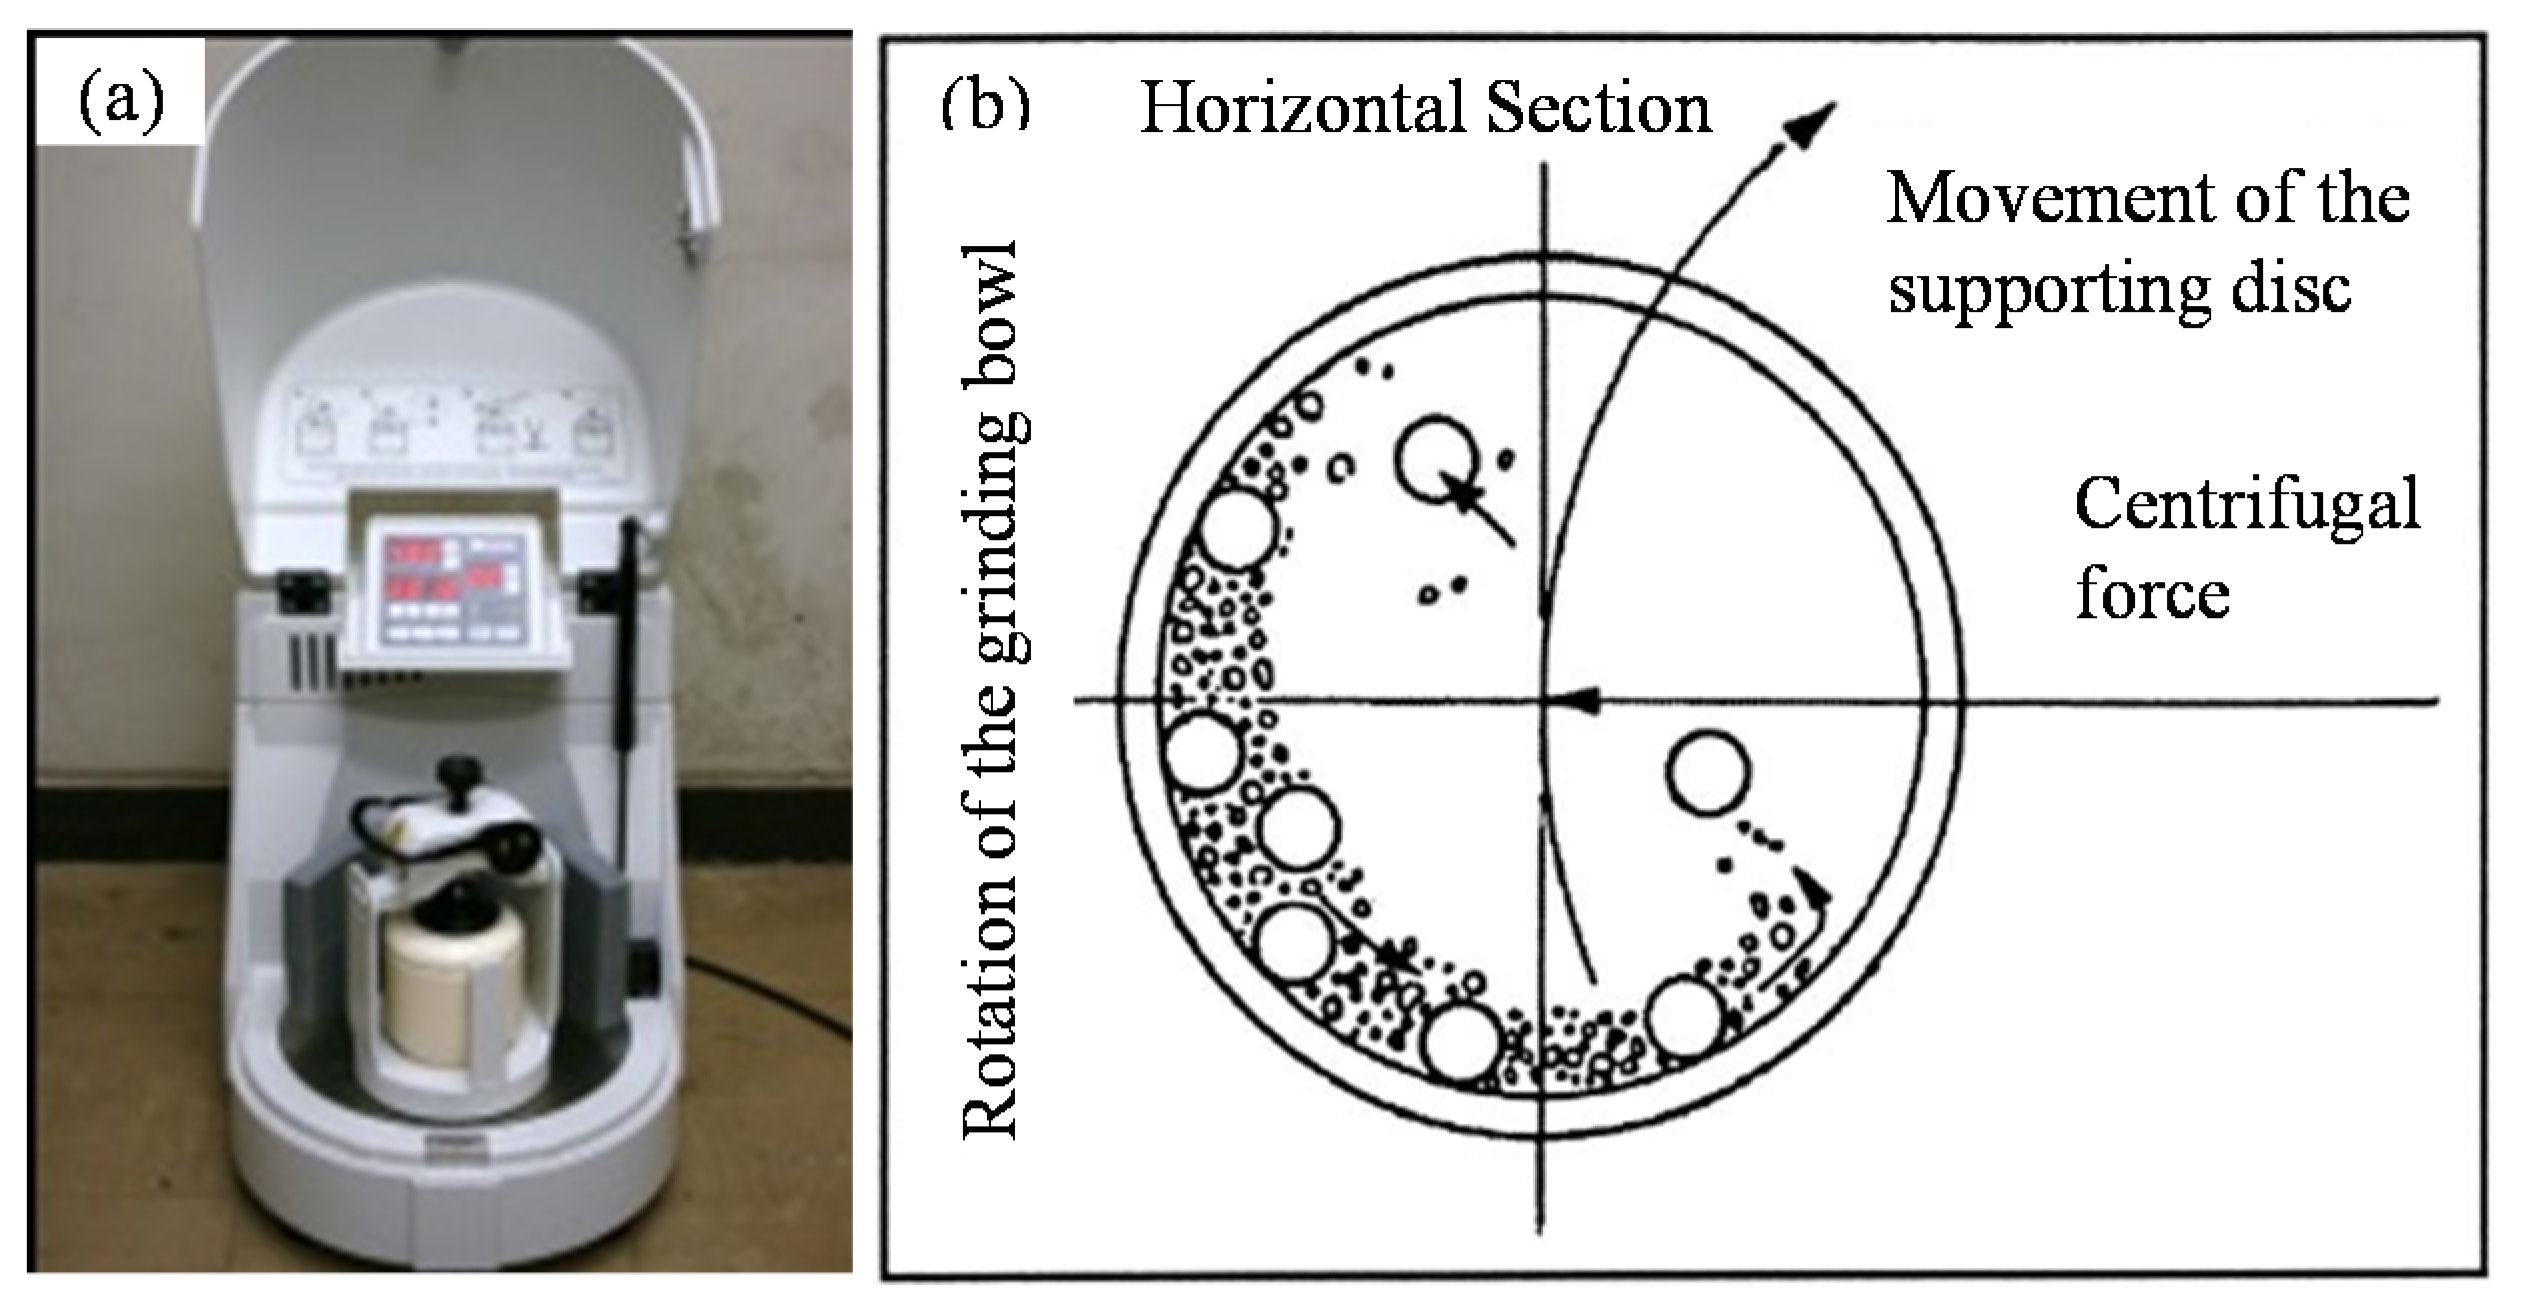
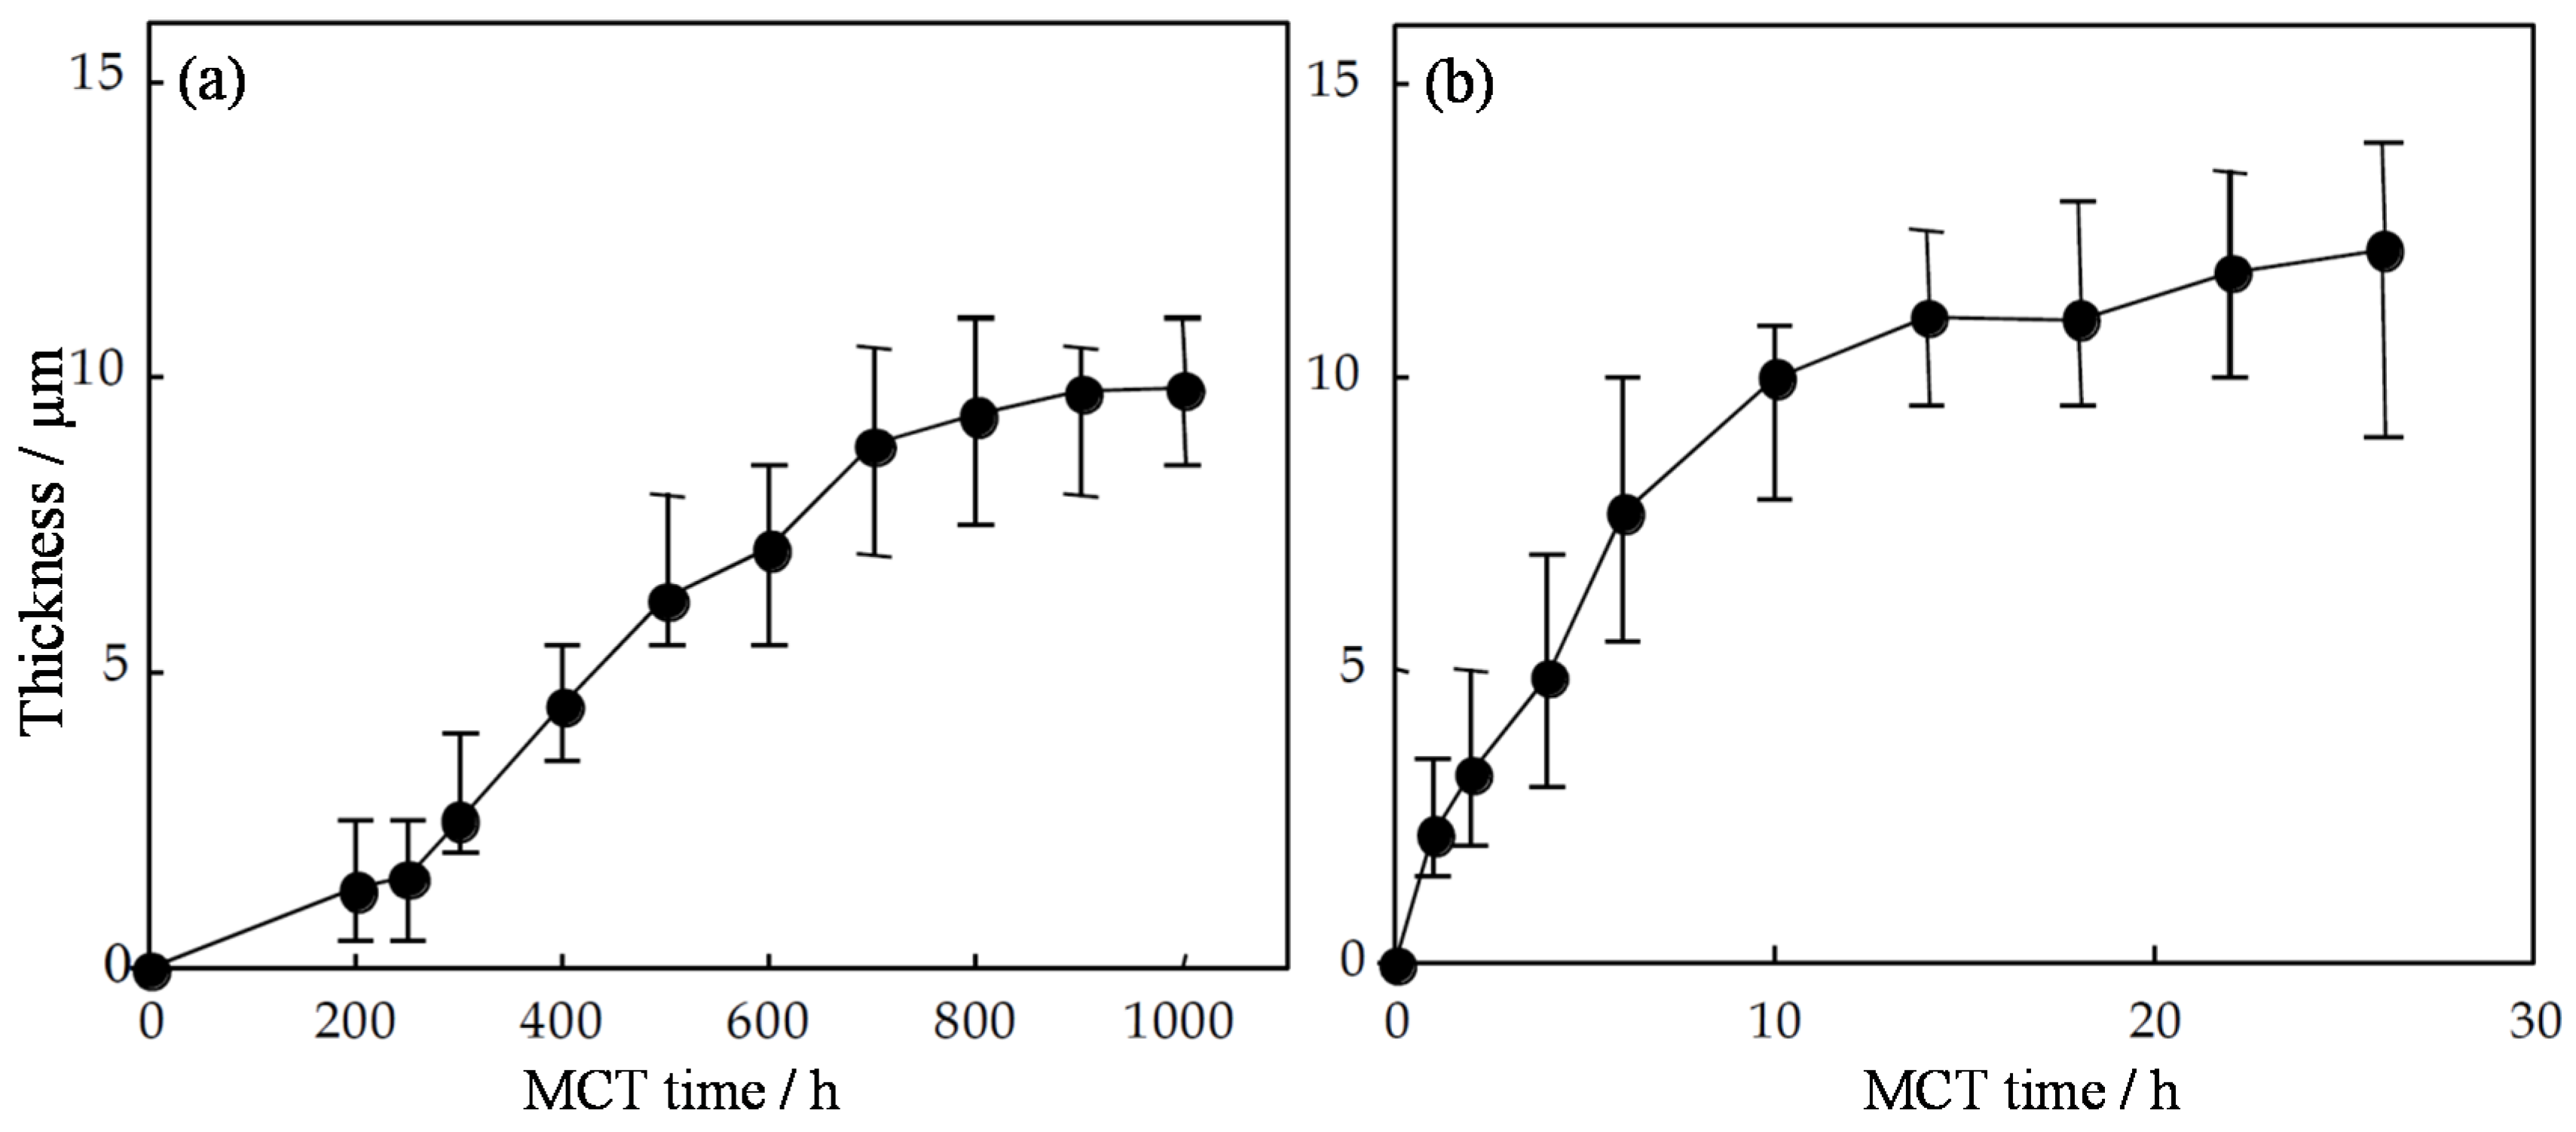
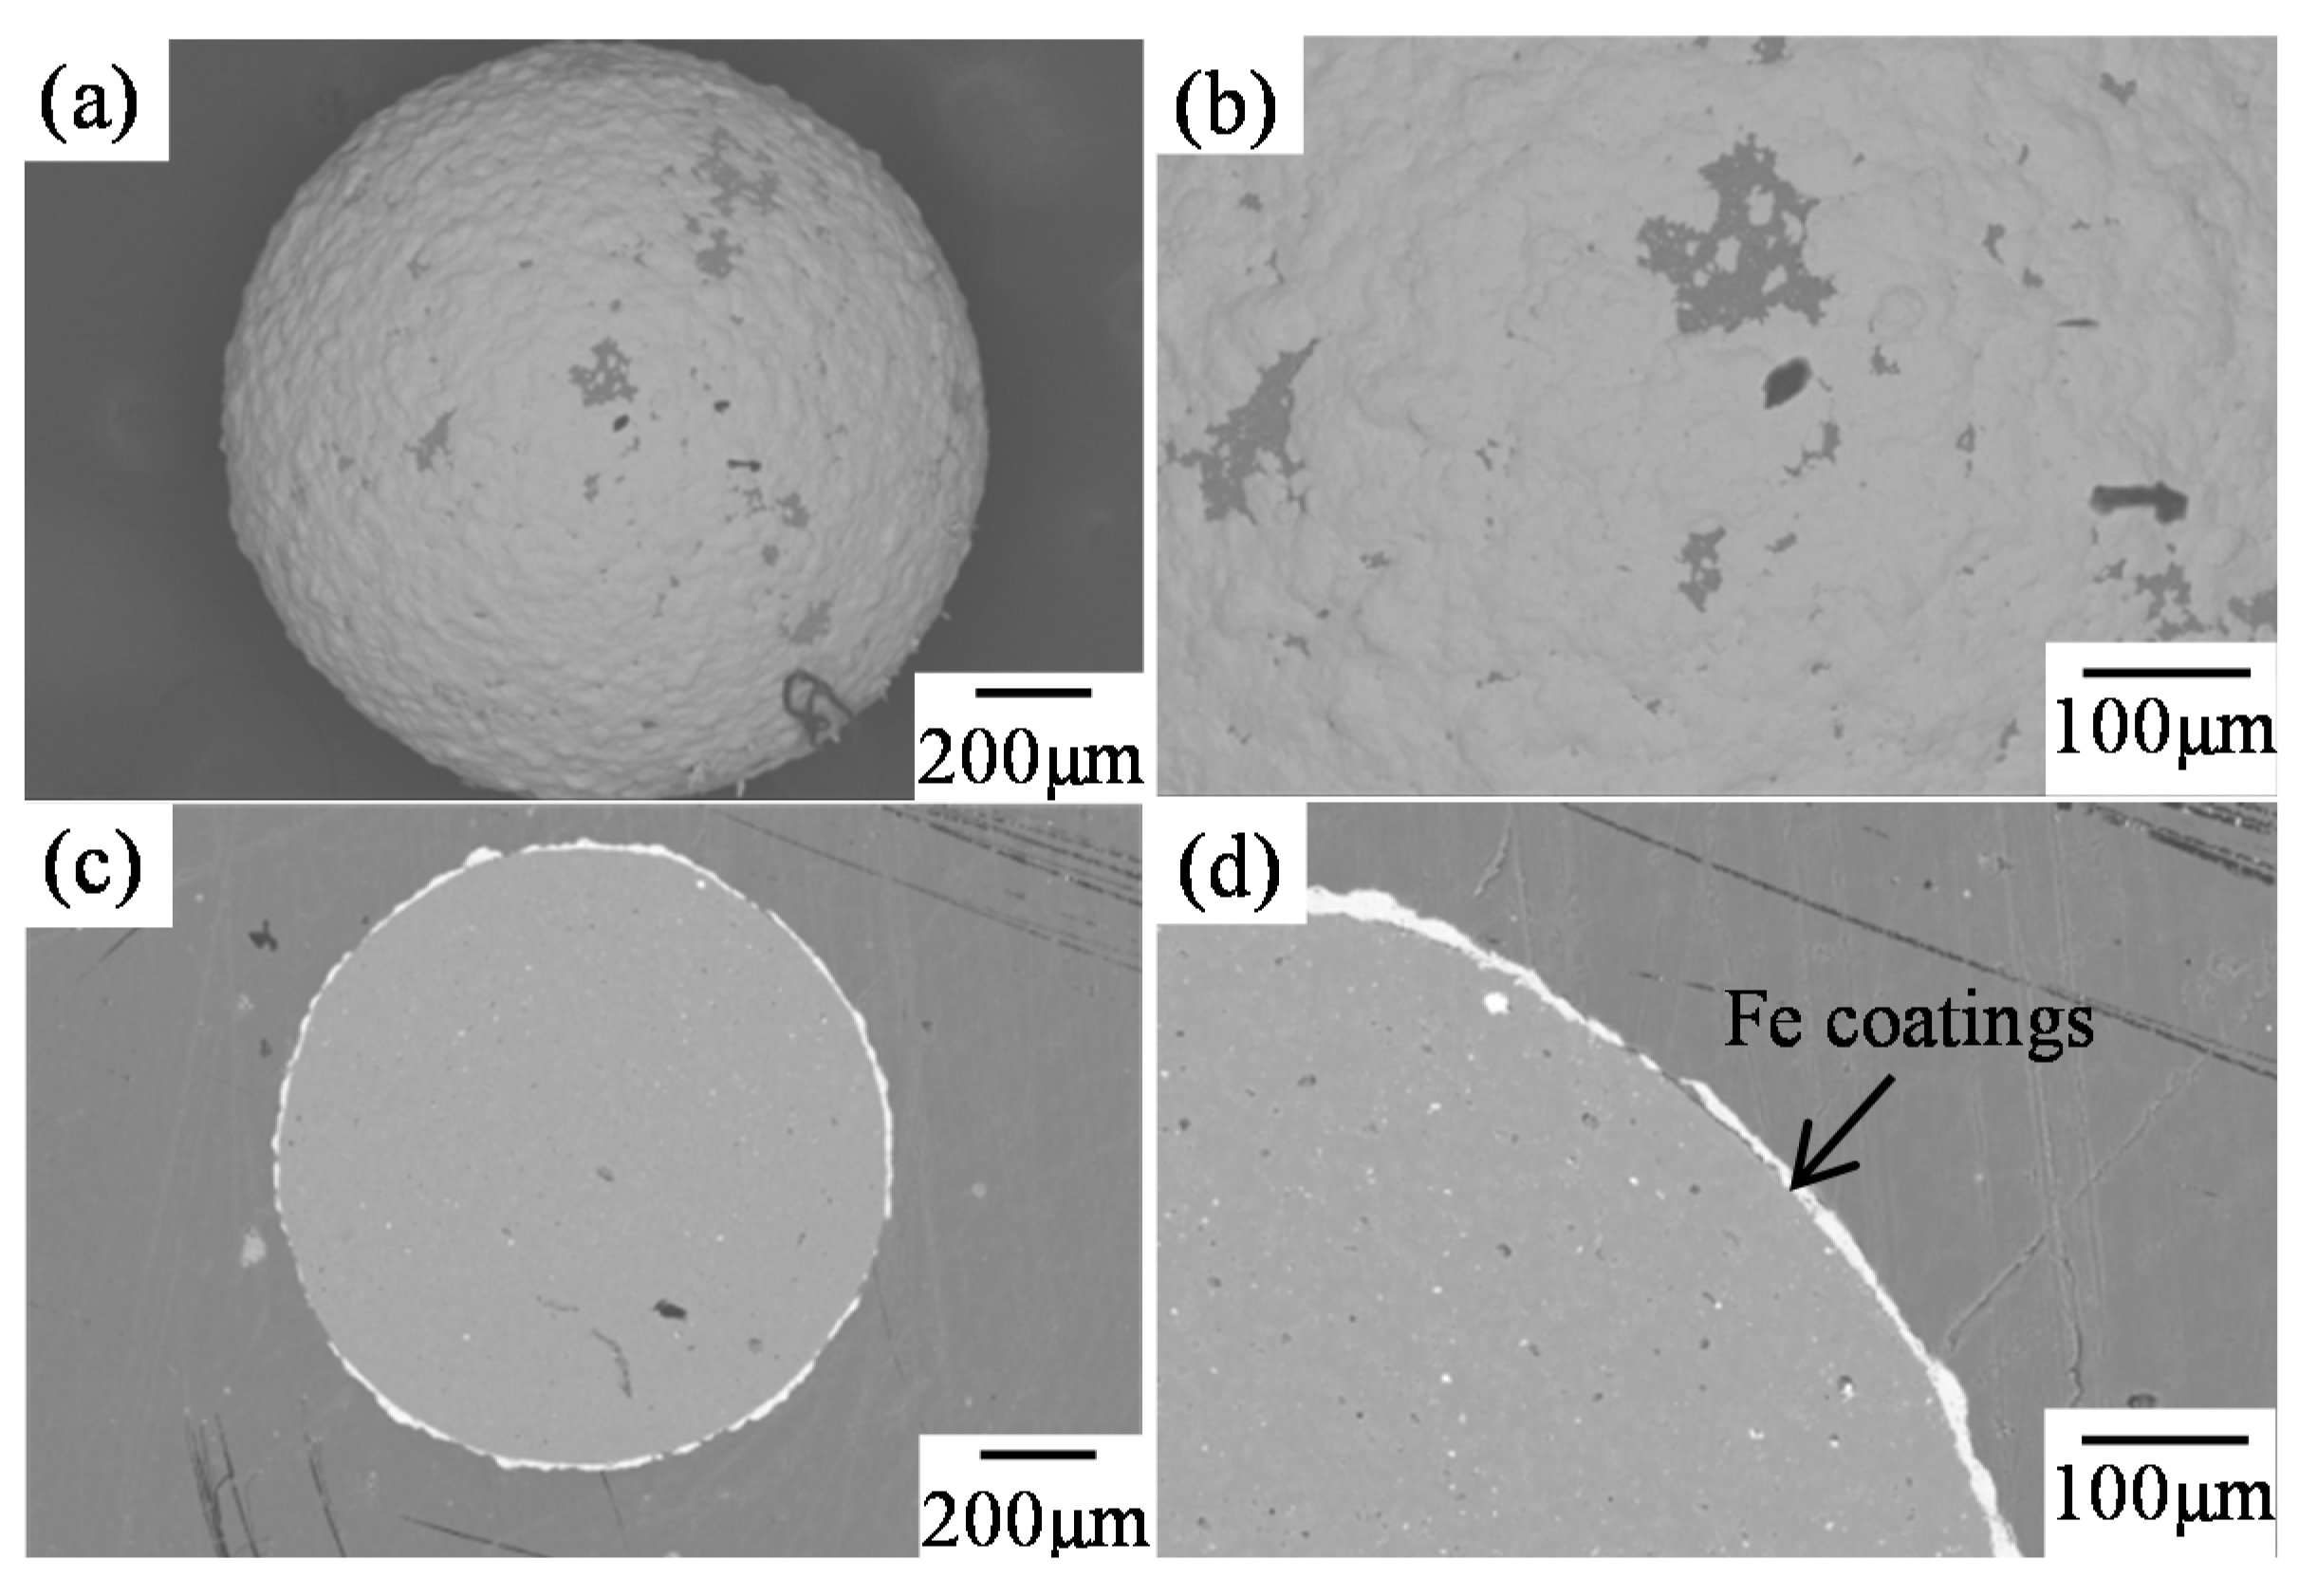
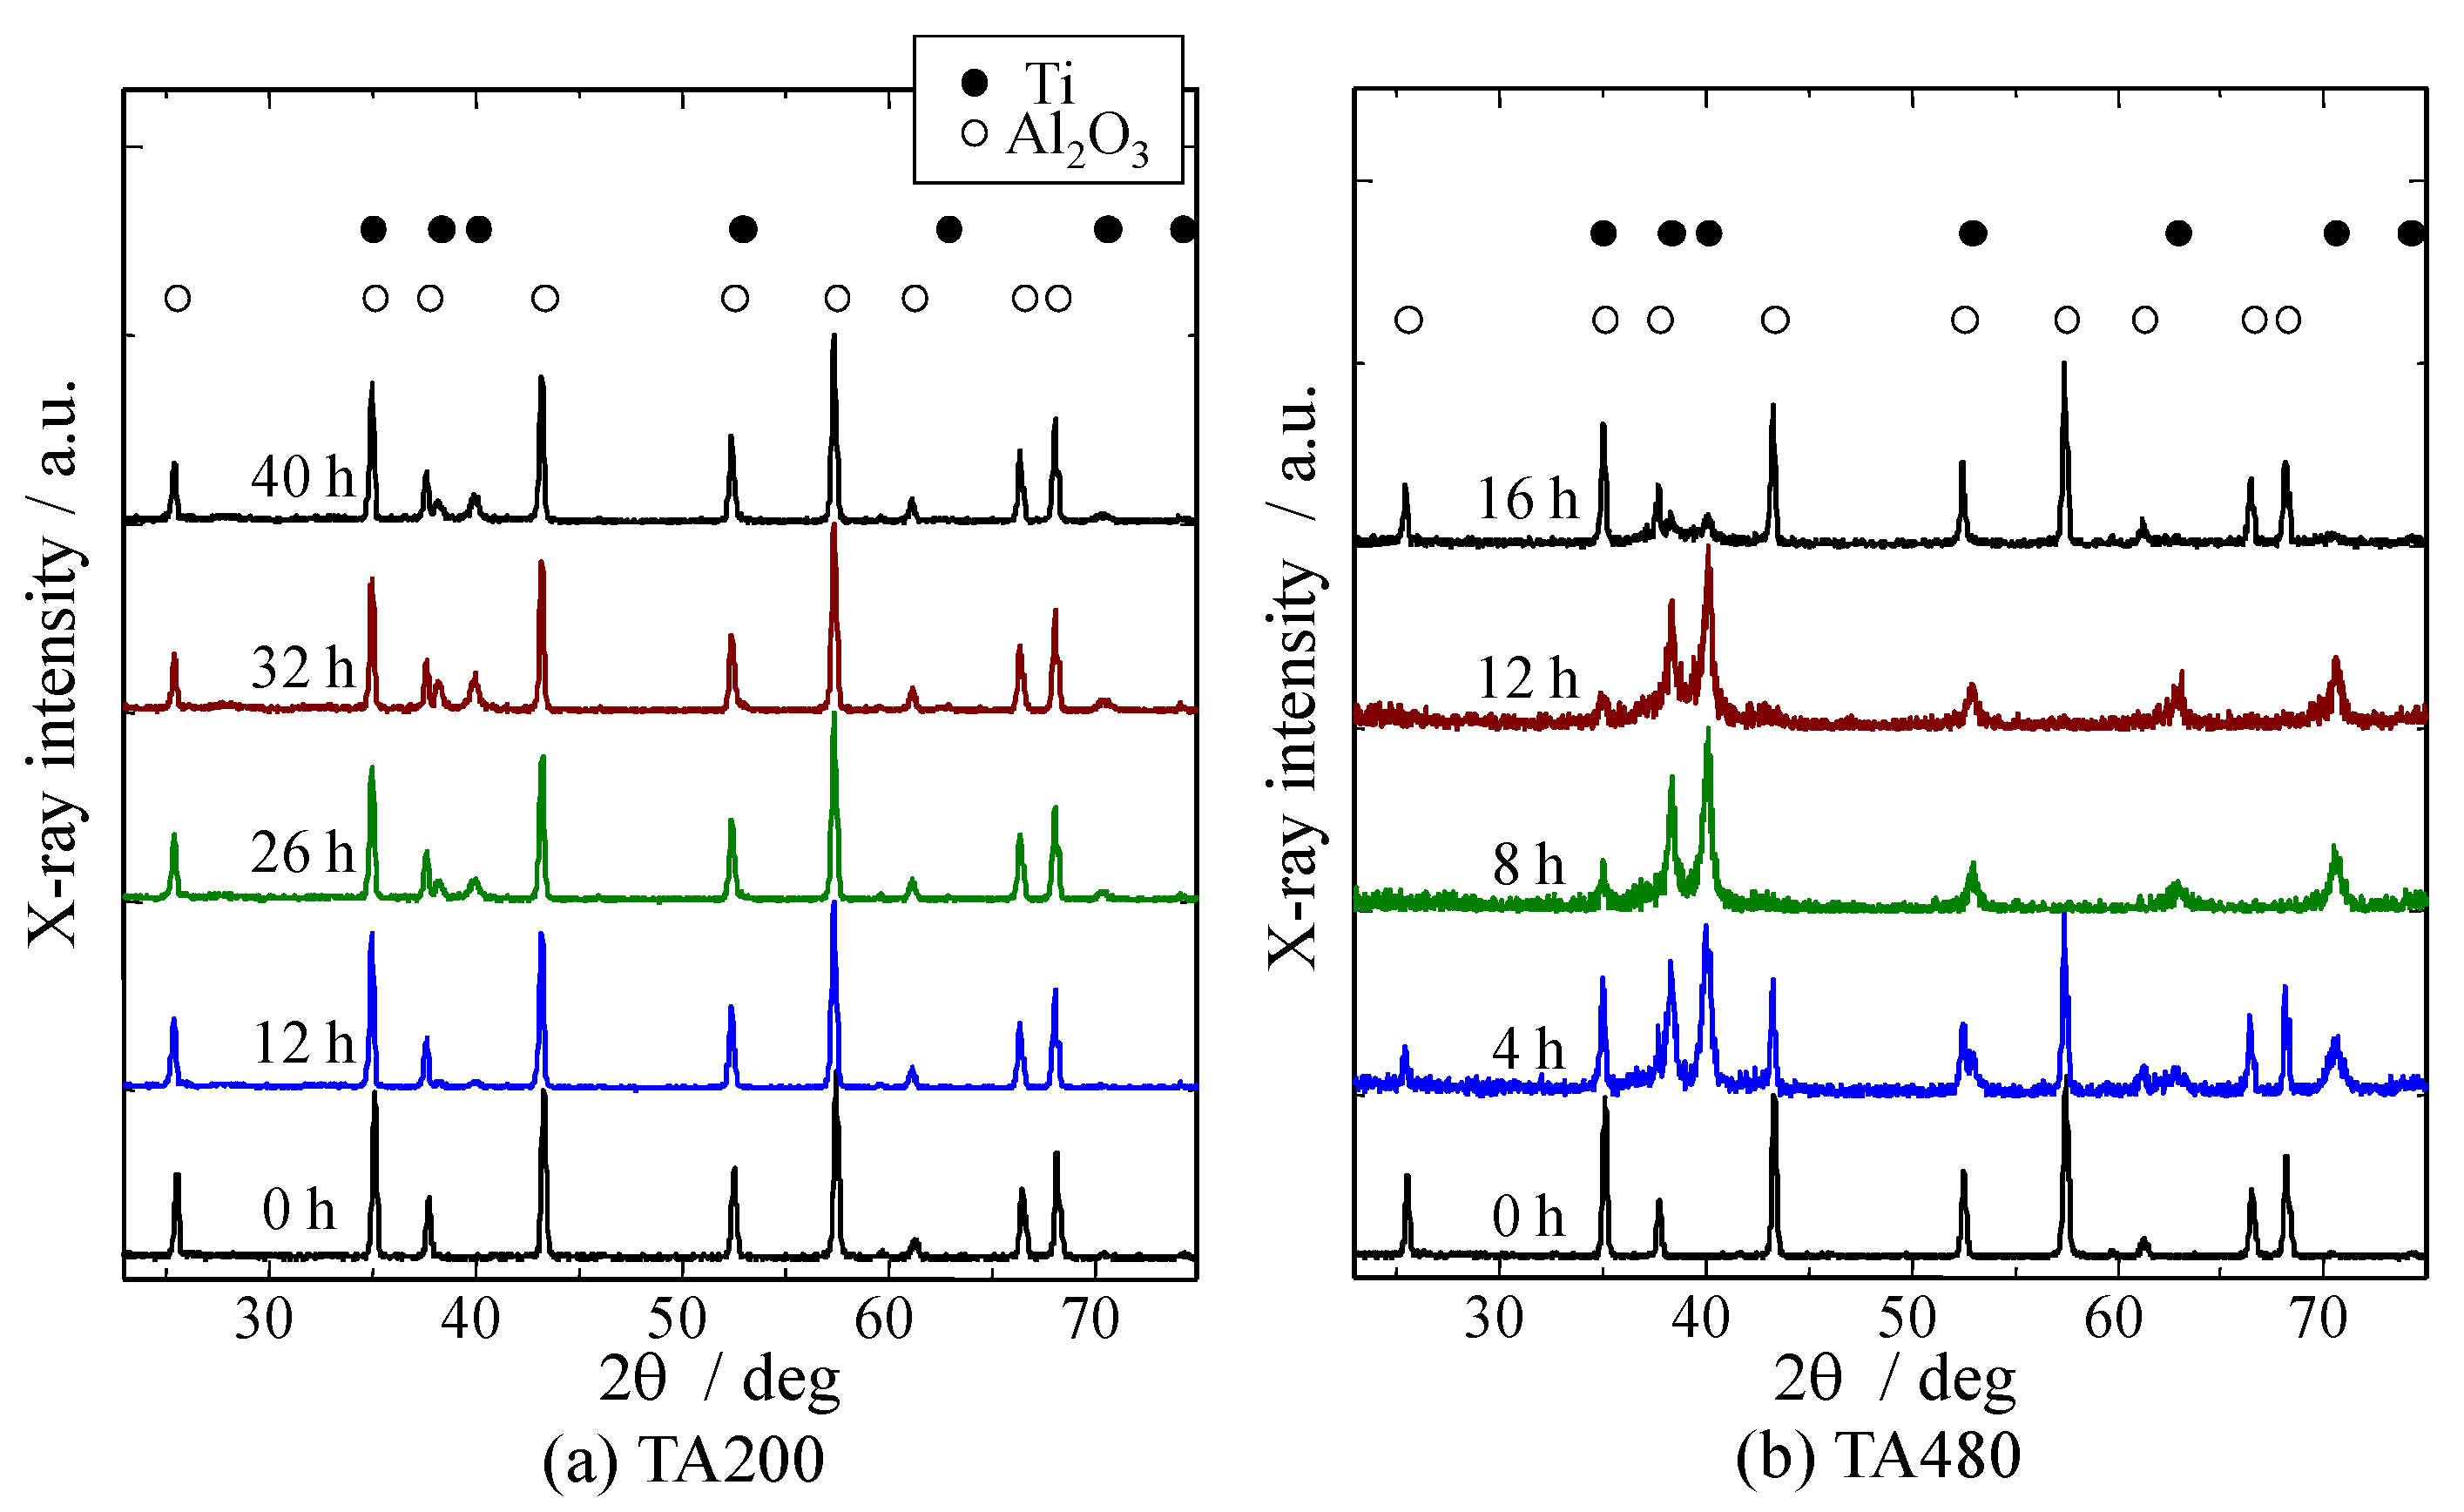
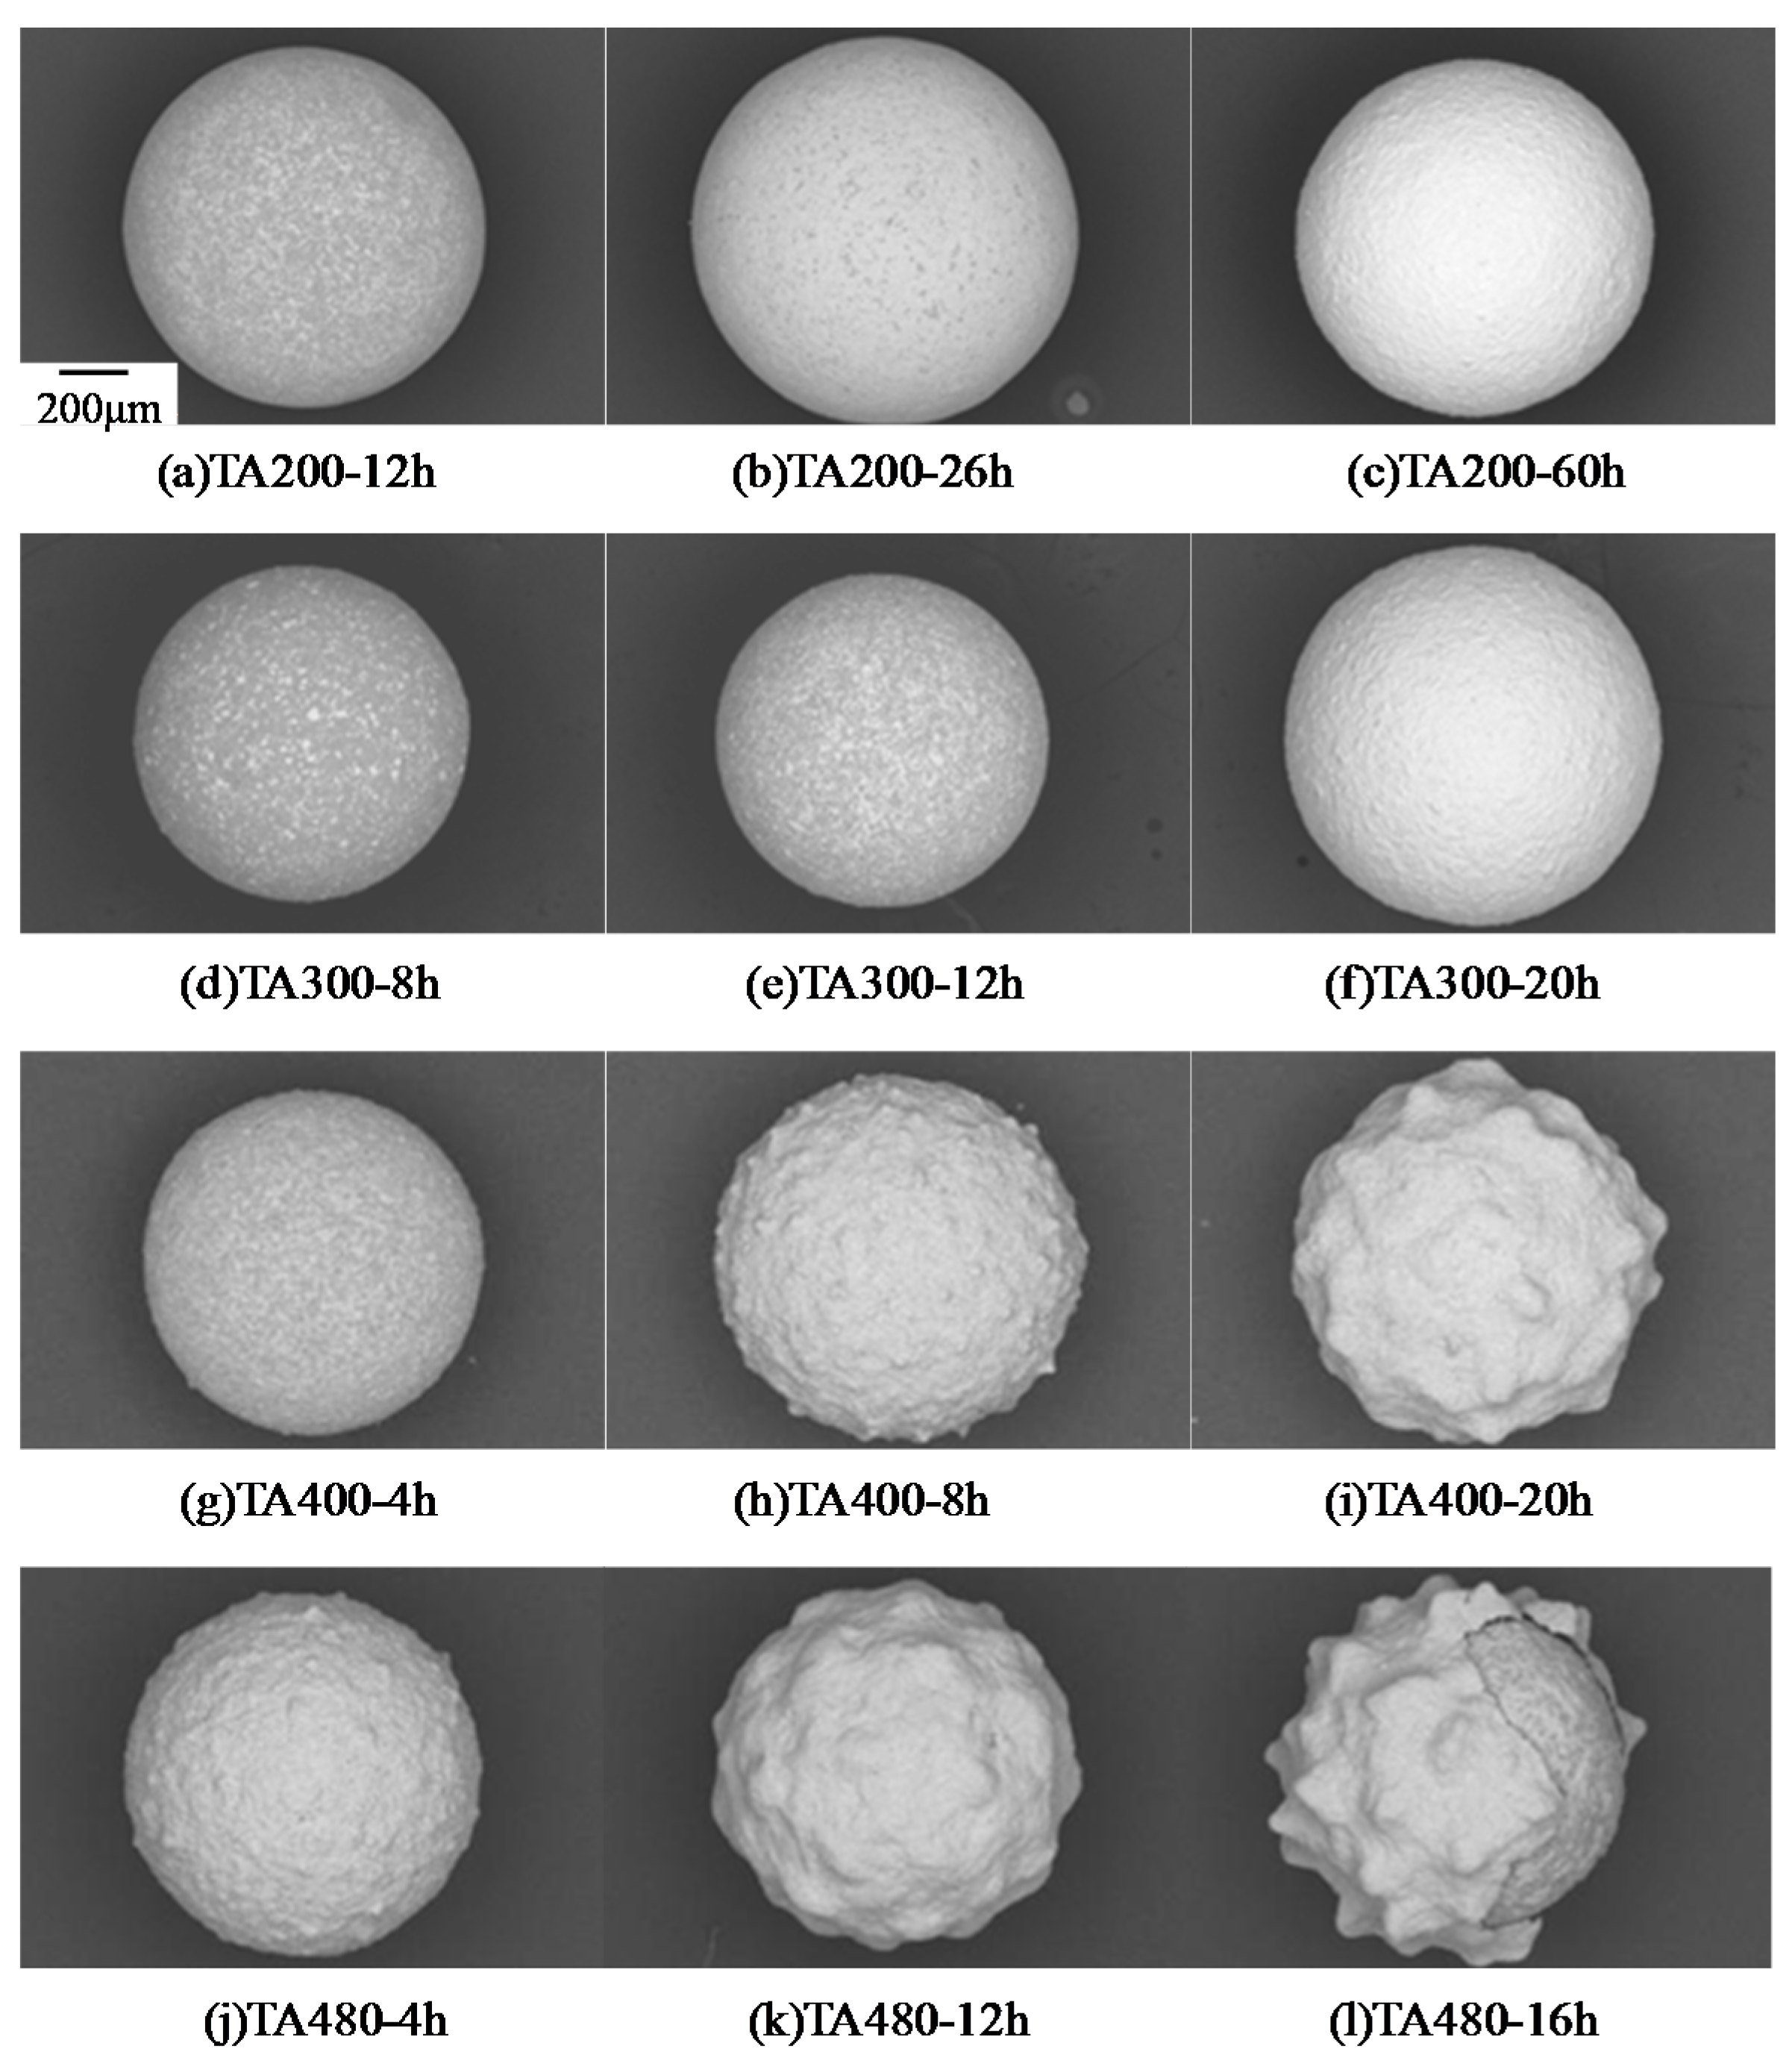
2.2.1. Coating Formation by MCT
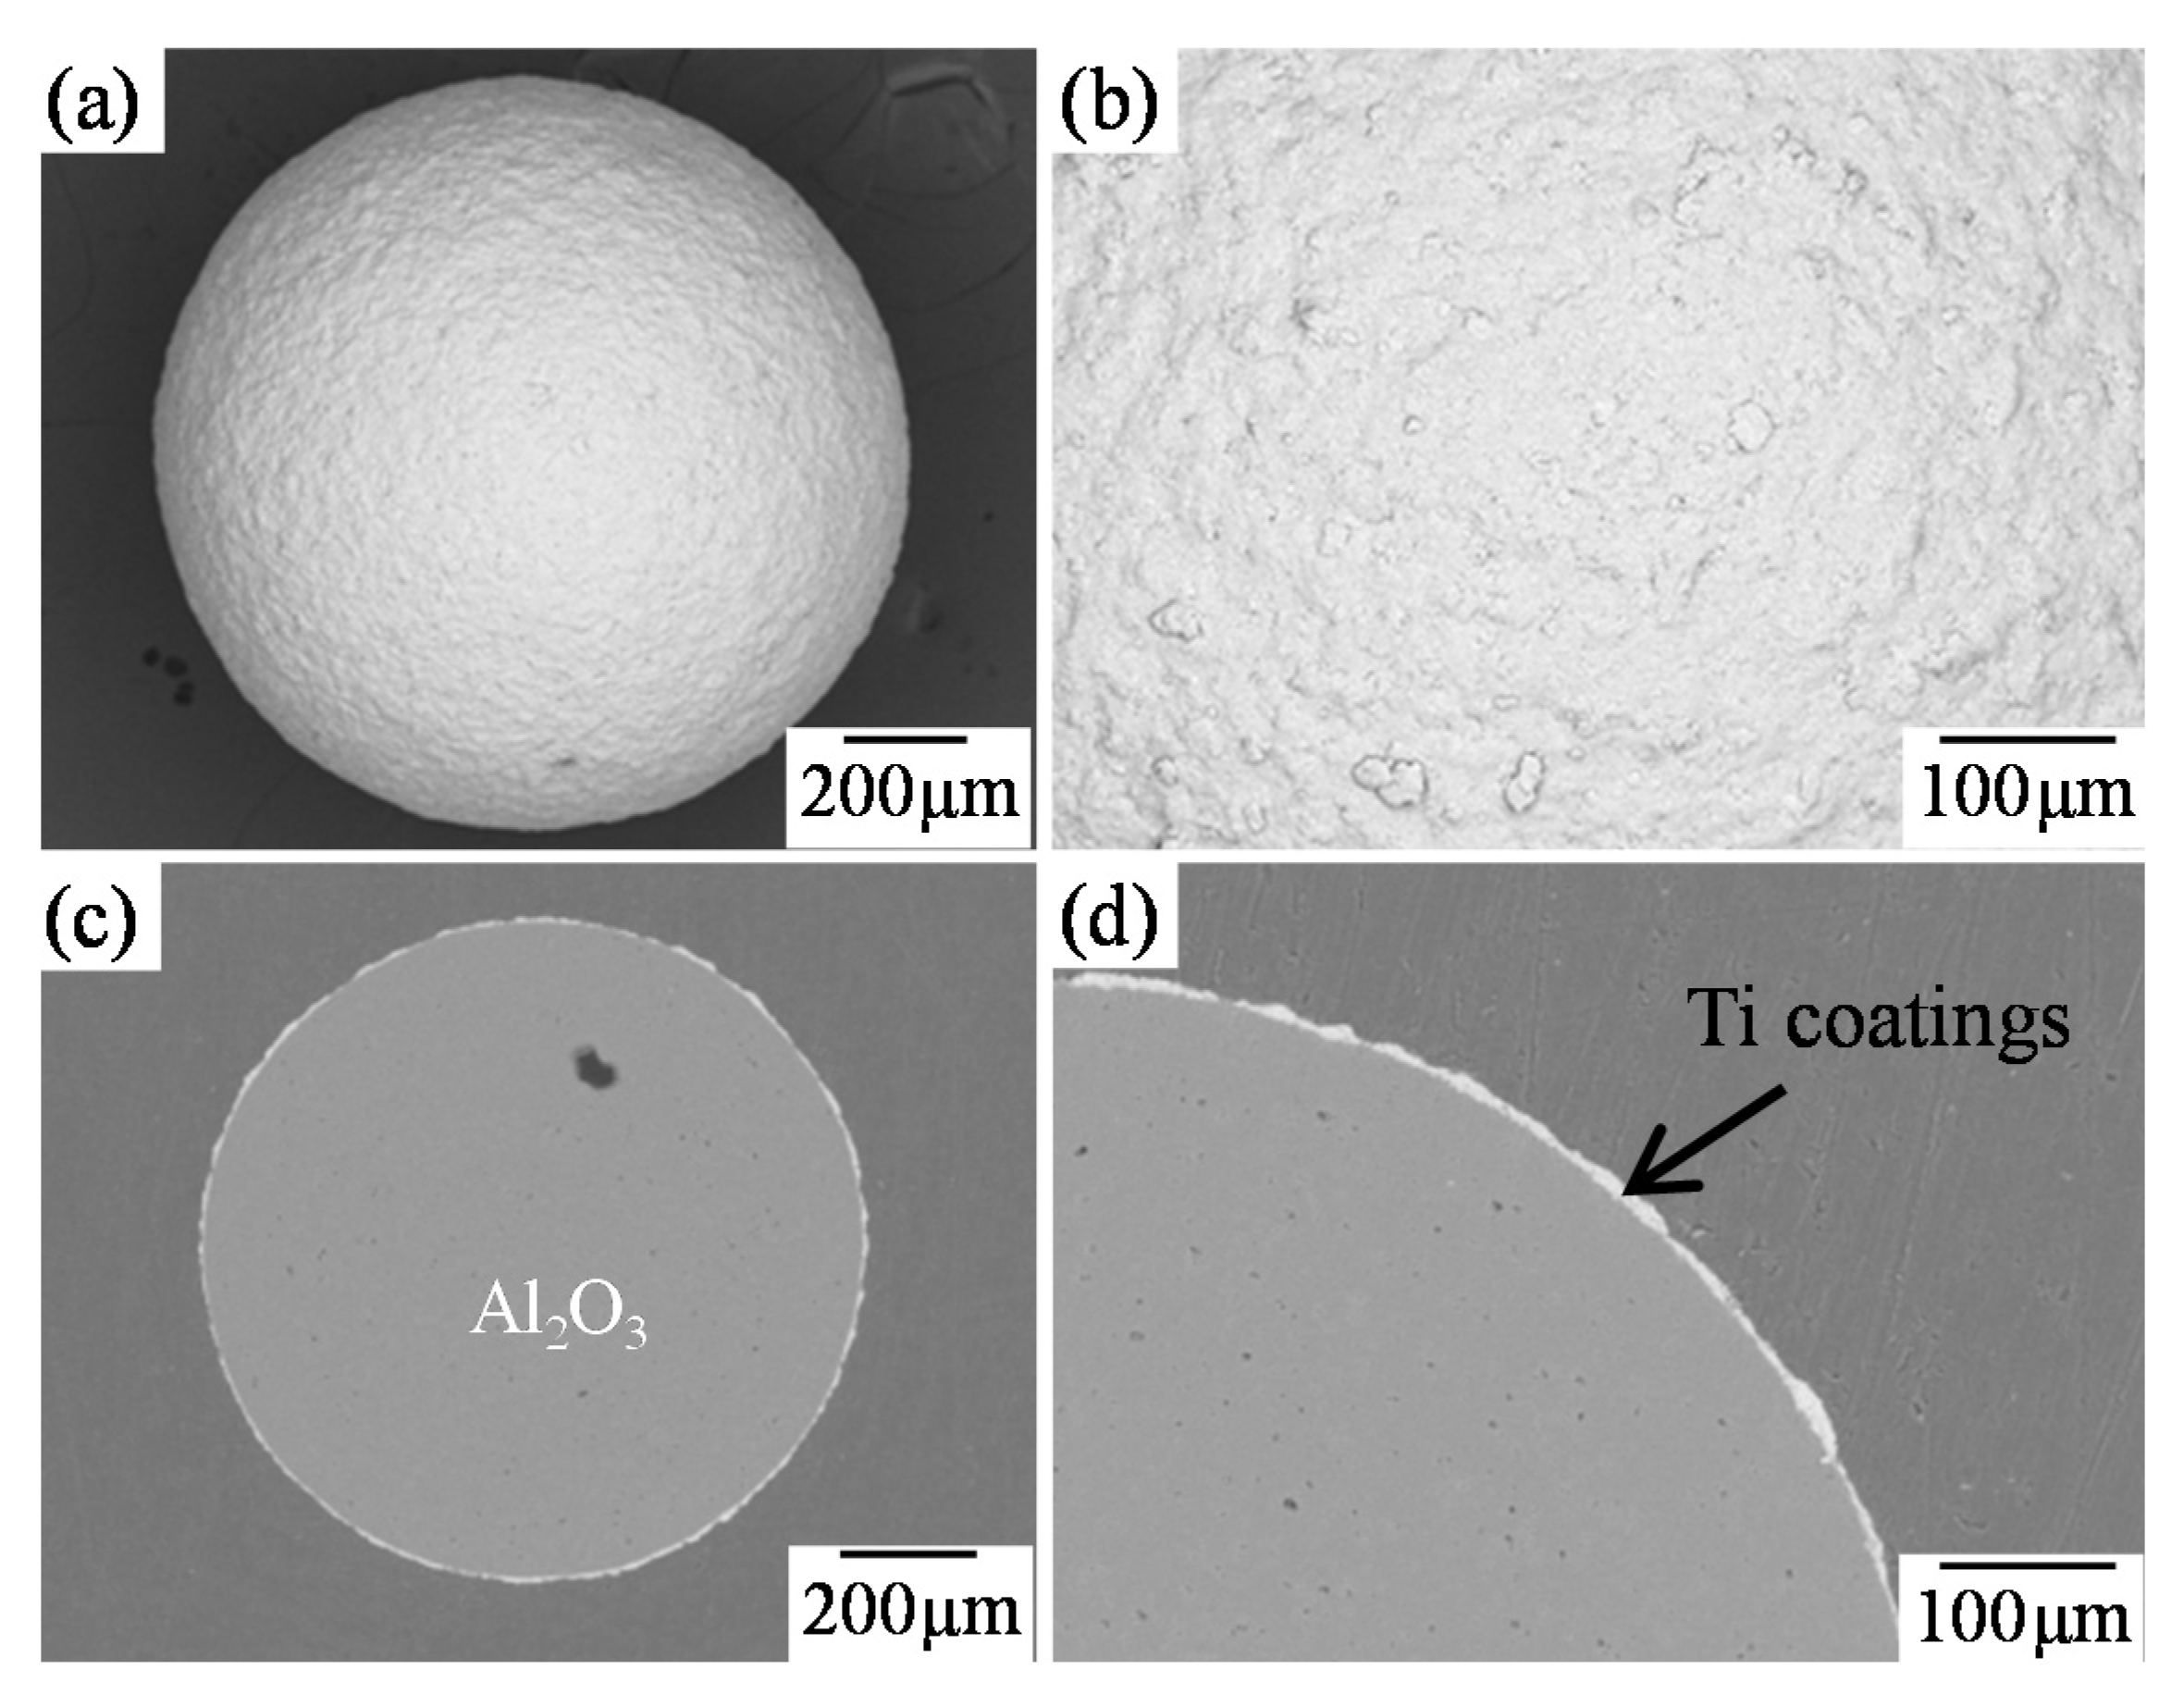
Ti Coatings by MCT

Figure 5 shows the appearances of Ti coatings on Al2O3 balls by MCT, with Ti powder (purity of 99.1%, average diameter of 30 μm) as coating materials, and Al2O3 balls (purity of 93.0%, average diameter of 1 mm) as substrates materials. It can be seen that the color of the Al2O3 balls changed from white to metallic gray, with extended MCT time. That means that more Ti powder particles adhered to the surfaces of the Al2O3 balls. Impact force of only about 1 G can be obtained during MCT performed by pot mill (as shown in Figure 1). When it is carried out by planetary ball mill (as shown in Figure 1), impact force over 10 G or even 40 G can be realized. Therefore, the required MCT time to form Ti coatings can be greatly shortened in the case of the planetary ball mill. With increases in the MCT time, the thickness of Ti coatings increased. The thickness evolution of Ti coatings during MCT was also monitored and is illustrated in Figure 6. Whether a pot mill or planetary ball mill, the coating thickness increased with the increase of MCT time, and they reached 10 and 12 μm, respectively, in pot mill and planetary ball mill after 1000 h and 26 h.
Figure 7 shows SEM images of Ti coatings on Al2O3 balls after MCT, with the MCT set as 300 rpm for 20 h. From Figure 7, it could be seen the Ti coatings had been formed on the Al2O3 balls by MCT, and the thickness of Ti coatings is about 10 μm (Figure 7d).
Figure 5. Appearance of Al2O3 balls by MCT. (a) By pot mill; (b) By planetary ball mill MCT.
Coatings 05 00425 g005
Figure 6. Thickness evolution of Ti coatings with MCT time. (a) By pot mill; (b) By planetary ball mill.
Coatings 05 00425 g006
Figure 7. Ti coatings by MCT at 300 rpm for 20 h. (a,b) Surface structure; (c,d) Cross sectional structure.
Coatings 05 00425 g007

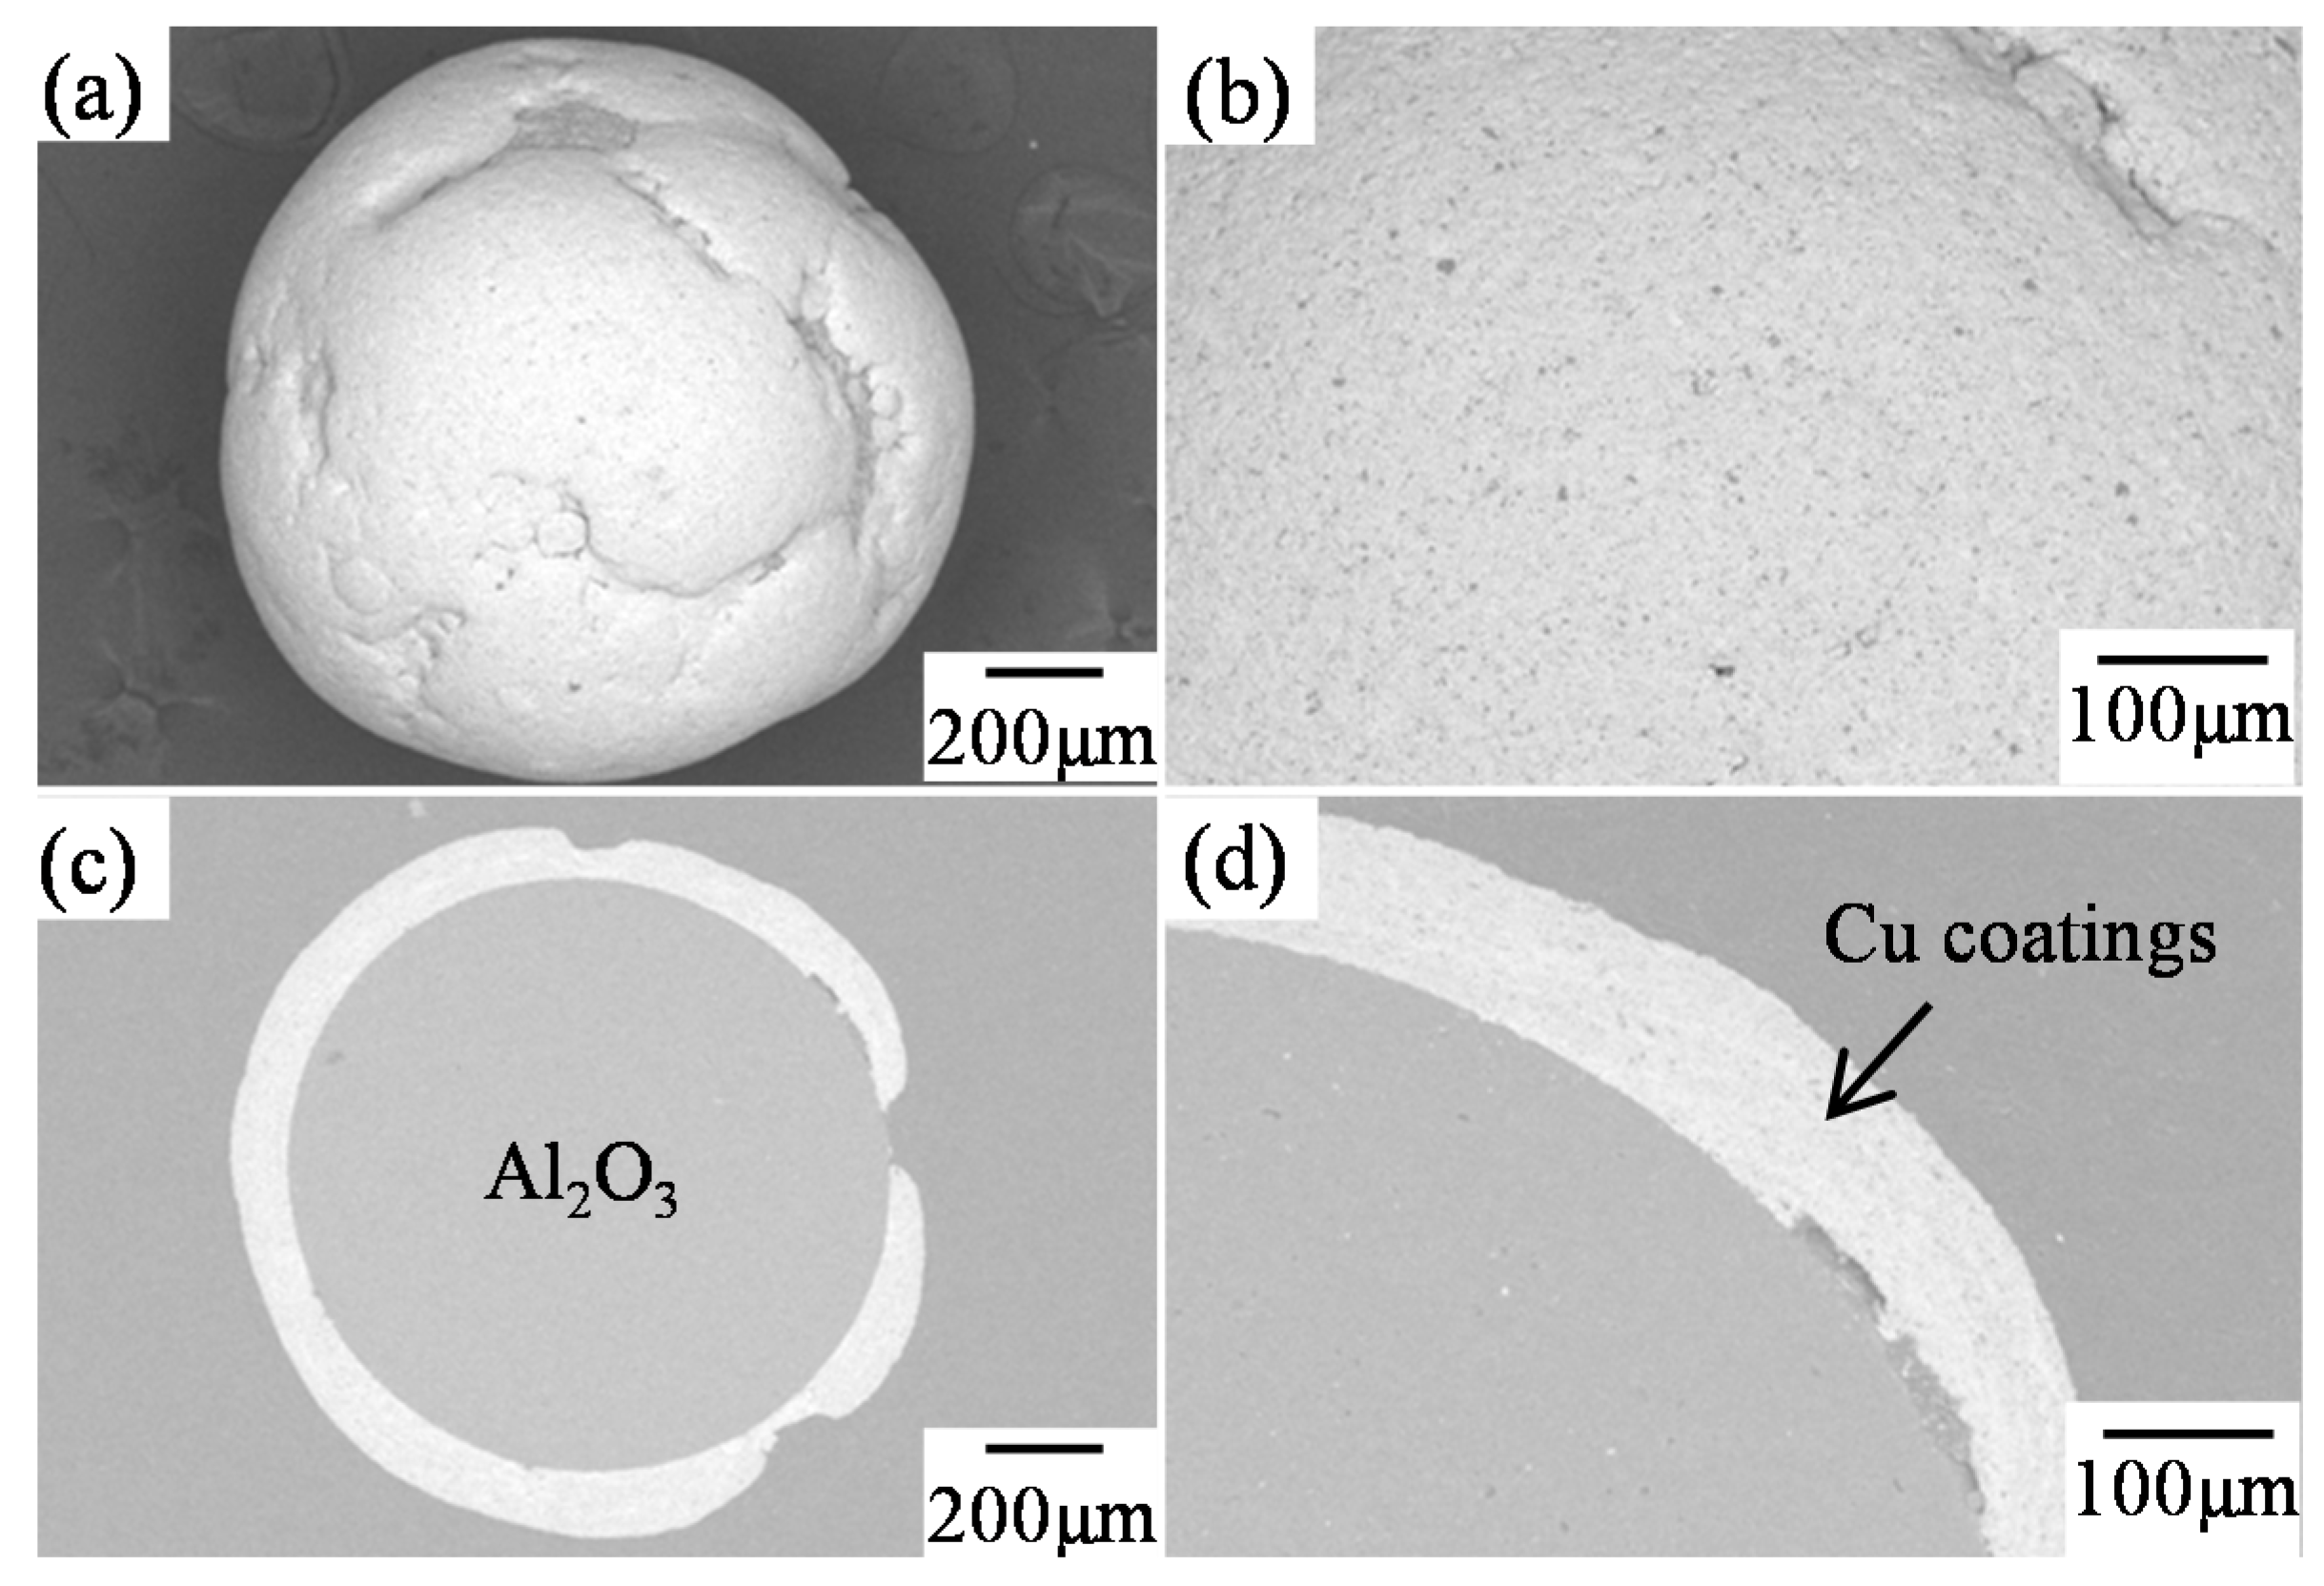
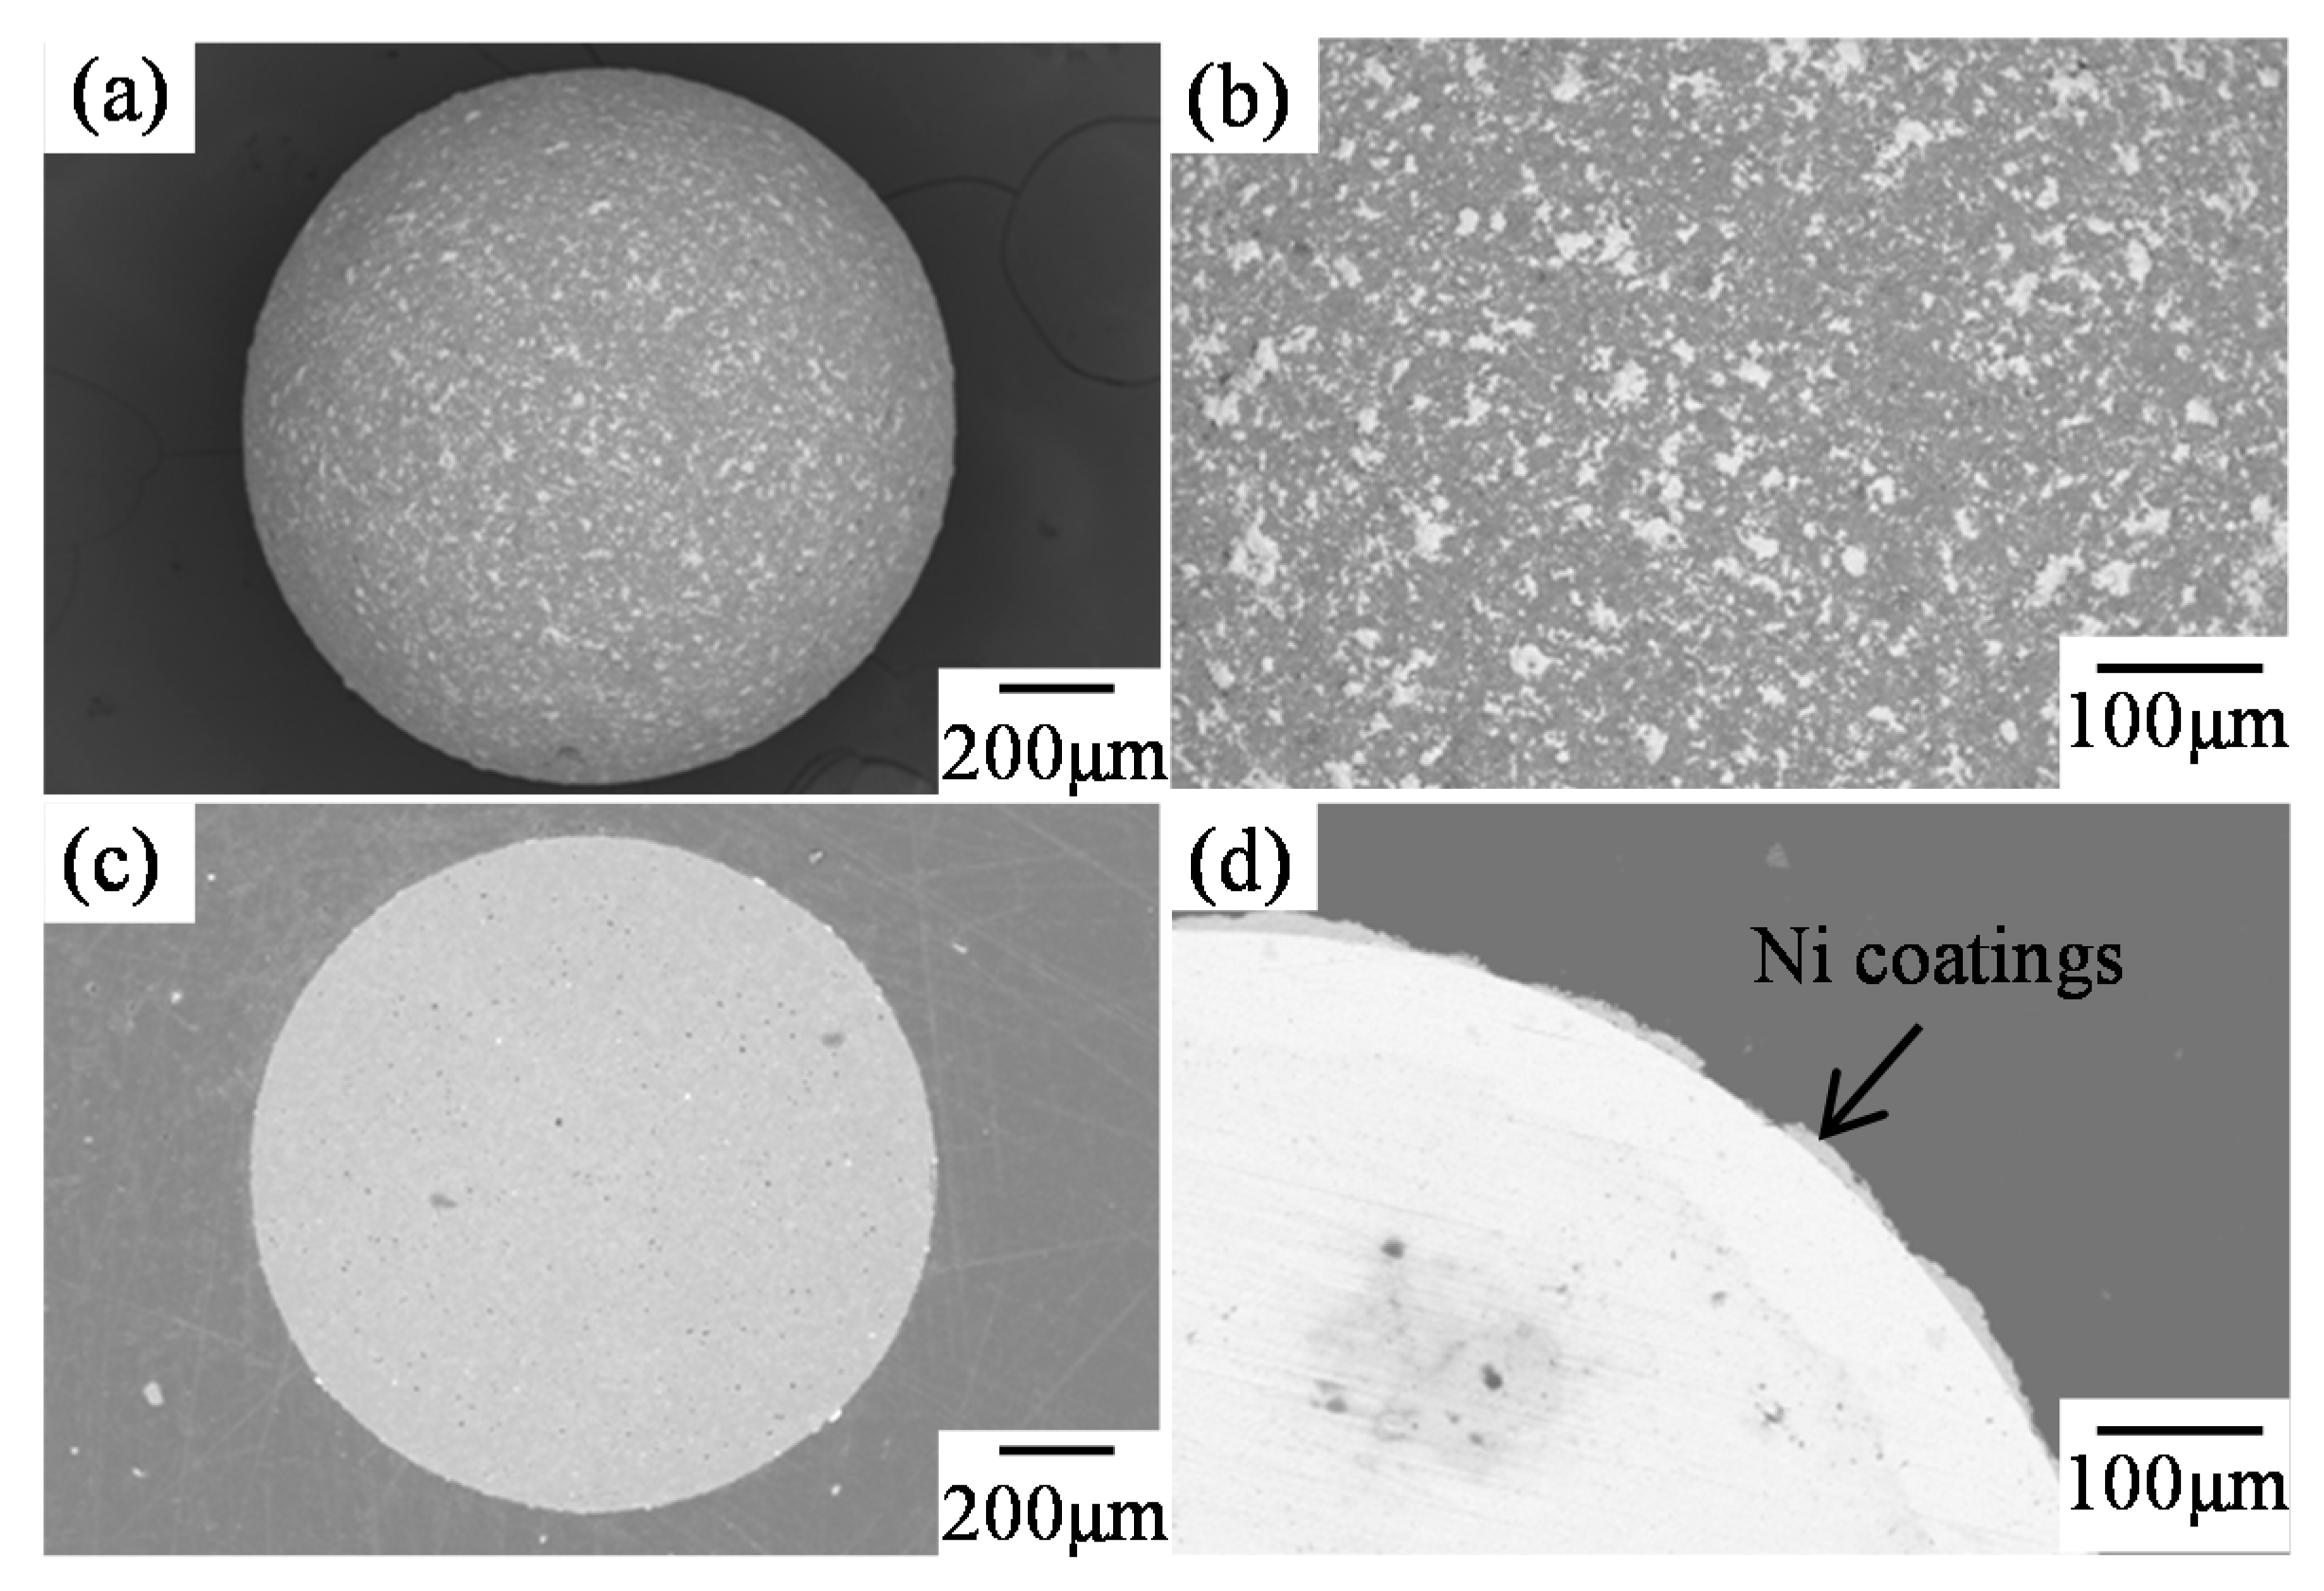
Coatings by MCT with Other Materials

Based on the Ti coatings fabricated by MCT, other metal coatings had been fabricated, shown as Table 2. Figure 8, Figure 9, Figure 10 and Figure 11 show SEM images of metal coatings fabricated by MCT. As shown in Figure 8, continuous Cu coatings were prepared on the whole although the surface of Al2O3 balls was not coated with Cu particles at some locations. The thickness of Cu coatings was uniform at about 80 μm.
In Figure 9, only discrete Ni powder particles coated on the surface of Al2O3 balls and continuous Ni coatings were not observed. It could be said that continuous Ni coatings cannot be formed in the present conditions.
As shown in Figure 10, continuous Fe coatings were basically formed on the surface of Al2O3 balls although some surface areas were not coated with Fe particles. The thickness of Fe coatings was confirmed to be about 6 μm.
As shown in Figure 11, continuous Zn coatings were formed, but the surface of Zn coatings was relatively uneven and bulges could be seen. The average thickness was measured to be about 75 μm. According to these results, the preliminary conclusion could be drawn that the coating formation of Cu and Zn is easier to achieve than that of Ni and Fe, with relatively longer MCT time (more than 10 h).
Table 2. Source materials’ parameters for metal coatings by MCT.
Source MaterialWeight (g)Average Diameter (mm)Purity (%)
Metal powderCu43.700.01099.8
Ti20.000.03099.1
Ni10.000.00599.8
Fe35.000.03599.5
Zn35.00<0.1899.8
Ceramic substrateAl2O3 balls30.001.093.0
Figure 8. Cu coatings by MCT at 480 rpm for 20 h. (a,b) Surface structure; (c,d) Cross sectional structure.
Coatings 05 00425 g008
Figure 9. Ni coatings by MCT at 480 rpm for 26 h. (a,b) Surface structure; (c,d) Cross sectional structure.
Coatings 05 00425 g009
Figure 10. Fe coatings by MCT at 300 rpm for 26 h. (a,b) Surface structure; (c,d) Cross sectional structure.
Coatings 05 00425 g010
Figure 11. Zn coatings by MCT at 300 rpm for 12 h. (a,b) Surface structure; (c,d) Cross sectional structure.
Coatings 05 00425 g011

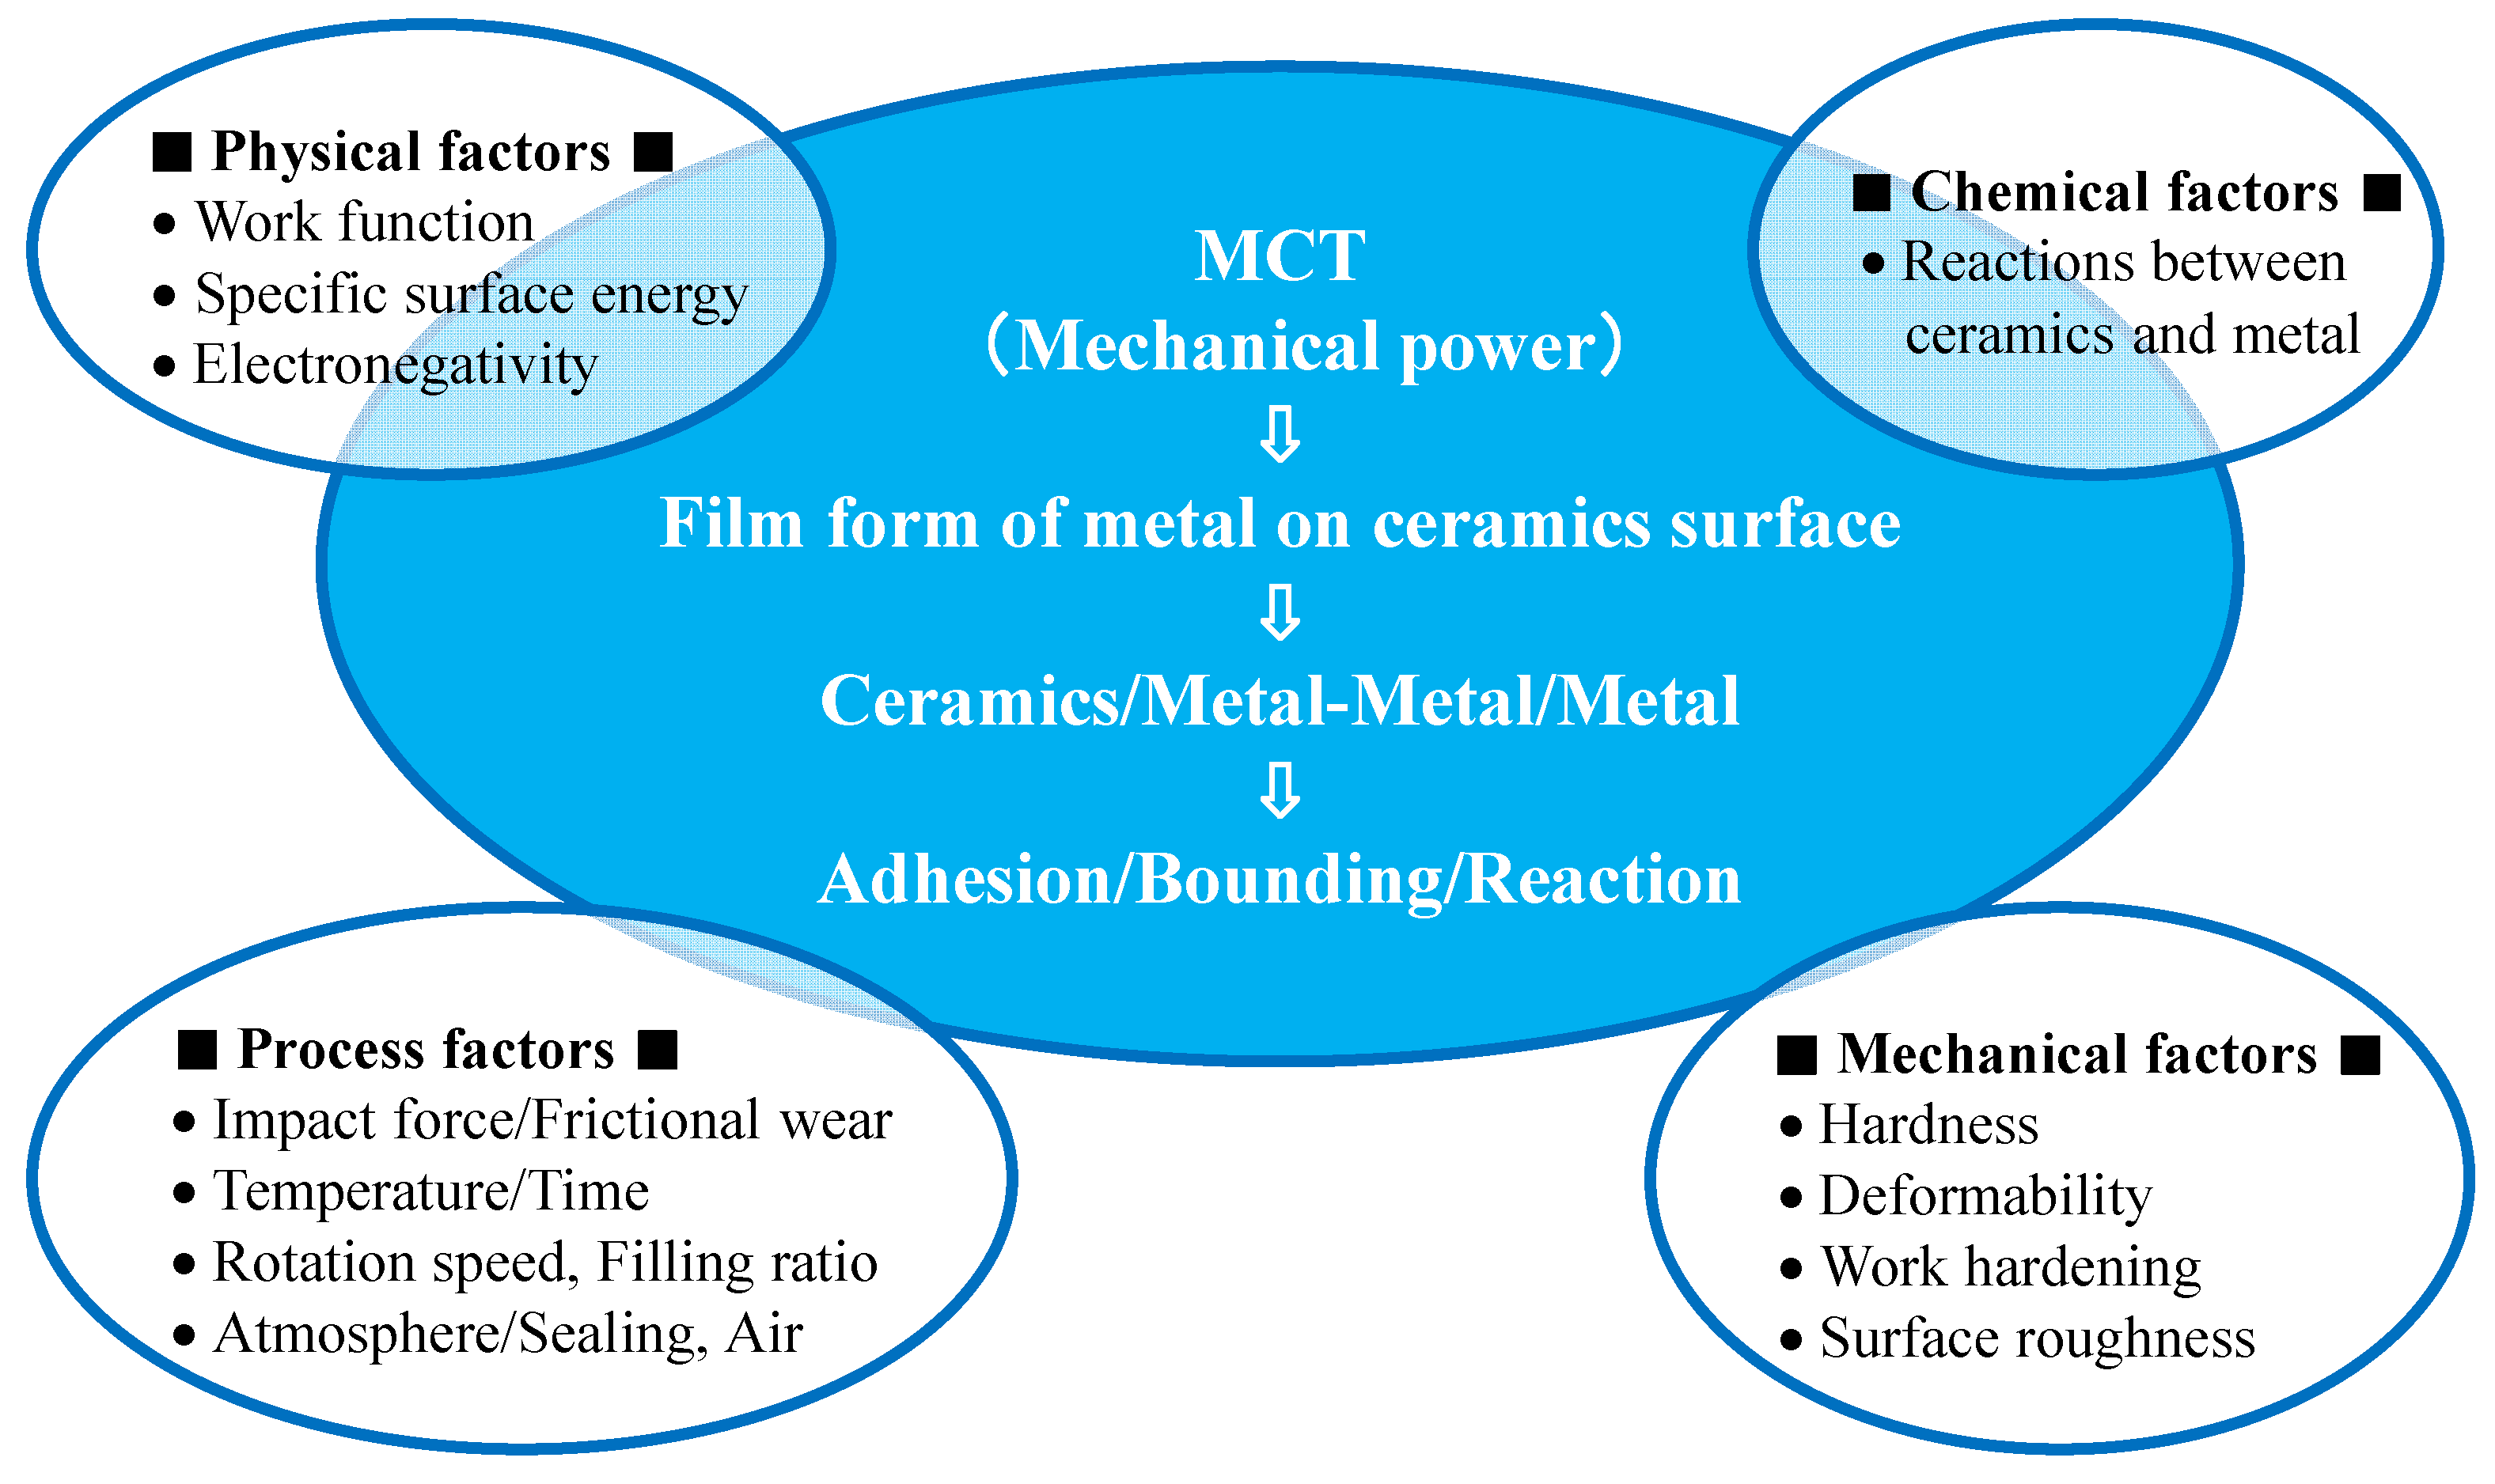
2.2.2. Influencing Parameters of MCT

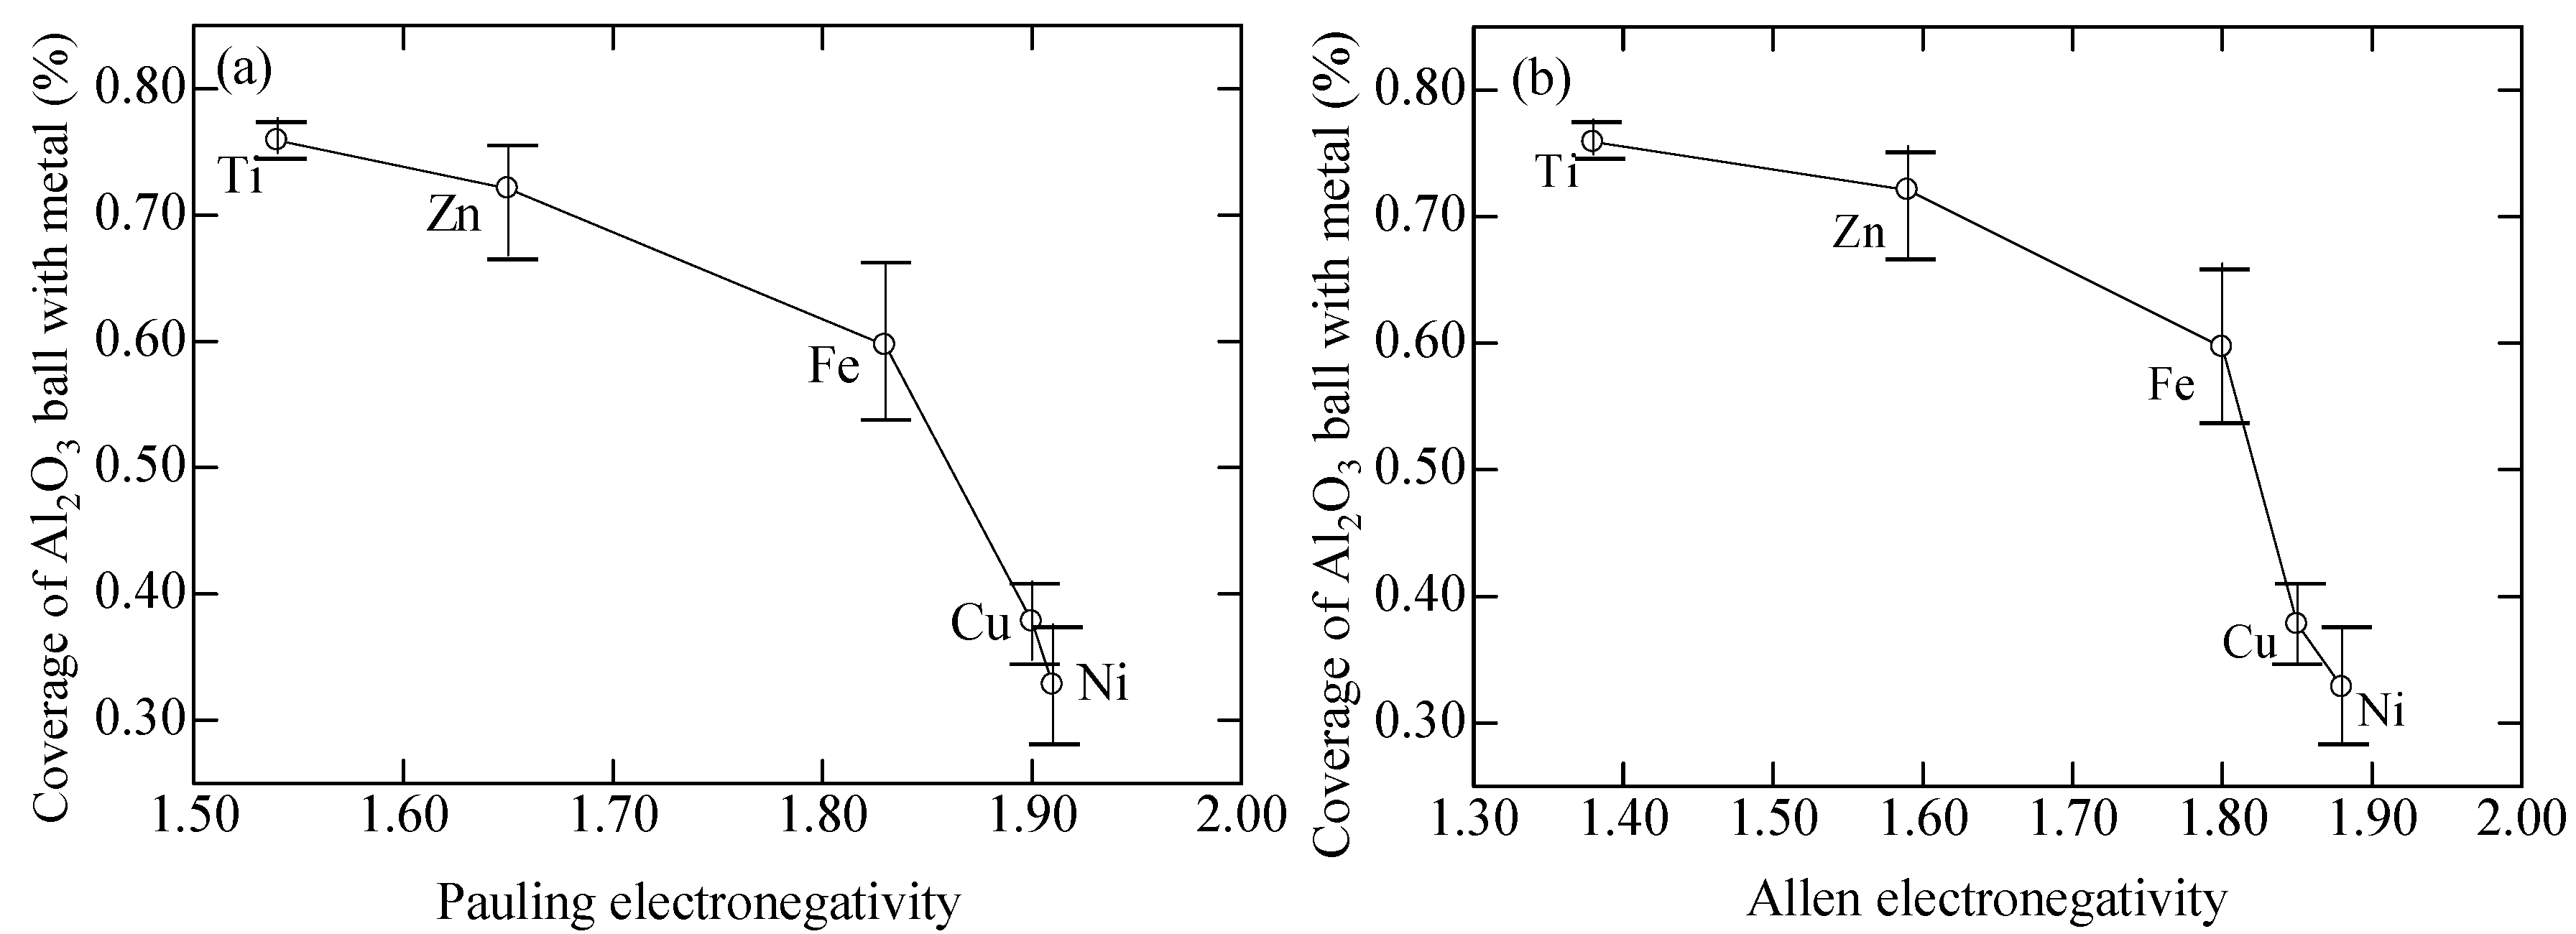
Electronegativity of Metal

In order to study the difficulty of coating formation by the different metals (Cu, Ti, Ni, Fe, and Zn), the adhesion of metal particles to the surface of Al2O3 balls at the initial stage of ball milling was investigated, by MCT at 300 rpm for 2 h, shown as Figure 12. The areas of light and dark colors correspond to metal and alumina, respectively. It can be clearly found that relatively fewer Cu and Ni particles adhered to the surfaces of Al2O3 balls compared with Ti, Fe, and Zn particles. The coverage of Al2O3 ball with metal was used to evaluate the adhesion difficulty of tiny metal particles to the surface of Al2O3 ball. The greater the coverage on the surface of Al2O3 ball, the easier the adhesion of the metal to the Al2O3 ball.
Figure 12. Surface SEM images of metal-coated Al2O3 balls by MCT.
Coatings 05 00425 g012
Electronegativity is defined as a measure of the ability of an atom in a molecule to attract electrons to itself [31]. The greater the electronegativity (either in Pauling or Allen scale), the easier the atom or the functional group attracts electrons to itself. When metals with a lower electronegativity contact ceramics or polymers, it becomes easier to transfer electrons to the ceramic or polymer. The resulting positive metal cations on the surface coupled with the image charges in Al2O3 produce a surface dipole layer resulting in a greater adhesive strength. This is the main reason why the metal with a lower electronegativity adheres more easily to the surface of the Al2O3 ball. Figure 13 shows the relationship between the initial coverage at 300 rpm for 2 h with metal and the electronegativity of metal. During relatively shorter MCT time (2 h), the coverage of the Al2O3 balls with metals is shown to range from a maximum to a minimum as: Ti > Zn > Fe > Cu > Ni, which is similar to other reports [32,33].
Figure 13. Relationship between coverage of Al2O3 ball with metal and electronegativity of the metal. (a) Pauling electronegativity; (b) Allen electronegativity.
Coatings 05 00425 g013

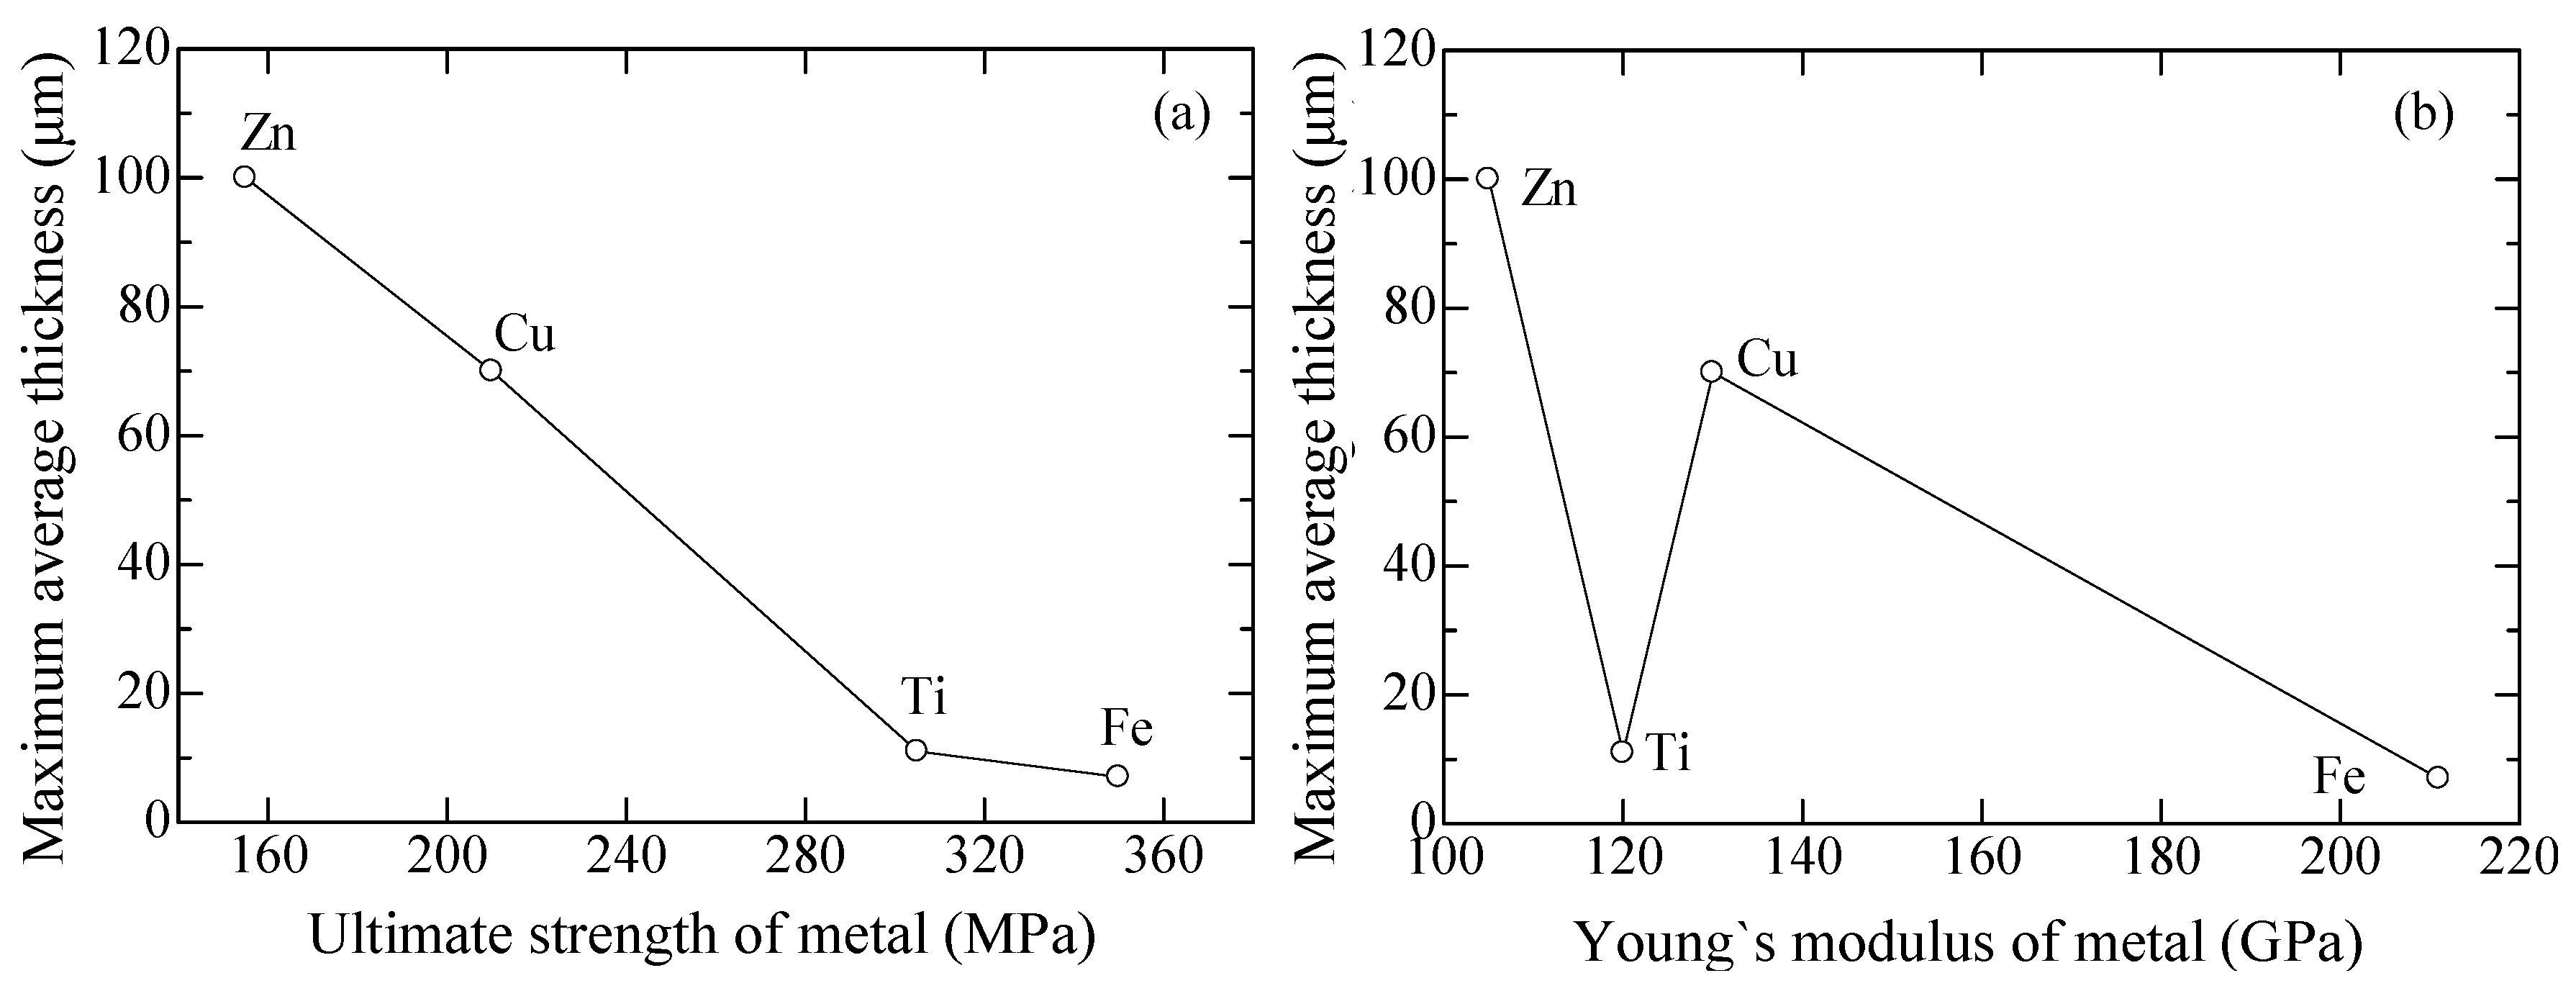
Plastic Deformability of Metal
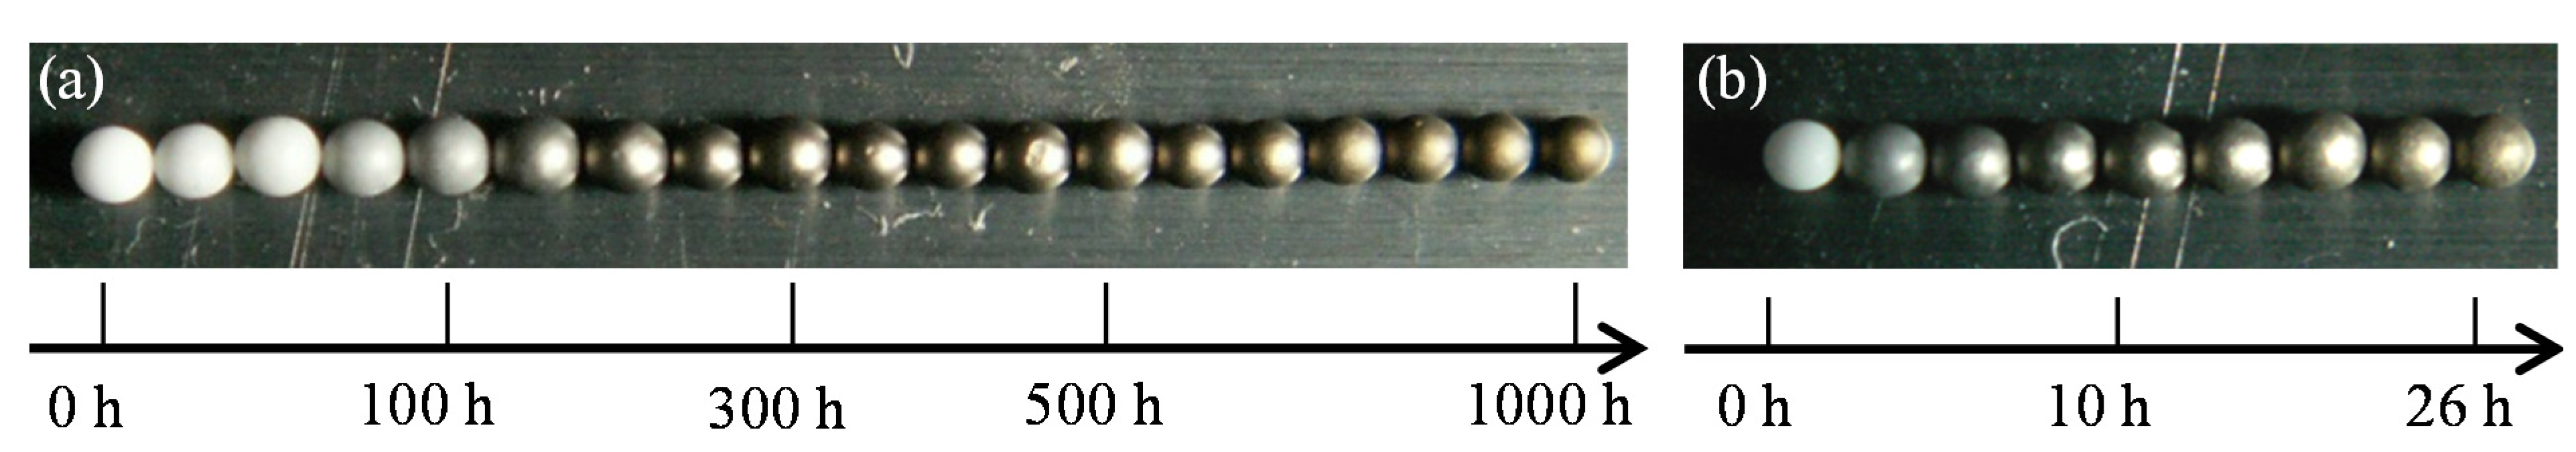
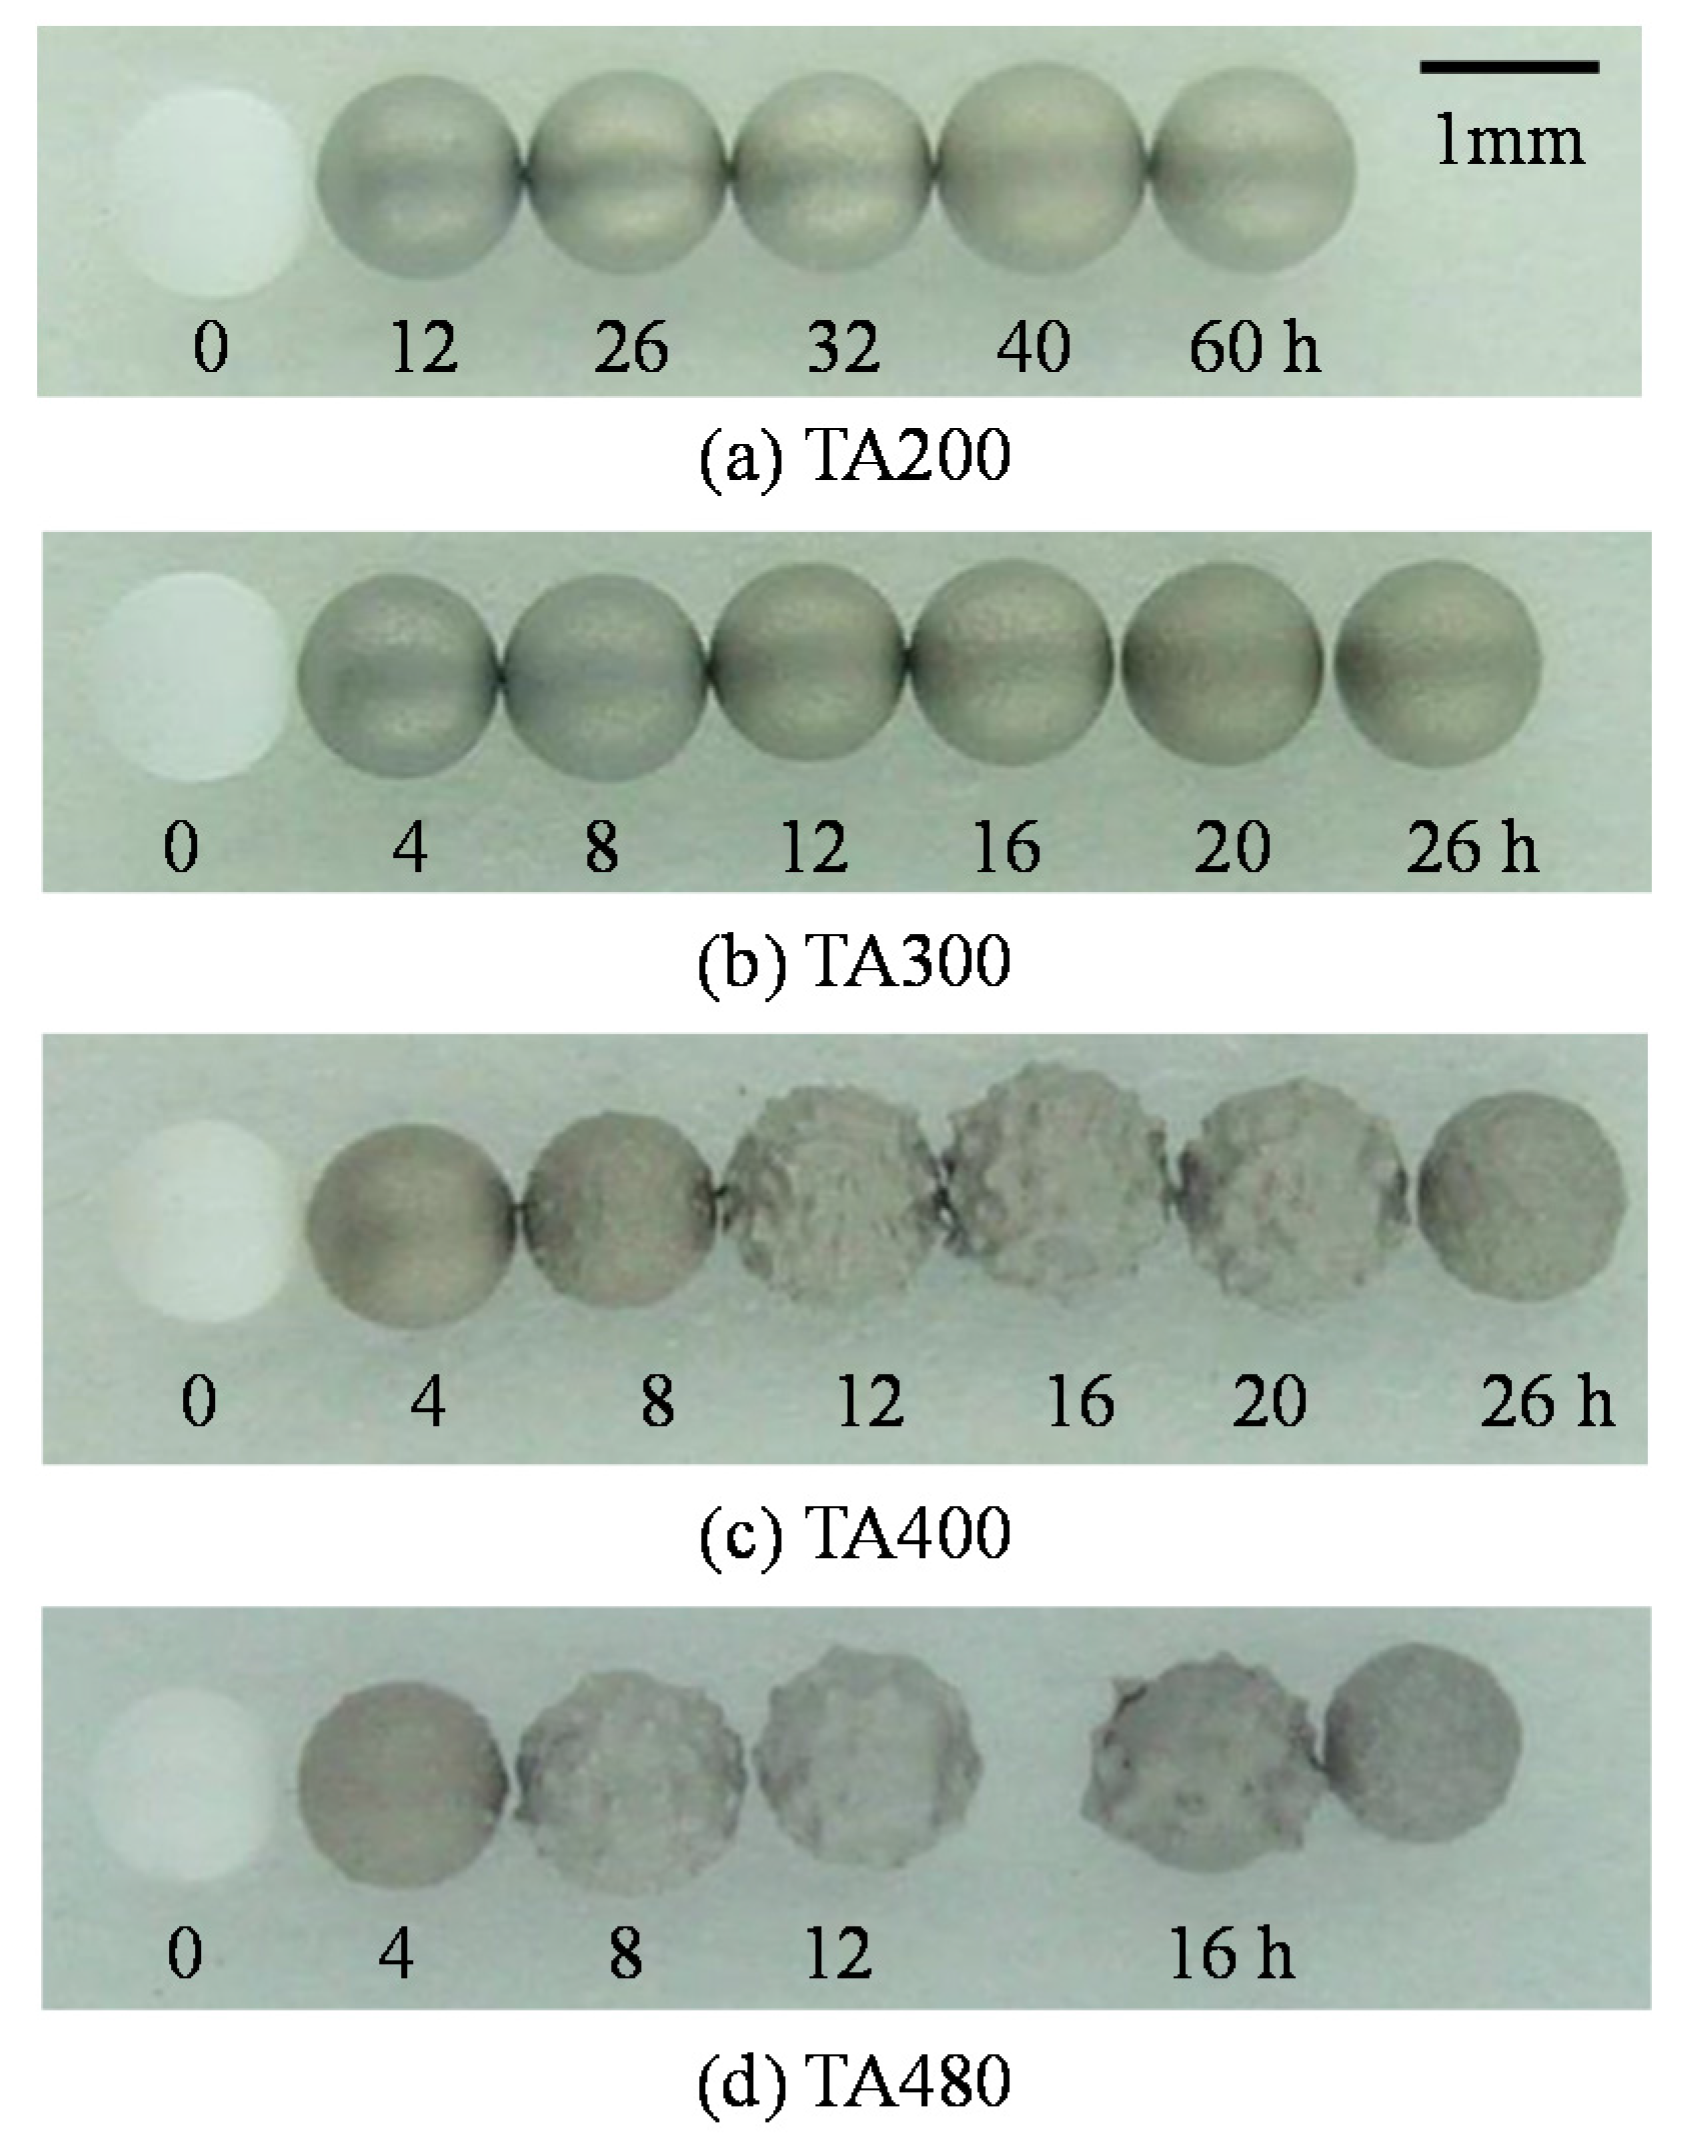
Generally, yield strength of the metal is used to characterize the plastic deformability of the metal. Metals with lower yield strength show better plastic deformability. Figure 14a shows the maximum average thicknesses of continuous metal coatings as function of the ultimate strength of the annealed metal. It is found that the thickness of continuous metal coatings decreased with an increase in ultimate strength. The order of the thickness varied from maximum to minimum as: Zn > Cu > Ti > Fe. Figure 14b represents the relationship between the maximum average thicknesses of continuous metal coatings and Young’s modulus of the annealed metals. The thickness decreased with an increase in Young’s modulus except Ti [34]. Therefore, we can conclude that the better the plastic deformability of the metal, the easier was the cold welding among the metal powder particles and the greater the thickness of the continuous metal coatings.
Figure 14. Relationship between maximum average thicknesses of continuous metal coatings. (a) Ultimate strength of annealed metals; (b) Young’s modulus of annealed metals.
Coatings 05 00425 g014

MCT Speed and Time

In order to study the influence of MCT speed and time on the coating formation during the MCT process, Ti powder was used as the coating material and Al2O3 balls were used as the substrates. Forty grams of Ti powder and 60 g Al2O3 balls were charged to an alumina bowl with a volume of 250 mL. A planetary ball mill was employed to perform the mechanical coating operation. The rotation speed of the planetary ball mill (MCT speed) was set from 200 to 480 rpm for a series of milling time (MCT time), as shown in Table 3, with a 10-min milling operation and a following 2-min cooling interval to prevent the bowl from overheating. The prepared samples were labeled as follows. “TAx-yh” is the sample fabricated with Ti powder by MCT at x rpm for y hour.
Table 3. Experimental conditions for fabricating Ti coatings by MCT.
SampleMCT Speed, x (rpm)MCT Time, y (h)Collision Power (×109 J·m−2·s−1 )φ (Hz)Collision Strength (×109 N·m−2·s−1 )
TA200-yh20012, 26, 32, 40, 6013.5914.0961.57
TA300-yh3004, 8, 12, 16, 20, 26, 32, 4023.9121.15108.50
TA400-yh4004, 8, 12, 16, 20, 2635.8328.21162.49
TA480-yh4804, 8, 12, 1646.3333.84210.15
The samples of TAx-yh after MCT show metallic color, shown in Figure 15. At relatively lower MCT speed, the surface is smooth and the speed of coating formation is slow. When increasing the MCT speed, the speed of coating formation accelerated and the surface became uneven, which was caused by higher collision power, frequency and strength, shown in Table 3 [35].
Figure 16 shows the XRD patterns of the samples of TAx-yh. At 200 rpm, the diffraction peaks of Ti are clearly detected after 26 h, while at 480 rpm, the peaks of Ti could be detected only after 4 h. The peaks of Al2O3 could not be detected after 8 h at 480 rpm, which means the whole surface of Al2O3 balls had been coated with Ti. The influence of MCT speed on coating formation matches the appearance (color) of samples.
Figure 15. Appearance of the samples.
Coatings 05 00425 g015
Figure 16. XRD patterns of the samples.
Coatings 05 00425 g016
The SEM images of TAx-yh samples are shown in Figure 17. When increasing the MCT time, the coatings grew at each MCT speed, which hints that the required time for preparing Ti coatings is shortened, with higher MCT speed by MCT. While at relatively higher speed, the surface of coatings became uneven, and Ti coatings were finally exfoliated from Al2O3 balls when the MCT speed up to 480 rpm for 16 h, shown as Figure 17.
Compared with the cross-sections of samples at different MCT speeds, shown as Figure 18, the Ti coatings became uneven, thickened and formed cracks, even with a shorter time at a relatively higher MCT speed.
Figure 17. SEM images of the surface of the samples.
Coatings 05 00425 g017
Figure 18. SEM images of cross-sectional structure of the samples.
Coatings 05 00425 g018

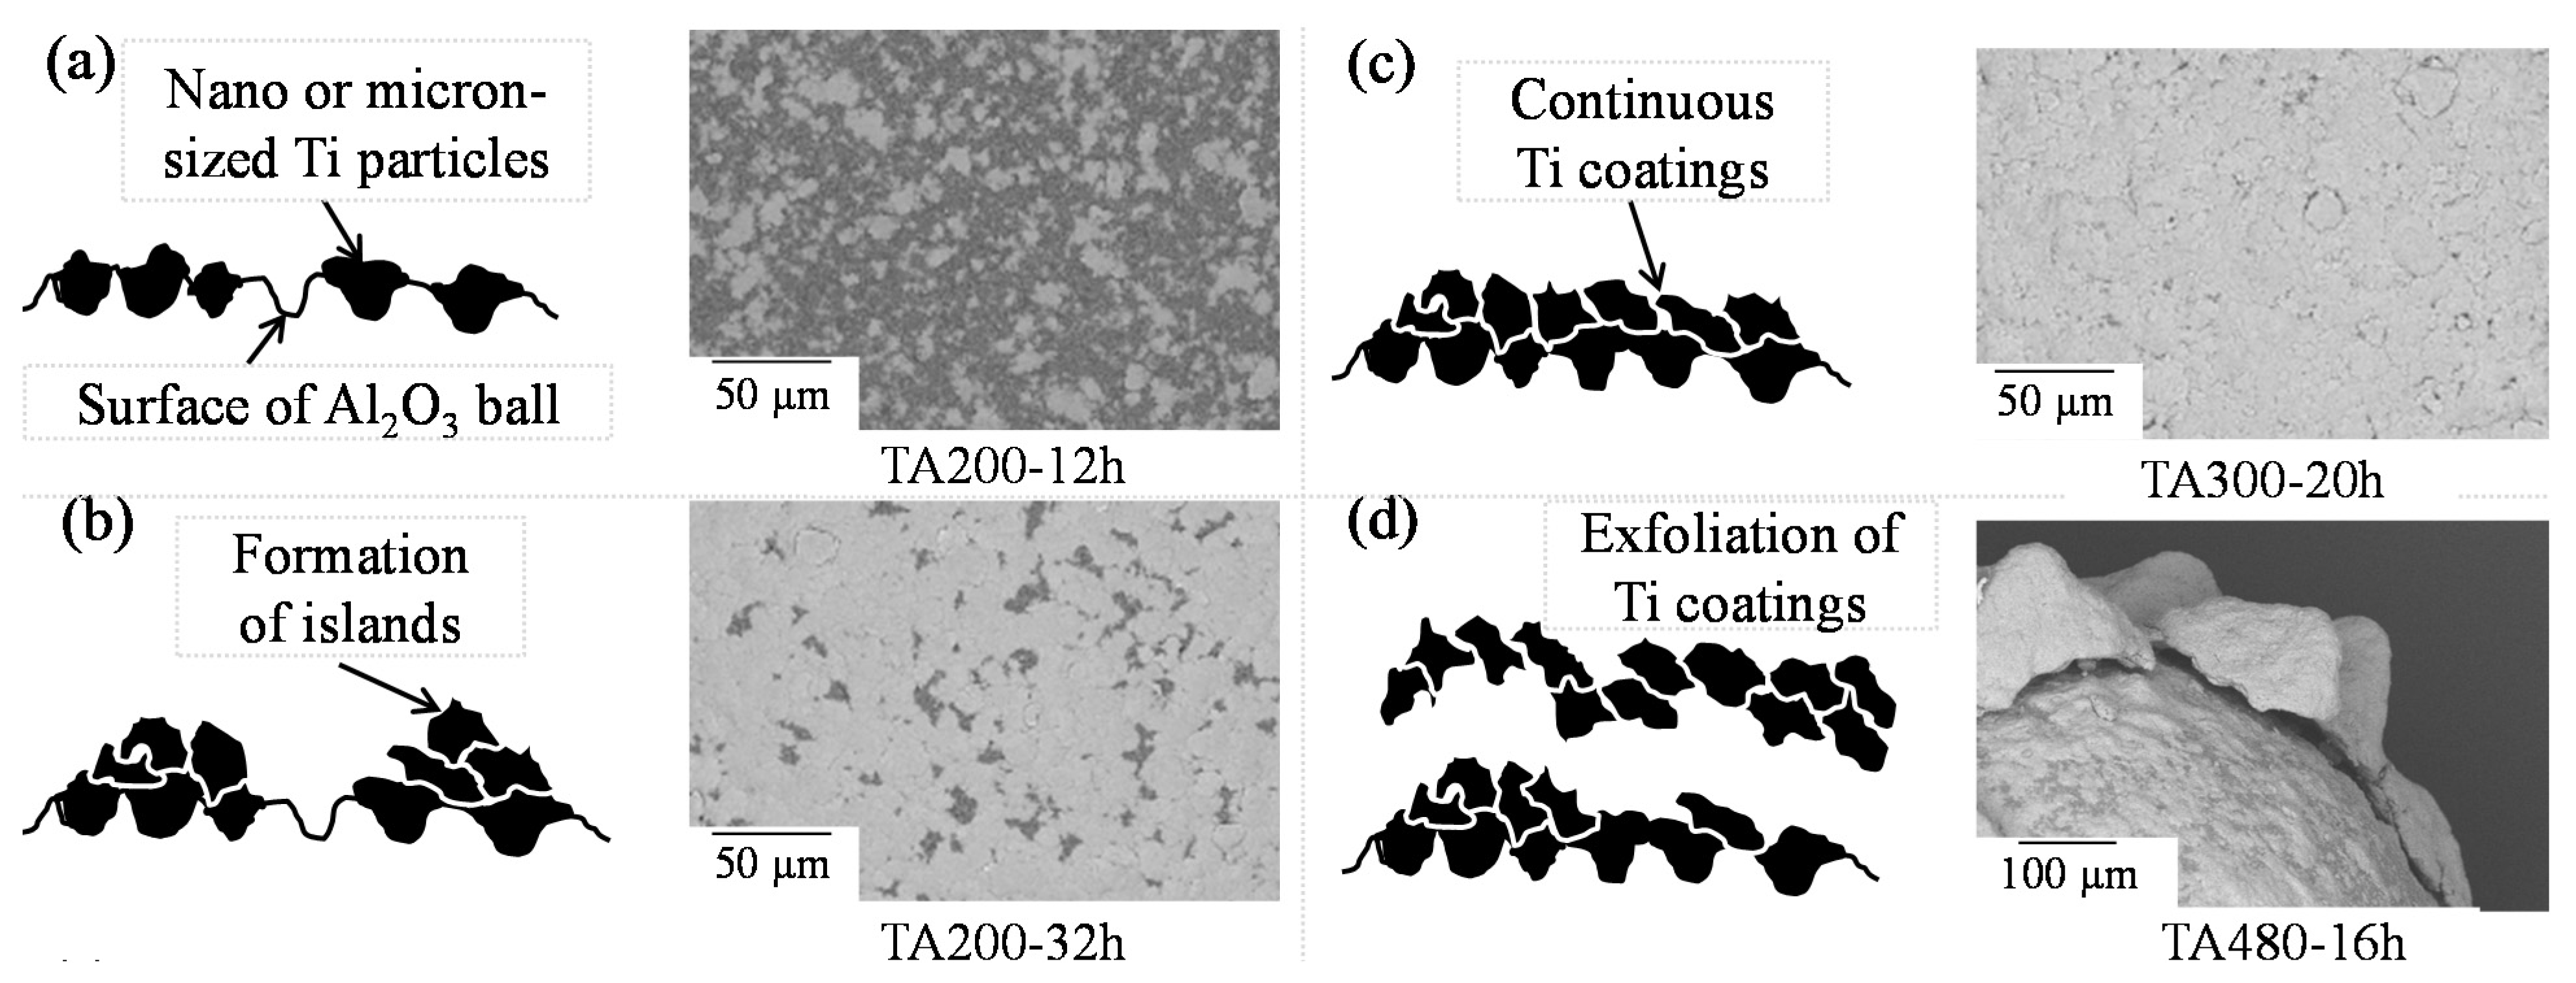
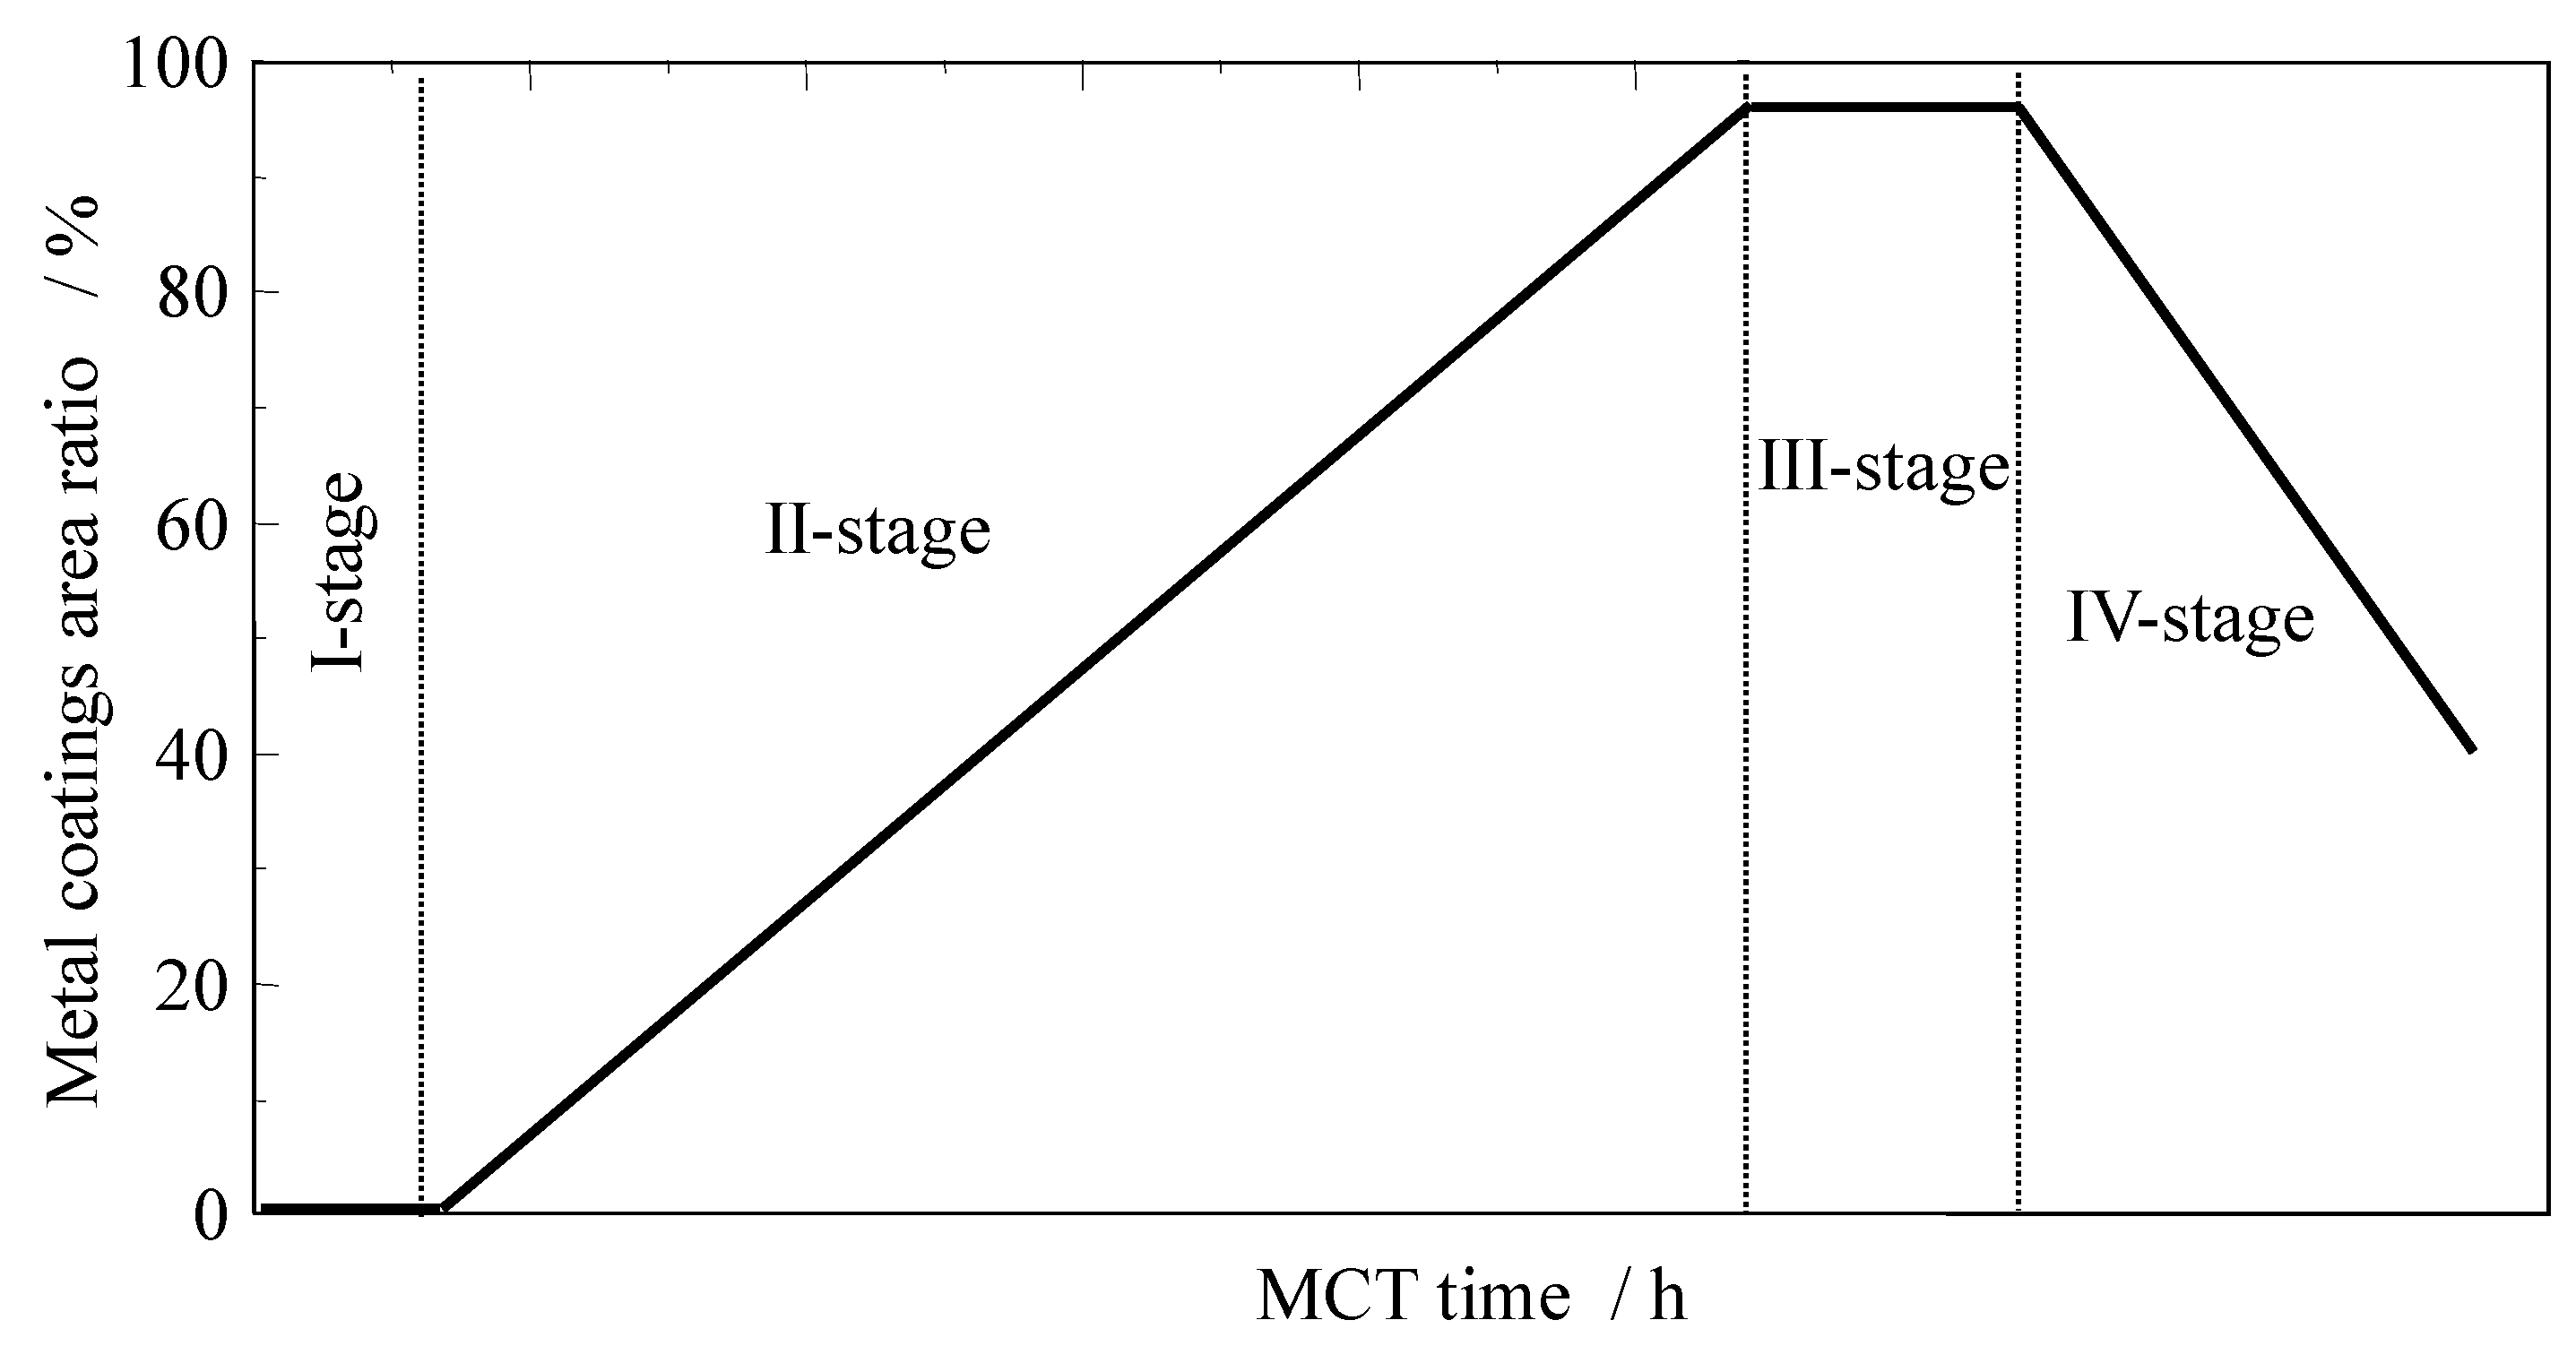
2.3. Coating Formation Process of MCT
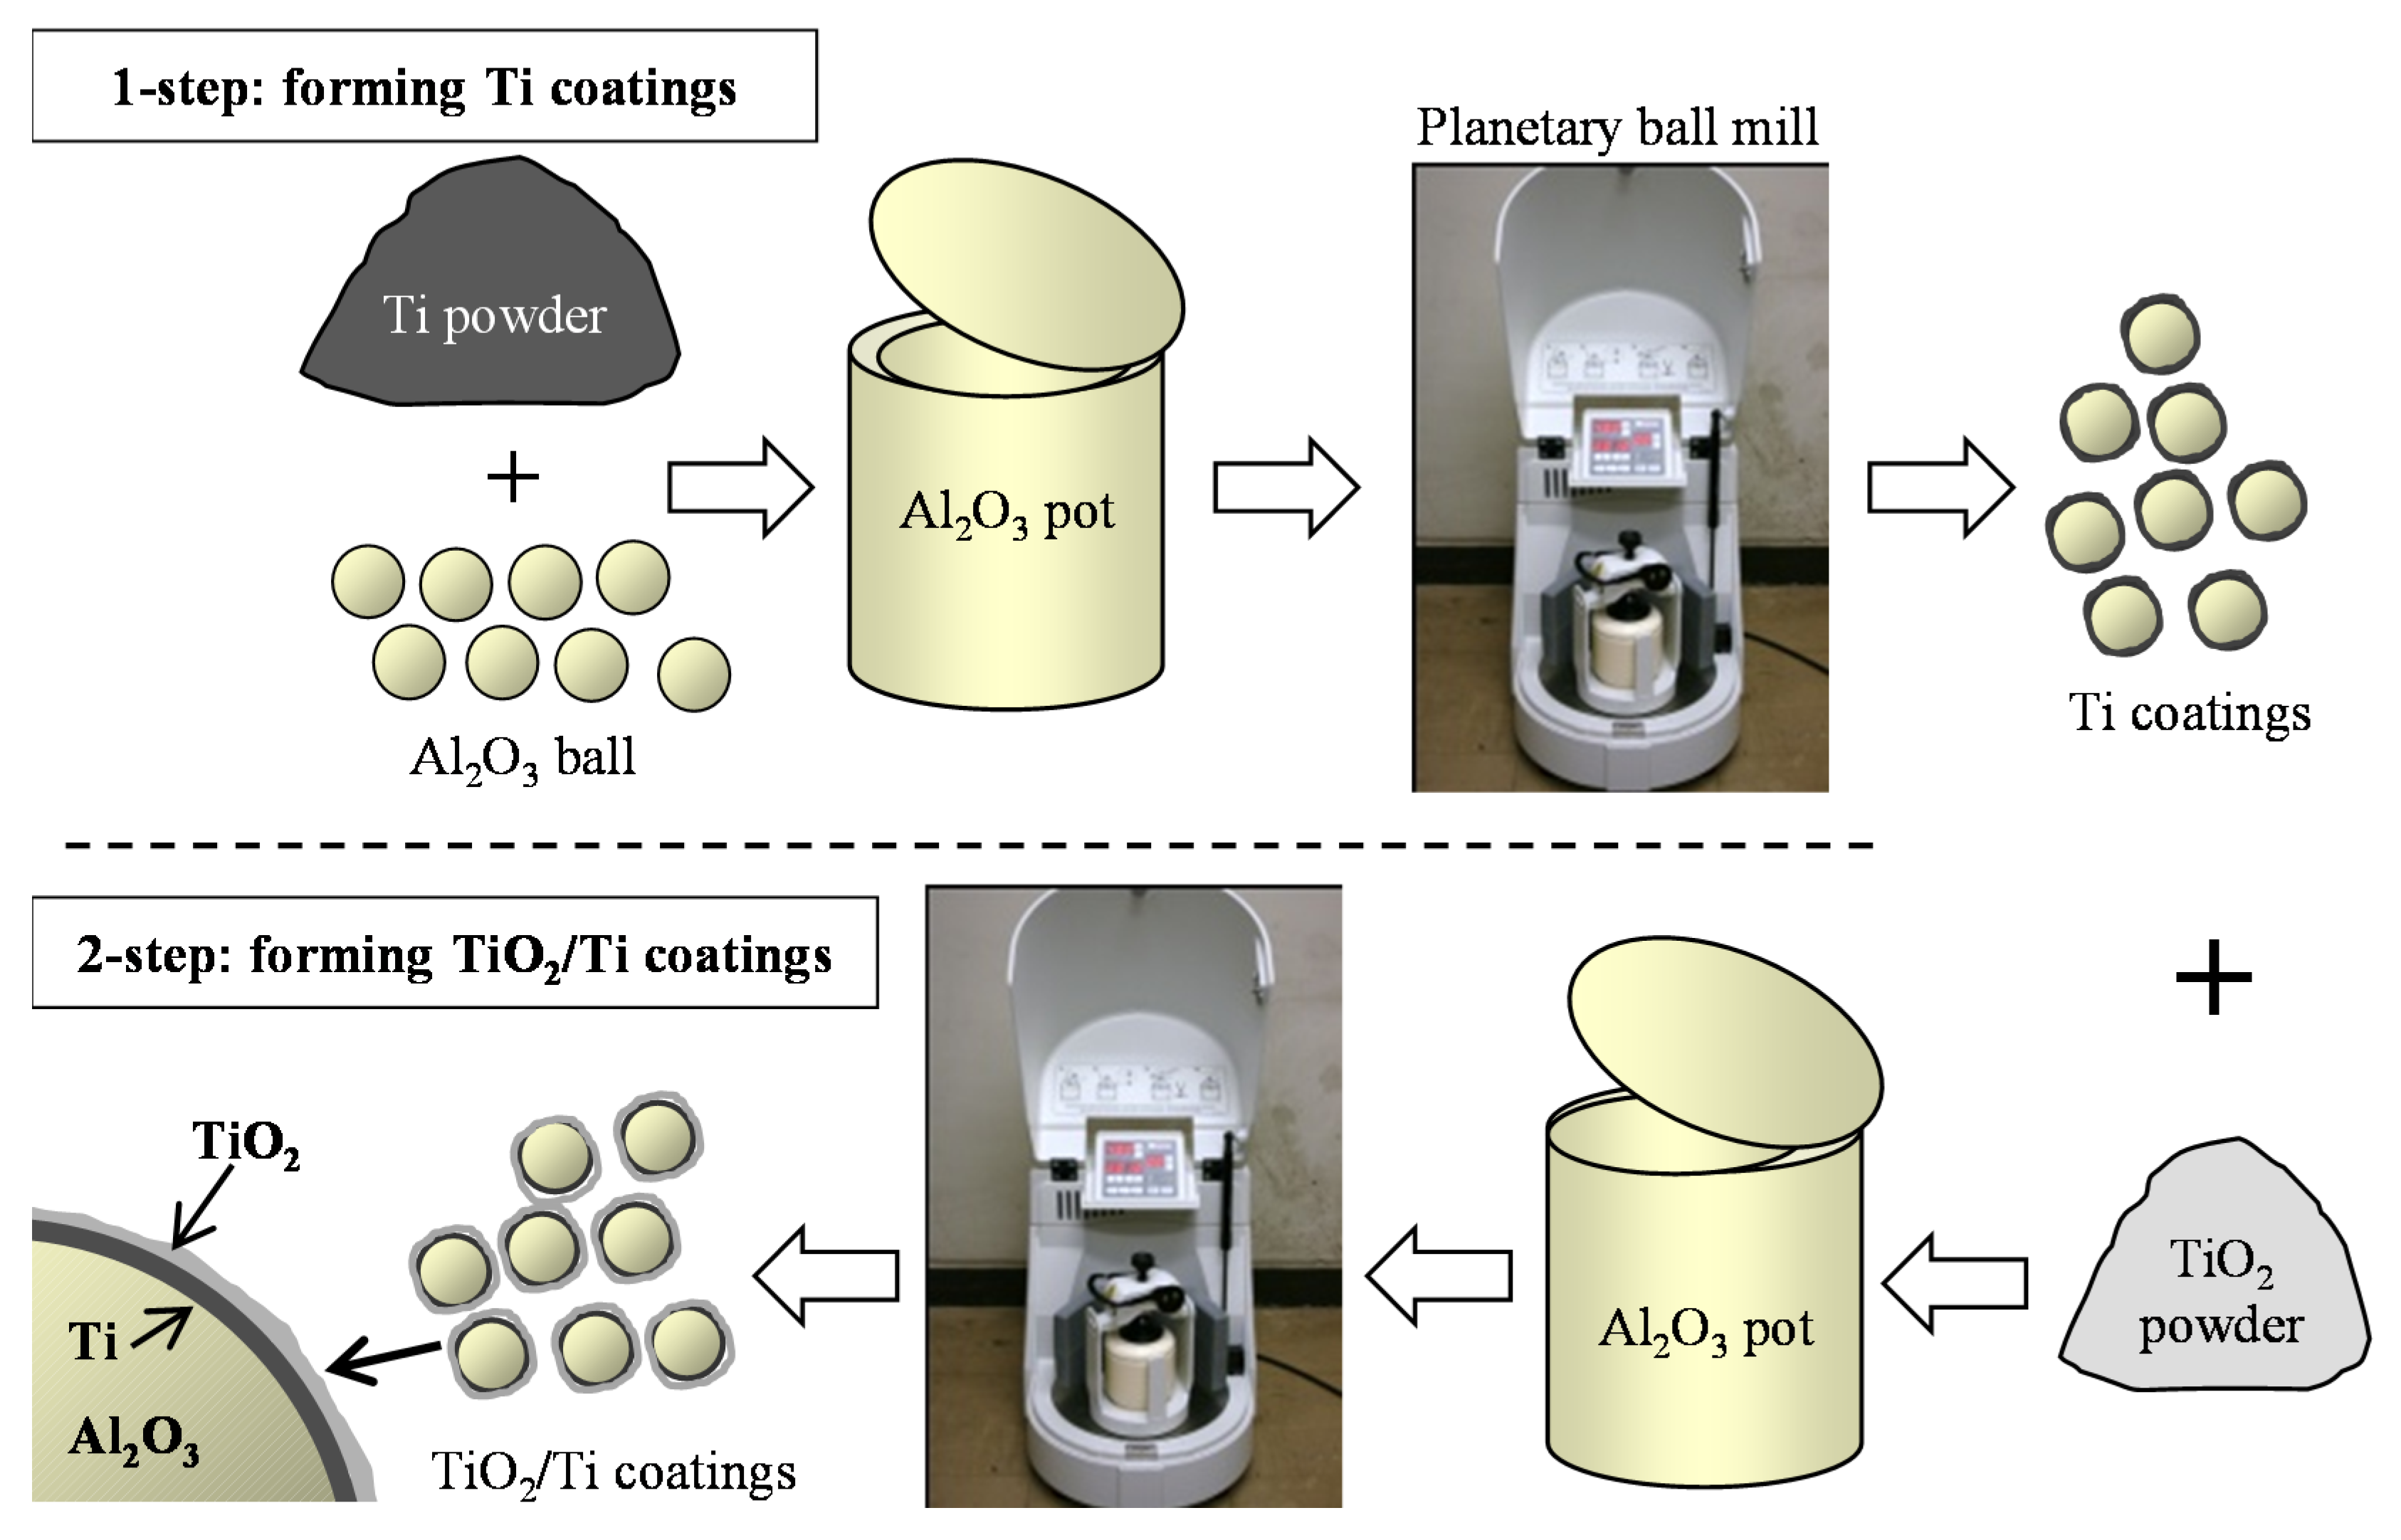
According to the above results, we summarized the evolution of metal coatings during MCT operation and proposed a model for the evolution. The evolution model of the coating formation process could be summarized according to four stages: nucleation, formation and coalescence of the discrete island, formation of the continuous coatings, and exfoliation, shown as Figure 19 [24].
Figure 19. Schematic diagram of formation process of surfaces of Ti coatings by MCT.
Coatings 05 00425 g019
Based on the coating formation process of MCT, the relationship between the area ratio and the four stages of the coating formation process was given as Figure 20. At the stage of nucleation (I-stage), the surface coverage hardly changes as the nuclei are too small to be detected. When increasing the MCT time, the discrete islands of metal particles are formed, then larger metal particles coat the surface and, hence, the coverage greatly increases (II-stage). When the continuous metal coatings are prepared, the coverage reaches 100% (III-stage). During III-stage, the thickness of coatings is quickly increased. Finally, the coverage is decreased due to the exfoliation of metal coatings (IV-stage).
Figure 20. Formation process of metal coatings by MCT.
Coatings 05 00425 g020

2.4. Two-Step MCT

Based on the MCT, the two-step MCT has been proposed to fabricate the composite photocatalyst coatings of TiO2/Ti, shown as Figure 21. Firstly, Ti coatings could be fabricated with Ti powder and Al2O3 balls by MCT, then the Ti coatings on Al2O3 balls were used as the substrate material and TiO2 powder as the coating material. After a certain time milling, the composite photocatalyst coatings of TiO2/Ti coatings could be fabricated.
Figure 21. Schematic diagram of two-step MCT.
Coatings 05 00425 g021

3. Application of the Composite Coatings Fabricated by MCT

When discussing the photocatalyst material of TiO2, it is well known that this material has been widely used as a photocatalyst. When TiO2 is used as a photocatalyst, the shape is usually as a film or coating, and fabrication has always been a problem. Regarding the above, our team has developed a new fabrication technique by converse thinking about the powder mixing in mechanical alloying, named as the mechanical coating technique (MCT), and carried out by using coating materials and substrate materials. In general, the photocatalyst coatings of TiO2 could be fabricated on Al2O3 balls with TiO2 powder by MCT operation. Due to some factors (the coating formation efficiency, cost and/or size of TiO2 powder, and so on), at present, our team focused on the oxidation process after MCT to fabricate the photocatalyst coatings, besides the two-step MCT.
In this part, this review presents the studies directed at photocatalyst coatings prepared by MCT and oxidation process, including the influence on photocatalyst coatings by oxidation conditions, adding other metals, and molten slat treatment.
Firstly, here we will introduce the naming method of prepared samples as follows. Regarding the materials as shown as Table 2: “M10-Ti” is the sample fabricated with Ti powder by MCT at 480 rpm for 10 h. “M10-xK-yh” are the final oxidized products of the M10-Ti samples, heat oxidation at the elevated temperature of x K for y hour. X-ray diffraction (XRD, JDX-3530, JEOL, Tokyo, Japan) with Cu-Kα radiation at 30 kV and 20 mA was used to determine the compositions and crystal structures. The surface morphologies and cross-sectional microstructures of the samples were observed by scanning electron microscopy (SEM) (JSM-5300, JEOL, Tokyo, Japan). The prepared samples firstly dried under UV light (FL20S BLB, Toshiba) for 24 h, then absorbed with 20 μmol/L methylene blue (MB) solution under the dark place for 18 h. After these treatments, the photocatalytic activity was evaluated by measuring the degradation rate of 10 μmol/L MB solution at room temperature by referring to Japanese industrial standard (JIS R 1703-2: 2007). The diameter of test cell is 18 mm and 40 mm. The photocatalytic activity test under UV has been reported in detail in our previous work [13]. On the other hand, the photocatalytic activity test under visible light was carried out by the light source of two 20 W fluorescent lamps (NEC FL20SSW/18), which were placed on the top to make sure the samples would obtain 5000 l×. A suitable cut-off filter (L42, Hoya Candeo Optronics Co., Saitama, Japan) was placed to ensure that only visible light (λ > 420 nm) could reach the samples. The degradation rate constant R (nmol·L−1·h−1 and nmol·L−1·min−1 for the test cell of 18 mm and 40 mm, respectively) of MB solution concentration versus irradiation time was calculated by the least squares method with the data, by referring to Japanese industrial standard (JIS R 1703-2: 2007). In order to clearly show the photocatalytic activity, here we use the R value to describe the difference in the degradation rate constants k. R is calculated by the equation:
R = kkMB
where kMB is to describe the degradation rate constants of MB solution without samples.

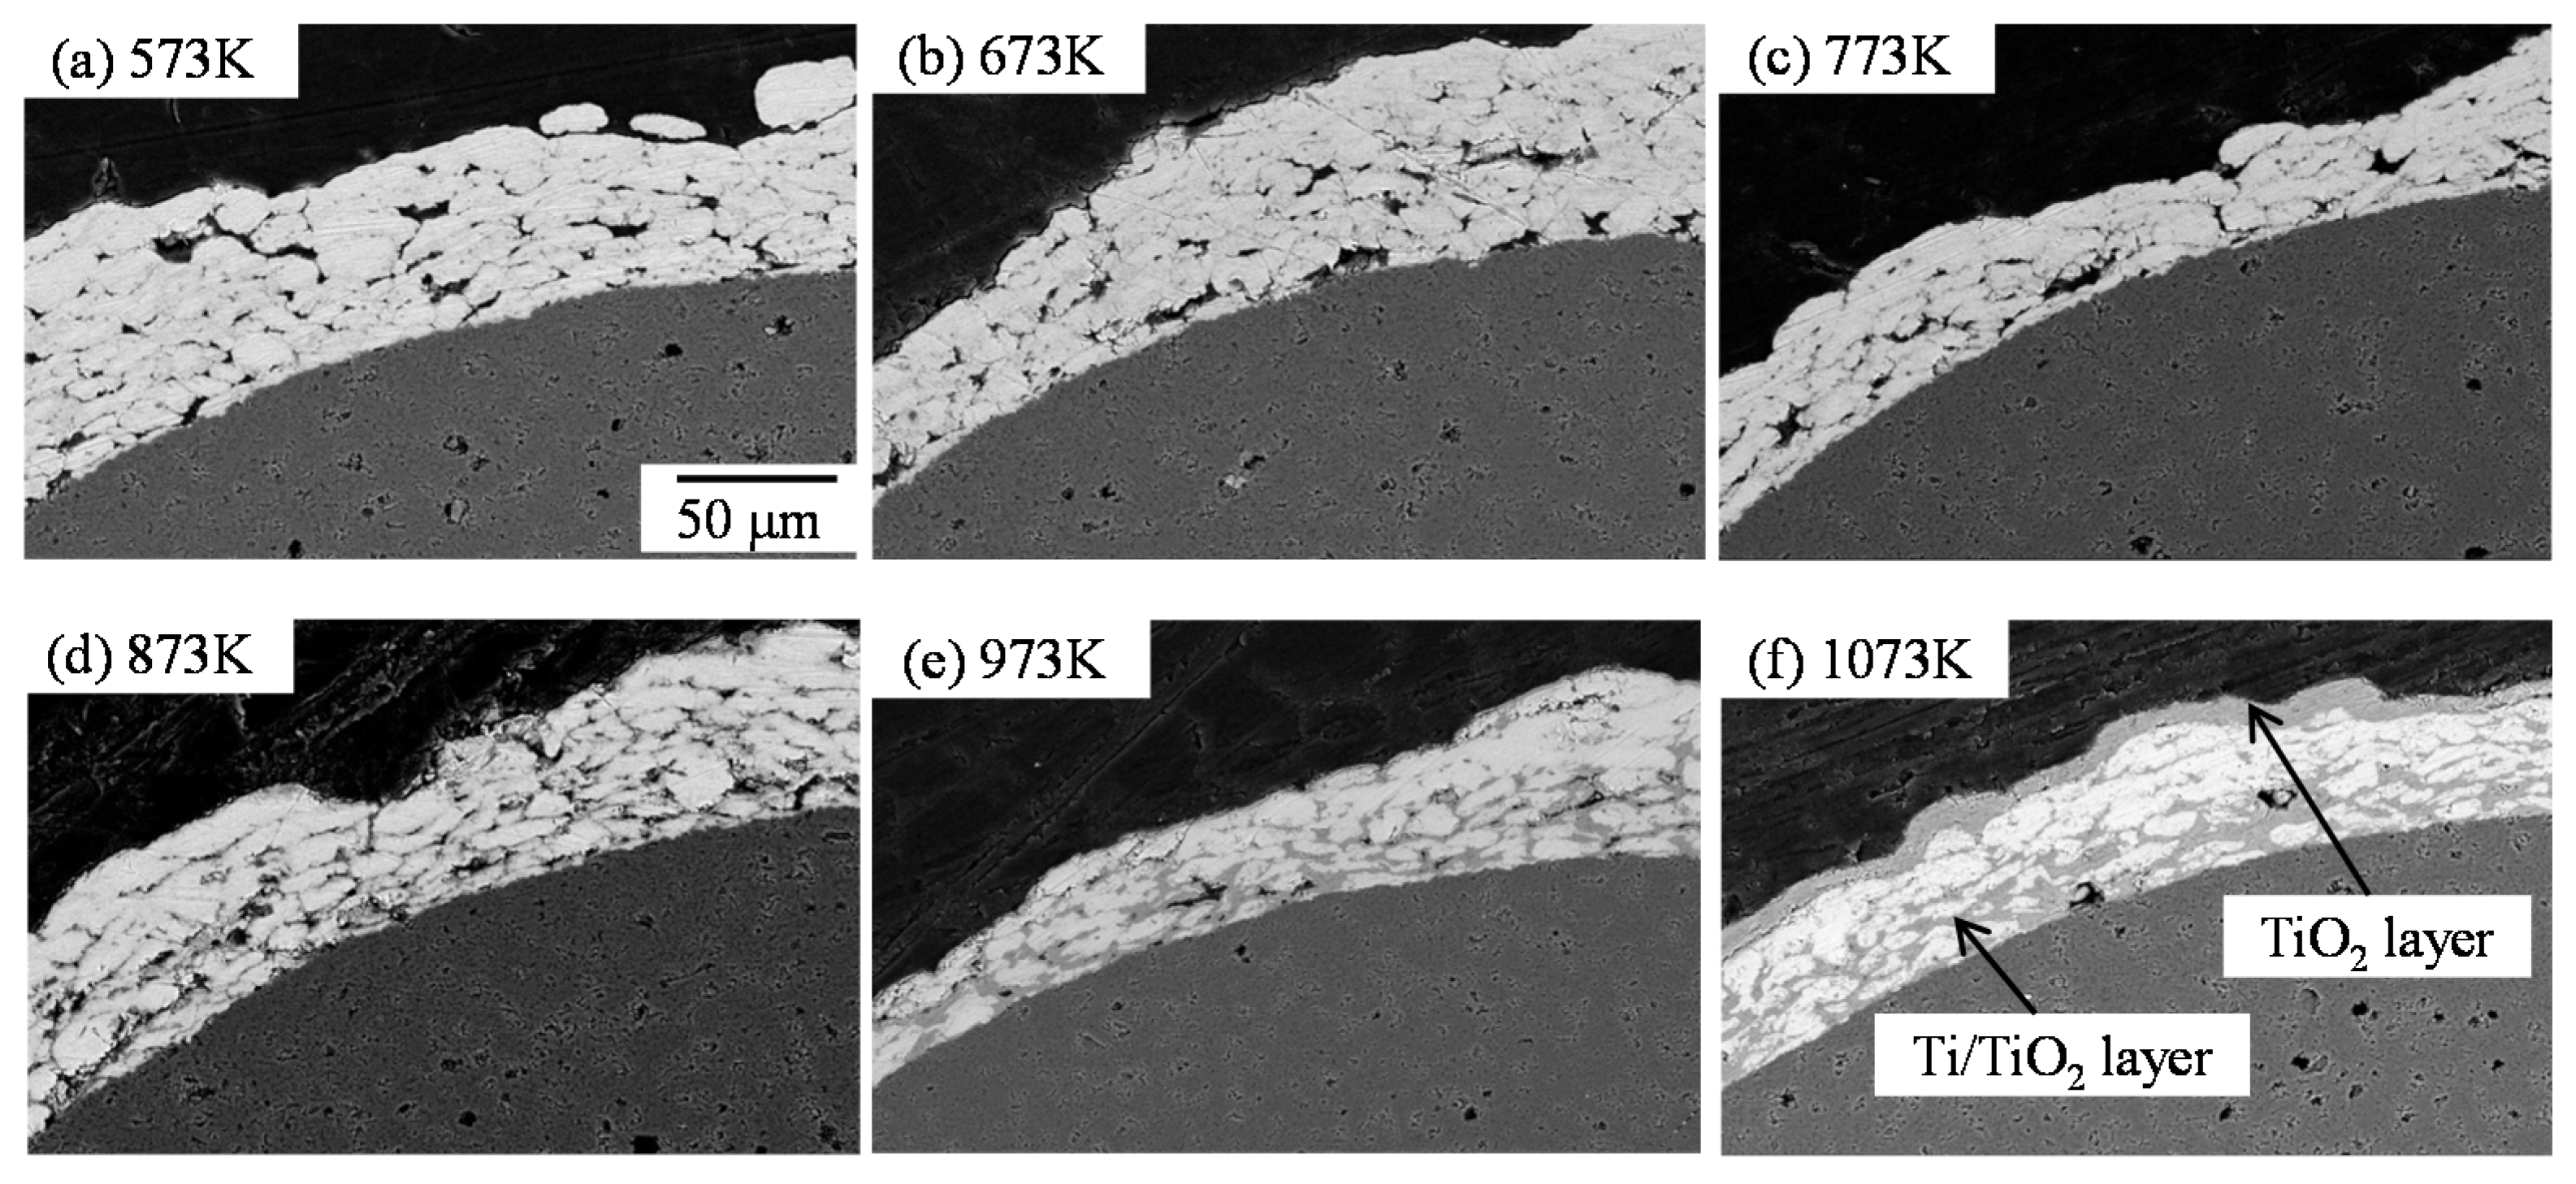
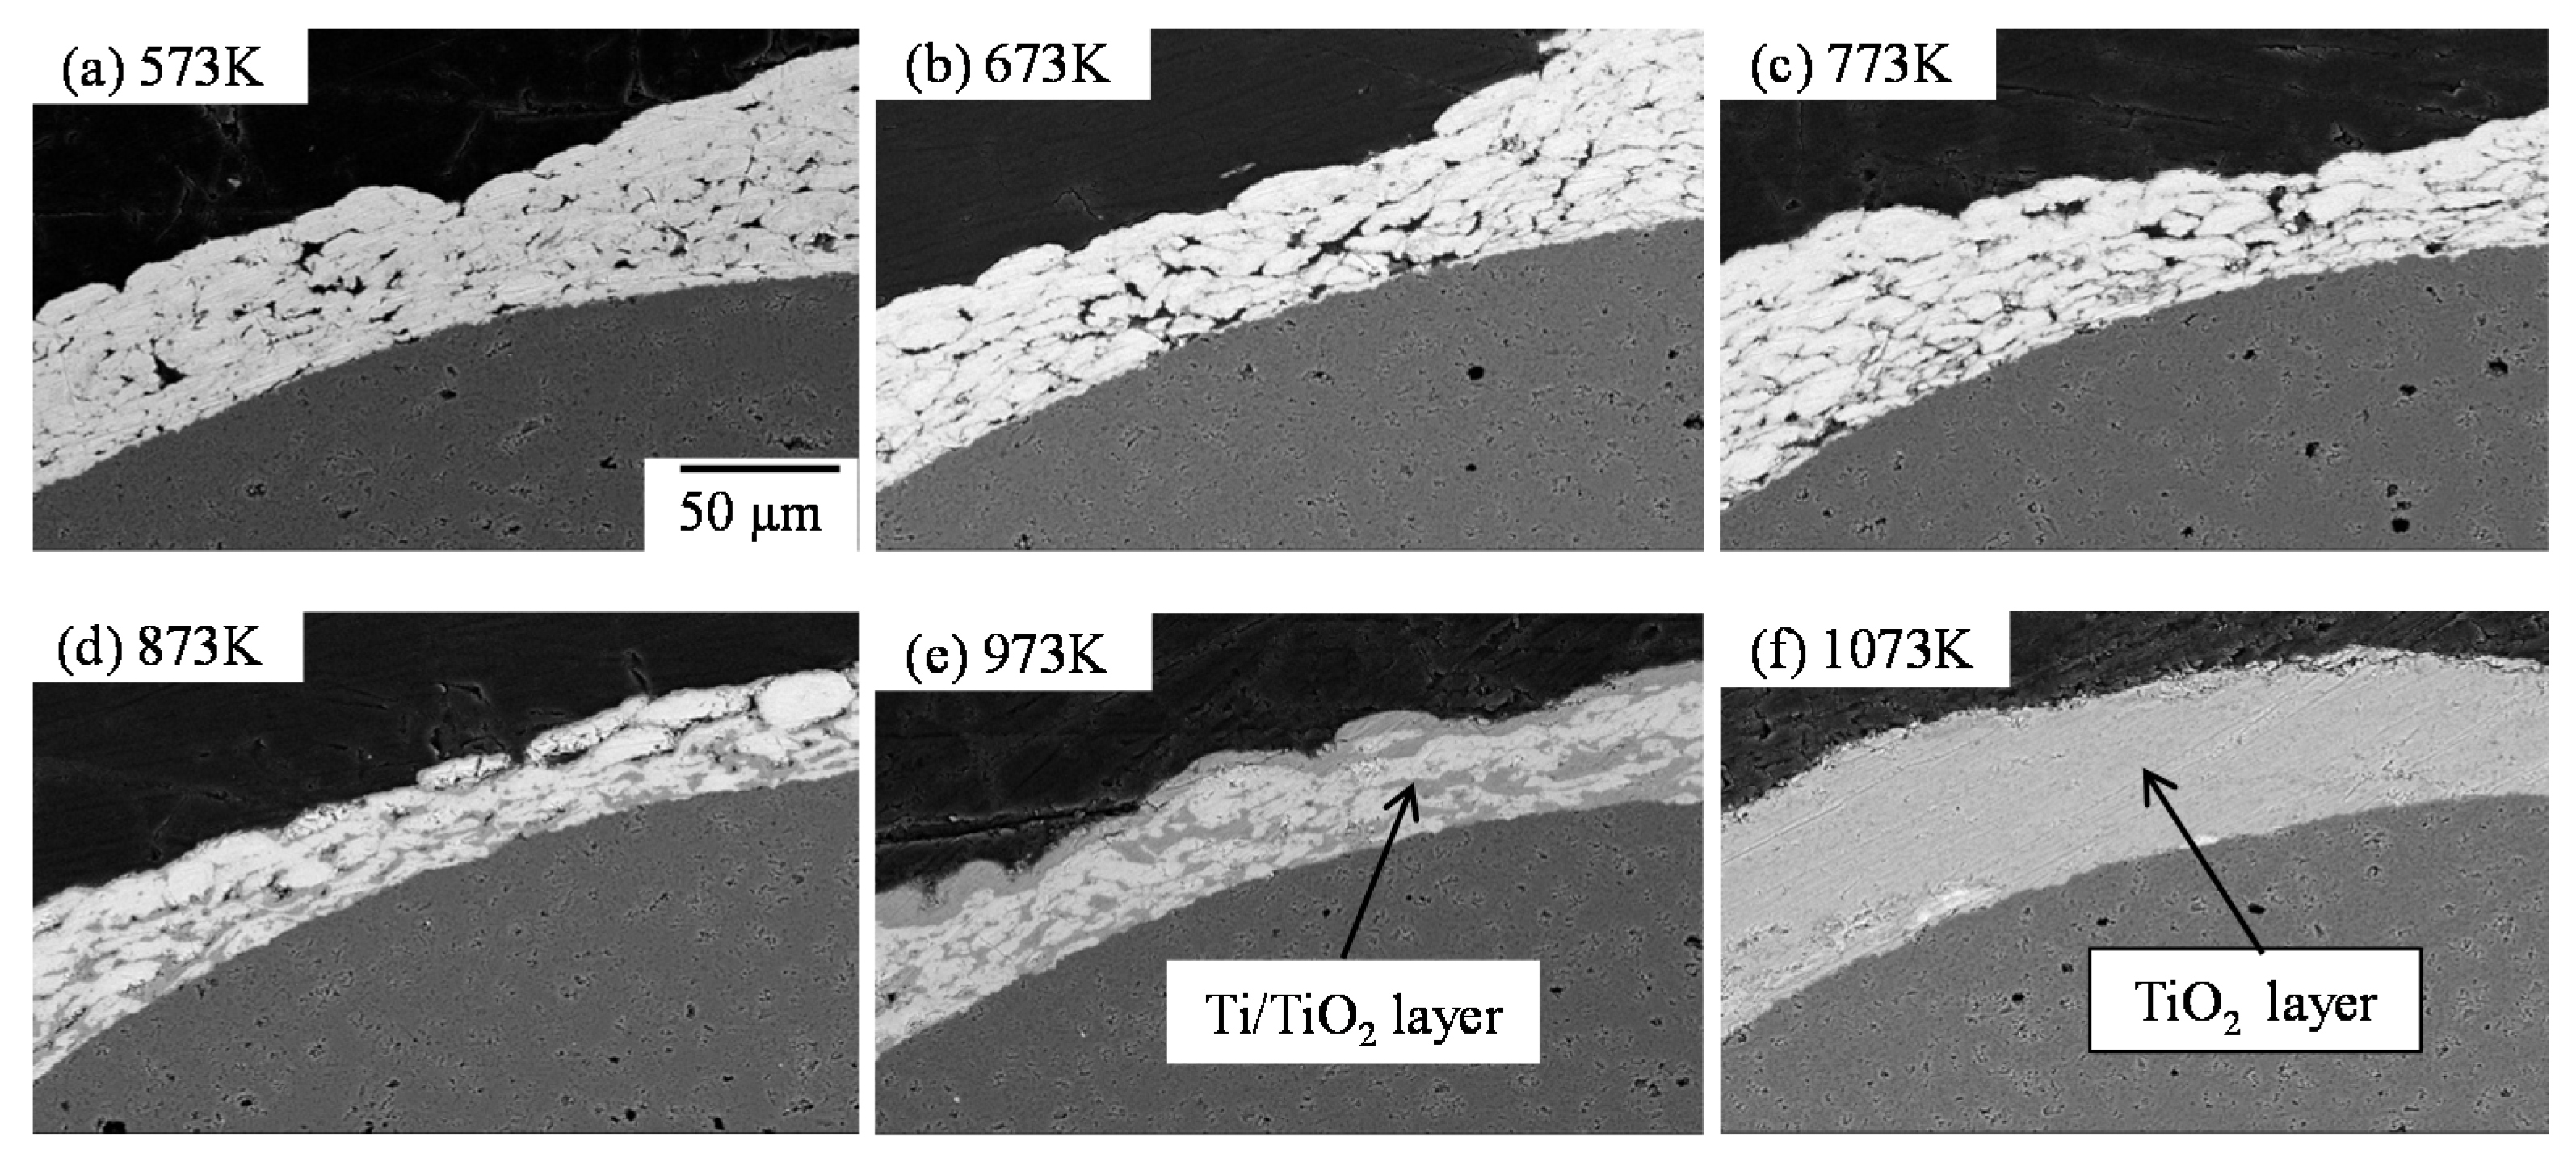
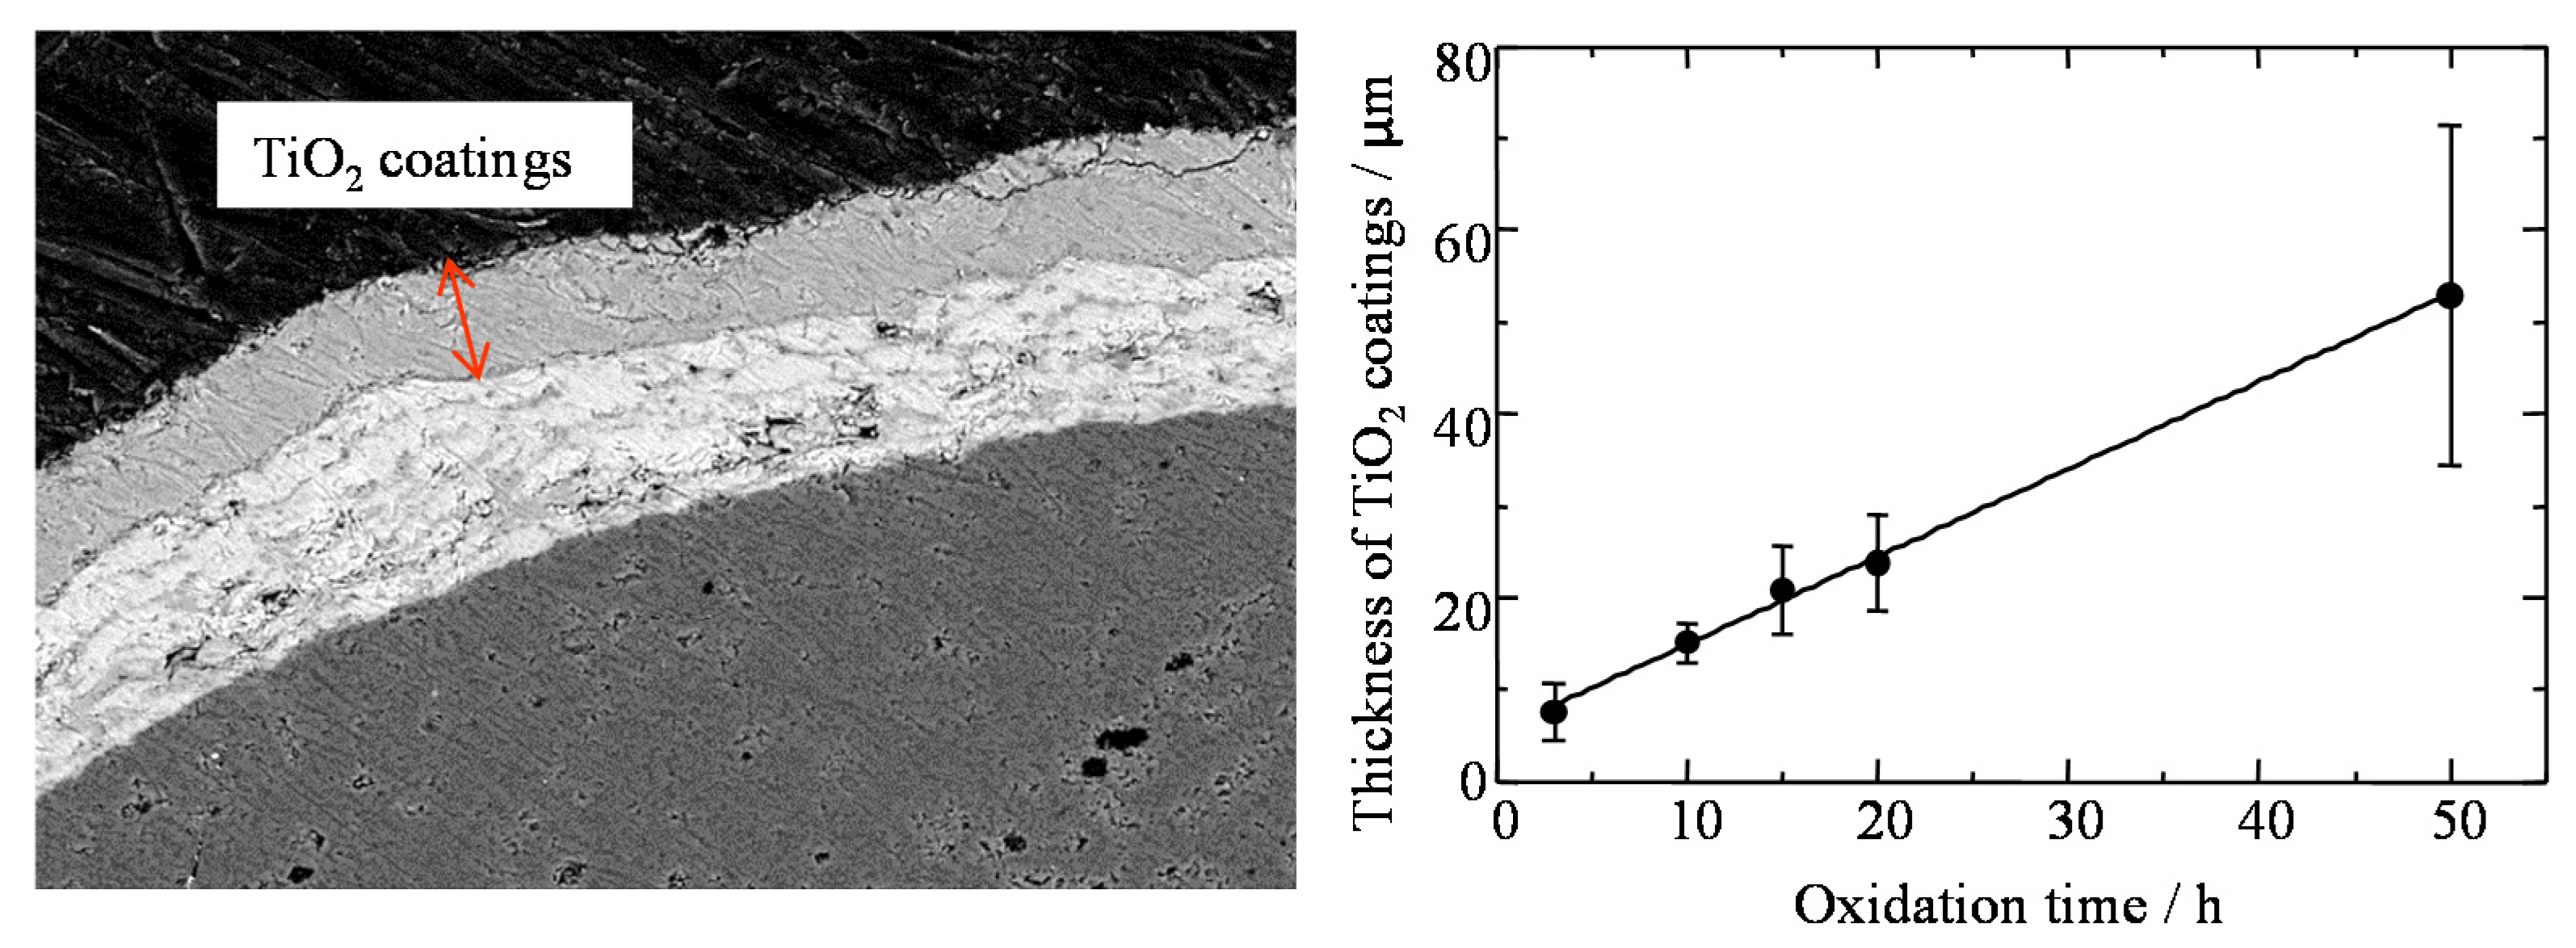
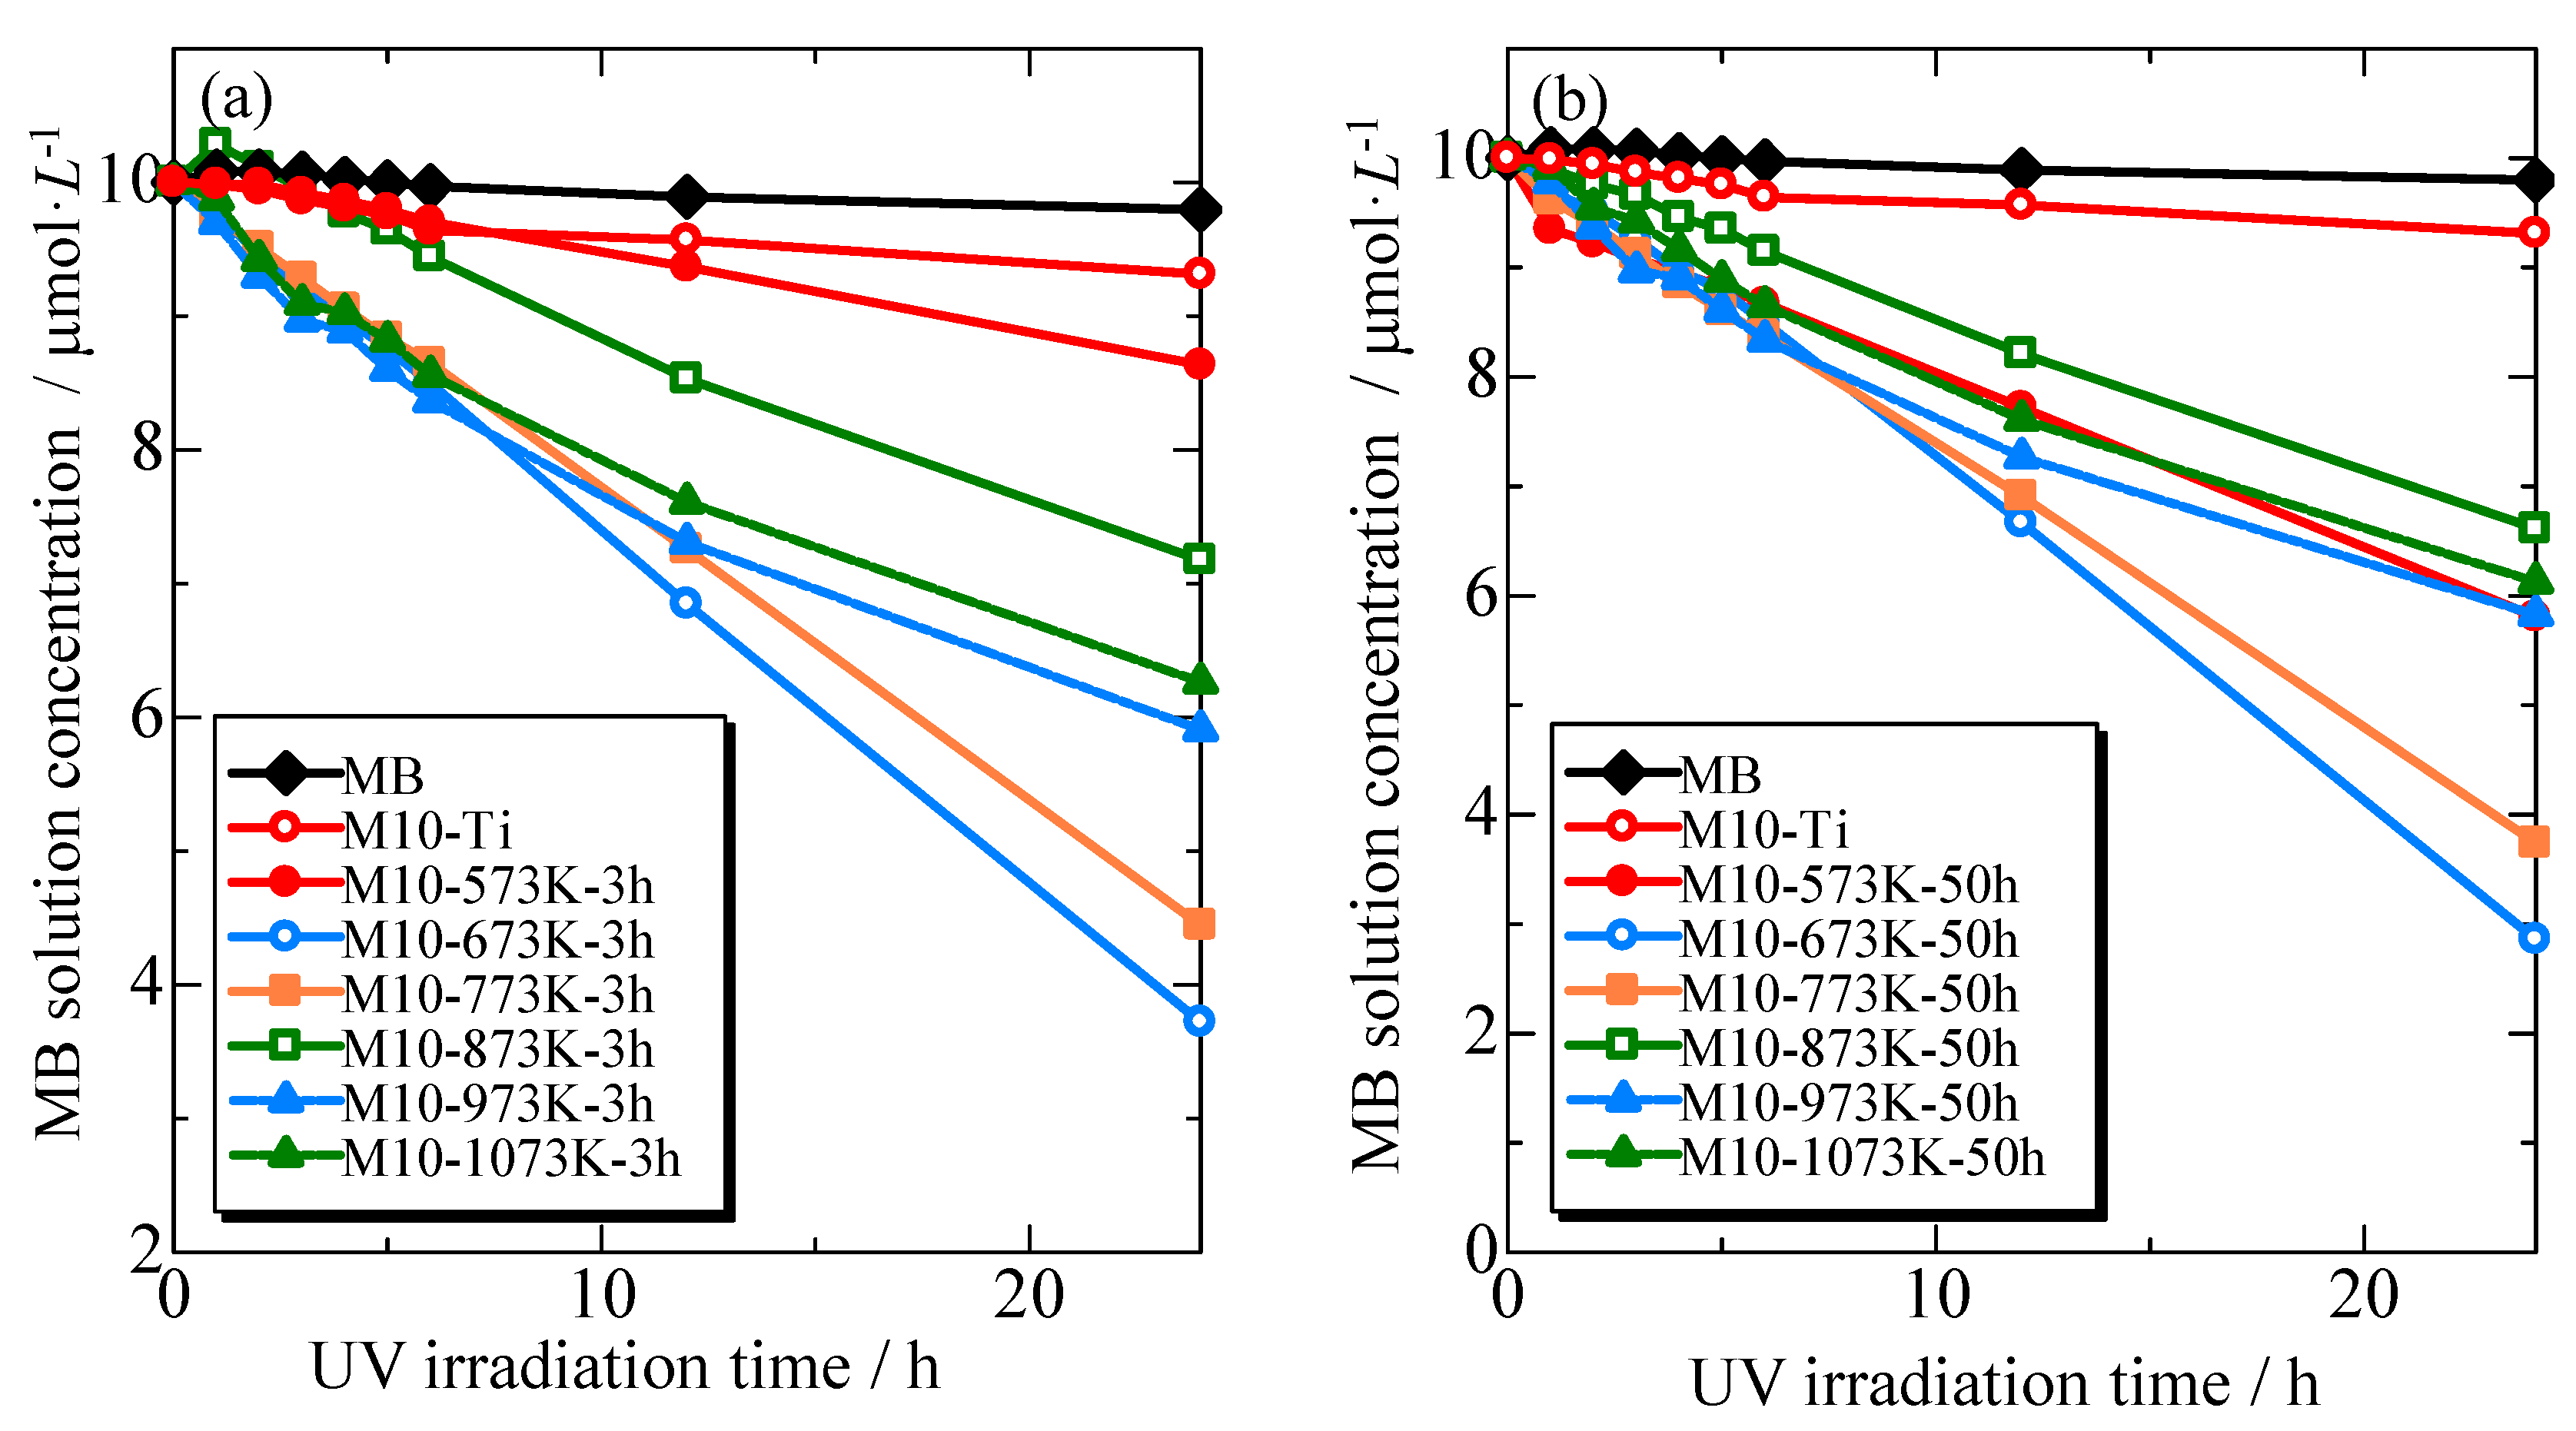
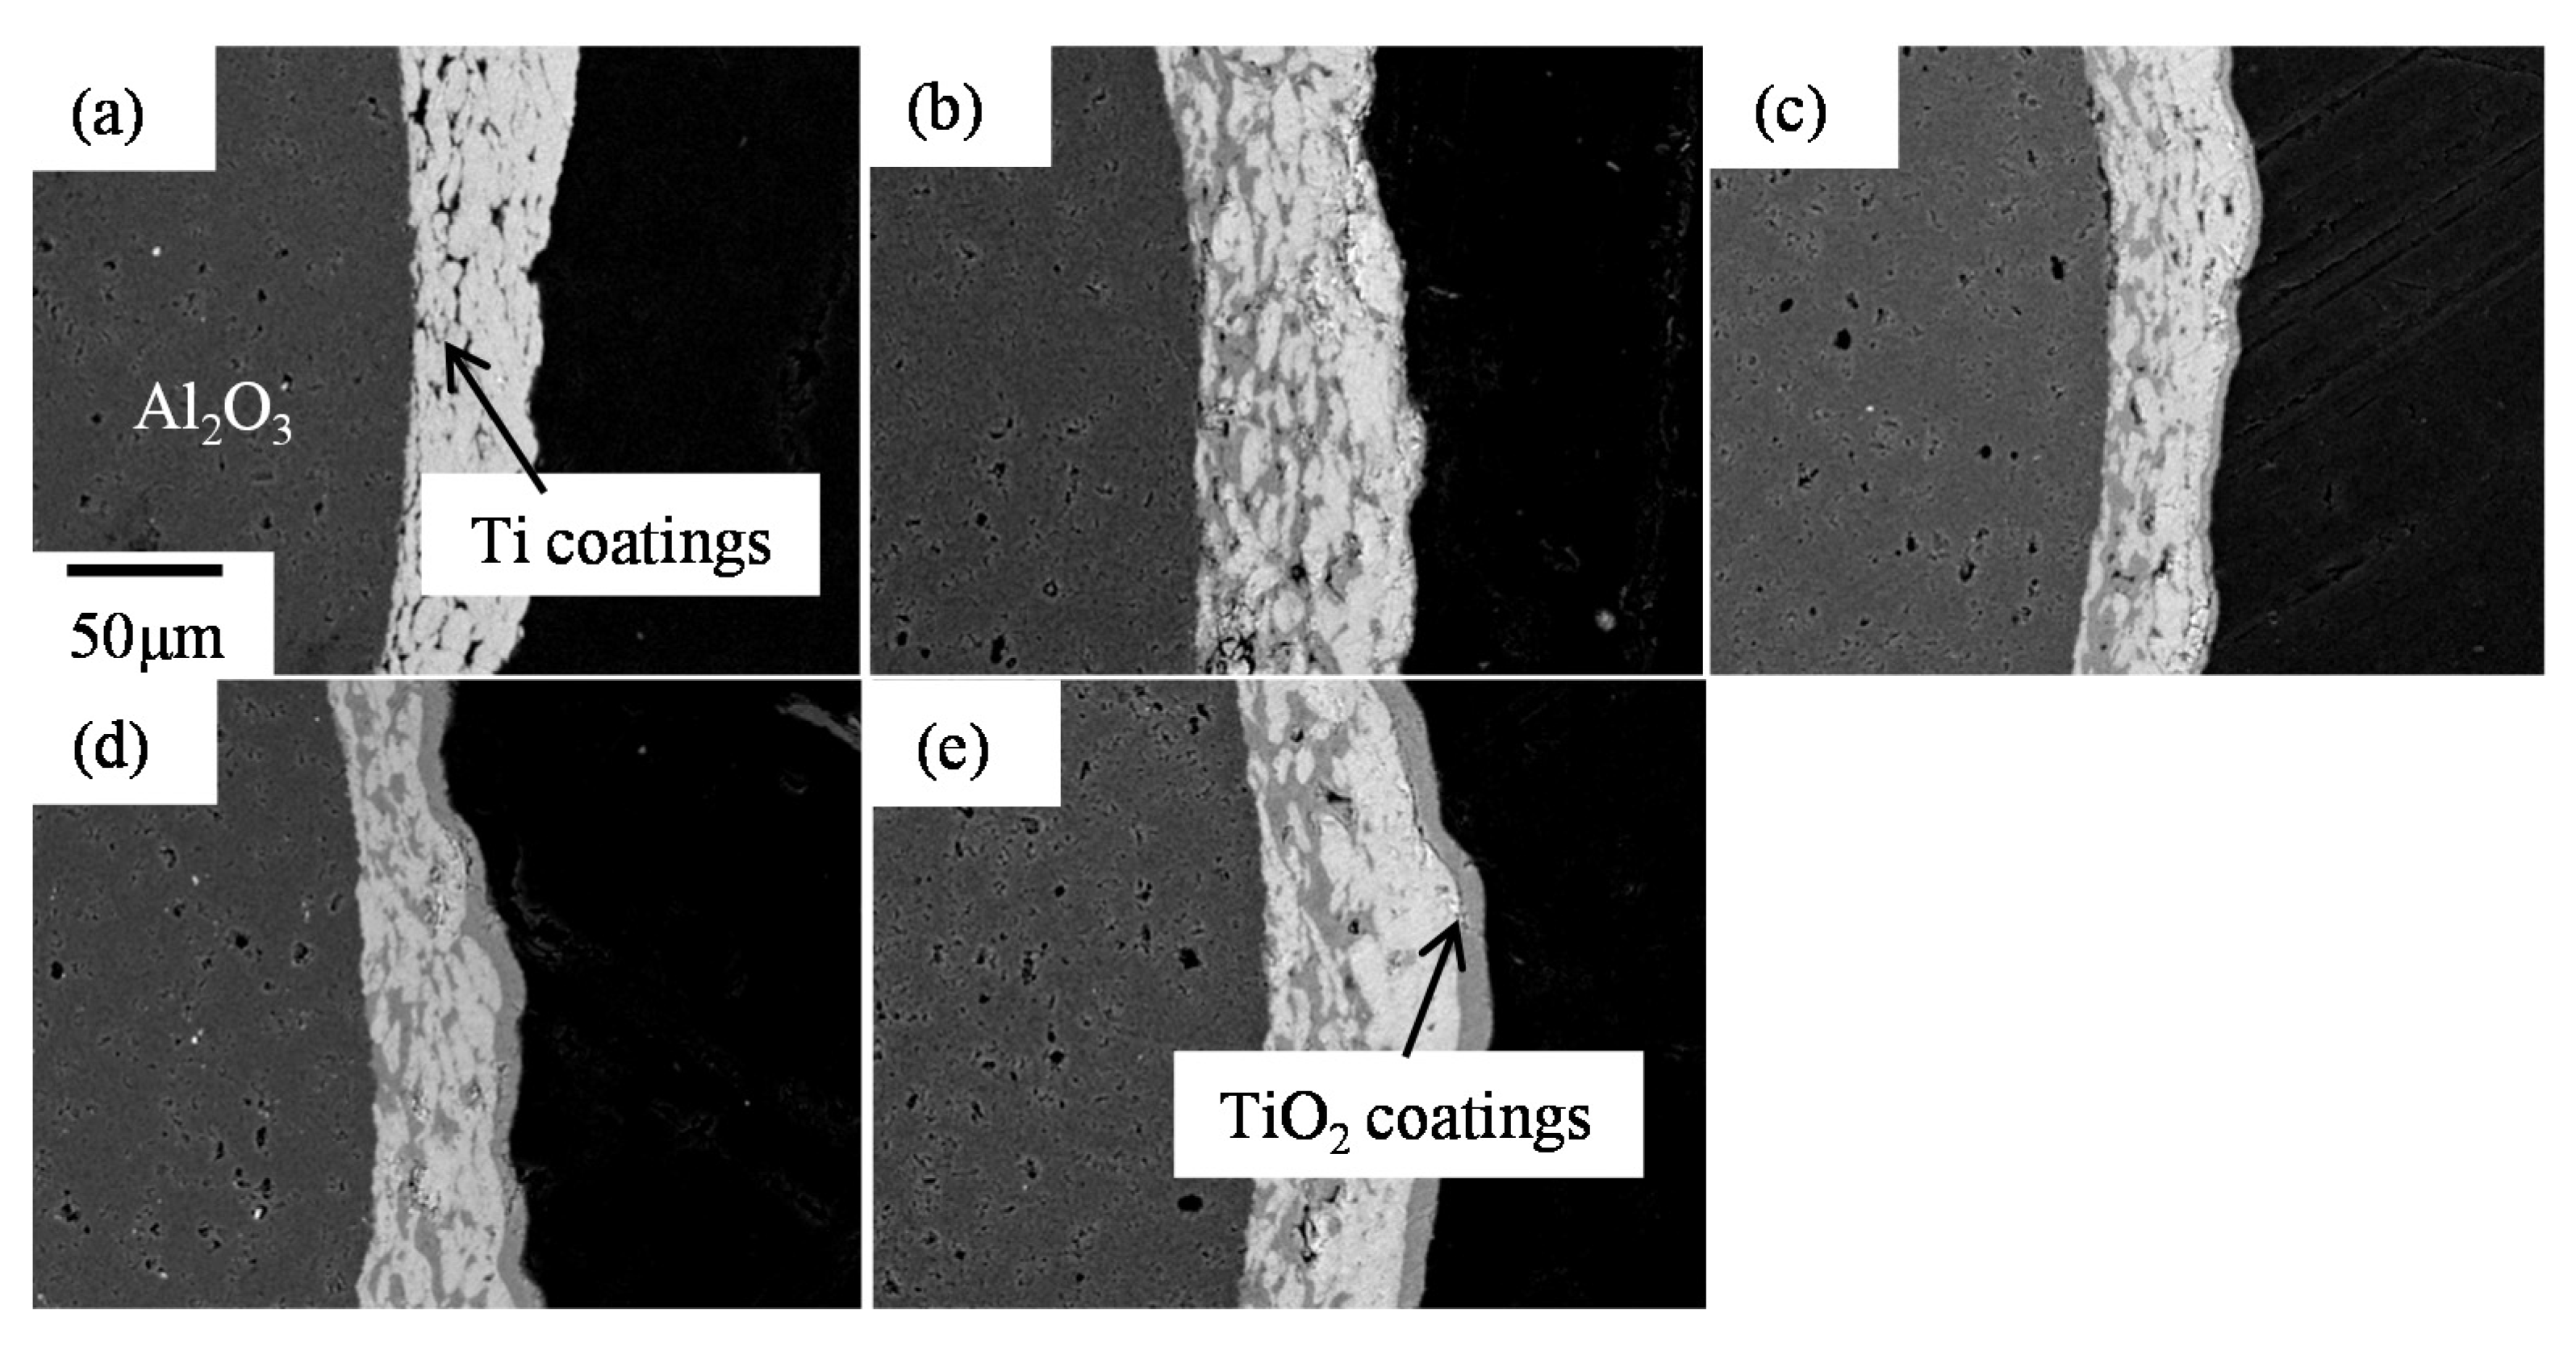
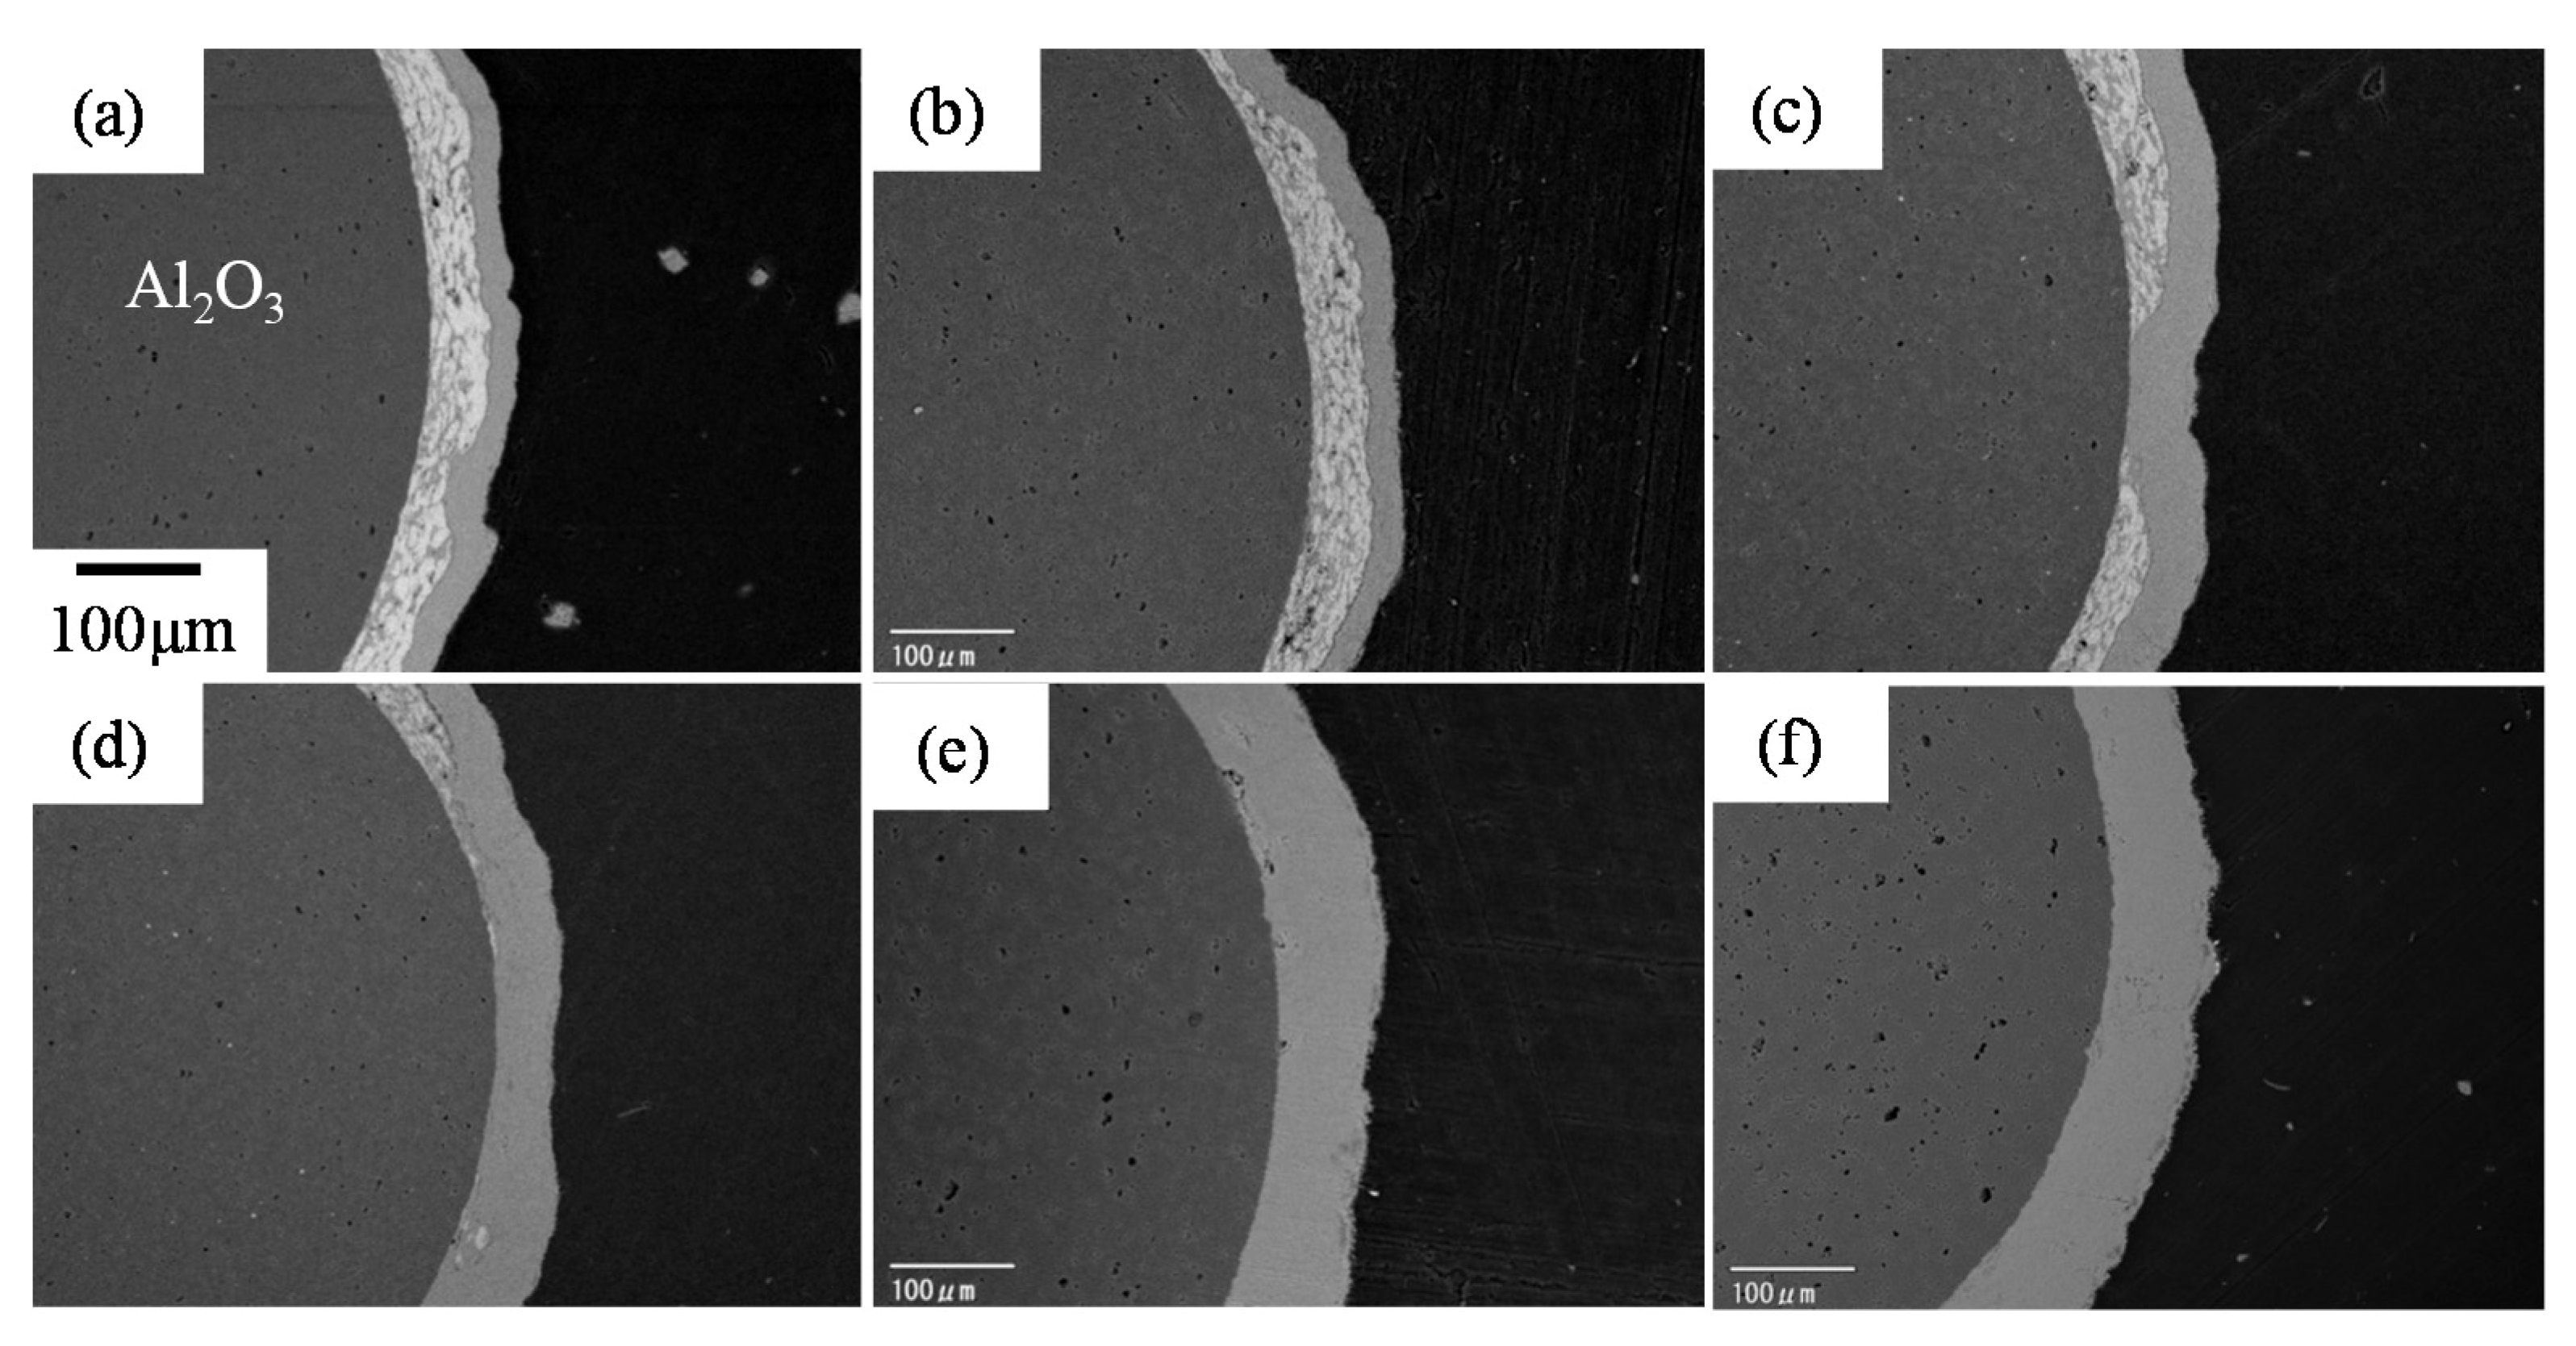
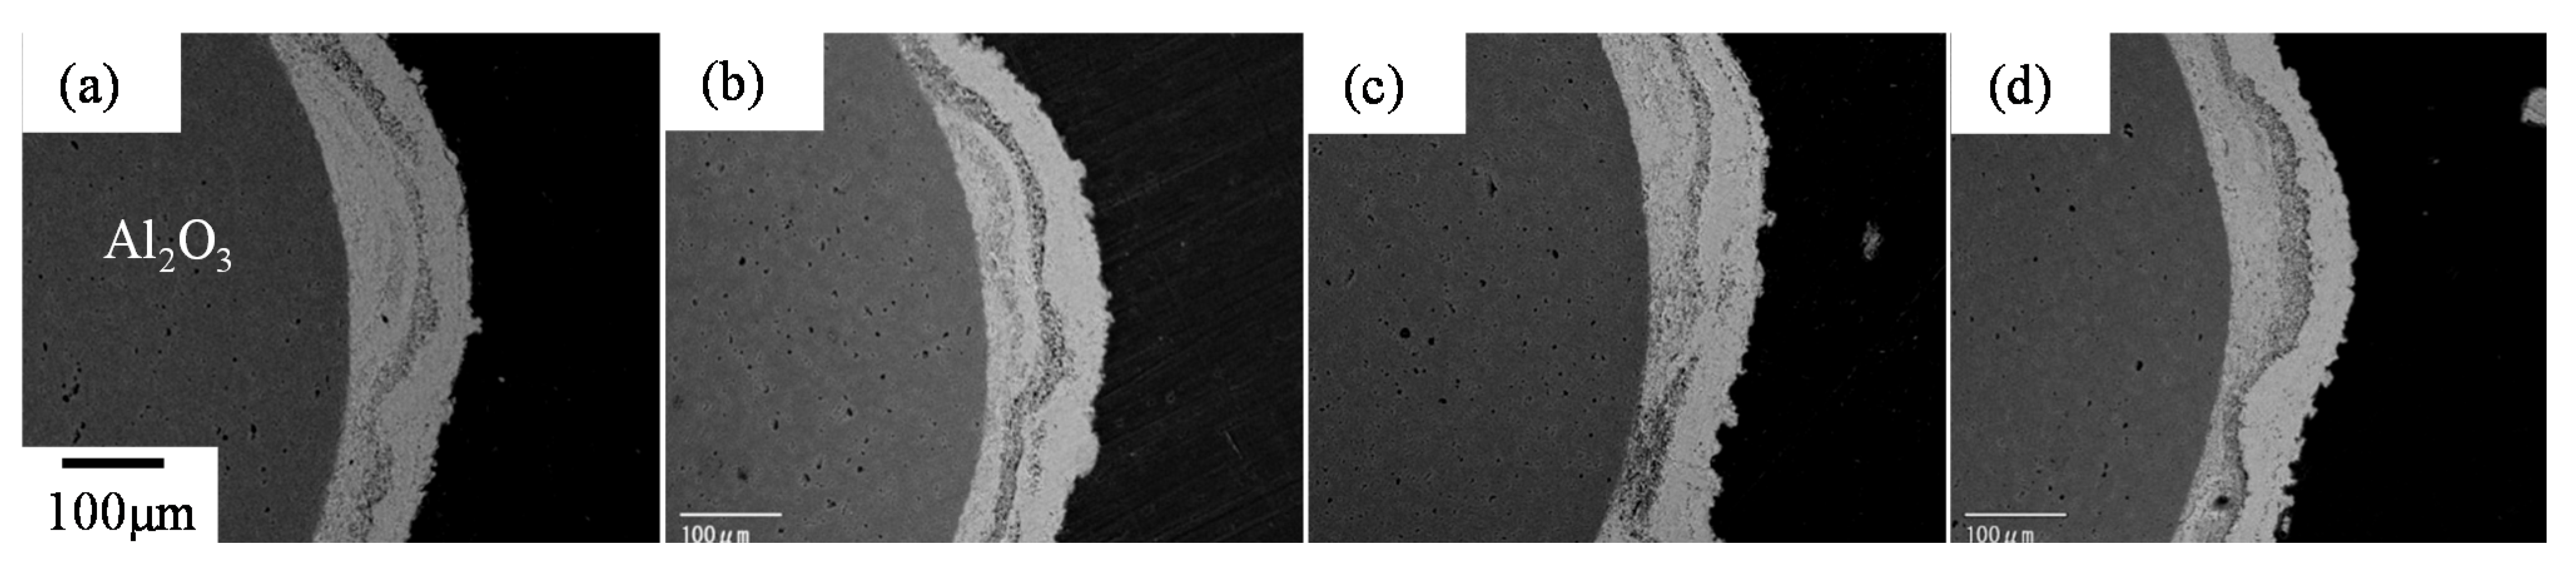
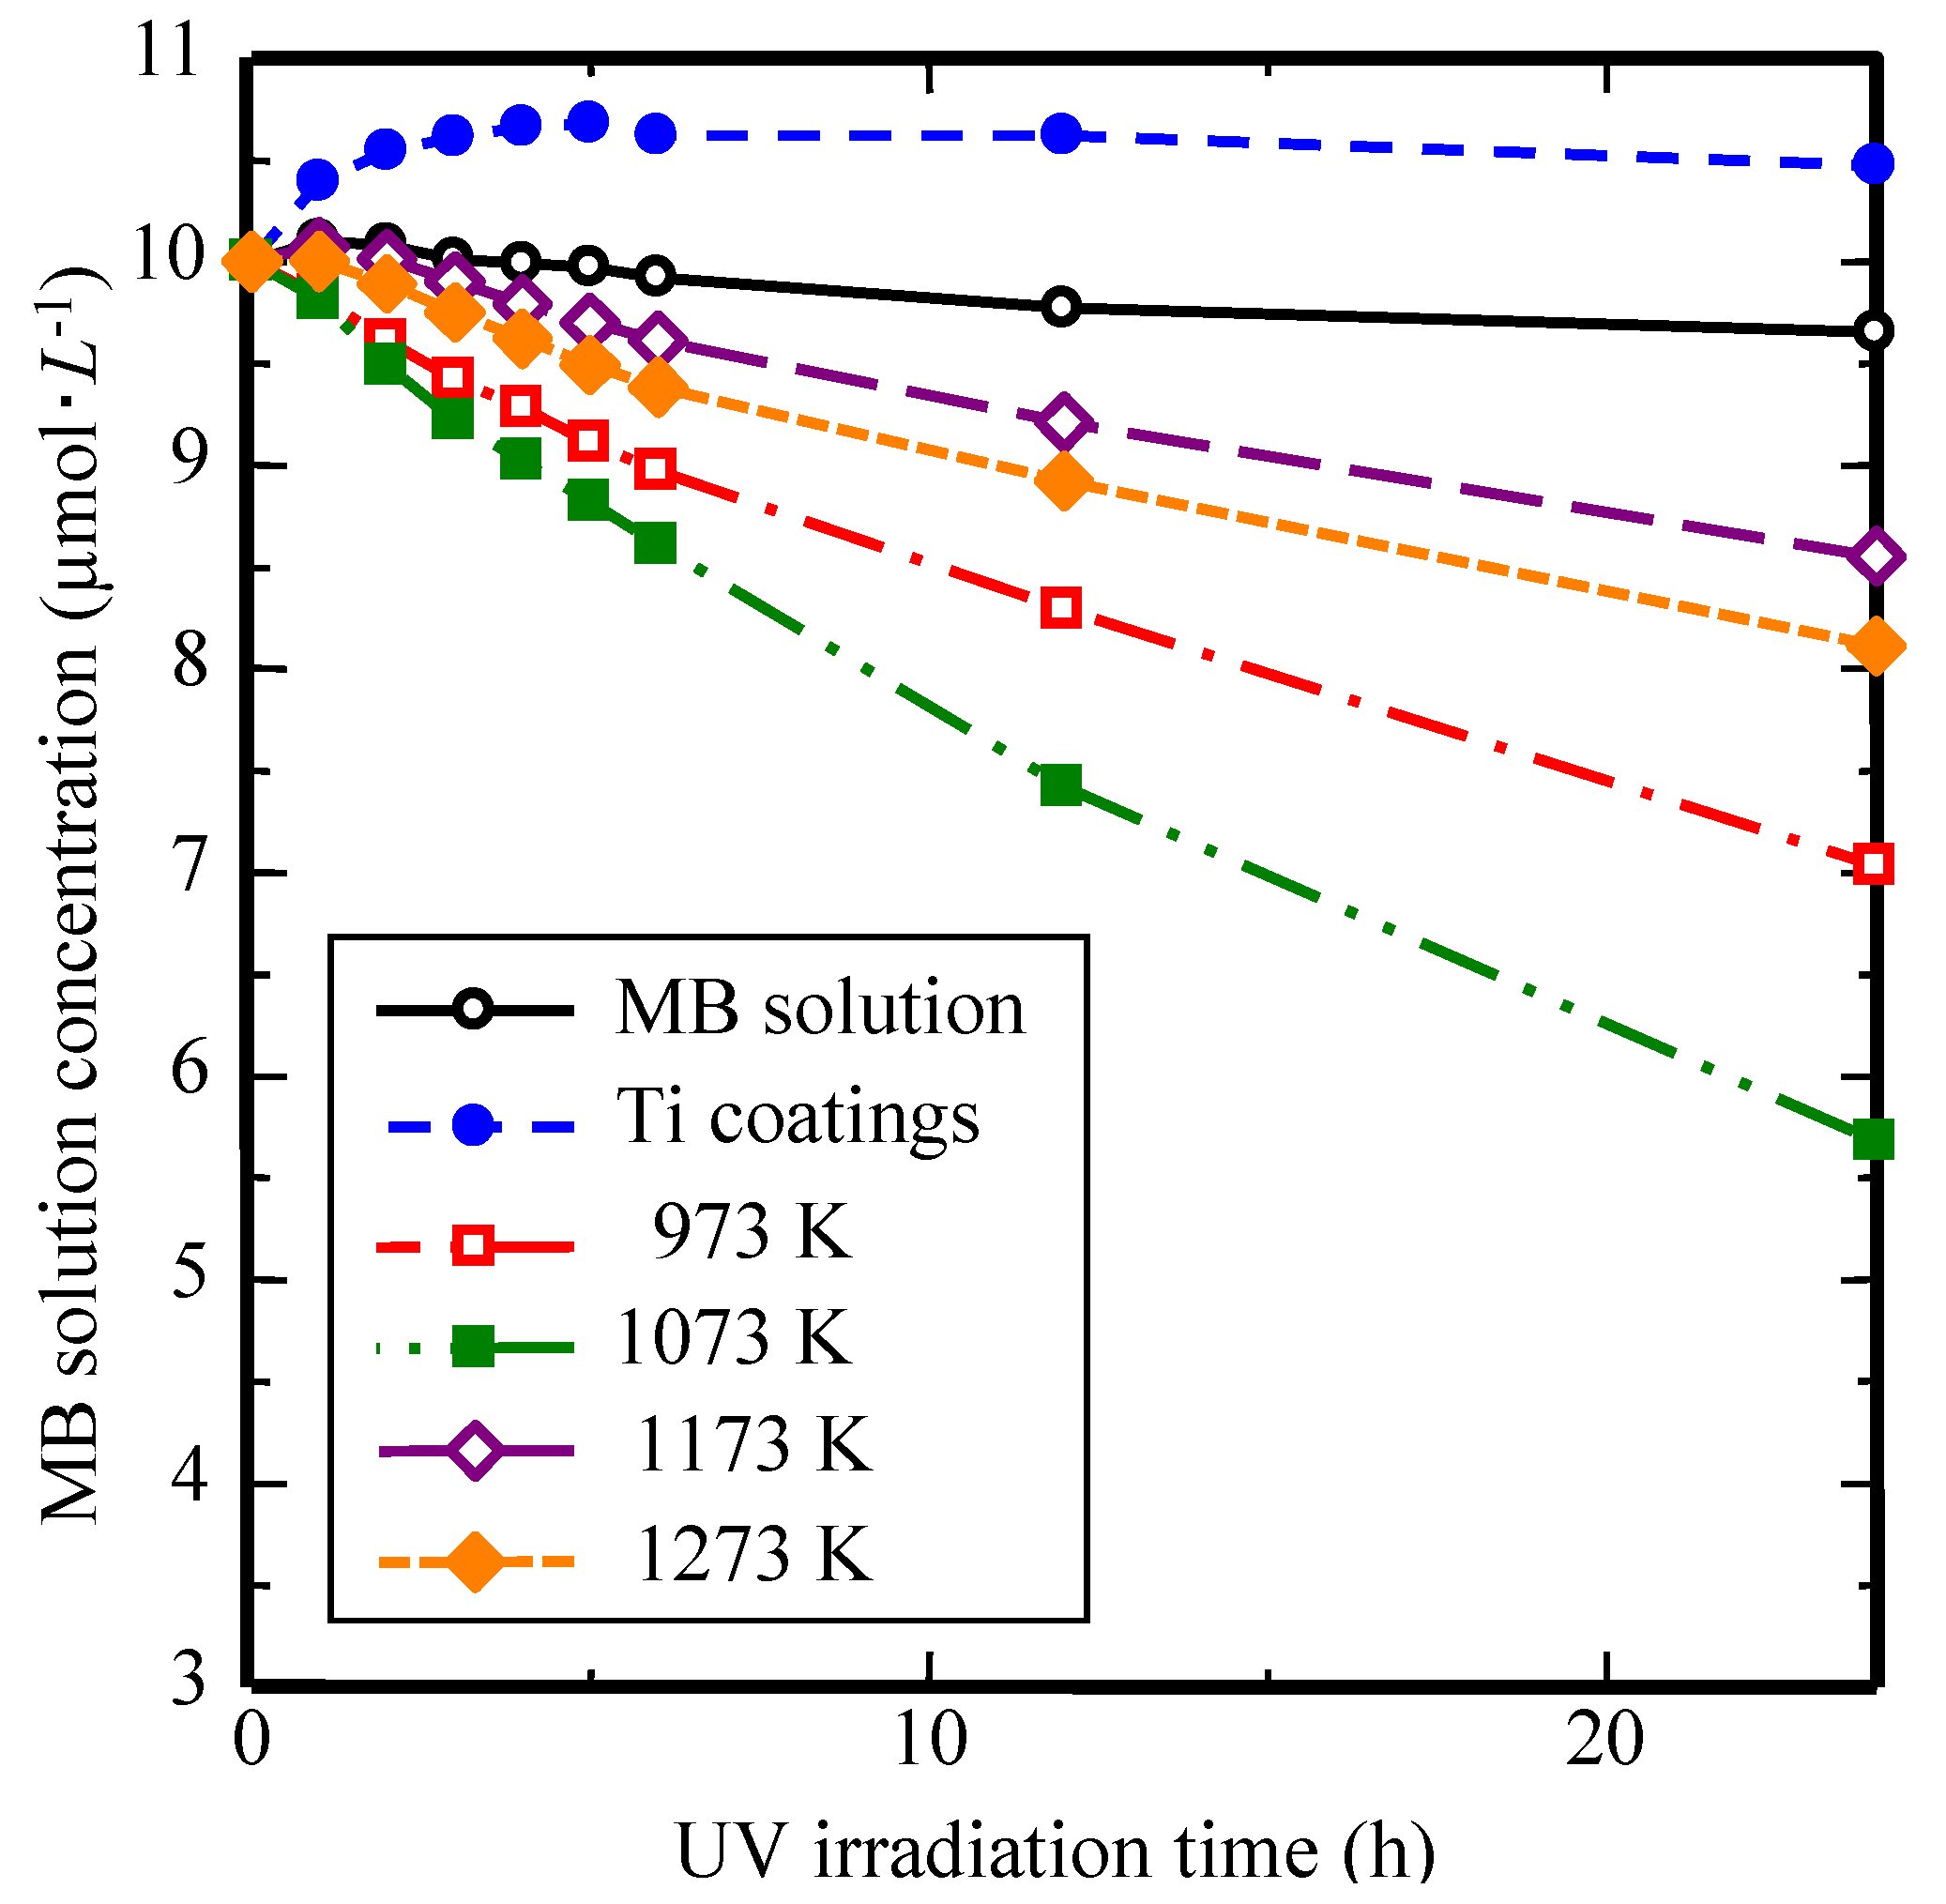
3.1. Influence on Photocatalyst Coatings of TiO2 by Oxidation Condition

During this study, the oxidation conditions focus on temperature and time. According to the Gibbs’ free energy theory, the influence on the crystal phase of TiO2 by temperature is more direct than that of time, and the crystal phase is one of the most important factors for photocatalytic activity of photocatalyst TiO2. Therefore, we divided this part into oxidation temperature and oxidation time.

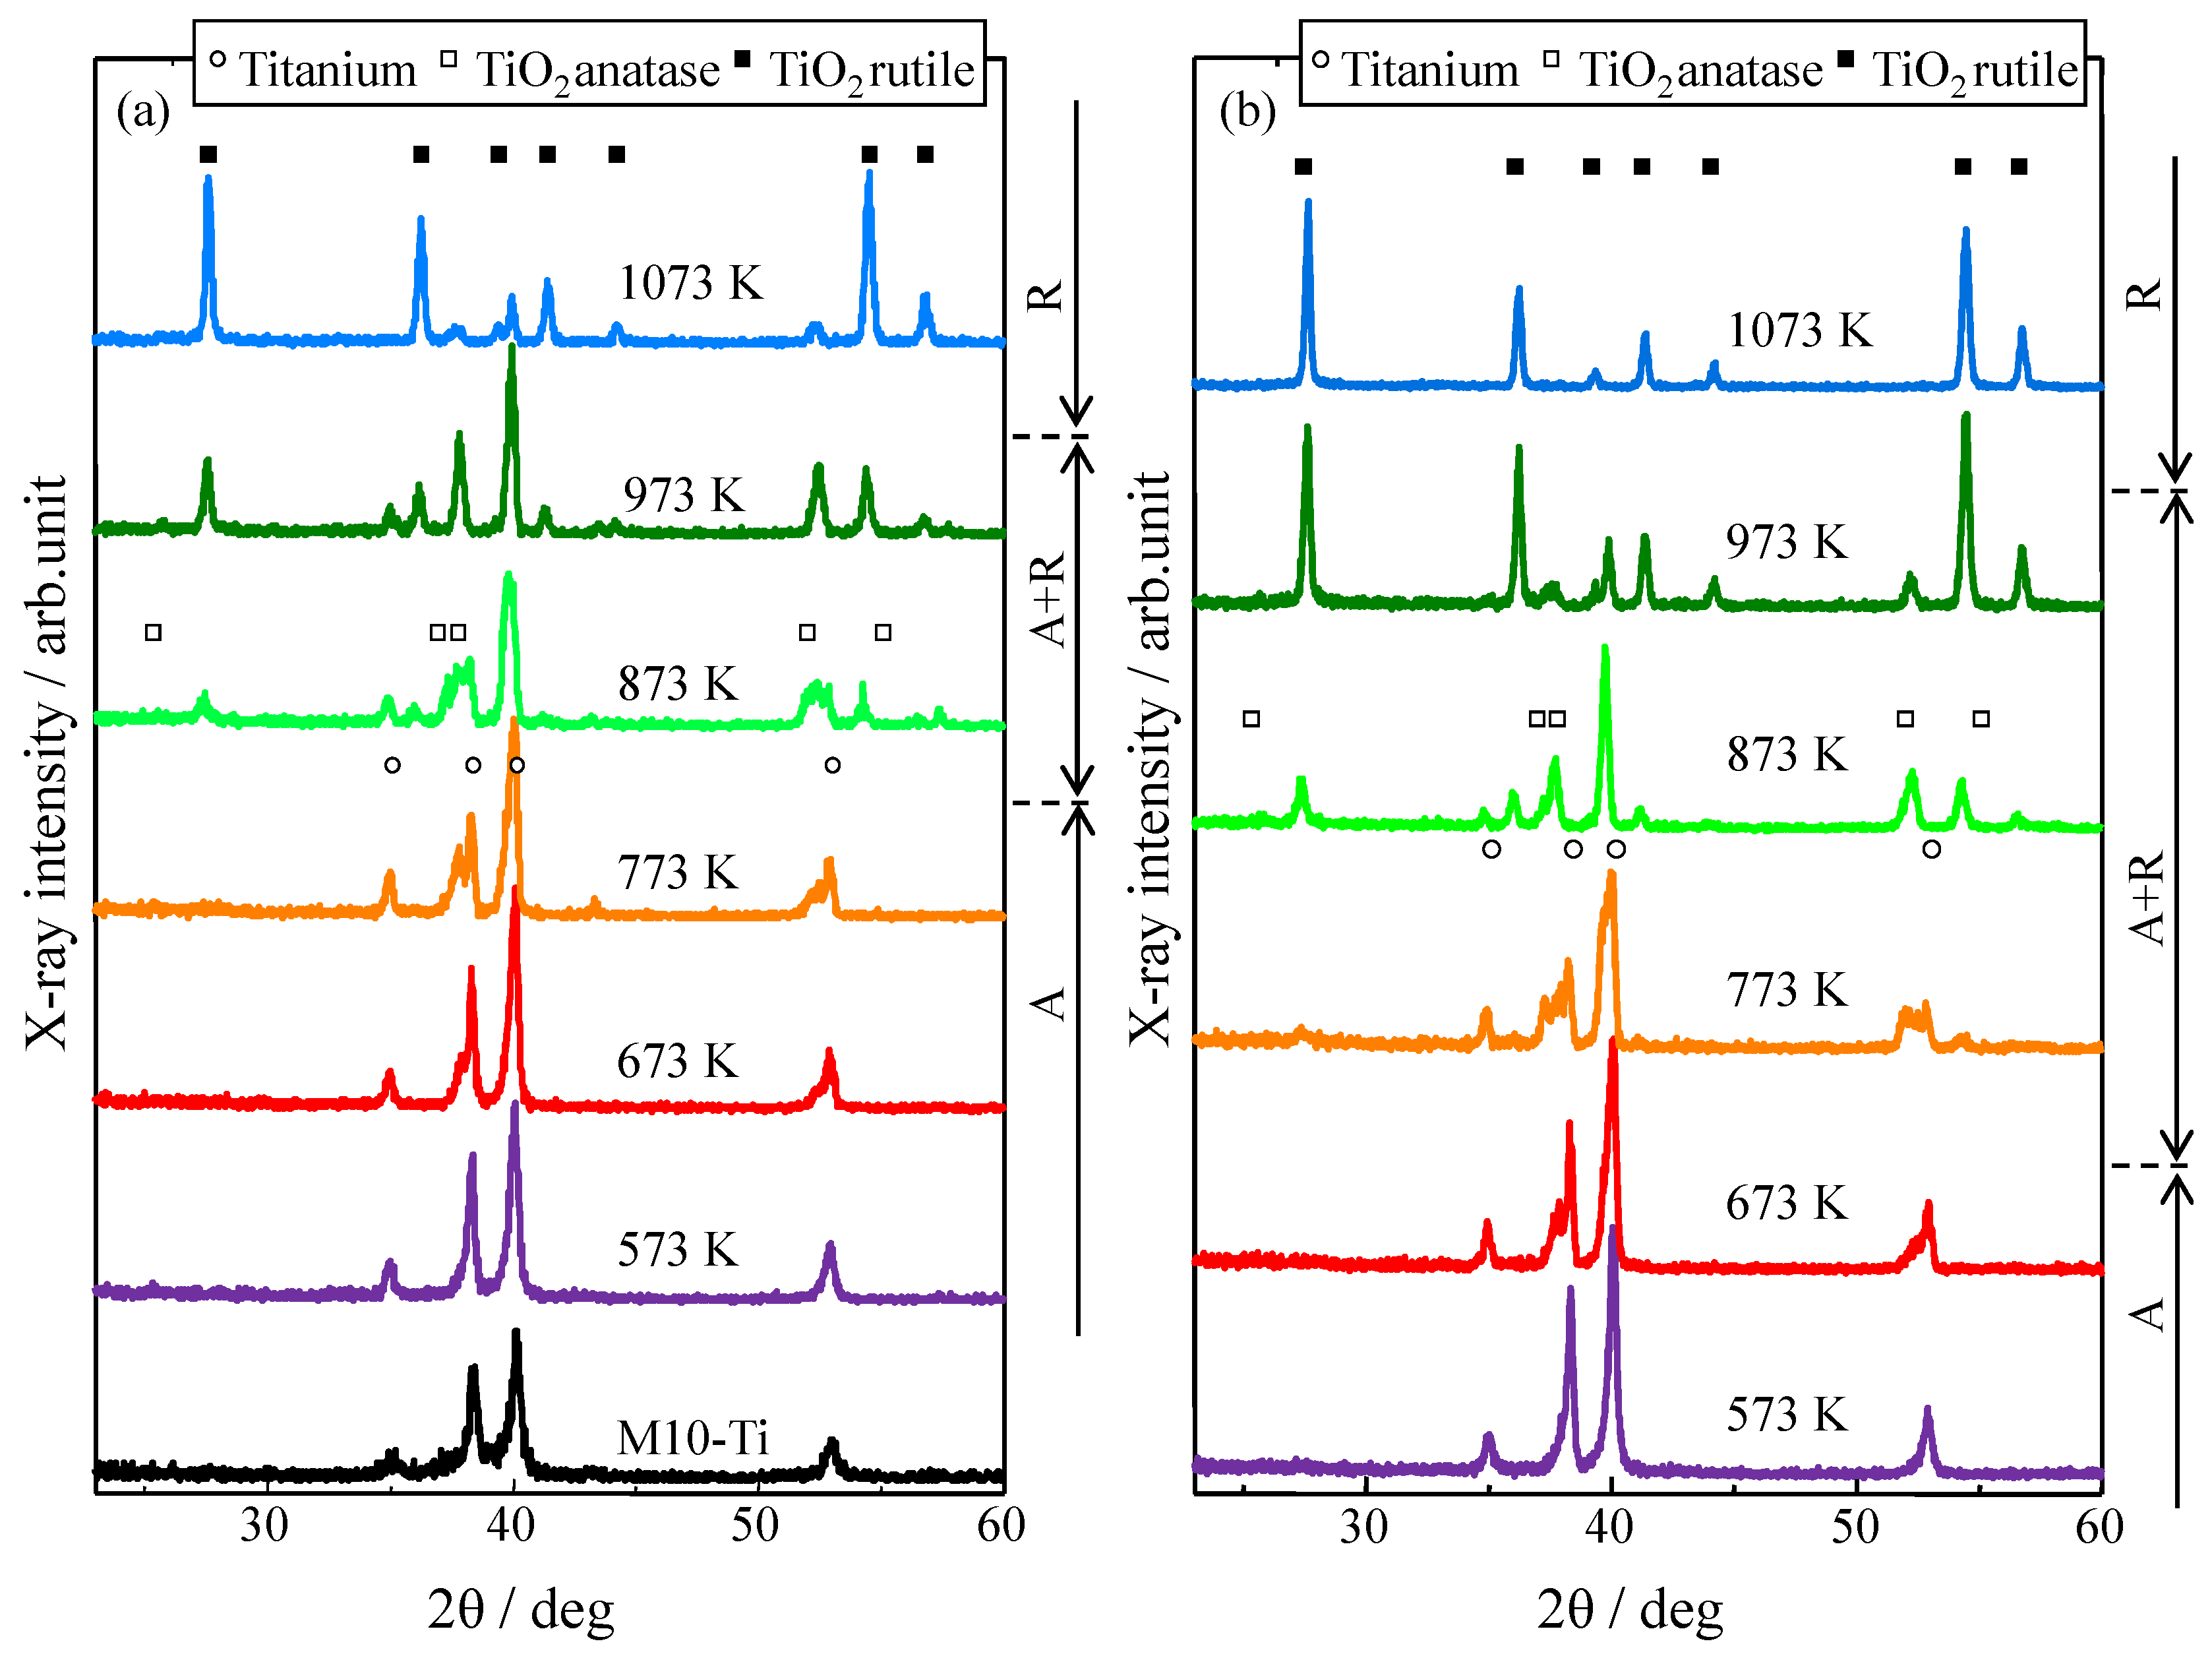
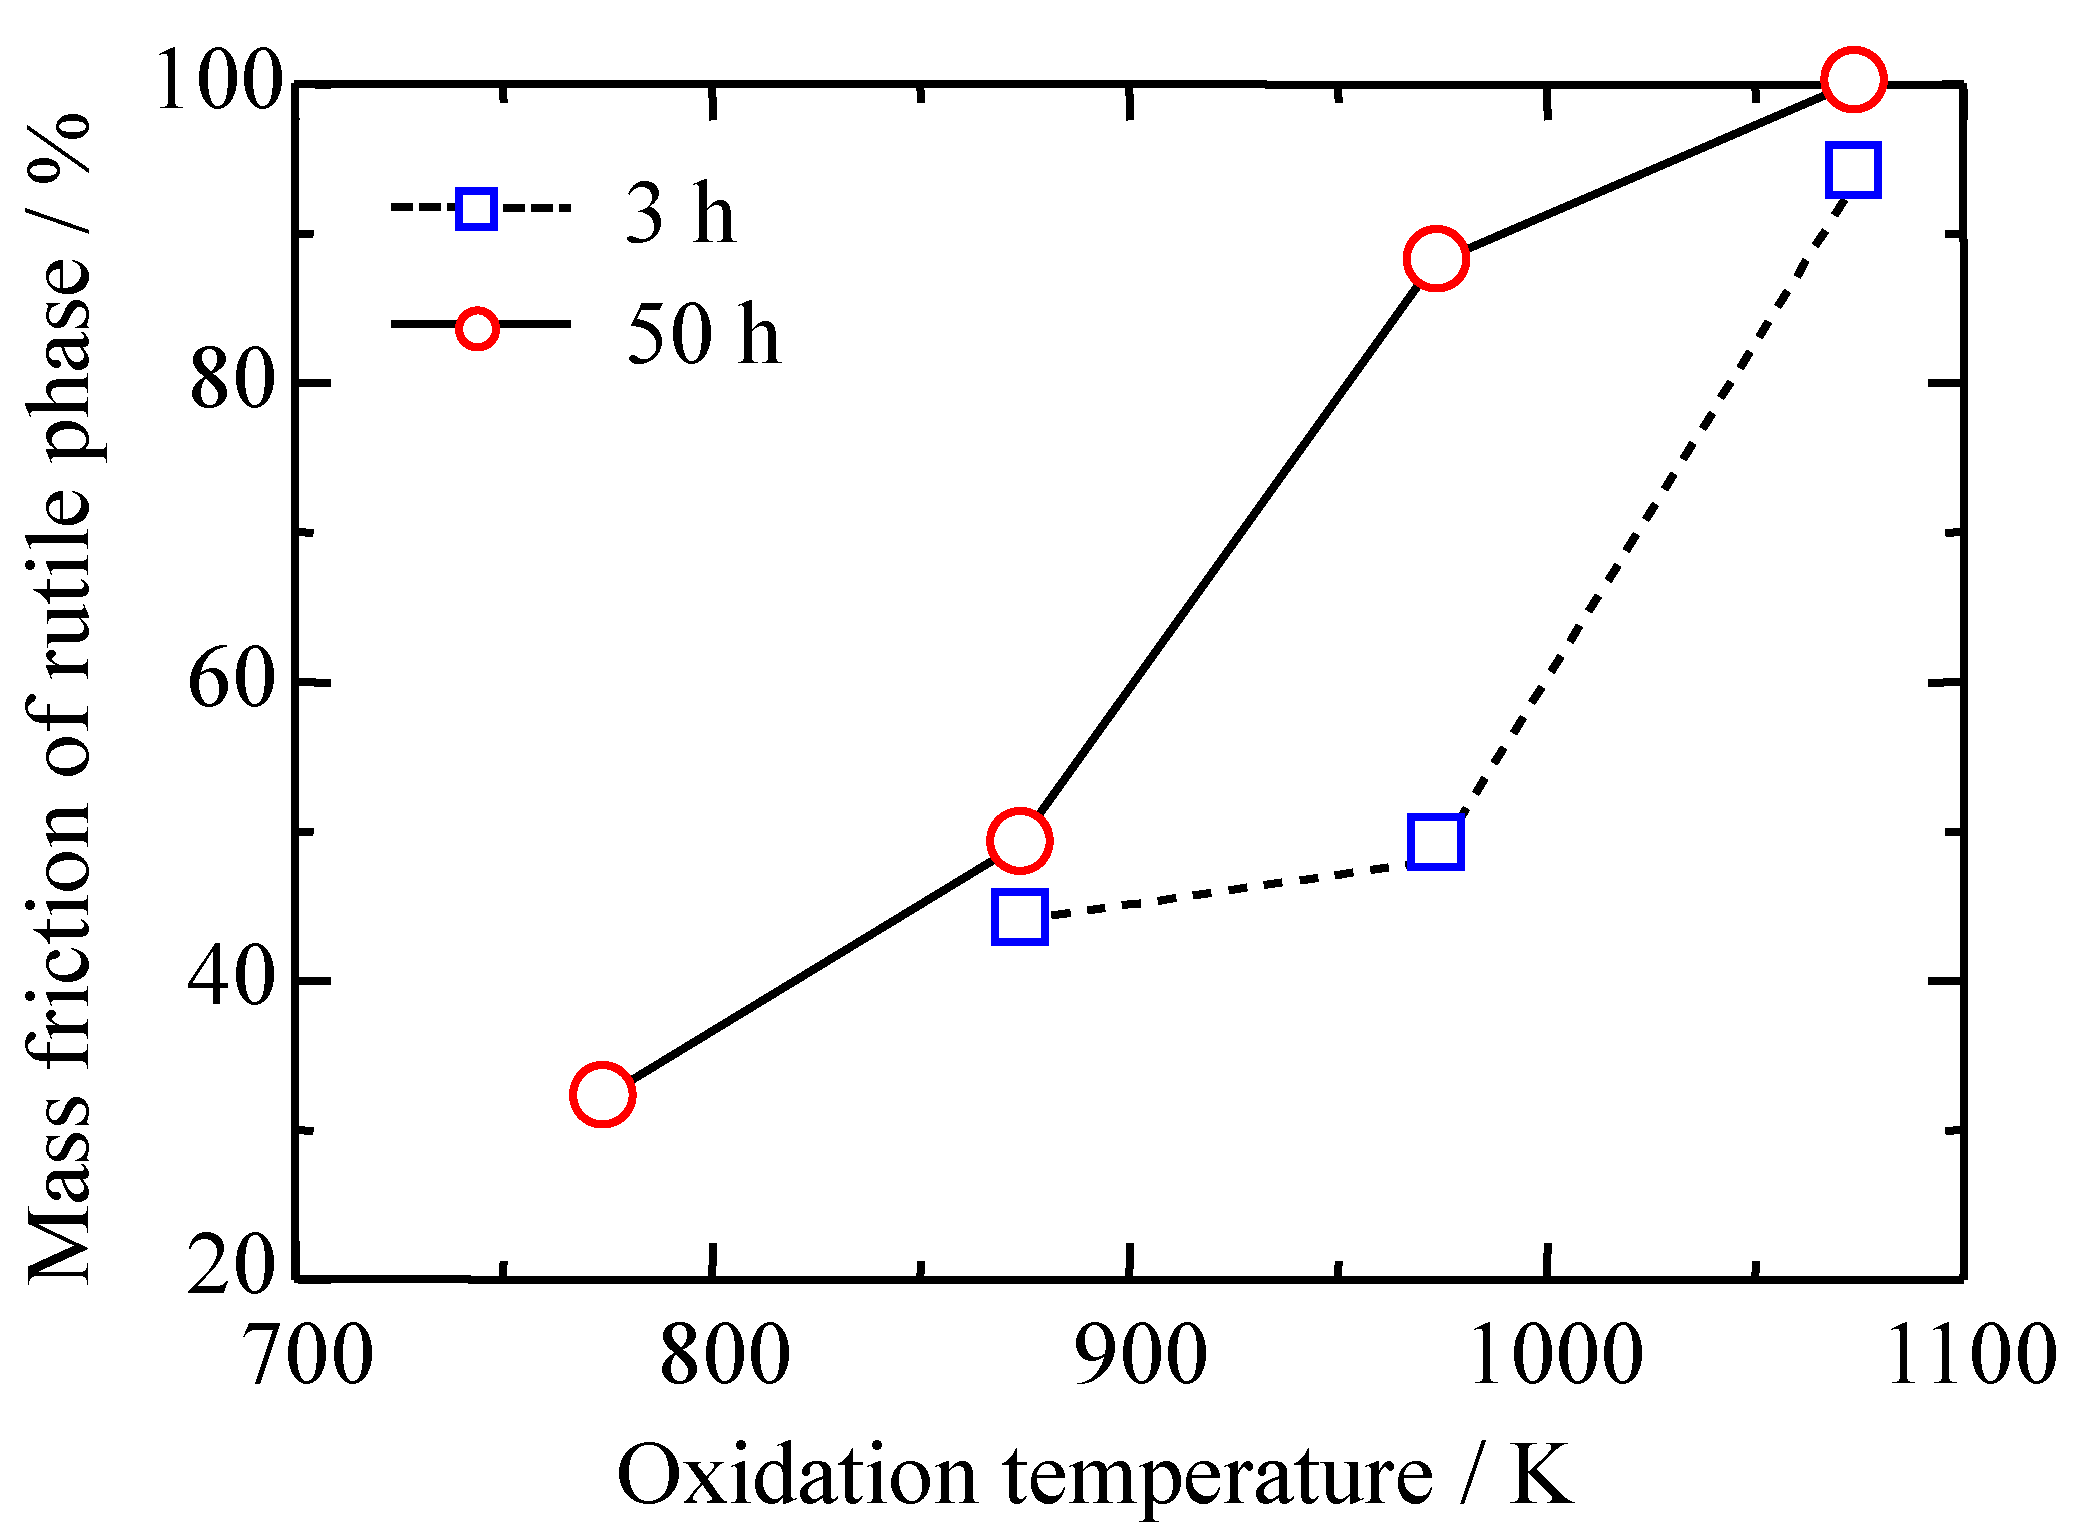
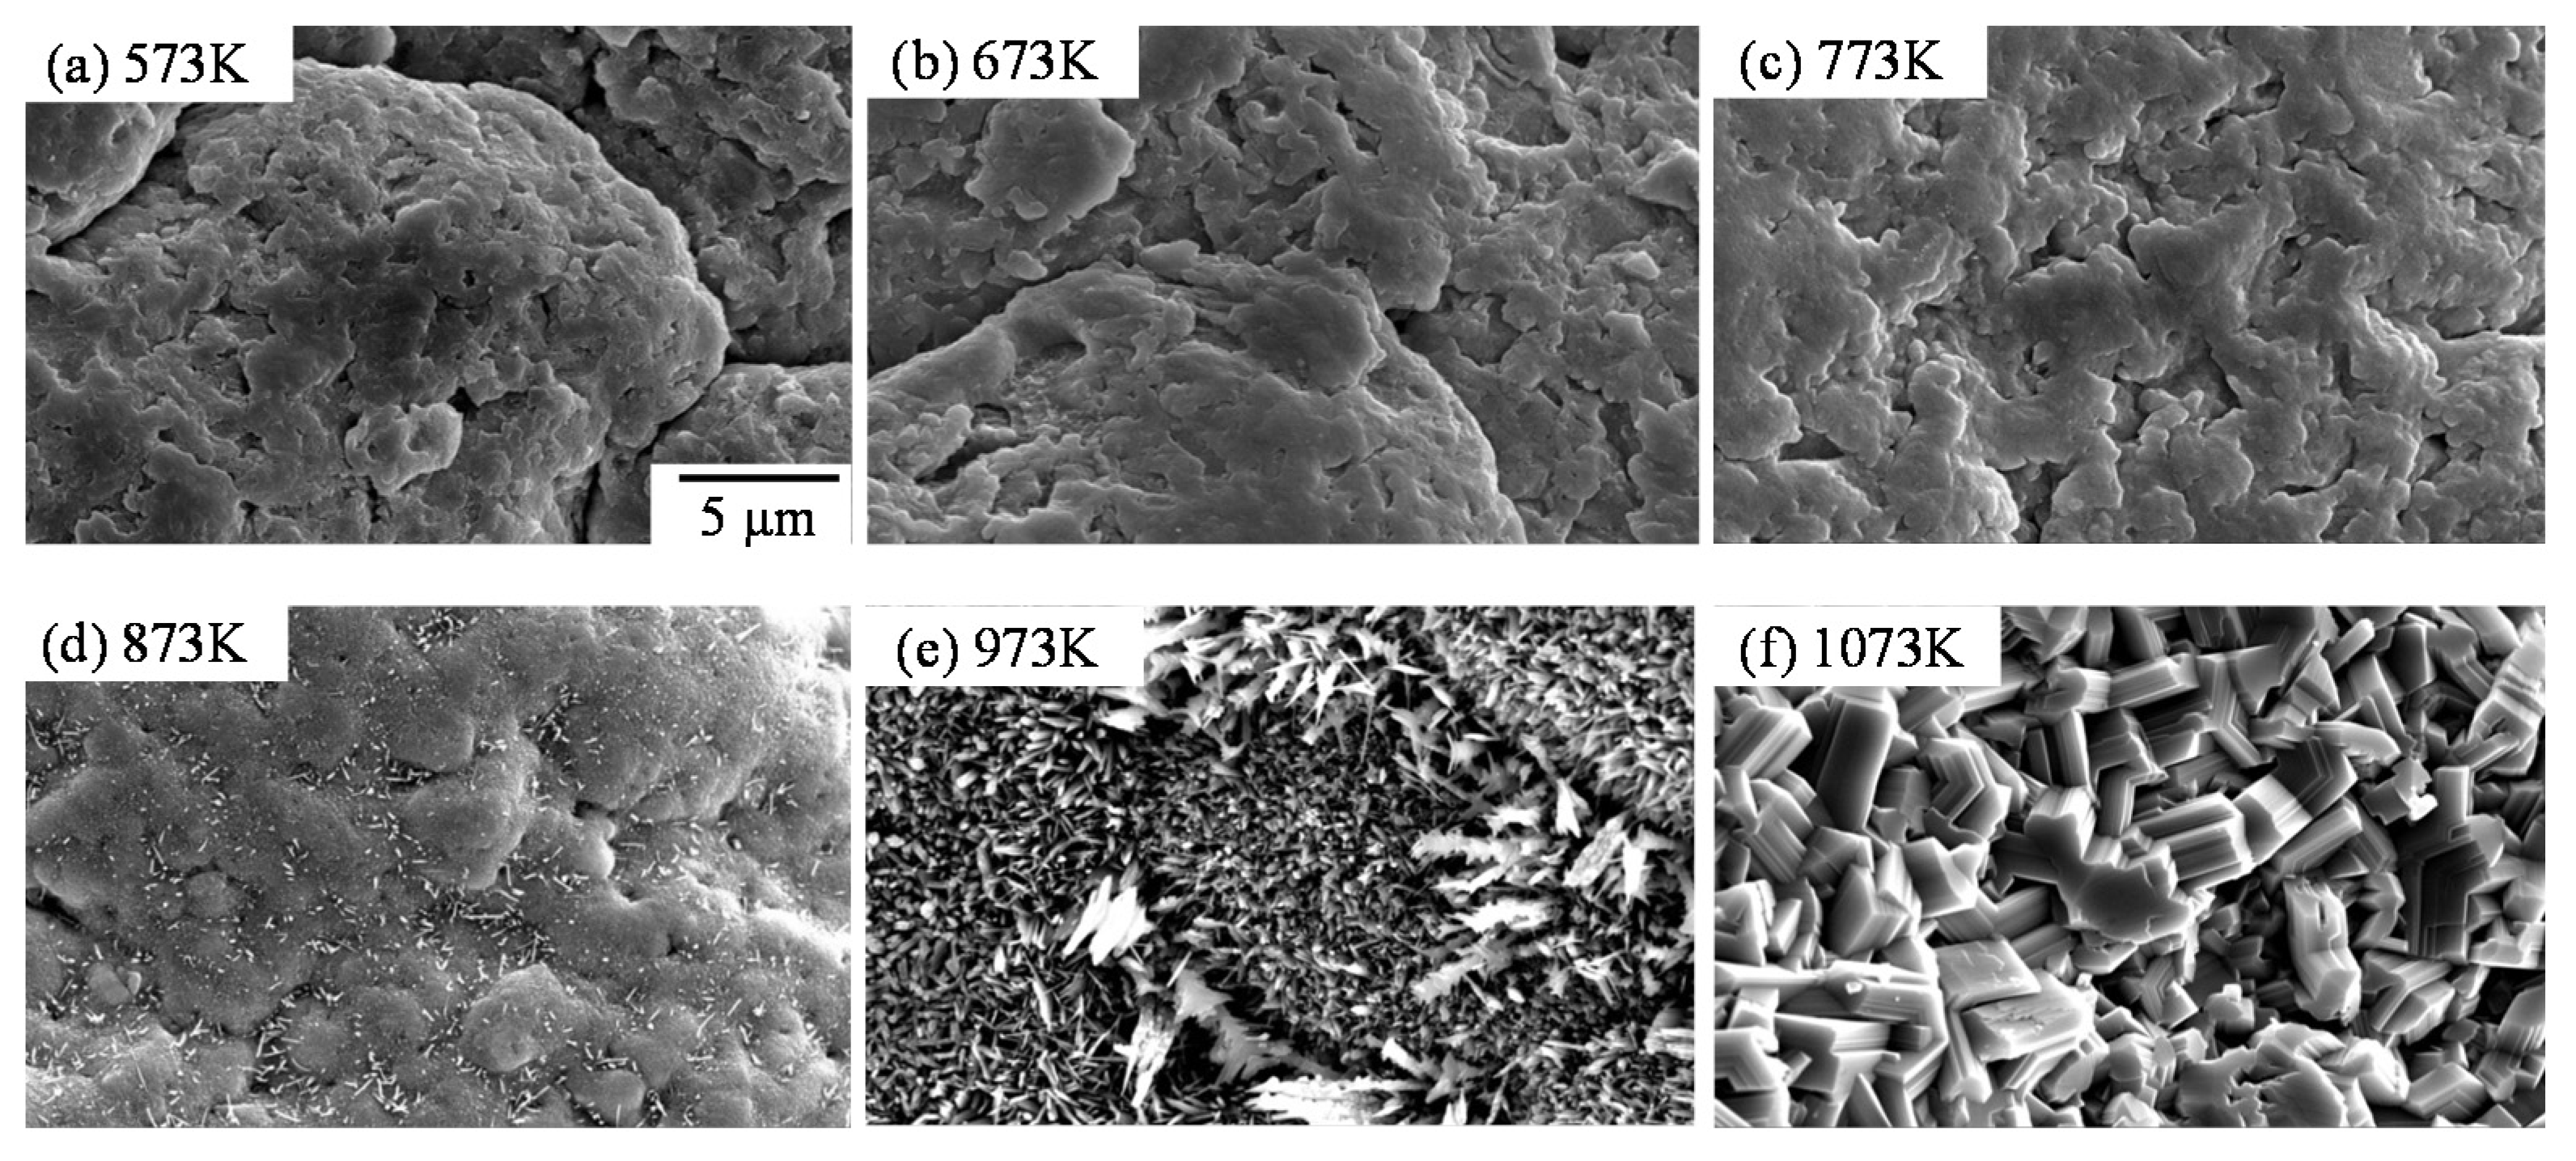
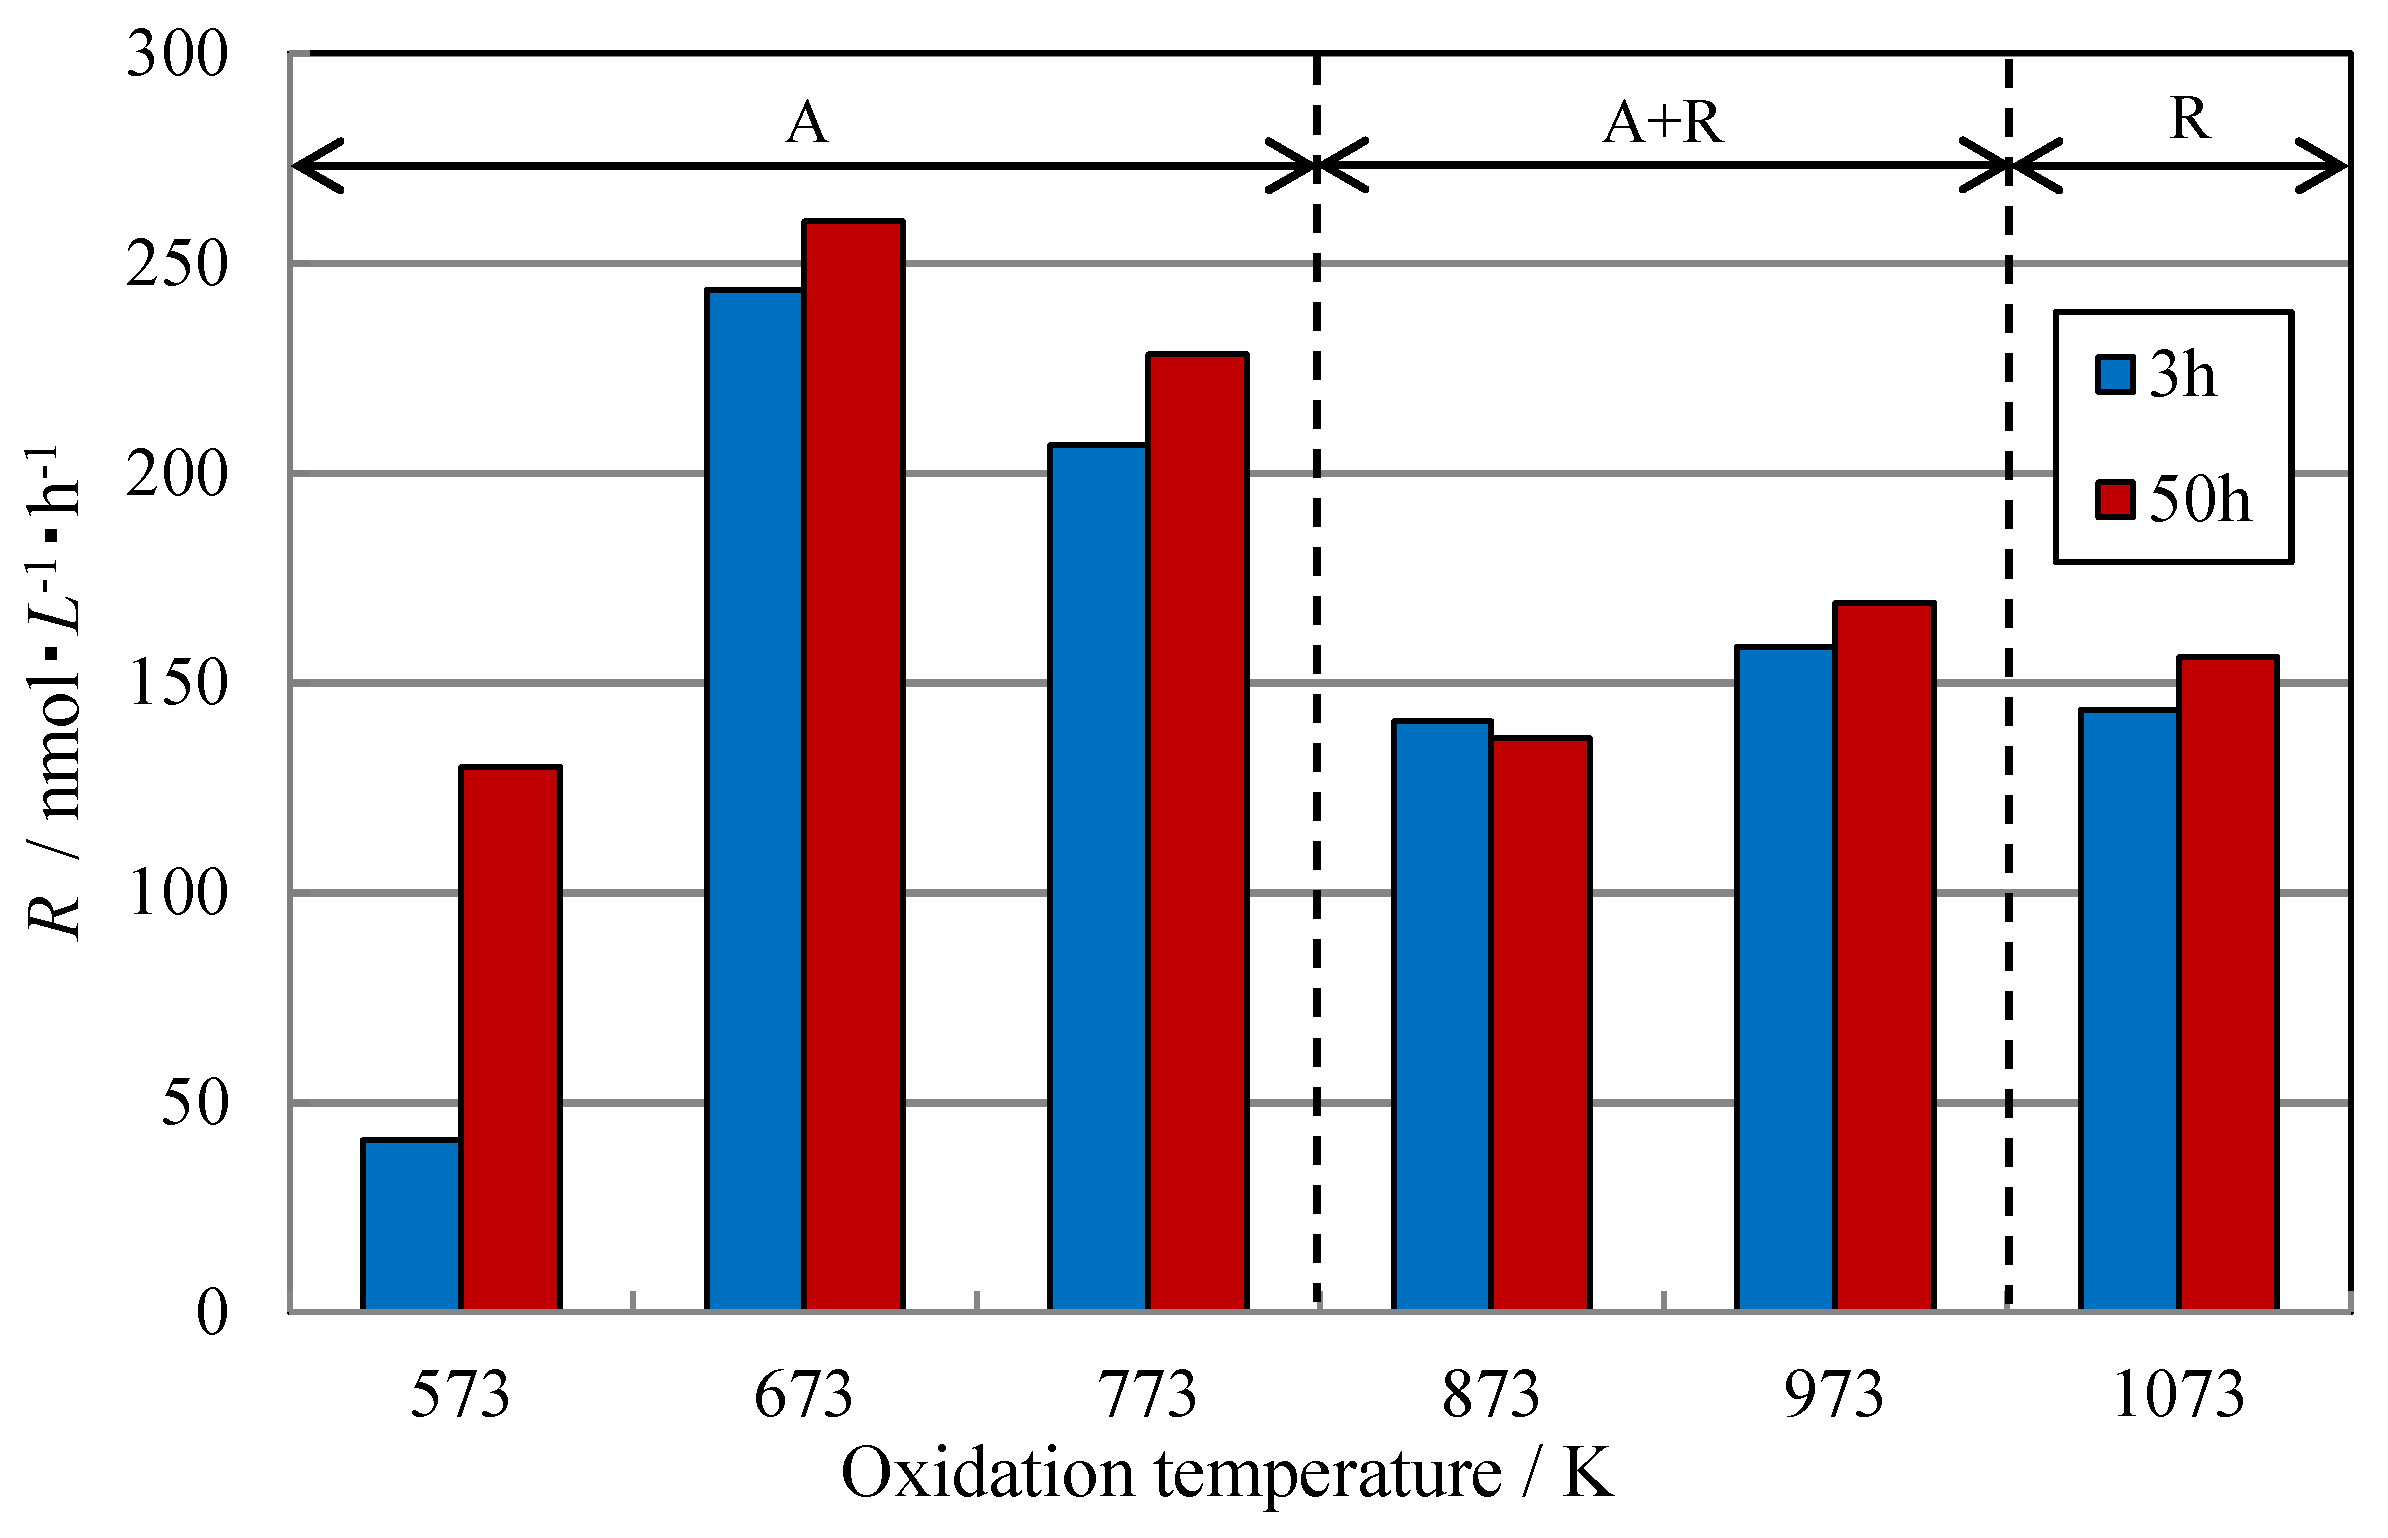
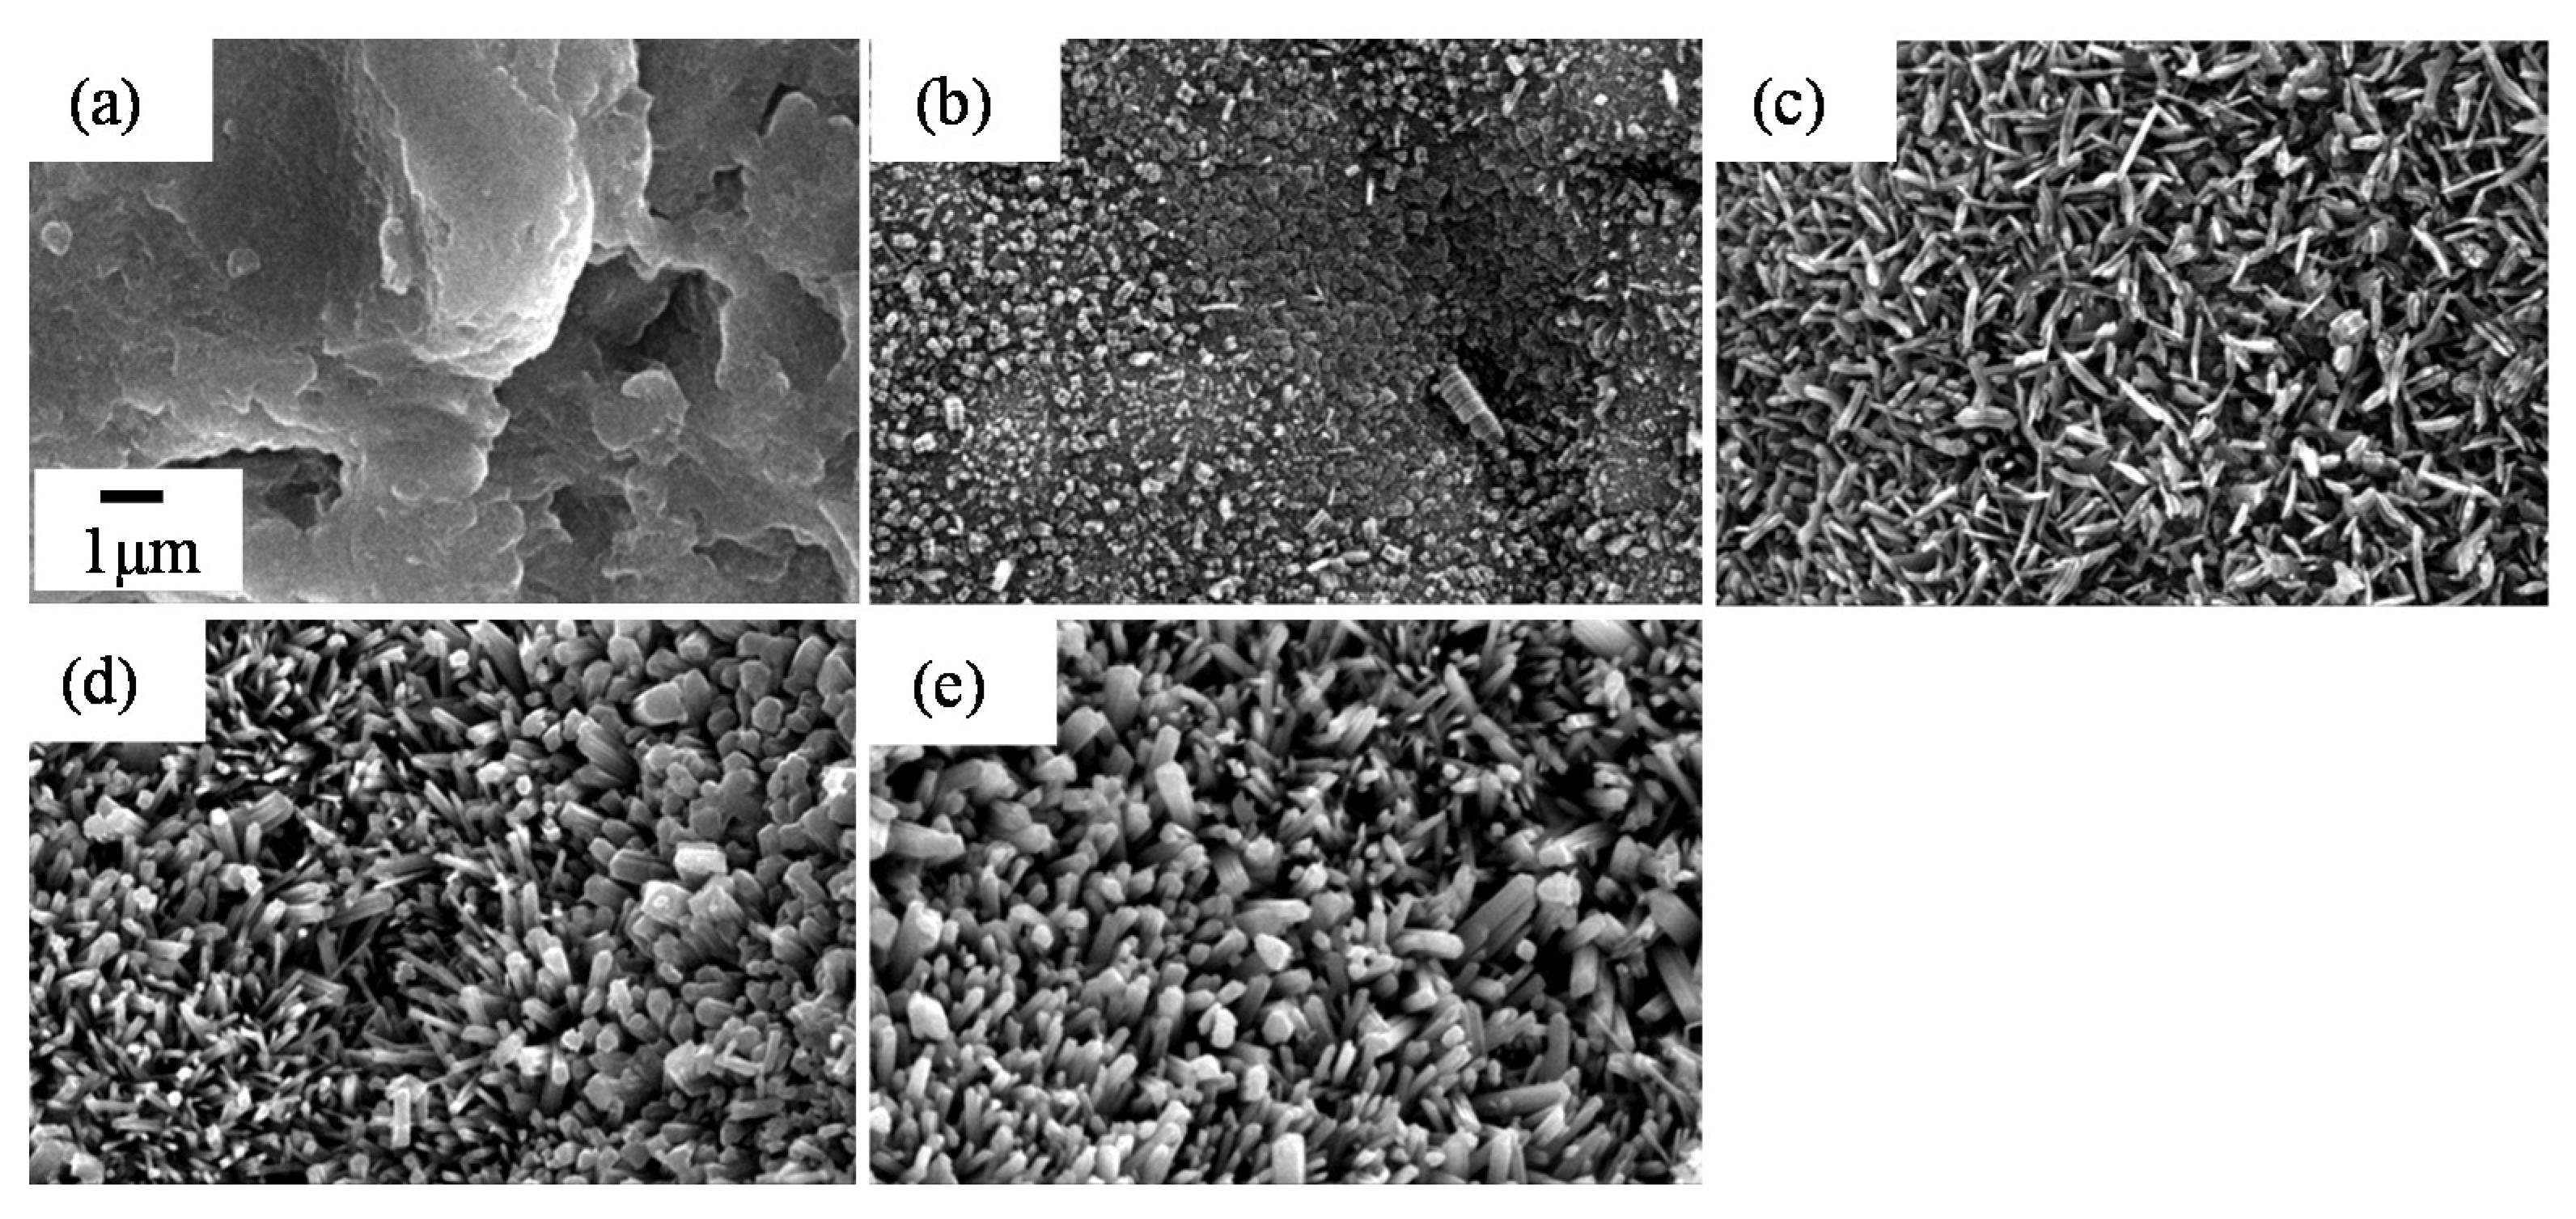
3.1.1. Focusing on Oxidation Temperature

Figure 22 shows the appearance photograph of M10-xK-yh samples. The Ti coatings (M10-Ti) show metallic color [8]. In contrast, the M10-xK-yh samples appear to have various colors, under different oxidation conditions, as shown in Figure 22. The color of TiO2 is related to the thickness of TiO2 coatings if the thickness is nano-sized, which hints the samples of TiO2 coatings with different thicknesses and nano-sizes were formed by each oxidation condition [27,36].
Figure 22. The appearance of the samples.
Coatings 05 00425 g022
Figure 23 shows the XRD patterns of the photocatalyst coatings on Al2O3 balls. It can be seen that only the diffraction peaks of Ti are detected for the M10-Ti samples. With the oxidation time of 3 h, the crystal structures of samples changed with the oxidation temperature are (1) anatase phase started to appear at 38.57° from the sample oxidized at 673 K, (2) mixed-phase of anatase and rutile started to appear at 873 K, and (3) anatase started to disappear at 1073 K. While extended the oxidation time to be 50 h, the crystal structures changed with the oxidation temperature are (1) anatase phase appeared at 673 K, (2) mixed-phase appeared at 773 K, and (3) anatase disappeared at 1073 K. As we know, the anatase-rutile phase transformation is a metastable-to-stable transformation and there is no equilibrium transformation temperature [37]. According to the Gibbs’ free energy (G) for the two phases (anatase, rutile), the energy difference ΔG between anatase and rutile phases at 773 K and 873 K are 3908 J·mol−1 and 3353 J·mol−1, respectively. Therefore, with extended oxidation time, the temperature of phase transformation had been decreased from 873 to 773 K. For comparison, the mass fraction of rutile (XR) was calculated from the respective peak intensities using the following equation [38]:
XR(%) = {1 − (1 + 1.26 IR/IA)−1} × 100
where IR and IA are X-ray intensities of the rutile (110) and anatase (004) peaks, respectively. The relationship between XR and the oxidation temperature with 3 h and 50 h is shown in Figure 24. The results show that the fraction of rutile (XR) had been increased quickly with extended oxidation time, and the XR at 973 K with 50 h is higher than that of 3 h.
SEM images of the surfaces of the samples are shown in Figure 25 and Figure 26. In Figure 25, no reaction compound is not detected from the surfaces of the samples oxidized at temperatures under 773 K with 3 h. A few reaction compounds as point-shape appeared from the samples oxidized at temperatures of 873 K. When increasing the oxidation temperature, the reaction compounds increase in number and finally grow to form the nano-size needle structure. It can be concluded that the observed reaction compounds are the rutile phase of TiO2, according to the needle-like structure and the XRD results above [39].
Figure 23. XRD patterns of M10-Ti and M10-xK-yh samples. (a) Oxidation time: 3 h; (b) Oxidation time: 50 h.
Coatings 05 00425 g023
Figure 24. Mass friction of rutile phase of the Ti coatings after oxidation.
Coatings 05 00425 g024
Figure 25. SEM images of surfaces of M10-xK-3h samples.
Coatings 05 00425 g025
Figure 26. SEM images of surfaces of M10-xK-50h samples.
Coatings 05 00425 g026
When extending the oxidation time to 50 h (Figure 26), there is also no observed reaction compound, even at 773 K. The reaction compounds also started to be detected from the temperature of 873 K, and the number of the needle-like structures is more than that during 3 h. When the temperature is increased up to 973 K and 1073 K with the oxidation time of 50 h, the structures of nano-size needles grow to become fiber-like structures (Figure 26e), and finally form columnar-like structures (Figure 26f). These mean the oxidative effect at relatively lower temperatures almost reached that of higher temperatures with an extended oxidation time, which is in line with the known time-temperature equivalence principle [40]: The structure at 873 K of 50 h is similar to that of 973 K of 3 h.
Figure 27 and Figure 28 show SEM images of the cross sections of the samples. The oxidized layer could not be detected from the samples at oxidation condition of 873 K for 3 h and 773 K for 50 h, respectively. If the oxidation temperature was increased up to 973 K during 3 h, the oxidized layer on the coatings could be clearly observed from the outer layer and parts of the inner layer, which forms the TiO2/Ti-TiO2 structure. When extending the oxidation time to 50 h, the TiO2/Ti-TiO2 structure could be observed at 873 K, which matches the XRD pattern. With increases in the temperature for the same duration or increasing the duration and maintaining the temperature (higher than 873 K), the oxidized layer increases to become more obvious and thicker, which is in line with the time-temperature equivalence principle. Figure 29 shows the increase in thickness of TiO2 coatings is linear, at an oxidation temperature of 1073 K. When the oxidation lasts up to 50 h, the reason for the larger thickness is that Ti coatings were almost oxidized into TiO2 coatings, shown as Figure 28f. Therefore, the thickness of TiO2 coatings is related with the thickness of the formed Ti coatings during MCT process.
Figure 27. SEM images of cross sections of M10-xK-3h samples.
Coatings 05 00425 g027
Figure 28. SEM images of cross sections of M10-xK-50h samples.
Coatings 05 00425 g028
Figure 29. Relationship between oxidation time at 1073 K and thickness of TiO2 coatings.
Coatings 05 00425 g029
Figure 30 shows the degradation of MB solution in the presence of the samples under UV irradiation, with the diameter of test cell is 18 mm. The concentration of the blank (marked with MB solution) hardly decreased, which hints the MB solution did not degrade. According to the Ti coatings (marked with M10-Ti), Ti coatings also hardly have any photocatalytic activity. However, the oxidized samples all show the photocatalytic activity, according to the change of concentration of MB solution. The samples oxidized by the temperature of 673 K show higher photocatalytic activity than others, as to the main anatase phase [18]. When increasing the temperature, the anatase phase transformed into rutile phase, and the photocatalytic activity decreased, which suggests that the photocatalytic activity of anatase TiO2 is higher than that of mixed-phase or rutile TiO2 under UV irradiation [41,42,43,44]. Figure 31 shows the trend of the degradation rate constants R, calculated from the plots of concentration versus irradiation time curves. Presented by the samples oxidized at a series of temperatures with 3 h and 50 h, the trend of R first increased and then decreased, finally remaining almost constant. In contrast, R of the samples with the oxidation time of 50 h is higher than that of 3 h, which is below that at temperatures from 573 to 1073 K.
Figure 30. Relationship between MB solution concentration and UV irradiation time of samples.
Coatings 05 00425 g030
Figure 31. Degradation rate constant of M10-xK-yh samples.
Coatings 05 00425 g031
The photocatalytic activity of samples might depend on the crystal structure and morphology, which could be controlled by changing the oxidation condition. With the growth of the anatase phase of samples, the photocatalytic activity is the highest at the temperature of 673 K with almost anatase TiO2, because anatase is a better photocatalyst than rutile [45]. When increasing the temperature, phase transformation from anatase to rutile would occur. However, at the temperature of 873 K, the content of rutile is little, and the charge transfer between rutile and anatase is limited to some extent [18]. Meanwhile, at temperatures up to 973 K, the photocatalytic activity is higher, because sufficient rutile content had been formed, and the charge transfer between rutile and anatase could suppress the recombination [46,47,48]. However, photocatalytic activity of the samples oxidized at 1073 K is decreased. That may be related to the extent of rutile formed, as rutile phase absorbs much light. In addition, the microstructures of surface at 973 K are needle-like structures, which is better than that with too little rutile oxidized at 873 K and with too much or larger size rutile at 1073 K. According to the results showing the cross-section and photocatalytic activity, it seems the influence of thicknesses from 8 to 52 μm at 1073 K on photocatalytic activity was not significant.

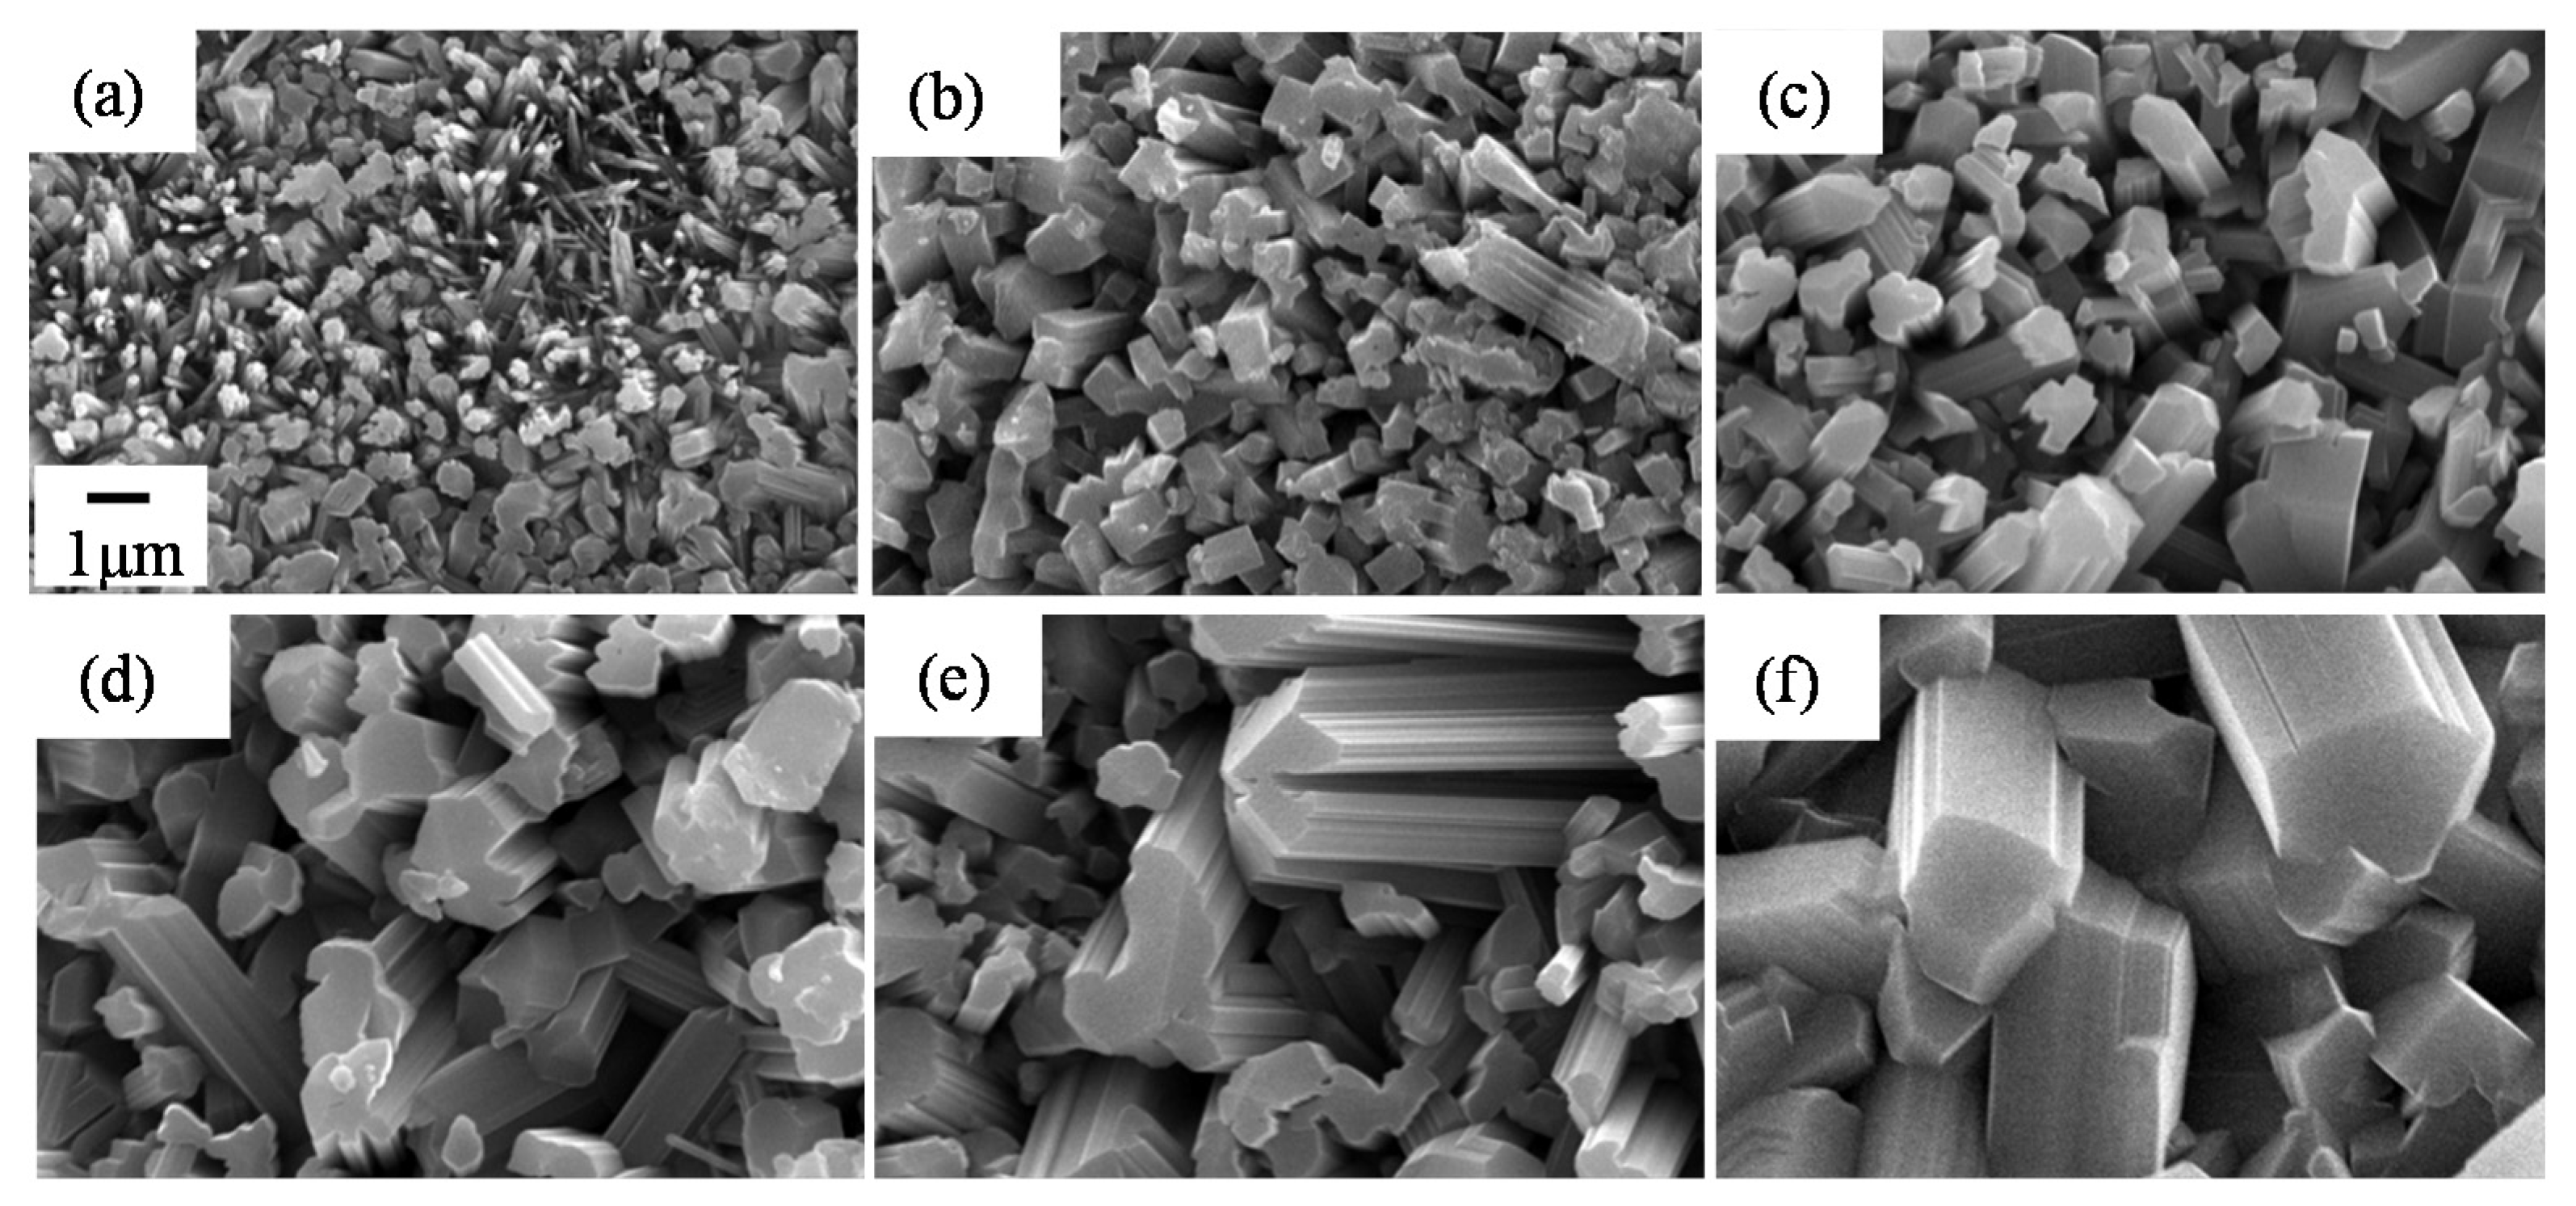
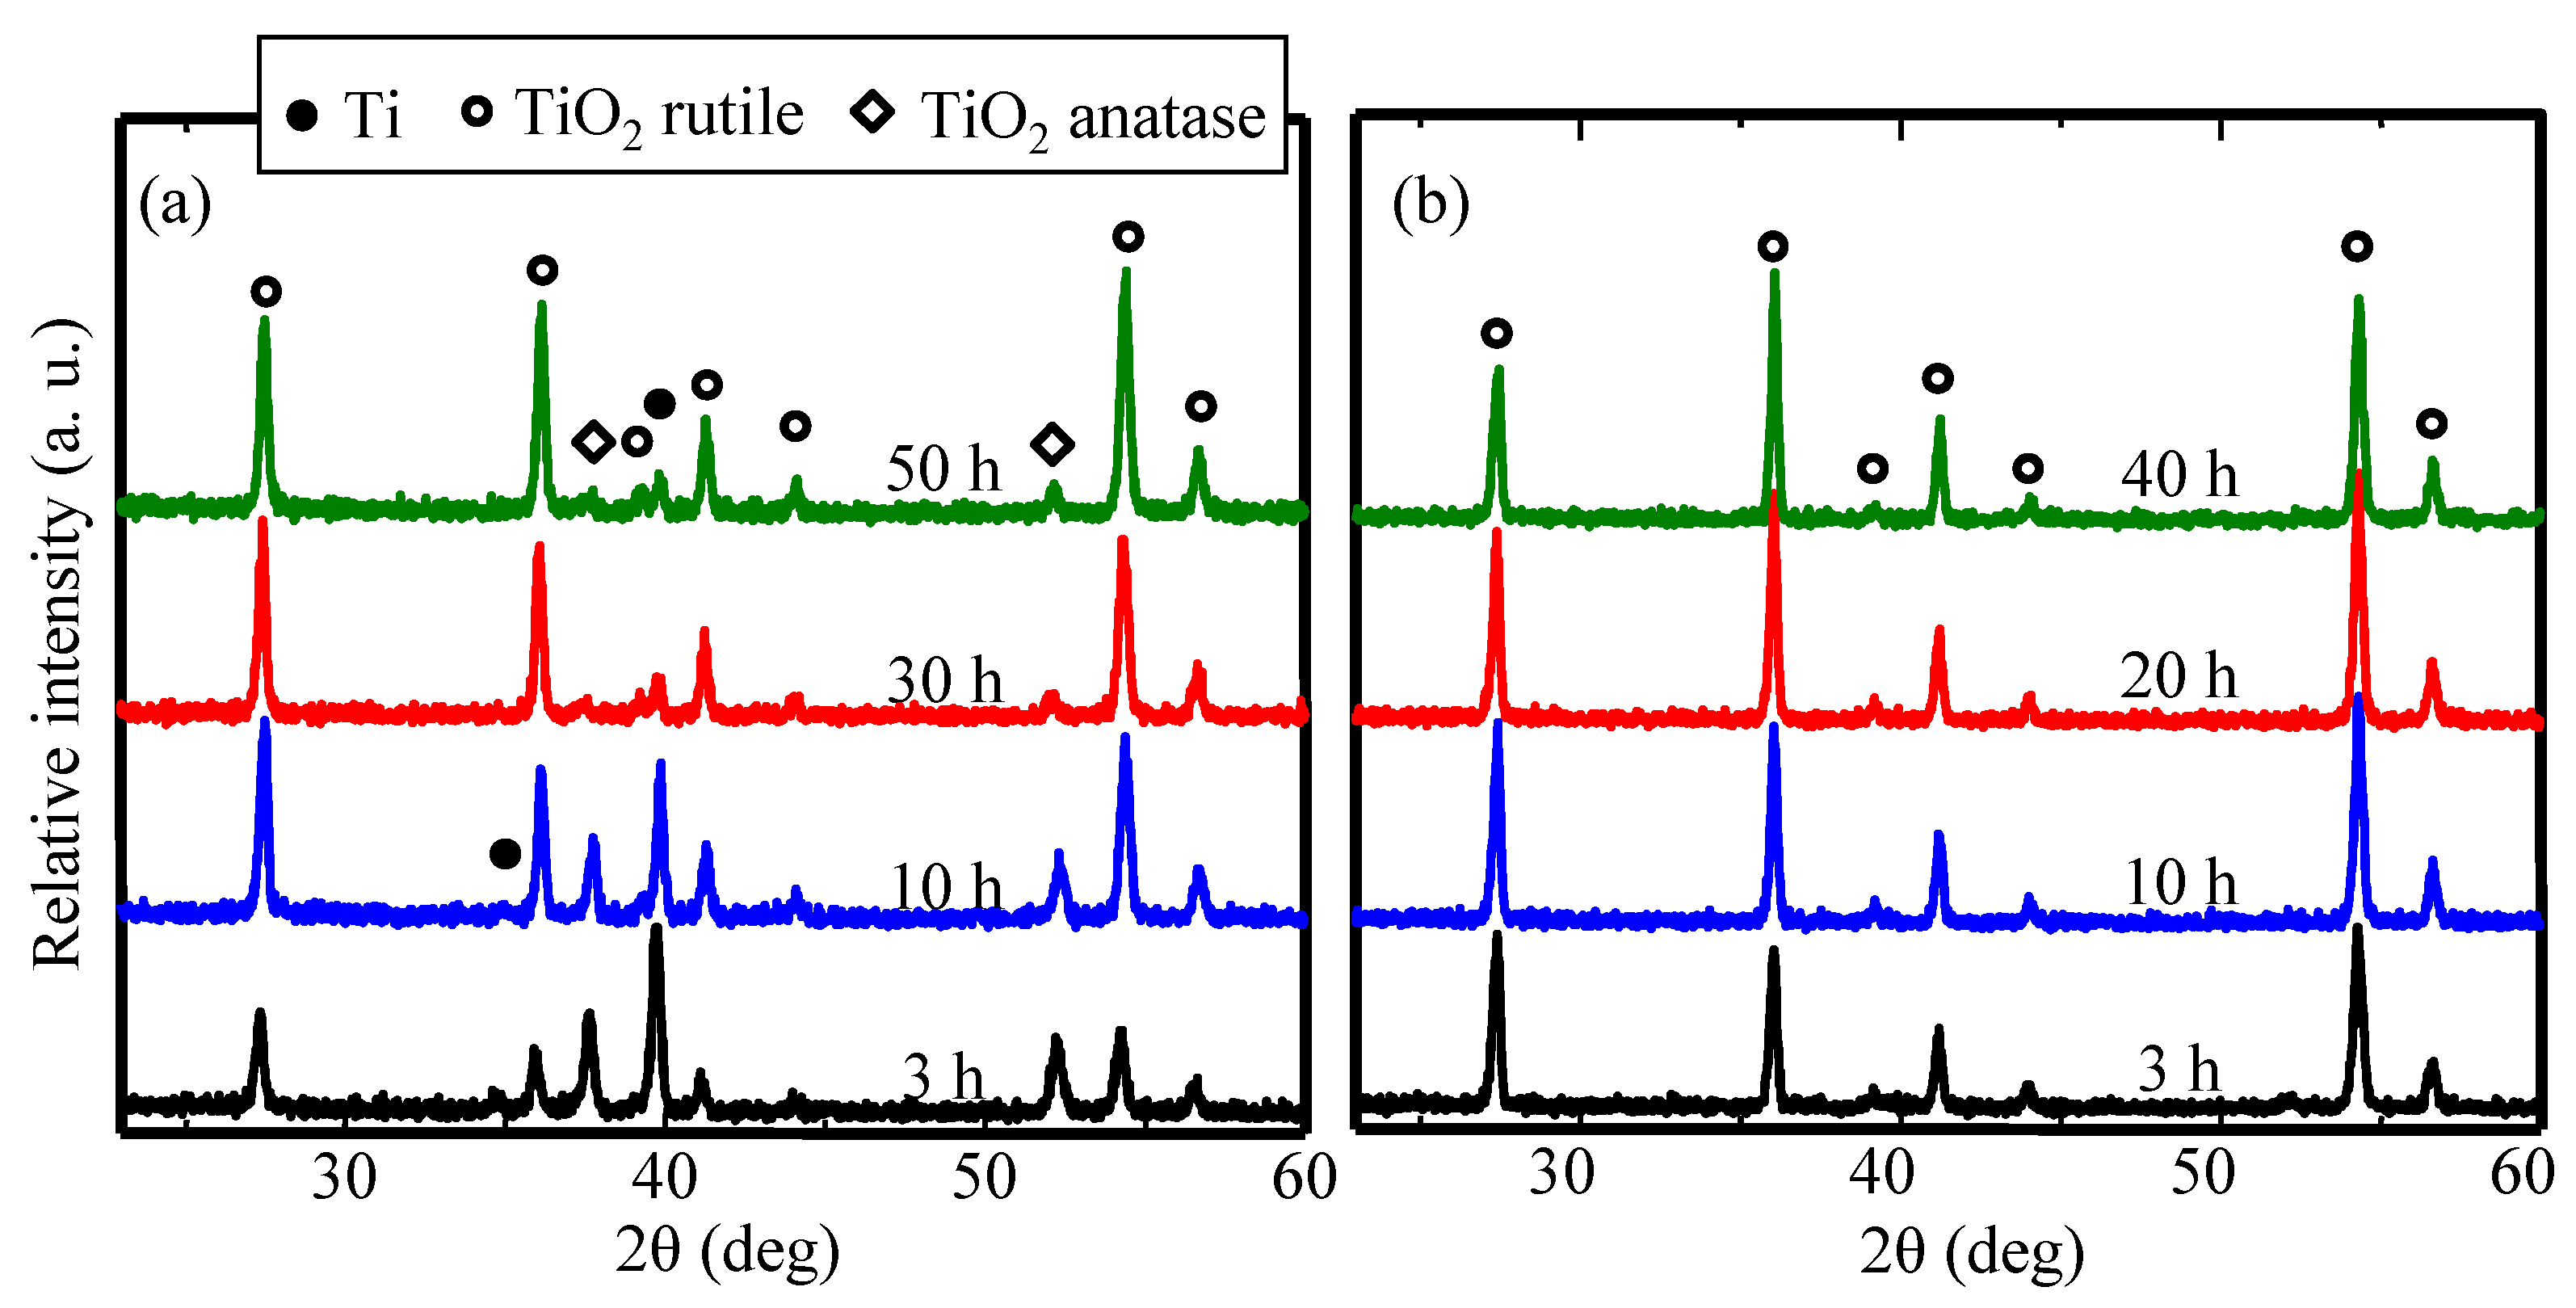
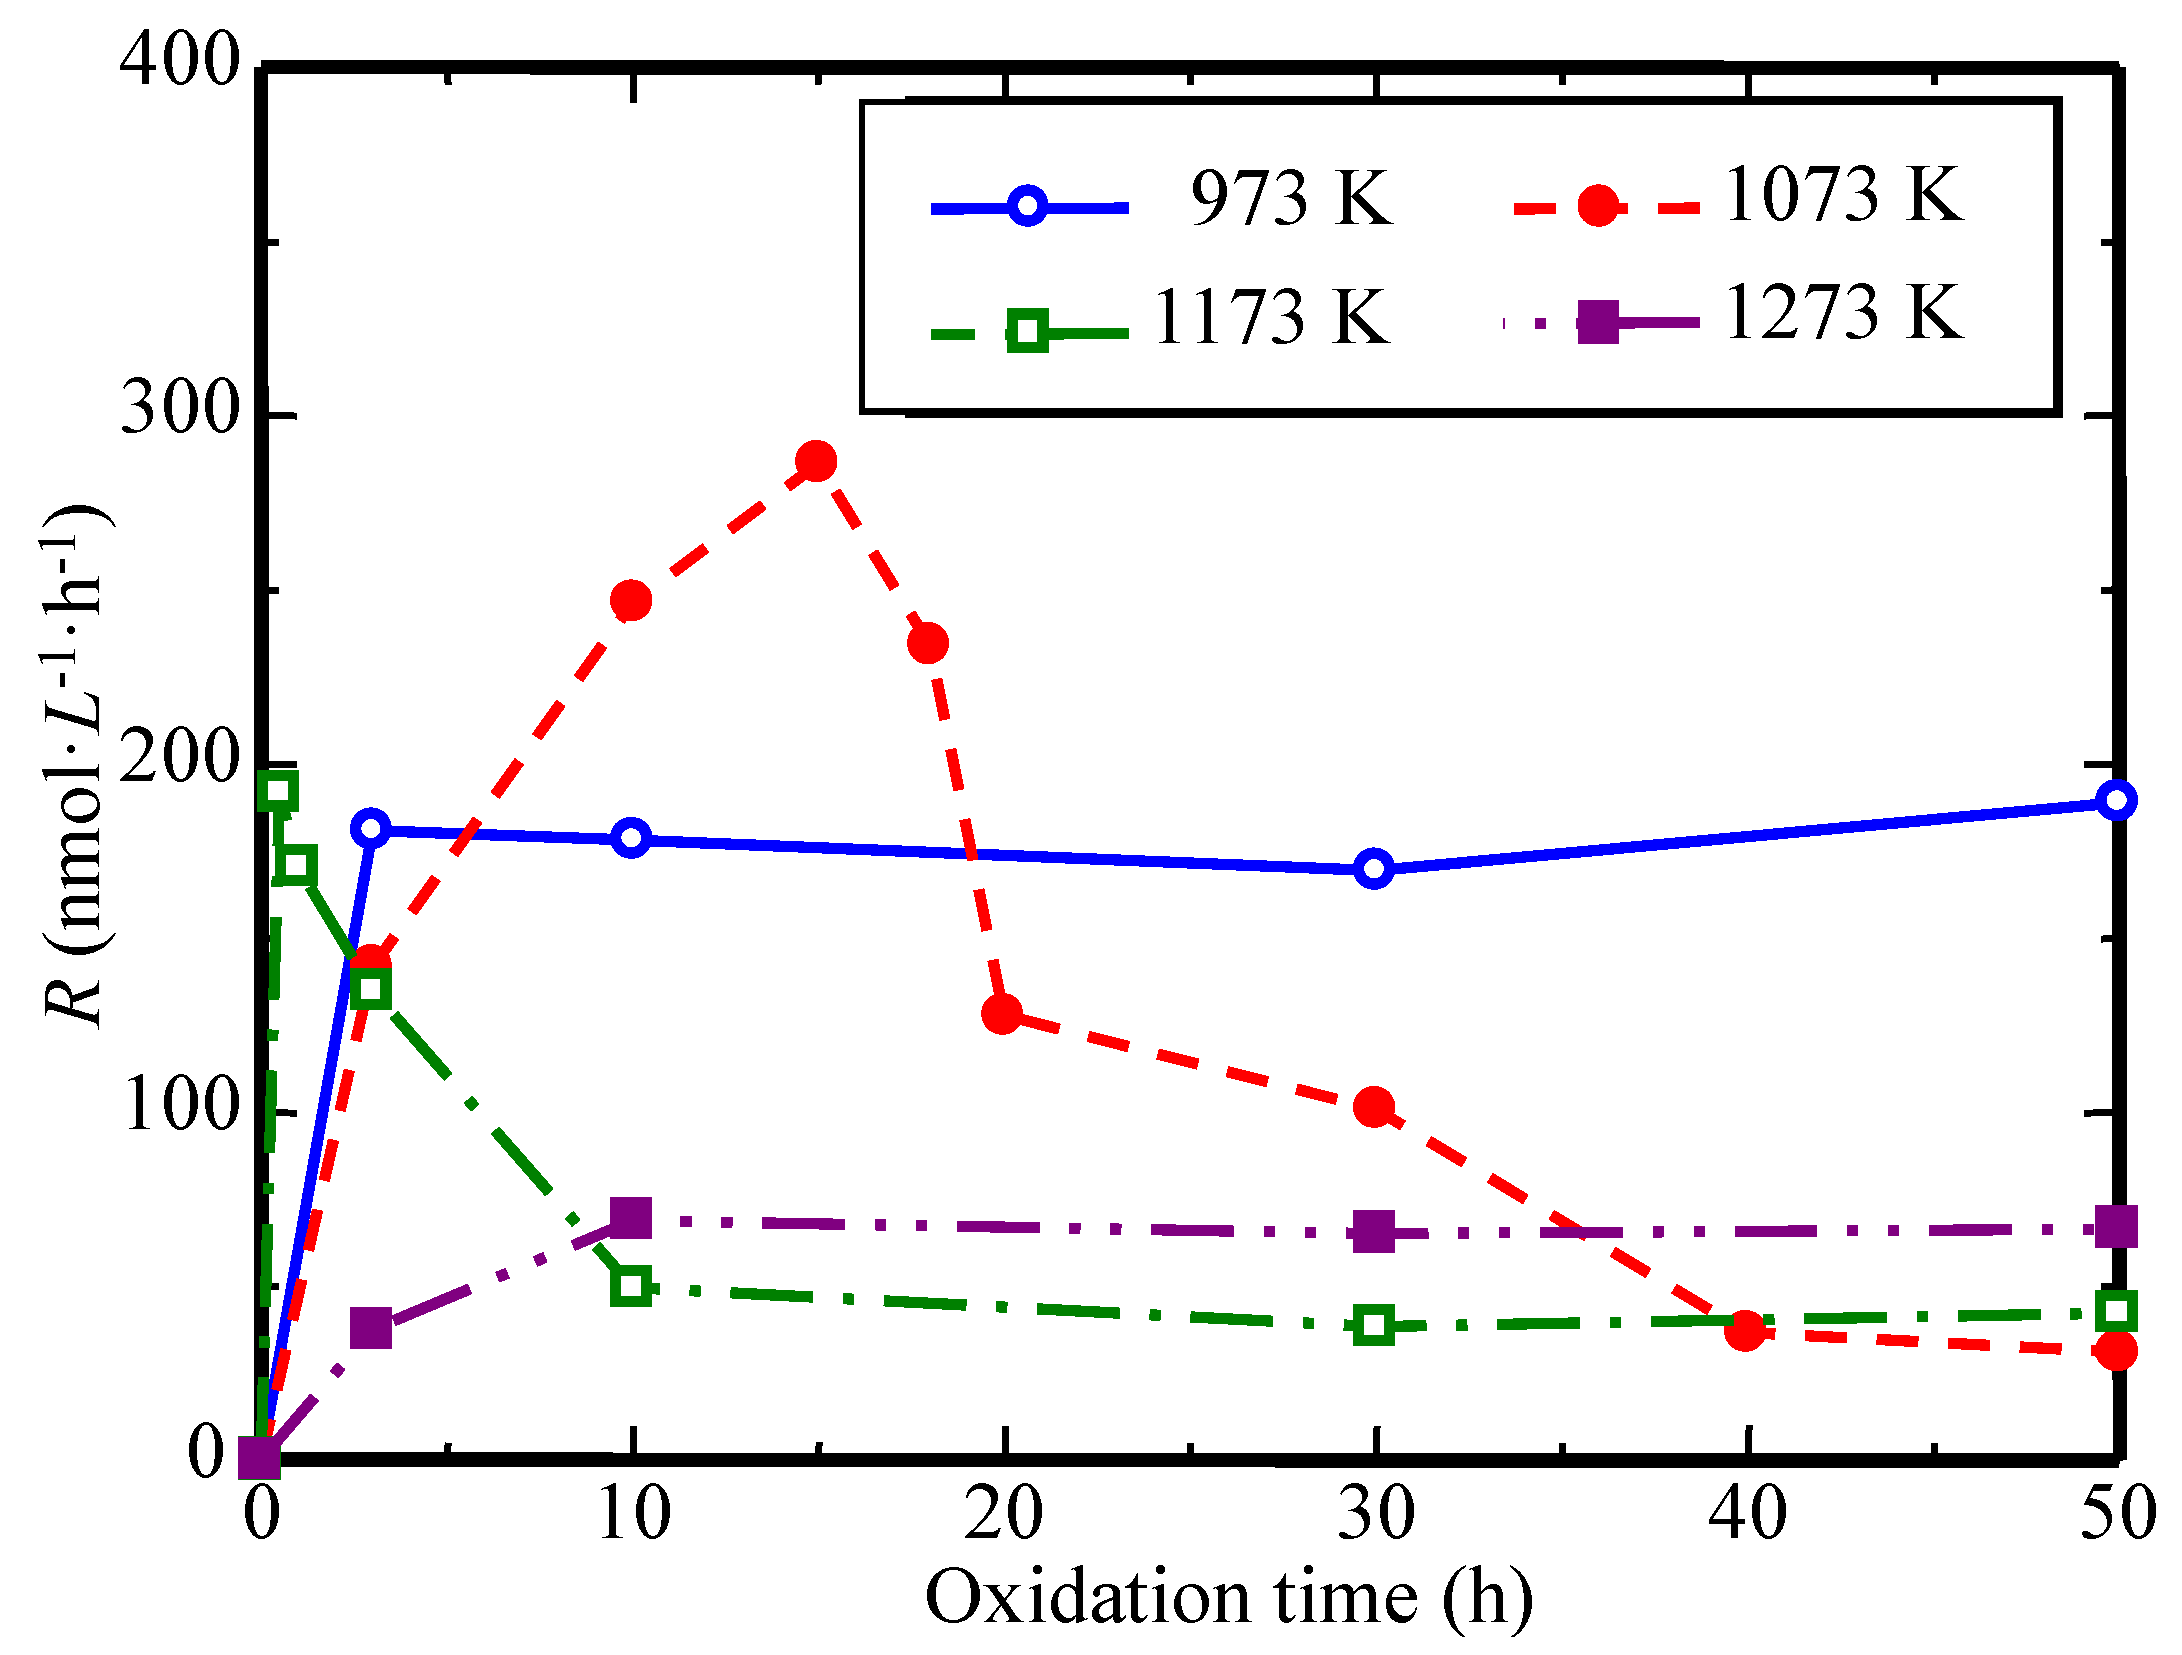
3.1.2. Focusing on Oxidation Time

In order to further investigate the oxidation condition on the photocatalyst coatings of TiO2, this part focuses on the oxidation time, at temperatures from 973 to 1273 K.
Figure 32 and Figure 33 show the surface morphologies of the coatings fabricated by the MCT and subsequent heat oxidation at 973 and 1073 K. Figure 32b,c indicates that nano-sized TiO2 needles formed. With increasing oxidation time, the size of the needles increased and columnar TiO2 nanocrystals formed (Figure 32d,e). When the oxidation temperature was increased to 1073 K (Figure 33), nano-sized TiO2 needles grew rapidly and micron-sized columnar TiO2 crystals formed as the oxidation time was increased. The formation and growth of nano-sized TiO2 needles and micron-sized columnar TiO2 crystals have been discussed in many papers [49,50,51]. It should result from the preferential growth of TiO2 crystals in a specific direction.
Figure 32. SEM images of surfaces of M10-973 K-yh samples. (a) Ti coatings before oxidation, and after oxidation time for (b) 3 h, (c) 10 h, (d) 30 h and (e) 50 h.
Coatings 05 00425 g032
Figure 33. SEM images of surfaces of M10-1073 K-yh samples. (a) 3 h, (b) 10 h, (c) 20 h, (d) 30 h, (e) 40 h and (f) 50 h.
Coatings 05 00425 g033
The XRD patterns of the Ti coatings oxidized at 973 and 1073 K are shown in Figure 34, respectively. Figure 34a shows the peaks of rutile TiO2 became higher while those of Ti and anatase TiO2 decreased, with increasing oxidation time. Combined with the results and analysis from Figure 32, the crystal TiO2 changes from anatase to rutile, and the surface morphology of TiO2 becomes larger—from nano-sized needles to micron-sized columnar
When the oxidation temperature was increased to 1073 K (Figure 34b), the peaks of rutile TiO2 were detected while those of Ti coatings were not found. It means that relatively thick rutile TiO2layers formed on the surface of the Ti coatings. The peaks of anatase TiO2 were not detected, which indicates that anatase as a metastable phase cannot be formed or has been transferred to rutile at the high temperature. The above results shows that anatase phase can be obtained at 973 K while it cannot be prepared at 1073 K.
Figure 35 shows the cross-sectional SEM images of these coatings fabricated by the MCT and subsequent heat oxidation at 973 K in air for different oxidation times. The light and dark areas of these coatings were confirmed to be Ti and TiO2 by XRD analysis, respectively. Figure 35a shows numerous small pores in Ti coatings, which had a thickness of about 50 μm. The inner and surface layers of the Ti coatings were found to be oxidized simultaneously (Figure 35b–e). It indicates that the coatings were porous and can be penetrated by air. As the oxidation time increased, the thickness of the TiO2 layers was increased. From the above analysis, it can be confirmed that TiO2/Ti composite coatings were prepared after the Ti coatings were oxidized at 973 K.
Figure 34. XRD patterns of the of M10-xK-yh samples. (a) 973 K and (b) 1073 K.
Coatings 05 00425 g034
Figure 35. Cross-section SEM images of M10-973 K-yh samples. (a) before oxidation, (b) 3 h, (c) 10 h, (d) 30 h and (e) 50 h.
Coatings 05 00425 g035
The cross-section SEM images of these coatings fabricated by the MCT and subsequent heat oxidation at 1073 and 1173 K are shown in Figure 36 and Figure 37, respectively. Compared with the samples oxidized at 973 K (Figure 35), the oxidation level of the Ti coatings was increased with an increase in oxidation temperature. When the oxidation temperatures were 1073 and 1173 K, Ti coatings were completely oxidized to form TiO2 coatings when oxidation time became 40 h and 10 h, respectively. Figure 38 shows the cross-section SEM images of the coatings fabricated by the MCT and subsequent heat oxidation at 1273 K. Porous TiO2 coatings were obtained after just 3 h of oxidation.
Figure 36. Cross-section SEM images of M10-1073 K-yh samples. (a) 10 h, (b) 15 h, (c) 20 h, (d) 30 h, (e) 40 h and (f) 50 h.
Coatings 05 00425 g036
Figure 37. Cross-section SEM images of M10-1173 K-yh samples. (a) 0.5 h, (b) 1 h, (c) 3 h, (d) 10 h, (e) 30 h and (f) 50 h.
Coatings 05 00425 g037
Figure 38. Cross-section SEM images of M10-1273 K-yh samples. (a) 3 h, (b) 10 h, (c) 30 h and (d) 50 h.
Coatings 05 00425 g038
The change in concentration of MB solution (with the diameter of test cell is 18 mm) in the presence of the M10-xK-10h samples as a function of UV irradiation time is illustrated in Figure 39. The concentration of MB solution for the blank (marked with MB solution) hardly decreased, which means that the MB solution did not degrade under UV irradiation. In addition, Ti coatings have no photocatalytic activity that appears as a marker with Ti coatings in Figure 39, which means that MB was not degraded under the action of Ti coatings and UV irradiation. However, the concentration of MB solution in the presence of the M10-xK-10h samples decreased to varying degrees. It indicates that the TiO2 coatings and TiO2/Ti composite coatings showed photocatalytic activity toward MB solution.
Degradation rate constants calculated from plots of concentration versus irradiation time curves are presented in Figure 40. For the photocatalyst coatings of M10-xK-yh at 1073 K and 1173 K, R first increased and then decreased at an almost constant rate with extending oxidation time. With the photocatalyst coatings of sample at 1073 K and 1173 K, R first increased and then remained almost constant with extending oxidation time. The M10-1073 K-15h samples showed the highest photocatalytic activity.
Figure 39. Degradation rate constant of M10-xK-yh samples.
Coatings 05 00425 g039
Figure 40. Relationship between dependence of degradation rate constants and the oxidation condition.
Coatings 05 00425 g040

3.2. Influence on Photocatalyst Coatings of TiO2 by Adding Metals

Additional information about the naming method of the prepared samples is provided as follows: “M10-xM” (M: Ni, Cr) indicates that the samples prepared with mixed Ti and M powder with x being the mass fraction of M by MCT at 480 rpm for 10 h. “M10-xM-yK/zh” are the final oxidized products of the “M10-xM”, and oxidation at the temperature of y K for z hour.

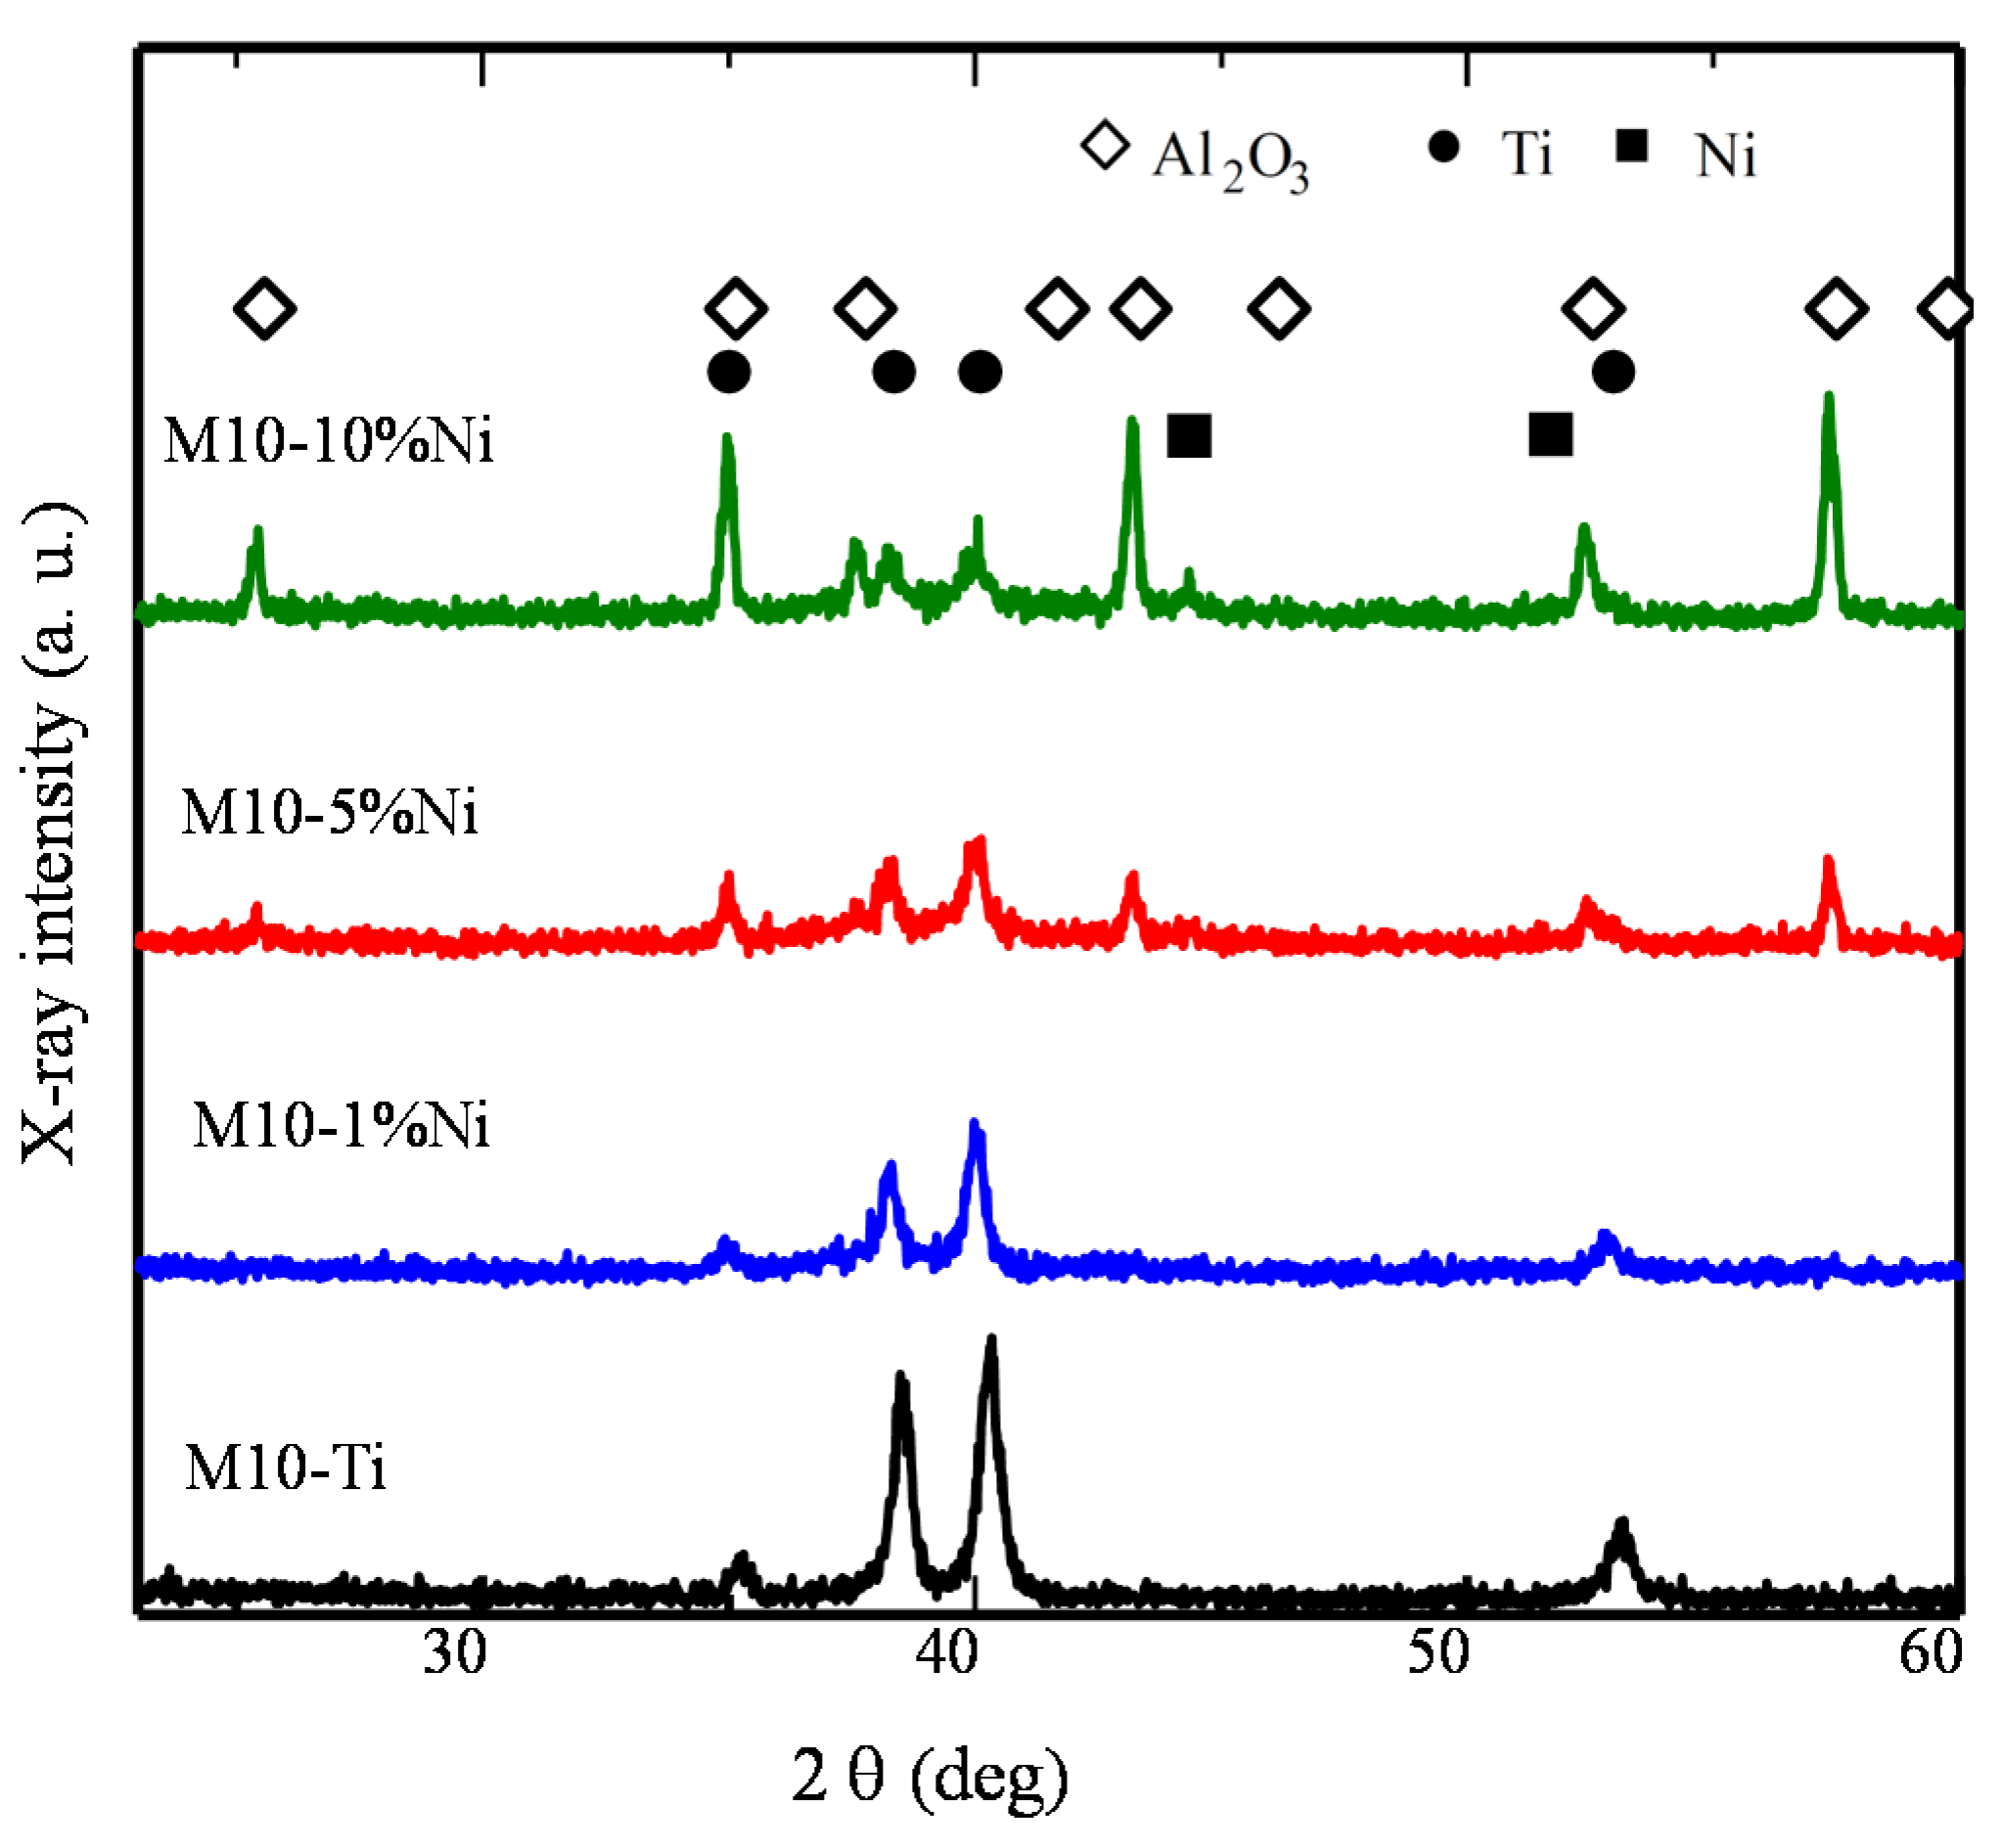
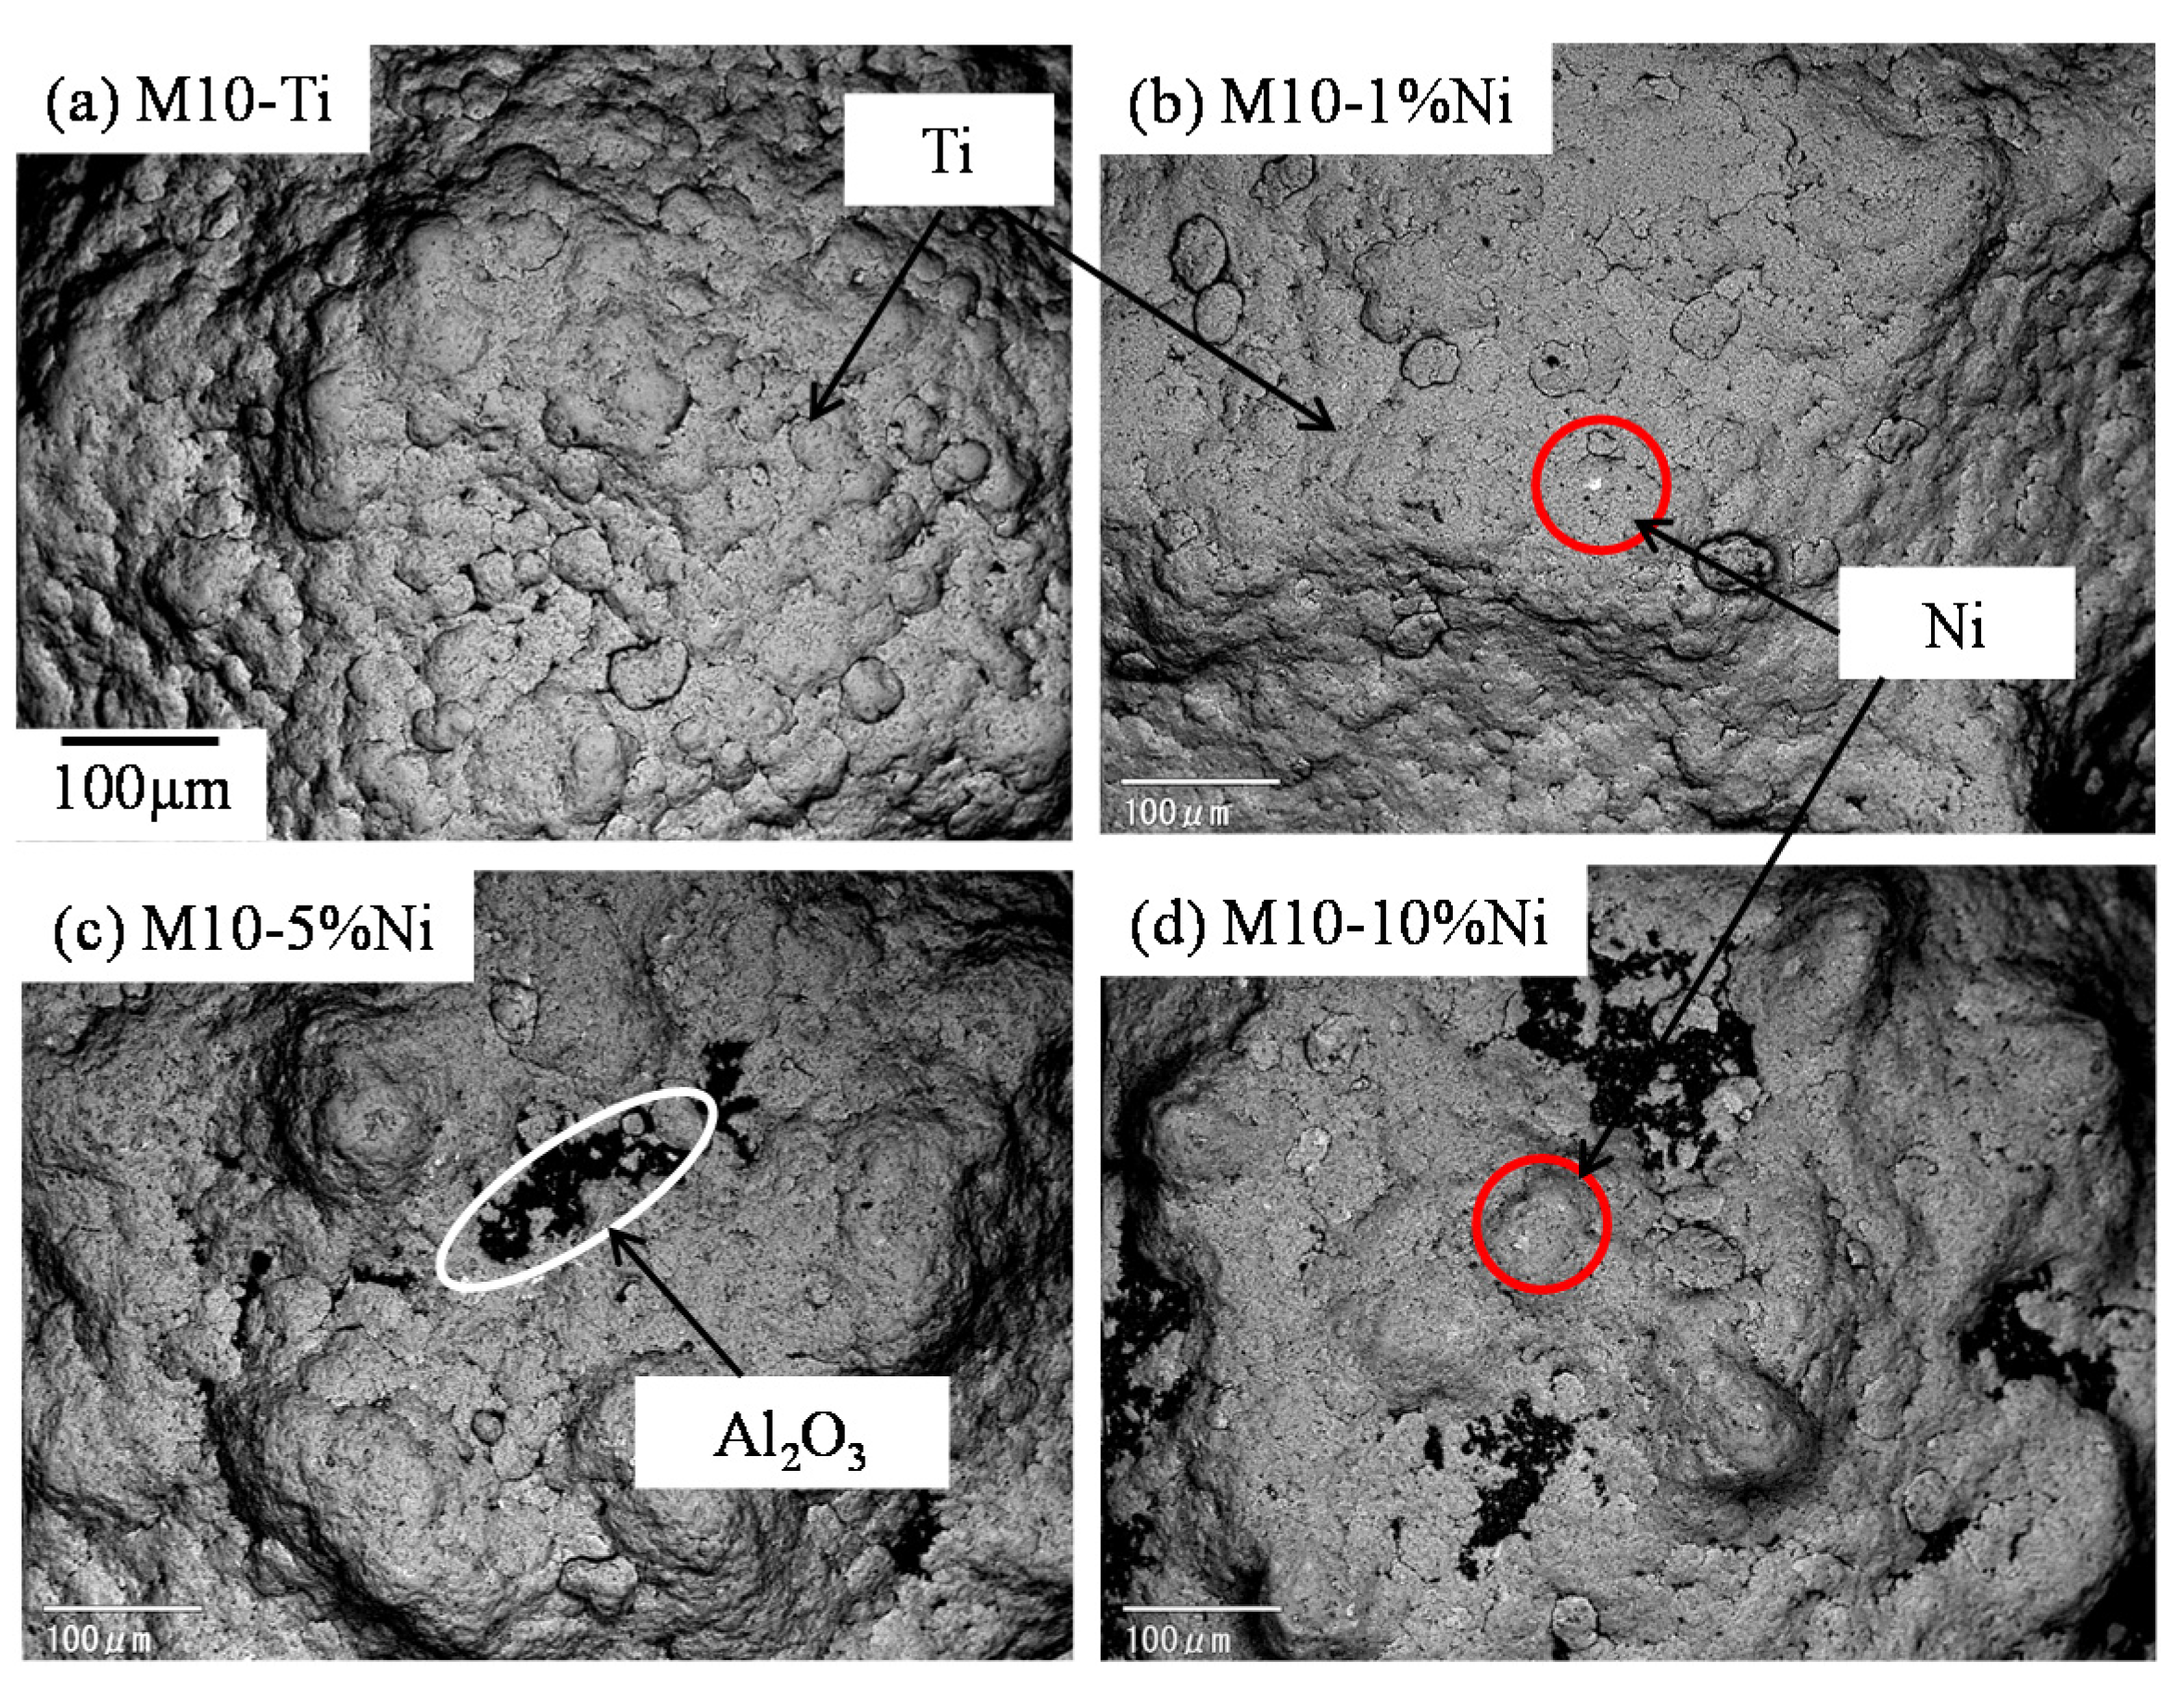
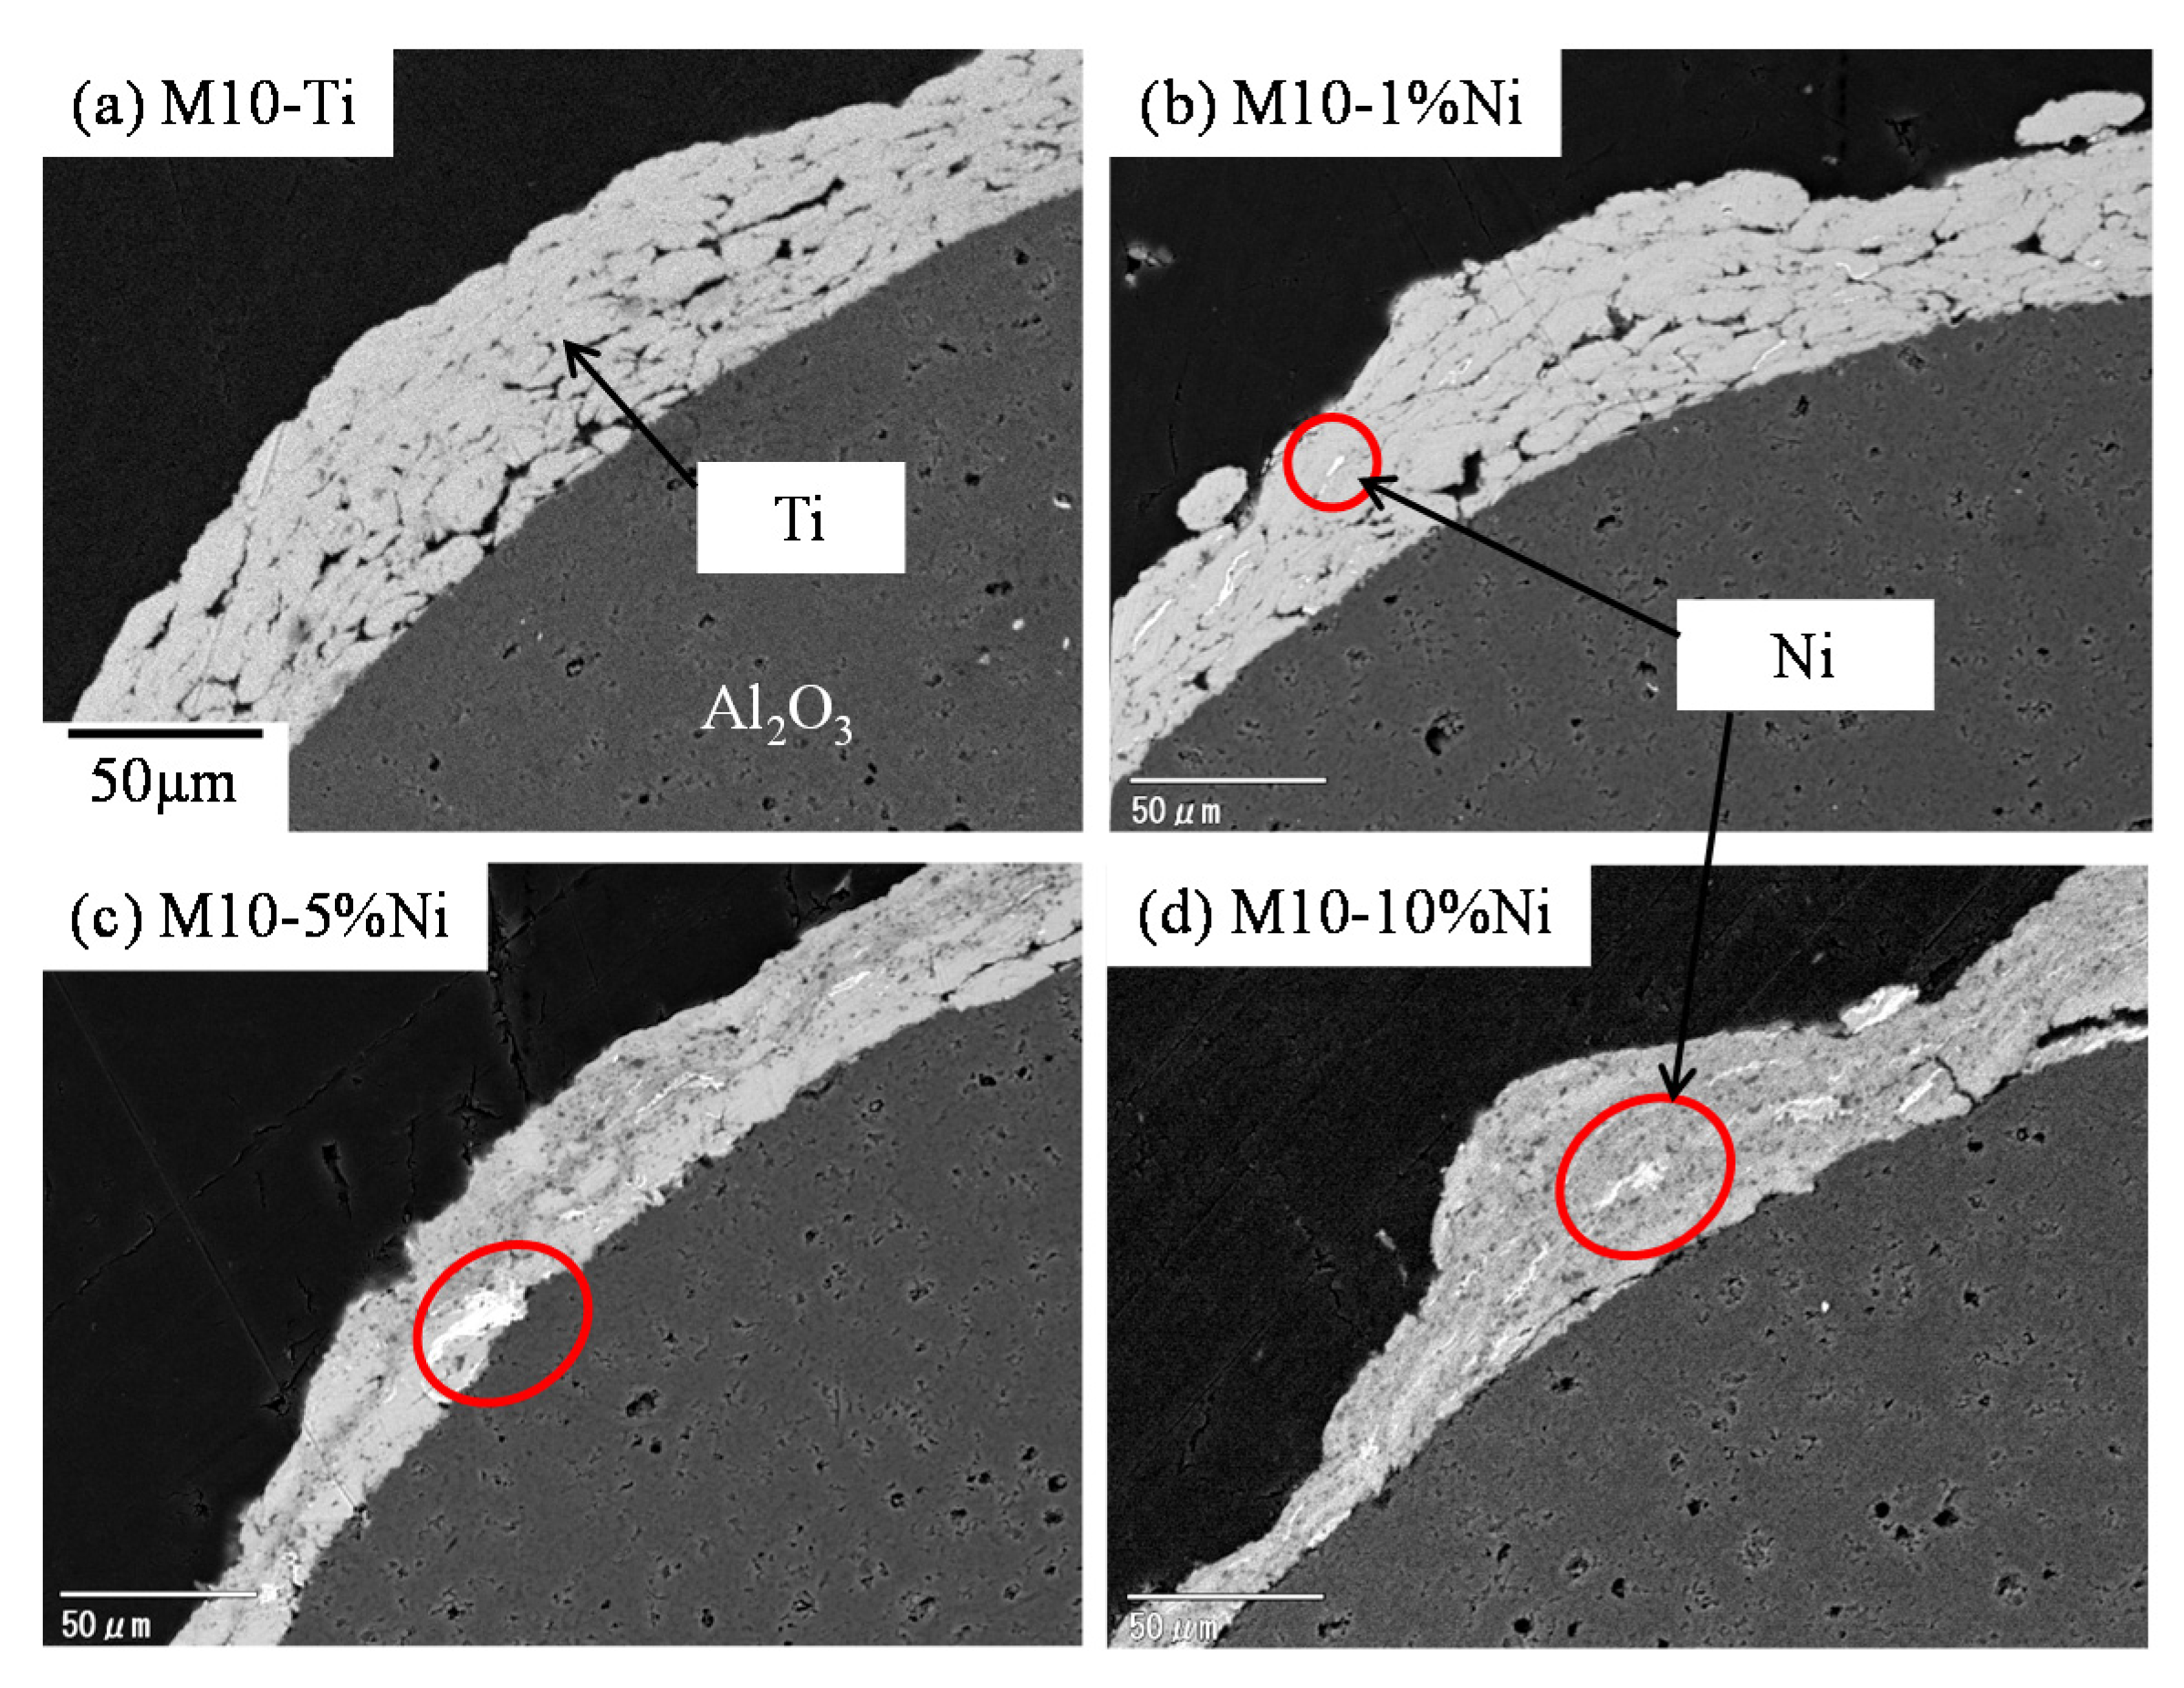
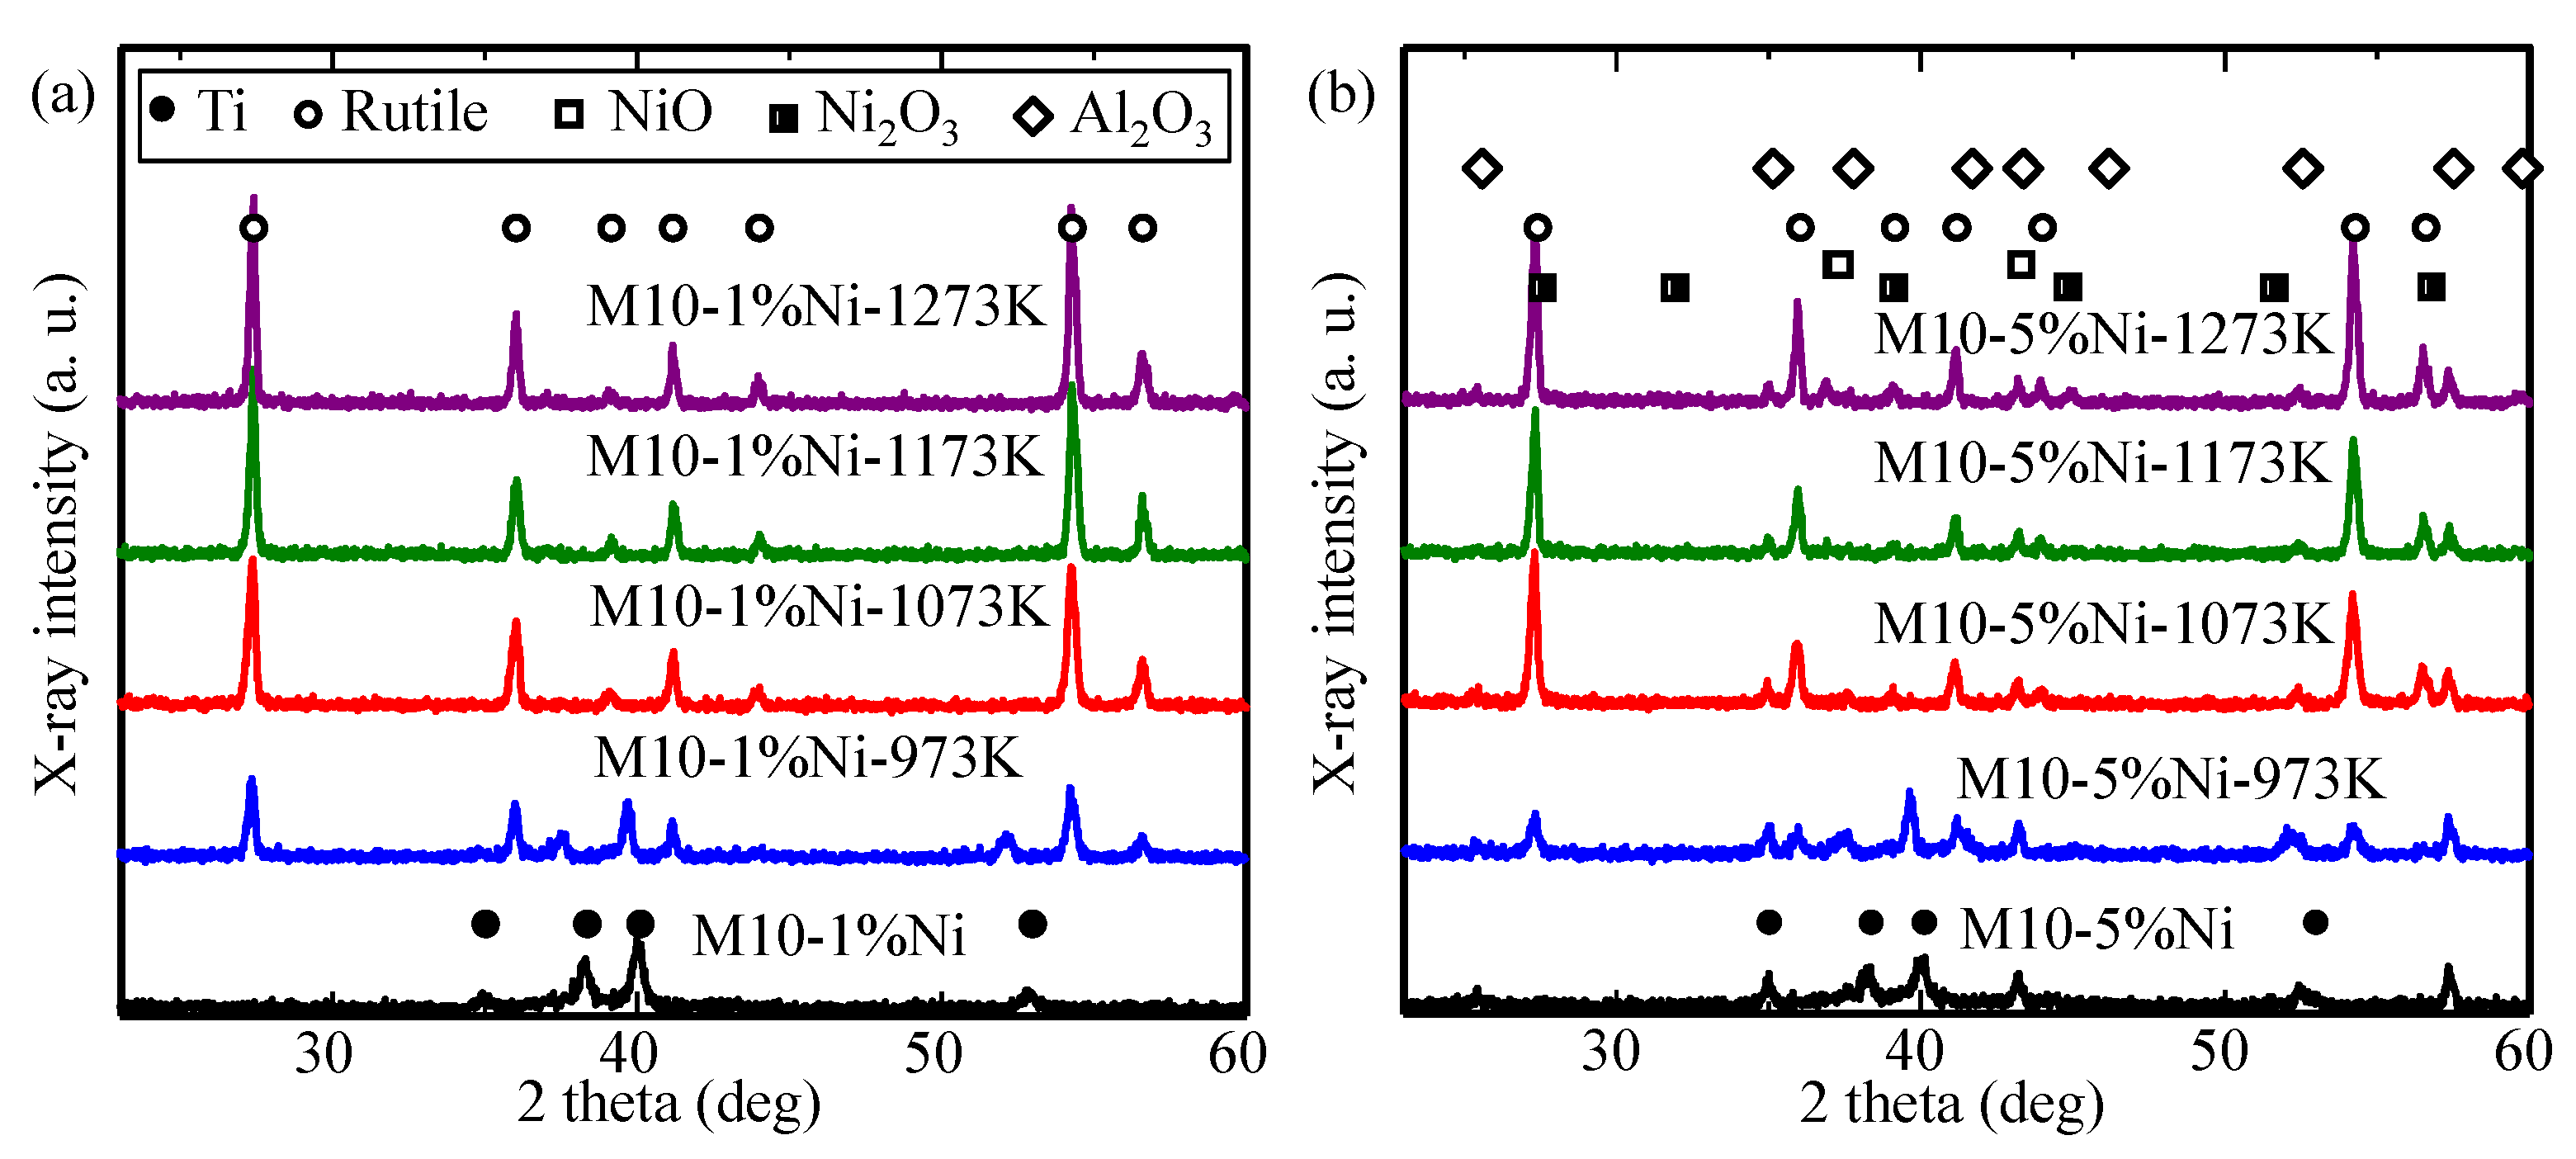
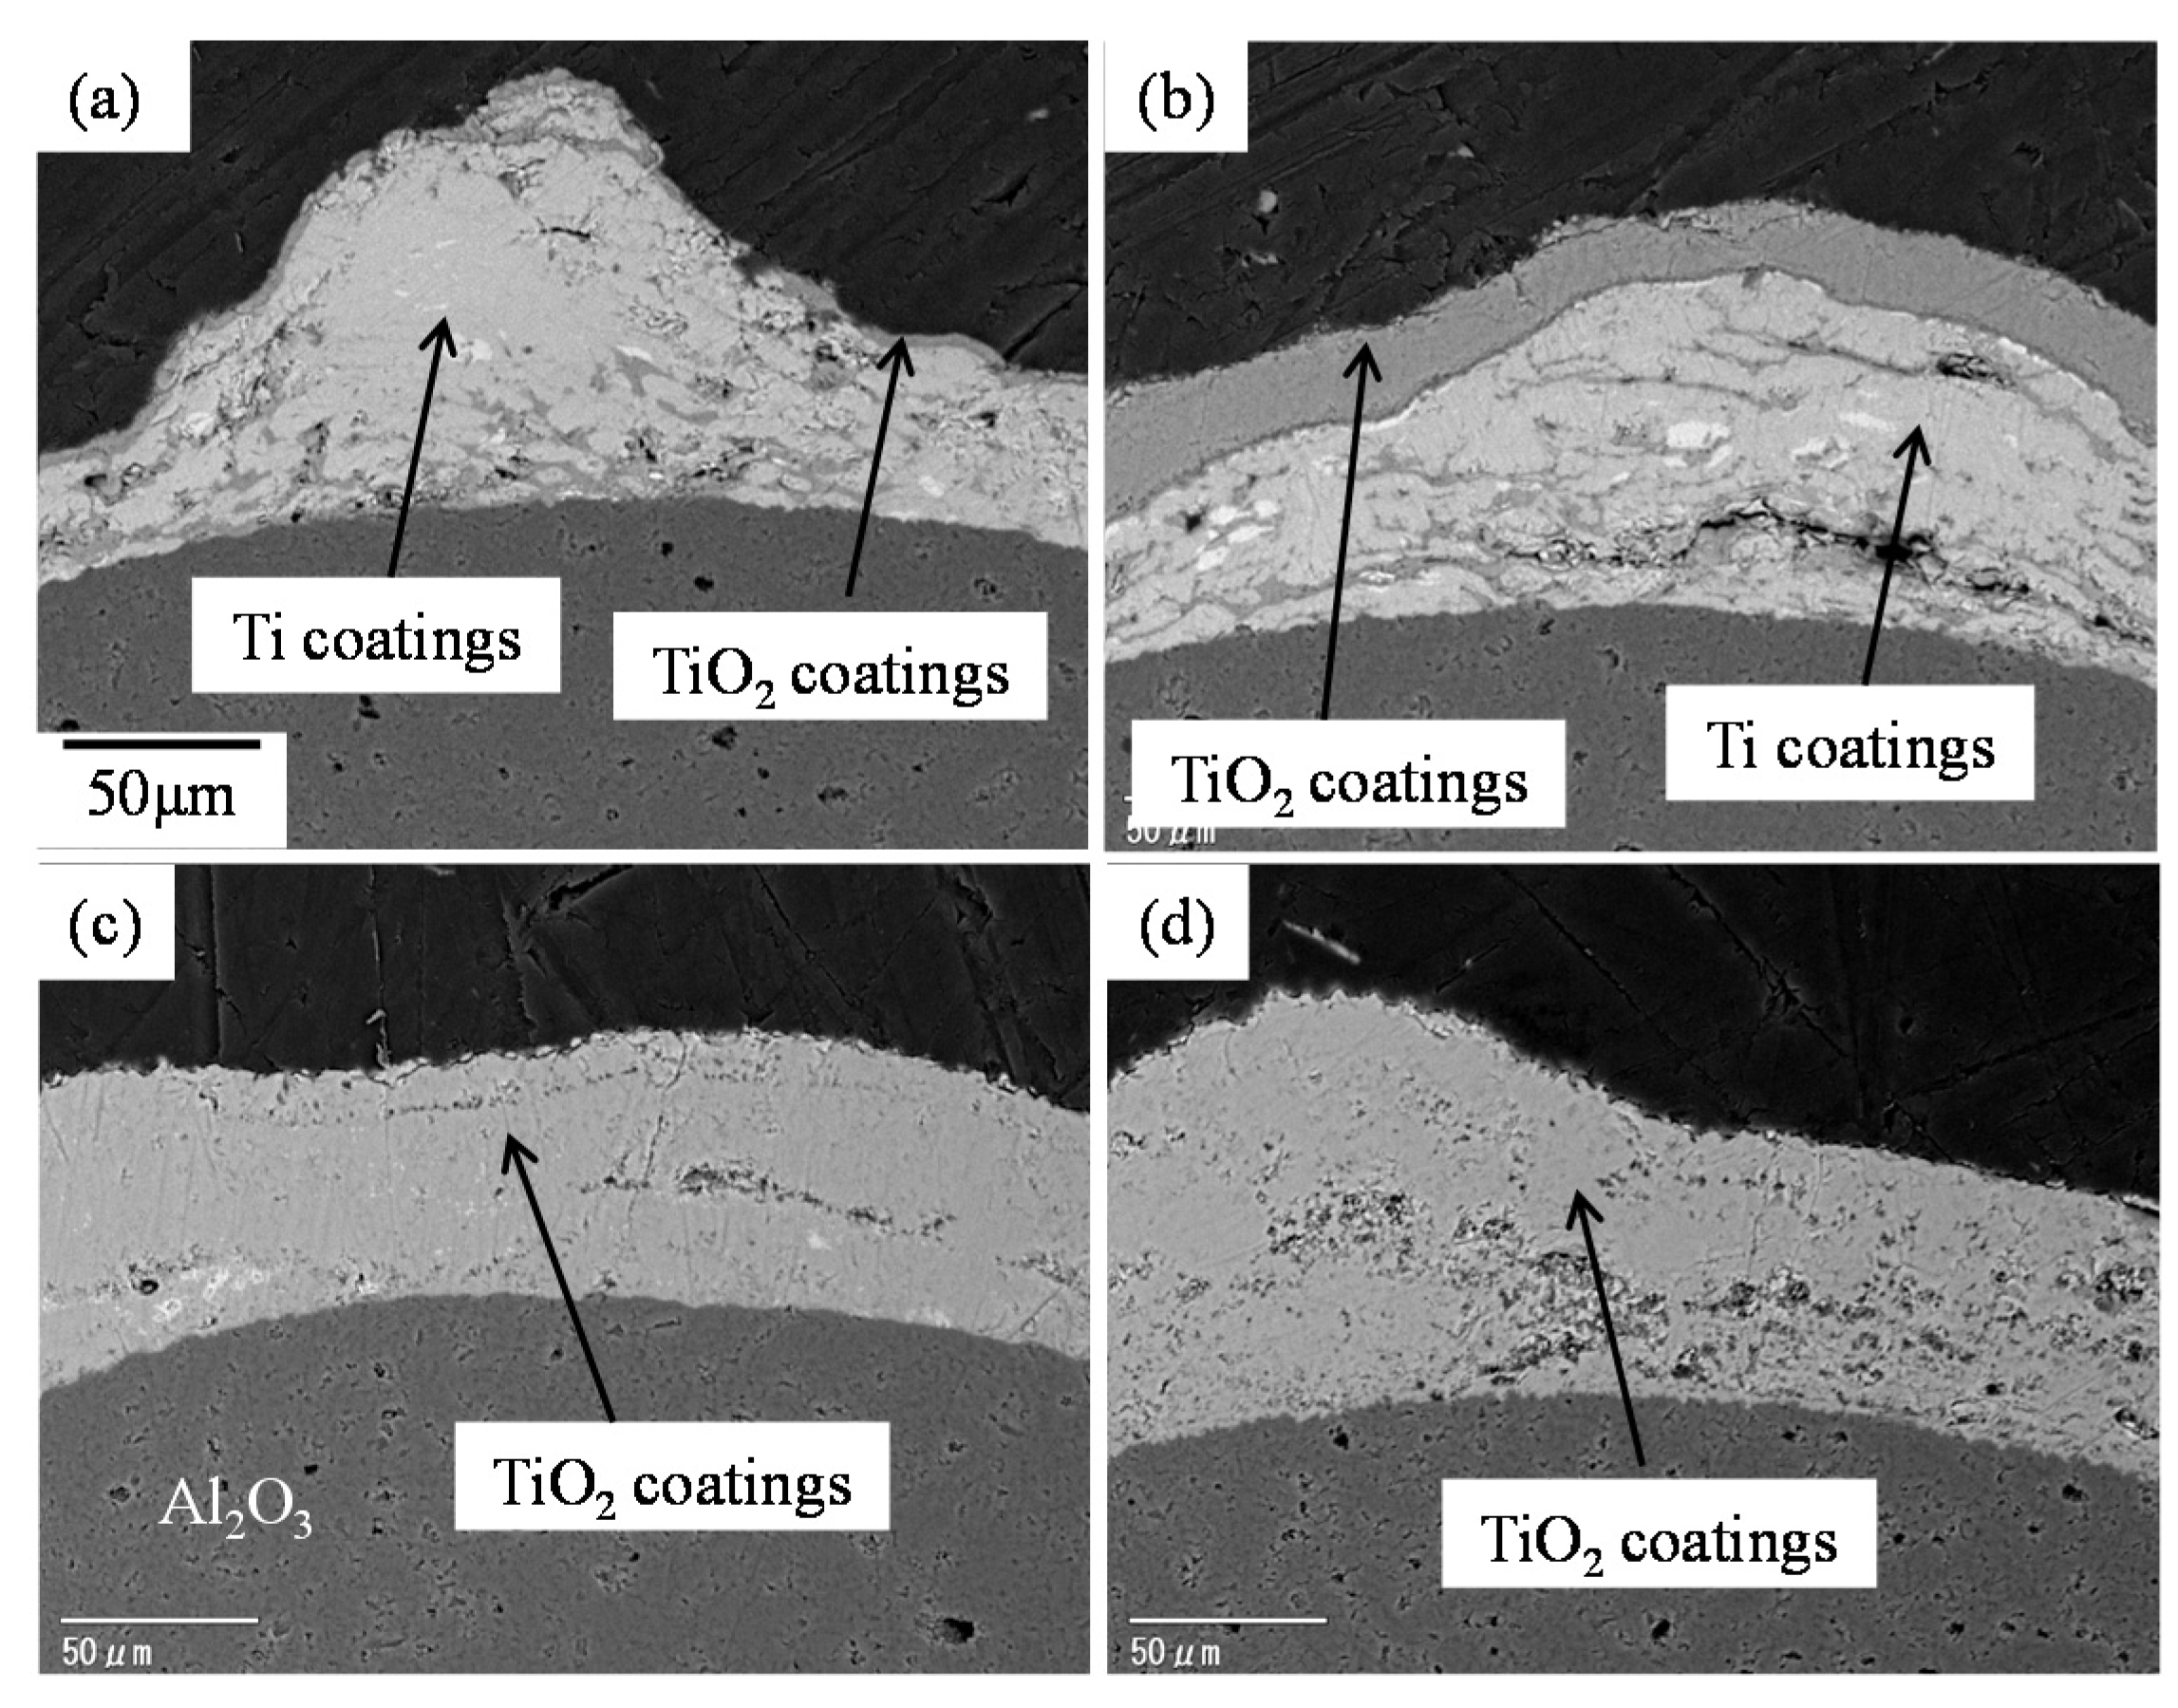
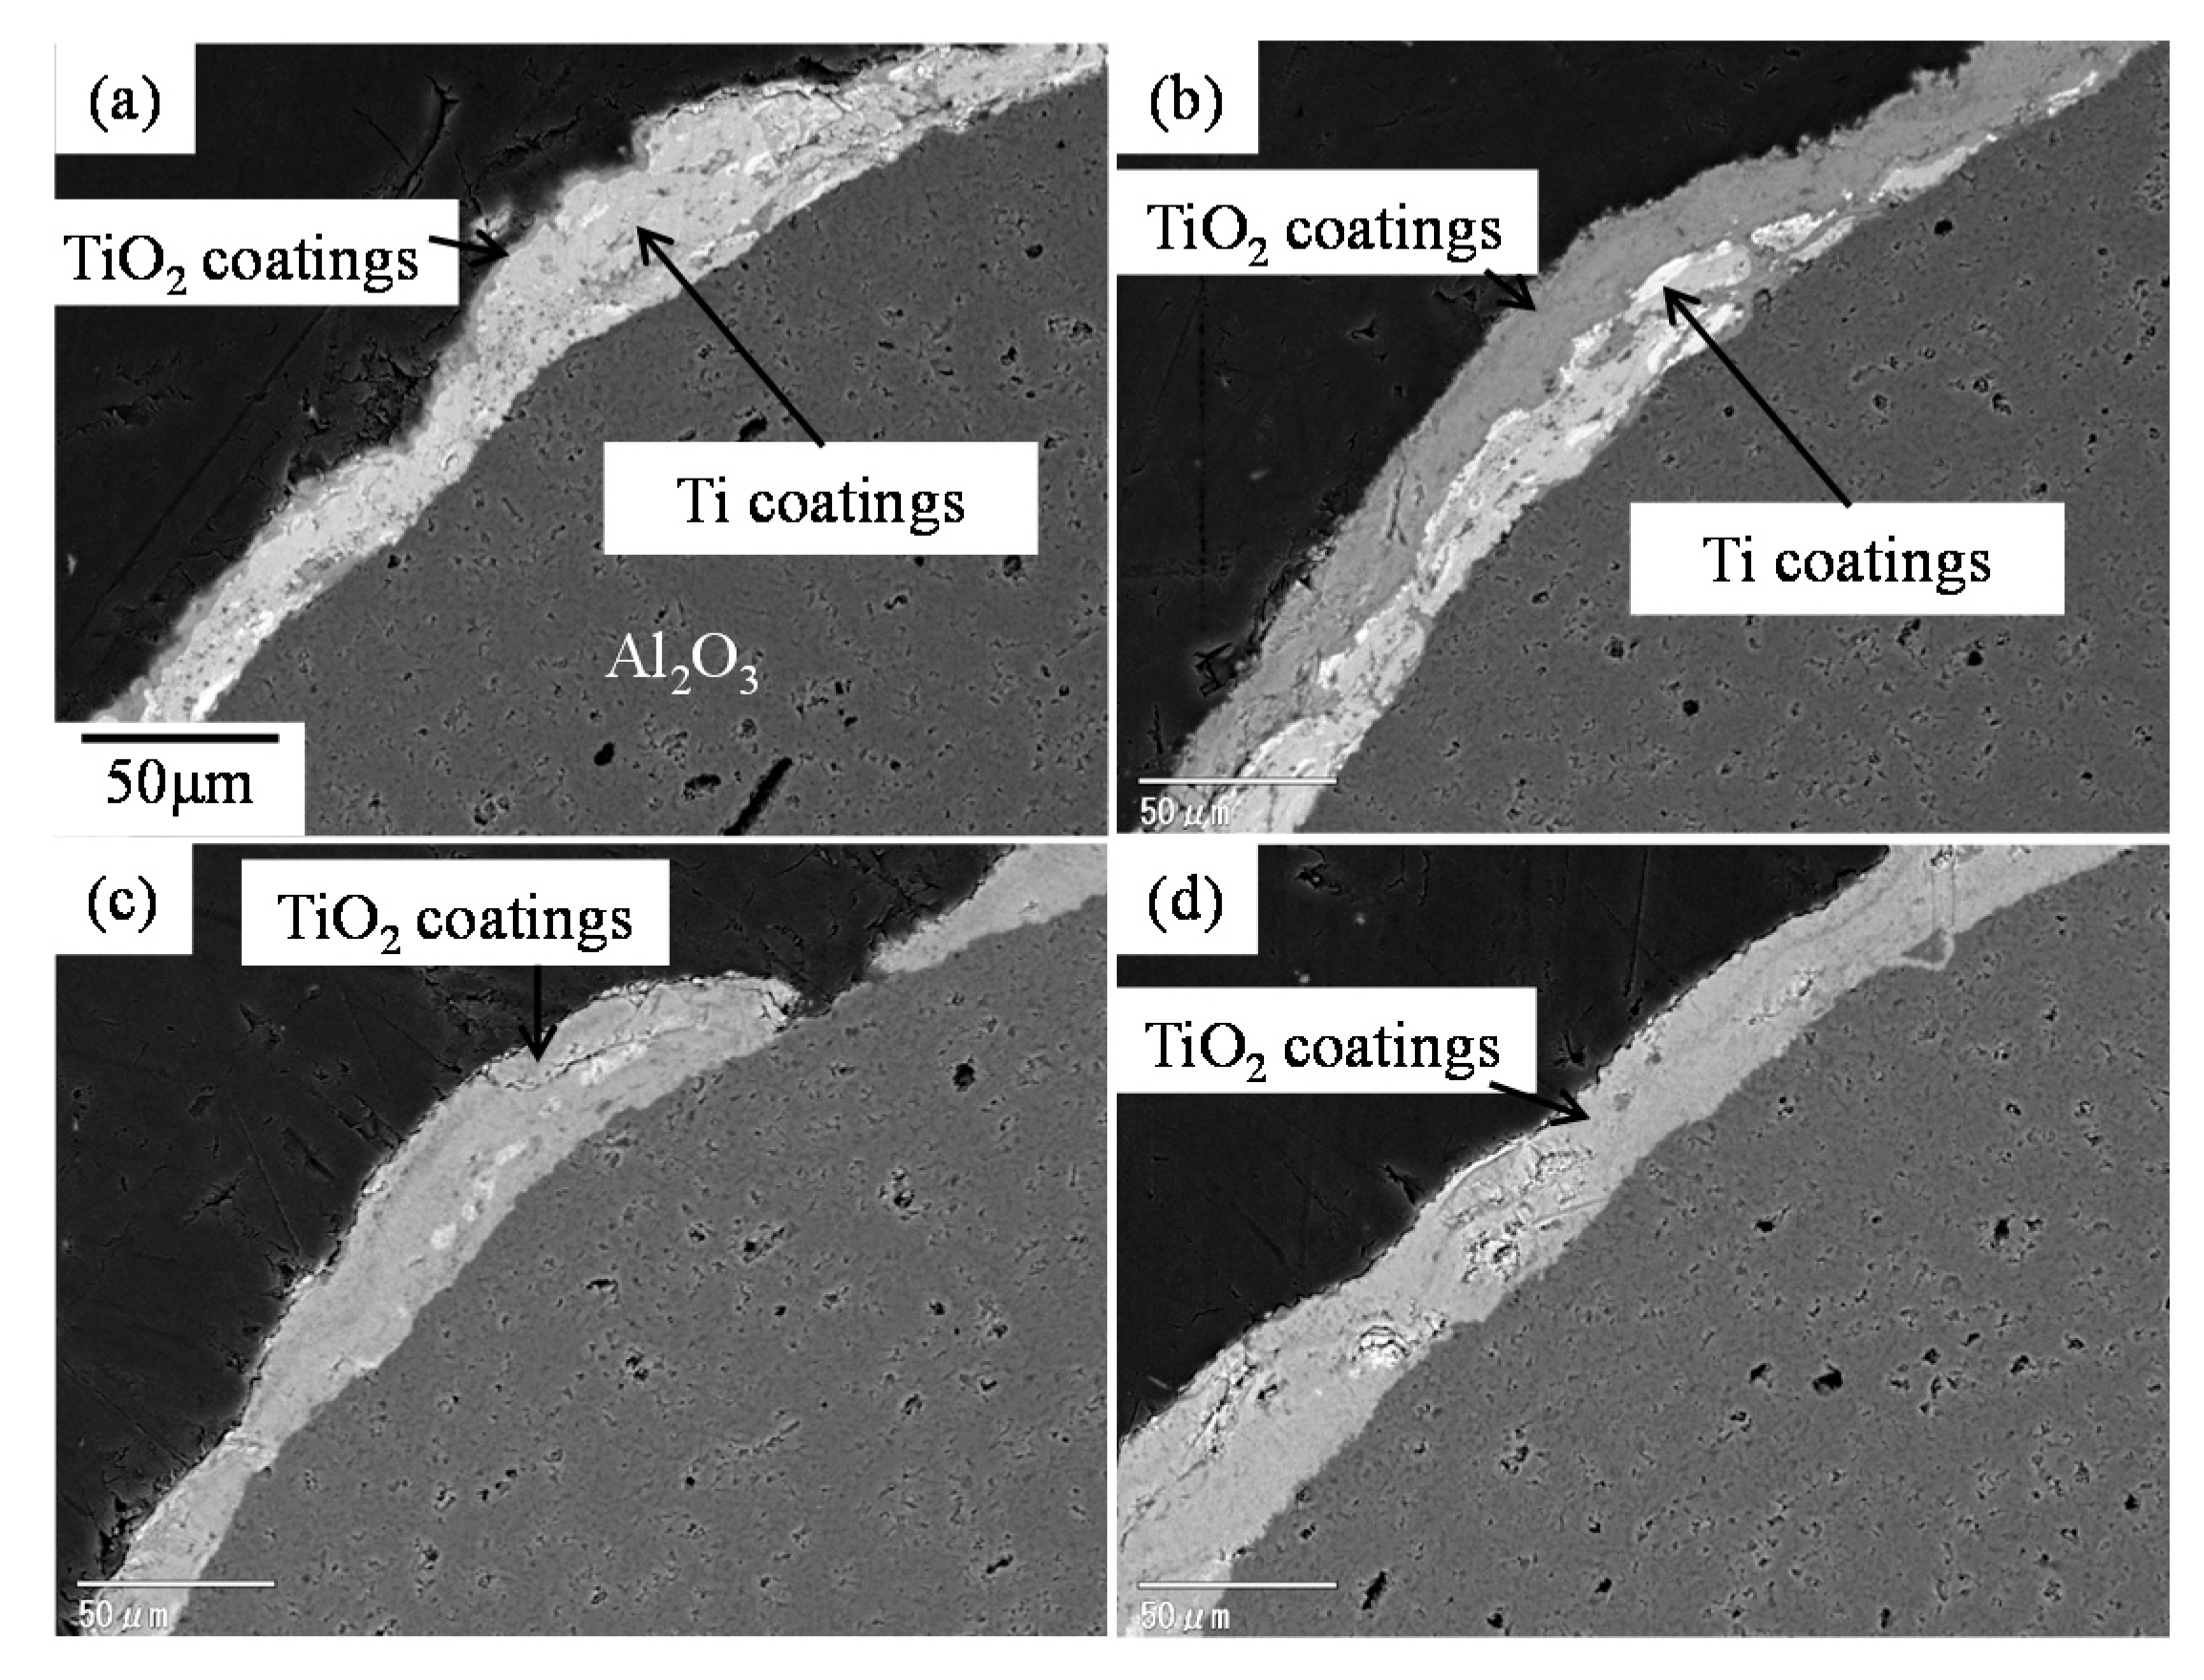
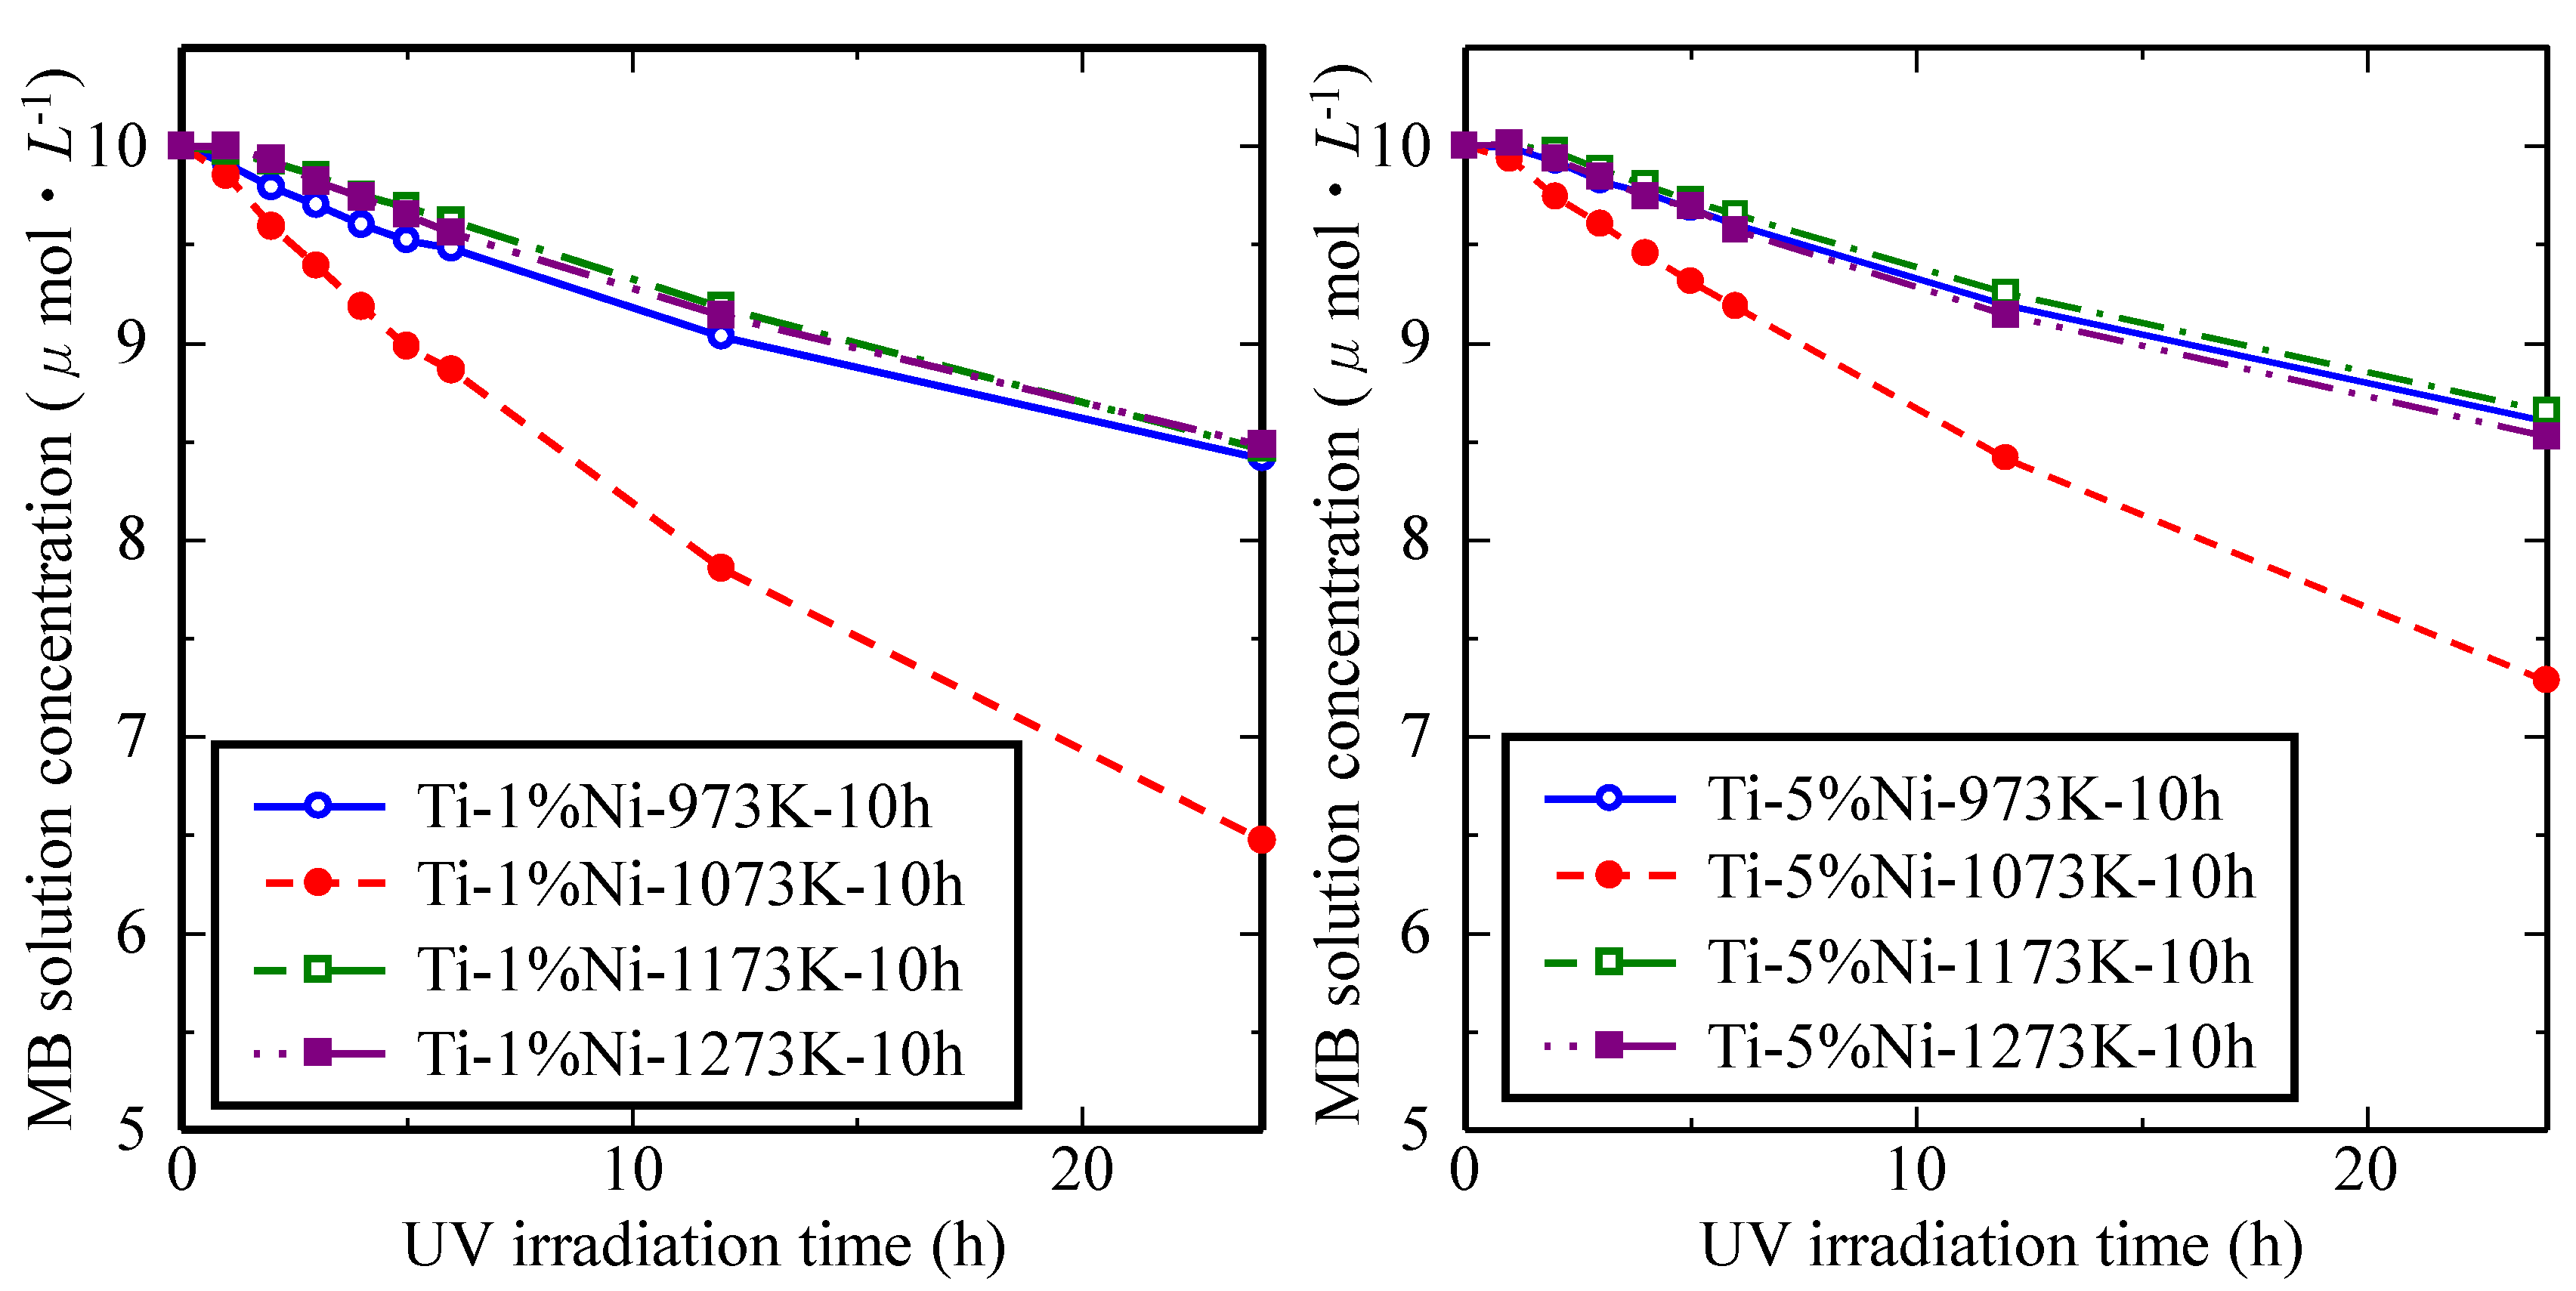
3.2.1. Influence on Photocatalyst Coatings of TiO2 by Adding Ni

Figure 41 shows the XRD patterns of the M10-xNi coatings on Al2O3 balls. Only diffraction peaks of Ti could be detected for the M10-Ti sample, which means the continuous Ti coatings were formed. For the Ti-5%Ni and Ti-10%Ni coatings, the diffraction peaks of alumina, Ti, and Ni were found, which means the Al2O3 balls were coated by Ti and Ni coatings. However, the peaks of Ni could hardly be detected from the M10-1%Ni sample, indicating that the content of Ni in the coatings is rather small or even zero [52].
Figure 41. XRD patterns of M10-xNi coatings samples.
Coatings 05 00425 g041
The SEM images of surface microstructure of the M10-xNi coatings on Al2O3 balls prepared by MCT are shown as Figure 42. The areas of dark gray and light gray correspond to Ni particles and Ti particles, respectively. The Ni particles in the M10-xNi coatings were rather few which means that the contents of Ni in the M10-xNi coatings are rather small. In addition, the Ti-Ni coatings discontinued with the increase of Ni content.
Figure 43 shows the cross-section SEM images of the M10-xNi coatings prepared by MCT. As pointed out above, the areas of dark gray and light gray correspond to Ni particles and Ti particles, respectively. The Ni particles are located in the inner layer of the M10-xNi coatings. However, the thickness of coatings becomes thinner with increases in the content of Ni, which may relate to the bad wettability of Ni compared to Ti.
Figure 42. SEM images of surface structure of the M10-xNi samples.
Coatings 05 00425 g042
Figure 43. Cross-section SEM images of the M10-xNi samples.
Coatings 05 00425 g043
Figure 44 shows the XRD patterns of the M10-xNi coatings after oxidation at elevated temperatures for 10 h. For Ti-1%Ni samples after oxidation (Figure 44a), only the diffraction peaks of rutile TiO2 were detected. For Ti-5%Ni samples after oxidation (Figure 44b), besides rutile TiO2, the diffraction peaks of Al2O3, NiO and Ni2O3 were also found (JCPDS card no. 89-7131 and 14-0841). It means that the Ni particles in the coatings were oxidized to form NiO2 and Ni2O3.
The cross-section SEM images of the M10-1%Ni-xK samples are shown as Figure 45. It can be seen that the thickness of TiO2 has increased with increasing oxidation temperature. When the oxidation temperatures were 1173 K and 1273 K, the Ti coatings were totally oxidized to form TiO2 coatings. Figure 46 shows the cross-section SEM images of the M10-5%Ni-xK samples. As the content of Ni in the coatings was rather small during MCT process, NiO and Ni2O3 cannot be found in the SEM images after oxidation in air. The evolution of the coatings with 5% of Ni during oxidation is similar to that with 1% of Ni of Figure 45.
Figure 44. XRD patterns of M10-xNi coatings after oxidation.
Coatings 05 00425 g044
Figure 45. Cross-section SEM images of the M10-1%Ni-xK samples. (a) 973 K, (b) 1073 K, (c) 1173 K, (d) 1273 K.
Coatings 05 00425 g045
Figure 46. Cross-section SEM images of the M10-5%Ni-xK samples. (a) 973 K, (b) 1073 K, (c) 1173 K, (d) 1273 K.
Coatings 05 00425 g046
The photocatalytic activity evaluation of the M10-xNi-yK samples under UV was also performed, with a test cell diameter of 18 mm, shown as Figure 47. All the samples show photocatalytic activity, while MB solution hardly degrades by itself (Figure 39). MB solution with the M10-1%Ni-1073 K sample was degraded with a larger degradation content of MB solution than that of the M10-5%Ni-1073 K sample. For all the samples, MB solution with the sample oxidized at 1073 K was degraded with a larger degradation content of MB solution compared to the samples with other content of Ni. It is assumed that a p–n heterojunction may be formed, along with a corresponding inner electric field at the interface of TiO2 and NiO. At equilibrium, the NiO region has a negative charge while the TiO2 region has a positive charge. The electron-hole pairs at the surface of TiO2 will be separated by the inner electric field. The holes move to the negative and the electrons flow to the positive field component. As a result, the recombination of photo-generated electron-hole pairs is decreased [53]. Thereby, the photocatalytic activity is enhanced.
Figure 47. MB degradation under UV of M10-xNi-yK samples.
Coatings 05 00425 g047

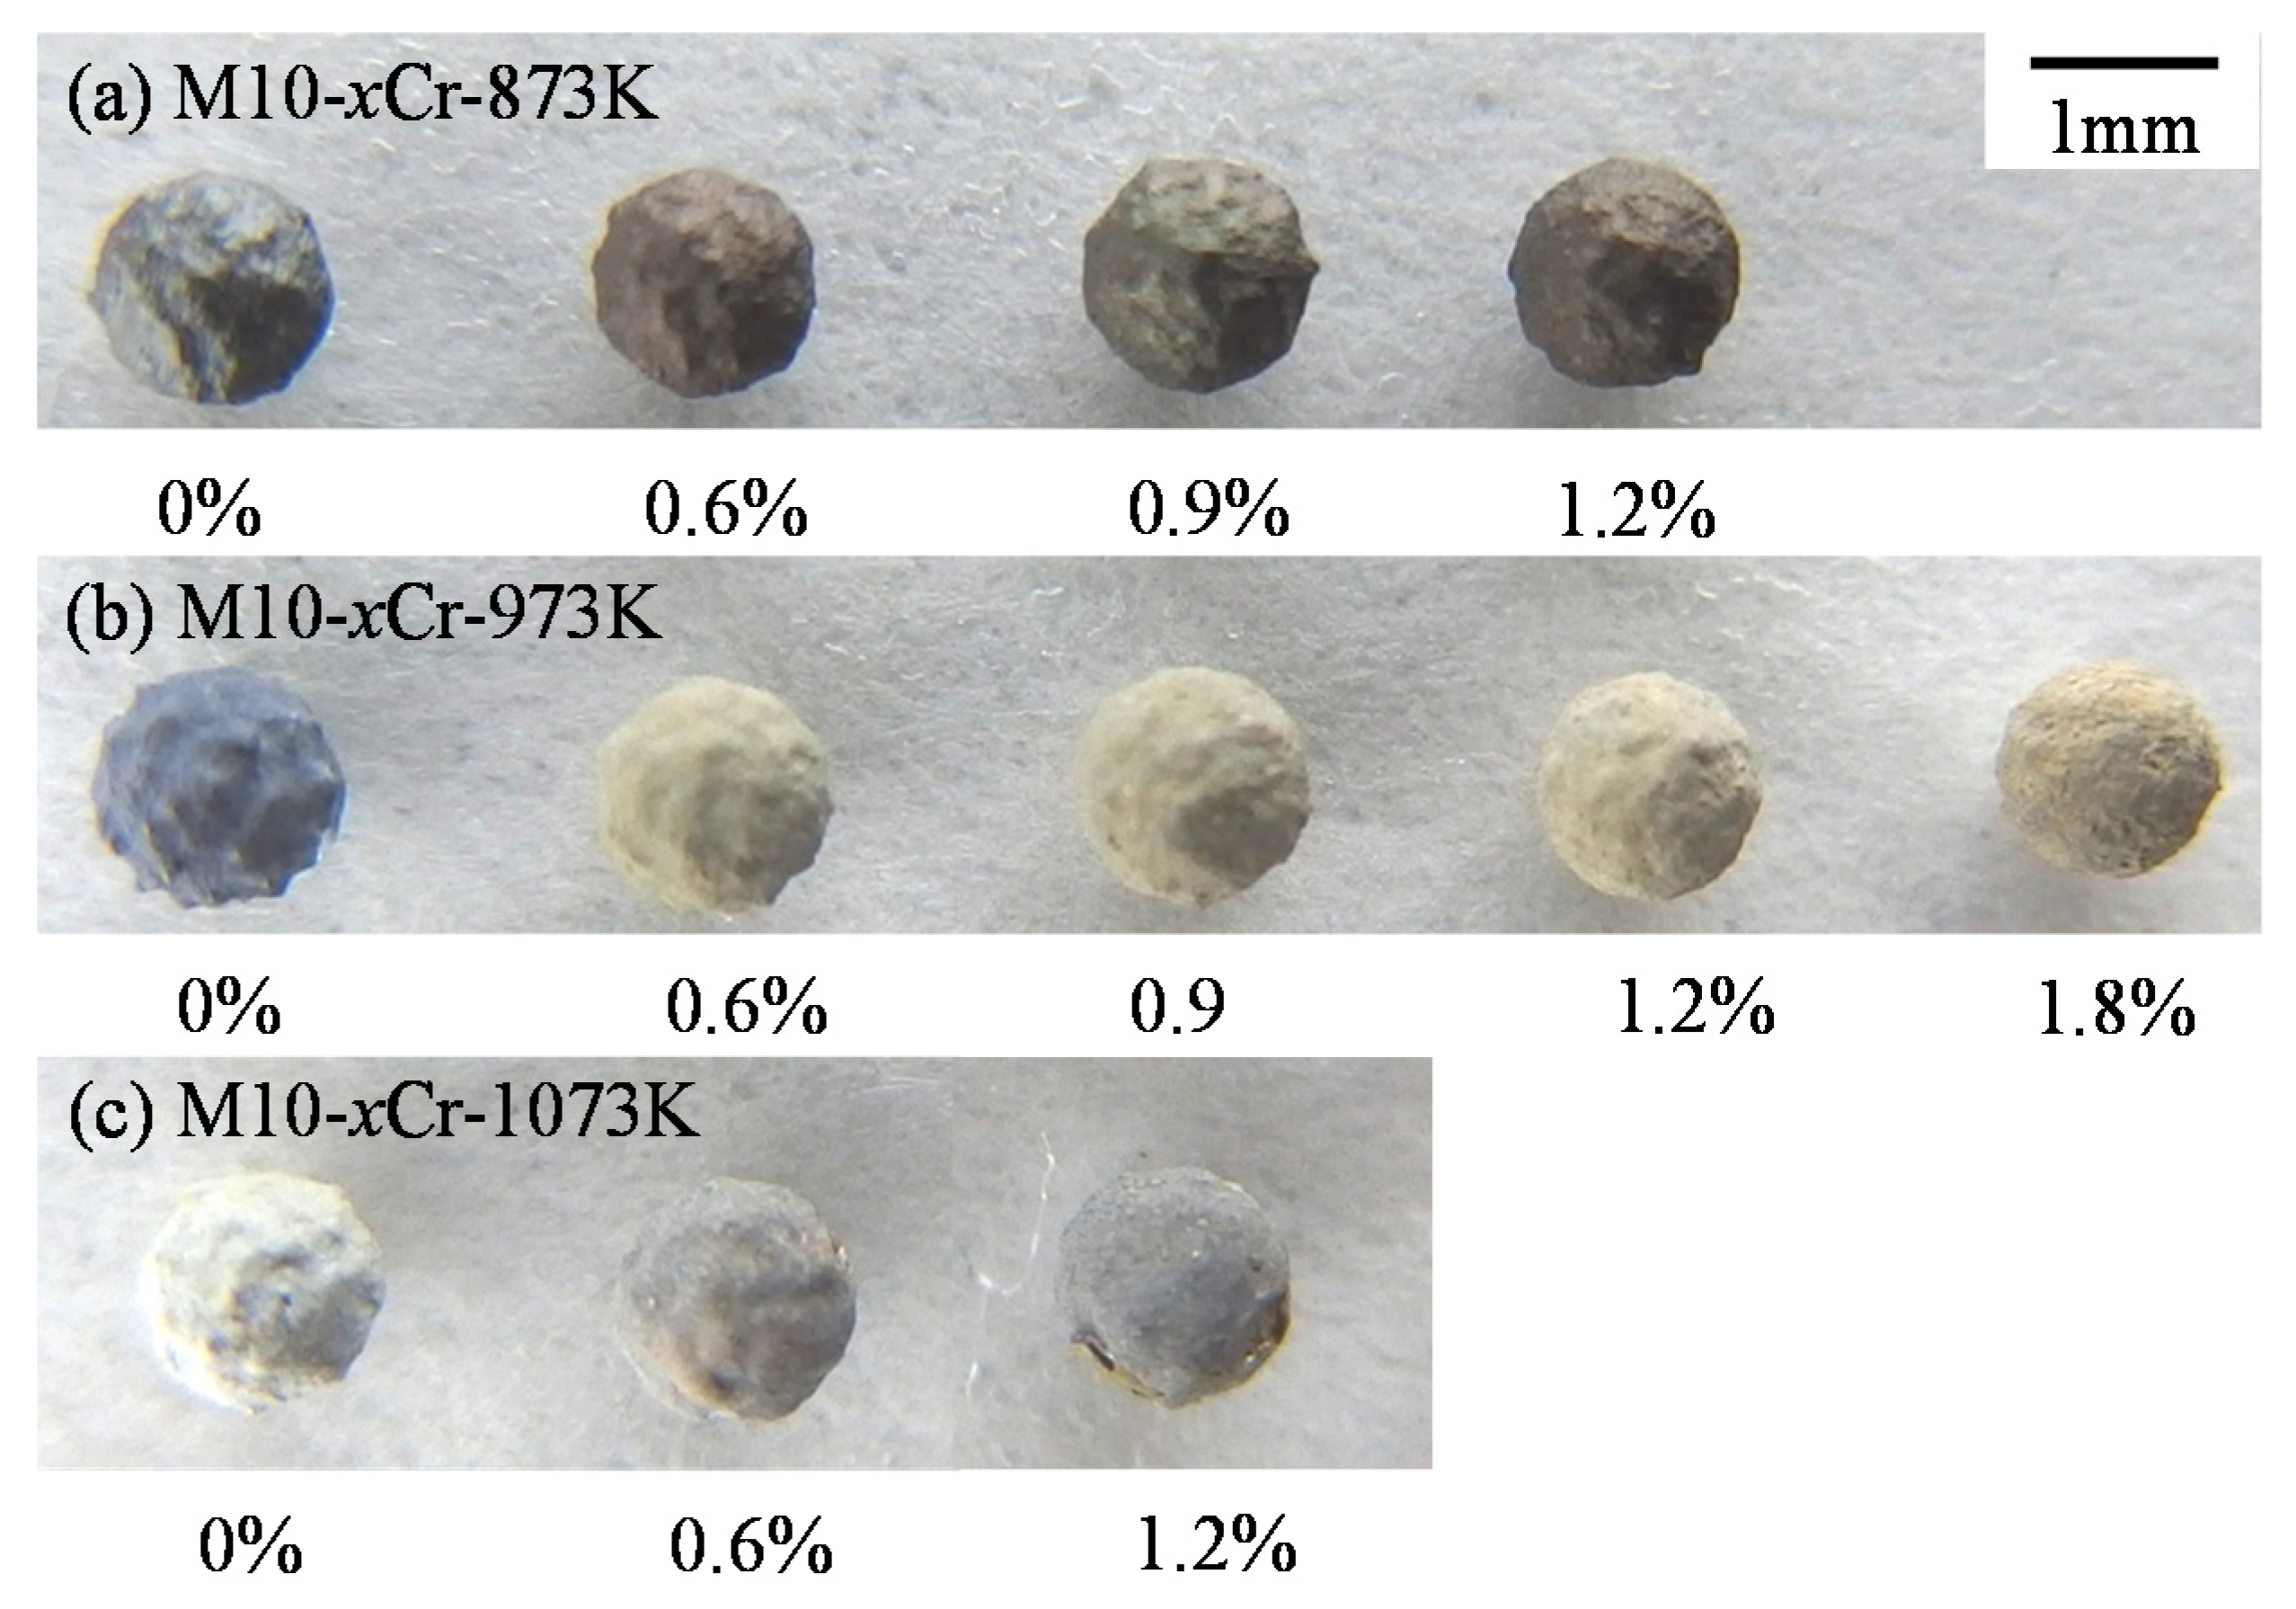
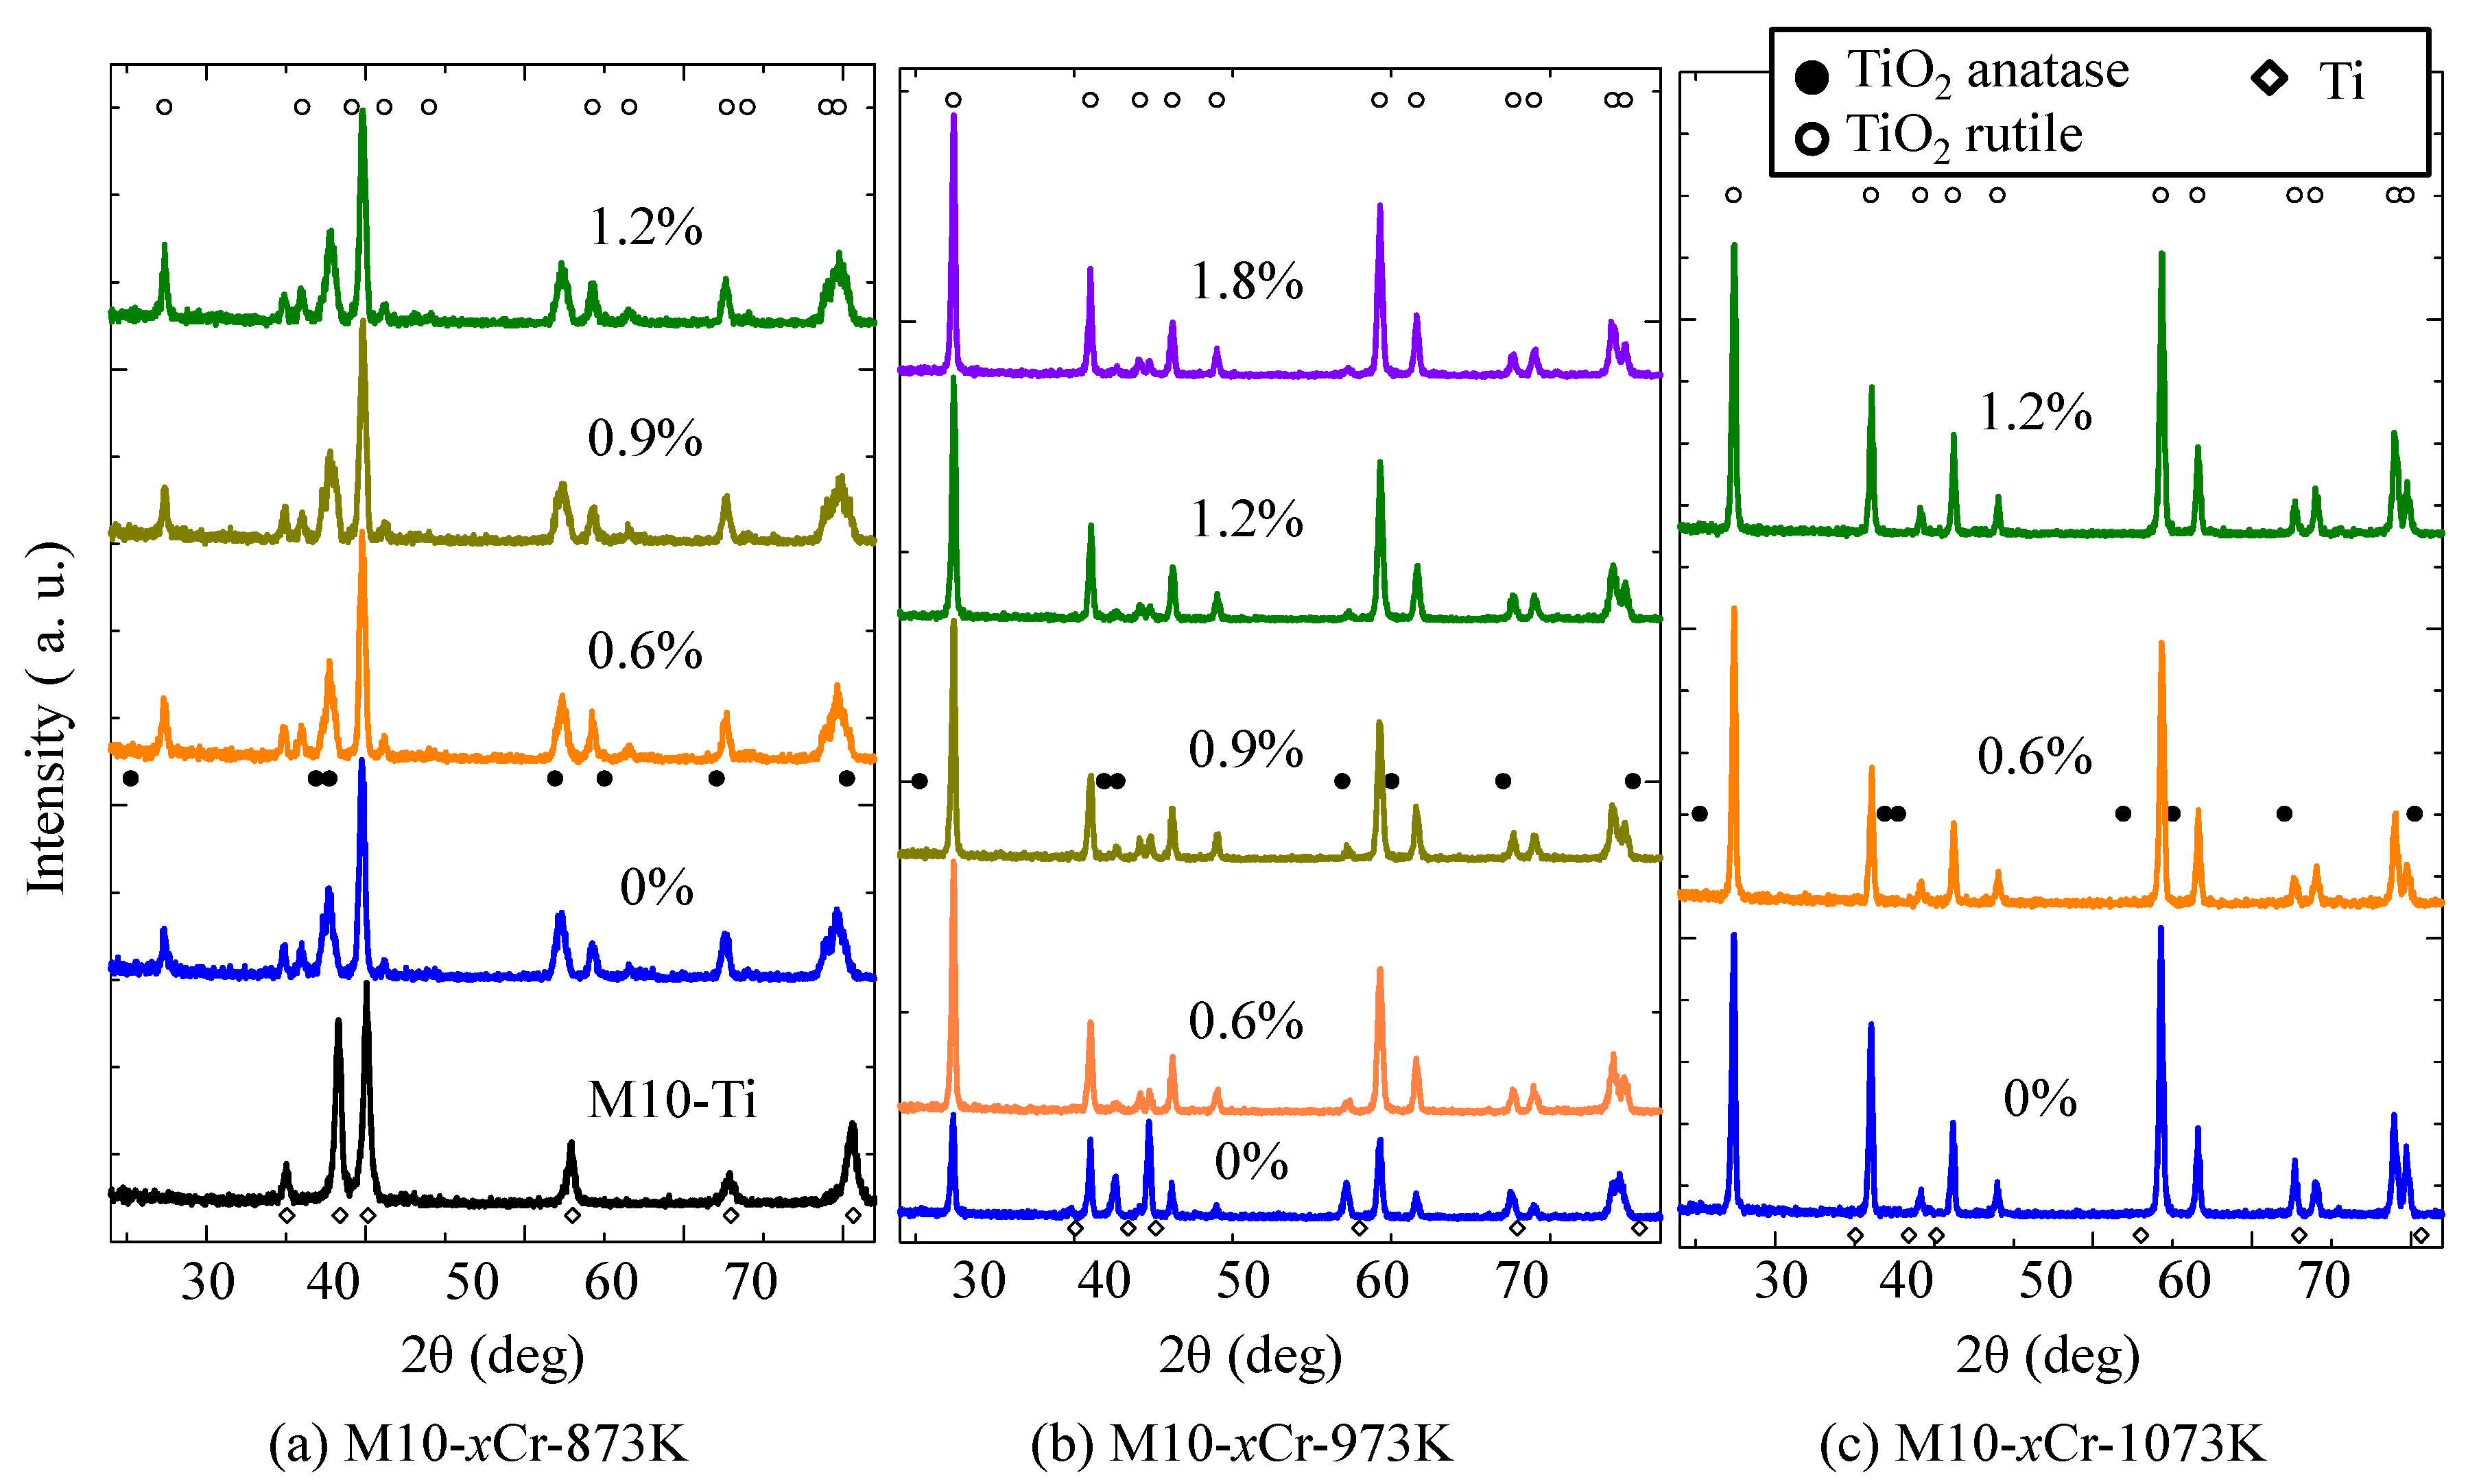
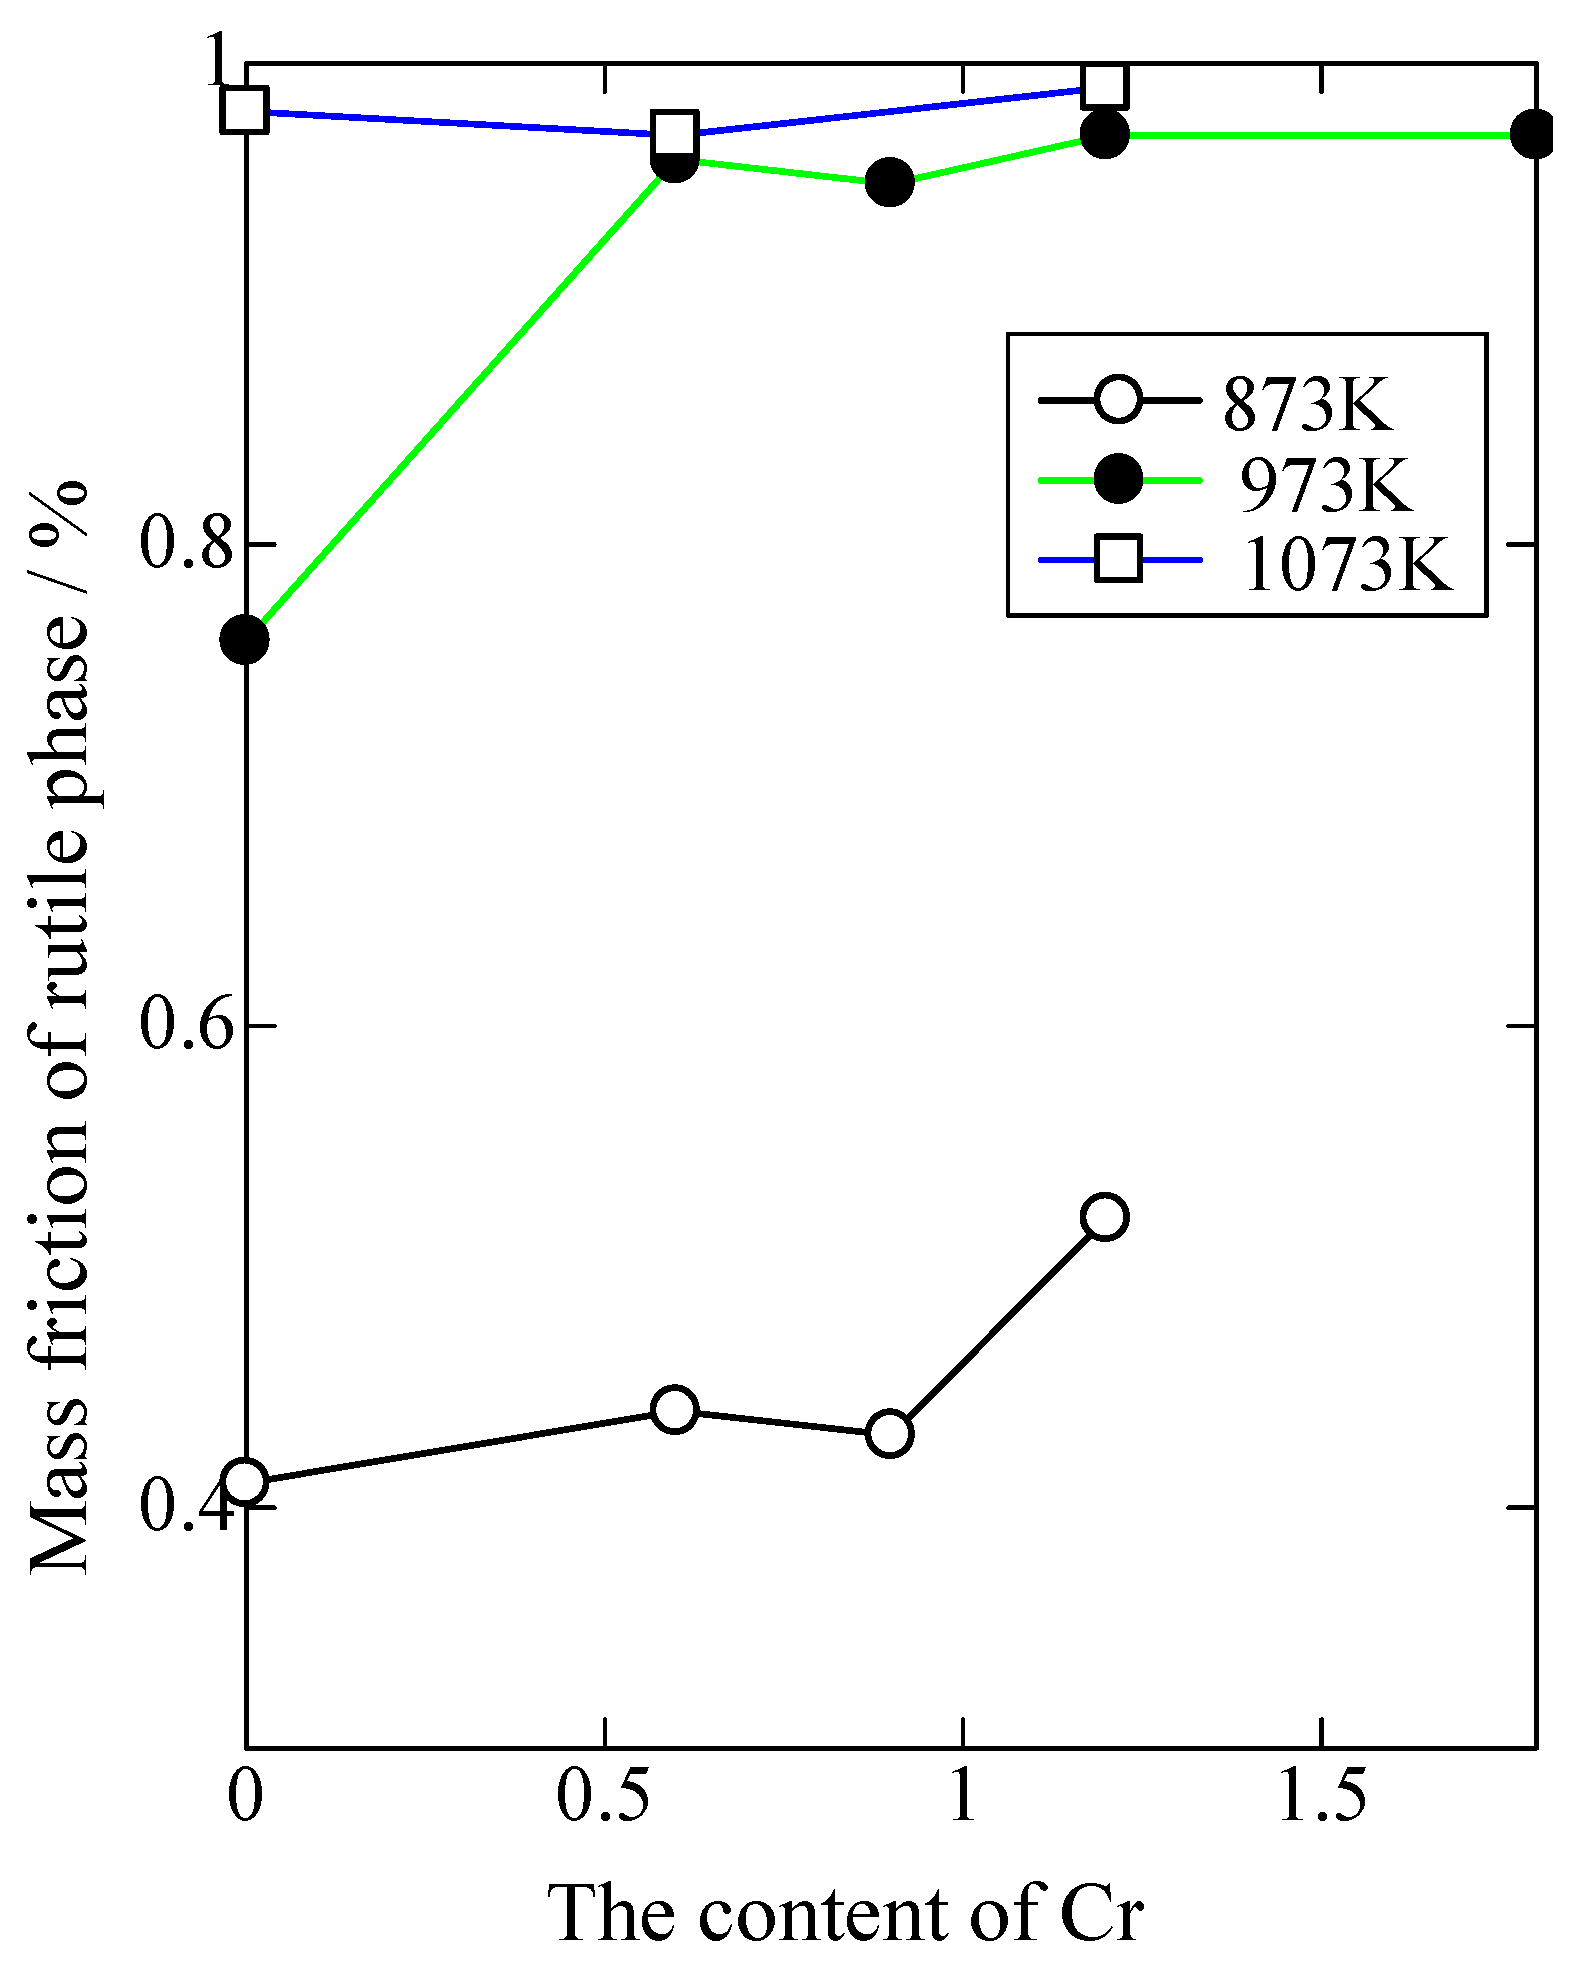
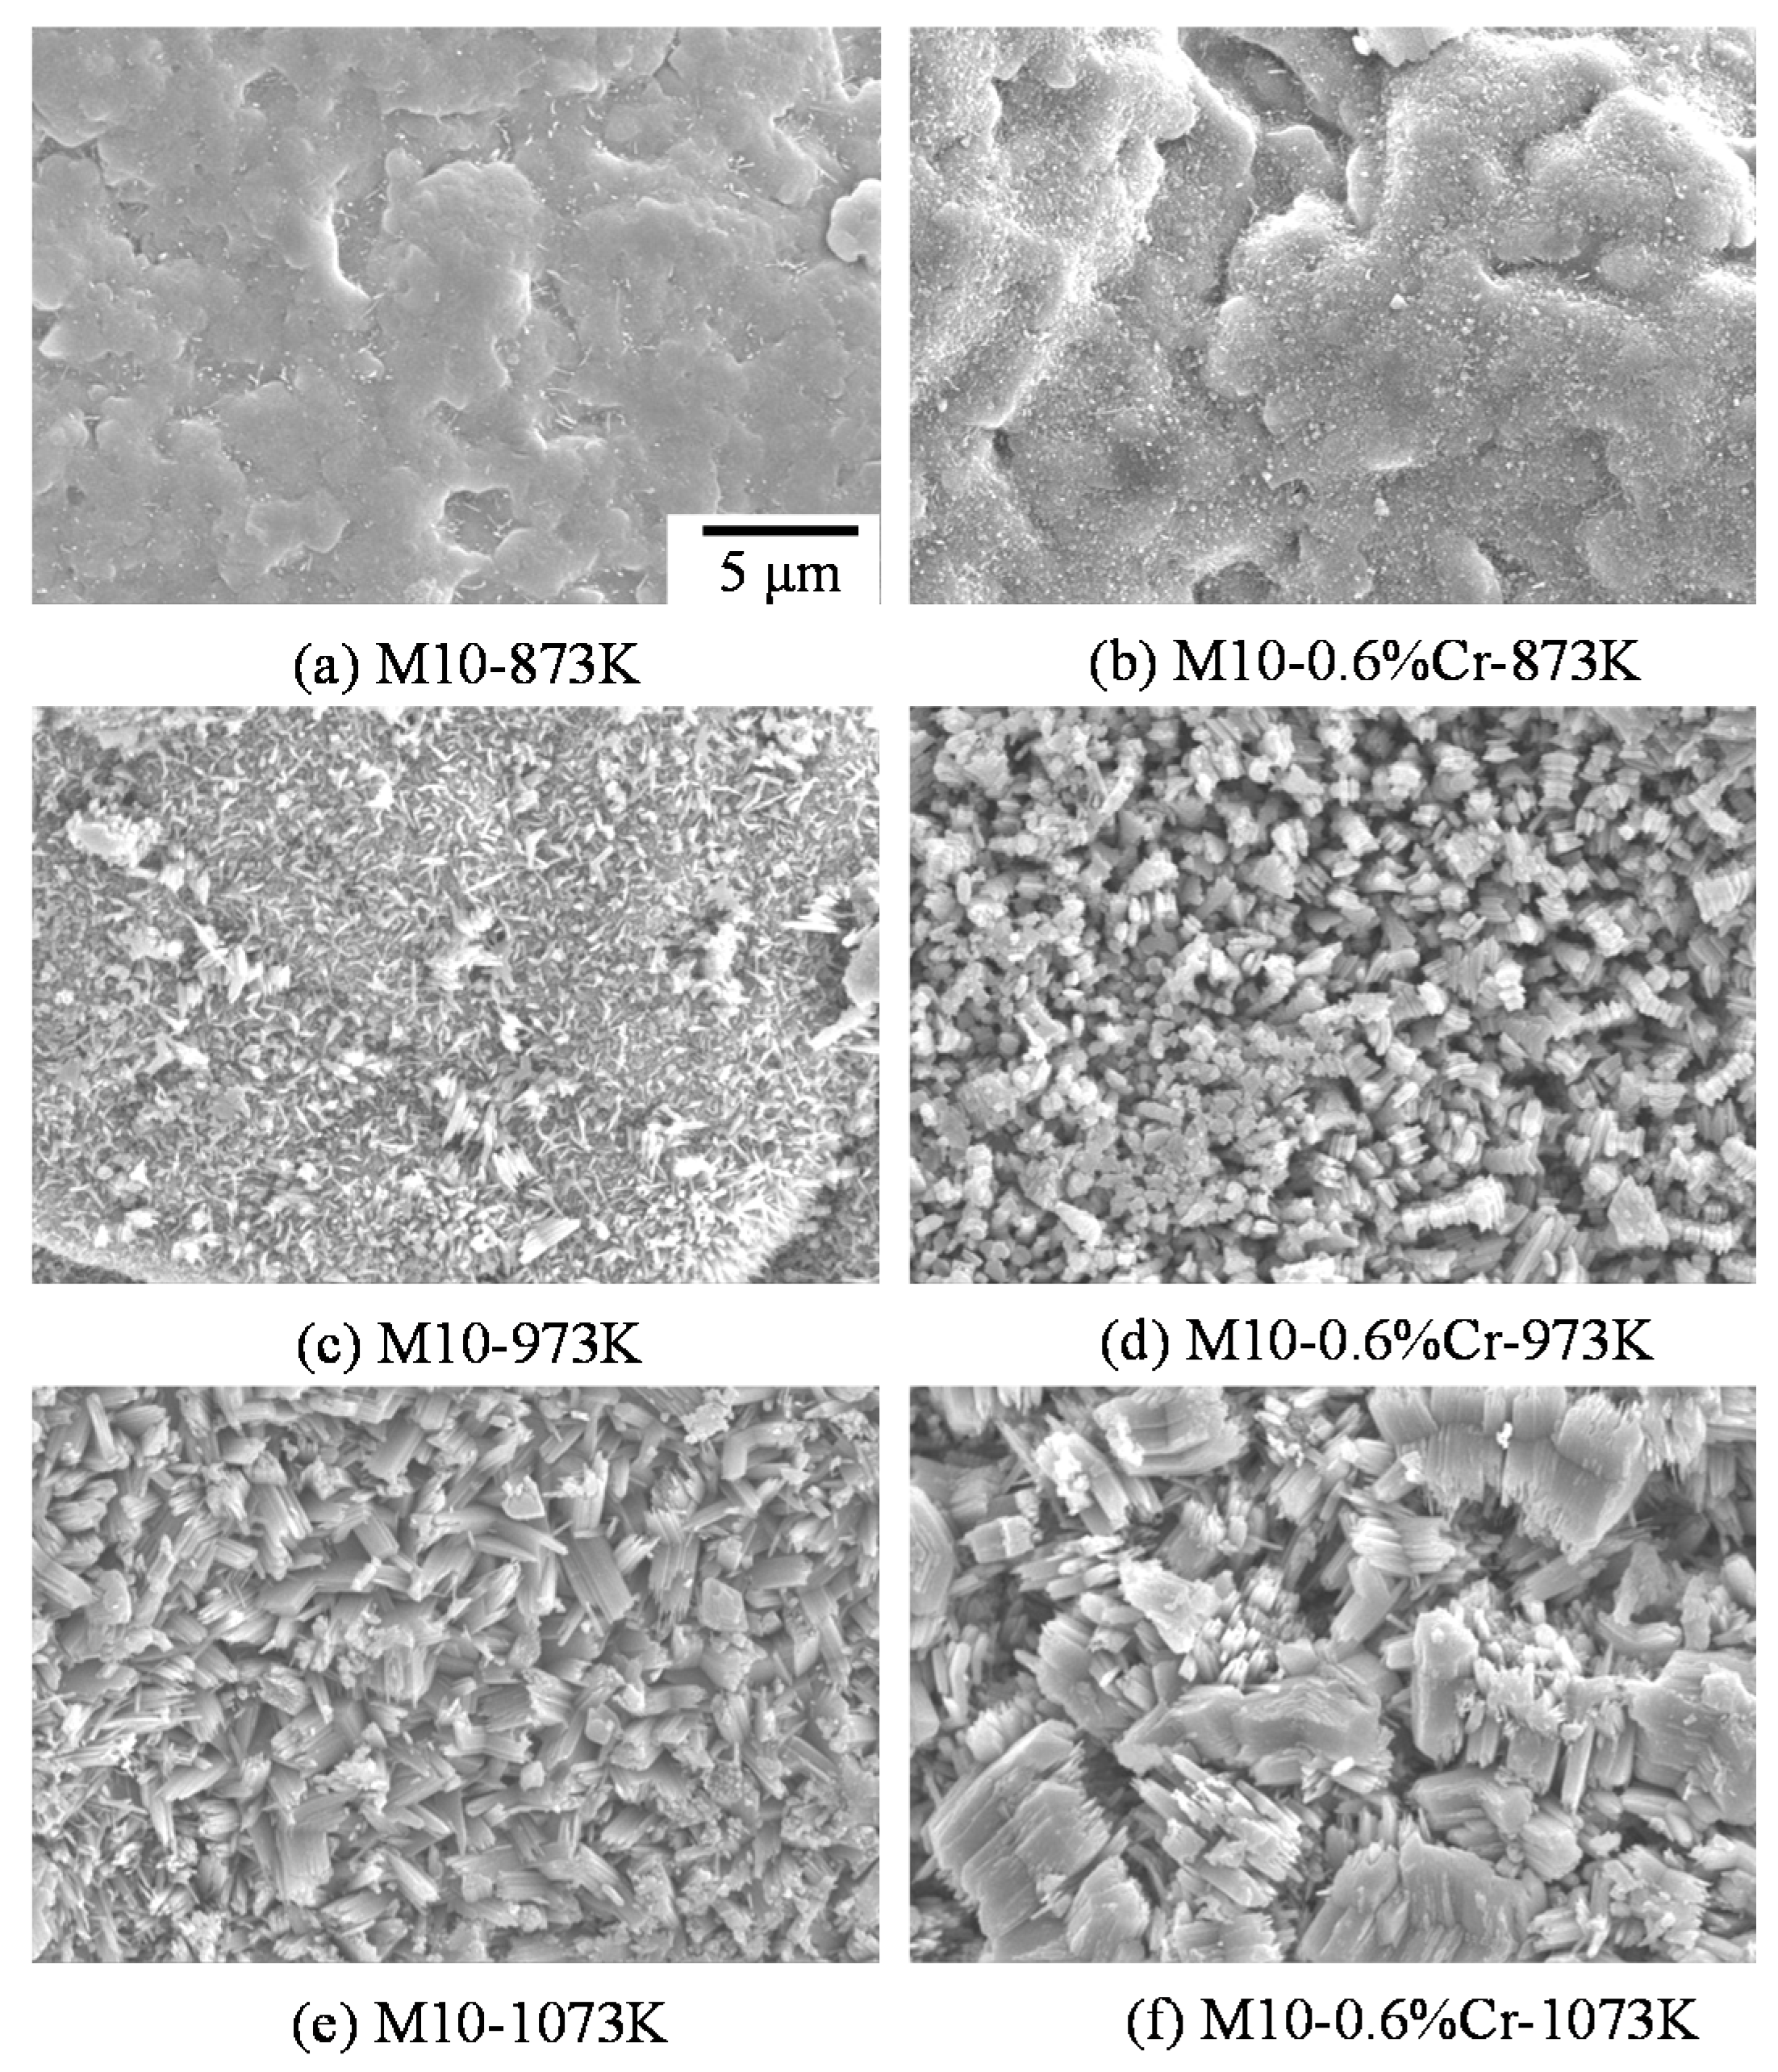
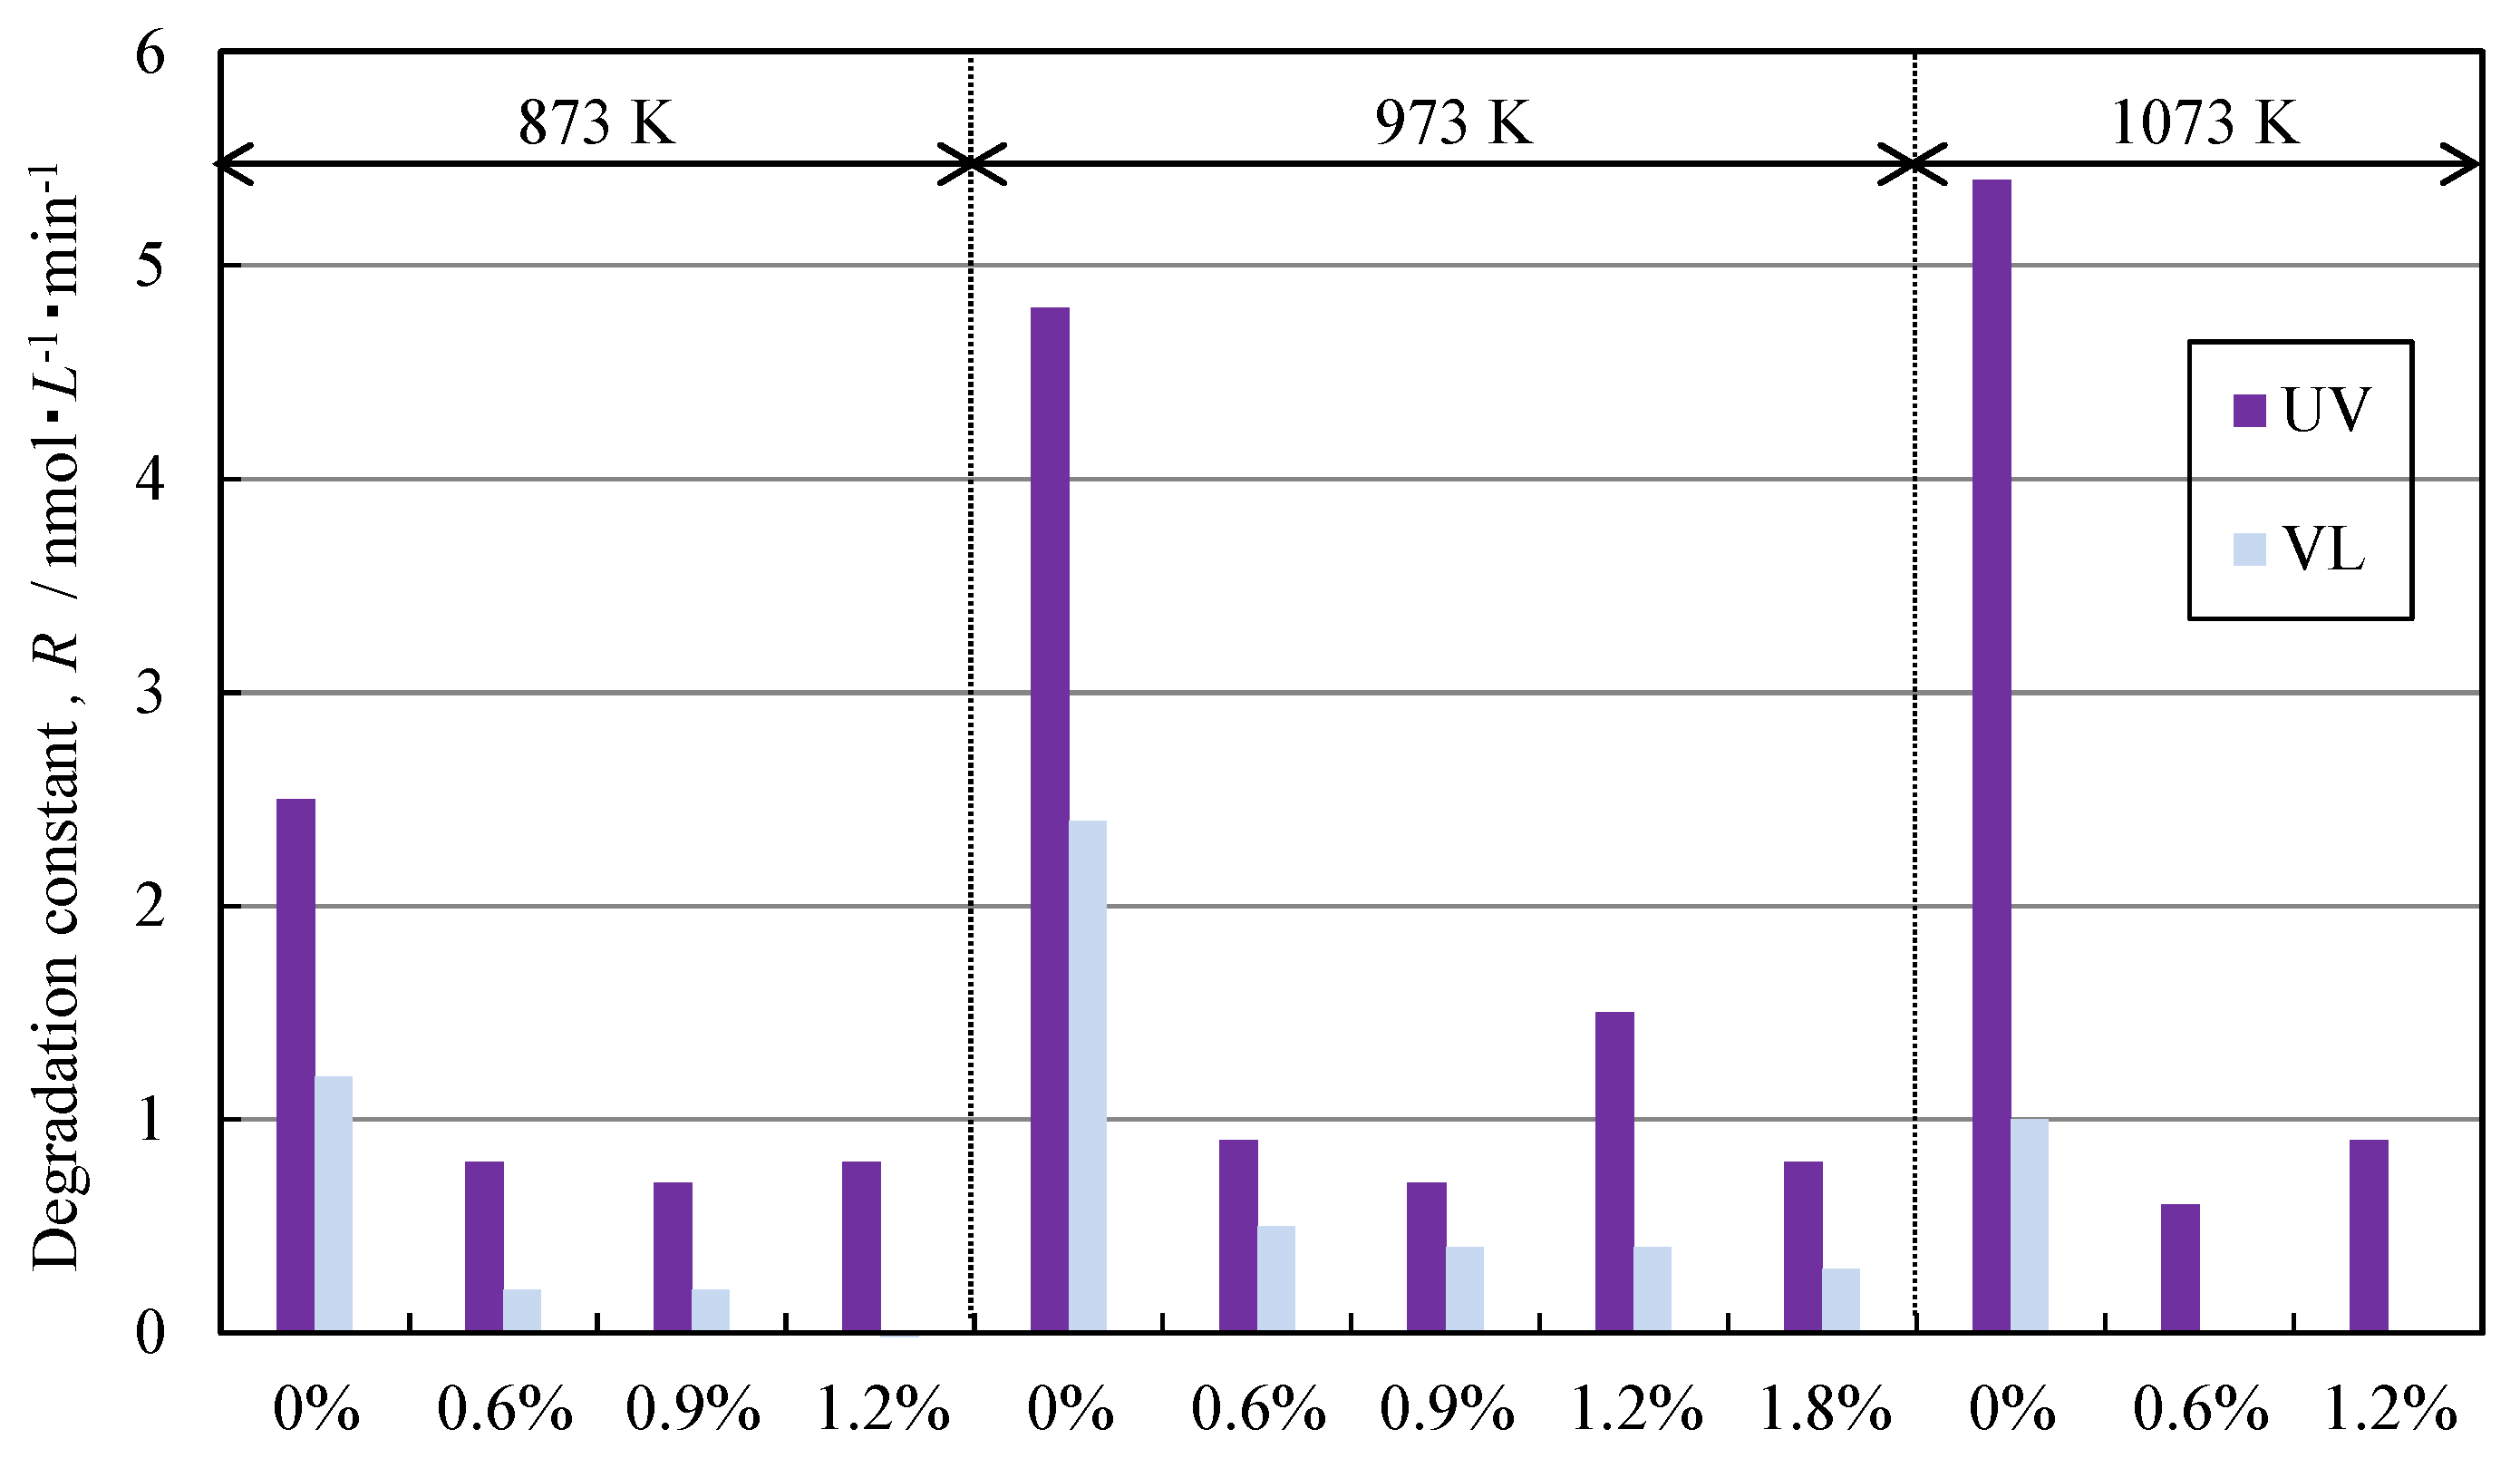
3.2.2. Influence on Photocatalyst Coatings of TiO2 by Adding Cr

The M10-xCr coatings show a metallic color, which is the same as M10-Ti [8]. In contrast, Figure 48 shows the M10-xCr coatings after being oxidized at elevated temperatures for 15 h. The M10-xCr-yK samples display various colors, which are grey, brown, and light-brown at 873 K, blue and light-yellow at 973 K, and light-white and light-grey at 1073 K. With added Cr, the color of samples obviously changes at each temperature. The color change of photocatalyst composite coatings hints that the samples with different thicknesses and nano-size crystal structures were formed by heat oxidation [35,54].
Figure 49 shows the XRD patterns of the samples. It can be seen that only the diffraction peaks of Ti are detected from the M10-Ti, and mixed-phase with anatase and rutile from the M10-xCr-873 K. No characteristic peak of chromium oxide was found, which hints either doped Cr was incorporated in the crystalline of TiO2, or the chromium oxide was highly dispersed and its size was too small to be detected [55,56,57]. While at the temperature of 973 K, the phase obviously changes from anatase to rutile when adding Cr, which suggests that Cr could accelerate the phase transformation from anatase to rutile [58]. With temperatures up to 1073 K, it only appeared as a rutile phase. For comparison, XR was calculated from the respective peak intensities using Equation (2). The change of XR is significant at each oxidation temperature and with different contents of Cr, especially at the temperature of 973 K, as shown in Figure 50.
The SEM images of M10-xCr-yK samples are shown in Figure 51, compared with the temperature and adding Cr. With increases in the temperature, the crystals increase in number and grow to form a nano-size structure, from Figure 51a,c,e, which is similar to Figure 25. While adding Cr, the microstructure of samples at each oxidation temperature becomes larger, from Figure 51b,d,f. The effect of adding Cr on the surface microstructure is significant. Considering the changes of surface microstructure and phase transformation, the conclusion could be drawn that the phase transformation from anatase to rutile had been affected by the crystal size [21,59].
Figure 48. Photograph of the samples.
Coatings 05 00425 g048
Figure 49. XRD patterns of the M10-xCr-yK samples.
Coatings 05 00425 g049
Figure 50. The change of XR with the content of Cr.
Coatings 05 00425 g050
Figure 51. SEM images of surfaces of M10-xCr-yK samples.
Coatings 05 00425 g051
Figure 52 shows the cross section of M10-xCr-yK samples. The oxidized layer cannot be detected from the samples at the temperature of 873 K. At the temperature of 973 K, a thin oxidized layer could be found from M10-973 K, while adding Cr, the layer thickens. At 1073 K, the growth of layer is more obvious, when adding Cr. The change hints that the presence of Cr could significantly accelerate the growth of the oxidized layer, which is similar to the effect on surface microstructure.
Figure 52. SEM images of cross sections of M10-xCr-yK samples.
Coatings 05 00425 g052
The photocatalytic activity of the samples had been investigated by degradation of MB solution under UV and visible light, when the diameter of the test cell is 40 mm, shown as Figure 53. With the addition of Cr, the photocatalytic activity under UV and visible light is relatively higher at 973 K, which might be caused by the nano-size microstructure and/or the recombination site from the excess Cr. The overall trends of photocatalytic activity was that of decrease, when adding Cr at each temperature. It shows that photocatalytic activities were affected by the surface morphology and crystal structure.
Figure 53. Degradation rate constant and XR of M10-xCr-yK samples.
Coatings 05 00425 g053

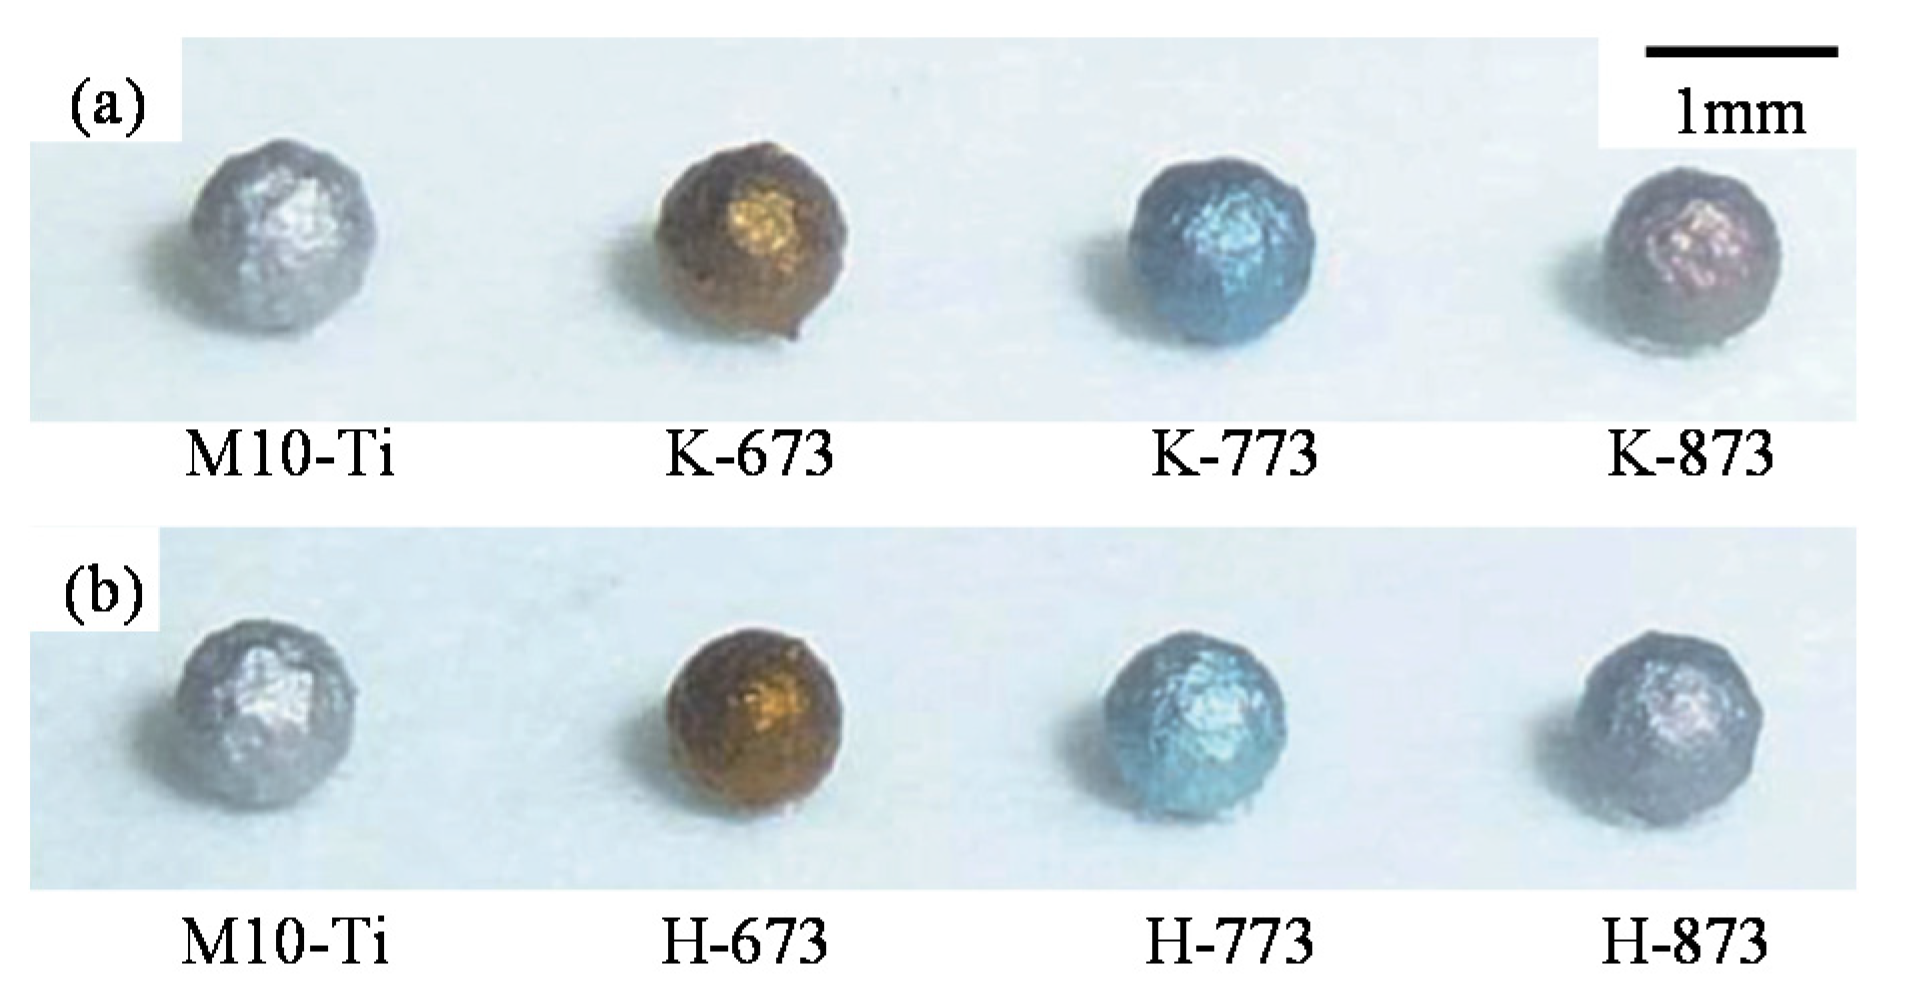
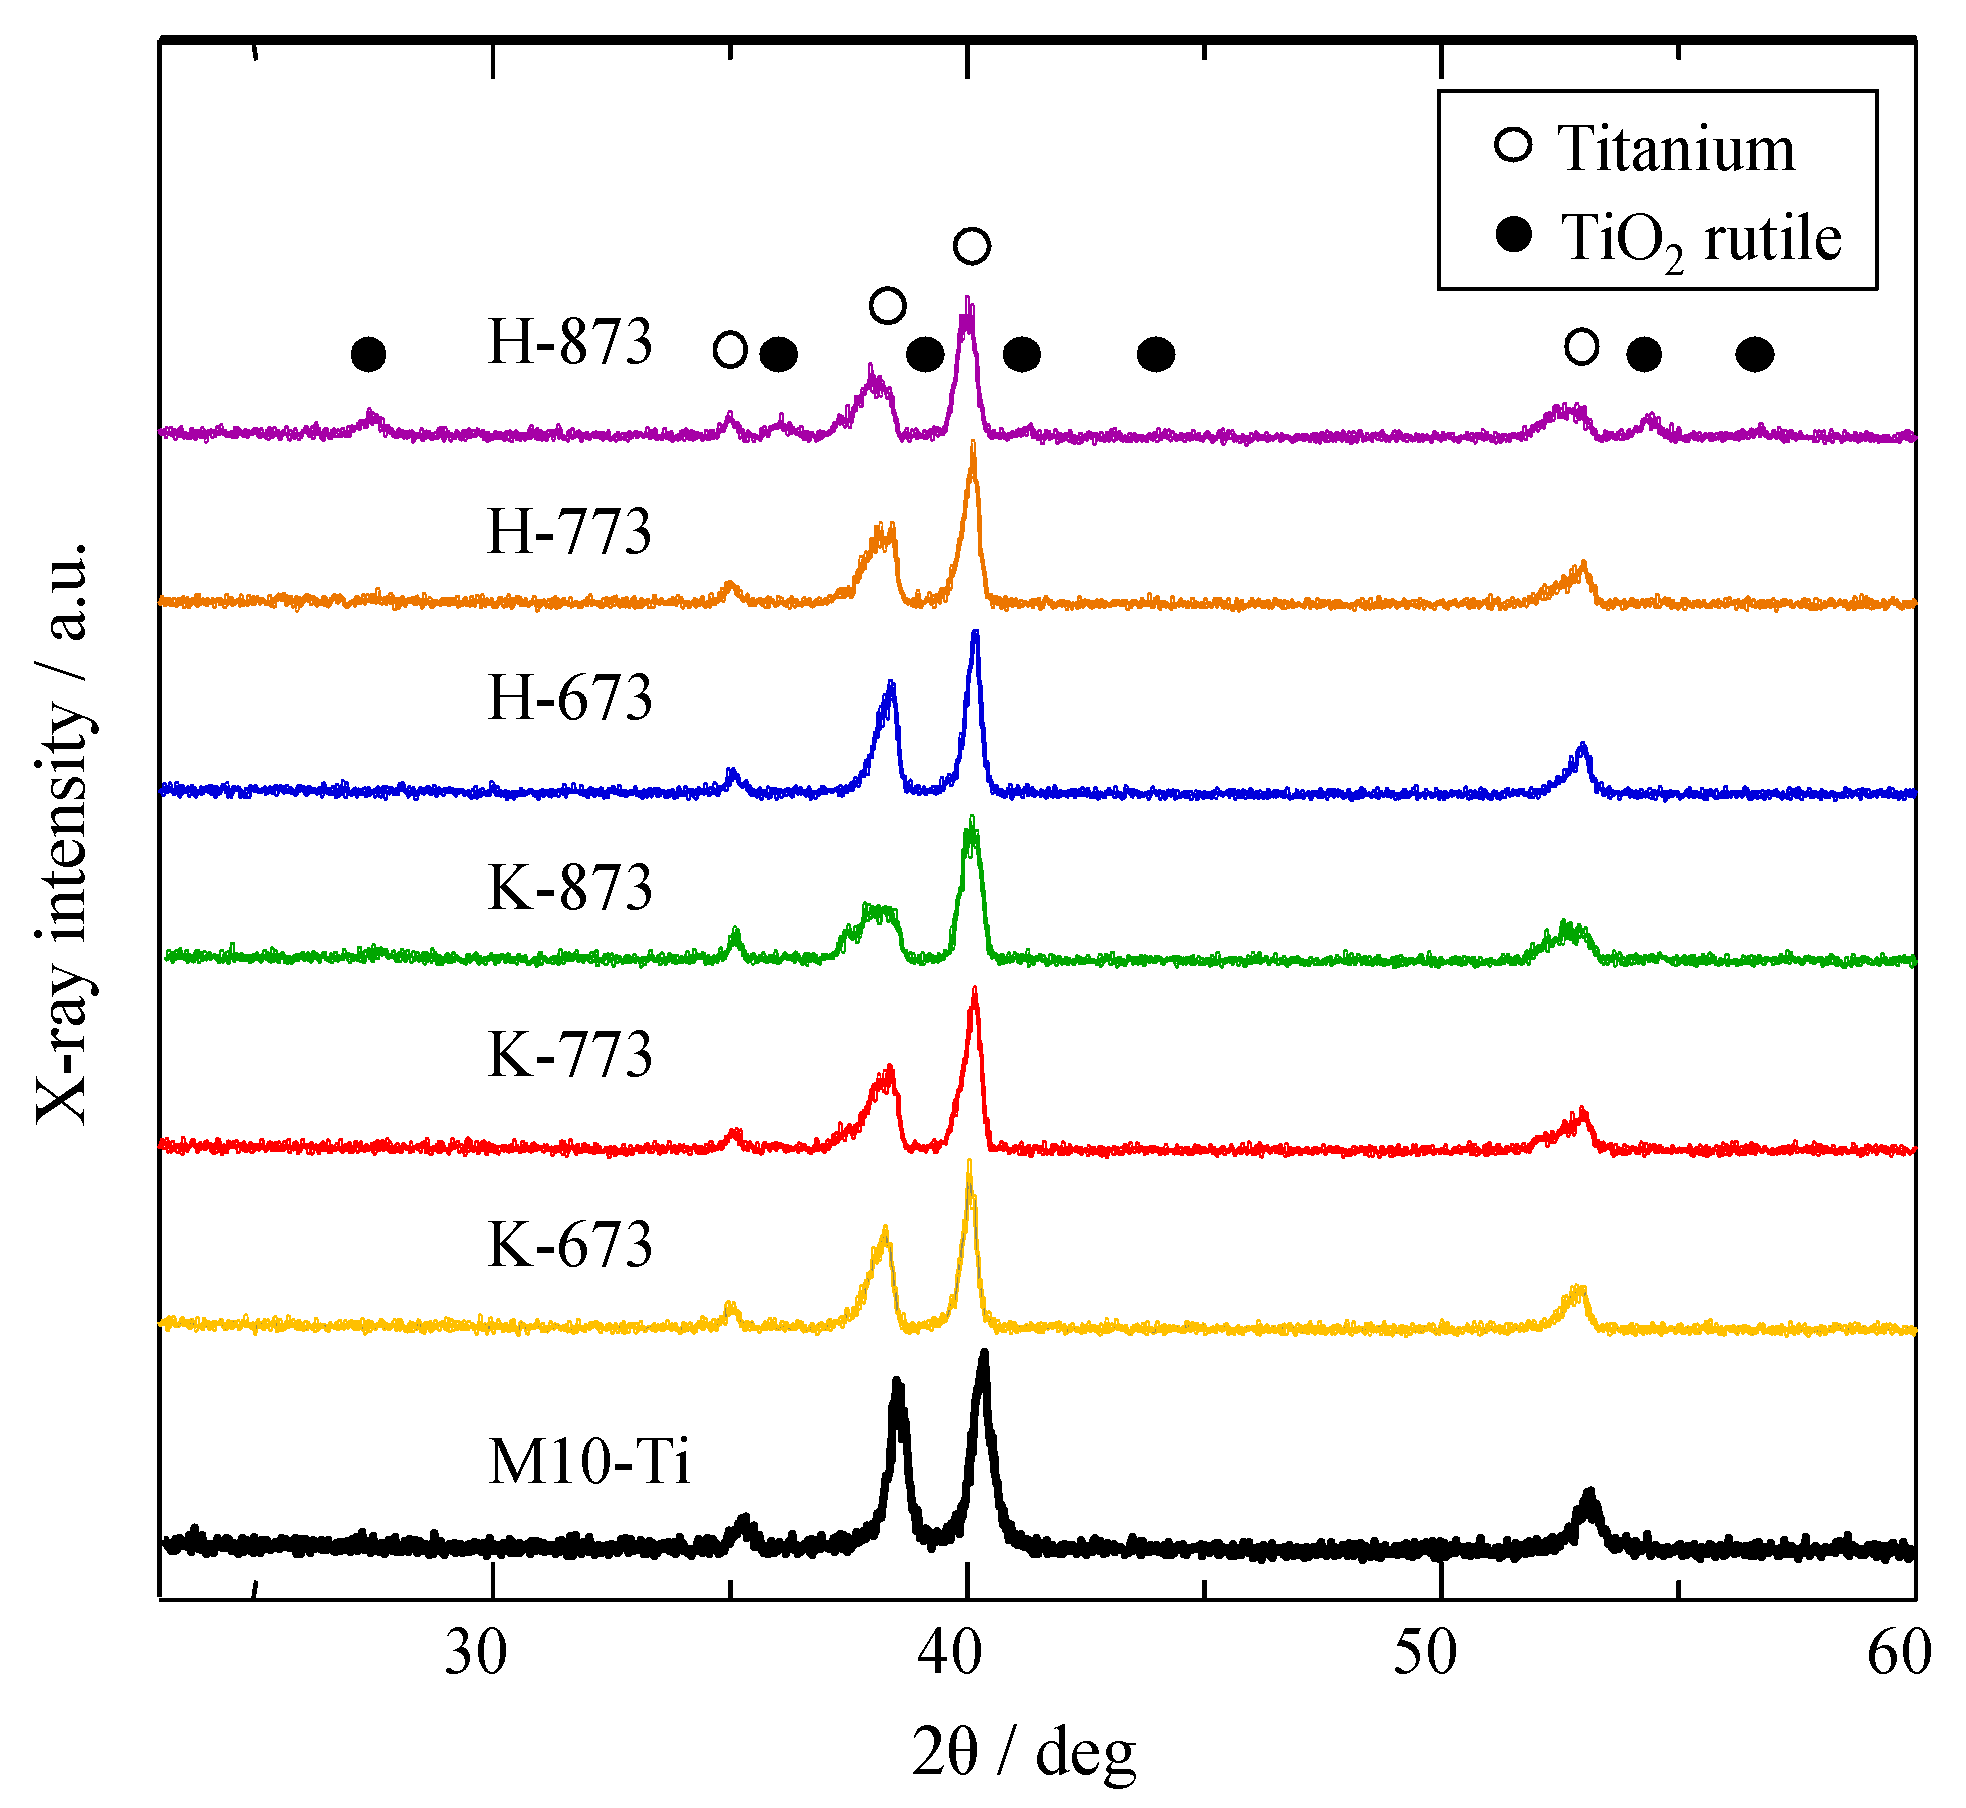
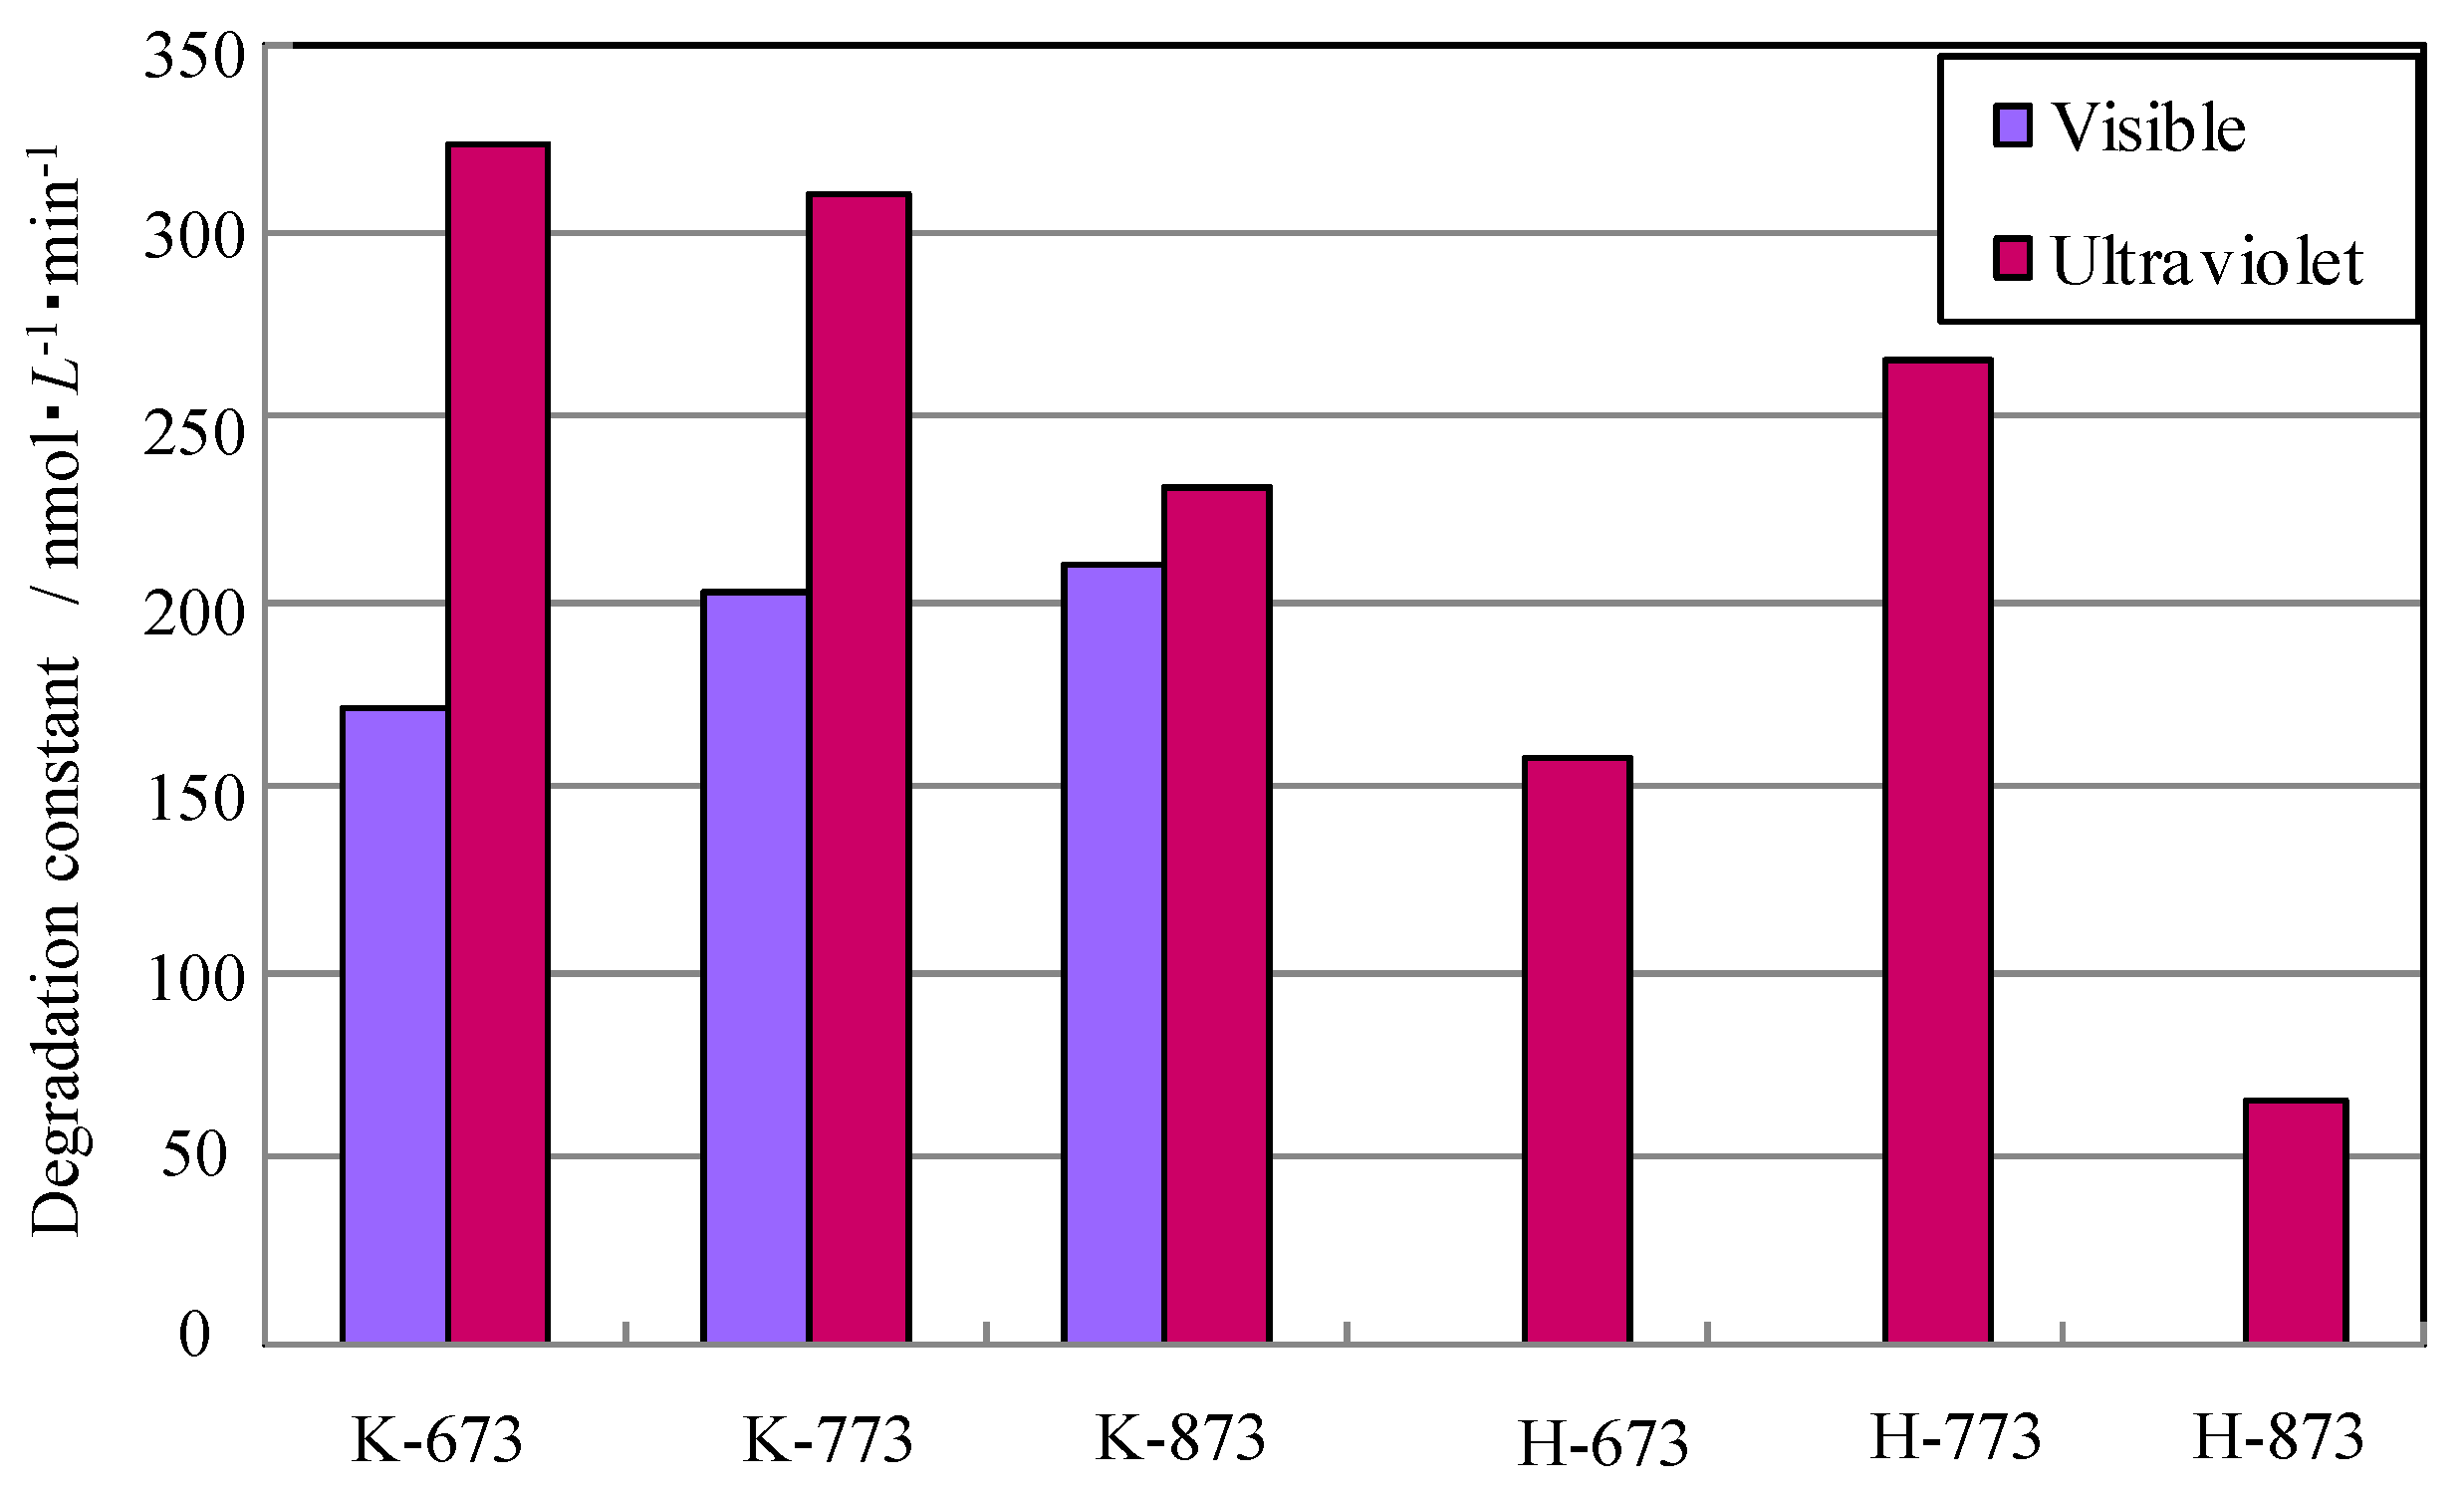
3.3. Influence on Photocatalyst Coatings of TiO2 by Molten Salt Treatment

Firstly, additional information about the naming method of prepared samples is provided as follows: The Ti coatings will be treated by molten salt treatment of KNO3 (99.0%, 167-04045, Wako Pure Chemical Industries, Ltd., Chuo-ku, Japan) under the temperature of x K for 3 h, named as K-x. For comparison, the samples will be oxidized at the temperature of y K for 3 h, named as H-y.
The appearance photograph of Ti coatings treated by molten salt treatment and oxidation process is shown as Figure 54. The K-x samples treated by molten salt treatment display various colors, yellow at 673 K, blue at 773 K, dark-purple at 873 K, shown in Figure 54a. While the H-y samples treated by oxidation process are similar but a little lighter than that of the K-x samples, shown in Figure 54b. The color of TiO2 is related to the thickness of TiO2 coatings, and the presence of potassium affected the TiO2 coatings [28,37,60].
Figure 54. Photograph of the samples.
Coatings 05 00425 g054
Figure 55 shows the XRD patterns of the samples. It can be seen that only the diffraction peaks of Ti are detected from the M10-Ti, and anatase phase near 38° and 52° from the treated samples of K-x and H-y. Compared with these two treatments, the XRD patterns show very little change, which hints that the content of potassium is too little to have an obvious effect on the phase transformation. In order to compare the influence of molten salt treatment, the content of potassium in the K-x samples had been investigated by EDS, as shown in Table 4.
Figure 55. XRD patterns of the samples.
Coatings 05 00425 g055
Table 4. Composition of the specimens by molten salt treatment.
ElementTitaniumOxygenPotassium
M10-Ti94.55.50.0
K-67386.413.60.0
K-77372.826.50.7
K-87358.539.52.0
The SEM images of surfaces microstructure of samples treated by molten salt treatment and an oxidation process are shown in Figure 56, compared with the temperature and treatment method. The nano-size structure could be detected by oxidation process from Figure 56a,b,c, until the temperature reaches 873 K, which is considered to be anatase phase, according to the XRD result. Meanwhile, the nano-size structure could be detected by molten salt treatment from Figure 56d,e,f, and the structure grew larger. Therefore, the structure formed at 673 K and 773 K by molten salt treatment may be related to amorphous potassium titanate [60].
The photocatalytic activity of the samples had been investigated by degradation of MB solution under UV and visible light, shown as Figure 57. The photocatalytic activity of the K-x samples under UV is a little higher than that of the H-y samples, while the photocatalytic activity of the K-x samples under visible light had been significantly enhanced. It might be related with the nano-size microstructure and/or amorphous phase caused by the presence of potassium, which is considered to provide good absorption [61].
Figure 56. SEM micrographs of surfaces microstructure of the K-x and H-y samples.
Coatings 05 00425 g056
Figure 57. Degradation rate constant of the samples.
Coatings 05 00425 g057

4. Conclusions

This review presents the latest results of studies directed at photocatalyst coatings of TiO2 prepared using the mechanical coating technique (MCT) and its application.
MCT as a novel formation process is affected by the electronegativity and plastic deformability of the metal, MCT speed and time. The formation process of the metal coatings in MCT is considered to consist of four stages: the nucleation by adhesion, the formation and coalescence of discrete islands, formation and thickening of continuous coatings, and exfoliation of continuous coatings. Further, based on the MCT concept for preparing composite coatings on alumina balls, a two-step MCT was developed to fabricate the composite photocatalyst coatings. Compared with traditional coating techniques (requiring large and complicated equipment, vacuum conditions, having high fabrication cost, difficulties in forming on spherical substrates), MCT is a simple, low cost and useful coating formation process, which could be used to fabricate photocatalyst coatings.
On the other hand, this review discusses the influence on the fabrication of photocatalyst coatings after MCT and improvement of the photocatalytic activity: oxidation conditions, coating materials, and melt salt treatment. The oxidation conditions could significantly affect the crystal phase and surface structure, and the photocatalyst coatings showed the highest photocatalytic activity with the oxidation condition of 1073 K for 15 h. The photocatalyst coatings had been fabricated using composite metal powder, and the surface structure and photocatalytic activity also had been affected by different metal powders (Ni, Cr). The Ni powder could enhance the photocatalytic activity under oxidation at 1073 K, while Cr powder had difficulty in enhancing the photocatalytic activity with a relatively high content of Cr powder. The melt salt treatment with KNO3 is an effective method to form a nano-size structure and enhance photocatalytic activity.

Conflicts of Interest

The authors declare no conflict of interest.

References

  1. Ohring, M. Materials Science of Thin Films; Academic Press: New York, NY, USA, 2001. [Google Scholar]
  2. Freund, L.B.; Suresh, S. Thin Film Materials-stress, Defect Formation and Surface Evolution; Cambridge University Press: Cambridge, UK, 2004. [Google Scholar]
  3. Lu, Y.; Hao, L.; Yoshida, H. Chapter12: Mechanical coating technique for composite films. In Composite and Their Applications; Hu, N., Ed.; Intech Press: Rigeka, Croatia, 2012. [Google Scholar]
  4. Mattox, D.M. Handbook of Physical Vapor Deposition (PVD) Processing; William Andrew: Burlington, VT, USA, 2010. [Google Scholar]
  5. Pierson, H.O. Handbook of Chemical Vapor Deposition-Principles, Technology and Application; William Andrew Publishing: New York, NY, USA, 1999. [Google Scholar]
  6. Wasa, K.; Kitabatake, M.; Adachi, H. Thin Film Materials Technology: Sputtering of Compound Materials; William Andrew Publishing: New York, NY, USA, 2003. [Google Scholar]
  7. Yoshida, H.; Lu, Y.; Hirohashi, M. Fabrication of metallic titanium film by mechanical coating technique. In Proceedings of the 5th International Forum on Advanced Material Science and Technology (IFAMST 5), Zhangjiajie, China, 11 June 2006.
  8. Yoshida, H.; Lu, Y.; Nakayama, H.; Hirohashi, M. Fabrication of TiO2 film by mechanical coating technique and its photocatalytic activity. J. Alloys Compd. 2009, 475, 383–386. [Google Scholar] [CrossRef]
  9. Dozzi, M.V.; Selli, E. Doping TiO2 with p-block elements: Effects on photocatalytic activity. J. Photochim. Photobiol. C 2013, 14, 13–28. [Google Scholar] [CrossRef]
  10. Kumar, S.G.; Devi, L.G. Review on modified TiO2 photocatalysis under UV/visible light: Selected results and related mechanisms on interfacial charge carrier transfer dynamics. J. Phys. Chem. A 2011, 115, 13211–13241. [Google Scholar] [CrossRef] [PubMed]
  11. Nakata, K.; Fujishima, A. TiO2 photocatalysis: Design and applications. J. Photochim. Photobiol. C 2012, 13, 169–189. [Google Scholar] [CrossRef]
  12. Liu, M.; Qiu, X.; Hashimoto, K.; Miyauchi, M. Cu (II) oxide amorphous nanoclusters grafted Ti3+ self-doped TiO2: An efficient visible light photocatalyst. J. Mater. Chem. A 2014, 2, 13571–13579. [Google Scholar] [CrossRef]
  13. Gratzel, M. Photoelectrochemical cells. Nature 2001, 238, 338–344. [Google Scholar] [CrossRef] [PubMed]
  14. Zhang, S. The microscopic origin of the doping limits in semiconductors and wide-gap materials and recent developments in overcoming these limits: A review. J. Phys. Condens. Mat. 2002, 14. [Google Scholar] [CrossRef]
  15. Chen, S.; Chen, L.; Gao, S.; Cao, G. The preparation of coupled SnO2/TiO2 photocatalyst by ball milling. Mater. Chem. Phys. 2006, 98, 116–120. [Google Scholar]
  16. Pan, L.; Zou, J.; Zhang, X.; Wang, L. Photoisomerization of norbornadiene to quadricyclane using transition metal doped TiO2. Ind. Eng. Chem. Res. 2010, 49, 8526–8531. [Google Scholar] [CrossRef]
  17. Gai, Y.; Li, J.; Li, S.; Xia, J.; Wei, S. Design of narrow-gap TiO2 for enhanced photoelectrochecmical activity: A passivated codoping approach. Phys. Rev. Lett. 2009, 102. [Google Scholar] [CrossRef]
  18. Yan, M.; Chen, F.; Zhang, J.; Anpo, M. Preparation of controllable crystalline titania and study on the photocatalytic properties. J. Phys. Chem. B 2005, 109, 8673–8678. [Google Scholar] [CrossRef] [PubMed]
  19. He, Z.; Cai, Q.; Fang, H.; Situ, G.; Qiu, J.; Song, S.; Chen, J. Photocatalytic activity of TiO2 containing anatase nanoparticles and rutile nanoflower structure consisting of nanorods. J. Environ. Sci. 2013, 25, 2460–2468. [Google Scholar] [CrossRef]
  20. Liu, J.; Yu, X.; Liu, Q.; Liu, R.; Shang, X.; Zhang, S.; Li, W.; Zheng, W.; Zhang, G.; Cao, H.; et al. Surface-phase junctions of branched TiO2 nanorod arrays for efficient photoelectrochemical water splitting. Appl. Catal. B 2014, 158–159, 296–300. [Google Scholar] [CrossRef]
  21. Zhang, J.; Xu, Q.; Feng, Z.; Li, M.; Li, C. Importance of the relationship between surface phases and photocatalytic activity of TiO2. Angew. Chem. Int. Ed. 2008, 47, 1766–1769. [Google Scholar] [CrossRef] [PubMed]
  22. Lu, Y.; Yoshida, H.; Nakayama, H.; Hao, L.; Hirohashi, M. Formation of TiO2/Ti composite photocatalyst film by 2-step mechanical coating technique. Mater. Sci. Forum 2011, 675–677, 1229–1232. [Google Scholar] [CrossRef]
  23. Lu, Y.; Hao, L.; Toh, K.; Yoshida, H. Fabrication of TiO2-Cu composite photocatalyst thin film by twostep mechanical coating technique and its photocatalytic activity. Adv. Mater. Res. 2012, 415–417, 1942–1948. [Google Scholar]
  24. Hao, L.; Lu, Y.; Asanuma, H.; Guo, J. The influence of the processing parameters on the formation of iron thin films on alumina balls by mechanical coating technique. J. Mater. Proc. Technol. 2012, 212, 1169–1176. [Google Scholar] [CrossRef]
  25. Hao, L.; Lu, Y.; Sato, H.; Asanuma, H.; Guo, J. Fabrication of zinc coatings on alumina balls from zinc powder by mechanical coating technique and the process analysis. Powder Technol. 2012, 228, 377–384. [Google Scholar] [CrossRef]
  26. Lu, Y.; Matsuzaka, K.; Hao, L.; Hirakawa, Y.; Yoshida, H.; Pan, F.S. Photocatalytic activity of TiO2/Ti composite coatings fabricated by mechanical coating technique and subsequent heat oxidation. Mater. Sci. Semicon. Process. 2013, 16, 1949–1956. [Google Scholar] [CrossRef]
  27. Lu, Y.; Kobayashi, K.; Guan, S.; Hao, L.; Yoshida, H.; Asanuma, H.; Chen, J. Influence of oxidation process on photocatalytic activity of photocatalyst coatings by mechanical coating technique. Mater. Sci. Semicon. Process. 2015, 30, 128–134. [Google Scholar] [CrossRef]
  28. Hirakawa, Y.; Lu, Y.; Yoshida, H.; Matsuzaka, K.; Hao, L.; Sato, H. Fabrication and evaluation of visible light active TiO2 photocatalyst by molten salt method. J. Jpn. Inst. Met. Mater. 2013, 77, 287–293. [Google Scholar] [CrossRef]
  29. Takaya, S.; Lu, Y.; Guan, S.; Miyazawa, K.; Yoshida, H.; Asanuma, H. Fabrication of the photocatalyst thin films of nano-structured potassium titanate by molten salt treatment and its photocatalytic activity. Surf. Coat. Technol. 2015, 275, 260–263. [Google Scholar] [CrossRef]
  30. Suryanarayana, C. Mechanical alloying and milling. Prog. Mater. Sci. 2001, 46, 1–184. [Google Scholar] [CrossRef]
  31. Kotz, J.C.; Treichel, P.M.; Townsend, J. Chemistry & Chemical Reactivity, 8th ed.; Mary Finch: Belmont, OH, USA, 2011. [Google Scholar]
  32. John, A. Dean: Lange’s Handbook of Chemistry, 14th ed.; McGraw-Hill: New York, NY, USA, 1999; Volume 29. [Google Scholar]
  33. Allen, L.C. Electronegativity is the average one-electron energy of the valence-shell electrons in ground-state free atoms. J. Am. Chem. Soc. 1989, 111, 9003–9014. [Google Scholar] [CrossRef]
  34. Howatson, A.M.; Lund, P.G.; Todd, J.D. Engineering Tables and Data; Chapman & Hall: London, UK, 1991. [Google Scholar]
  35. Hao, L.; Lu, Y.; Sato, H.; Asanuma, H.; Guo, J. Analysis on energy transfer during mechanical coating and ball milling—Supported by electric power measurement in planetary ball mill. Int. J. Miner. Process. 2013, 121, 51. [Google Scholar] [CrossRef]
  36. The Japan Titanium Society. Processing Technology of Titanium; Nikkan Kogyo Shimbun: Tokyo, Japan, 1992. [Google Scholar]
  37. Zhang, X.; Lei, L. One step preparation of visible-light responsive Fe–TiO2 coating photocatalysts by MOCVD. Mater. Lett. 2008, 62, 895–897. [Google Scholar] [CrossRef]
  38. Spuur, R.A.; Myers, H. Quantitative analysis of anatase-rutile mixtures with an X-ray diffractometer. Anal. Chem. 1957, 29, 760–762. [Google Scholar] [CrossRef]
  39. Kakiuchi, K.; Hosono, E.; Imai, H.; Kimura, T.; Fujihara, S. {111}-faceting of low-temperature processed rutile TiO2 rods. J. Cryst. Growth 2006, 293, 541–545. [Google Scholar] [CrossRef]
  40. Ferry, J.D. Viscoelastic Properties of Polymers; Wiley: New York, NY, USA, 1980. [Google Scholar]
  41. Luttrell, T.; Halpegamage, S.; Tao, J.; Kramer, A.; Sutter, E.; Batzill, M. Why is anatase a better photocatalyst than rutile? Model studies on epitaxial TiO2 films. Sci. Rep. 2014, 4, 1–8. [Google Scholar] [CrossRef] [PubMed]
  42. Liu, X.; Zhang, H.; Liu, C.; Chen, J.; Li, G.; An, T.; Wong, P.; Zhao, H. UV and visible light photoelectrocatalytic bactericidal performance of 100% {111}-faceted rutile TiO2 photoanode. Catal. Today 2014, 224, 77–82. [Google Scholar] [CrossRef]
  43. Hurum, D.; Agrios, A.; Gray, K.; Rajh, T.; Thurnauer, M. Explaining the enhanced photocatalytic activity of degussa P25 mixed-phase TiO2 using EPR. J. Phys. Chem. B 2003, 107, 4545–4549. [Google Scholar] [CrossRef]
  44. Liu, B.; Aydil, E. Growth of oriented single-crystalline rutile TiO2 nanorodson transparent conducting substrates for dye-sensitized solar cells. J. Am. Chem. Soc. 2009, 131, 3985–3990. [Google Scholar] [CrossRef] [PubMed]
  45. Ozawa, K.; Emori, M.; Yamamoto, S.; Yukawa, R.; Yamamoto, S.; Hobara, R.; Fujikawa, K.; Sakama, H.; Matsuda, I. Electron-hole recombination time at TiO2 single-crystal surfaces: Influence of surface band bending. J. Phys. Chem. Lett. 2014, 5, 1953–1957. [Google Scholar] [CrossRef]
  46. Chen, X.; Shen, S.; Guo, L.; Mao, S. Semiconductor-based photocatalytic hydrogen generation. Chem. Rev. 2010, 110, 6503–6570. [Google Scholar] [CrossRef] [PubMed]
  47. Chen, X.; Wang, X.; Hou, Y.; Huang, J.; Wu, L.; Fu, X. The effect of postnitridation annealing on the surface property and photocatalytic performance of N-doped TiO2 under visible light irradiation. J. Catal. 2008, 255, 59–67. [Google Scholar] [CrossRef]
  48. Asahi, R.; Morikawa, T.; Ohwaki, T.; Aoki, K.; Taga, Y. Visible-light photocatalysis in nitrogen-doped titanium oxides. Science 2001, 293, 269–271. [Google Scholar] [CrossRef] [PubMed]
  49. Sheng, J.; Hu, L.H.; Li, W.X.; Mo, L.E.; Tian, H.J.; Dai, S.Y. Formation of single-crystalline rutile TiO2 splitting microspheres for dye-sensitized solar cells. Sol. Energy 2011, 85, 2697–2703. [Google Scholar] [CrossRef]
  50. Bae, E.; Murakami, N.; Nakamura, M.; Ohno, T. Effect of chemical etching by sulfuric acid or H2O2–NH3 mixed solution on the photocatalytic activity of rutile TiO2 nanorods. Appl. Catal. A 2010, 380, 48–54. [Google Scholar] [CrossRef]
  51. Li, C.J.; Xu, G.R.; Zhang, B.H.; Gong, J.R. High selectivity in visible-light-driven partial photocatalytic oxidation of benzyl alcohol into benzaldehyde over single-crystalline rutile TiO2 nanorods. Appl. Catal. B 2012, 115–116, 201–208. [Google Scholar] [CrossRef]
  52. Lu, Y.; Hao, L.; Matsuzaka, K.; Yoshida, H.; Asanuma, H.; Chen, J.; Pan, F. Titanium dioxide-nickel oxide composite coatings: Preparation by mechanical coating/thermal oxidation and photocatalytic activity. Mater. Sci. Semicon. Process. 2014, 24, 138–145. [Google Scholar] [CrossRef]
  53. Guan, S.; Lu, Y.; Hao, L.; Takaya, S.; Miyazawa, K.; Yoshida, H.; Asanuma, H. Influence of oxidation conditions on photocatalytic activity of Cr-TiO2 coatings by mechanical coating technique. In Proceedings of the 9th International Forum on Advanced Material Science and Technology (IFAMST 9), Xiamen, China, 1 December 2014.
  54. Chen, S.; Zhang, S.; Liu, W.; Zhao, W. Preparation and activity evaluation of p–n junction photocatalyst NiO/TiO2. J. Hazard. Mater. 2008, 155, 320–326. [Google Scholar]
  55. Pan, C.; Wu, J. Visible-light response Cr-doped TiO2−x NX photocatalysts. Mater. Chem. Phys. 2006, 100, 102–107. [Google Scholar] [CrossRef]
  56. Zhu, J.; Deng, Z.; Chen, F.; Zhang, J.; Chen, H.; Anpo, M.; Huang, J.; Zhang, L. Hydrothermal doping method for preparation of Cr3+-TiO2 photocatalysts with concentration gradient distribution of Cr3+. Appl. Catal. B 2006, 62, 329–335. [Google Scholar] [CrossRef]
  57. Peng, Y.; Huang, G.; Huang, W. Visible-light absorption and photocatalytic activity of Cr-doped TiO2 nanocrystal films. Adv. Powder Technol. 2012, 23, 8–12. [Google Scholar] [CrossRef]
  58. Hajjaji, A.; Gaidi, M.; Bessais, B.; Khakani, M. Effect of Cr incorporation on the structural and optoelectronic properties of TiO2:Cr deposited by means of a magnetron co-sputtering process. Appl. Surf. Sci. 2011, 257, 10351–10357. [Google Scholar] [CrossRef]
  59. Tretyachenko, E.; Gorokhovsky, A.; Yurkov, G.; Fedorov, F.; Vikulova, M.; Kovaleva, D.; Orozaliev, E. Adsorption and photo-catalytic properties of layered lepidocrocite-like quasi-amorphous compounds based on modified potassium polytitanates. Particuology 2014, 17, 22–28. [Google Scholar] [CrossRef]
  60. Gorokhovsky, A.V.; Escalante-Garcia, J.I.; Sanchez-Monjaras, T.; Gutierrez-Chavarria, C.A. Synthesis of potassium polytitanate precursors by treatment of TiO2 with molten mixtures of KNO3 and KOH. J. Eur. Ceram. Soc. 2004, 24, 3541–3546. [Google Scholar] [CrossRef]
  61. Masaki, N.; Uchida, S.; Yamane, H.; Sato, T. Hydrothermal synthesis of potassium titanates in Ti-KOH-H2O system. J. Mater. Sci. 2000, 35, 3307–3311. [Google Scholar] [CrossRef]

