Article

Identification of Intermetallic Compounds and Its Formation Mechanism in Boron Steel Hot-Dipped in Al-7 wt.% Mn Alloy

1
Department of Material Science and Engineering, Pusan National University, Busan 46241, Korea
2
Department of Hybrid Materials & Machining Technology, Graduate School of Convergence Science, Pusan National University, Busan 46241, Korea
*
Author to whom correspondence should be addressed.
Coatings 2017, 7(12), 222; https://doi.org/10.3390/coatings7120222
Submission received: 10 November 2017 / Revised: 27 November 2017 / Accepted: 1 December 2017 / Published: 6 December 2017
(This article belongs to the Special Issue Hybrid Surface Coatings & Process (Selected Papers from HyMaP 2017))

Abstract

:
In laser welding and hot stamping Al-Si-coated boron steel, there is a problem that the strength of the joint is lowered due to ferrite formation in the fusion zone. The purpose of this study is to develop an Al-7 wt.% Mn hot-dip coating in which Mn, an austenite stabilizing element, replaces the ferrite stabilizing element Si. The nucleation and formation mechanism of the reaction layer was studied in detail by varying the dipping time between 0 and 120 s at 773 °C. The microstructure and phase constitution of the reaction layer were investigated by various observational methods. Phase formation is discussed using a phase diagram calculated by Thermo-CalcTM. Under a 30 s hot-dipping process, no reaction occurred due to the formation of a Fe3O4 layer on the steel surface. The Fe3O4 layer decomposed by a reduction reaction with Al-Mn molten alloy, constituent elements of steel dissolved into a liquid, and the reaction-layer nucleus was formed toward the liquid phase. A coated layer consists of a solidified layer of Al and Al6Mn and a reactive layer formed beneath it. The reaction layer is formed mainly by inter-diffusion of Al and Fe in the solid state, which is arranged on the steel in the order of Al11Mn4 → FeAl3 (θ) → Fe2Al5 (η) phases, and the Fe3AlC (κ) in several nm bands formed at the interface between the η-phase and steel.

1. Introduction

In recent years, in the automobile industry, as the strength of the vehicle body has been increased to attain light weight and strength, there has been a problem in that spring-back phenomenon occurs due to insufficient ductility during the forming process [1,2]. In order to overcome this challenge using Advanced High Strength Steel (AHSS), a hot stamping process has been developed that stabilizes both the formation and strength of boron steel [3,4,5]. However, in this process, scale formation and surface decarburization occur, caused by surface oxidation of the steel when heated in excess of 900 °C. In turn, to solve this issue, Al-Si hot-dipped coating is typically performed [4,5,6,7].
However, when an Al-Si–coated boron steel sheet for hot stamping is laser-welded, a coated layer composed of the ferrite-forming elements is mixed into the fusion zone, and the δ-ferrite is formed in a band shape at the fusion zone boundary. As a large amount of ferrite is formed, the strength of the joint decreases, and fracture occurs in the segregation region [8,9,10].
To address these challenges, in this study, a coating layer was developed that suppresses the formation of ferrite in the fusion zone during laser welding by adding Mn, which is an austenite-forming element, to the Al-Si coating layer typically used.
Previous studies on intermetallic compounds between solid Fe and liquid Al have reported the formation of intermetallic compounds including Fe2Al5 and FeAl3 [11,12,13,14]. In addition, many studies have investigated the growth rate of Fe2Al5 among such intermetallic compounds. [15,16,17,18]. Studies using Al-Mn coatings have shown that Mn can be used to improve the corrosion resistance of the coating layer, as studied by Xinmei Li et al. [19] and Debabrata Pradhan et al. [20]. Xinmei Li et al. [19] performed a hot-dipping process for 10 min using pure Al, Al-2 wt.% Mn, Al-9 wt.% Mn, and Al-13 wt.% Mn composites on low-carbon steel. After hot dipping, a scratch test was conducted to characterize adhesion, showing that the coating layer containing Mn adhered well. Debabrata Pradhan et al. [20] reported that steel sheets in hot dipping of Al-Mg-Mn alloys have about six times better corrosion resistance than zinc coating. Studies have also been performed on the growth rate of intermetallic compounds formed after the reaction of liquid Al and solid Fe and on the corrosion resistance of Al-Mn-coated layers. However, few studies have attempted to identify the phases of intermetallic compounds and the formation and growth mechanisms of each phase.
Therefore, in this study, in order to improve the mechanical properties of the fusion zone after hot stamping, instead of using ferrite-forming element Si, the austenite-forming element Mn was added to inhibit the formation of ferrite in the fusion zone, and an Al-7 wt.% Mn coating layer was applied. The use of 7 wt.% Mn was selected as 7 wt.% in consideration of the inhibitory effect of ferrite formation of Mn and the coating temperature (under 800 °C). The purpose of this study was to investigate the coating conditions to obtain a uniform coating layer on a 1.5 Ga grade boron steel sheet for automobiles, and to study the formation process of the reaction phases formed in the coating layer and its mechanism.

2. Materials and Methods

In this study, 1.2-mm-thick boron steel (SABC1470 grade) was used as the base material, with a chemical composition of Fe-0.23 C-0.24 Si-1.19 Mn-0.002 B (wt.%) as shown in Table 1. The specimens were cut to a size of 40 mm × 120 mm to clean the surface of the boron steel before hot-dipping, washed with 20 mL HCl + 200 mL CH3OH and a solution of 20 mL H2SO4 + 20 mL distilled water for 5 min, and finally washed with CH3OH.
Al-7 wt.% Mn alloy was prepared by mixing 373.3 g of pure Al and 326.7 g of Al-15wt.% Mn alloy. The specimens were pre-heated at 150 °C for 20 s to remove moisture from the surface of the Al-7Mn (wt.%) molten alloy. The temperature of the molten metal was maintained at 773 °C, which is the lowest possible coating temperature, for 0–120 s to perform hot dip process then air cooling.
The coated specimens were polished by using 1 mm Diamond + 0.04 mm Silica after arranging the surfaces through several stages of SiC sand paper. After polishing, 50 mL CH4OH + 2 mL HNO3 etching solution was used for the base material. 100 mL distilled water + 1 g NaOH solution, which is the etching solution of the 3000 series Al alloy, was used for the coating layer [21].
To observe the microstructure of the coated layer after hot-dipping, the Olympus (Tokyo, Japan) BX-51M optical microscopy and the Carl Zeiss (Oberkochen, Germany) SUPRA 45 field-emission Scanning Electron Microscope (FE-SEM) were used. Phase identification of large areas of the oxide layer was performed using the Rigaku (Tokyo, Japan) Ultima IV X-ray diffraction (XRD) at 1°/min. EDAX (Mahwah, NJ, USA). Energy-dispersive spectroscopy (EDS) was performed to observe the element distribution in the coating layer.
In order to analyze the chemical composition distribution, the JEOL (Tokyo, Japan) JXA-8530F field-emission electron probe micro-analysis (FE-EPMA) was performed to analyze the area, with a 1 kV voltage, 100 nA current, and step sizes of 0.1–0.5 mm in a non-etching state. To analyze the phase of the reaction layer, specimens were deflected using the FEI (Hillsboro, OR, USA) Scios focused ion beam (FIB), and their chemical composition and diffraction pattern were then obtained using the FEI (Hillsboro, OR, USA) TALOS F200X field-emission transmission electron microscopy (FE-TEM). The EDAX Hikari Electron backscatter diffraction (EBSD) was used to observe the phase distribution and crystal orientation of the reaction layer during formation and growth, and the Media Cybernetics (Rockville, MD, USA) Image-plus pro image analysis program was used for analyzing images to obtain parameters such as the thickness and length of each phase.

3. Results

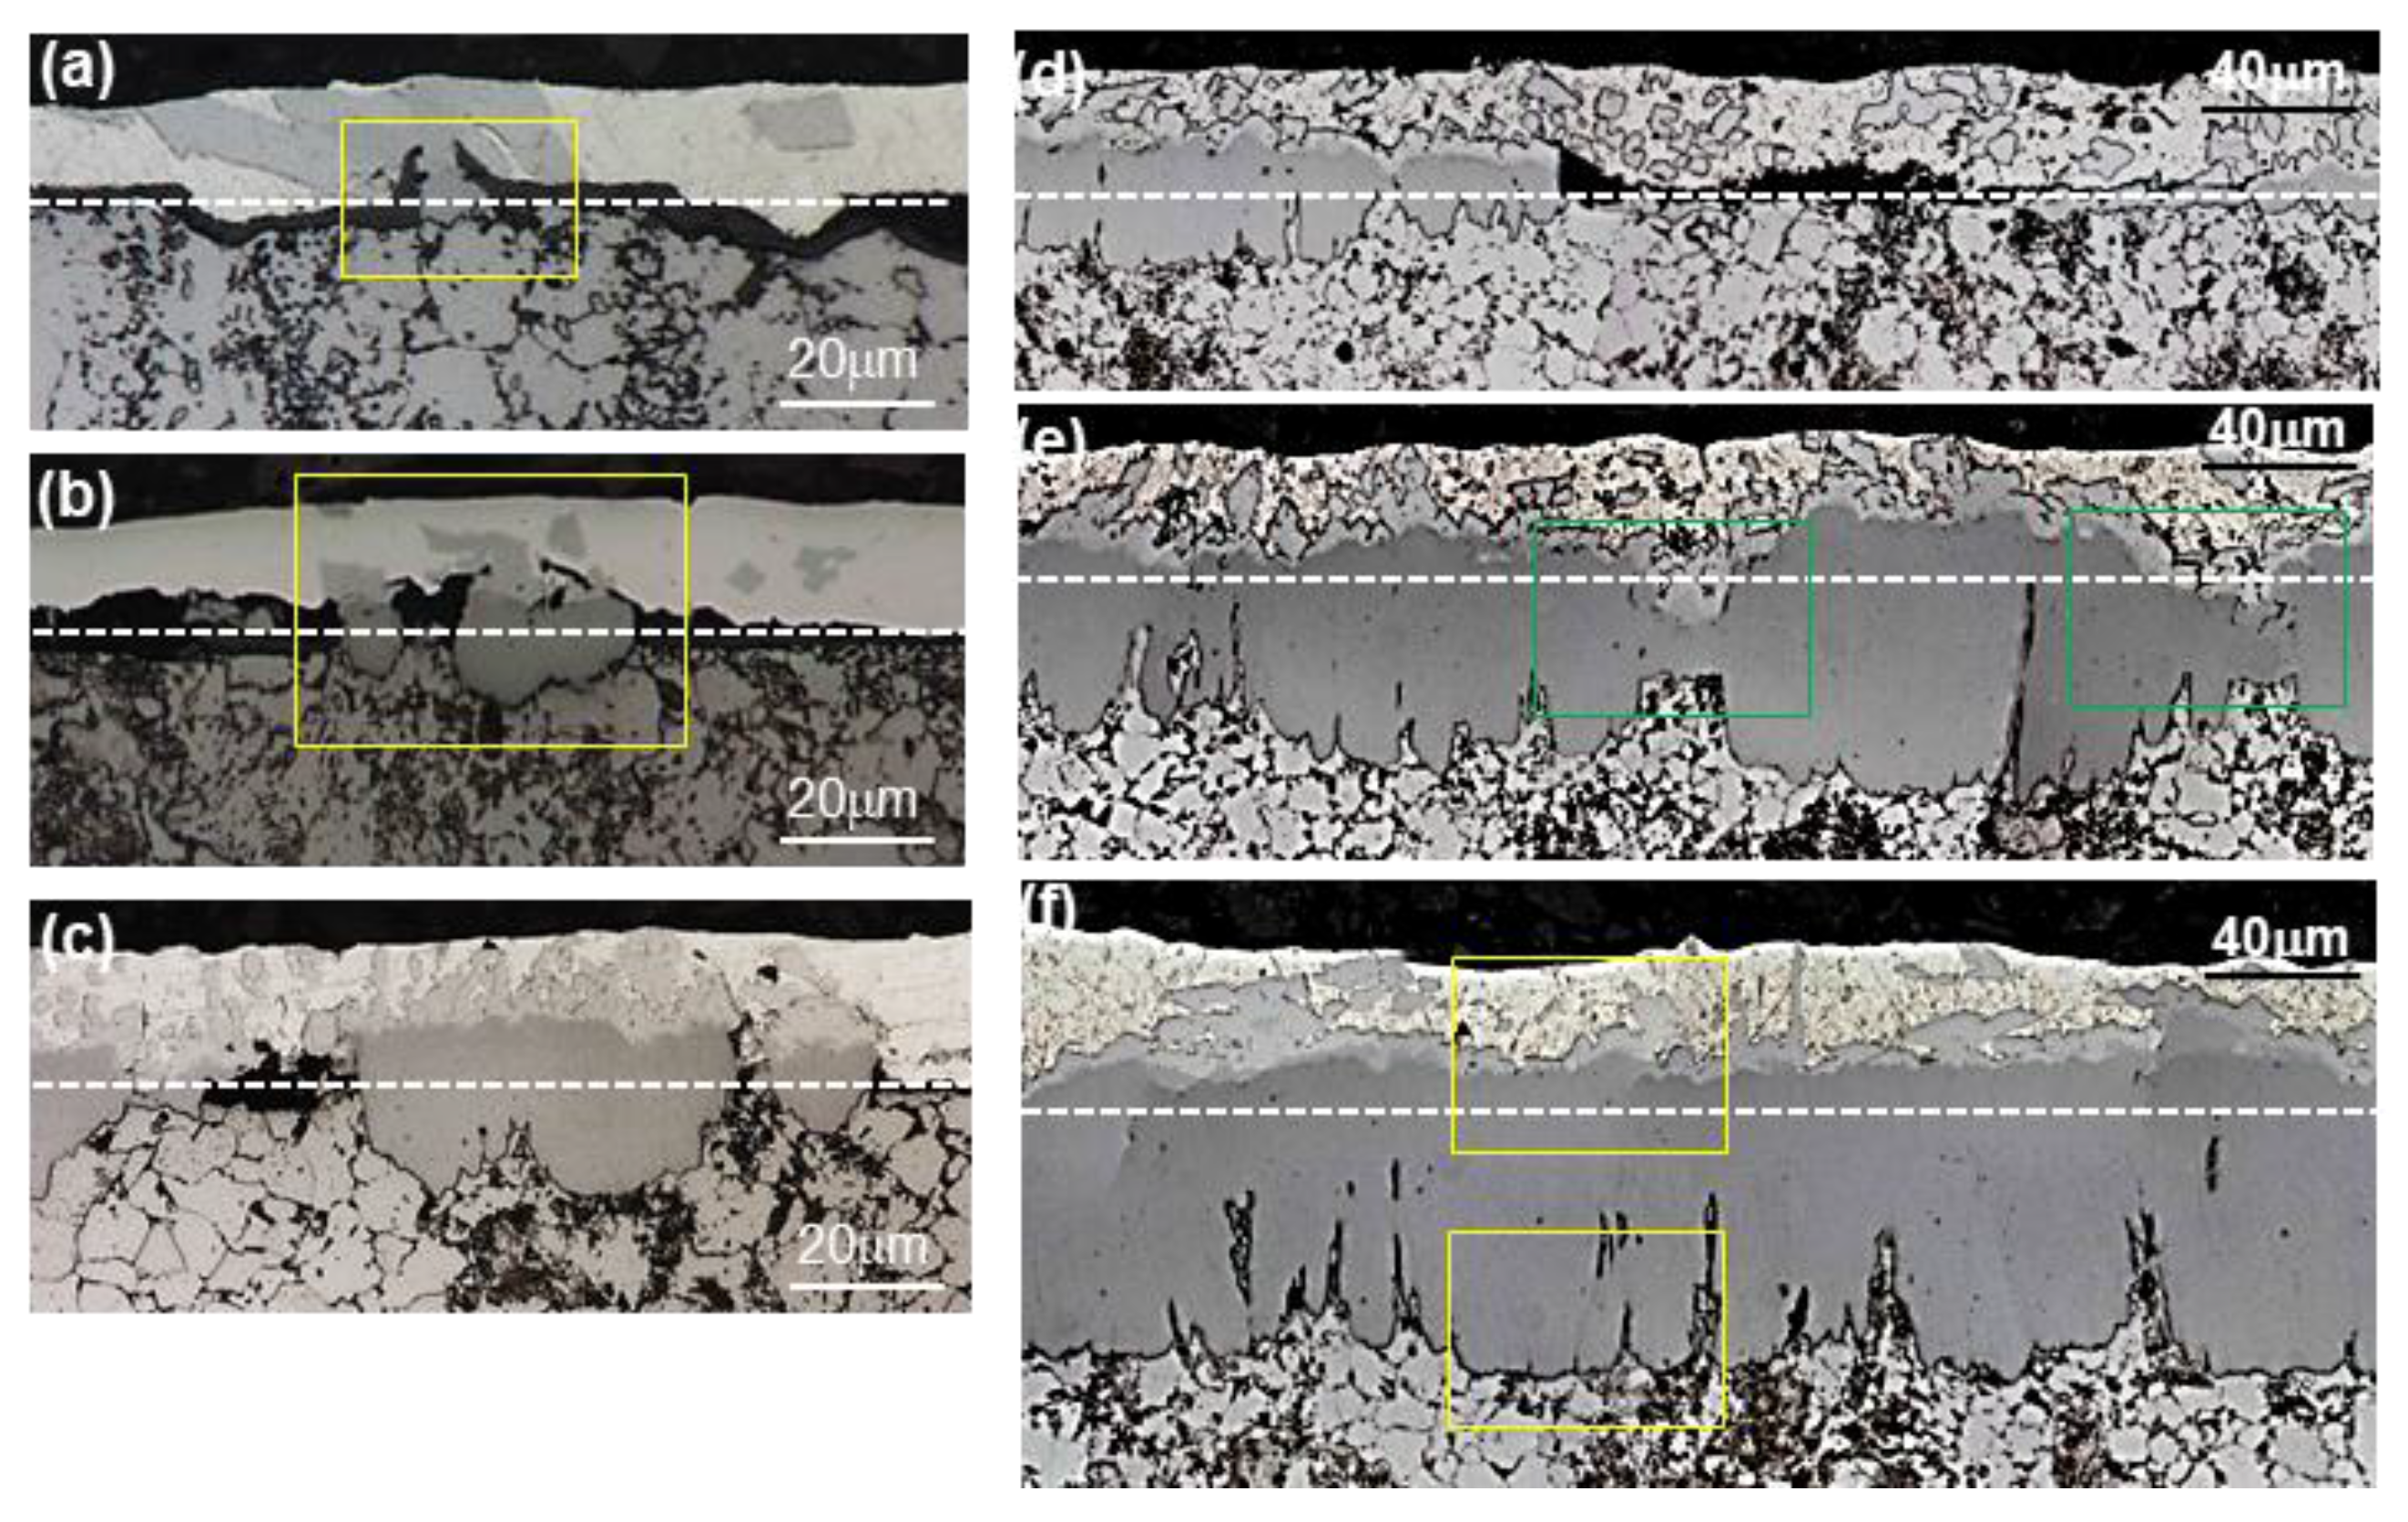
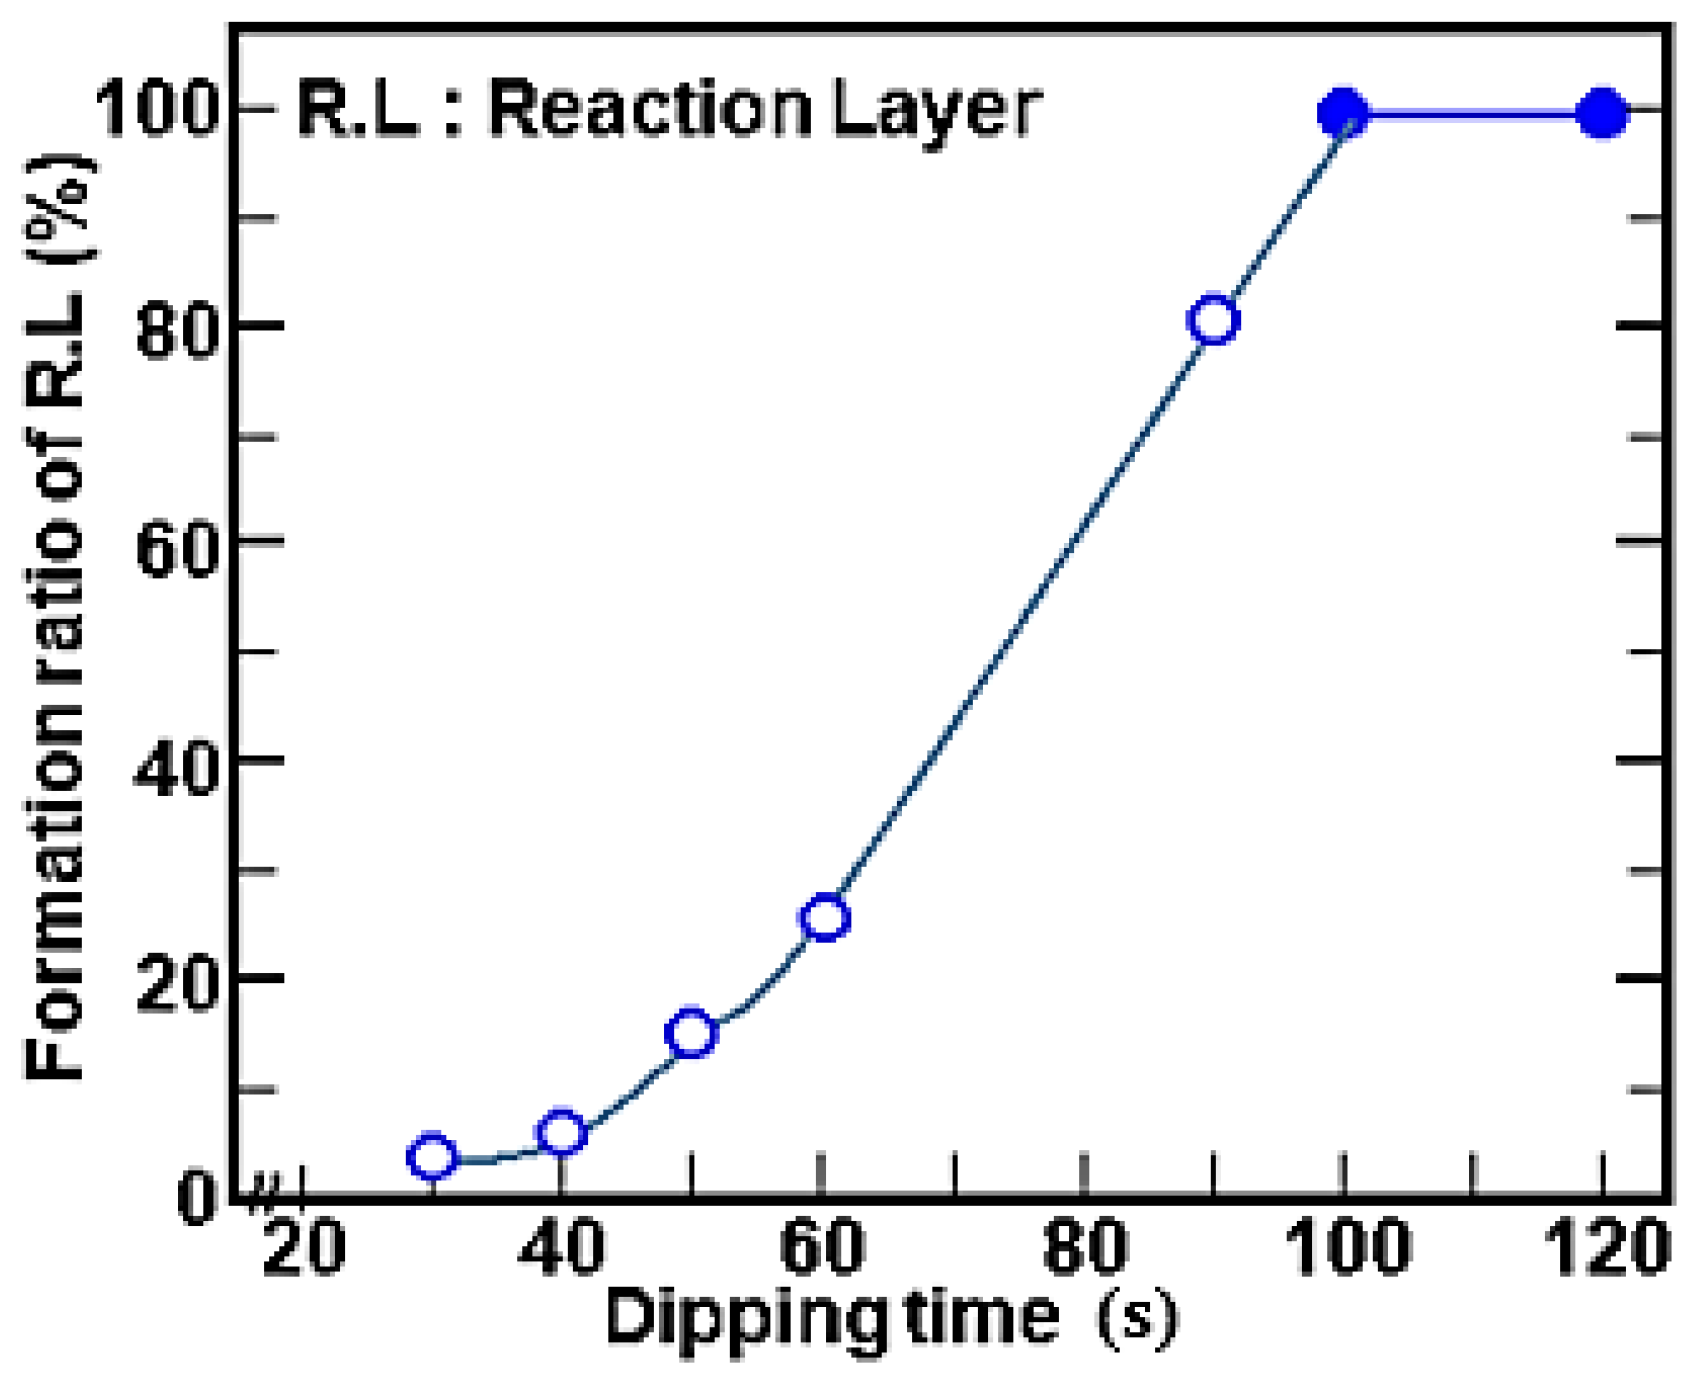
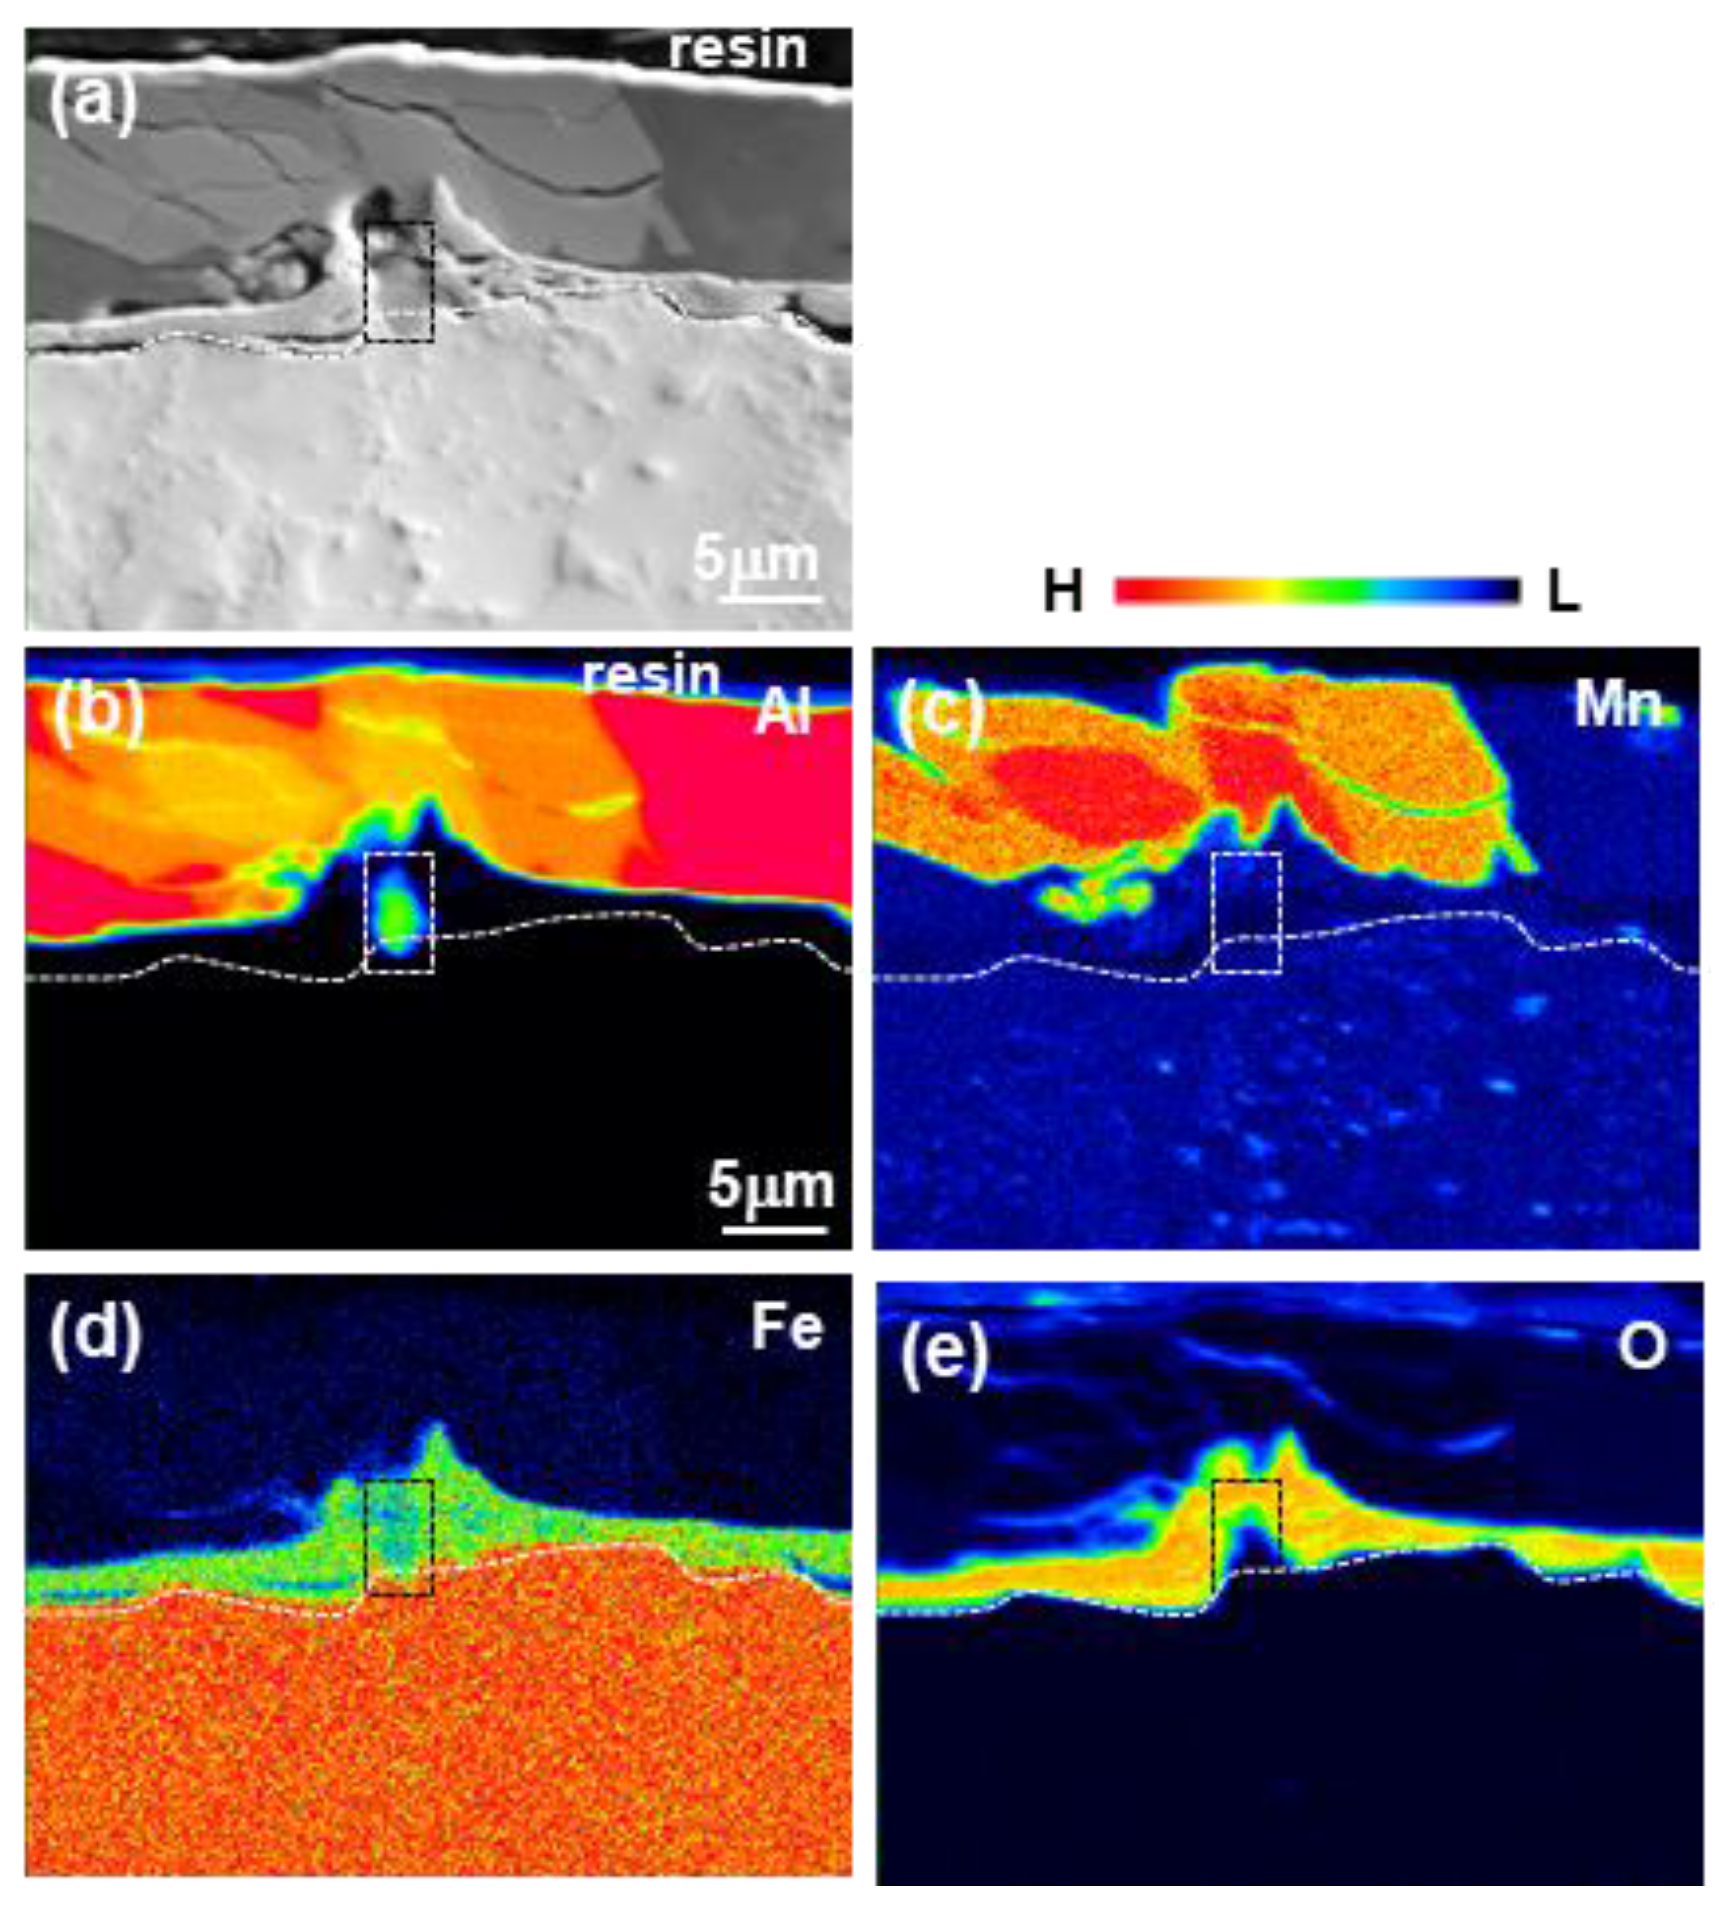
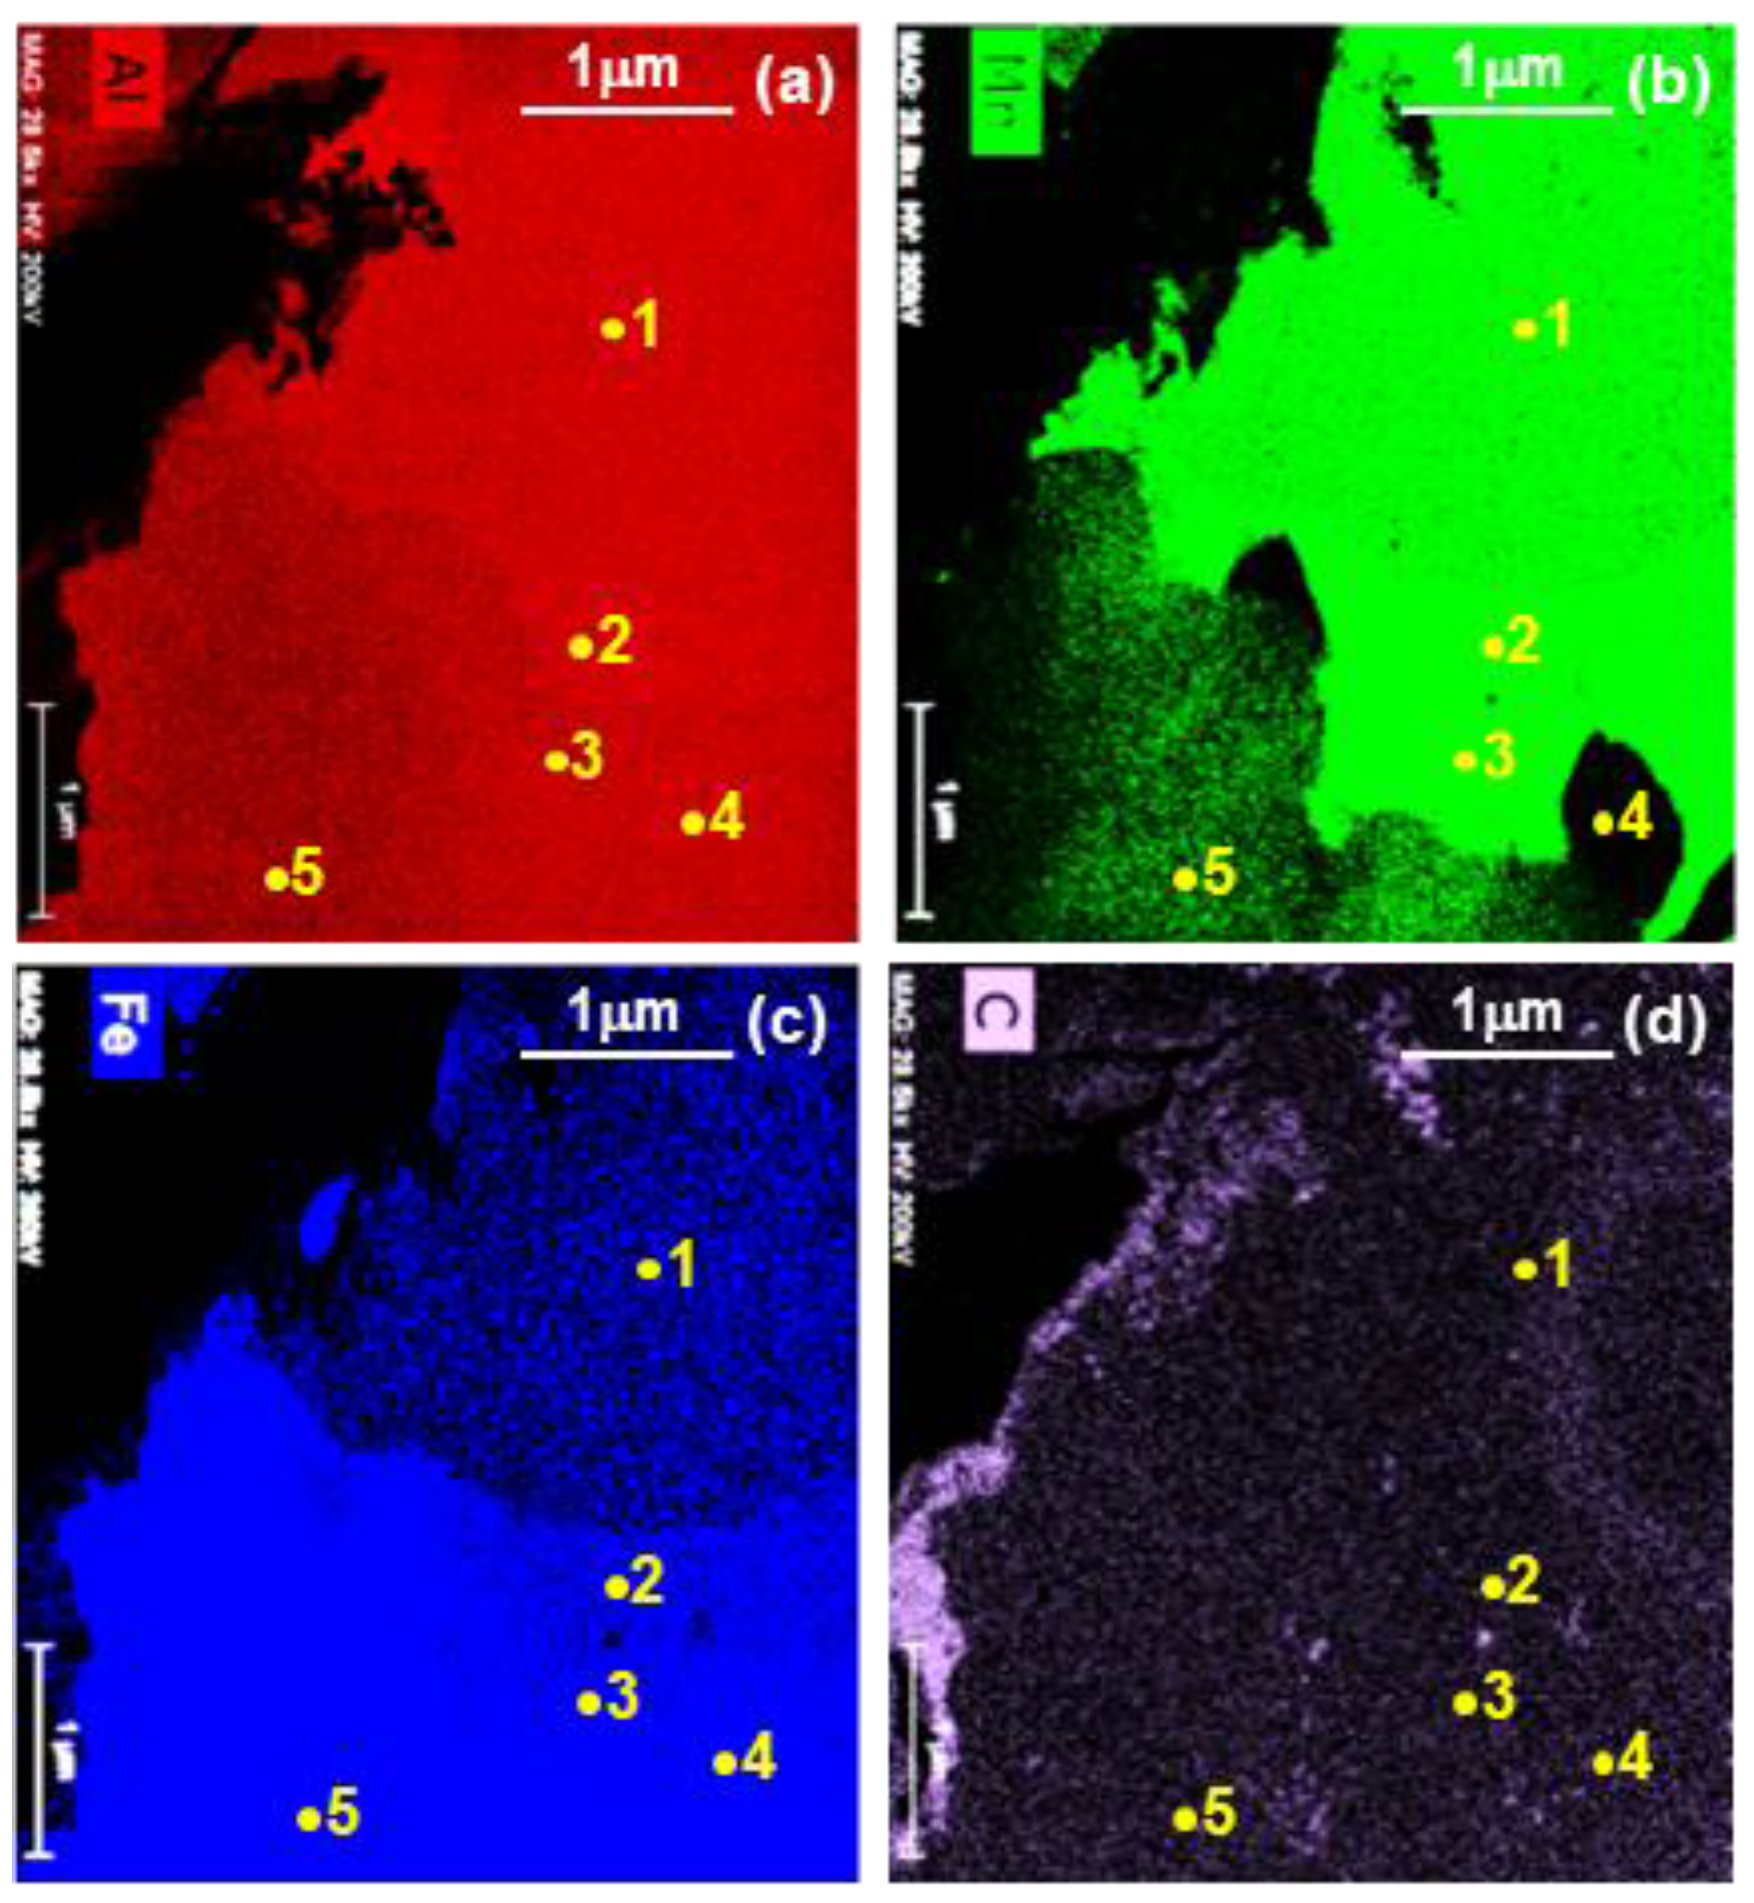
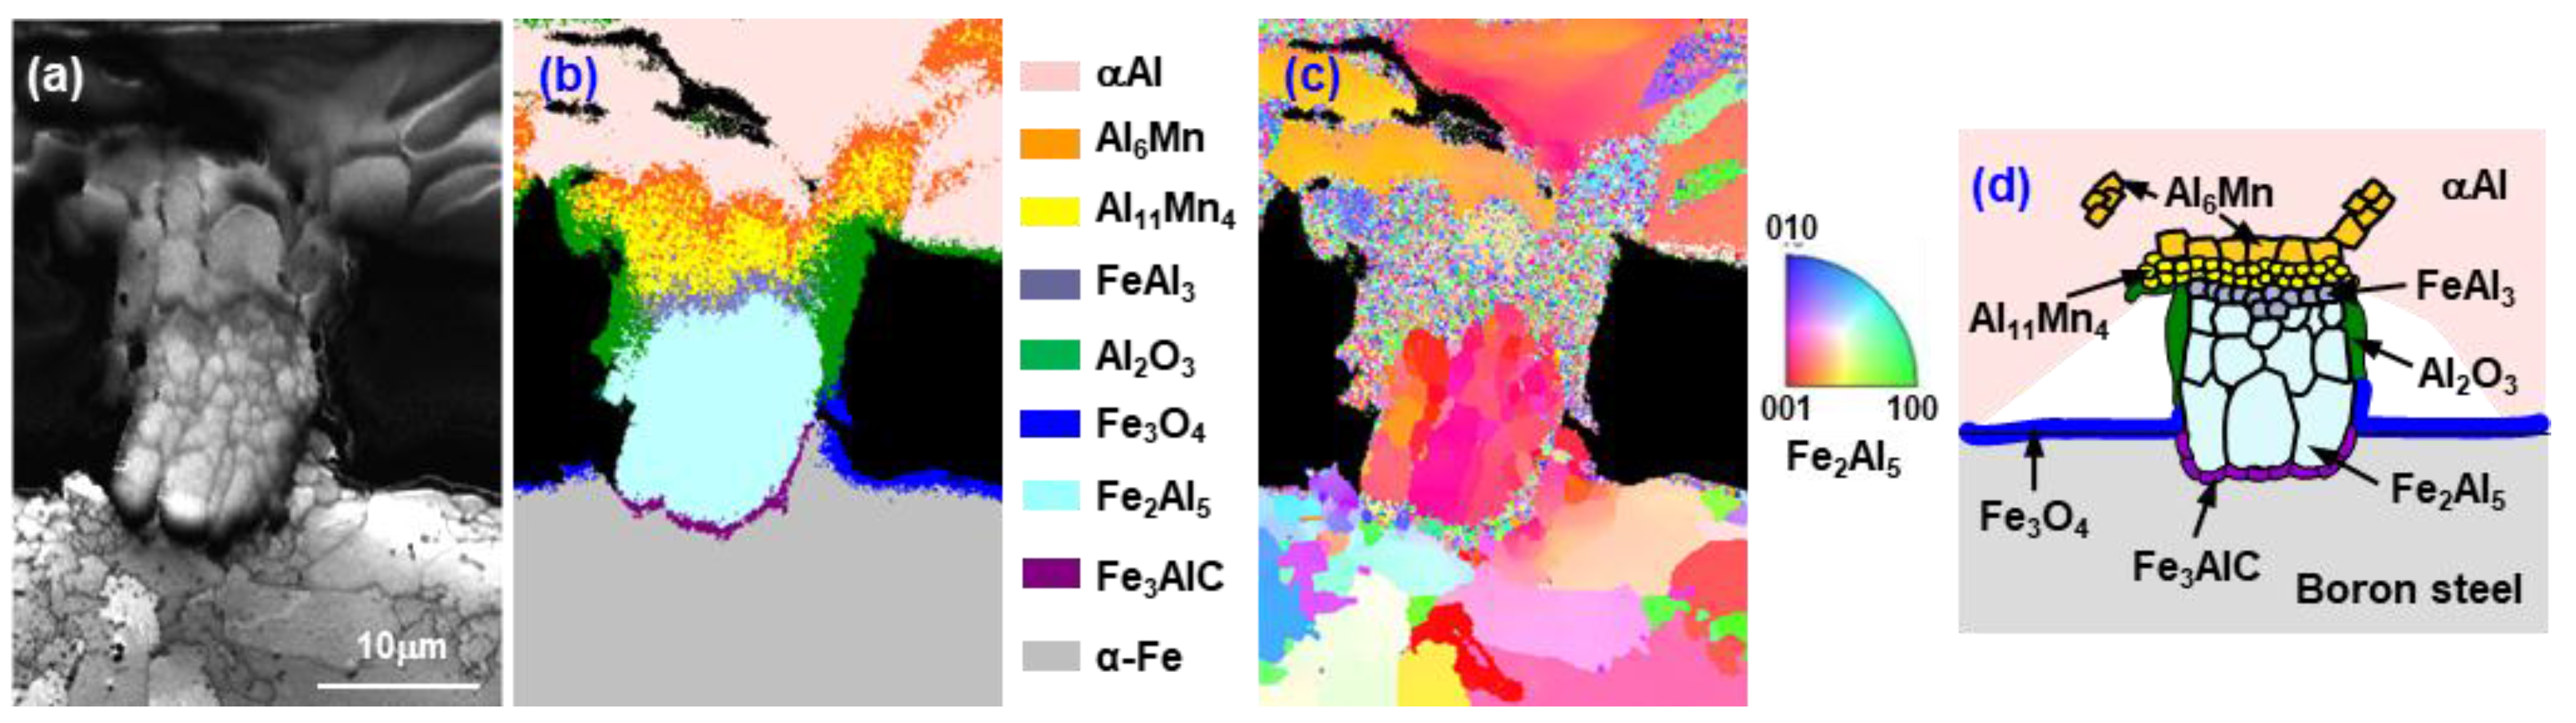
3.1. Formation of the Reaction Layer at Initial Hot Dipping

Boron steel was hot-dipped in Al-7 wt.% Mn molten metal at 773 °C for various dipping times. Figure 1 shows the cross-sectional optical microstructure of hot dipped specimens for various times at 773 °C. In the specimens hot dipped for 10 s and 20 s, the reaction layer was not formed. As shown in Figure 1a, the localized reaction layer was formed on the surface of steel for 30 s.
Figure 2 shows the results of the back-scattered electron (BSE) image in which the reaction phase is present (Figure 1a) and the Fe and O components of Al, Mn, and steel. The white line shows the original steel surface. A band structure with high concentrations of Fe (Figure 1d) and O (Figure 1e) was formed on the surface of the steel. From this result, this layer is considered to be a Fe-based oxide layer. On the other hand, the elliptical shape phase in the area indicated by γ on the surface coexisted with the coating components Al and Fe, but Mn and O are not detected. Thus, the reaction phase formed where the oxide layer broke, and the Al-Mn coating solution permeated, reacting with the steel to form the reaction layer.
Figure 3 includes an enlarged SEM microstructure and an EPMA surface analysis results of the area denoted by γ in Figure 1b, where specimens were dipped for 40 s. A reaction layer formed and increased in the absence of an oxide layer. The reaction layer can be classified into four phases—A, B, C, and D—from the comparison of the Al, Mn, and Fe concentrations with the formed positions, either at the steel surface or coating layer. The A phase contains a high concentration of Al and Fe but contains no Mn and was formed in the coating layer and the steel interior. The B phase formed in the coating layer and was a high concentration of Al and Mn, but was characterized by a small amount of Fe, which was connected to the A phase and the end. The C phase had a slightly higher in Mn concentration than the B phase. Phase D consisted almost entirely of Al.
Figure 4 shows the results of the XRD of the steel surface after dipping for 5 s at 773 °C, confirming that the oxide layer was comprised of Fe3O4. This oxide layer is the most thermodynamically stable Fe-based oxide at temperatures below the dipping temperature. When the boron steel was heated in an electric furnace maintained at 773 °C for 10 s in air, no oxide layer was formed. However, when the boron steel was dipped into the Al-7 wt.% Mn molten metal, an oxide layer formed. Thus, the Fe3O4 formed by the reaction of the steel surface with oxygen in the molten metal.
Figure 5 shows the formation rate which is defined as the ratio (%) of the formed reaction layer to the measurement length (10 mm) from the cross-sectional structure. The reaction area increased with an increase in the dipping time, and the reaction layer formed over the entire surface at 100 s. Moreover, the thickness (in the depth direction) distribution of the reaction layer was non-uniform, as shown in Figure 1e, but the specimen after hot-dipping for 120 s had a uniform reaction layer.

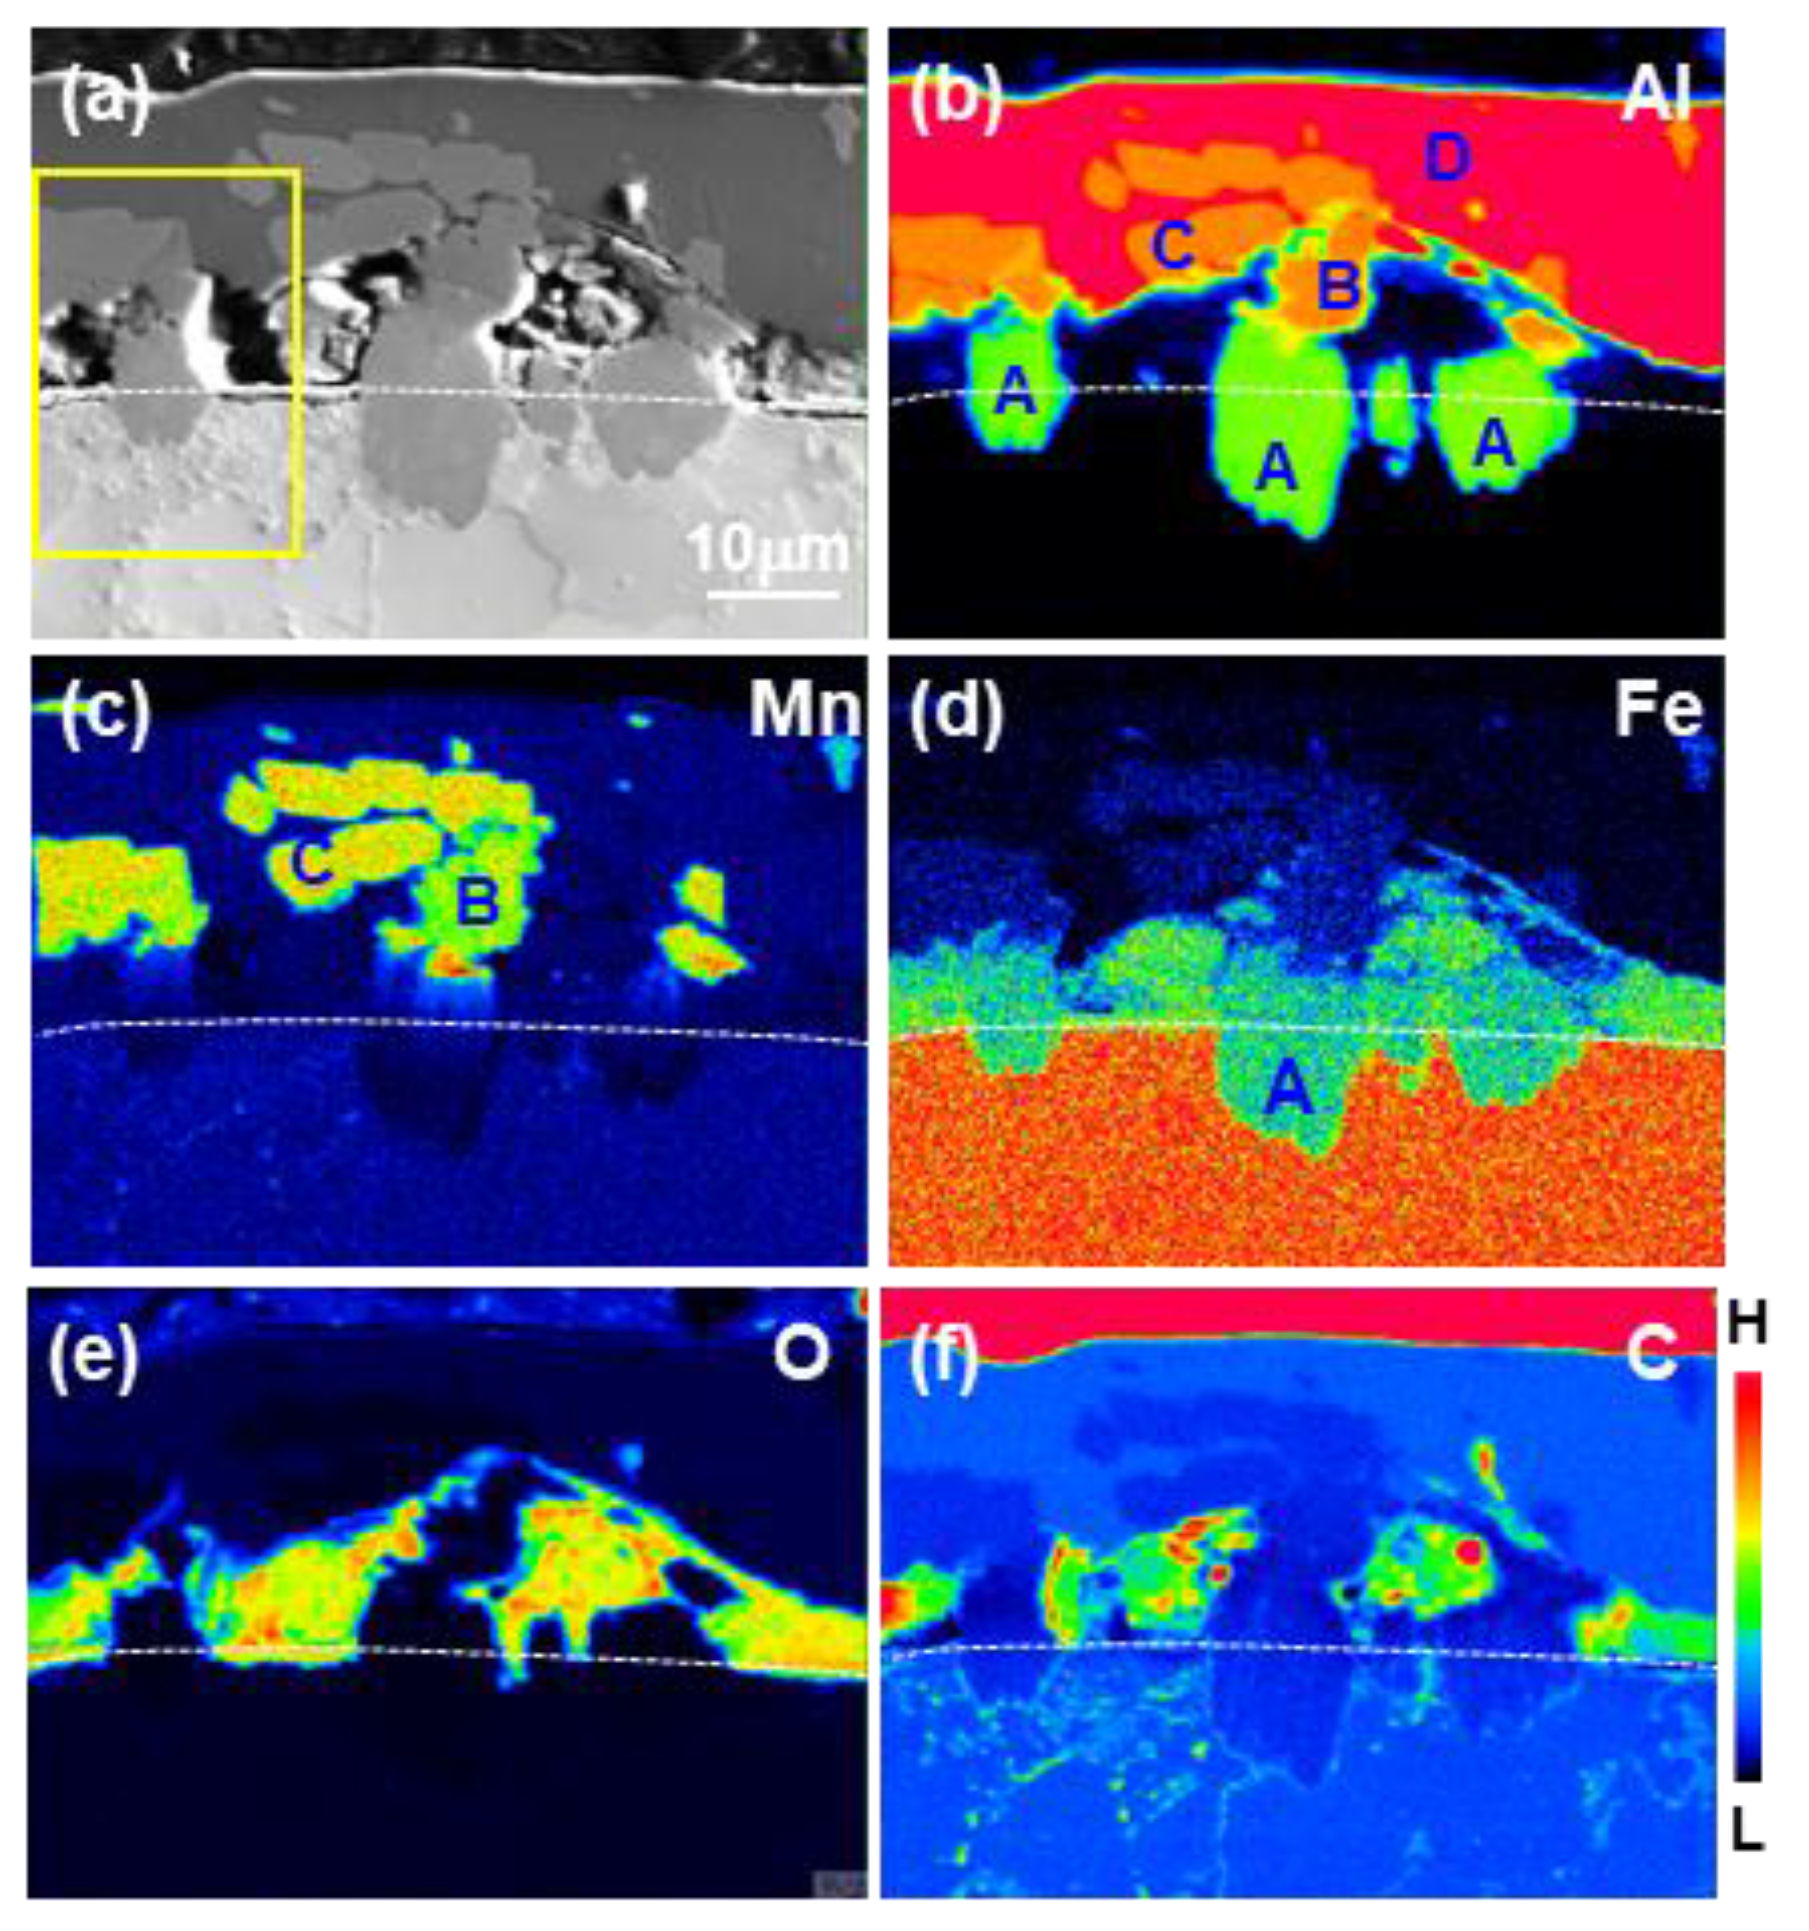
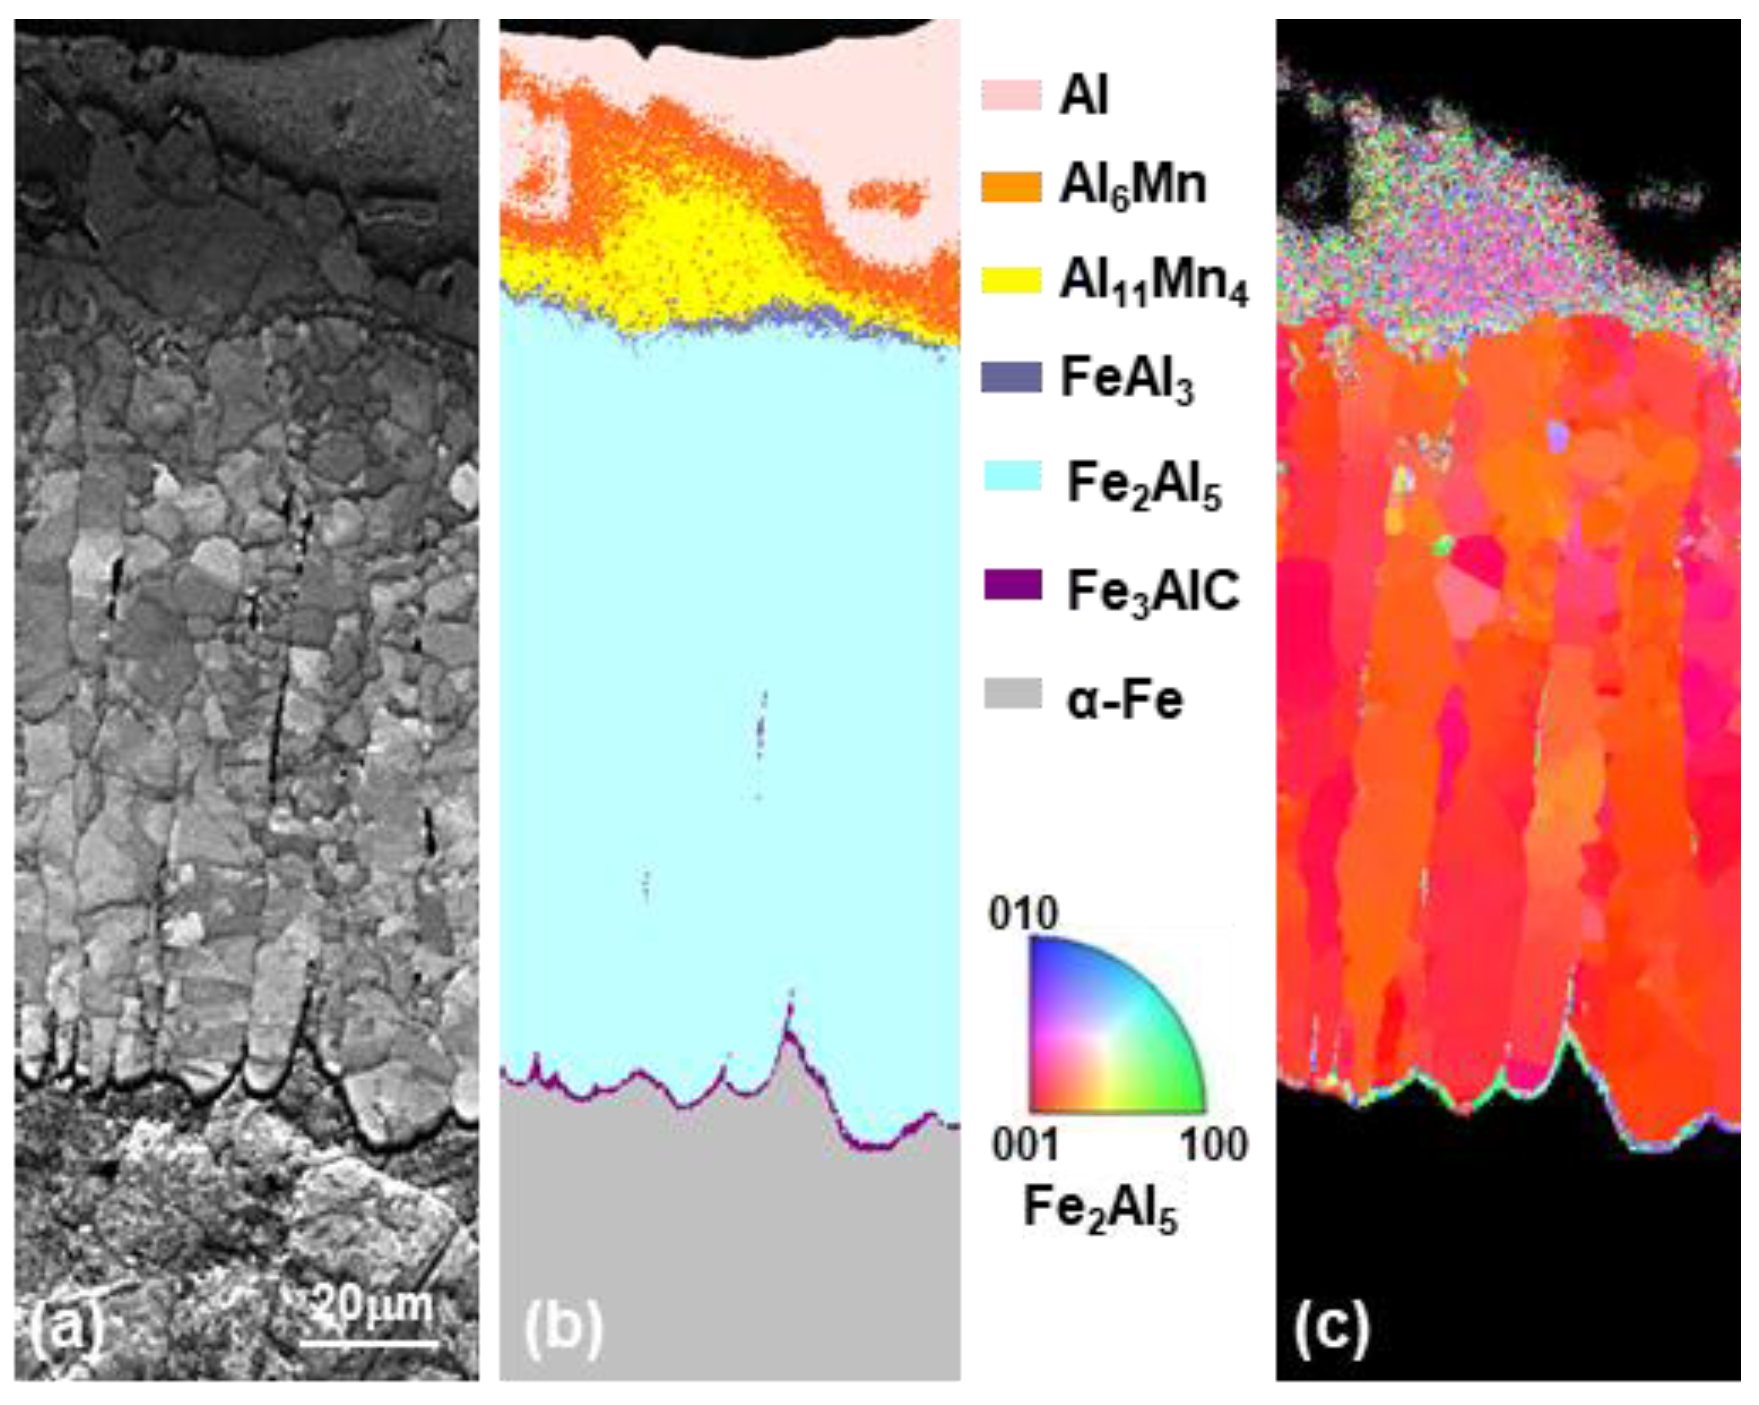
3.2. Evolution of Microstructure in the Coating Layer

The reaction layer (Figure 1a) of the specimen dipped for 30 s was too small, the oxide layer was nearby, and TEM specimens could not be obtained by FIB. Among the reaction layers of the 40 s dipped specimens, the smallest, corresponding to the area in Figure 3a, was selected. TEM specimens were collected by FIB (focused ion beam) and observed by STEM to identify which phases were formed in the reaction layer. Figure 6a shows a specimen cut in the depth direction in γ area of Figure 3a, allowing observation of the phases of the liquid (area 1) and the steel (area 2). Additionally, (c,d) shows the STEM—HAADF (high-angle annular dark-field) microstructure observed in areas 1 and 2, respectively.
Figure 7 is the surface analysis by EDS for Al, Mn, Fe, and C in Figure 6c and Table 2 shows the results of EDS point analysis of the phases 1–5 in Figure 6c. From the distributions of Mn and Fe, the areas of 1, 2, and 3 had high Mn concentrations but low Fe concentration. Region 5 contains high Fe and low Mn concentrations, and 4 region contains a high Fe concentration and negligible Mn.
Figure 8 shows the results of the diffraction pattern in the area indicated by 1–5 in Figure 6c and the diffraction pattern analysis obtained the composition analysis result in Table 2. From the diffraction pattern analysis, Point 1 phase is Al6Mn (orthorhombic), Point 2 and 3 phases are Al11Mn4 (triclinic) phase, point 4 phase is Fe2Al5 (η, orthorhombic) phase, and point 5 phase is FeAl3 (θ, monoclinic) phase.
Figure 9 shows the result of EDS analysis of the reaction zone Figure 6d in steel, and Table 3 shows the result of EDS analysis of the composition of each phase. The lower left part where Al was not detected was steel. On the top of the steel, the reactive layer was much thinner than the other, and as a result the intensity detected during the EDS was too low and not measured. In regions 6 and 7, the concentration of Al was high, but the concentrations of Mn, Fe, and C were low. Thus, it is a reaction layer. In the band with a high concentration of C in Figure 9d as shown in Table 3, Al was detected in addition to Fe, and this band was expected to be composed of Fe, Al, and C. However, the phases of regions 9 and 10 were expected to be steel structures because almost no Al was detected, yet the concentration of C was different.
Figure 10 shows the results of the diffraction pattern analysis based on the diffraction pattern obtained in the area indicated by 6–10 in Figure 9 and the composition analysis result (Table 3). The phases of 6 and 7 are Fe2Al5 (η, orthorhombic) phase in the same pattern. The phases 9 and 10 are α-Fe (ferrite) and Fe3C (cementite), which are steel structures. On the other hand, Fe3AlC (κ, Cubic) formed as a band-like phase at the interface between the steel and the reaction layer.
The microstructure of the coating layer was classified into a reaction layer (reactive phase) formed while maintaining the dipping temperature and a solidified structure formed during cooling of the coating liquid. Figure 11 shows the microscopic optical structure of the Al-7 wt.% Mn cast alloy, which consists of matrix Al and Al6Mn.
Figure 12 shows the EBSD analysis of the reaction layer (also shown in Figure 1b and Figure 6a) formed at the initial coating process, 40 s. Figure 12a is an IQ (image quality) map; Figure 12b is a phase map; and Figure 12c is an IPF (inverse pole figure). The phases present in the EBSD are the same as identified in the TEM observation; Figure 12d is a schematic diagram of a reaction layer formed on a steel surface based on the above described TEM and EBSD analysis results.
The microstructure arrangement from the coating layer toward the steel is, in order, Al + Al6Mn (coated alloy structure) → Al11Mn4 → FeAl3 (θ) → Fe2Al5 (η) → Fe3AlC (κ) → αFe (steel). In addition, a Fe3O4 oxide layer formed on the surface of the steel, but Al2O3 formed around the reaction layer.
Compared with the sample maintained for 120 s the reaction layer formed over the entire surface with an initially formed reaction layer appearing after 40 s. Figure 13 shows the SEM microstructure and EPMA analysis of the area denoted as γ in Figure 1f, which was hot-dipped for 120 s. (a–e) show the solidification layer near the liquid phase and reaction layer, and (f–k) show the analysis of the reaction layer near the base material. Table 4 shows the results of the EDS point analysis for areas 1–8 in Figure 13a,f. Figure 14 shows the EBSD analysis of this area. Compared with the solidification layer that formed on the surface of the steel, the reaction layer after 120 s (Figure 13 and Figure 14) and at the initial 40 s (Figure 3 and Figure 10), the shape and distribution are similar. From the EDS, EPMA, and EBSD analysis results, the solidification layer consisted of Al (1) and Al6Mn (2) on the surface of the steel, the reaction layer was composed of Al11Mn4 (3) below Al6Mn (2). FeAl3 (θ) phase (4) is formed on the Al11Mn4 (3) and Fe2Al5 (5) interfaces. The Fe2Al5 (η) phase (5, 6) grew on the inside of the steel, and Fe3AlC (7) formed at the interface between the steel (8) and the η (6).
Consequently, the same microstructure arrangement formed initially (40 s). The arrangement from the coating layer toward the steel was, in order, Al + Al6Mn (coated alloy structure) → Al11Mn4 → FeAl3 (θ) → Fe2Al5 (η) → Fe3AlC (κ) → αFe (steel). The η phase dipped for 40 s (see Figure 11) mainly grew toward the liquid phase, whereas the specimen dipped for 120 s (Figure 14) grew very deep into the steel interior. The growth direction of the η phase was the same in the [001] direction.

4. Discussion

Analyzing the reaction layer microstructure formed during initial hot dipping (within 40 s), the formation mechanism of the reaction layer its phase are as follows. The Fe3O4 oxide layer is formed on the surface of the steel when the steel sheet is dipped in the Al-7 wt.% Mn molten alloy. However, the Fe3O4 oxide layer is formed on the surface of the steel, but since Al2O3 is formed around the reaction layer, Fe3O4 is destroyed as it reacts with Al-7 wt.% Mn molten alloy and is substituted with Al2O3. It is well known that Al2O3 is a more stable oxide than Fe3O4, and therefore a substitution reaction occurred. When the Fe3O4 was destroyed by the substitution reaction, the melt flowed into the solid, reacting with the steel to form a reaction layer. The reaction layer formed mainly in the liquid phase, with a thickness of about 1 μm or less inside the steel. The microstructure of the coating layer formed at the initial stage (40 s) of the coating process as shown in Figure 12 was in the order of Al + Al6Mn (coated alloy structure) → Al11Mn4 → FeAl3 (θ) → Fe2Al5 (η) → Fe3AlC → αFe(steel). The microstructure of the coated layer can be classified into a solidification structure in which Al-7 wt.% Mn melts are formed during cooling and a reaction layer is formed while holding. As shown in Figure 11, the solidification structure of Al-7 wt.% Mn is composed of Al with Al6Mn as the matrix. Therefore, Al and Al6Mn were solidified structures and the remaining Al11Mn4, FeAl3 (θ), Fe2Al5 (η) are the reaction phases formed during the coating process.
Reaction layers or reaction phases have been studied for a long time in the diffusion reaction or coating process of Fe and pure Al [22,23,24], Fe and Al alloys [25,26], steel and pure Al [27,28,29,30,31], and steel and Al alloys [32,33]. The reaction layers formed in these studies were classified into the following three types: (1) Al/FeAl3 (θ)/Fe2Al5 (η)/Fe [22,23,24,33] where the intermetallic layer is composed of an outer minor FeAl3 (θ) layer and an inner major Fe2Al5 (η) layer; (2) Al/Fe4Al13 (θ)/Fe2Al5 (η)/Fe [31,32] where the intermetallic layer is composed of an outer minor Fe4Al13 layer and an inner major Fe2Al5 layer; and (3) Al/Fe2Al5/Fe [33,34,35] where the only reaction product was Fe2Al5. Most studies have reported that θ phase (Fe4Al13 or FeAl3) is formed on Al side and η phase is formed on Fe side or steel side. There is no study on the reaction of Al-Mn coated layer in these studies. In the Al-Mn coating process of this study, Al11Mn4 is formed before θ phase formation.
As seen in Figure 12b, all reaction phases except for Fe3AlC (κ) phase formed on the liquid side of the steel surface, the elements such as Fe dissolved and formed in the Al-7 wt.% Mn molten alloy. Thus, an (Al-7 wt.% Mn)-Fe quasi-binary phase diagram was calculated using Thermo-CalcTM (Ver.6.0, Stockholm, Sweden) to analyze phase transformation during and while maintaining the dipping temperature. Figure 15 shows the phase diagram. When Fe is added into the melts at a dipping temperature of 773 °C at 0.6 wt.% or more, solid Al11Mn4 (A) formed within the liquid phase. However, the phase in the coating layer composed of Al and Mn had two phases, Al11Mn4 and Al6Mn (B). In the phase diagram, Al6Mn does not exist at the dipping temperature, but does exist below temperatures of 725 °C. In particular, Al6Mn can form on Al11Mn4 or can form in the coating layer. With this distribution, the Al11Mn4 formed as the Fe concentration in the melts increased while maintaining the dipping temperature. And Al6Mn can crystallize in liquid phase during cooling or form on Al11Mn4 which is nucleation site during cooling. Therefore, Al11Mn4 and Al6Mn may be connected to each other. The reaction layer, except for the coating structure (Al + Al6Mn), was formed as Al11Mn4 → FeAl3 (θ) → Fe2Al5 (η) → Fe3AlC (κ) in the coating process, maintaining the dipping temperature. Al11Mn4 formed by reacting with the liquid phase, but the remaining FeAl3 (θ), Fe2Al5 (η), and Fe3AlC (κ) did not react directly with the liquid phase but instead would be formed by a solid-phase diffusion mechanism between Al11Mn4 and steel.
Figure 16 is a schematic diagram of the processes formed by inter-diffusion in the order of phases. At interface Al11Mn4/liquid phase (L) formed first, and when Fe diffused toward the liquid phase and Al diffused toward the solid phase Al11Mn4, the Al11Mn4 phase grew. At the Al11Mn4 phase/steel interface, Al diffused toward the steel, and when Fe diffused into the A phase, the Al concentration decreased in the region close to the steel. On the other hand, since the Fe concentration increased, the Fe-rich phase formed. The θ phase (FeAl3) formed when the Fe concentration increased from 0 to 4 wt.% or more in the (Al-7 wt.% Mn)-x wt.% Fe quasi-binary diagram in Figure 15.
However, in Table 2 and Table 3, the actual Mn concentrations of the θ and η phases are lower than 7 wt.%. That is, the amounts of Mn of θ and η phases were 6.32 wt.% and 0.22 wt.%, respectively, and the Mn content of η was much lower than the Mn concentration in 1.13 wt.% of steel. Therefore, phase transformation by inter-diffusion while considering Mn content can be interpreted as Al-Mn-Fe ternary phase diagram. Figure 17 shows the Al-Mn-Fe ternary phase diagram calculated by Thermo-CalcTM. In the phase diagram, when the amount of Mn is 5% or less, Al11Mn4 did not form and instead the θ phase formed. Also, as Fe increased, it transformed from FeAl3 (θ) to Fe2Al5 (η). As a result, the amount of Fe increased by diffusion at the A11Mn4 phase/steel interface, and when the amount of Al decreased, θ would form. At the θ phase/steel interface (c), when the amount of Al decreased and the amount of Fe further increased, η (Fe2Al5) would form as shown in the phase diagram. As shown in Figure 14c, large columnar η grains grow along the c-axis of the phase. Morphology of the η phase has been studied and explained as a result of the 30% vacancy rate in the c-axis of the crystal structure, which can be as a rapid diffusion tunnel. It causes η phase to be oriented by the fixed c-axis of the crystal structure, and grows preferentially along the diffusion direction during hot-dipping.
The formation mechanism of the κ (Fe3AlC) phase at the interface between the steel and the η phase is as follows. As shown in Figure 3f, the concentration of C in the region transformed from α Fe (Steel) to η phase is lower than that of the steel. This phenomenon coincides with the maximum solubility of 0.07 wt.% of η phase (see Table 5) calculating by using Thermo-CalcTM, and the solubility is very low. Therefore, C in the region transformed to η phase will be diffused and discharged toward the steel that can be soluted by increasing the concentration of Al and C in the steel interface. The content of C in the Fe3AlC (κ) is 5.05 wt.%, and the average concentration of steel is 0.23 wt.%. Since the amount of C for forming this phase is absolutely insufficient, the thickness is formed in nm.

5. Conclusions

Nucleation and growth of the reaction layer formed on boron steel hot-dipped in an Al-7 wt.% Mn molten alloy at 773 °C for various times was investigated.
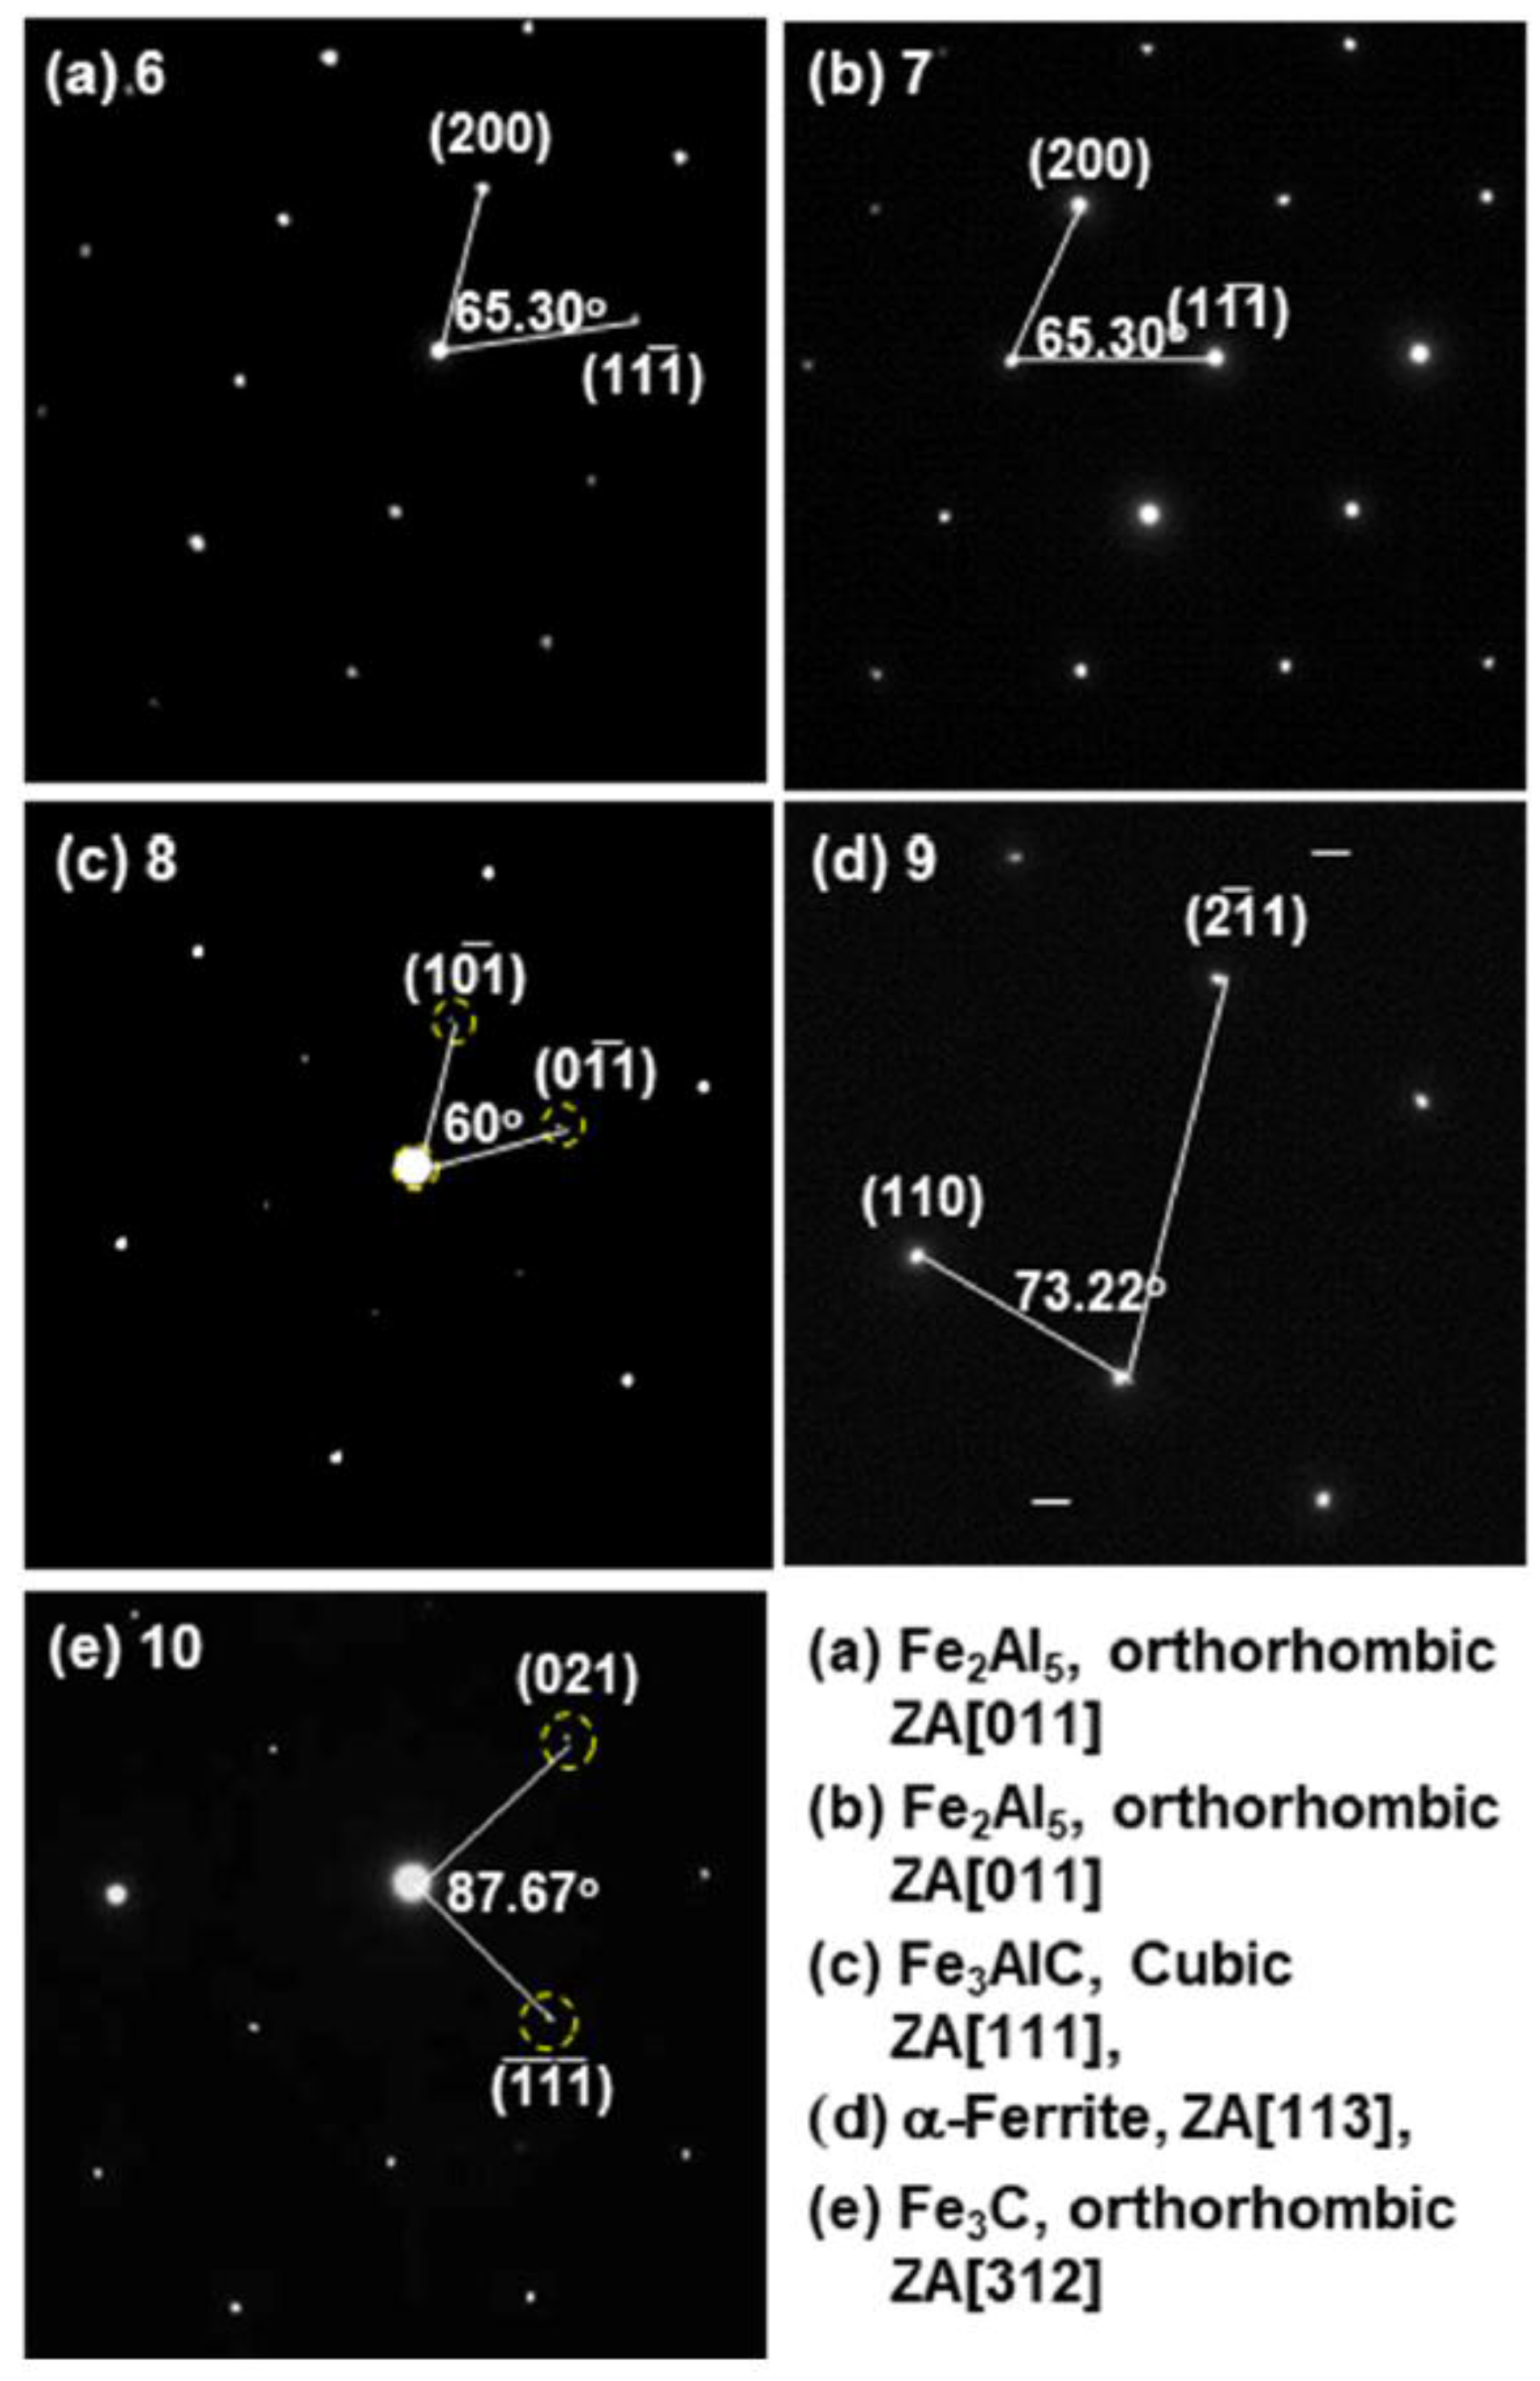
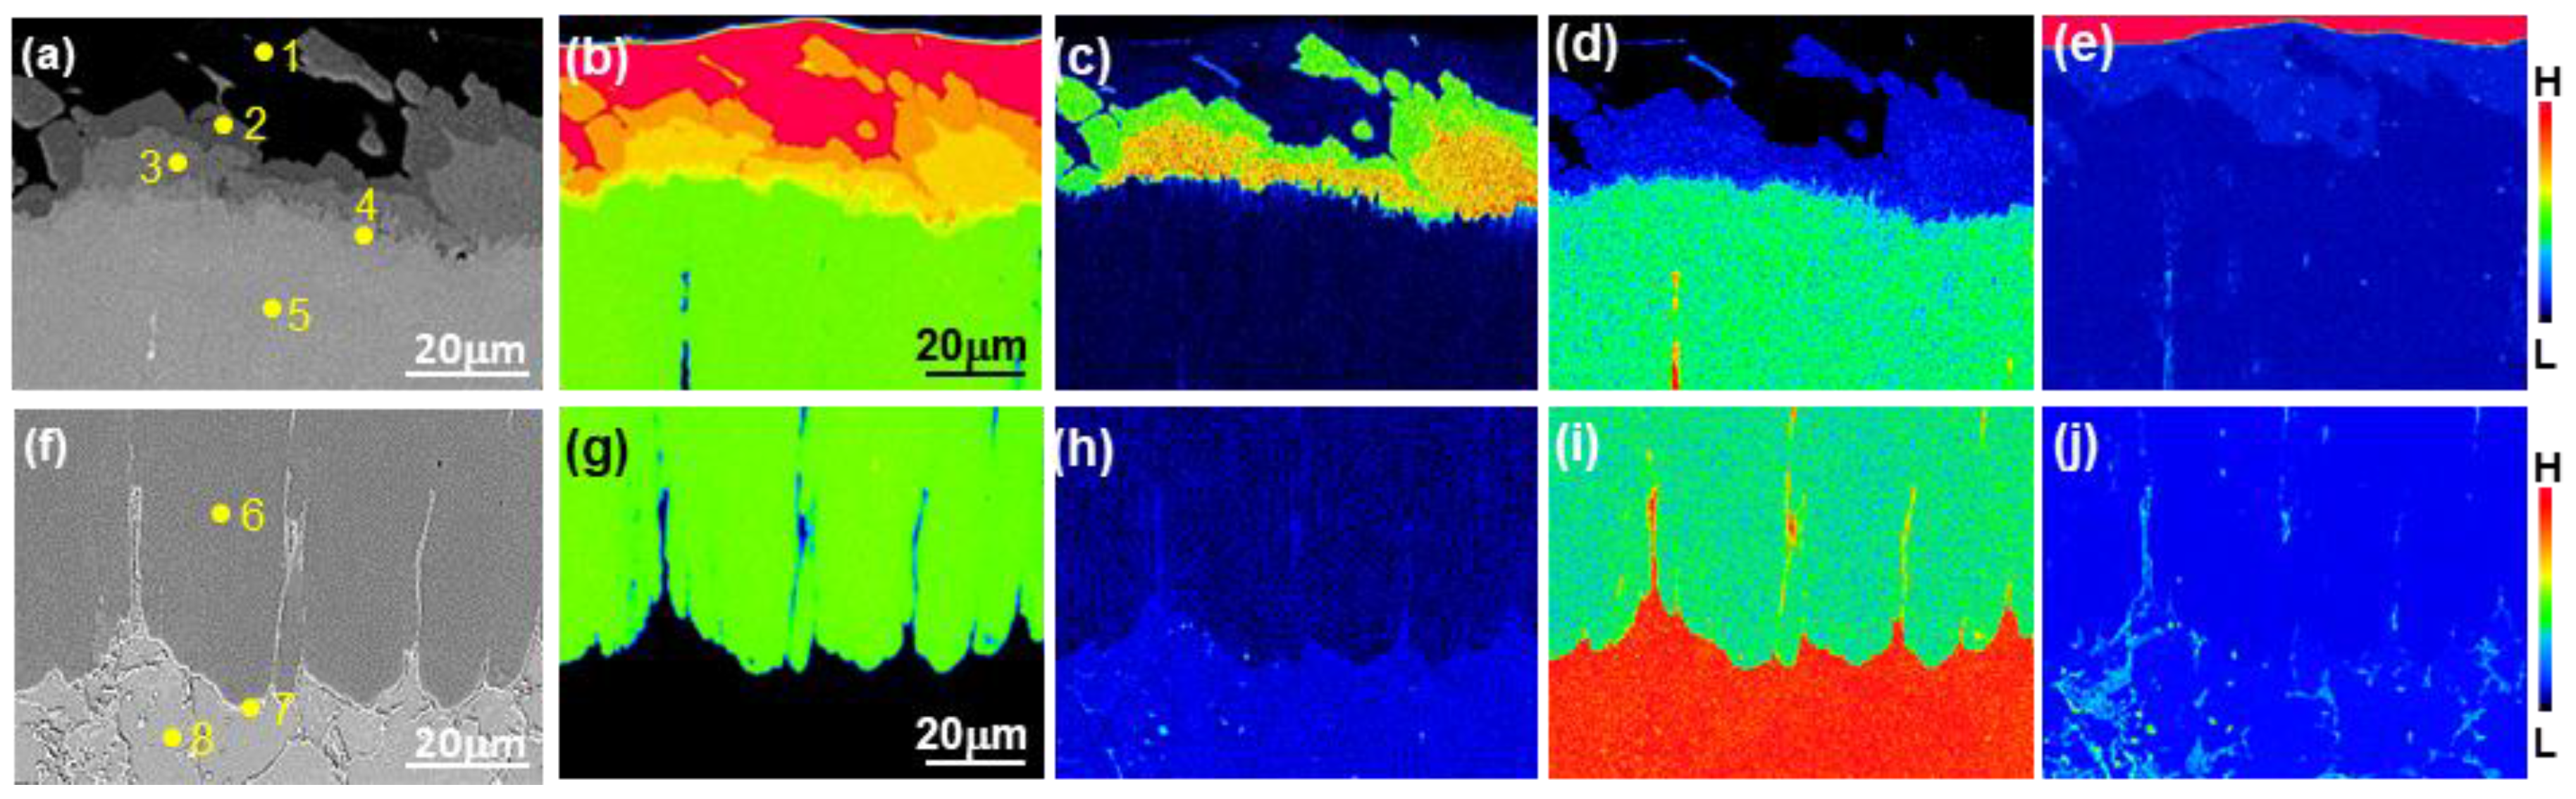
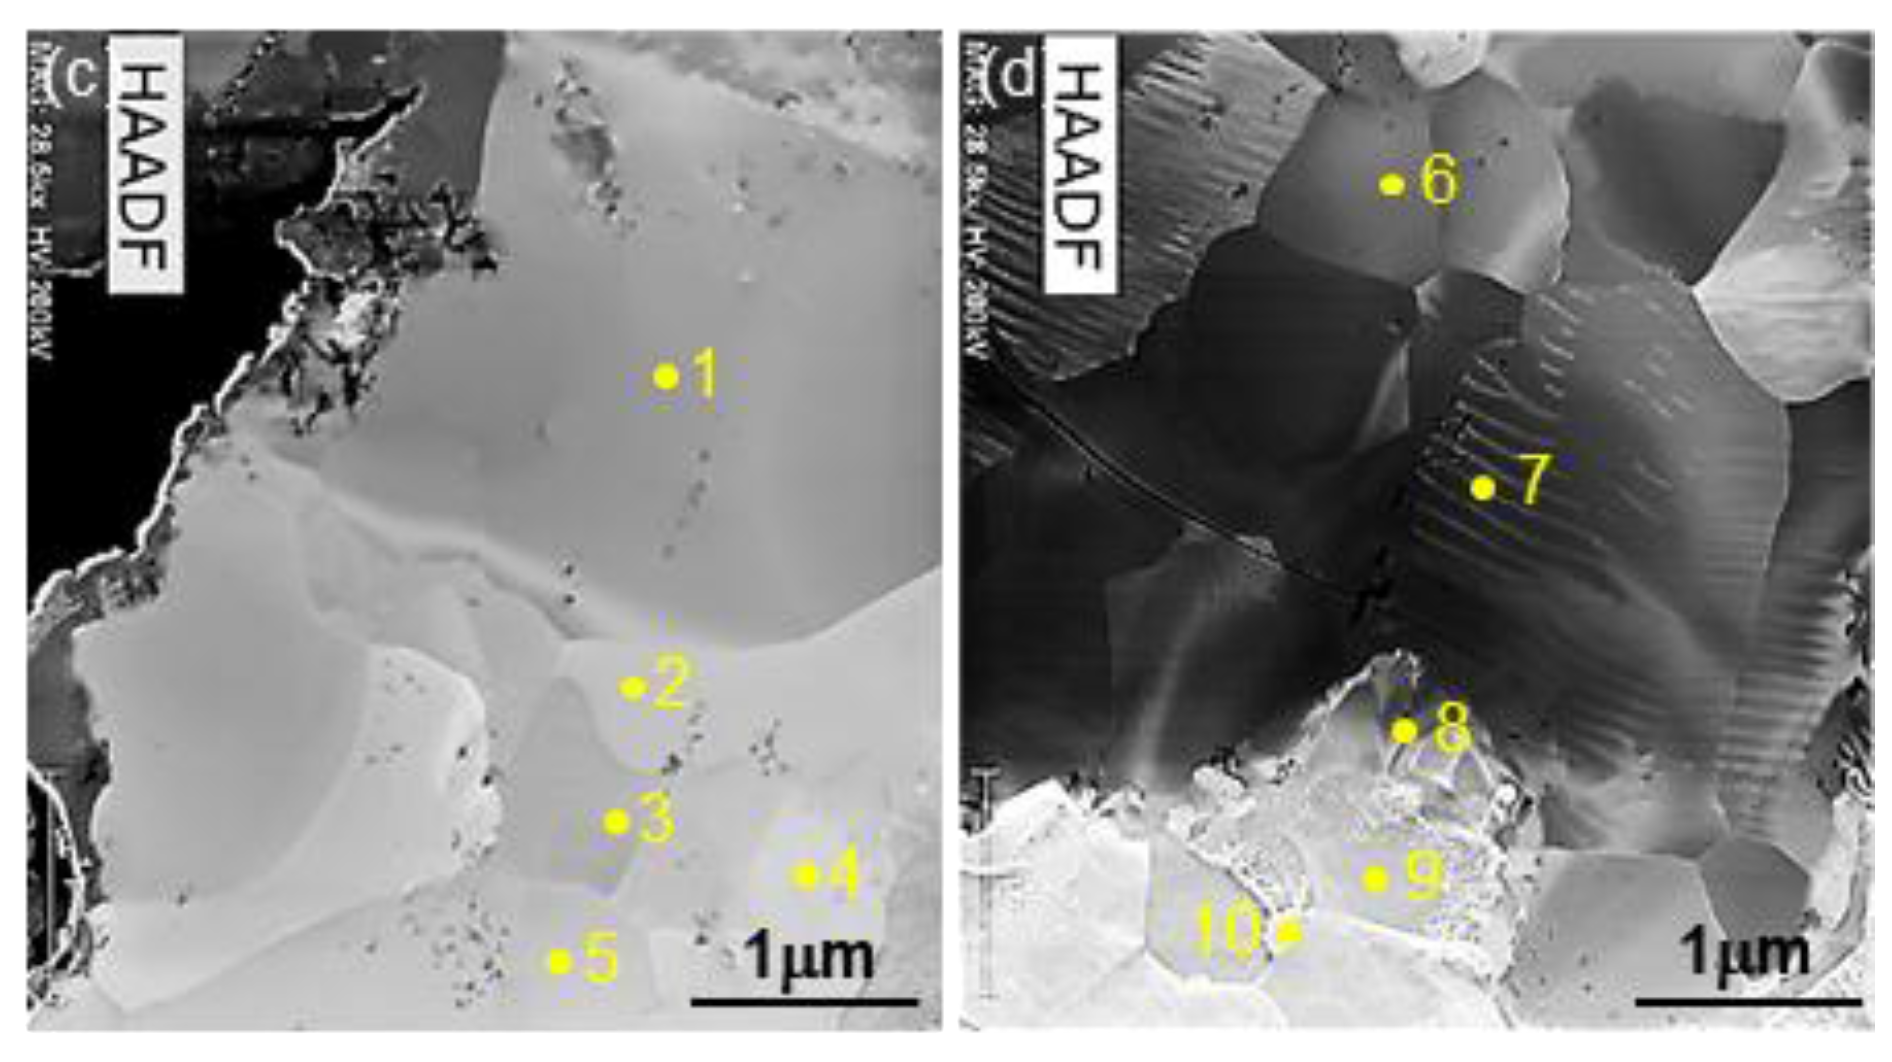
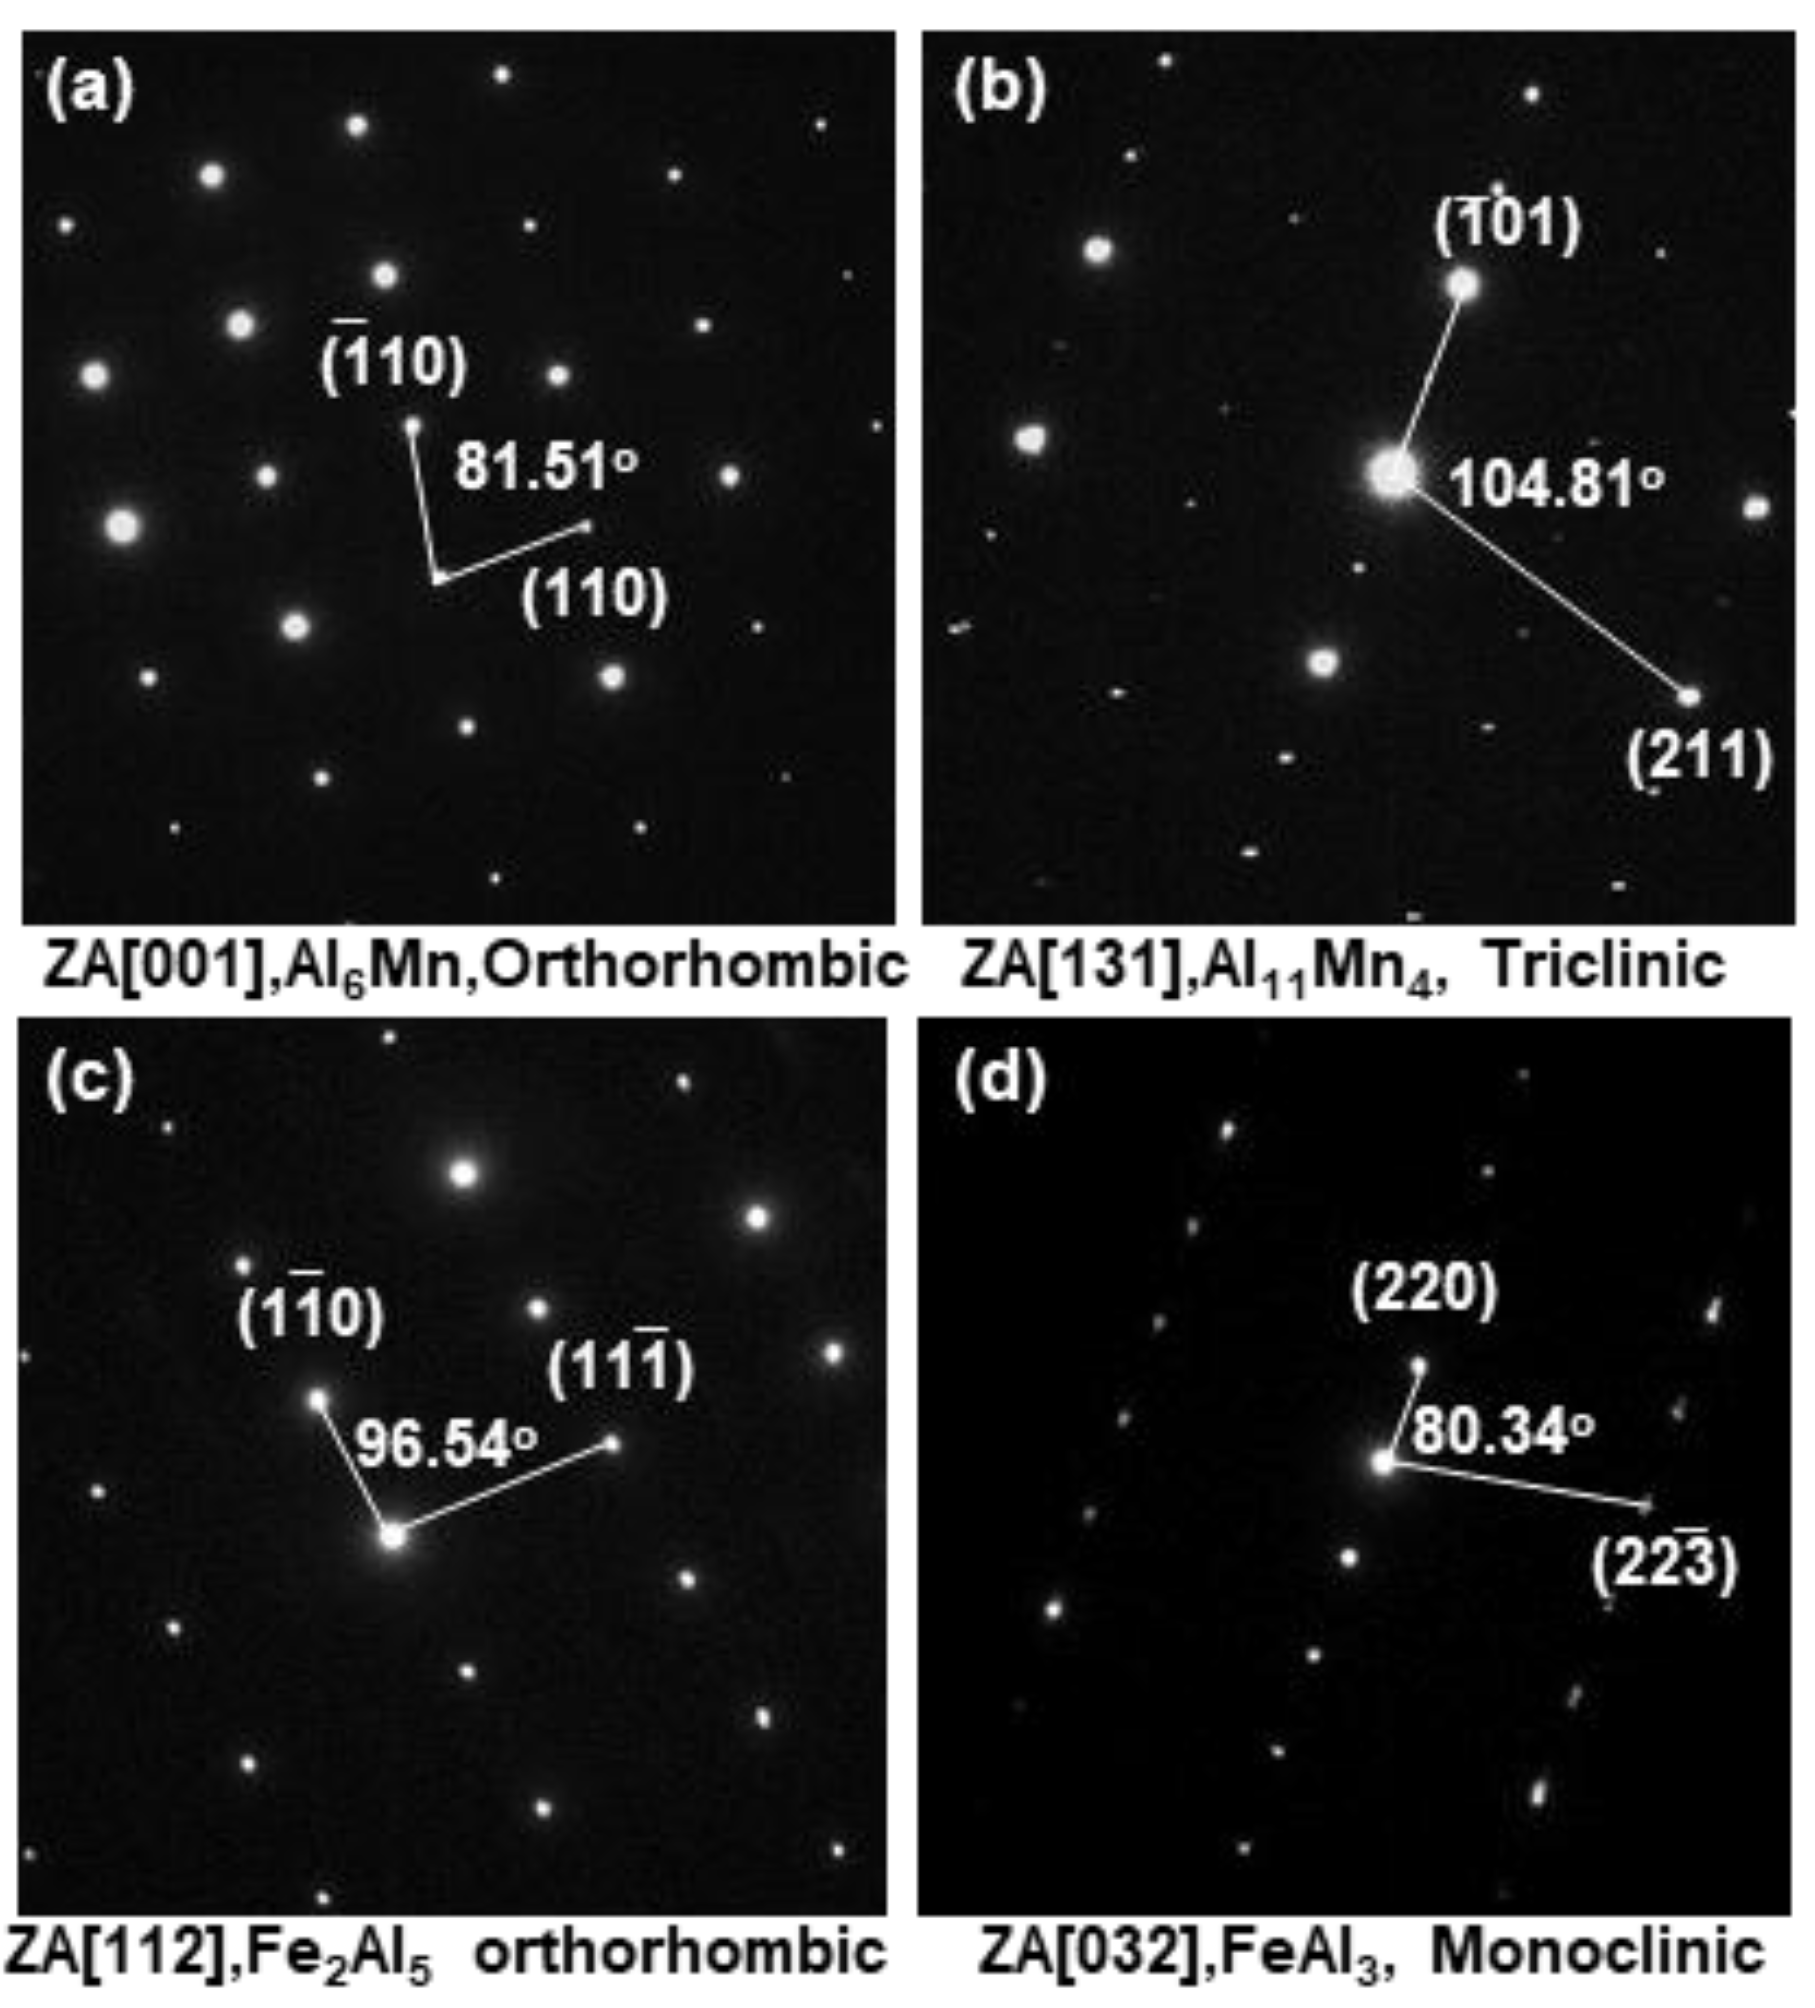
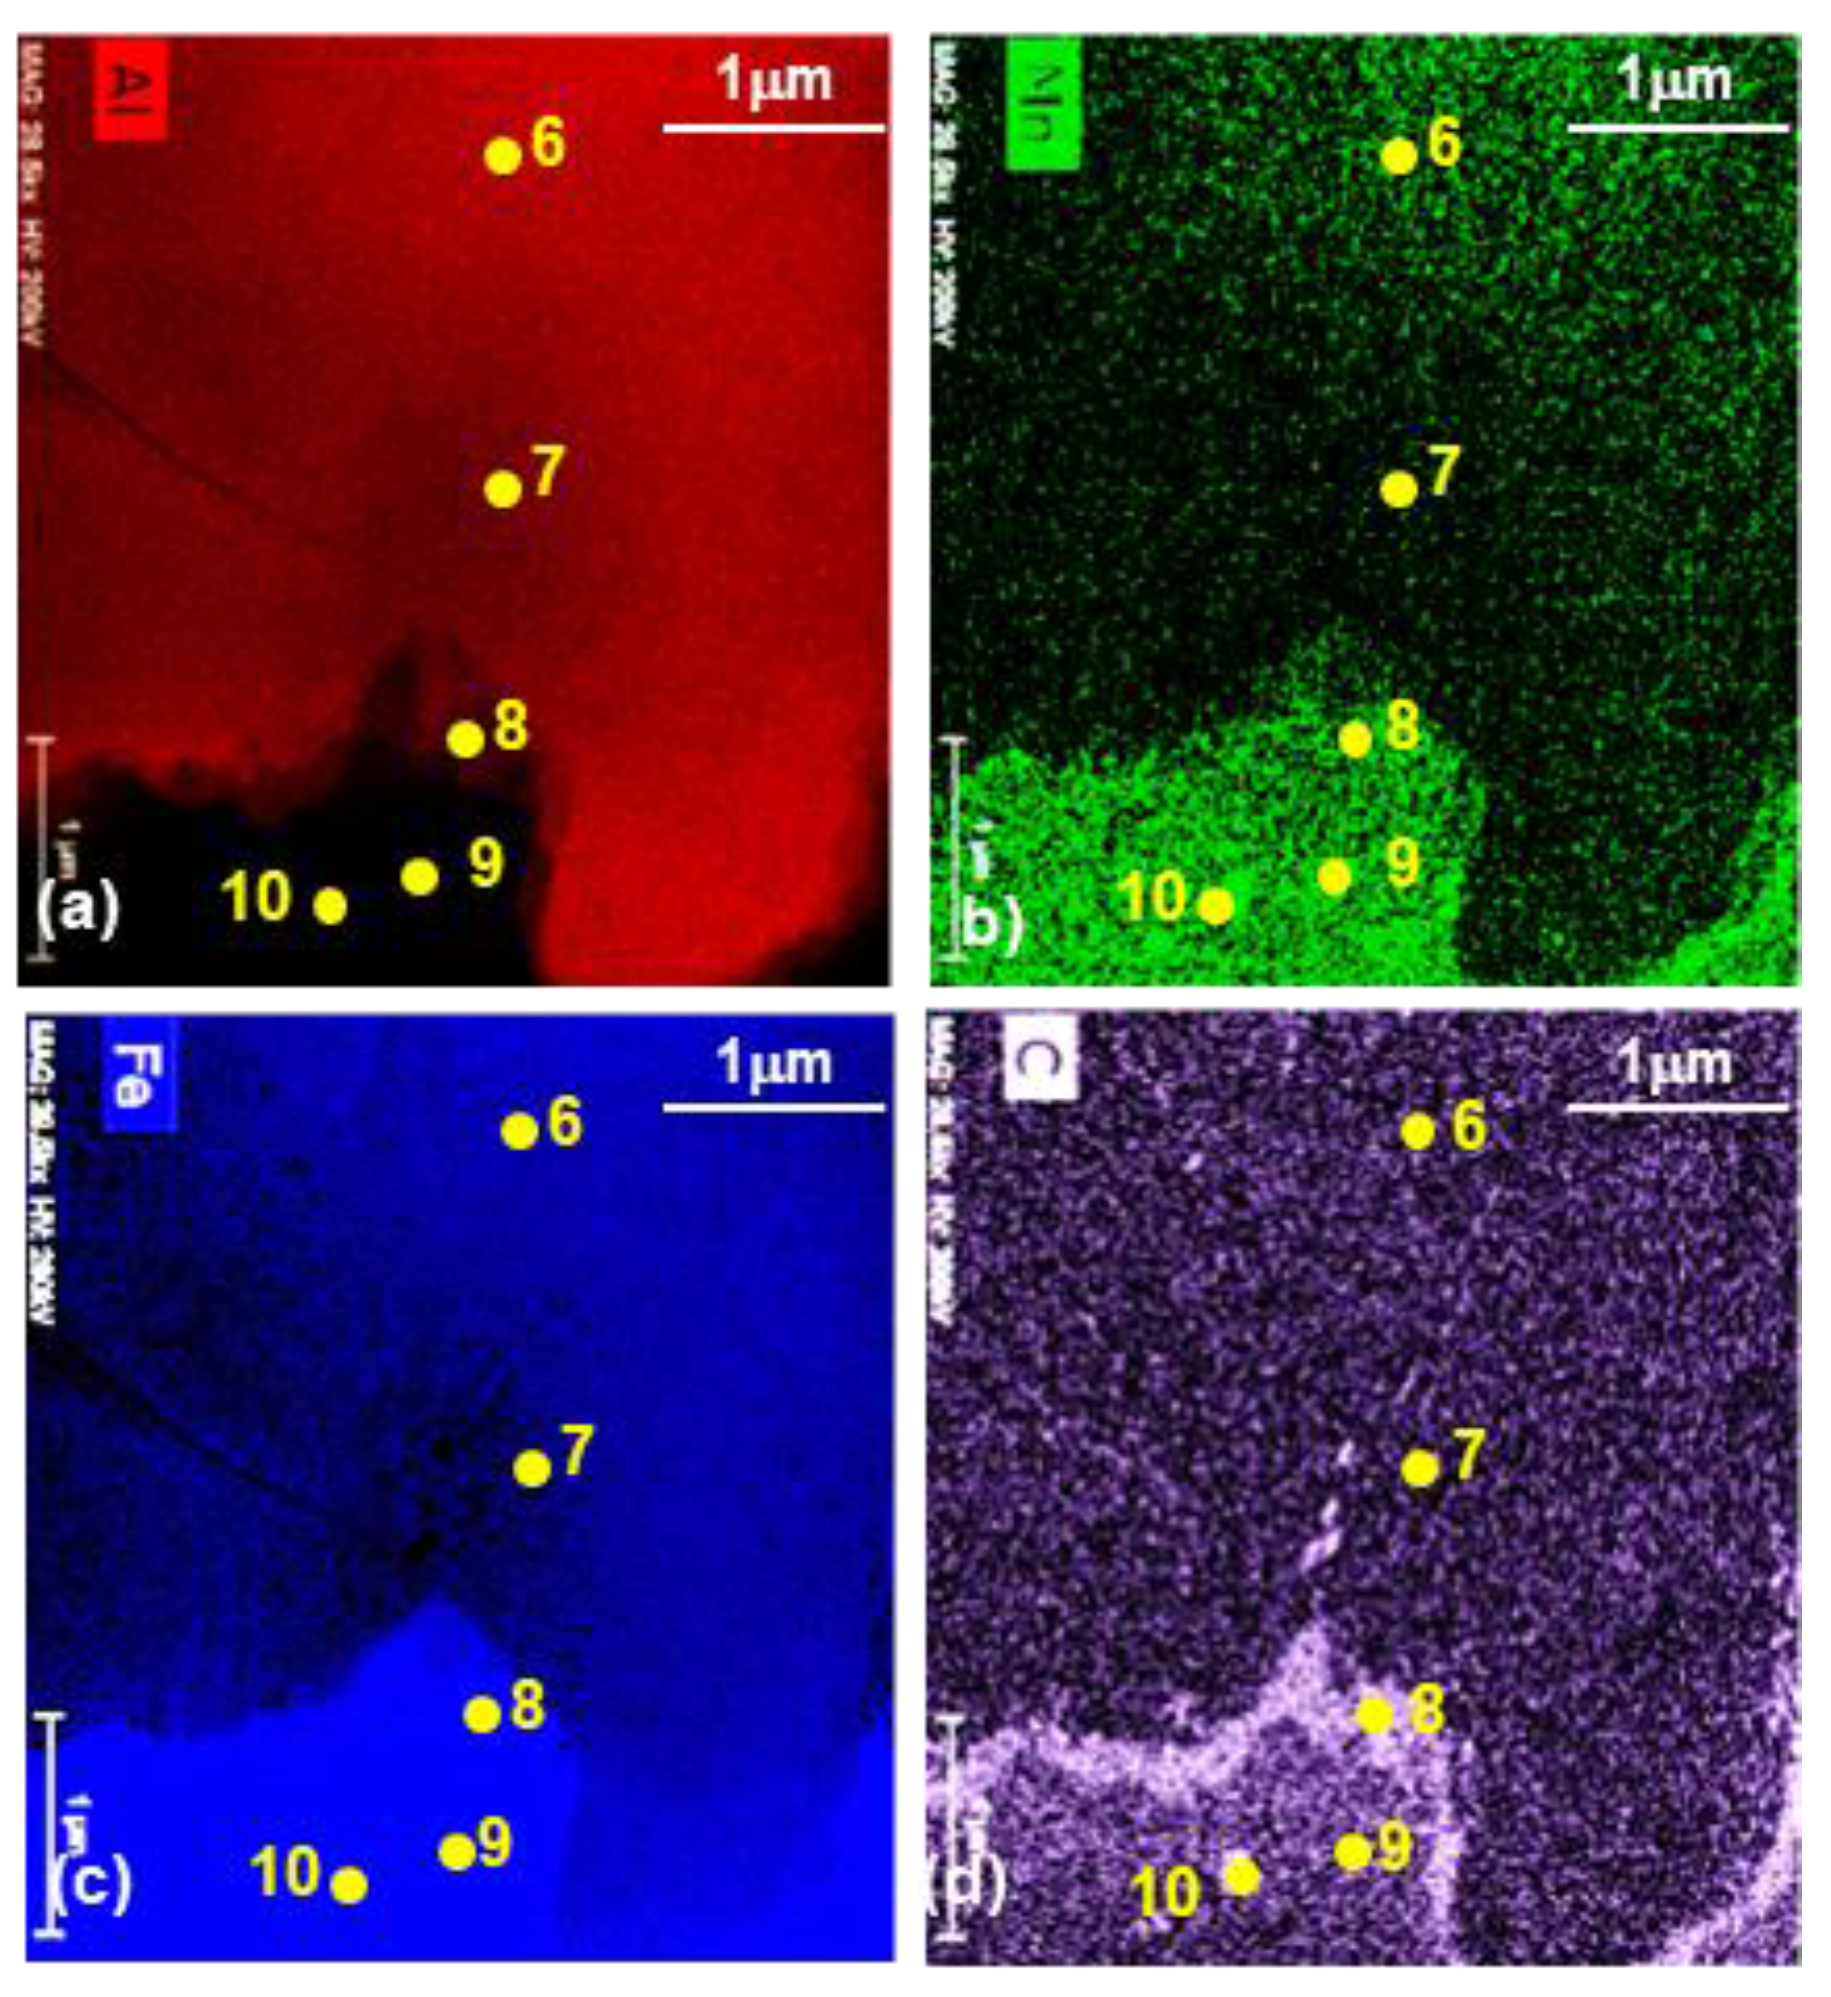
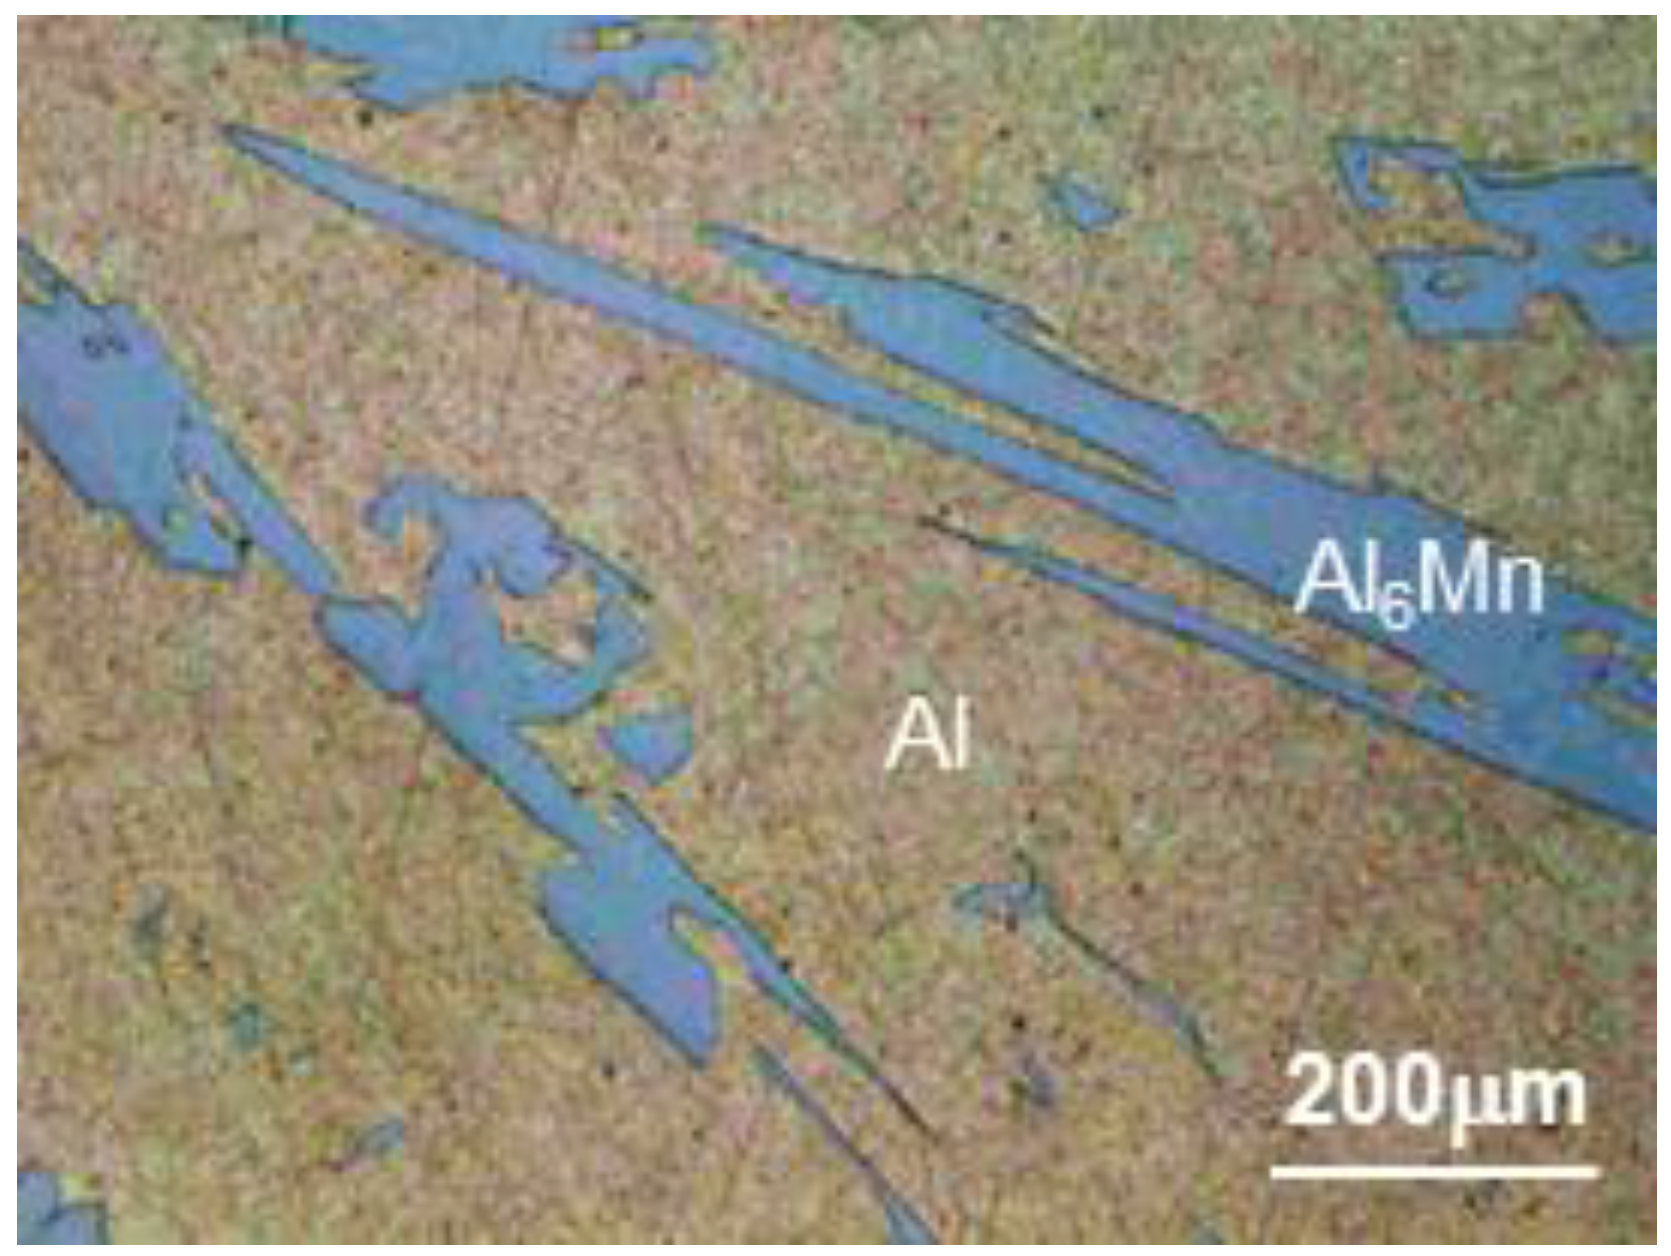
  • The layer formed on the surface of the steel was classified into a reaction layer formed at the coating temperature and a solidification layer in which the liquid phase solidified during cooling. The solidification layer was composed of Al and Al6Mn phases, and the reaction layer was composed of Al11Mn4, FeAl3 (θ) and Fe2Al5 (η) phases. In particular, the η phase grew long inside the steel. The Fe3AlC (κ) phase was formed at the interface between the η phase and the steel in a very thin band of several nanometers.
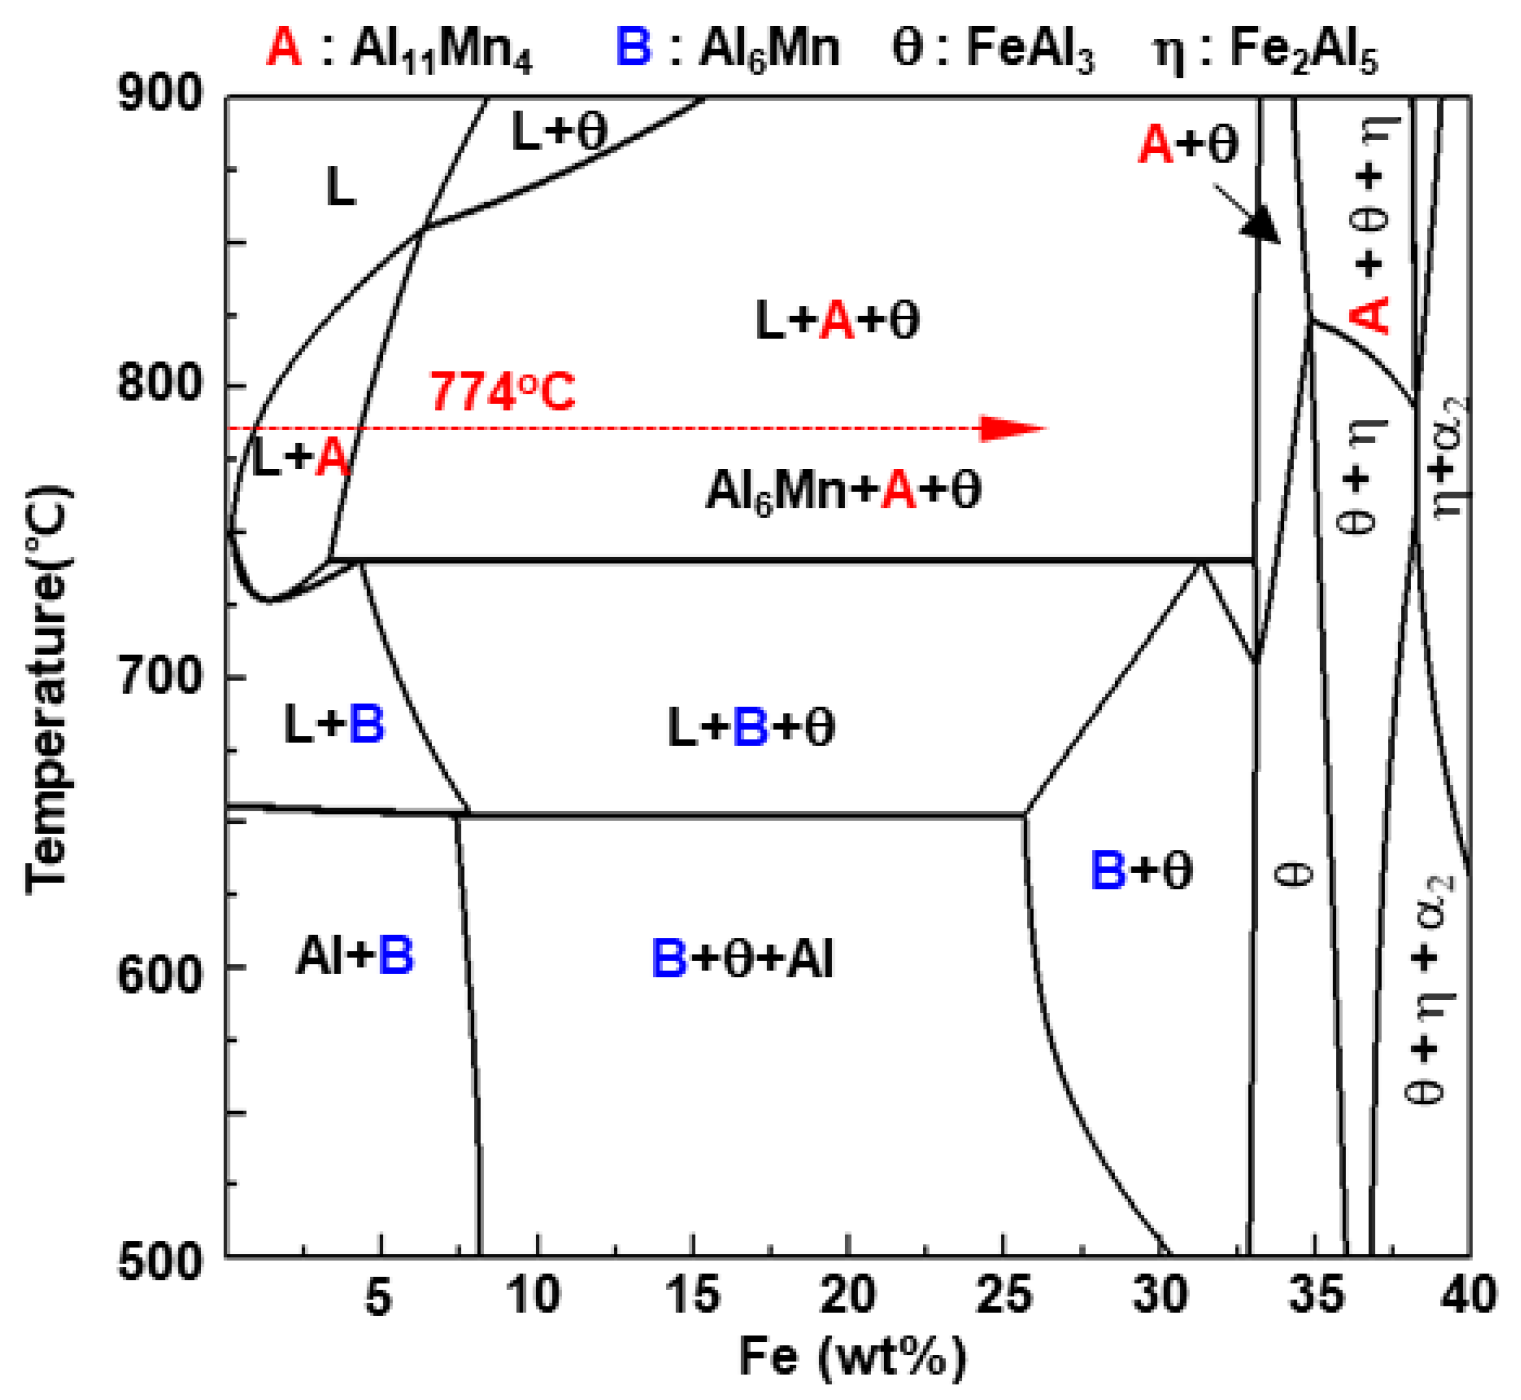
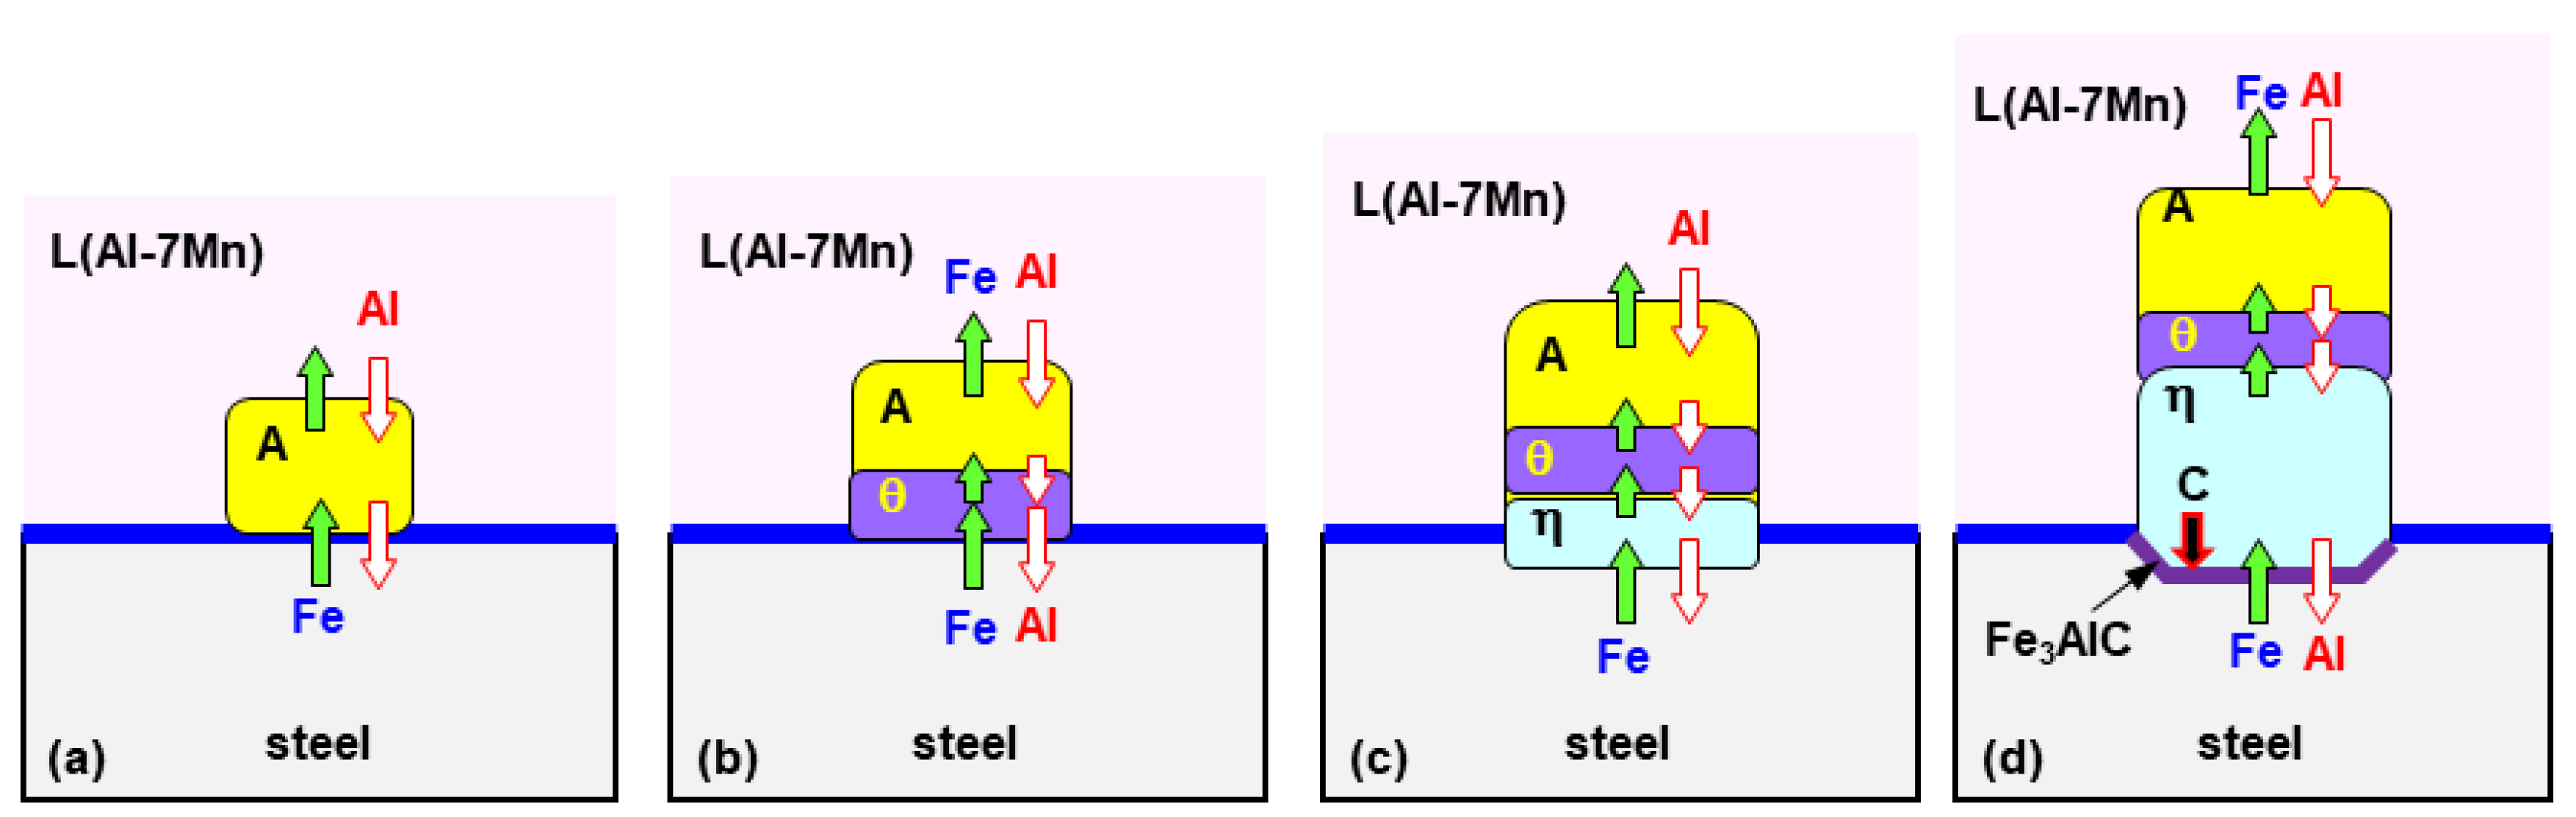
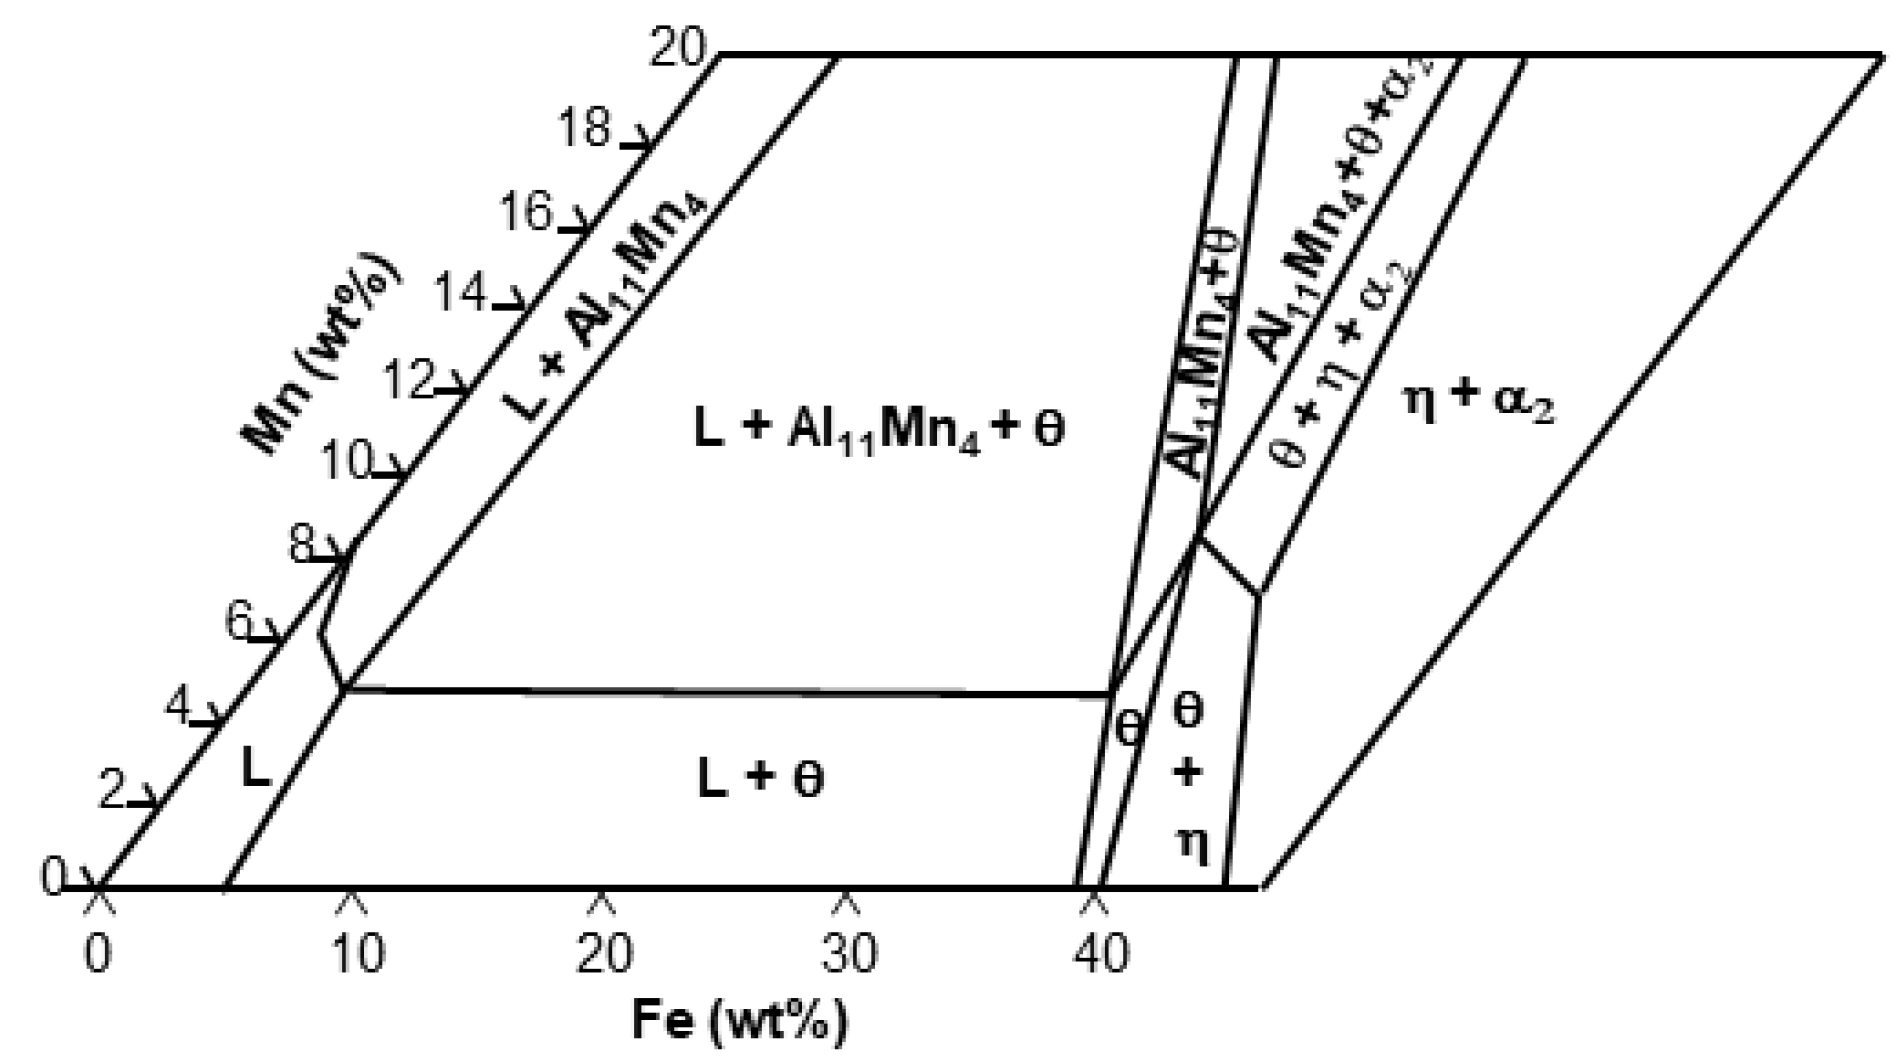
  • The solid phase Al11Mn4 was eluted when Fe was dissolved in Al-Mn molten alloy at 773 °C at 0.6 wt.% or more from the (Al-7 wt.% Mn)-x wt.% Fe quasi phase diagram (Thermo-CalcTM). At the interface between Al11Mn4 phase and the steel, as Fe diffused toward the Al11Mn4 and Al diffused toward the steel, at the interface, θ phase was formed as the Fe concentration increased and the Al concentration decreased. In addition, η phase was formed due to inter-diffusion of Fe, Al between the θ phase and the steel. In other words, Al11Mn4 → θ → η was formed in which the Fe content was higher toward the steel by inter-diffusion in the solid phase state.
  • The η phase formed by the reaction with the liquid phase initially had a fine polygonal structure. However, it formed inside the steel, growing to the order of Al11Mn4 → θ → η in the liquid phase, and grew in a long columnar form because the Al diffusion was along the c-axis and the <100> direction was fast, as already known.
  • Fe3AlC (κ) phase was formed as the concentration of Al and C is increasing at the steel interface because the η phase diffused C toward steel due to the fact that η hardly contains C.

Acknowledgments

This work was supported by a 2-Year Research Grant of Pusan National University.

Author Contributions

Sung-Yun Kwak and Chung-Yun Kang conceived and designed the experiments; Sung-Yun Kwak, Jae-Hyeong Lee, Jung-Gil Yun, and Dong-Ik Shin performed the experiments; Sung-Yun Kwak and Chung-Yun Kang analyzed the data; Sung-Yun Kwak wrote the manuscript.

Conflicts of Interest

The funding sponsors had no role in the design of the study; in the collection, analyses, or interpretation of data; in the writing of the manuscript, and in the decision to publish the results.

References

  1. Senuma, T. Physical metallurgy of modern high strength steel sheets. Iron Steel Inst. Jpn. 2001, 41, 520–532. [Google Scholar] [CrossRef]
  2. Tetsuya, M.; Kohei, H.; Hidetaka, K. Ultra high-strength steel sheets for bodies, reinforcement parts, and seat frame parts of automobile—Ultra high-strength steel sheets leading to great improvement in crash-worthiness. JFE Tech. Rep. 2004, 4, 38–43. [Google Scholar]
  3. Bariani, P.F.; Bruschi, S. Testing formability in the hot stamping of HSS. CIRP Ann. Manuf. Technol. 2008, 57, 265–268. [Google Scholar] [CrossRef]
  4. Karbasian, H.; Tekkaya, A.E. A review on hot stamping. J. Mater. Process. Technol. 2010, 210, 2103–2118. [Google Scholar] [CrossRef]
  5. Naderi, M.; Ketabchi, M. Analysis of microstructure and mechanical properties of different high strength carbon steels after hot stamping. J. Mater. Process. Technol. 2011, 211, 1117–1125. [Google Scholar] [CrossRef]
  6. Wang, C.-J.; Chen, S.-M. The high-temperature oxidation behavior of hot-dipping Al–Si coating on low carbon steel. Surf. Coat. Technol. 2006, 200, 6601–6605. [Google Scholar] [CrossRef]
  7. Cheng, W.-J.; Wang, C.-J. Effect of silicon on the formation of intermetallic phases in aluminide coating on mild steel. Intermetallics 2011, 19, 1455–1460. [Google Scholar] [CrossRef]
  8. Saha, D.C.; Biro, E.; Gerlich, A.P.; Zhou, Y.N. Fiber laser welding of Al-Si-coated press-hardened steel. Weld. J. 2016, 95, 147–156. [Google Scholar]
  9. Jung, B.H.; Kong, J.P.; Kang, C.Y. Effect of hot-stamping heat treatment on the microstructure of Al-segregated zone in TWB laser joints of Al-Si-coated boron steel and Zn-coated DP steel. Korean J. Met. Mater. 2012, 50, 455–462. [Google Scholar]
  10. Yoon, T.-J.; Oh, M.-H.; Shin, H.-J.; Kang, C.-Y. Comparison of microstructure and phase transformation of laser-welded joints in Al-10wt.%Si-coated boron steel before and after hot stamping. Mater. Charact. 2017, 128, 195–202. [Google Scholar] [CrossRef]
  11. Kobayashi, S.; Yakou, T. Control of intermetallic compound layers at interface between steel and aluminum by diffusion-treatment. Mater. Sci. Eng. A 2002, 338, 44–53. [Google Scholar] [CrossRef]
  12. Chen, S.; Yang, D.; Zhang, M.; Huang, J.; Zhao, X. Interaction between the growth and dissolution of intermetallic compounds in the interfacial reaction between solid iron and liquid aluminum. Metall. Mater. Trans. A 2016, 47, 5088–5100. [Google Scholar] [CrossRef]
  13. Cheng, W.-J.; Wang, C.-J. Study of microstructure and phase evolution of hot-dipped aluminide mild steel during high-temperature diffusion using electron backscatter diffraction. Appl. Surf. Sci. 2011, 257, 4663–4668. [Google Scholar] [CrossRef]
  14. Springer, H.; Kostka, A.; Payton, E.J.; Raabe, D.; Kaysser-Pyzalla, A.; Eggeler, G. On the formation and growth of intermetallic phases during interdiffusion between low-carbon steel and aluminum alloys. Acta Mater. 2011, 59, 1586–1600. [Google Scholar] [CrossRef]
  15. Naoi, D.; Kajihara, M. Growth behavior of Fe2Al5 during reactive diffusion between Fe and Al at solid-state temperatures. Mater. Sci. Eng. A 2007, 459, 375–382. [Google Scholar] [CrossRef]
  16. Tanaka, Y.; Kajihara, M. Kinetics of isothermal reactive diffusion between solid Fe and liquid Al. J. Mater. Sci. 2010, 45, 5676–5684. [Google Scholar] [CrossRef]
  17. Drewett, R. A review of some aspects concerning the formation of metallic diffusion coatings on ferrous metals. Corros. Sci. 1969, 9, 823–847. [Google Scholar] [CrossRef]
  18. Yeremenko, V.N.; Natanzon, Y.V.; Dybkov, V.I. The effect of dissolution on the growth of the Fe2Al5, interlayer in the solid iron—Liquid aluminium system. J. Mater. Sci. 1981, 16, 1748–1756. [Google Scholar] [CrossRef]
  19. Li, X.; Liu, B.; Dong, X.; Yu, Q.; Xu, Q. Prepartion of Al-Mn alloy coatings on low carbon steel by hot-dip-aluminizing. Appl. Mech. Mater. 2012, 117–119, 1121–1124. [Google Scholar] [CrossRef]
  20. Pradhan, D.; Manna, M.; Dutta, M. Al–Mg–Mn alloy coating on steel with superior corrosion behavior. Surf. Coat. Technol. 2014, 258, 405–414. [Google Scholar] [CrossRef]
  21. ASM Handbook Volume 9: Metallography and Microstructures; Vander Voort, G.F. (Ed.) ASM International: Materials Park, OH, USA, 2004. [Google Scholar]
  22. Takata, N.; Nishimoto, M.; Kobayashi, S.; Takeyama, M. Crystallography of Fe2Al5 phase at the interface between solid Fe and liquid Al. Intermetallics 2015, 67, 1–11. [Google Scholar] [CrossRef]
  23. Bouche, K.; Barbier, F.; Coulet, A. Intermetallic compound layer grwoth between solid iron and molten aluminum. Mater. Sci. Eng. A 1998, 249, 167–175. [Google Scholar] [CrossRef]
  24. Shahverdi, H.R.; Ghomashchi, M.R.; Shabestari, S.; Hejazi, J. Microstructural analysis of interfacial reaction between molten aluminum and solid iron. J. Mater. Process. Technol. 2002, 124, 345–352. [Google Scholar] [CrossRef]
  25. Takata, N.; Nishimoto, M.; Kobayashi, S.; Takeyama, M. Morphology and formation of Fe-Al intermetallic compoundss on iron hot-dipped in Al-Mg-Si alloy melt. Intermetallics 2014, 54, 136–142. [Google Scholar] [CrossRef]
  26. Yin, F.-C.; Zhao, M.-X.; Liu, Y.-X.; Han, W.; Li, Z. Effect of Si on growth kinetics of intermetallic compounds during reaction between solid iron and molten aluminum. Trans. Nonferrous Met. Soc. China 2013, 23, 556–561. [Google Scholar] [CrossRef]
  27. Cheng, W.-J.; Wang, C.-J. Growth of intermetallic compounds in the aluminide mild steel during hot-dipped. Surf. Coat. Technol. 2009, 204, 824–828. [Google Scholar] [CrossRef]
  28. Awan, G.H.; Hasan, F.U. The morphology of coating/substrate interface in hot-dip-aluminized steels. Mat. Sci. Eng. A 2008, 472, 157–165. [Google Scholar] [CrossRef]
  29. Sasaki, T.; Yakou, T. Features of intermetallic compounds in aluminized steels formed using aluminum foil. Surf. Coat. Technol. 2006, 201, 2131–2139. [Google Scholar] [CrossRef]
  30. Heumann, T.; Dittrich, N. Structure character of the Fe2Al5 intermetallics compound in hot dip aluminizing process. Z Metallk 1959, 50, 617–625. [Google Scholar]
  31. Van Alboom, A.; Lemmens, B.; Breitbach, B.; de Grave, E.; Cottenier, S.; Verbeken, K. Multi-method identification and characterization of the intermetallic surface layers of hot-dip Al-coated steel: FeAl3 or Fe4Al13 and Fe2Al5 or Fe2Al5+x. Surf. Coat. Technol. 2017, 324, 419–428. [Google Scholar] [CrossRef]
  32. Mhadhbi, M.; Khitouni, M.; Escoda, L.; Suñol, J.J. Recovery, grain growth and recrystallization of mechanically alloyed FeAl alloy. In IOP Conference Series: Materials Science and Engineering; IOP Publishing: Bristol, UK, 2010; p. 012021. [Google Scholar]
  33. Burkhardt, U.; Grin, Y.; Ellner, M. Structure refinement of the iron-aluminum phase with the approximate composition Fe2Al5. Acta Crystallogr. Sect. B Struct. Sci. 1994, 50, 313–316. [Google Scholar] [CrossRef]
  34. Cheng, W.-J.; Wang, C.-J. Microstructural evolution of intermetallic compounds in hot-dipped aluminide mild steel with silicon addition. Surf. Coat. Technol. 2011, 205, 4726–4731. [Google Scholar] [CrossRef]
  35. Sakidja, R.; Perepezko, J.H.; Calhoun, P. Synthesis, thermodynamic stability and diffusion mechanism of Al5Fe2-based coatings. Oxid. Met. 2014, 81, 167–177. [Google Scholar] [CrossRef]
Figure 1. Cross-sectional optical microstructure of specimens hot dipped for various dipping times. (a) 30 s; (b) 40 s; (c) 50 s; (d) 90 s; (e) 100 s; (f) 120 s.
Coatings 07 00222 g001
Figure 2. Electron probe micro-analysis (EPMA) area-analysis results of the coating layers hot dipped at 773 °C for 30 s. (a) BSE; (b) Al; (c) Mn; (d) Fe; (e) O.
Coatings 07 00222 g002
Figure 3. EPMA area-analysis results of the coating layers hot dipped at 773 °C for 40 s. (a) BSE; (b) Al; (c) Mn; (d) Fe; (e) O; (f) C.
Coatings 07 00222 g003
Figure 4. X-ray diffraction (XRD) analysis of the oxide layer formed on the steel surface upon initial dipping.
Coatings 07 00222 g004
Figure 5. Change in formation ratio of reaction layer on boron steel with dipping time (s).
Coatings 07 00222 g005
Figure 6. (a) Back-scattered electron (BSE) structure enlarged of area denoted as γ in Figure 3a,b TEM specimen took at area denoted as γ in (a) using FIB; (c,d) HAADF image of area 1 and area 2 in (b), respectively.
Coatings 07 00222 g006aCoatings 07 00222 g006b
Figure 7. Results of TEM-EDS (Transmission Electron Microscopy-Energy Dispersive Spectroscopy) analysis in Figure 6c. (a) Al; (b) Mn; (c) Fe; (d) C.
Coatings 07 00222 g007
Figure 8. Results of the diffraction pattern in the area indicated by 1–5 in Figure 6c. (a) Al6Mn, (b) Al11Mn4, (c) Fe2Al5 (η), (d) FeAl3 (θ).
Coatings 07 00222 g008
Figure 9. Results of TEM-EDS analysis of (d) in Figure 6. (a) Al; (b) Mn; (c) Fe; (d) C.
Coatings 07 00222 g009
Figure 10. Results of the diffraction pattern in the area indicated by 6–10 Figure 6d. (a,b) Fe2Al5 (η); (c) Fe3AlC (κ); (d) α-Fe; (e) Fe3C.
Coatings 07 00222 g010
Figure 11. Microstructure of Al-7 wt.% Mn alloy (as cast).
Coatings 07 00222 g011
Figure 12. Results of EBSD analysis hot—dipping for 40 s. (a) Image Quality (IQ) map; (b) Phase map; (c) Inversed Pole Figure (IPF) map and (d) the schematic diagram of the reaction layer nucleated in the liquid (40 s).
Coatings 07 00222 g012
Figure 13. Scanning electron microscopy (SEM) microstructure and EPMA area results of the coating layers hot dipped for 120 s. (a,f) SEM microstructure; (b,g) Al; (c,h) Mn; (d,i) Fe; (e,j) C.
Coatings 07 00222 g013
Figure 14. EBSD results of the reaction layer (120 s). (a) Image Quality (IQ) map; (b) Phase map; (c) Inversed Pole Figure (IPF) map.
Coatings 07 00222 g014
Figure 15. (Al-7 wt.% Mn)-xFe quasi-binary diagram calculated by using Thermo-CalcTM.
Coatings 07 00222 g015
Figure 16. Formation mechanism of the reaction layer formed by the dissolution and inter-diffusion reactions at initial hot-dipping process. (a) Al11Mn4; (b) FeAl3 (θ); (c) Fe2Al5 (η); (d) κ (Fe3AlC).
Coatings 07 00222 g016
Figure 17. Al-Mn-Fe ternary phase diagram at 773 °C calculated by using Thermo-CalcTM.
Coatings 07 00222 g017
Table 1. Chemical composition of Boron steel.
Chemical Composition (wt.%)
CSMnCrNbTiBPSFe
0.2290.2381.1890.1830.0040.0360.0020.0020.002Bal.
Table 2. EDS analysis results (at./wt.%) of phases denoted as 1–5 in Figure 6c, respectively.
No.AlMnFeCRem.Expected Phase
at.%/wt.%at.%/wt.%at.%/wt.%at.%/wt.%at.%/wt.%
180.96/67.5212.26/20.956.20/10.770.32/0.12Bal./Bal.Al6Mn
276.11/61.1715.06/24.698.24/13.730.36/0.13Bal./Bal.Al11Mn4
374.01/58.3716.16/26.018.33/15.260.36/0.13Bal./Bal.Al11Mn4
469.58/52.490.14/0.2229.98/47.010.23/0.08Bal./Bal.Fe2Al5
569.17/52.274.11/6.3226.4/41.020.32/0.11Bal./Bal.FeAl3
Table 3. Energy-dispersive spectroscopy (EDS) analysis results (at./wt.%) of phases denoted as 6–10 in Figure 6d, respectively.
No.AlMnFeCRem.Expected Phase
at.%/wt.%at.%/wt.%at.%/wt.%at.%/wt.%at.%/wt.%
669.84/51.950.17/0.2529.62/47.020.22/0.07Bal./Bal.Fe2Al5
768.67/51.600.15/0.2330.9/48.060.26/0.09Bal./Bal.Fe2Al5
818.24/11.521.37/1.7662.5/81.6917.89/5.03Bal./Bal.Fe3AlC
90.09/0.04 1.14/1.1397.16/98.011.01/0.22Bal./Bal.Fe
100.03/0.027.07/8.1574.37/87.1618.53/4.67Bal./Bal.Fe3C
Table 4. Chemical composition (at.%) of phases denoted as 1–8 by EDS analysis.
No.AlMnFeCRem.Expected Phase
198.300.210.171.01Bal.Al
282.2111.345.720.37Bal.Al6Mn
374.6119.124.930.14Bal.Al11Mn4
469.174.9425.010.27Bal.FeAl3
569.140.1629.740.10Bal.Fe2Al5
668.730.1930.100.21Bal.Fe2Al5
717.311.0362.8817.87Bal.Fe3AlC
80.021.2195.941.81Bal.Fe
Table 5. Equilibrium composition (wt.%) at 773 °C calculated using Thermo-CalcTM.
PhaseAlMnFeC
Al11Mn457.4035.896.620.09
FeAl3 (θ)57.057.6735.140.14
Fe2Al5 (η)54.710.3244.90.07

