
Metakaolin-Based Geopolymer with Added TiO2 Particles: Physicomechanical Characteristics


1
Composites Materials Group (CENM), School of Materials Engineering Universidad del Valle, Cali 76001, Colombia
2
Department of Civil and Industrial Engineering, Pontificia Universidad Javeriana, Cali 760031, Colombia
*
Author to whom correspondence should be addressed.
Coatings 2017, 7(12), 233; https://doi.org/10.3390/coatings7120233
Submission received: 26 October 2017
/
Revised: 2 December 2017
/
Accepted: 12 December 2017
/
Published: 15 December 2017
(This article belongs to the Special Issue Advanced Coatings for Buildings)
Abstract
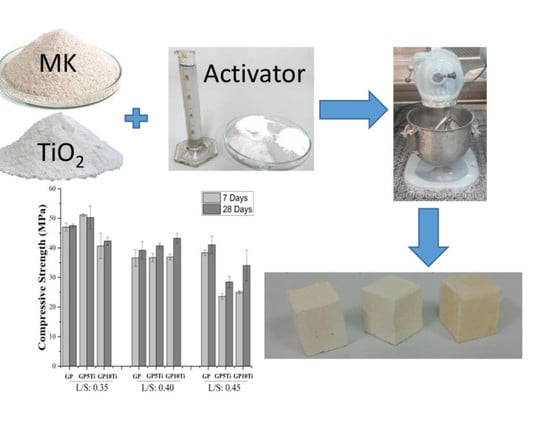
:The effect of the TiO2 addition on the physicomechanical properties of a geopolymer system based on metakaolin (MK) and hydroxide and potassium silicate as activators is presented in this article. Three different liquid-solid systems (0.35, 0.40, and 0.45) and two titanium additions were investigated (5% and 10% of the cement content). The flowability, setting time, and mechanical strength of the geopolymer mixtures and their microstructural characteristics were evaluated using techniques such as X-ray diffraction (XRD), Fourier transform infrared spectroscopy (FTIR), and scanning electron microscopy (SEM). It was concluded that a percentage of up to 10% TiO2 does not affect the mechanical properties of the geopolymer, although it does reduce the fluidity and setting times of the mixture.
1. Introduction
Population growth and the consequent demand of more infrastructure have increased the consumption of ordinary Portland cement (OPC), which is the main cementitious material in concrete technology. In spite of the benefits of concrete, there are several factors, such as high energy consumption, high CO2 emissions, and limited limestone reserves that have led to the reconsideration of the use of this material [1]. Owing to the above, measures have been taken both to improve the production processes of Portland cement, via the use of alternative fuels and different sources of raw materials to develop new cementitious materials that equal or exceed the properties of Portland cement and, in turn, exhibit better environmental performance. Geopolymers have been considered as an alternative at a global level; they are considered to be the third generation of cement, after lime and OPC. It is estimated that, depending of the precursors and activators, the production of geopolymers results in ~70% less greenhouse gas emissions than the production of cement, which makes some geopolymers environmentally friendly [2,3,4].
Geopolymers are obtained from the optimum blend of a material, mineral or industrial by-product based on SiO2 and Al2O3 (precursors) with a chemical agent (alkaline activator), which, through a series of reactions at low temperature (<100 °C), leads to the formation of a product with cementitious characteristics [5]. The main criterion for the stable development of a geopolymer is that the source of the aluminosilicate material is highly amorphous and contains sufficient reactive glass content. The main alkaline activators used are sodium hydroxide (NaOH), potassium hydroxide (KOH), sodium silicate (Na2SiO3), and potassium silicate (K2SiO3). Compared with NaOH, KOH exhibits a higher degree of alkalinity; however, it has been reported that NaOH has a greater ability to separate the monomers of silicates and aluminates in the phase of dissolution of the precursor [5]. Geopolymer cements are considered materials that can replace Portland cement owing to properties such as high resistance at early ages, resistance to chemical attack, low thermal and acoustic conductivity, and high temperature and fire resistance; these properties, depending of the type of raw materials and mix formulation of the geopolymer, can be similar, or even superior, to those of traditional Portland cement.
As in the case of Portland cement, the addition of nanoparticles to geopolymers has focused on improving the mechanical properties. For example, Assaedi et al. added SiO2 nanoparticles in a proportion of up to 3 wt % to a fly ash-based geopolymer, finding that the addition of these materials improved the mechanical performance of the material by 27%, while decreasing the porosity and water absorption [6]. Riahi and Nazari synthesized geopolymers from rice husk ash and fly ash, to which SiO2 and Al2O3 nanoparticles were added; they also obtained an improvement in the mechanical properties of the material [7]. However, the best performance was for the samples with added nano-silica, owing to their greater amorphous character, unlike the alumina nanoparticles, which, because they were crystalline, did not participate in the process of geopolymerization [7]. Recently, Duan et al. developed geopolymers from fly ash, focusing on the mechanical performance and durability to carbonation when nano-titanium oxide (TiO2) particles were added; the authors reported that the addition of these up to 5 wt % improves the mechanical properties and durability and attributed this behaviour to pore refinement and densification of the geopolymer microstructure [8]. Similarly, Yang et al. studied the mechanical and physical behaviour of an alkaline activated slag to which TiO2 nanoparticles were added at 0.5 wt % and reported a decrease in porosity and material shrinkage; in addition, the material was densified and had a greater resistance to compression [9]. On the other hand, Zhang et al. evaluated the effect of adding titanium dioxide and hollow glass microspheres to a geopolymer coating from metakaolin (MK) on the geopolymer’s optical and thermal properties [10]. The study found that by adding hollow glass microspheres at 6 wt % and titanium dioxide based on the cementant at 12 wt %, increases of 12% and 90% of the thermal insulation and reflectivity, respectively. The authors attributed this behaviour to the pigment character of the titanium dioxide, for which the high coefficient of refraction enabled it to reflect wavelengths close to infrared and visible light [10].
In other studies that were not particularly focused on geopolymer materials, it has been found that nanoparticles of TiO2, because they are a semiconductor substance, are able to confer photocatalytic properties to the system to which they are added [11], and this results in self-cleaning and air-purifying properties, which is highly desirable for building materials.
Based on the above, the present article aims to evaluate the effect of the addition of TiO2 particles on the physical and mechanical behaviour of a geopolymer based on MK as a precursor. The variables considered are the liquid/solid ratio (L/S) of the system and the percentage by weight of TiO2 added. Properties in the fresh state, such as the setting time and flowability, and properties of the hardened state, such as the compressive strength, density, absorption, and porosity, are studied. The study is complemented with a microstructural analysis of the geopolymers using the X-ray diffraction (XRD), Fourier transform infrared spectroscopy (FTIR), and scanning electron microscopy (SEM) techniques. The contribution of the photocatalytic properties of TiO2 to the geopolymer, specifically its self-cleaning and algaecide properties, will be the object of future studies.
2. Materials and Experimental Methodology
2.1. Materials
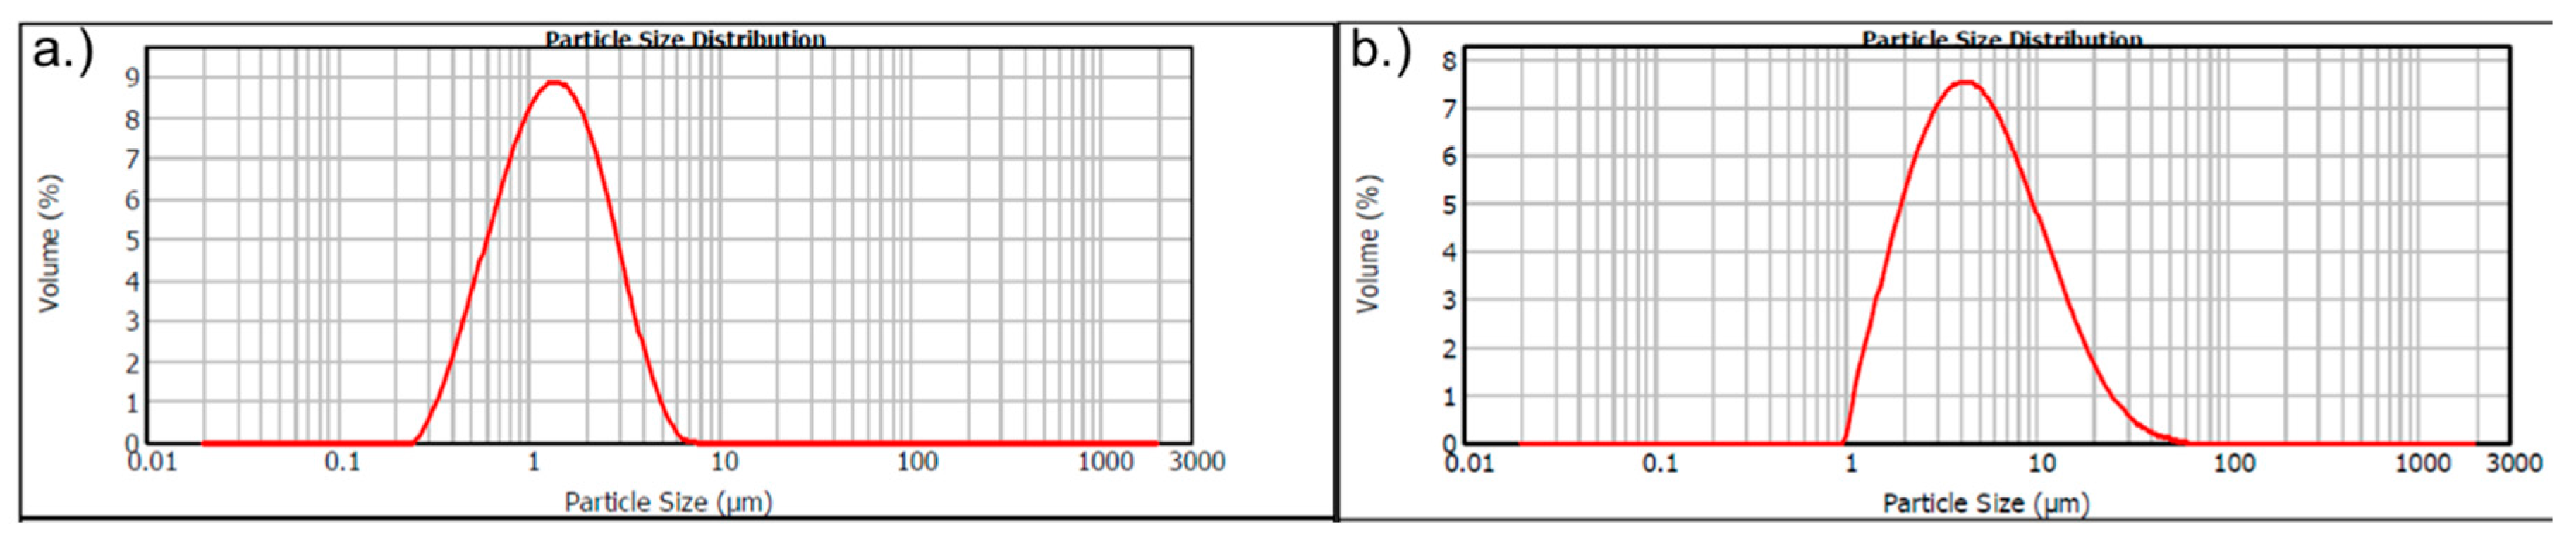
A high-purity commercial MK (Metamax BASF, Florham Park, NJ, USA) was used as the primary source or precursor in the production of the geopolymer material, whose chemical composition is presented in Table 1. The chemical composition was determined via X-ray fluorescence (XRF) using a Phillips MagiX-Pro PW 2440 spectrometer (PANalytical, Tollerton, UK) equipped with a Rhodium tube and a maximum power of 4 kW. The SiO2/Al2O3 molar ratio of the MK was 1.97. High-purity analytical titanium oxide (TiO2; Merck, reference 1008081000) was used as an additive. Particle size and distribution analysis was performed with a Mastersizer-2000 laser granulometer from Malvern Instruments (Malvern, UK) with a Hydro2000MU dispersion unit; distilled water was used as a dispersant medium. The mean particle sizes D (4,3) of the MK and titanium oxide were 6.57 and 1.59 μm, respectively (Figure 1).
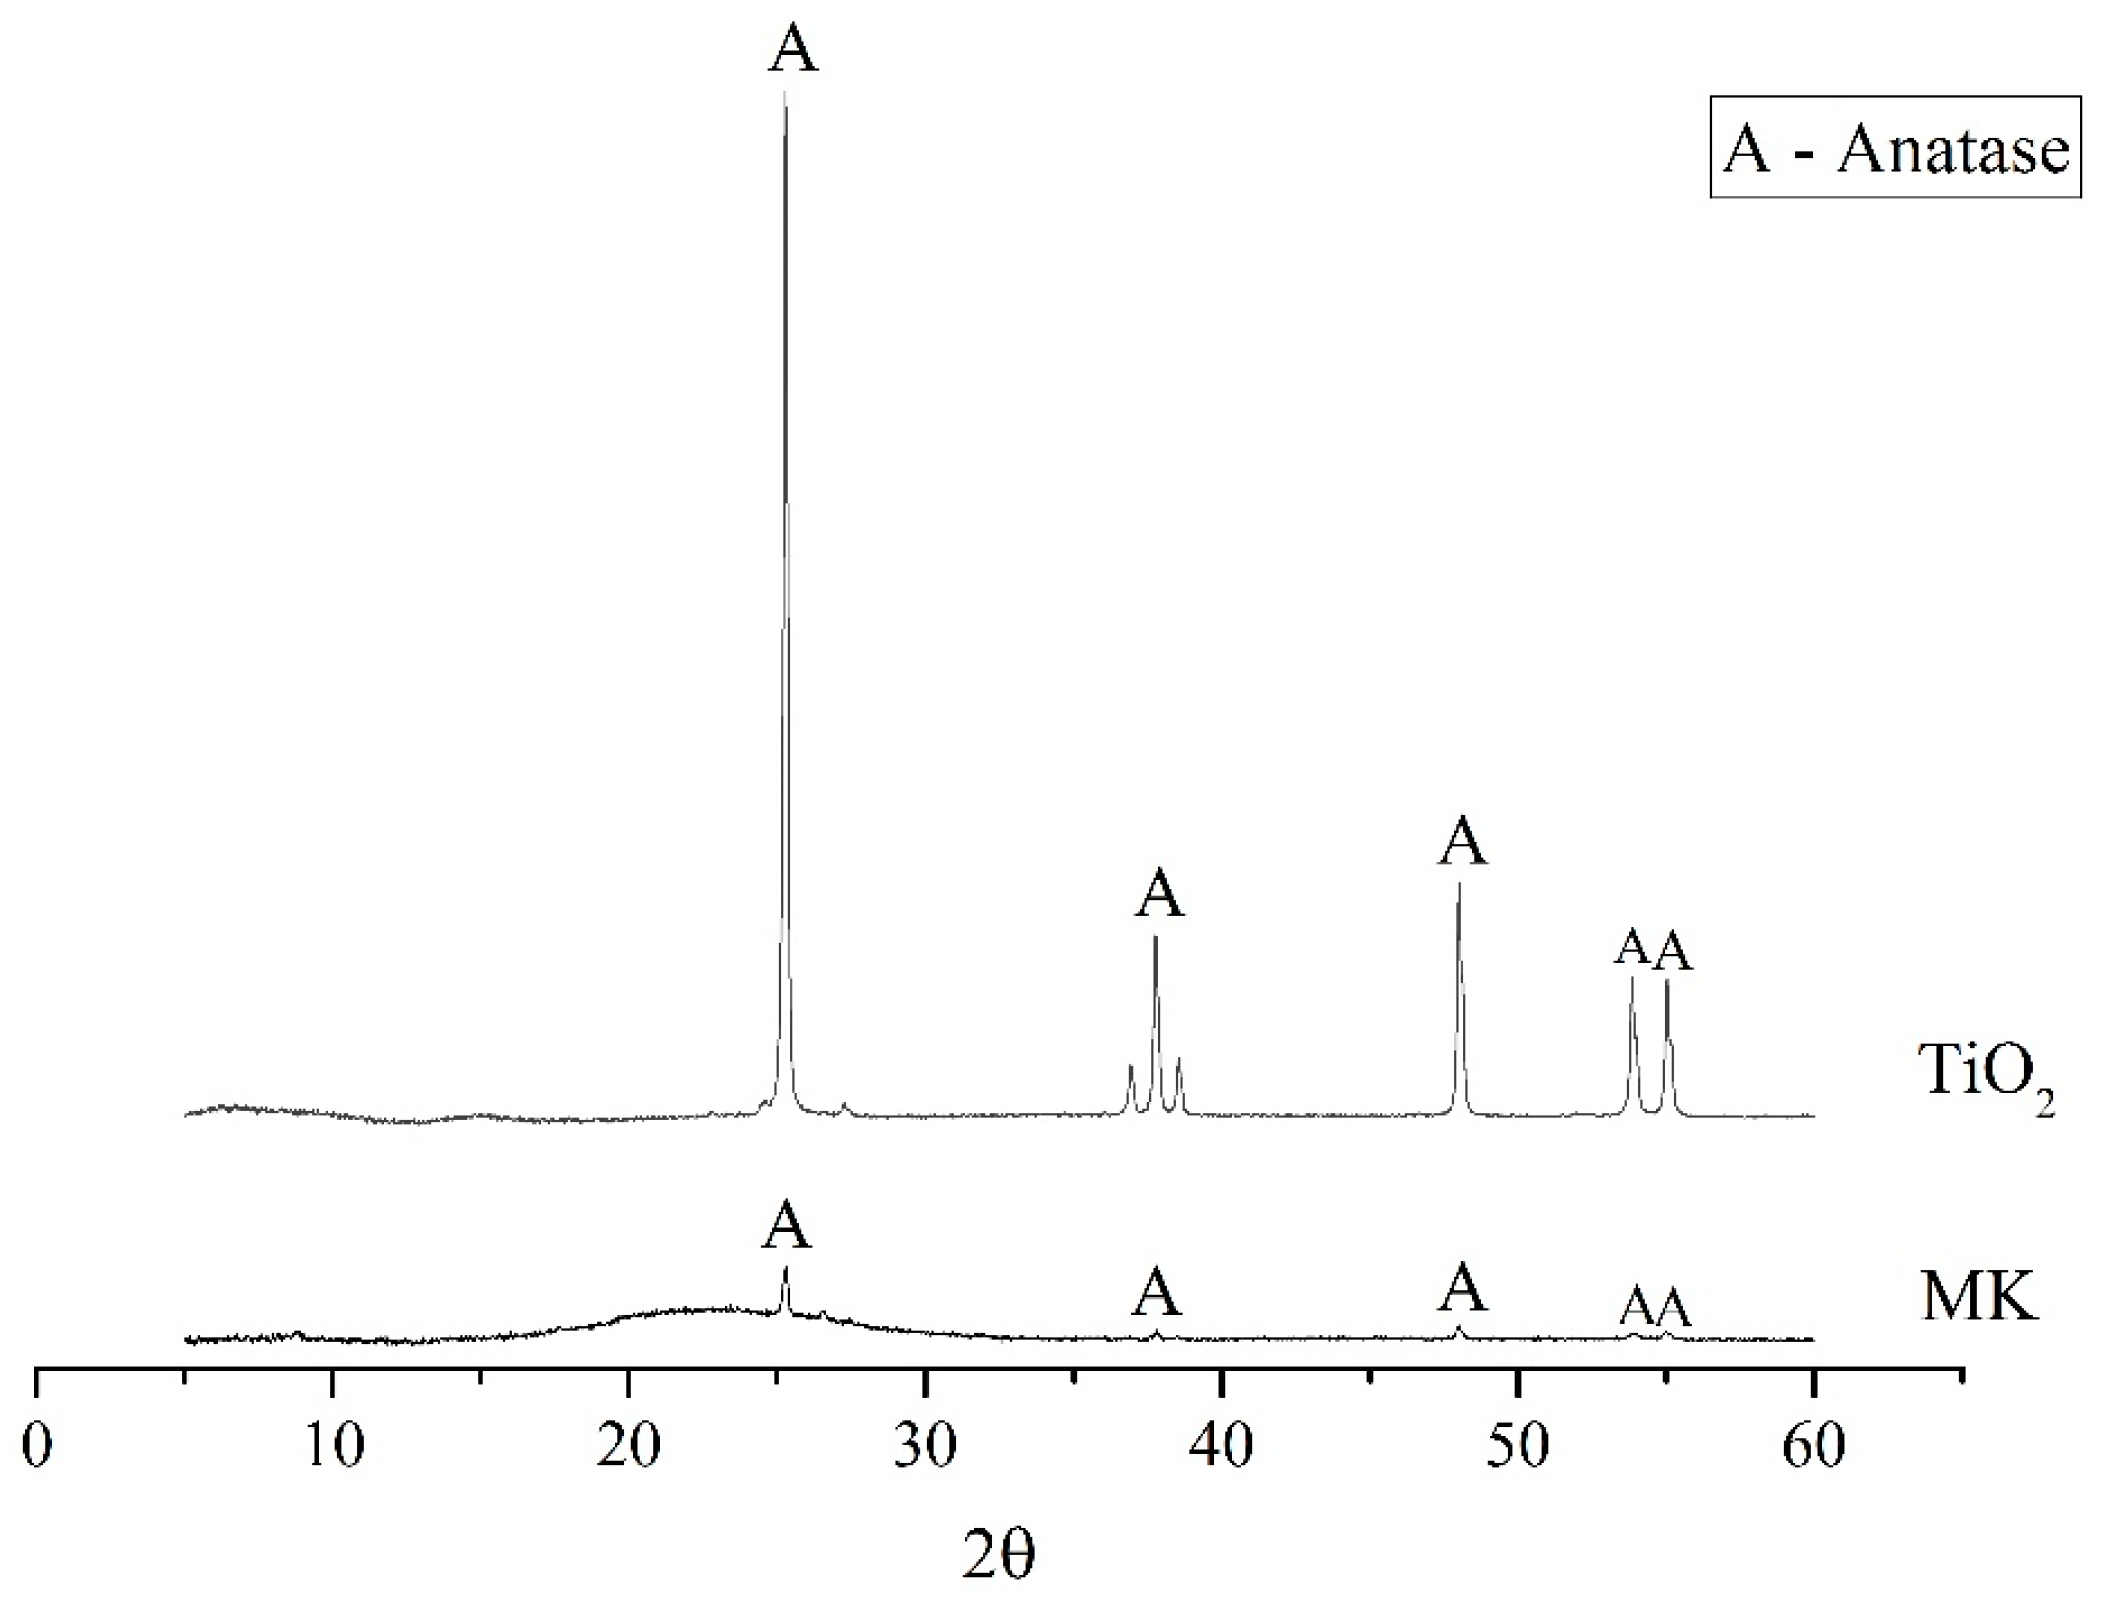
Figure 2 and Figure 3 show the XRD and FTIR results for MK and TiO2, respectively. For the XRD analysis, a Bruker diffractometer equipped with a wide-angle goniometer RINT2000 was used, using the Kα1 signal of Cu at 45 kV and 40 mA. A 0.02° pitch was used within a range of 5–70° at a rate of 5°/min. Information processing was performed using the X’pert HighScore Plus software package, version 2.2.5. FTIR spectroscopy was performed using a PerkinElmer Spectrum 100 spectrometer (Perkin Elmer, Shelton, United States) in transmittance mode in the frequency range of 450–4000 cm−1. Samples were prepared using the KBr compressed method. In Figure 2, it can be observed that MK has a high level of amorphicity due to the halo located in the range between 20 and 30° 2θ and presents small traces of a crystalline product identified as anatase (reference pattern 01-078-2486), which corresponds to the observed peaks at approximately 25°, 38°, 48°, 55°, and 63° 2θ. This coincides with the percentage of TiO2 reported in the chemical composition of MK (Table 1). There is also evidence that the TiO2 used is in the anatase phase, which is an important phase because of its photocatalytic potential [11]. In the FTIR spectrum (Figure 3) of the MK, a band at approximately 3437 cm−1 is observed; this corresponds to the asymmetric vibration of OH–groups. At 1089 cm−1, a Si–O–Al vibrational peak is observed, which corroborates the aluminosilicate character of this raw material. The peaks at 814 and 473 cm−1 are attributed to the amorphous Al–O stretching vibration and Si–O–Si flexion, respectively [12]. On the other hand, the FTIR spectrum obtained for TiO2 indicates the presence of peaks near 3430 and 1632 cm−1, which correspond to vibration via stretching of the –OH bonds and vibration via deformation of the bonds in adsorbed surface water molecules, respectively. The peak located near 687 cm−1 is characteristic of the Ti–O–Ti stretching of the anatase phase, thus confirming the presence of these photoactive species [13].
2.2. Preparation of Geopolymeric Mixtures
The geopolymeric materials (GP) were prepared using the molar ratios SiO2/Al2O3 = 2.5 and K2O/SiO2 = 0.28 based on results from previous research [14]. A potassium hydroxide (KOH) analytical-grade reagent and commercial potassium silicate (K2SiO3) distributed by Pan American Chemicals (SiO2 = 26.38%, K2O = 13.06%, H2O = 60.56%) were dosed to obtain the activator solution module (Ms: SiO2/K2O = 0.76) required in the geopolymer mixture. The percentage of addition of TiO2 as a function of the cementant was varied in three levels, 0 wt %, 5 wt % and 10 wt %. The liquid/solid ratio (L/S) was also varied in three levels, 0.35 (dry consistency), 0.40 (mean consistency), and 0.45 (fluid consistency). In total, nine mixtures per system were made, each with two repetitions, for a total of 18 mixtures. Table 2 presents the blend specifications employed in this research.
The mixing process of the solid components (MK and titanium dioxide) and liquids (activator) was performed in a HOBART Vulcan 1249 mixer. The solids were homogenized for 15 s, and the activating solution (KOH + K2SiO3) was added and mixed for 3 min at low speed, followed by 2 min at medium speed and, finally, 1 min at low speed until a homogeneous paste was obtained. The geopolymeric paste was then casted into cubic silicone moulds of dimensions 20 mm × 20 mm × 20 mm. The obtained samples were cured at room temperature (25 °C) for 24 h and then demoulded and taken to a humidity chamber (relative humidity >90% and 25 °C) until the test age was reached (seven and 28 days).
2.3. Physical and Mechanical Properties
In fresh conditions, the setting time and fluidity were determined. The setting time was determined using a Vicat needle, following ASTM C191. The fluidity was measured following the procedures described in ASTM C230. A modification to the test was that a cone of smaller volume or minislump with dimensions of 57 mm (high) × 38.20 mm (diameter) was employed on the flow table prior to the 25 strokes standardized in the guidelines. The flow diameters reported were measured using a digital caliper.
In the hardened state, the compressive strength was evaluated at ages of seven and 28 days using an INSTRON 3369 universal test machine with a capacity of 50 kN at a deformation rate of 1 mm/min. In each case, a minimum of three specimens were tested. The density, pore volume, and water absorption capacity of each material were also determined following the procedures detailed in ASTM C642-13. It should be noted that the drying of the sample was performed at 60 °C for 48 h.
2.4. Microstructural Analysis
The following techniques were used for the microstructural study of the blends: Electron microscopy, FTIR, and XRD. A JEOL scanning electron microscope (JSM-6490LV, high vacuum of 3 × 10⁻⁶ Torr, Peabody, MA, USA) was employed. The equipment has an INCAPentaFETx3 Brand Oxford Instruments model 7573 detector. The samples were metalized with gold in a Denton Vacuum Desk IV tank.
3. Results and Discussion
3.1. Fluidity and Setting Time
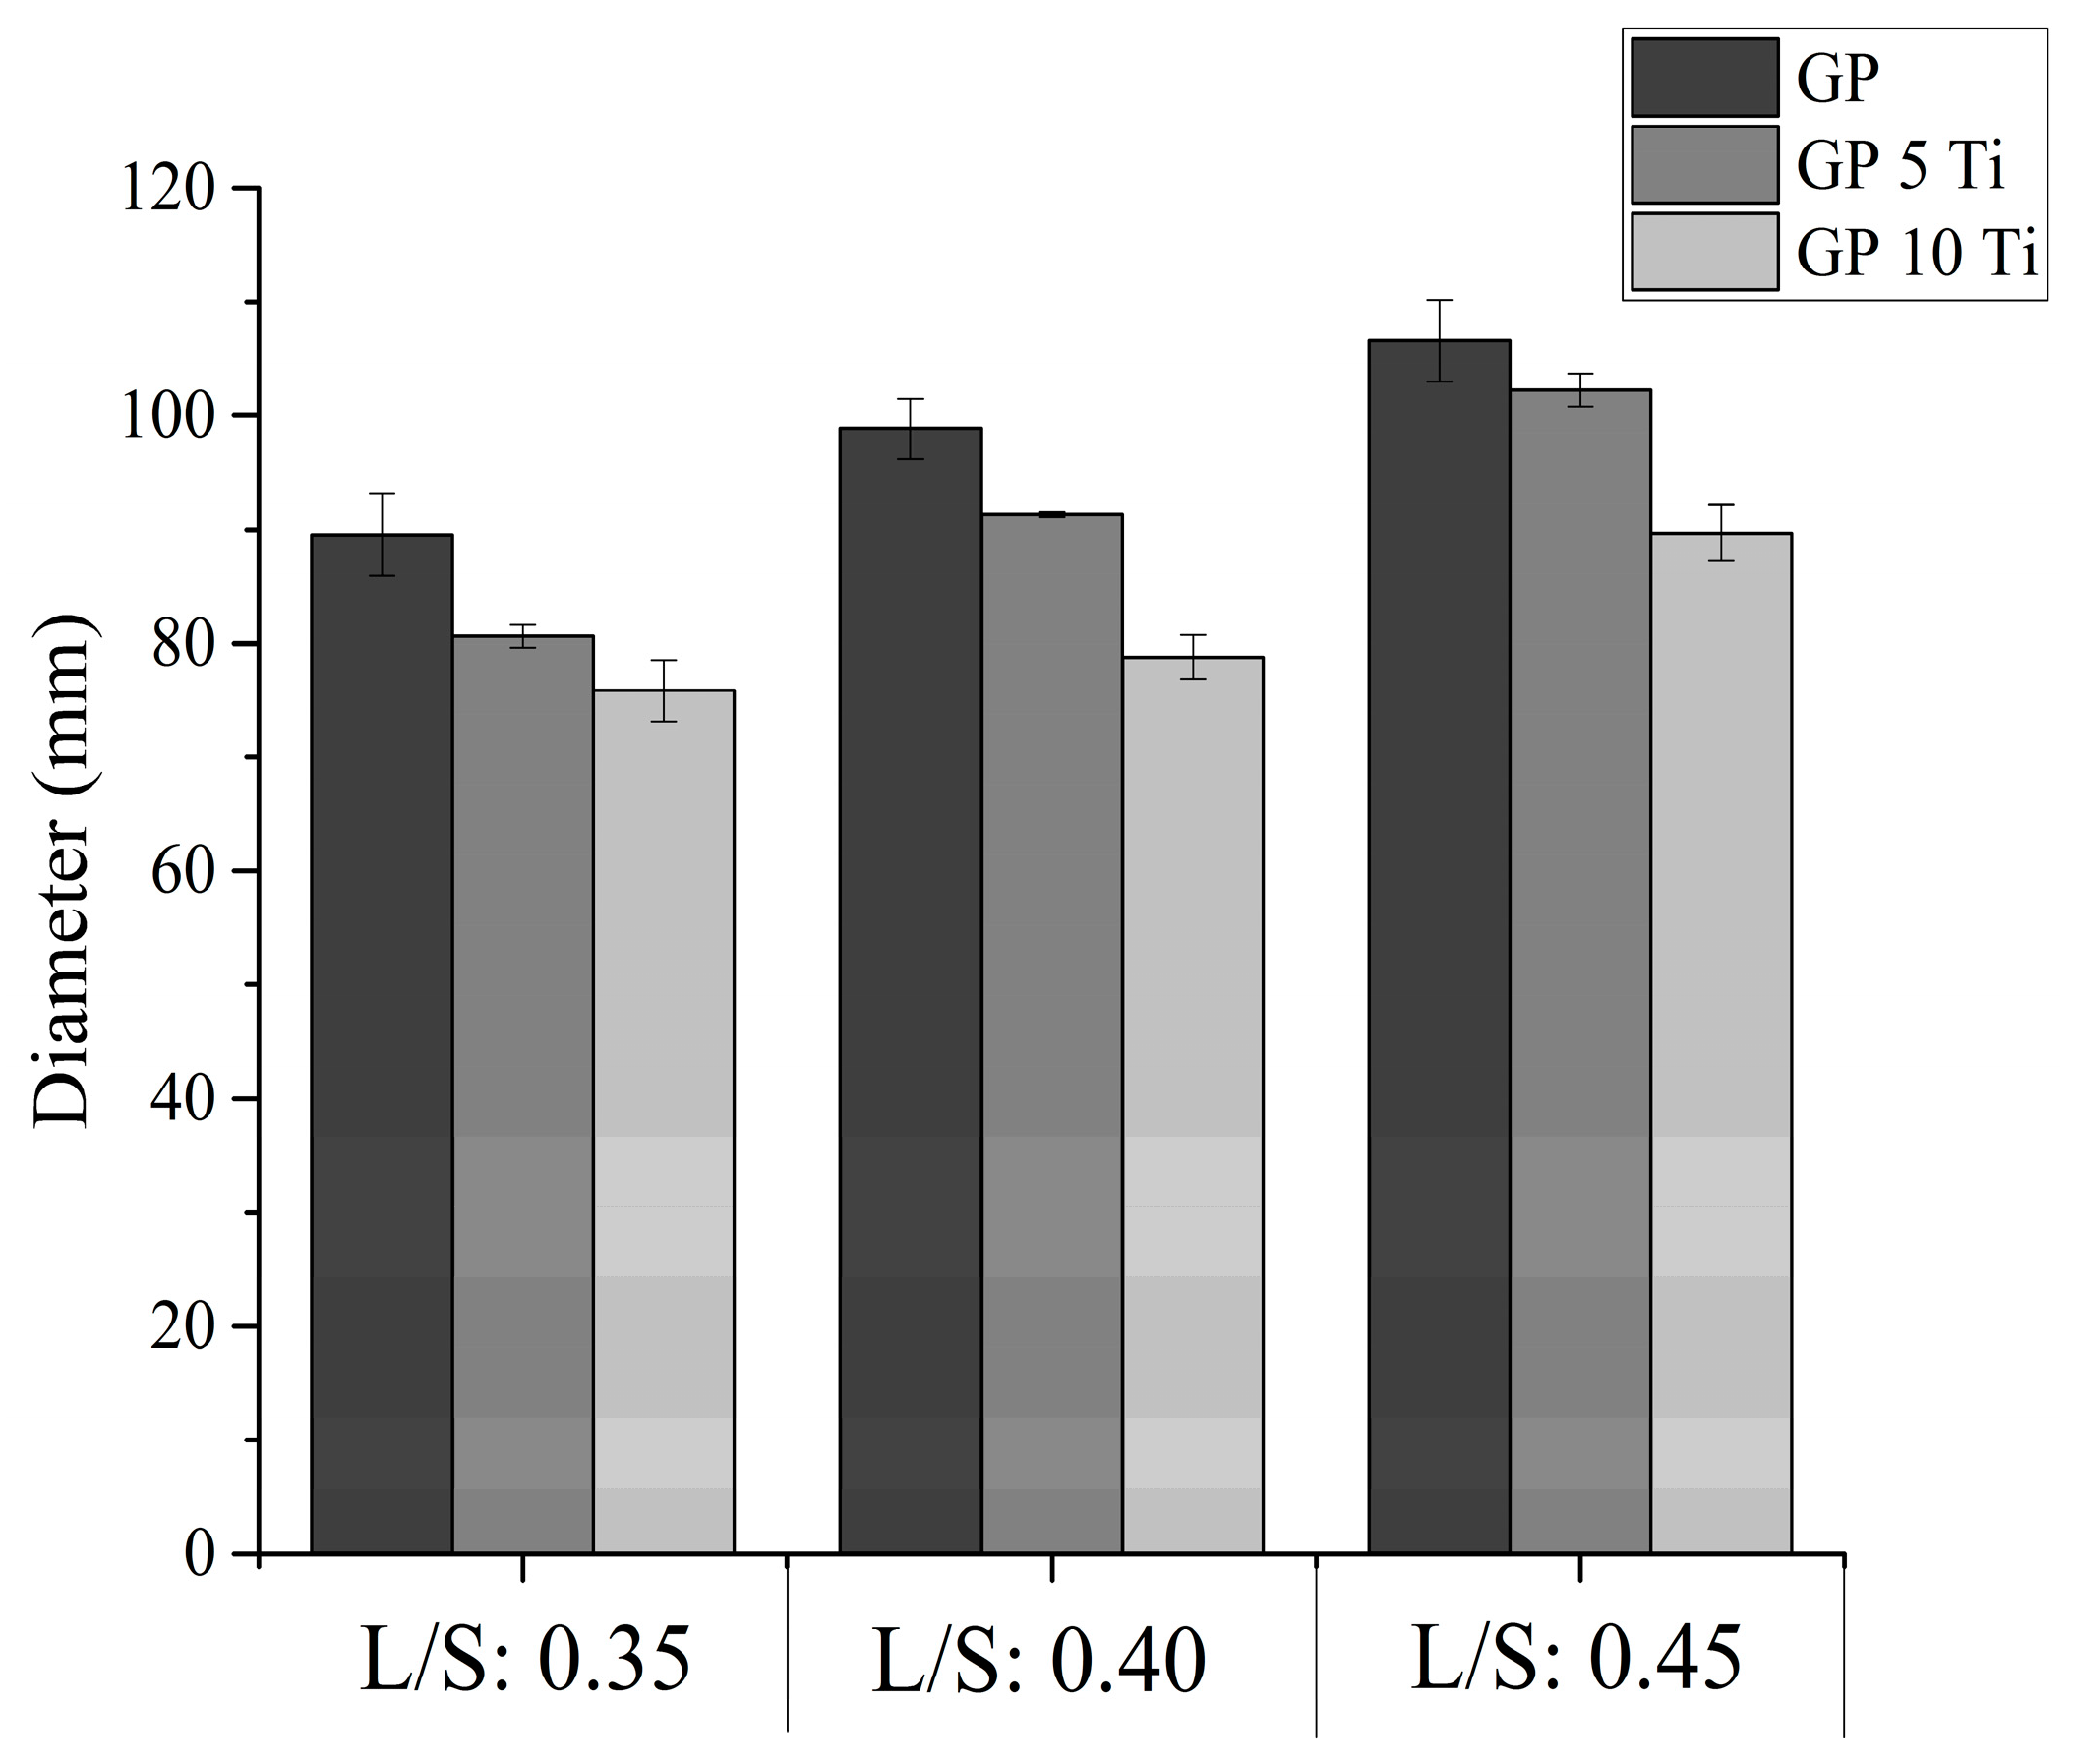
Figure 4 shows the diameters measured after subjecting the different systems evaluated to the flow table test. As expected, as the L/S ratio of the system was increased, the fluidity increased, regardless of the TiO2 content. However, in all cases, the samples with no TiO2 addition had a higher fluidity percentage. For a fixed L/S ratio, increased TiO2 content reduced the workability of the samples; using 10 wt % with respect to the cement decreased the fluidity by as much as 30.13%. Duan et al. found similar results when measuring flowability in fly ash geopolymer mortars and reported that the addition of 3% and 5% TiO2 nanoparticles decreased the fluidity of the material by factors of 21.86% and 31.12%, respectively [8].
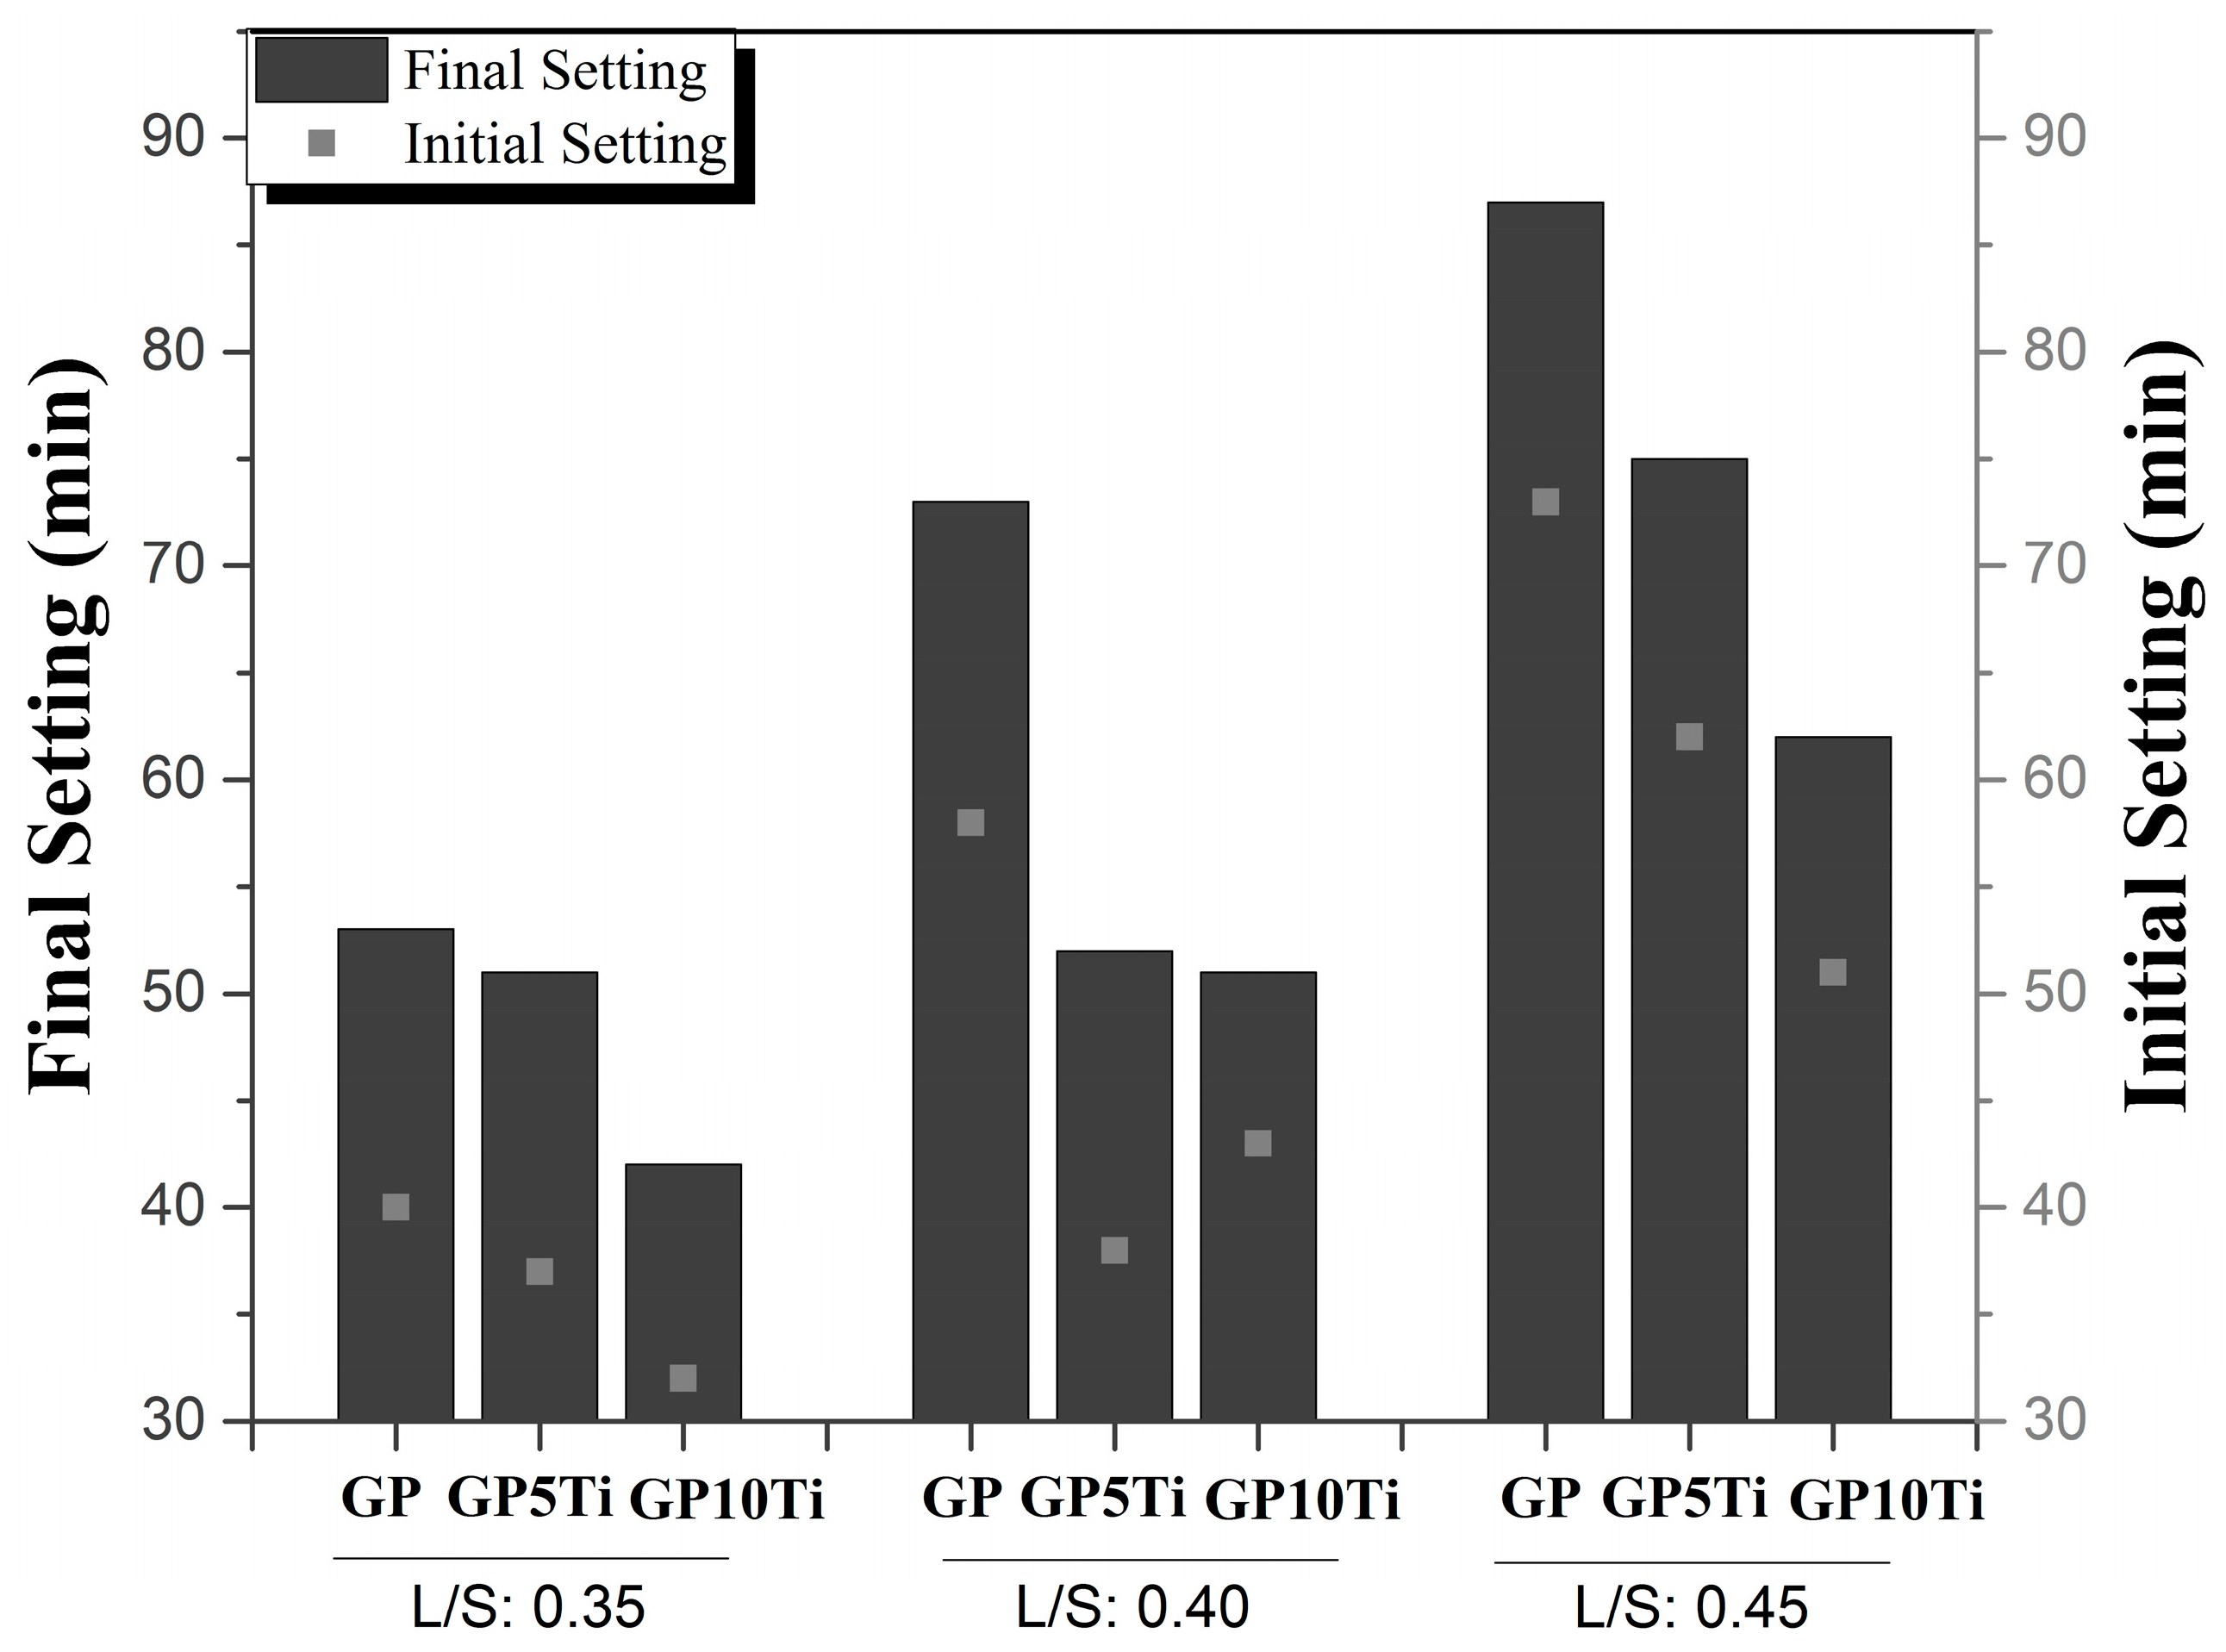
Figure 5 shows the effect of the TiO2 additions on the setting time. It is evident that both the higher liquid content (L/S ratio) and the addition of TiO2 particles affect the setting time, although their effects have opposite signs. By increasing the percentage of addition up to 10 wt % TiO2 particles, the setting time was decreased by 20.7%, 31.1%, and 27.6% for the dry, medium, and fluid consistency materials, respectively. The reduction of the setting time of the geopolymers with addition of TiO2, at a constant L/S ratio, can be attributed to a nucleation and filling effect that contributes to accelerate the degree of reaction of the geopolymer. It is also evident that, by increasing the mixing water content, the concentration of ions in the aqueous solution decreases, decreasing the gel formation process, in addition to leading to a greater availability of water in the system to be evaporated for the formation of the consolidated structure, which is reflected in an increase in the setting time [15].
3.2. Physical and Mechanical Properties
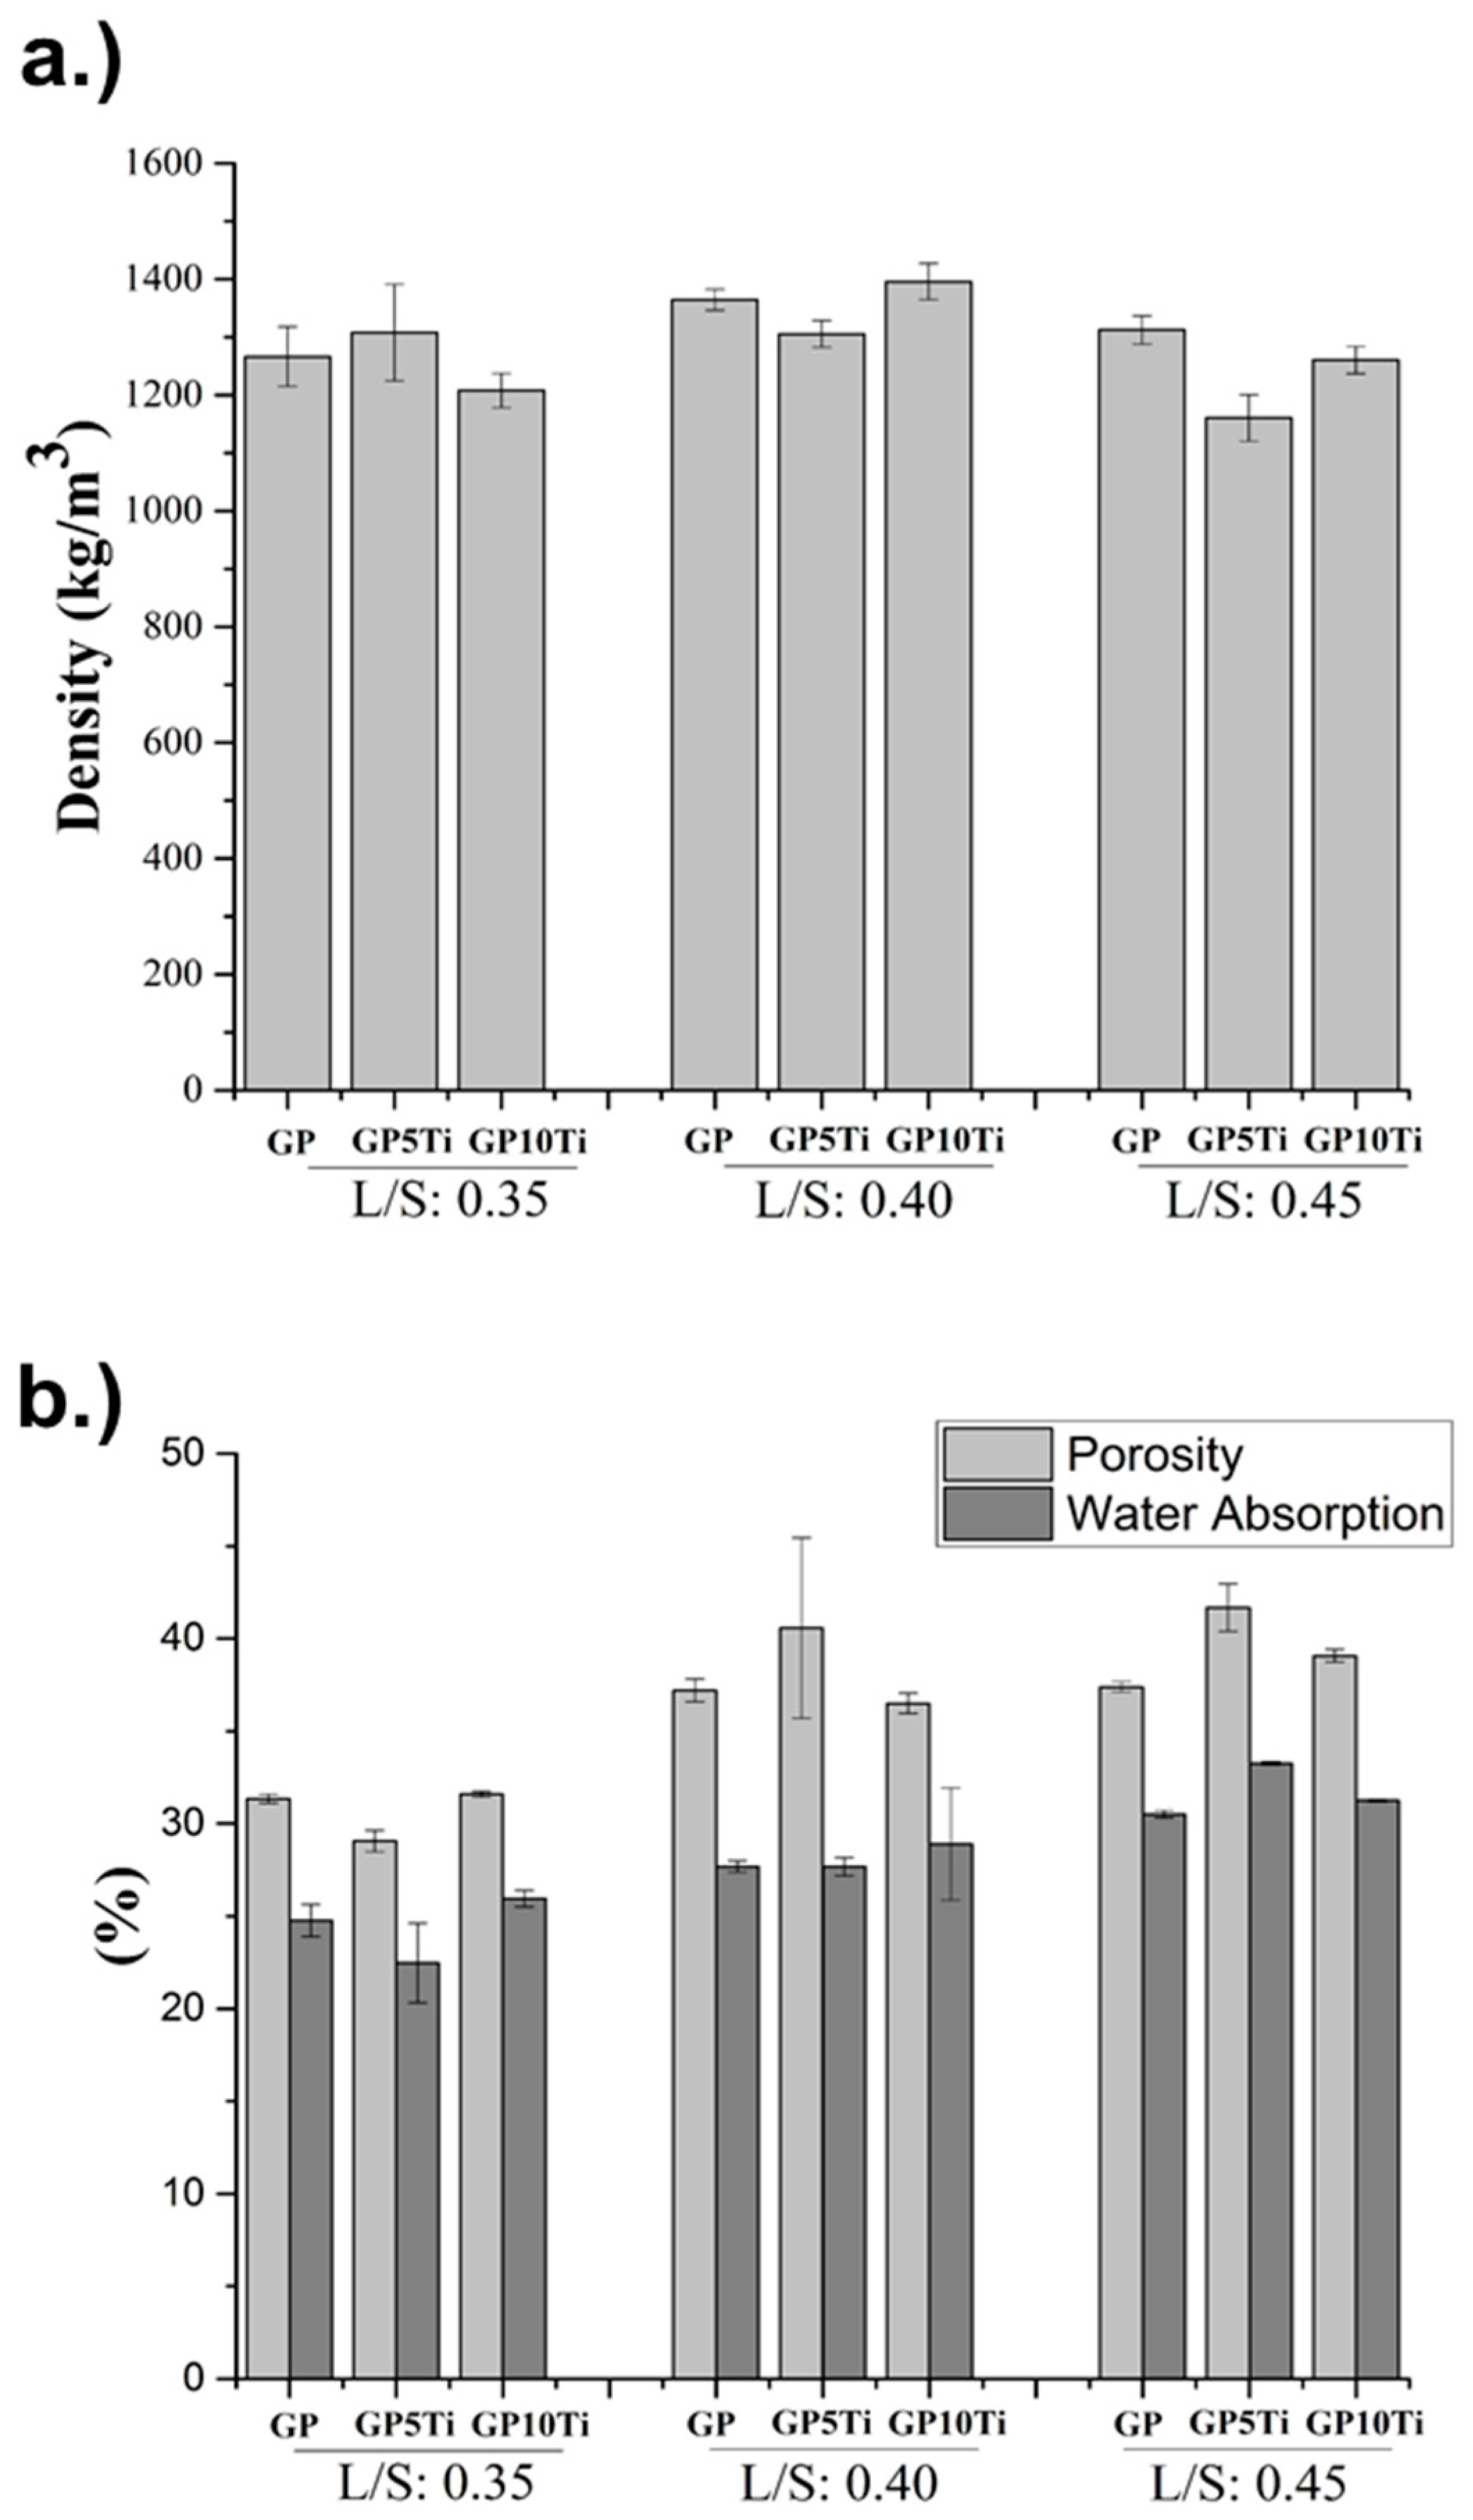
The obtained results regarding density, absorption, and porosity for the different mixtures can be observed in Figure 6a,b, and those of mechanical resistance to compression are presented in Figure 7. In general, the density fluctuated between 1230 and 1376 kg/m3, with no significant dependence on the L/S or the percentage of added TiO2 observed (Figure 6a). The results obtained for the density are in accordance with those reported by Liew et al. who evaluated the effect of using different L/S ratios on the density of geopolymers based on MK and found that the system of medium consistency had the highest density, followed by the more fluid system and, finally, the drier one [16]. The authors concluded that increased liquid content can promote the speed of dissolution of the Al and Si species of the precursor, but it obstructs the processes of polycondensation; in contrast, a small amount of liquid does not favour dissolution and, therefore, generates increased viscosity [16]. Zuhua et al. also evaluated the role of water in the geopolymerization of materials based on MK using the calorimetry technique, noting that increased water reduced the rate of geopolymerization owing to the lower concentration of ions present in the dissolution processes; they also mentioned that water promotes hydrolysis processes, but decreases the rate of polycondensation [15].
In general, an increased proportion of liquid adversely affects the permeable pore content of the blends (Figure 6b). This higher pore volume for the higher L/S ratio (0.45) is related to the lower mechanical performance of these mixtures. It was observed that the addition of TiO2 particles decreased the pore volume for materials with lower water content or dry consistency (L/S = 0.35), particularly when 5 wt % (GP5Ti) was added, coinciding with increased mechanical strength (Figure 7). This result seems to indicate that the addition of TiO2 particles contributes to a better mechanical performance; however, there is an optimum concentration of TiO2, so in the presence of an excess of the particles, these will act as filler [17].
Of the different mixtures evaluated, those with the lowest water content (L/S = 0.35) presented higher mechanical performance. Among them, that with 5 wt % TiO2 added exhibited the most superior resistance, a 5.8% increase (50.27 MPa) after 28 days of curing, relative to the reference (GP); however, adding 10 wt % TiO2 yielded the opposite effect, possibly due to the low availability of liquid to hydrate the particles and promote the formation of reaction products, taking into account that there is a greater presence of non-reactive TiO2 particles coexisting in the gel. In contrast, for the materials with L/S = 0.4, it was found that the highest strength was achieved by adding 10 wt % TiO2 (43.25 MPa), yielding a strength 10.3% greater than that of the reference. This effect is attributed to the TiO2 particles having a smaller particle size than the precursor and behaving as nucleation points that enhance the formation of reaction products [17].
3.3. Characterization of the Geopolymer Microstructure
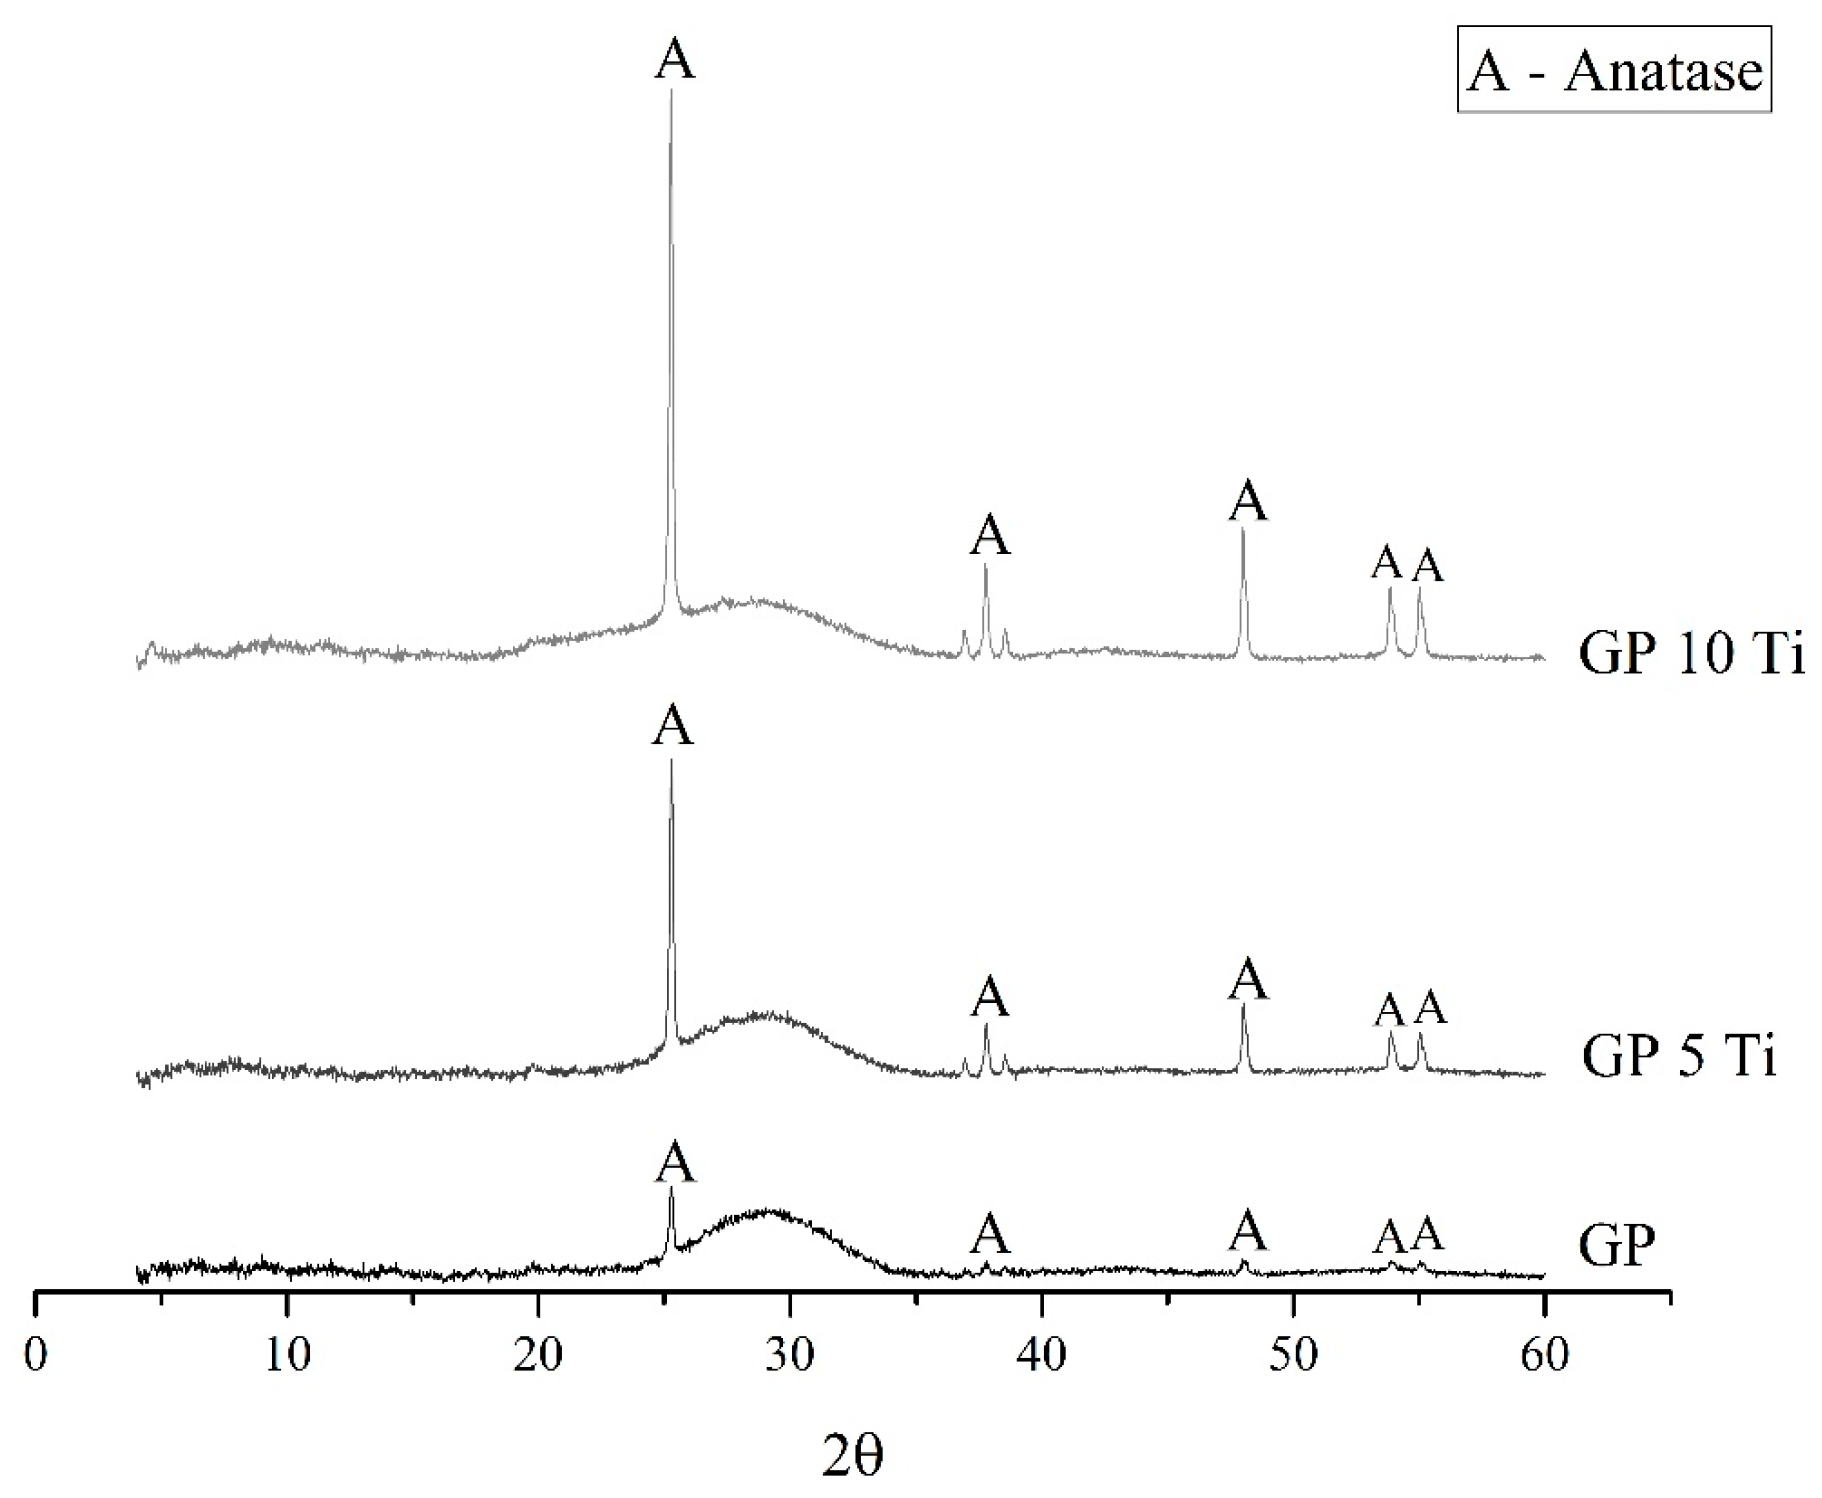
Figure 8 shows the XRD patterns obtained for the evaluated geopolymer systems. Compared with the MK precursor diffractogram (Figure 2), an amorphous halo between 25° and 35° can be observed in all cases, which corresponds to the aluminosilicate gel that forms the fundamental binder phase of the geopolymer matrix (KASH) and is responsible for the resistance of the geopolymer [18]. Likewise, the presence of the crystalline phase of the precursor is observed in the GP, which increases with the addition of TiO2 in the material owing to its contribution.
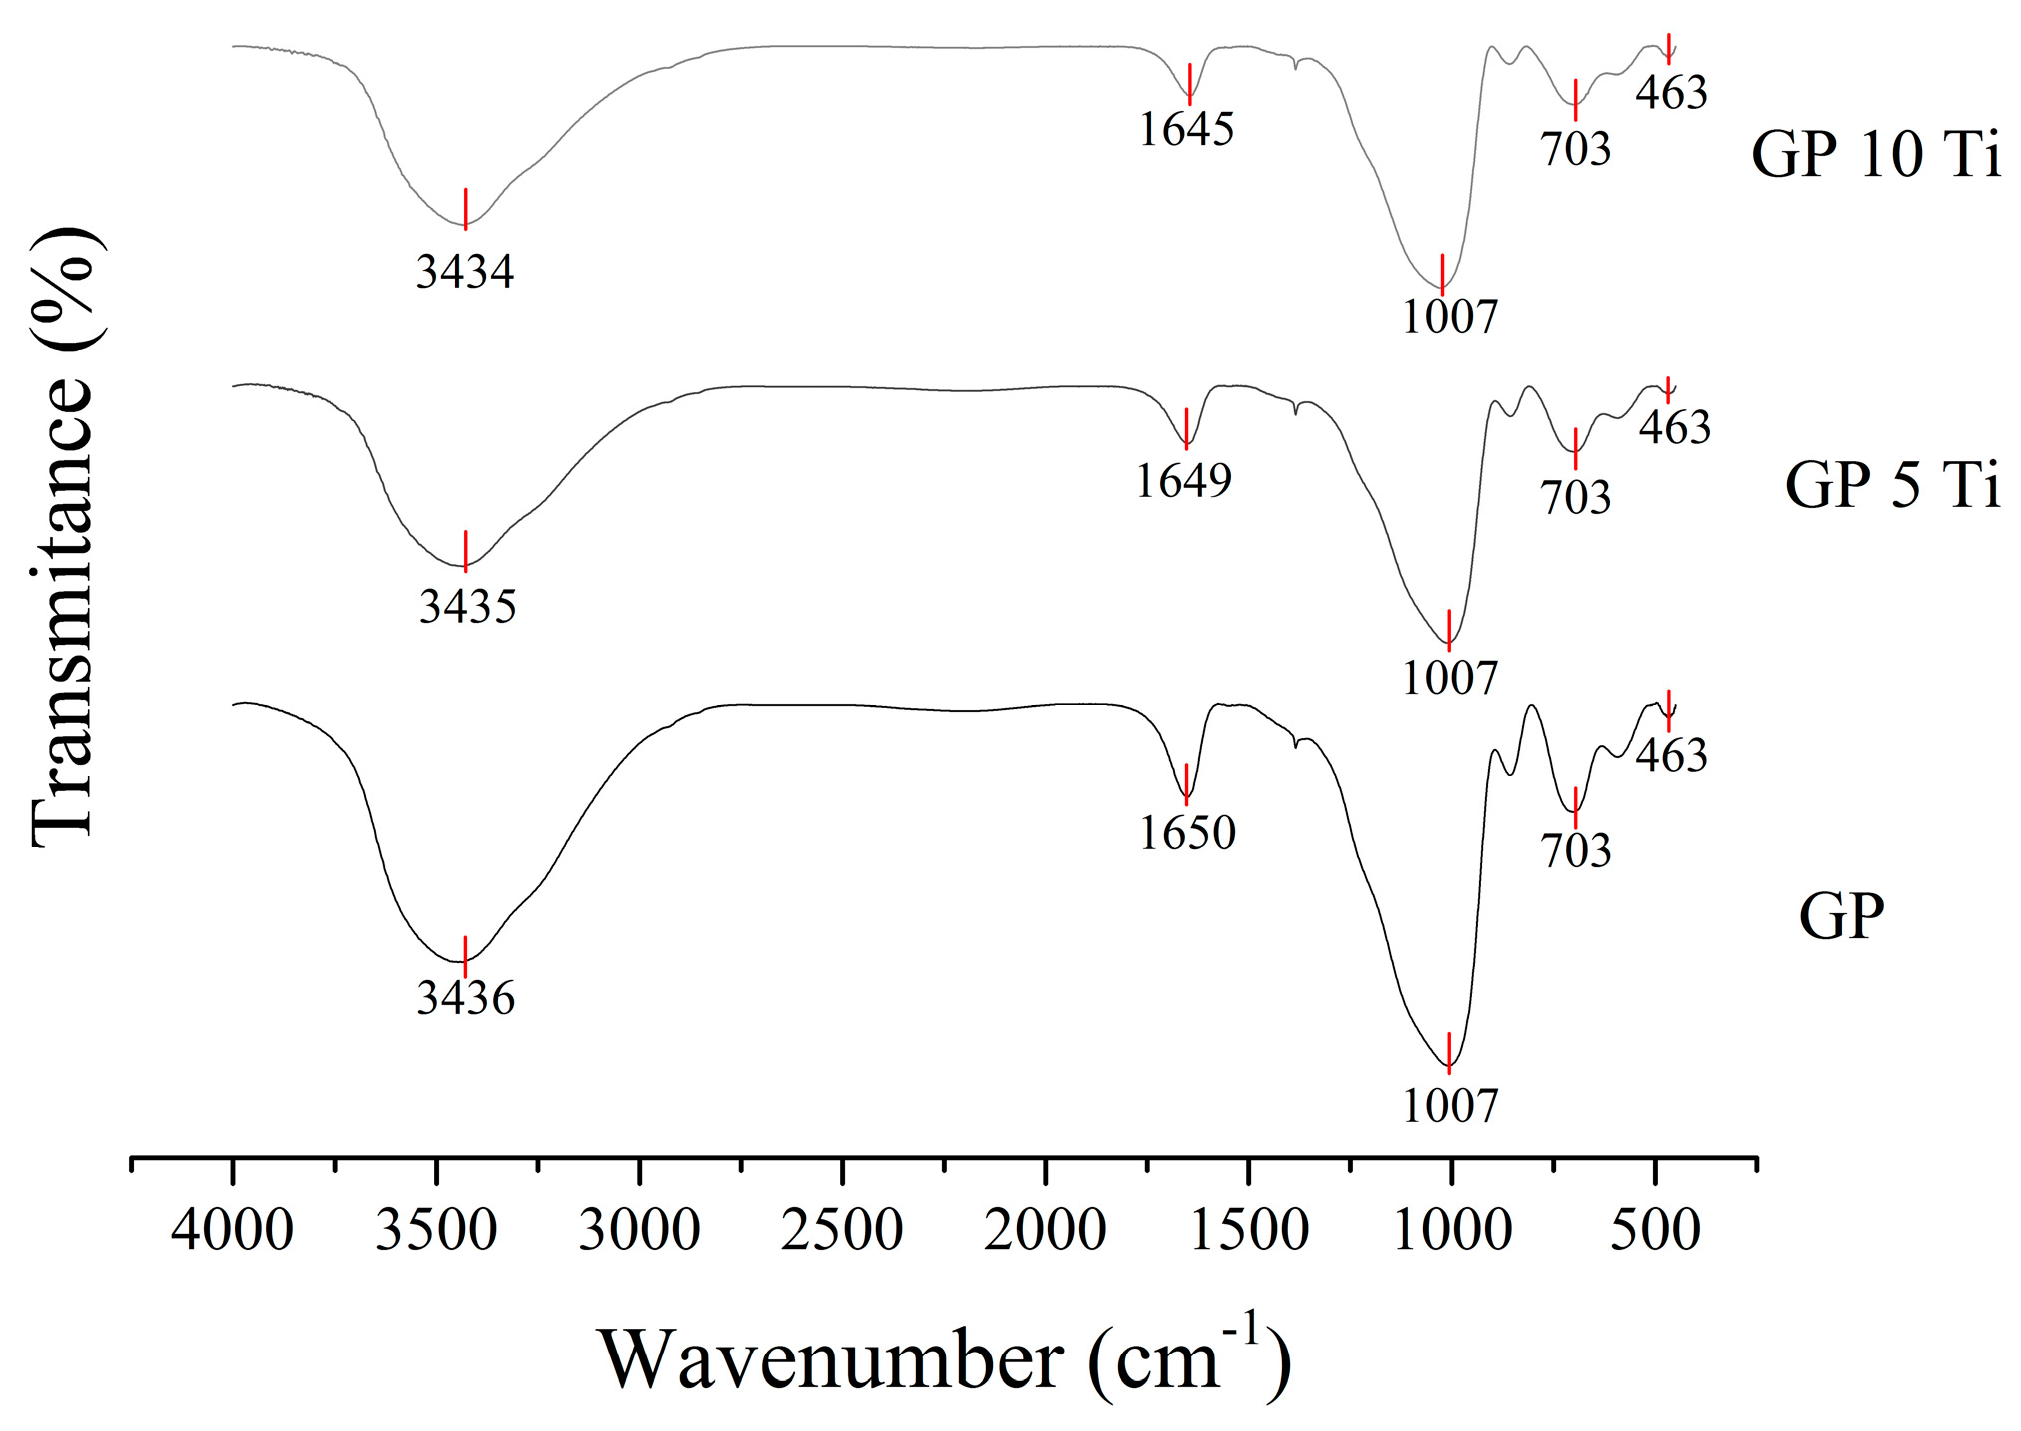
The FTIR spectra of the synthesized geopolymers are shown in Figure 9, in which no large differences between the non-added and those with 5 wt % and 10 wt % TiO2 added are observed. The presence of bands characteristic of precursor materials (Figure 4), in addition to the displacement of the one located at 1089 cm−1 in MK to 1007 cm−1 due to the asymmetric stretching of the Si–O–T band (T is a tetrahedron of Al or Si) in KASH gels and a band at 463 cm−1 corresponding to a lower Si–O–Si band intensity due to the reaction of MK for KASH gel formation, can be observed. The band located at approximately 703 cm−1 verifies the presence of Ti–O–Ti photoactive species, and it also generates overlap with amorphous Al–O bands, in addition to exhibiting a decrease in its intensity due to gel formation. When comparing these spectra with the MK FTIR spectrum (Figure 3), it is important to highlight the displacement at higher frequencies in the 3436 and 1650 cm−1 bands, which correspond to OH– and HOH group vibrations, suggesting increased hydrophobicity of the material as a result of the increased TiO2 additive content [19].
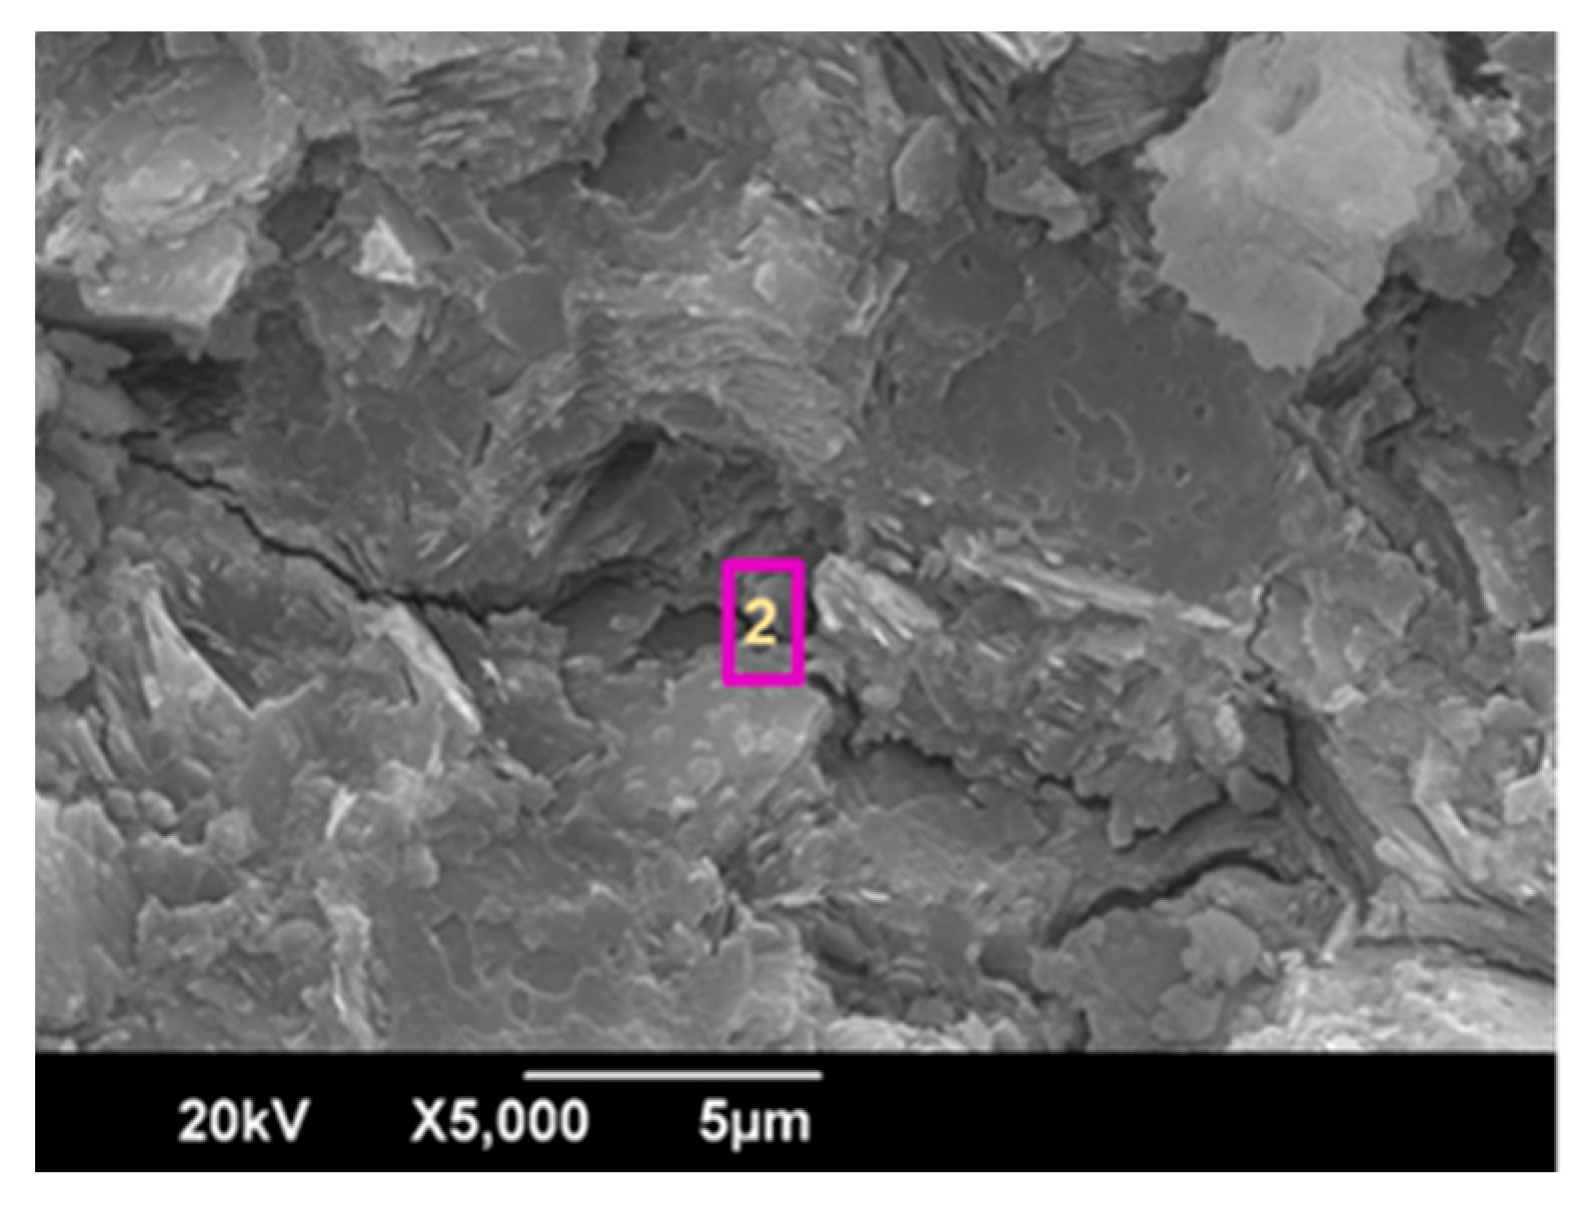
The surface morphologies of the GP and GP10Ti geopolymers at seven and 28 days of curing evaluated by SEM and the corresponding EDS analysis results are shown in Figure 10 and Figure 11, and the compositions of elements present at the evaluated points are presented in Table 3 and Table 4. In general, all samples had a compact and continuous structure with small traces of unreacted MK, which is characterized by preservation of its lamellar structure in layers, mainly for the earliest age of curing; this behaviour was verified via EDS when performing the measurement at point 1 of Figure 10a, in which only high contents of O, Al, and Si, and lower proportions of K, were identified. By increasing the curing age, a greater gel formation is observed in the structure that is identified in the micrographs due to its dark tone, in addition to a lower presence of unreacted MK; in addition, the presence of O, Al, Si, and K is evidenced by the measurement of EDS at point 2 of Figure 10b, suggesting adequate KASH gel formation. It is noteworthy that there is no significant difference between the morphologies of the systems with and without TiO2, but the EDS measurements at point 2 of the sample with 10 wt % added (Figure 11) reveals the presence of O, Al, Si, K, and Ti, the latter being present in a smaller proportion, indicating that the formation of the gel was not impeded by the addition of TiO2 particles and that these coexist in the structure of the material [19].
4. Conclusions
The effects of adding titanium dioxide particles and modifying the system L/S ratio on the physicomechanical and structural properties of an MK-based geopolymer were evaluated. The results indicate that the addition of titanium dioxide particles at up to 10 wt % did not affect the formation of the KASH gel and that these particles coexisted within it. The compressive strength was maximized by adding titanium dioxide particles in proportions of 5 and 10 wt % at a dry (L/S = 0.35) and an average (L/S = 0.40) consistency, respectively. No improvement in the compressive strength was found for materials with a fluid consistency (L/S = 0.45). The fluidity and the setting time of the material were affected by the addition of titanium oxide particles and the L/S ratio; adding titanium dioxide particles at 10 wt % decreased the fluidity by up to 20.27%, and the setting time decreased by up to 30.13%. In contrast, an increased L/S ratio resulted in increases in the flowability and setting time of up to 20% and 60%, respectively.
Acknowledgments
This study was funded by the Colombian Institute for the Development of Science, Technology, and Innovation COLCIENCIAS (project, “Construction of prototype at the scale of rural housing using innovative materials with low carbon footprint,” contract 096-2016). The authors, who are members of the Composite Materials Group (GMC) from the Centre of Excellence in New Materials (CENM), would like to thanks to Universidad del Valle (Cali, Colombia), in which the experimental work was carried out.
Author Contributions
Mejía de Gutiérrez R. and Maury-Ramírez A. conceived and designed the experiments; Guzmán-Aponte L. performed the experiments; Guzmán-Aponte L., Mejía de Gutiérrez R. and Maury-Ramírez A. analyzed the data; Mejía de Gutiérrez R. contributed reagents/materials/analysis tools; Guzmán-Aponte L., Mejía de Gutiérrez R., and Maury-Ramírez A. wrote the paper.
Conflicts of Interest
The authors declare no conflict of interest.
References
- Singh, B.; Ishwarya, G.; Gupta, M.; Bhattacharyya, S. Geopolymer concrete: A review of some recent developments. Constr. Build. Mater. 2015, 85, 78–90. [Google Scholar] [CrossRef]
- Robayo-Salazar, R.A.; Mejia, J.; Mejia de Gutierrez, R. Eco-efficient alkali-activated cement based on red clay brick wastes suitable for the manufacturing of building materials. J. Clean. Prod. 2017, 166, 242–252. [Google Scholar] [CrossRef]
- McLellan, C.; Williams, R.P.; Lay, J.; Van Riessen, A.; Corder, G.D. Costs and carbon emissions for geopolymer pastes in comparison to ordinary portland cement. J. Clean. Prod. 2011, 19, 1080–1090. [Google Scholar] [CrossRef] [Green Version]
- Weil, M.; Dombrowski, K.; Buchwald, A. Life-cycle analysis of geopolymers. In Geopolymers: Structure Processing Properties and Industrial Applications, 1st ed.; Provis, J.L., van Deventer, J.S.J., Eds.; Woodhead Publishing Limited: Cambridge, UK, 2009; pp. 194–210. [Google Scholar]
- Duxon, P.; Fernandez-Jimenez, A.; Provis, J.; Luckey, G.; Palomo, A.; van Deventer, J. Geopolymer technology: The current state of the art. J. Mater. Sci. 2007, 42, 2917–2933. [Google Scholar] [CrossRef]
- Assaedi, H.; Shaikh, F.; Low, I. Influence of mixing methods of nano silica on the microstructural and mechanical properties of flax fabric reinforced geopolymer composites. Constr. Build. Mater. 2016, 123, 541–552. [Google Scholar] [CrossRef]
- Riahi, S.; Nazari, A. The effects of nanoparticles on early age compressive strength of ash-based geopolymers. Ceram Int. 2012, 38, 4467–4476. [Google Scholar] [CrossRef]
- Duan, P.; Yan, C.; Luo, W.; Zhou, W. Effects of adding nano-TiO2 on compressive strength, drying shrinkage, carbonation and microstructure of fluidized bed fly ash based geopolymer paste. Constr. Build. Mater. 2016, 106, 115–125. [Google Scholar] [CrossRef]
- Yang, L.; Jia, Z.; Zhang, Y.; Dai, J. Effects of nano-TiO2 on strength, shrinkage and microstructure of alkali activated slag pastes. Cem. Concr. Compos. 2015, 57, 1–7. [Google Scholar] [CrossRef]
- Zhang, Z.; Wang, K.; Mo, B.; Li, X.; Cui, X. Preparation and characterization of a reflective and heat insulative coating based on geopolymers. Energy Build. 2015, 87, 220–225. [Google Scholar] [CrossRef]
- Ohama, Y.; Van Gemert, D. Introduction. In Application of Titanium Dioxide Photocatalysis to Construction Materials, 1st ed.; Ohama, Y., Van Gemert, D., Eds.; State of the Art Report of the RILEM Technical committee 194-TDP; Springer: Dordrecht, The Netherlands, 2011; Volume 5, pp. 1–4. ISBN 978-94-007-1296-6. [Google Scholar]
- Wan, Q.; Rao, F.; Song, S.; Garcia, R.; Estrella, R.; Patiño, C.; Zhang, Y. Geopolymerization reaction, microstructure and simulation of metakaolin-based geopolymers at extended Si/Al ratios. Cem. Concr. Compos. 2017, 79, 45–52. [Google Scholar] [CrossRef]
- Wang, W.; Chen, J.; Gao, M.; Huang, Y.; Zhang, X.; Yu, H. Photocatalytic degradation of atrazine by boron-doped TiO2 with a turnable rutile/anatase ratio. Appl. Catal. B 2016, 195, 69–76. [Google Scholar] [CrossRef]
- Villaquirán-Caicedo, M.; Mejía de Gutiérrez, R.; Sulekar, S.; Davis, C.; Nino, J. Thermal properties of novel binary geopolymers based on metakaolin and alternative silica sources. Appl. Clay Sci. 2015, 118, 276–282. [Google Scholar] [CrossRef]
- Zuhua, Z.; Xiao, Y.; Huajun, Z.; Yue, C. Role of water in the synthesis of calcined kaolin-based geopolymer. Appl. Clay Sci. 2009, 43, 218–223. [Google Scholar] [CrossRef]
- Liew, Y.; Kamarudin, H.; Mustafa, A.; Bnhussain, M.; Luqman, M.; Nizar, I.; Ruzaidi, C.; Heah, C. Optimization of solids-to-liquid and alkali activator ratios of calcined kaolin geopolymeric powder. Constr. Build. Mater. 2012, 37, 440–451. [Google Scholar] [CrossRef]
- Essawy, A.; Aleem, S. Physico-mechanical properties, potent adsorptive and photocatalytic efficacies of sulfate resisting cement blends containing micro silica and nano-TiO2. Constr. Build. Mater. 2014, 52, 1–8. [Google Scholar] [CrossRef]
- Yun, L.; Cheng, H.; Mustafa, M.; Hussin, K. Structure and properties of clay-based geopolymer cements: A review. Prog. Mater. Sci. 2016, 83, 595–629. [Google Scholar] [CrossRef]
- Falah, M.; Mackenzie, K. Synthesis and properties of novel photoactive composites of P25 titanium dioxide and copper (I) oxide with inorganic polymers. Ceram. Int. 2015, 41, 13702–13708. [Google Scholar] [CrossRef]
Figure 1.
Particle size distribution of (a) titanium dioxide, and (b) MK.

Figure 2.
XRD patterns of the raw materials.

Figure 3.
FTIR spectra of the raw materials.
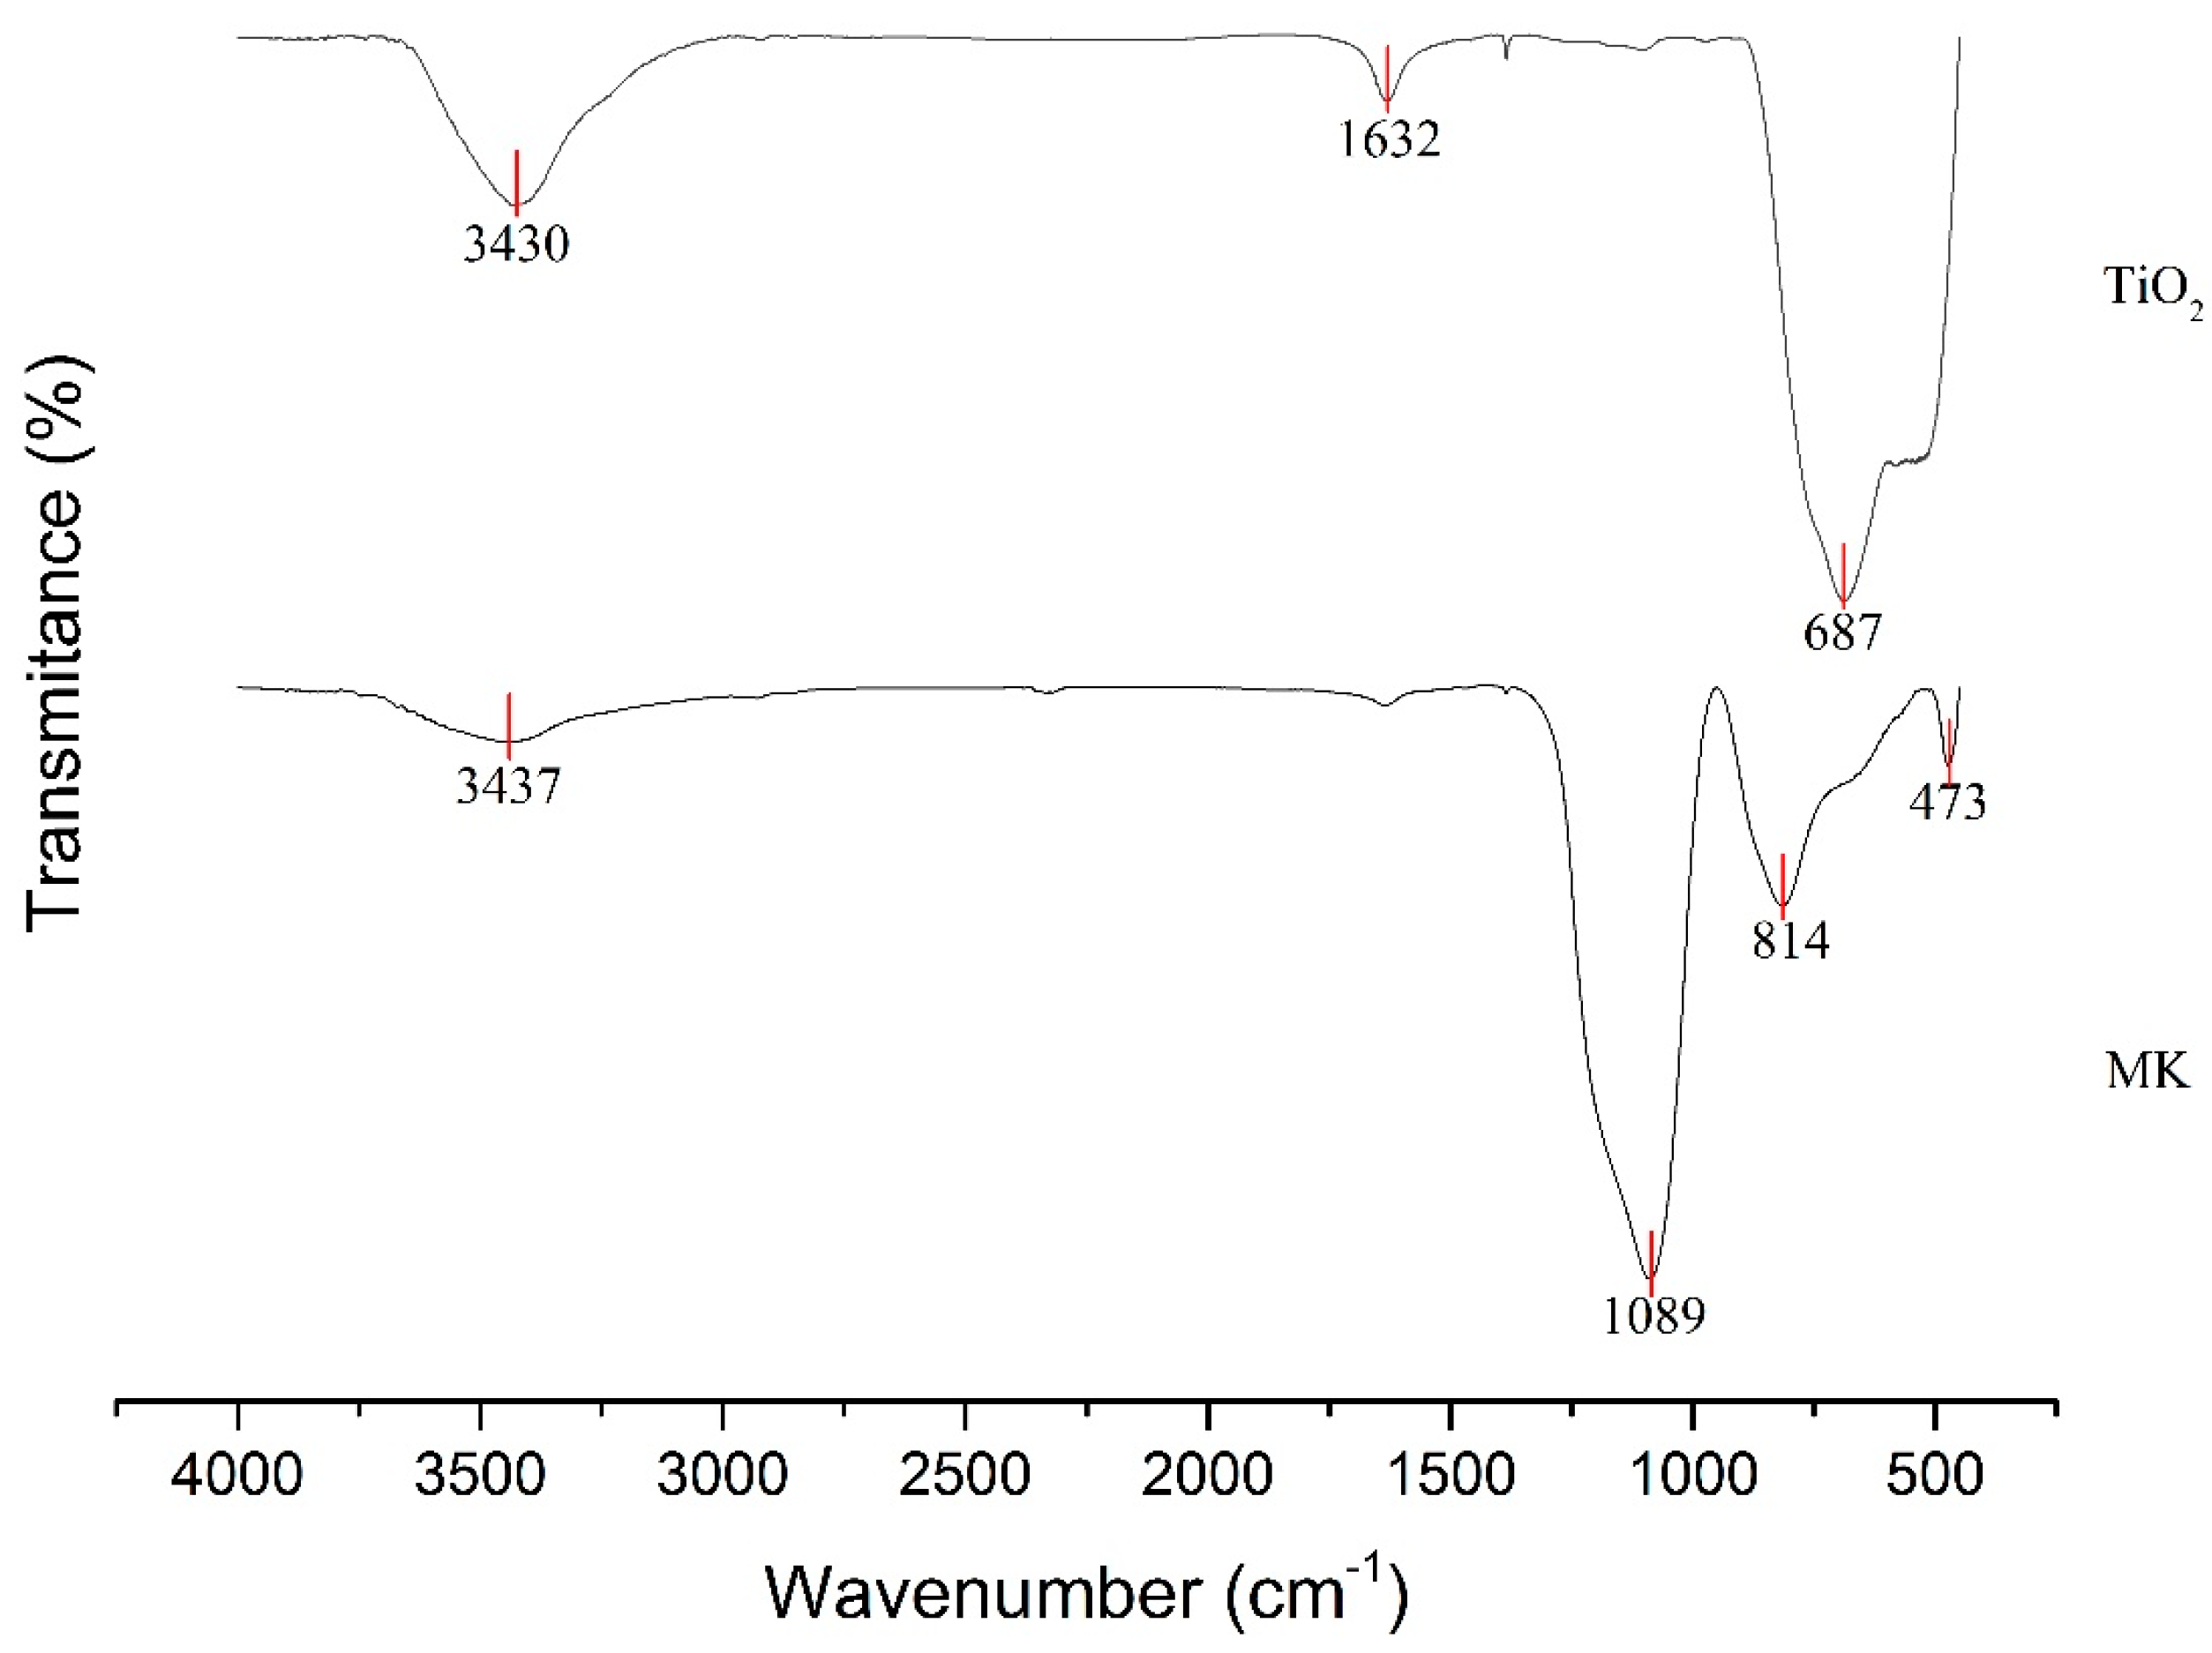
Figure 4.
Fluidity of the various systems evaluated.

Figure 5.
Setting times of the various materials evaluated.

Figure 6.
(a) Density and (b) water absorption and porosity of the geopolymeric materials evaluated.
Figure 6.
(a) Density and (b) water absorption and porosity of the geopolymeric materials evaluated.

Figure 7.
Compressive strength of the various materials evaluated.
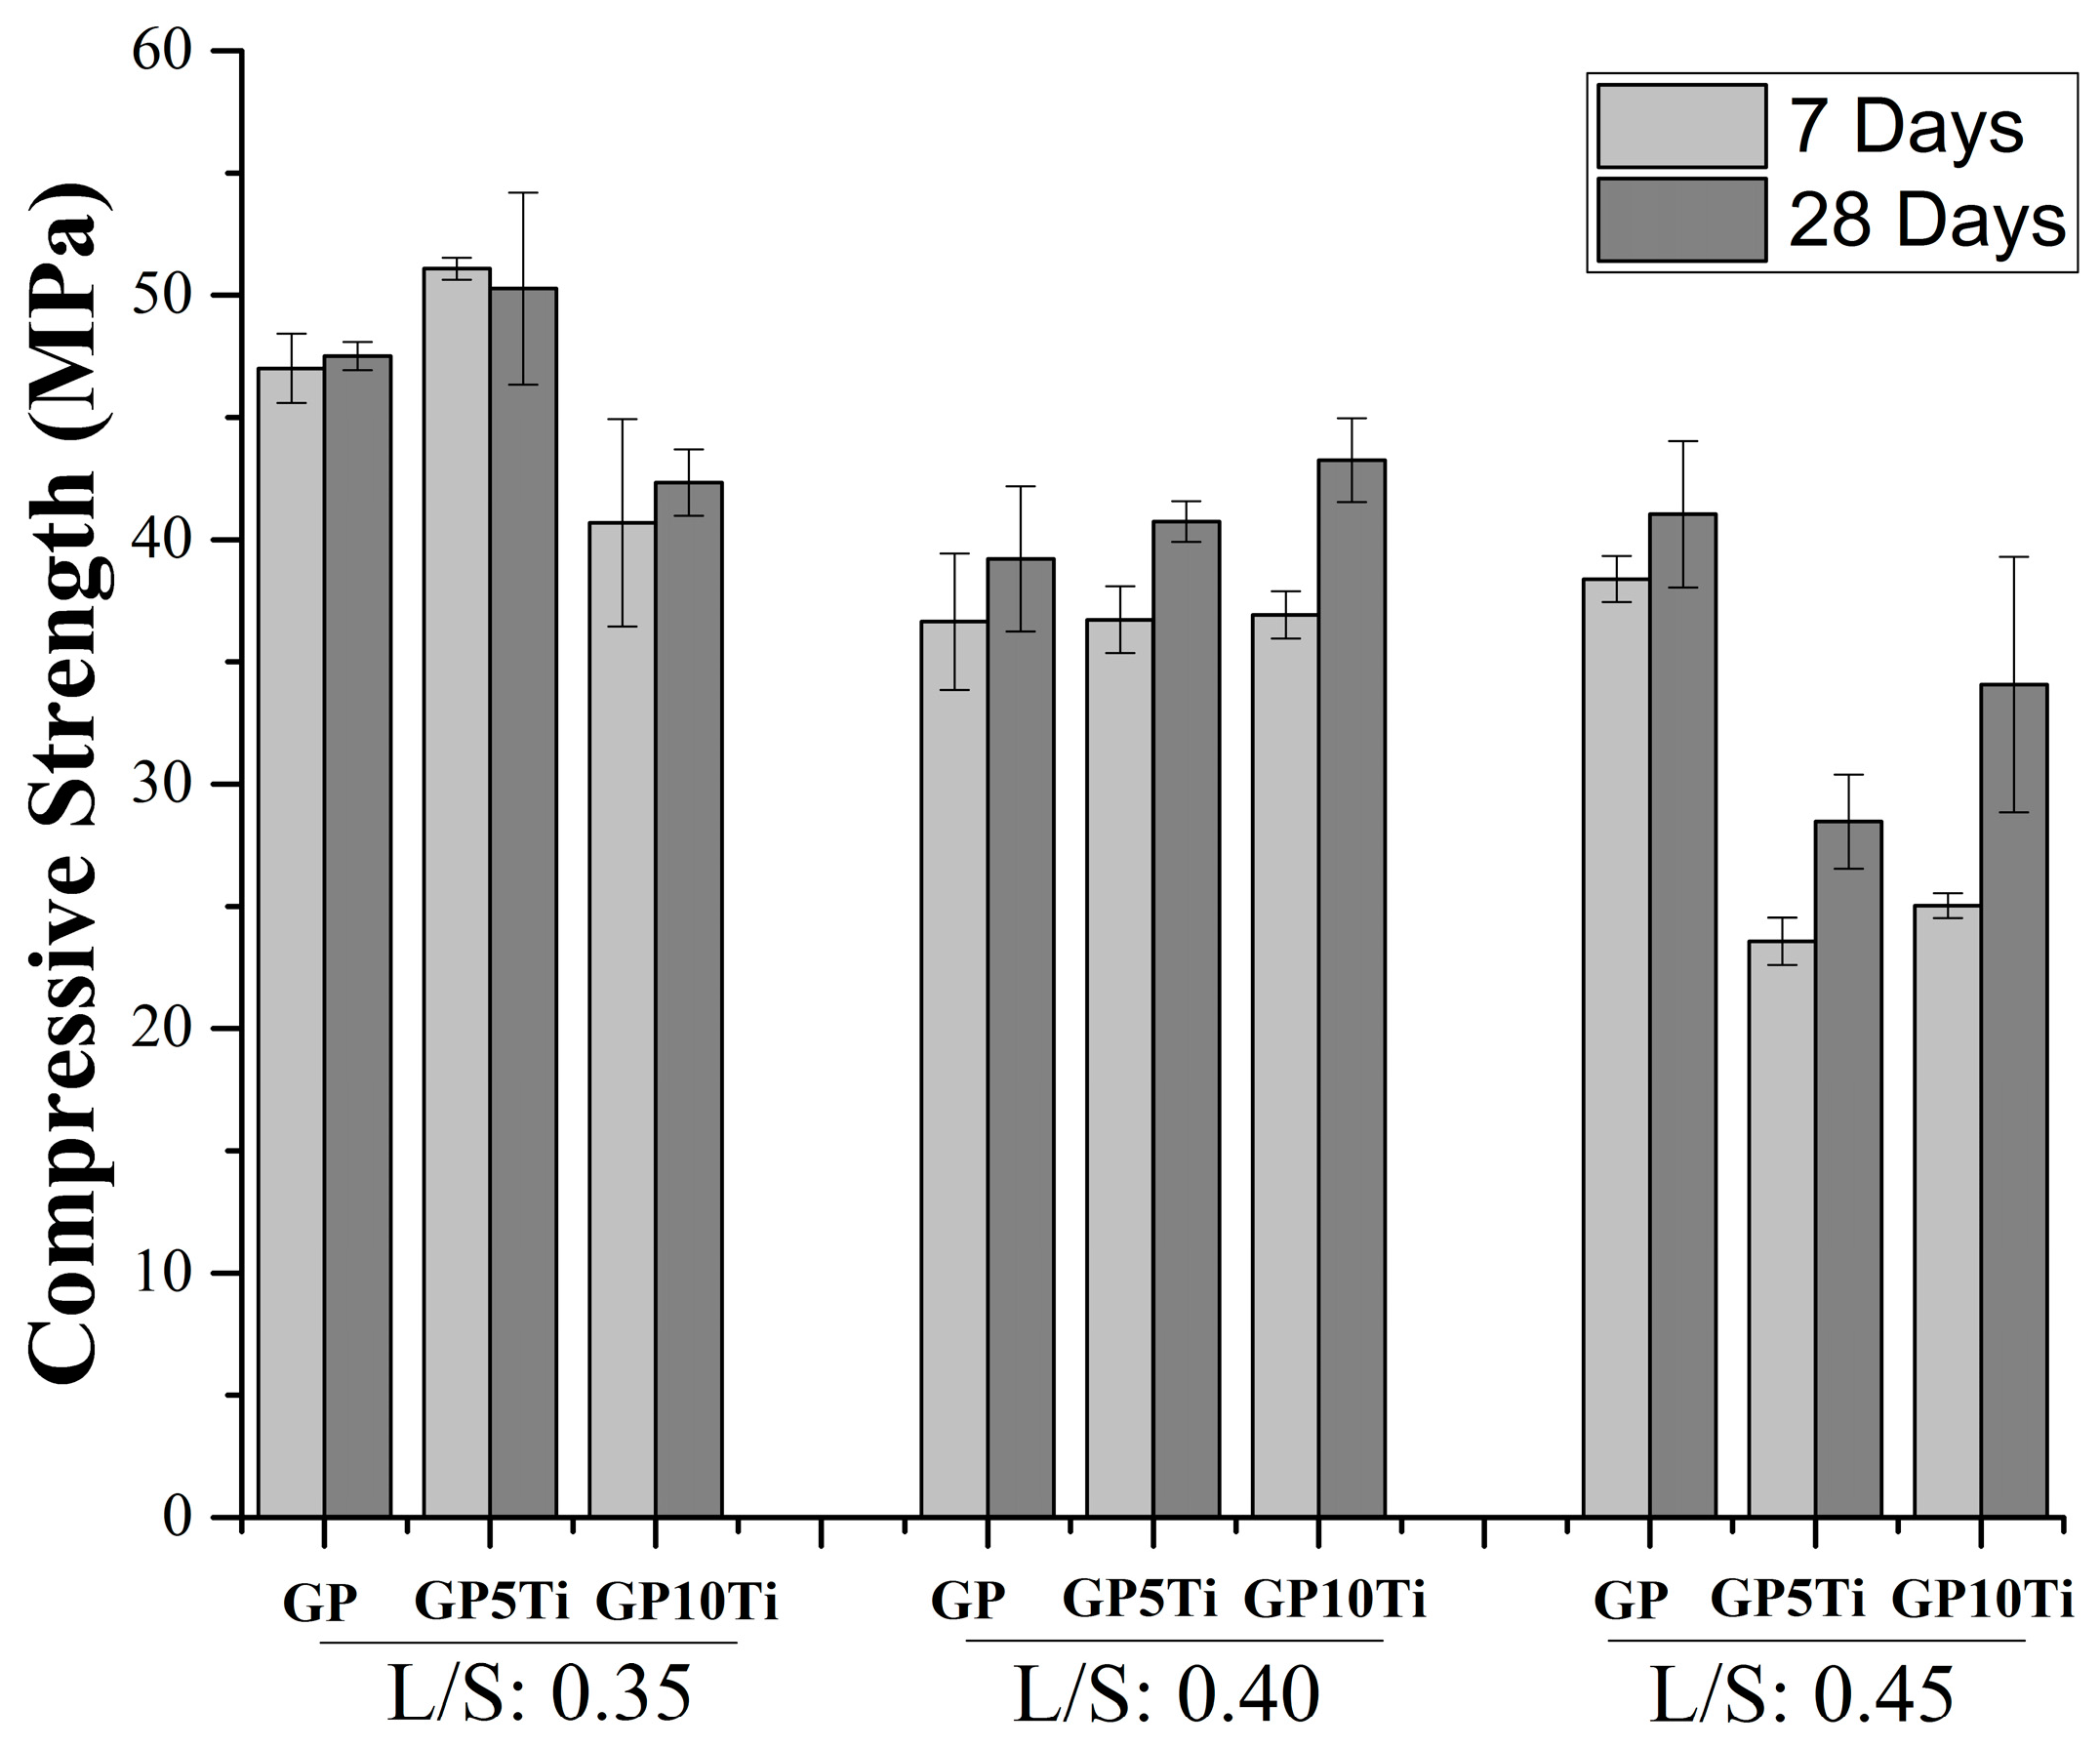
Figure 8.
XRD pattern of the synthesized geopolymers.

Figure 9.
FTIR spectra of geopolymers.

Figure 10.
SEM micrographs. (a) GP at seven days; (b) GP 0 at 28 days; (c) GP 10 Ti at seven days, and (d) GP 10 Ti at 28 days.
Figure 10.
SEM micrographs. (a) GP at seven days; (b) GP 0 at 28 days; (c) GP 10 Ti at seven days, and (d) GP 10 Ti at 28 days.
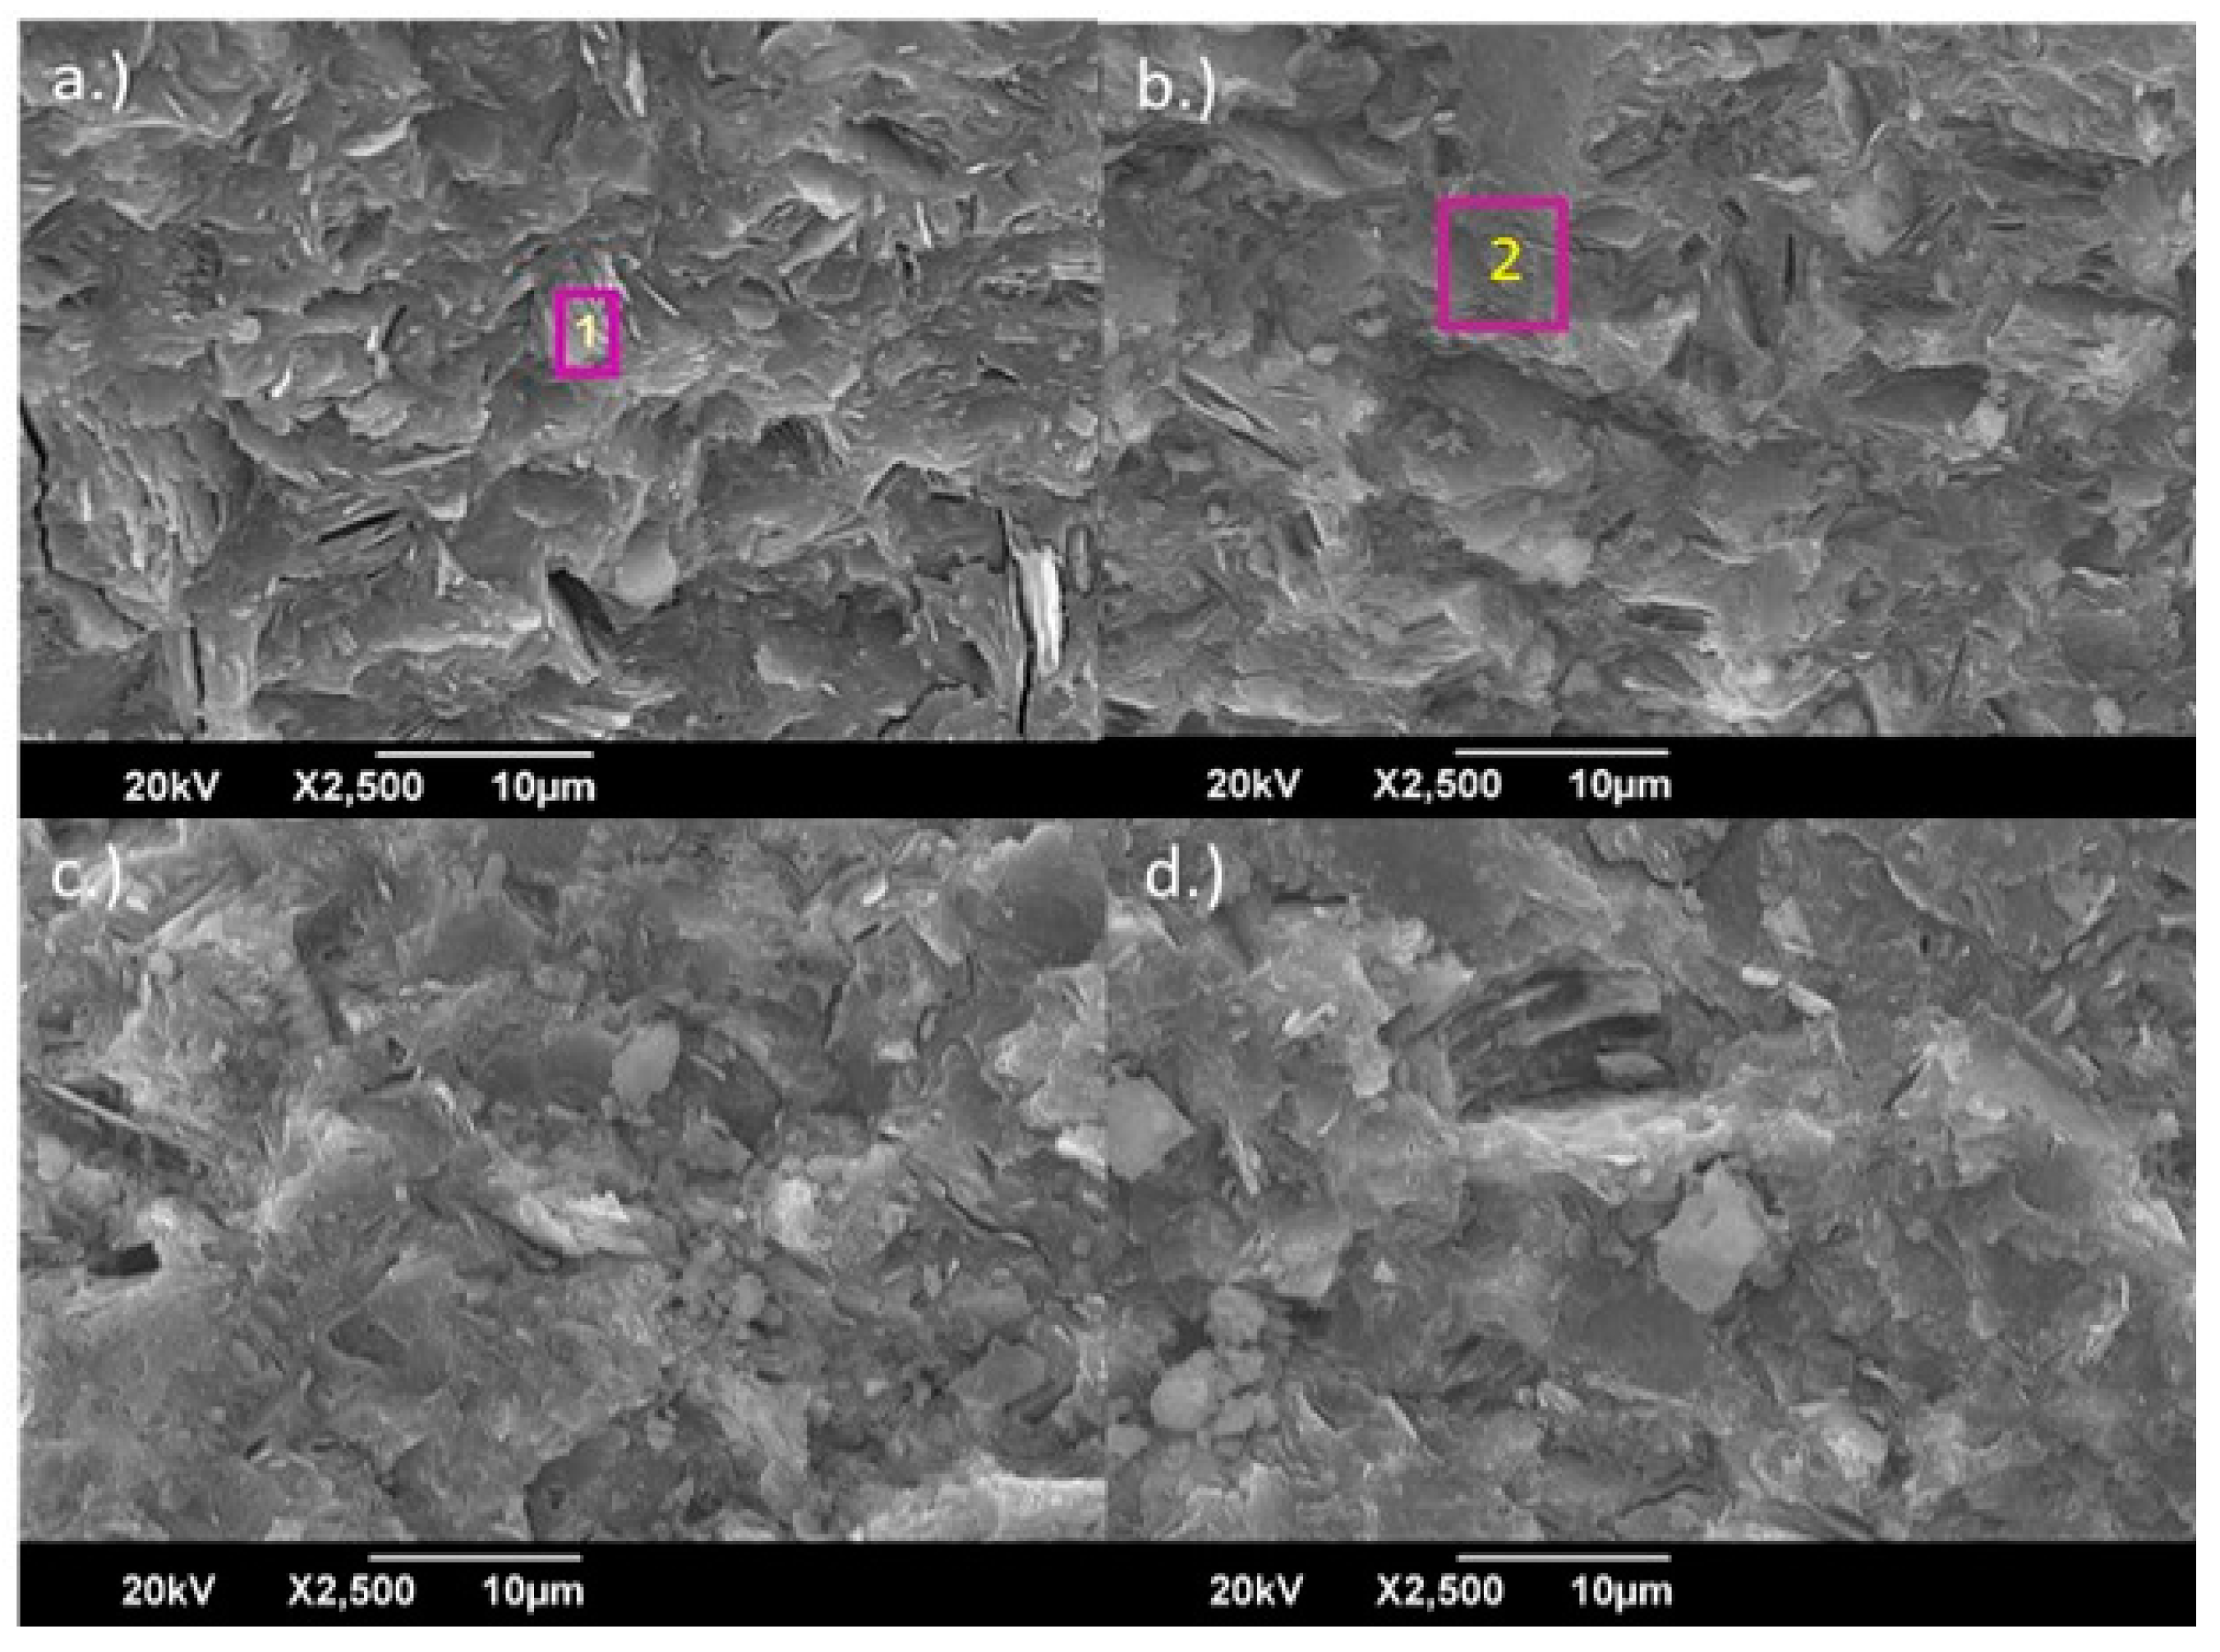
Figure 11.
SEM micrographs with EDS for sample to which 10 wt % TiO2 was added (28 days).


Table 1.
Chemical composition of the precursor (MK).
| Element/Composite | wt % |
|---|---|
| SiO2 | 52.018 |
| Al2O3 | 44.950 |
| TiO2 | 1.730 |
| Fe2O3 | 0.469 |
| Na2O | 0.295 |
| MgO | 0.192 |
| K2O | 0.158 |
| P2O5 | 0.058 |
| CaO | 0.023 |
| Ce | 0.023 |
| V | 0.021 |
| S | 0.018 |
| Cr | 0.014 |
| Zr | 0.012 |
| Ga | 0.006 |
| Sr | 0.005 |
| Zn | 0.003 |
| Nb | 0.003 |
Table 2.
Compositions of the mixtures.
| Mixture | TiO2% | L/S Ratio | SiO2/Al2O3 | K2O/SiO2 |
|---|---|---|---|---|
| GP | 0 | 0.35, 0.40 and 0.45 | 2.5 | 0.28 |
| GP 5 Ti | 5 | |||
| GP 10 Ti | 10 | – | – | – |
Table 3.
Composition of elements measured via EDS as shown in Figure 10.
Table 3.
Composition of elements measured via EDS as shown in Figure 10.
| Composition, % | Spectrum 1 | Spectrum 2 |
|---|---|---|
| O | 53.42 | 36.40 |
| Al | 18.59 | 13.96 |
| Si | 23.42 | 20.89 |
| K | 4.56 | 28.74 |
Table 4.
Composition of elements measured via EDS as shown in Figure 11.
Table 4.
Composition of elements measured via EDS as shown in Figure 11.
| Composition, % | Spectrum 2 |
|---|---|
| O | 50.67 |
| Al | 13.43 |
| Si | 19.23 |
| K | 11.02 |
| Ti | 5.65 |
© 2017 by the authors. Licensee MDPI, Basel, Switzerland. This article is an open access article distributed under the terms and conditions of the Creative Commons Attribution (CC BY) license (http://creativecommons.org/licenses/by/4.0/).
Share and Cite
MDPI and ACS Style
Guzmán-Aponte, L.A.; Mejía de Gutiérrez, R.; Maury-Ramírez, A. Metakaolin-Based Geopolymer with Added TiO2 Particles: Physicomechanical Characteristics. Coatings 2017, 7, 233. https://doi.org/10.3390/coatings7120233
AMA Style
Guzmán-Aponte LA, Mejía de Gutiérrez R, Maury-Ramírez A. Metakaolin-Based Geopolymer with Added TiO2 Particles: Physicomechanical Characteristics. Coatings. 2017; 7(12):233. https://doi.org/10.3390/coatings7120233
Chicago/Turabian StyleGuzmán-Aponte, Luis A., Ruby Mejía de Gutiérrez, and Anibal Maury-Ramírez. 2017. "Metakaolin-Based Geopolymer with Added TiO2 Particles: Physicomechanical Characteristics" Coatings 7, no. 12: 233. https://doi.org/10.3390/coatings7120233
Note that from the first issue of 2016, this journal uses article numbers instead of page numbers. See further details here.