
Effect of the Addition of Molybdenum on the Structure and Corrosion Resistance of Zinc–Iron Plating


1
Department of Chemical Systems Engineering, Graduate School of Engineering, Nagoya University, Furo-cho, Chikusa-ku, Nagoya 464-8603, Japan
2
Green Mobility Research Institute, Institutes of Innovation for Future Society, Nagoya University, Furo-cho, Chikusa-ku, Nagoya 464-8603, Japan
3
Institute of Materials and Systems for Sustainability, Nagoya University, Furo-cho, Chikusa-ku, Nagoya 464-8603, Japan
*
Author to whom correspondence should be addressed.
Coatings 2017, 7(12), 235; https://doi.org/10.3390/coatings7120235
Submission received: 24 November 2017
/
Revised: 11 December 2017
/
Accepted: 14 December 2017
/
Published: 16 December 2017
(This article belongs to the Special Issue Hybrid Surface Coatings & Process (Selected Papers from HyMaP 2017))
Abstract
:Zn–Ni plating is indispensable in various industries because of its high corrosion resistance. However, Ni has been reported to trigger allergies; thus, an alternative Ni-free plating is desired. Zn–Fe plating is considered to be a promising candidate, albeit its corrosion resistance still needs to be improved. The corrosion resistance of Zn–Fe plating is expected to increase by the addition of Mo as the third alloying element as it is more noble than Zn and Fe. In this study, Zn–Fe–Mo plating with a corrosion resistance nearly equivalent to that of the Zn–Ni plating was fabricated. Zn–Fe–Mo plating was electrically deposited from continuously-agitated plating baths prepared by mixing ZnSO4, FeSO4, Na2MoO4, Na3C6H5O7, and Na2SO4 using Fe or Ni plates as the substrate. The surface morphology, composition, crystal phase, and electronic state of Mo of the platings were investigated by scanning electron microscopy equipped with energy-dispersive spectroscopy (SEM-EDS), X-ray diffraction (XRD), and X-ray photoelectron spectroscopy (XPS). The anti-corrosion performance was evaluated by Tafel extrapolation method. Formation of plating comprising a Mo containing alloy phase was found to be crucial for improving corrosion resistance. The Zn–Fe–Mo plating demonstrates promise for replacing anti-corrosion Zn–Ni platings.
1. Introduction
Metals, such as steel and cast iron, are typically used as the major components of architecture and machines in daily life [1]. In several cases, these metals are exposed to harsh environments, and protection against corrosion is a critical issue, particularly where high reliability is required. The application of corrosion-resistant alloys, including stainless steels, is an effective solution; however, the high cost hinders its applications for daily use [2]. Another promising method to improve corrosion resistance is protection by Zn plating or so-called galvanization [3]. It protects the underlying steel or cast iron by the sacrificial corrosion protection effect, and its considerably lower cost has led to its widespread use in various fields.
Currently, protective coatings with a high corrosion resistance are desired to extend the life of industrial products for realizing a sustainable society and for withstanding a more severe environment to meet industrial demands. Alloying with iron-group elements, such as Fe and Ni, is well known in improving the corrosion resistance of Zn platings [4,5,6,7,8]. By the formation of alloys of Zn with iron-group elements, the standard electrode potential of the alloy becomes closer to that of the substrate metal. The smaller potential difference between the plating and substrate decreases the driving force for the corrosion of the plating, which, in turn, improves its corrosion resistance. In particular, Zn–Ni plating has demonstrated to exhibit five to six times greater corrosion resistance compared with that of Zn plating according to salt spray tests [8]. Thus, Zn–Ni plating has become indispensable for various applications, including aircraft and automotive parts, where conventional Zn plating cannot be applied [9].
Meanwhile, in recent years, Ni allergies have become a social concern. In fact, allergic contact dermatitis in children is caused by nickel [10]. Nickel ions released from various alloys are potent allergens or haptens that can trigger skin inflammation [11]. Therefore, an alternative nontoxic Ni-free plating with a corrosion resistance equivalent to or higher than that of Zn–Ni plating is desired. Zn–Fe plating is considered to be promising because of its cost-effectiveness and nontoxicity. However, it exhibits insufficient corrosion resistance, corresponding to only one-third of that of the Zn–Ni plating [12]. Meanwhile, the addition of noble elements such as Mo and W into plating has been reported to improve the corrosion resistance via the stabilization of the passive film [13,14]. Mo and W cannot be electrically deposited from solutions alone, but these elements have been reported to undergo co-deposition with iron-group elements [15,16]. This result indicated that these elements are also possibly co-deposited into Zn–Fe platings; however, studies of Zn–Fe–Mo plating have been rarely reported thus far to the best of our knowledge [17,18,19,20,21]. In this study, Zn–Fe–Mo plating was electrically deposited by the addition of Mo into the plating bath, and its effect on corrosion resistance was investigated. Furthermore, the possibility of using Zn–Fe–Mo platings to replace conventional Zn–Ni platings is discussed.
2. Materials and Methods
2.1. Bath Preparation
Table 1 shows the composition of the bath, which was prepared by mixing zinc sulfate heptahydrate (ZnSO4·7H2O, Nacalai Tesque, Inc., Kyoto, Japan), iron (II) sulfate heptahydrate (FeSO4·7H2O, Nacalai Tesque, Inc.), sodium molybdate dihydrate (Na2MoO4·2H2O, Kishida Chemical Co., Ltd., Osaka, Japan), trisodium citrate dihydrate (C6H5Na3O7·2H2O, Nacalai Tesque, Inc.), and sodium sulfate (Na2SO4, Nacalai Tesque, Inc.). Typically, 60 mL of distilled water (DI) was first added into a 100 mL Pyrex glass beaker, and C6H5Na3O7·2H2O, Na2SO4, Na2MoO4·2H2O, ZnSO4·7H2O, and FeSO4·7H2O were added in the order mentioned. Second, the pH was adjusted using sodium hydroxide (NaOH, Nacalai Tesque, Inc.) and sulfuric acid (H2SO4, Nacalai Tesque, Inc.) solutions, respectively, and the total bath volume was adjusted to 100 mL by the addition of distilled water. All procedures were carried out under continuous agitation. Finally, oxygen was removed from the bath by bubbling with Ar for 30 min before use.
2.2. Preparation of Zn–Fe–Mo Platings by Electrodeposition
All electrochemical experiments were carried out using a three-electrode system. The electrodeposition of the Zn–Fe–Mo alloy was carried out at a fixed amount of electric charge of 50 C using the bath prepared in Section 2.1. The plating bath was stirred at a constant speed of 300 rpm using a magnetic stirrer at room temperature (25 °C). A potential/galvanostat (HZ-7000, Hokuto Denko Co., Tokyo, Japan) was utilized to control the electrolysis potential and analyze data. A Ni plate (NI-313374, Nilaco, Tokyo, Japan) or an Fe plate (B-60-P01, Yamamoto-Ms, Tokyo, Japan) and a Pt coil were used as the cathode and anode, respectively. Ag/AgCl in saturated KCl was used as the reference electrode. The cathode was degreased with ethanol, pickled with 10% H2SO4, and masked with an insulation tape (PES-01, AS ONE Corporation, Osaka, Japan), leaving a space of 400 mm2 (20 mm × 20 mm) for electrodeposition prior to the experiment.
2.3. Characterization and Evaluation of the Platings
Scanning electron microscopy (SEM; JSM-6330F, JEOL, Tokyo, Japan) equipped with energy-dispersive spectroscopy (EDS; JED2140-GS, JEOL) was employed to examine the surface morphology and composition of the plating. The composition was determined by analyzing two to three areas near the center of the plating and their average value was adopted. X-ray diffraction (XRD, Ultima IV, Rigaku, Tokyo, Japan) was employed to examine the crystalline phase. X-ray photoelectron spectroscopy (XPS, ESCA-3300, Shimadzu Corporation, Kyoto, Japan) was employed to examine the electronic state of Mo. Ar+ etching was performed using an ion source operated at 2 kV and 20 mA for 3 min to confirm the electronic state of Mo inside the plating. Current efficiency (Ceff) was calculated from the mass change and plating composition, as shown in Equation (1):
Here, ZX (X = Zn, Fe, or Mo) is the ionic valence of each element, nX is the molar amount obtained from EDS analysis, F is the Faraday constant, and Q is the amount of electric charge passed.
The corrosion resistance was evaluated by anode polarization tests. A 3 wt.% sodium chloride (NaCl, Nacalai Tesque, Inc., Kyoto, Japan) solution degassed with Ar was used as the test solution, with a sweep rate of 1 mV s−1 for the polarization measurement. The potential at 0.1 mA cm−2 in the anode polarization curve was defined as the corrosion potential (Ecorr). Zn, Zn–Fe, and Zn–Ni plating were prepared and evaluated as a reference.
3. Results and Discussions
3.1. Effect of Bath pH on Zn–Fe–Mo Platings
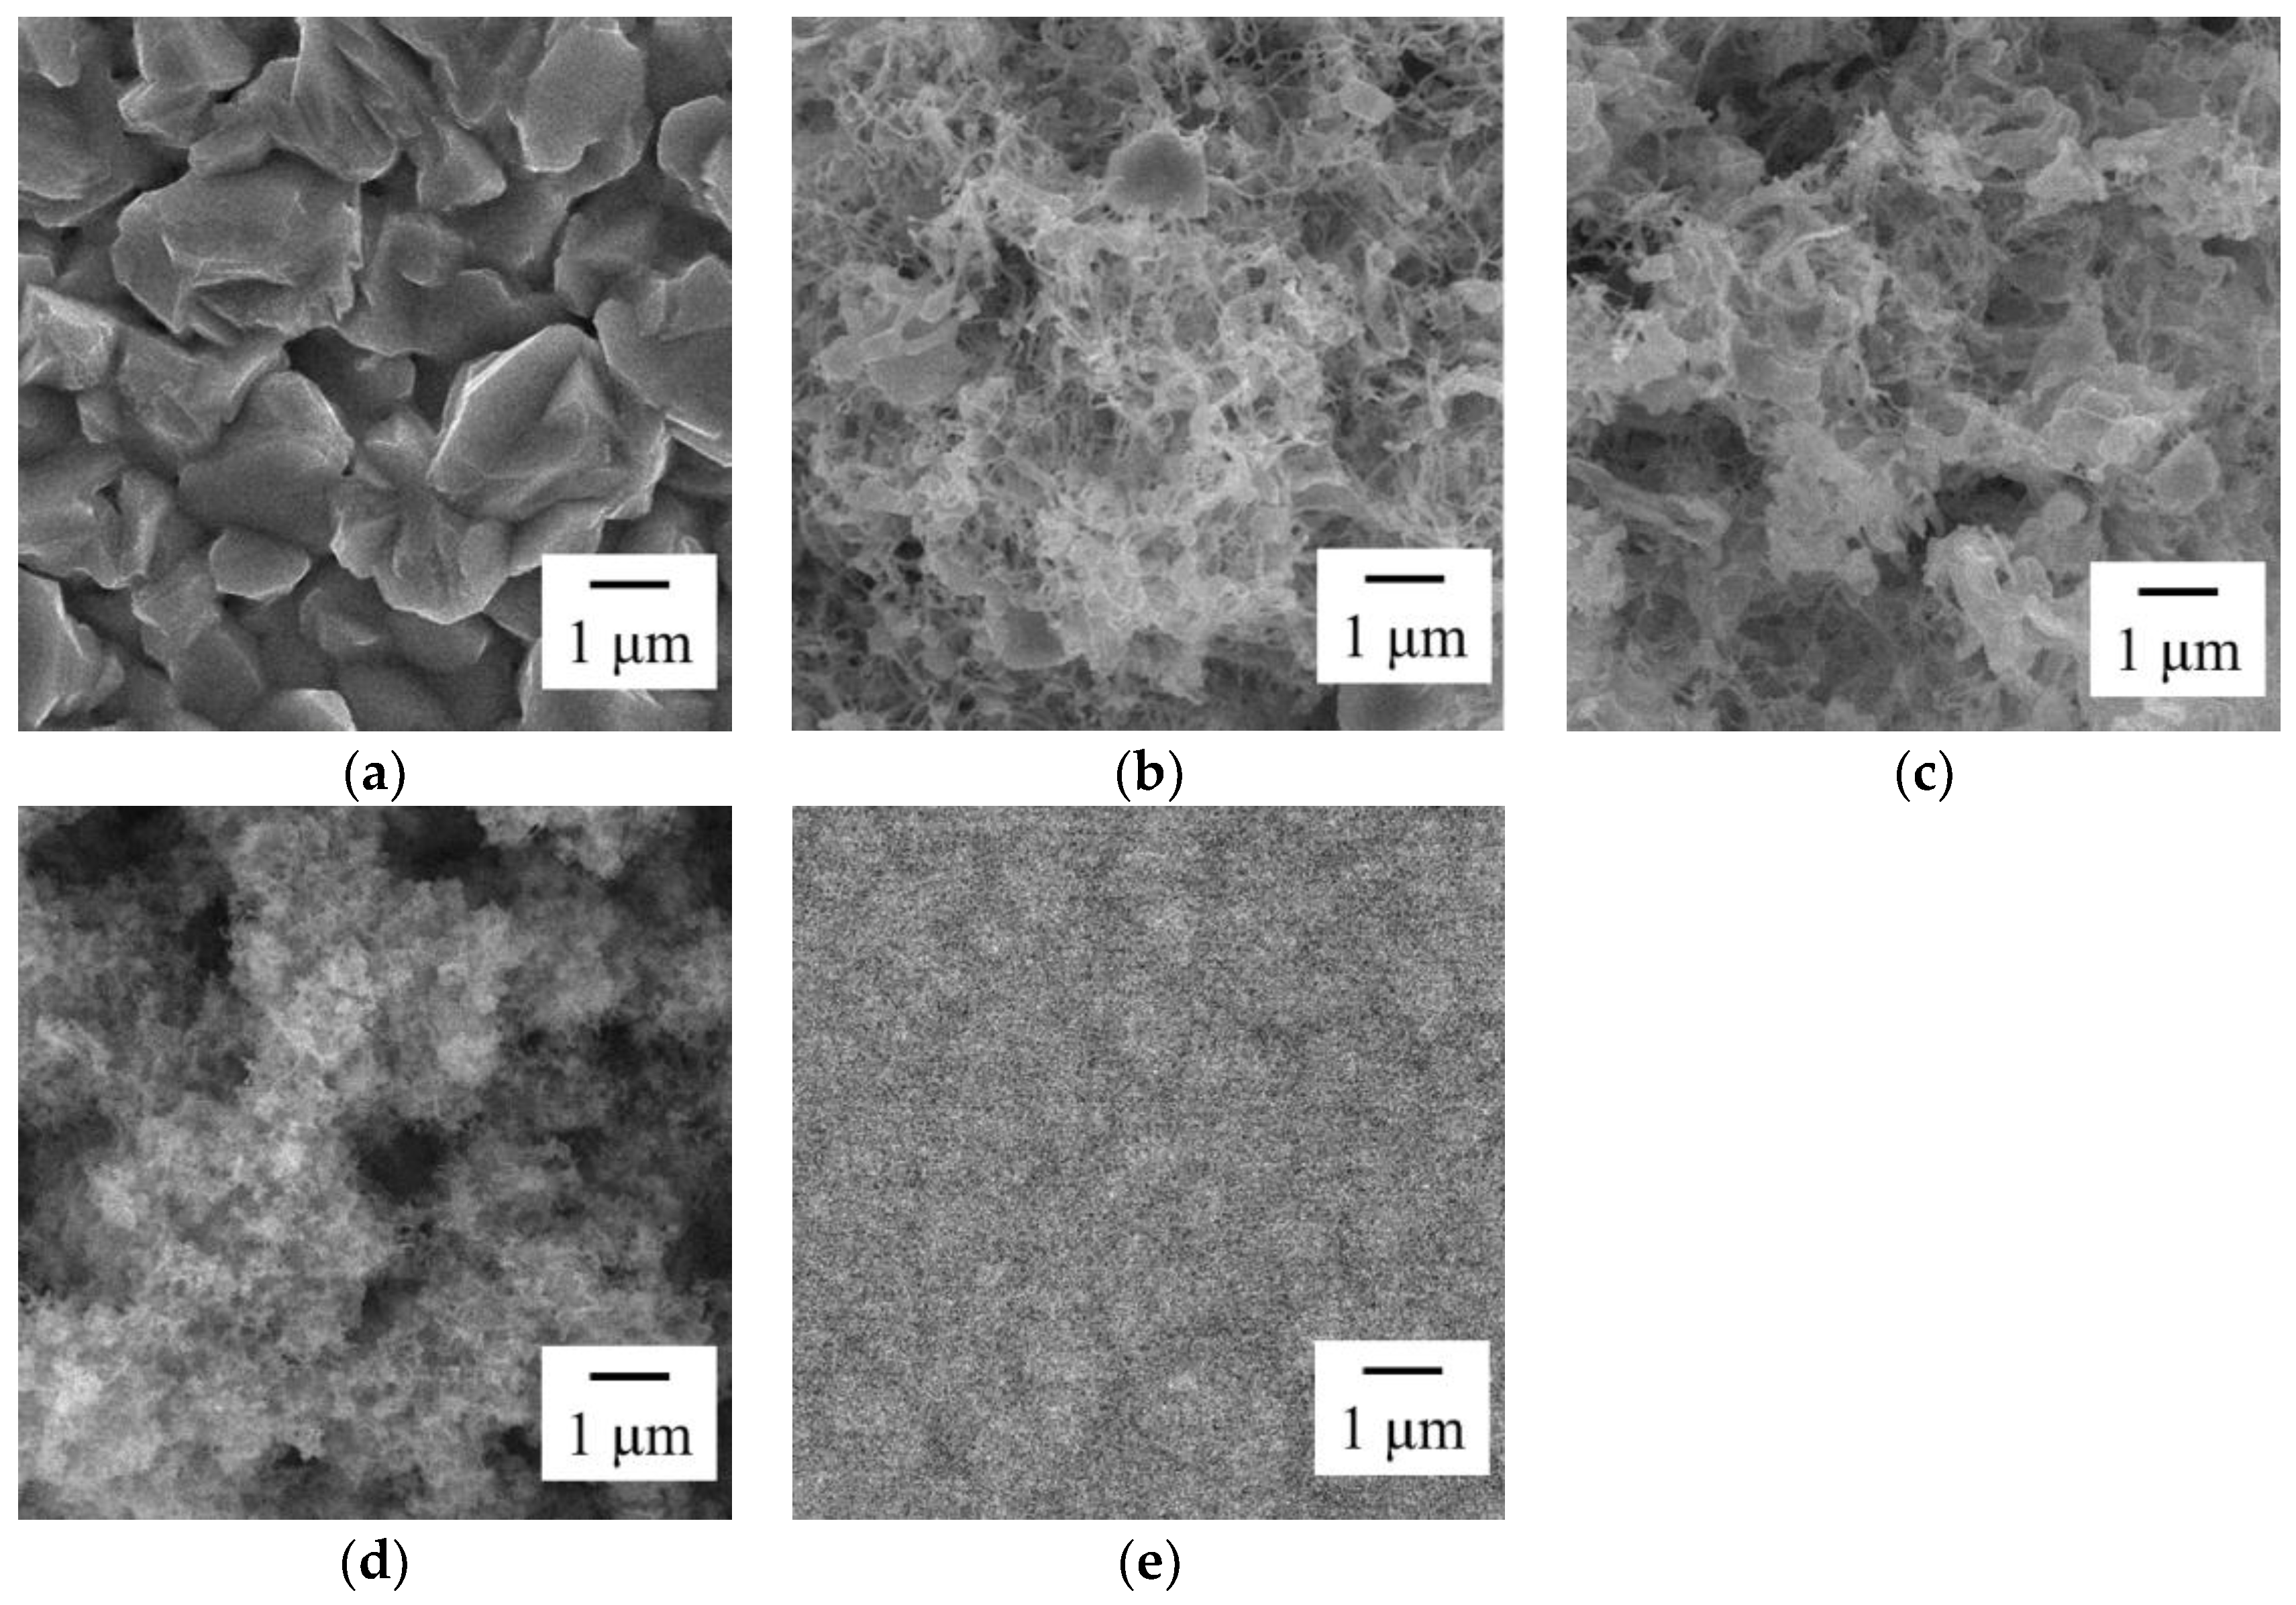
Zn–Fe–Mo plating was electrically deposited at various pH values. The current density was fixed at 10 mA cm−2. A black precipitate with low adhesion was formed on the substrate during electrodeposition at a pH greater than 5.7. Thus, the pH range was selected from 4.0 to 5.7. Figure 1 shows the SEM images of the platings deposited in the baths at different pH values. The surface morphology clearly changed. The plating obtained from the bath at pH 4 comprised granules of ca. 2 μm (Figure 1a), whereas that obtained from pH 4.5 to 5.5 changed to a fibrous structure (Figure 1b–d). Finally, that from pH 5.7 exhibited a smooth structure comprising of fine grains (Figure 1e).
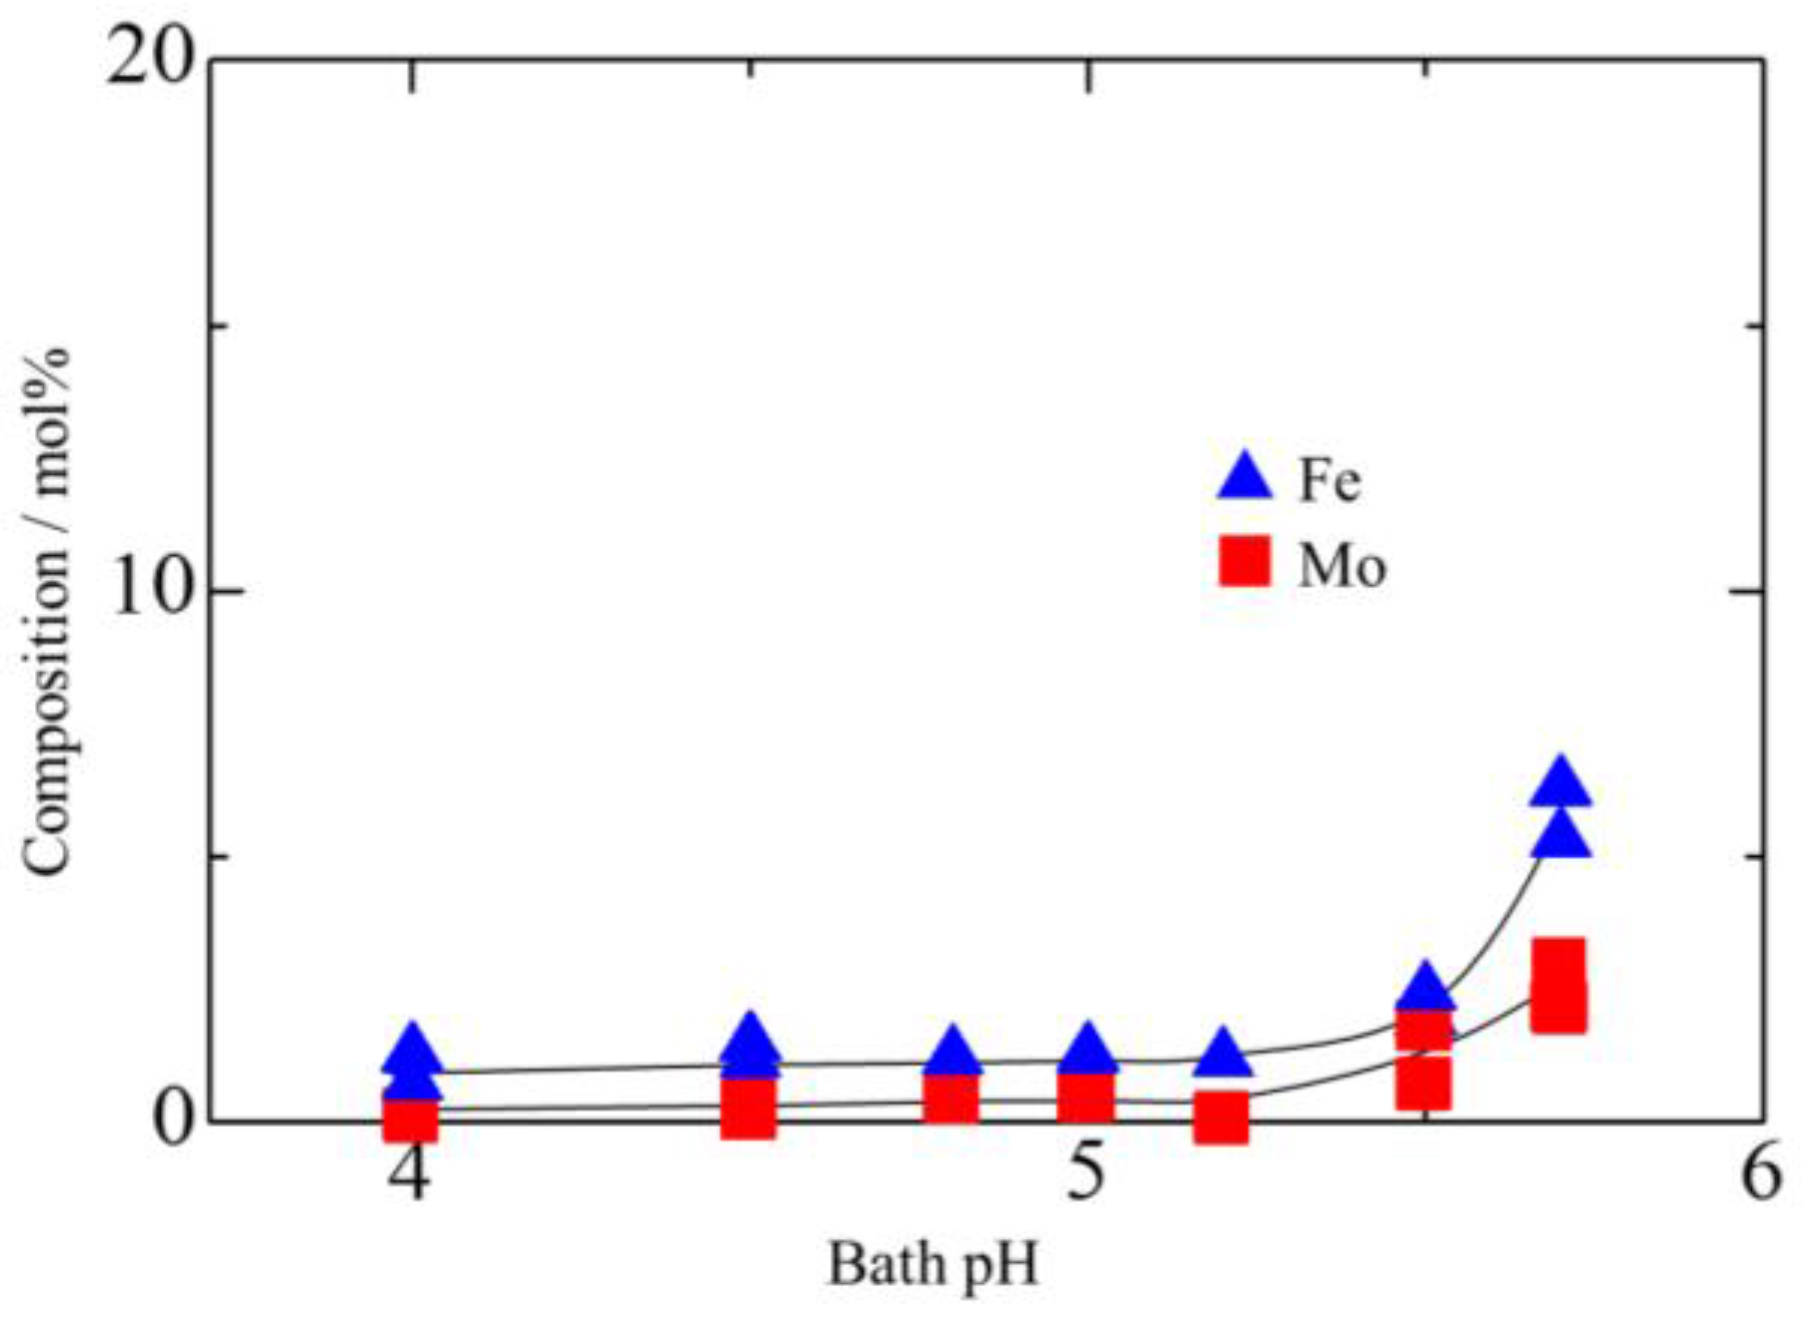
Figure 2 shows the composition of the platings deposited at various pH values. Ni substrates were used in this experiment to avoid the detection of Fe from the substrate. A majority of the platings exhibited a high Zn content, with only trace Fe and Mo, indicating that the current conditions are categorized as “anomalous co-deposition” [22]. Although Mo was barely observed for the plating prepared by electrical deposition at pH between 4.0 and 5.2, the amount of Mo increased with further increasing pH. A plating with approx. 3 at.% Mo could be obtained at a pH of 5.7, probably related to the difference in the present form of Mo. In solution, Mo exists as oxyanions, which is known to form various polyoxyanion at low pH and mono-oxyanions at pH greater than around 6. Therefore, the deposition of Mo is thought to occur with the decrease in the size of oxyanions, which allows for the easier deposition of Mo [23,24].
Figure 3 shows the XRD patterns of the platings deposited at various pH values. Intense peaks were observed for all platings, indicative of the deposition of a crystalline structure. Reflections only corresponding to the Zn phase and the substrate were observed in the platings deposited at pH 4.0–5.5; however, with increasing pH, a slight shift toward low angles was observed, in addition to peak broadening. The incorporation of Fe atoms into the Zn lattice was anticipated to lead to a distorted Zn structure. Peaks other than Zn were observed for the plating obtained at pH 5.7. These are expected to correspond to reflections from a Fe3Mo-based alloy phase since similar peaks have been observed for Fe3Mo alloys in previous studies [25,26].
Figure 4 shows the anodic polarization curves of platings deposited at various pH values. The plating deposited at pH 4.0 exhibited a sharp increase in current density at around −960 mV, whereas that deposited at pH values of 4.5 exhibited a slight increase at around −1100 mV and a drastic increase at around −960 mV. At pH 5.0 and 5.5, a gradual increase between −1100 mV to −920 mV and a similar behavior to that at pH 4.0 was observed with a sharp change at around −990 mV, respectively. This indicated a low corrosion potential for the fibrous structure. For the platings deposited at pH 5.7, a change at −950 mV and a drastic change at −700 mV were observed. The plating with the supposed Fe3Mo-based alloy phase exhibited higher corrosion resistance than those of the others comprising the Zn phase. From these experiments, a pH of 5.7 is selected for the remaining experiments.
3.2. Effect of Current Density on Zn–Fe–Mo Platings
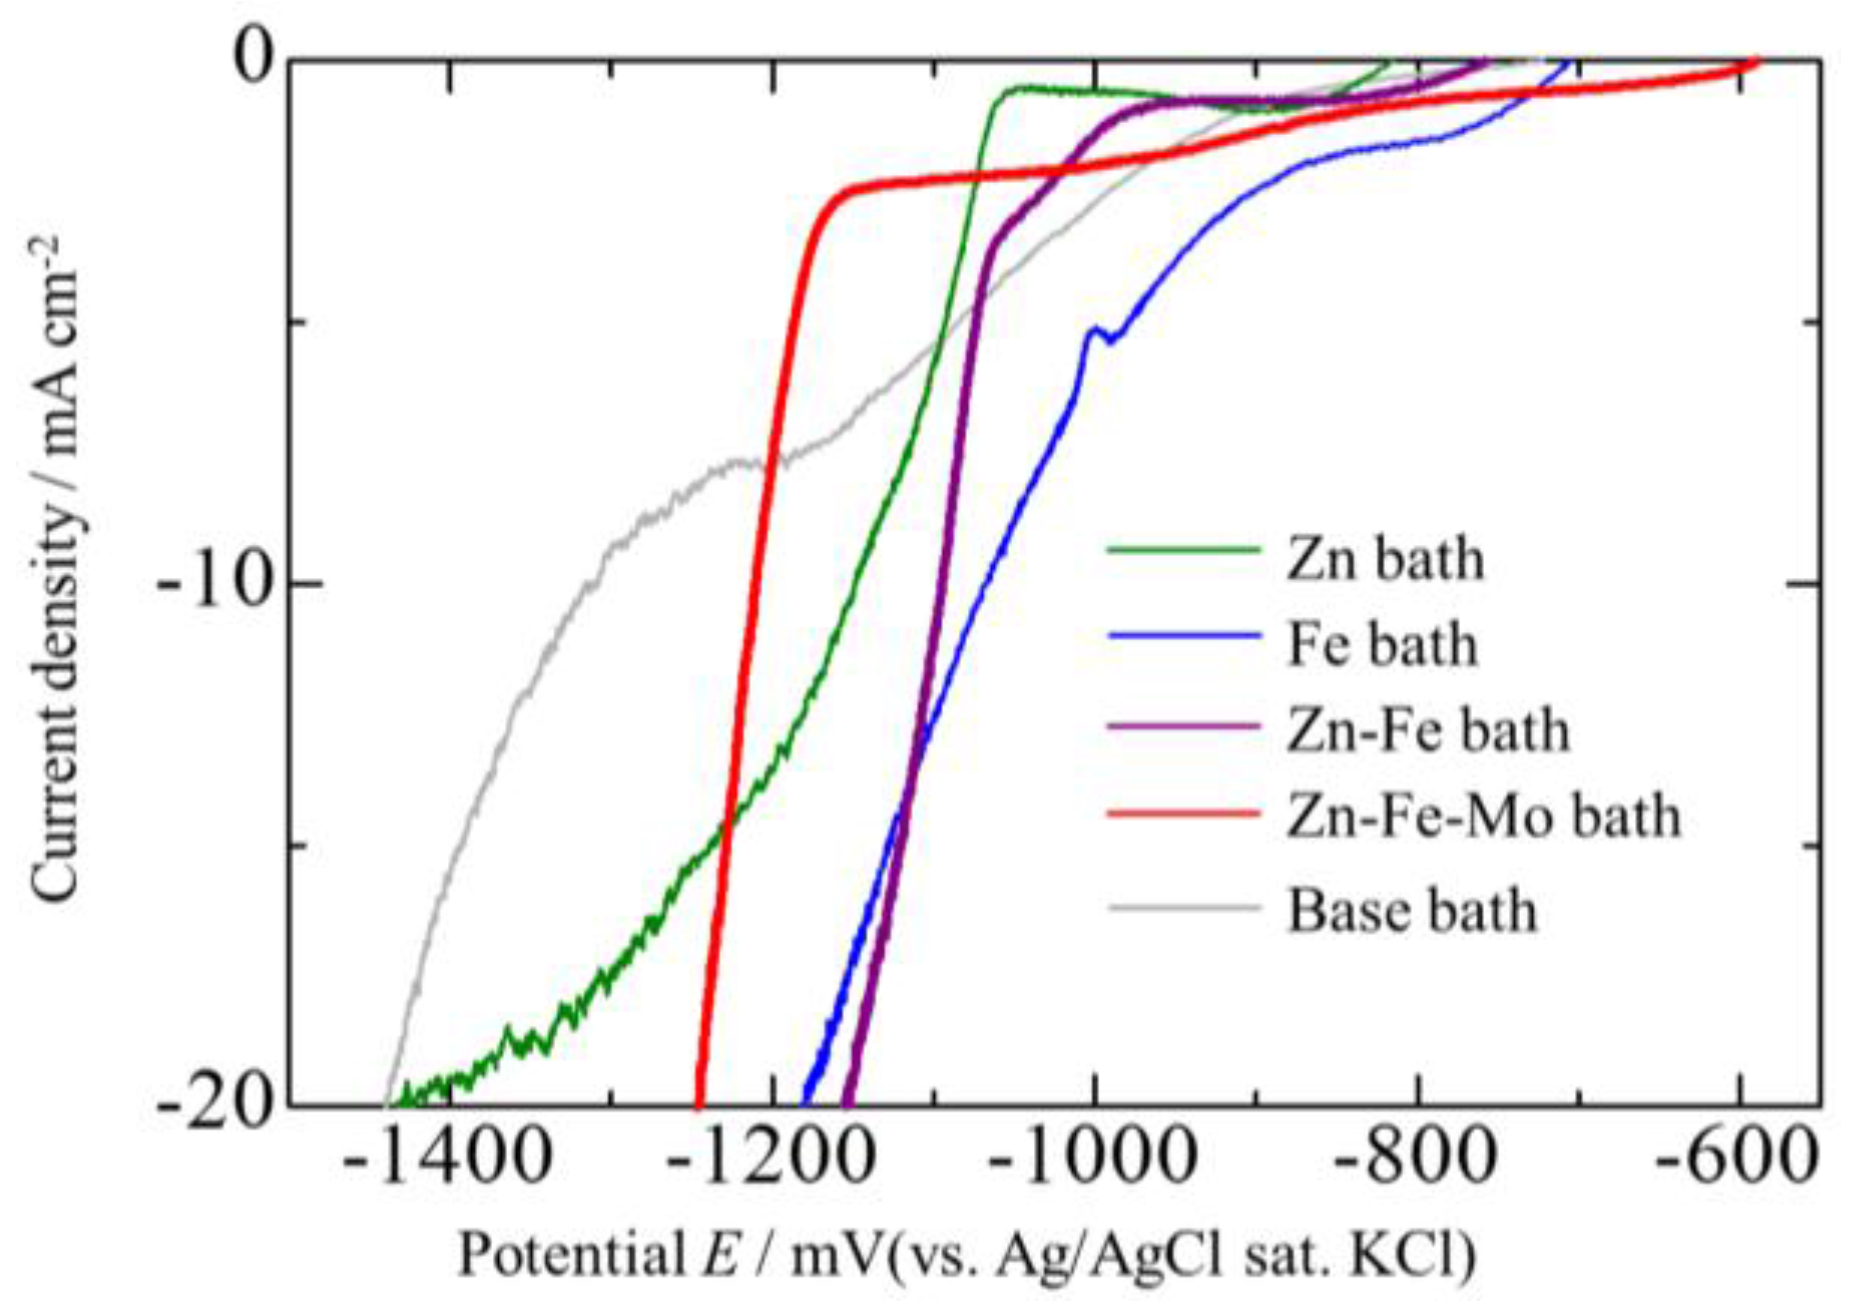
A cathodic polarization measurement was carried out to consider the range of the current density. Figure 5 shows the measured cathodic polarization curves at a pH of 5.7 and a sweep rate of 5 mV/s. The deposition of Zn and Fe started at approximately −1080 and −980 mV from baths containing Zn or Fe alone (Zn and Fe baths), respectively. Meanwhile, when using the plating bath containing both Zn and Fe (Zn–Fe bath), a small peak at −980 mV and a second large peak were observed at −1080 mV, corresponding to the deposition of Fe and Zn, respectively. Finally, from the bath containing Zn, Fe, and Mo, two peaks were again observed at −800 mV, possibly corresponding to the co-reduction of Fe and Mo, and at −1200 mV, related to Zn deposition. These shifts in potential are likely to be explained by the presence of noble Mo, shifting the reduction of Fe to higher potentials through co-reduction of Mo while shifting the Zn deposition to lower potential by avoiding the deposition of Zn via the adsorption of oxyanions on the substrate surface.
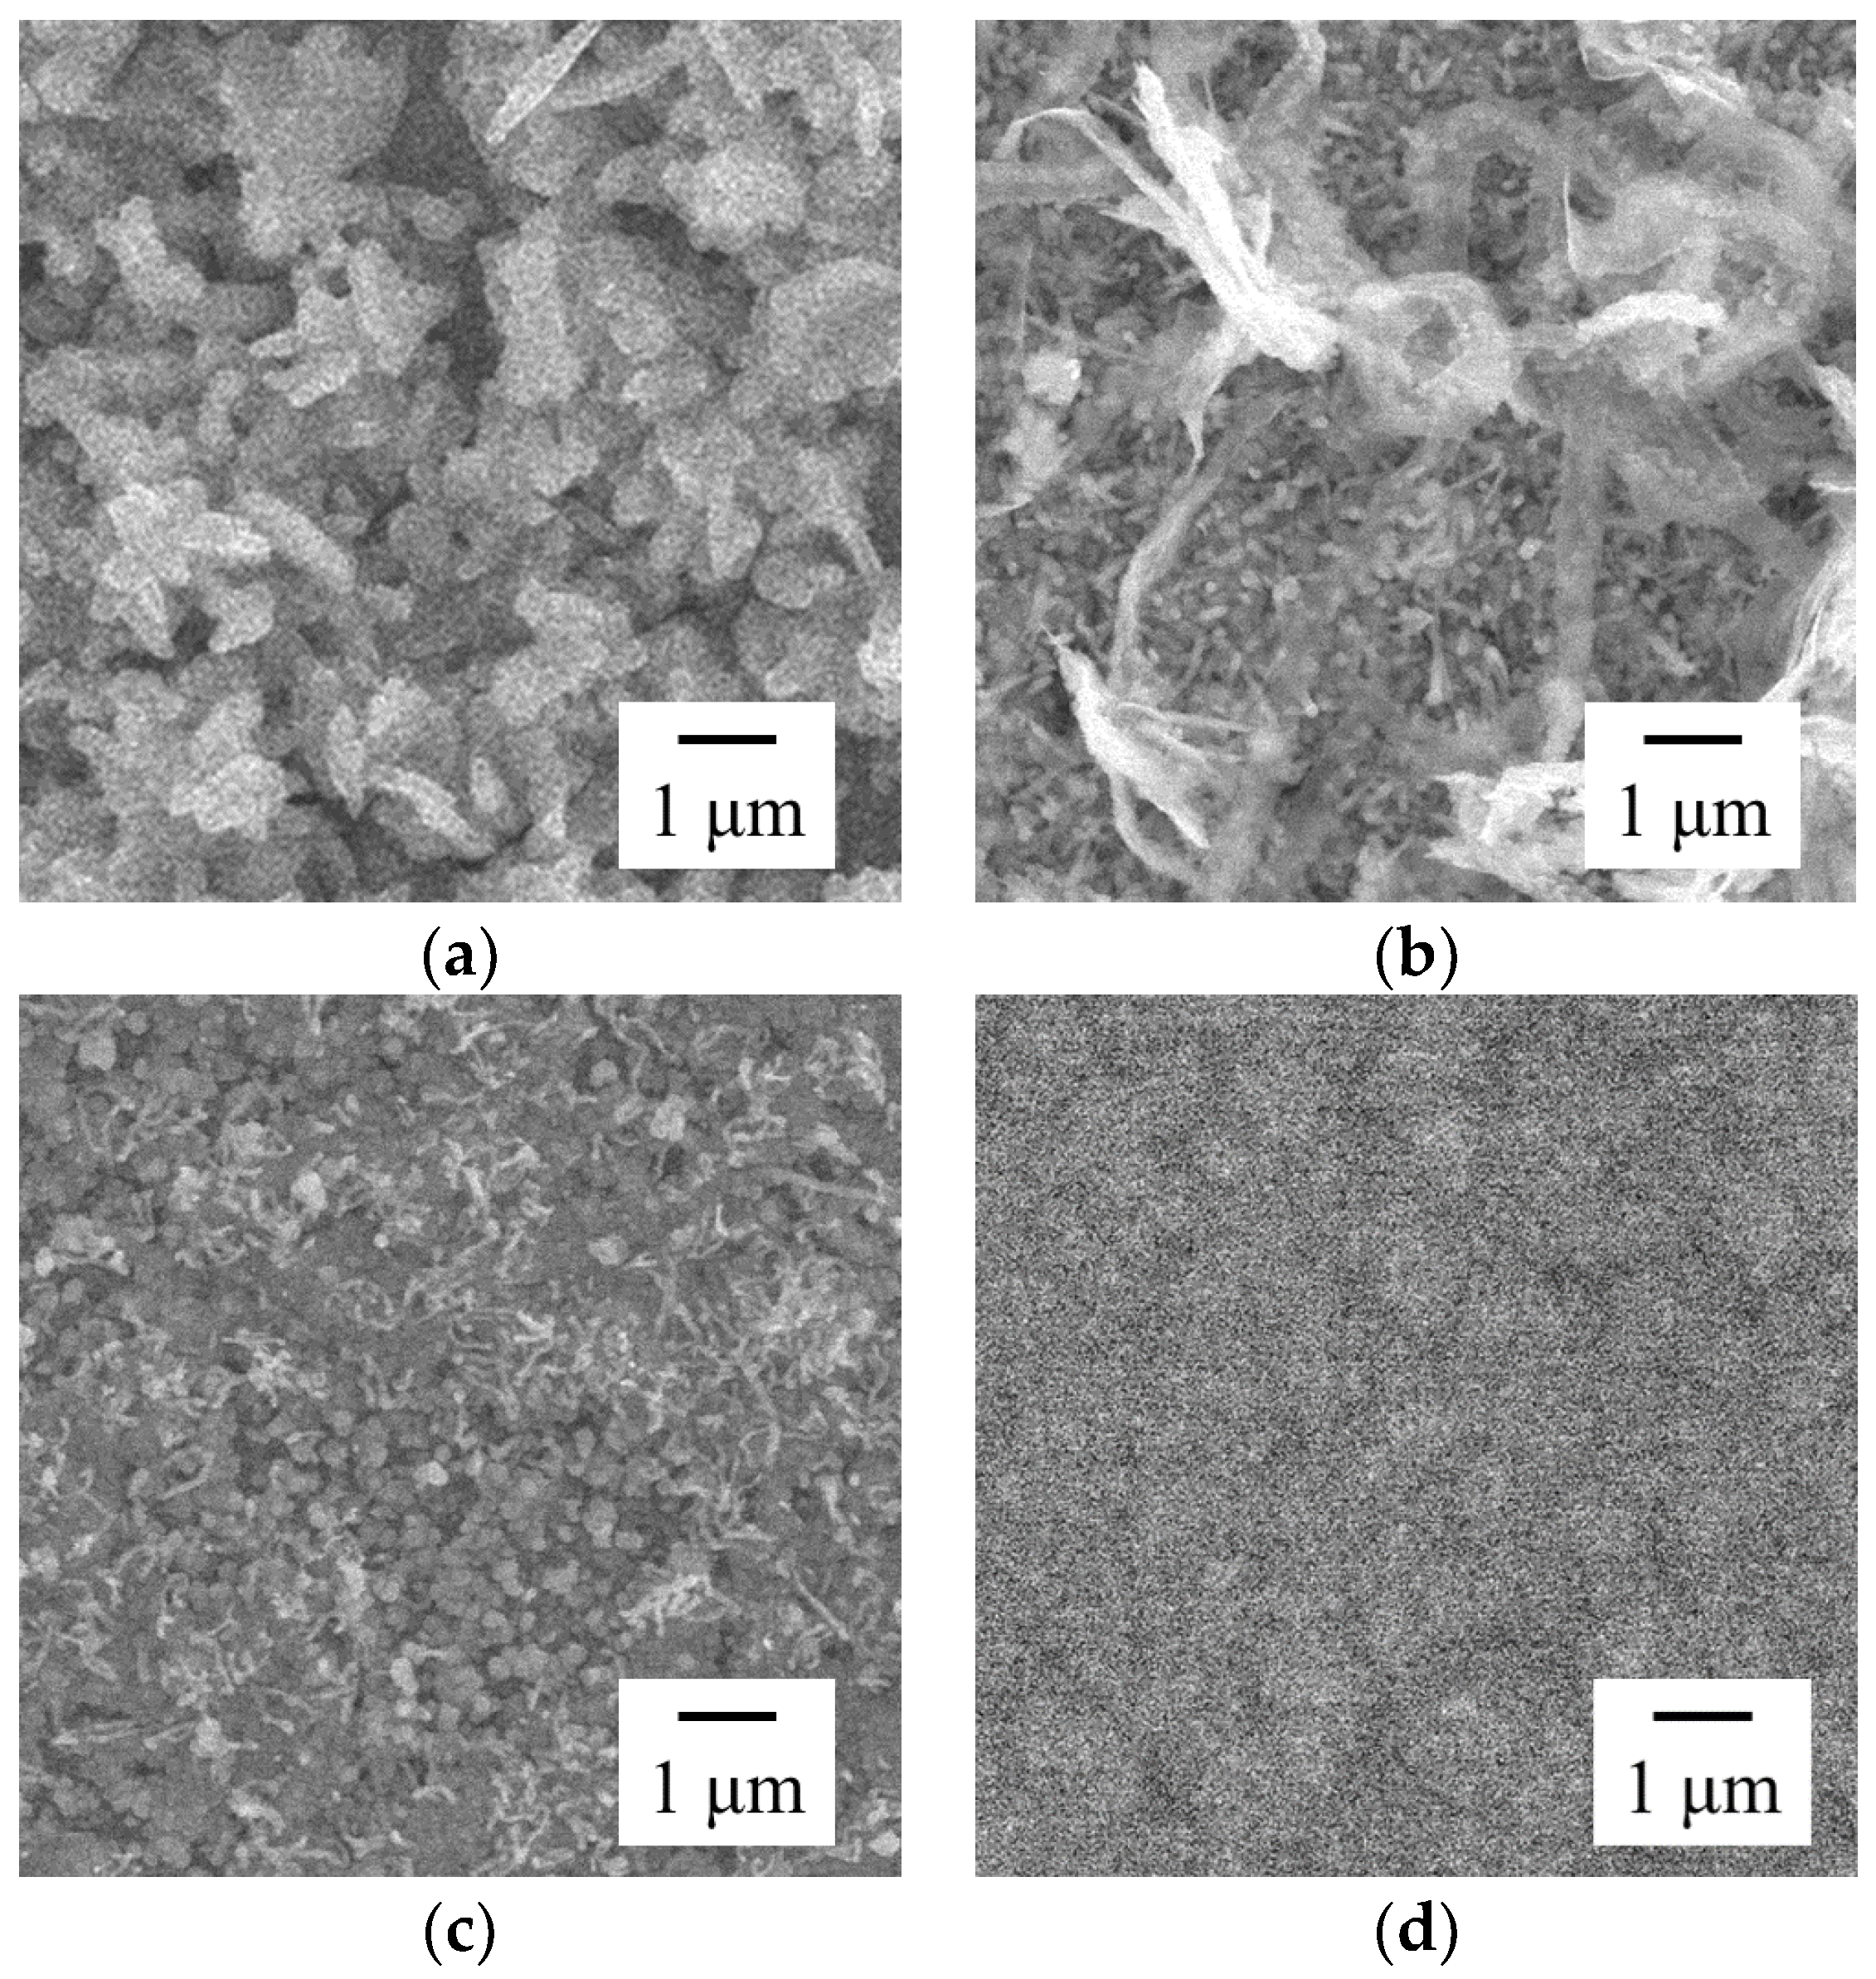
From the results obtained from the cathodic polarization curves, current densities of 1, 2, 5, and 10 mA cm−2 were selected. Figure 6 shows the SEM images of the platings deposited at different current densities. At low current densities, the plating surface was comprised of bulky granules (Figure 6a). The size decreased with increasing current density, probably because a high current density promoted the nucleation on the substrate surface.
Figure 7 shows the relationship between the plating composition and current density. One plot corresponds to one sample. The content of Mo in the plating decreased with increasing current density, possibly corresponding to a high deposition rate of the plating and an insufficient feed rate of the Mo ions. The extremely high deposition rate must have led to the depleted Mo layer near the substrate surface, thereby leading to the slow reduction of Mo [27]. In addition, the composition of the platings, especially of Fe, prepared at current densities of 2 and 5 mA cm−2 were found to be quite scattered. This seemed not to be caused by the difference in the analyzed area since the values before averaging was within ±1 mol % for each plot. The variation in composition may be due to their precipitated form. From the SEM image (Figure 6), the platings obtained by electrodeposition at current densities of 2 and 5 mA cm−2 seemed to be comprised of a mixture of two types of granules while those of 1 and 10 mA cm−2 seemed to be comprised of one. This implies that current densities of 2 and 5 mA cm−2 are in the transition region. The deposition ratio of these two types of grains may have varied in this unstable transition region.
Figure 8 shows the result obtained from the XPS analysis of platings deposited at different current densities. The peaks around 227–228 eV corresponds to metal Mo (Mo (0)) and 229–234 eV corresponds to Mo in the oxide or hydroxide state. Mo (0) was not observed on the plating surface. For the platings deposited at 1 and 2 mA cm−2, changes were not observed even after Ar-ion etching; however, Mo (0) was observed for plating at 5 and 10 mA cm−2 after Ar-ion etching, indicating that a relatively high current density is required to reduce Mo, which is necessary for co-deposition to occur. The low generation rate of atomic hydrogen at the substrate surface may be responsible for this phenomenon since Mo is proposed to be reduced by the generation of atomic hydrogen in previous studies [27,28]. Similar results have been reported for electroplating in a Ni–Mo system [27].
Figure 9 shows the relationship between the current density and current efficiency. The current efficiency increased with current density. As the amount of electric charge was constant, a low current density is equivalent to a long electrodeposition time. The possibility of oxygen dissolution from the atmosphere into the plating bath was suspected, leading to necessity of extra electric charge to reduce the dissolved oxygen in the bath. To confirm this hypothesis, electrodeposition using a bath with continuous Ar bubbling was conducted; however, the current efficiency was found to be of similar value. Thus, the dissolution of oxygen seemed not to be the reason. The decrease in the current efficiency at low current density may be related to the oxidation-reduction reaction between oxides or hydroxides of Mo and Mo oxyanion on the substrate, but further investigation is necessary to understand this phenomenon.
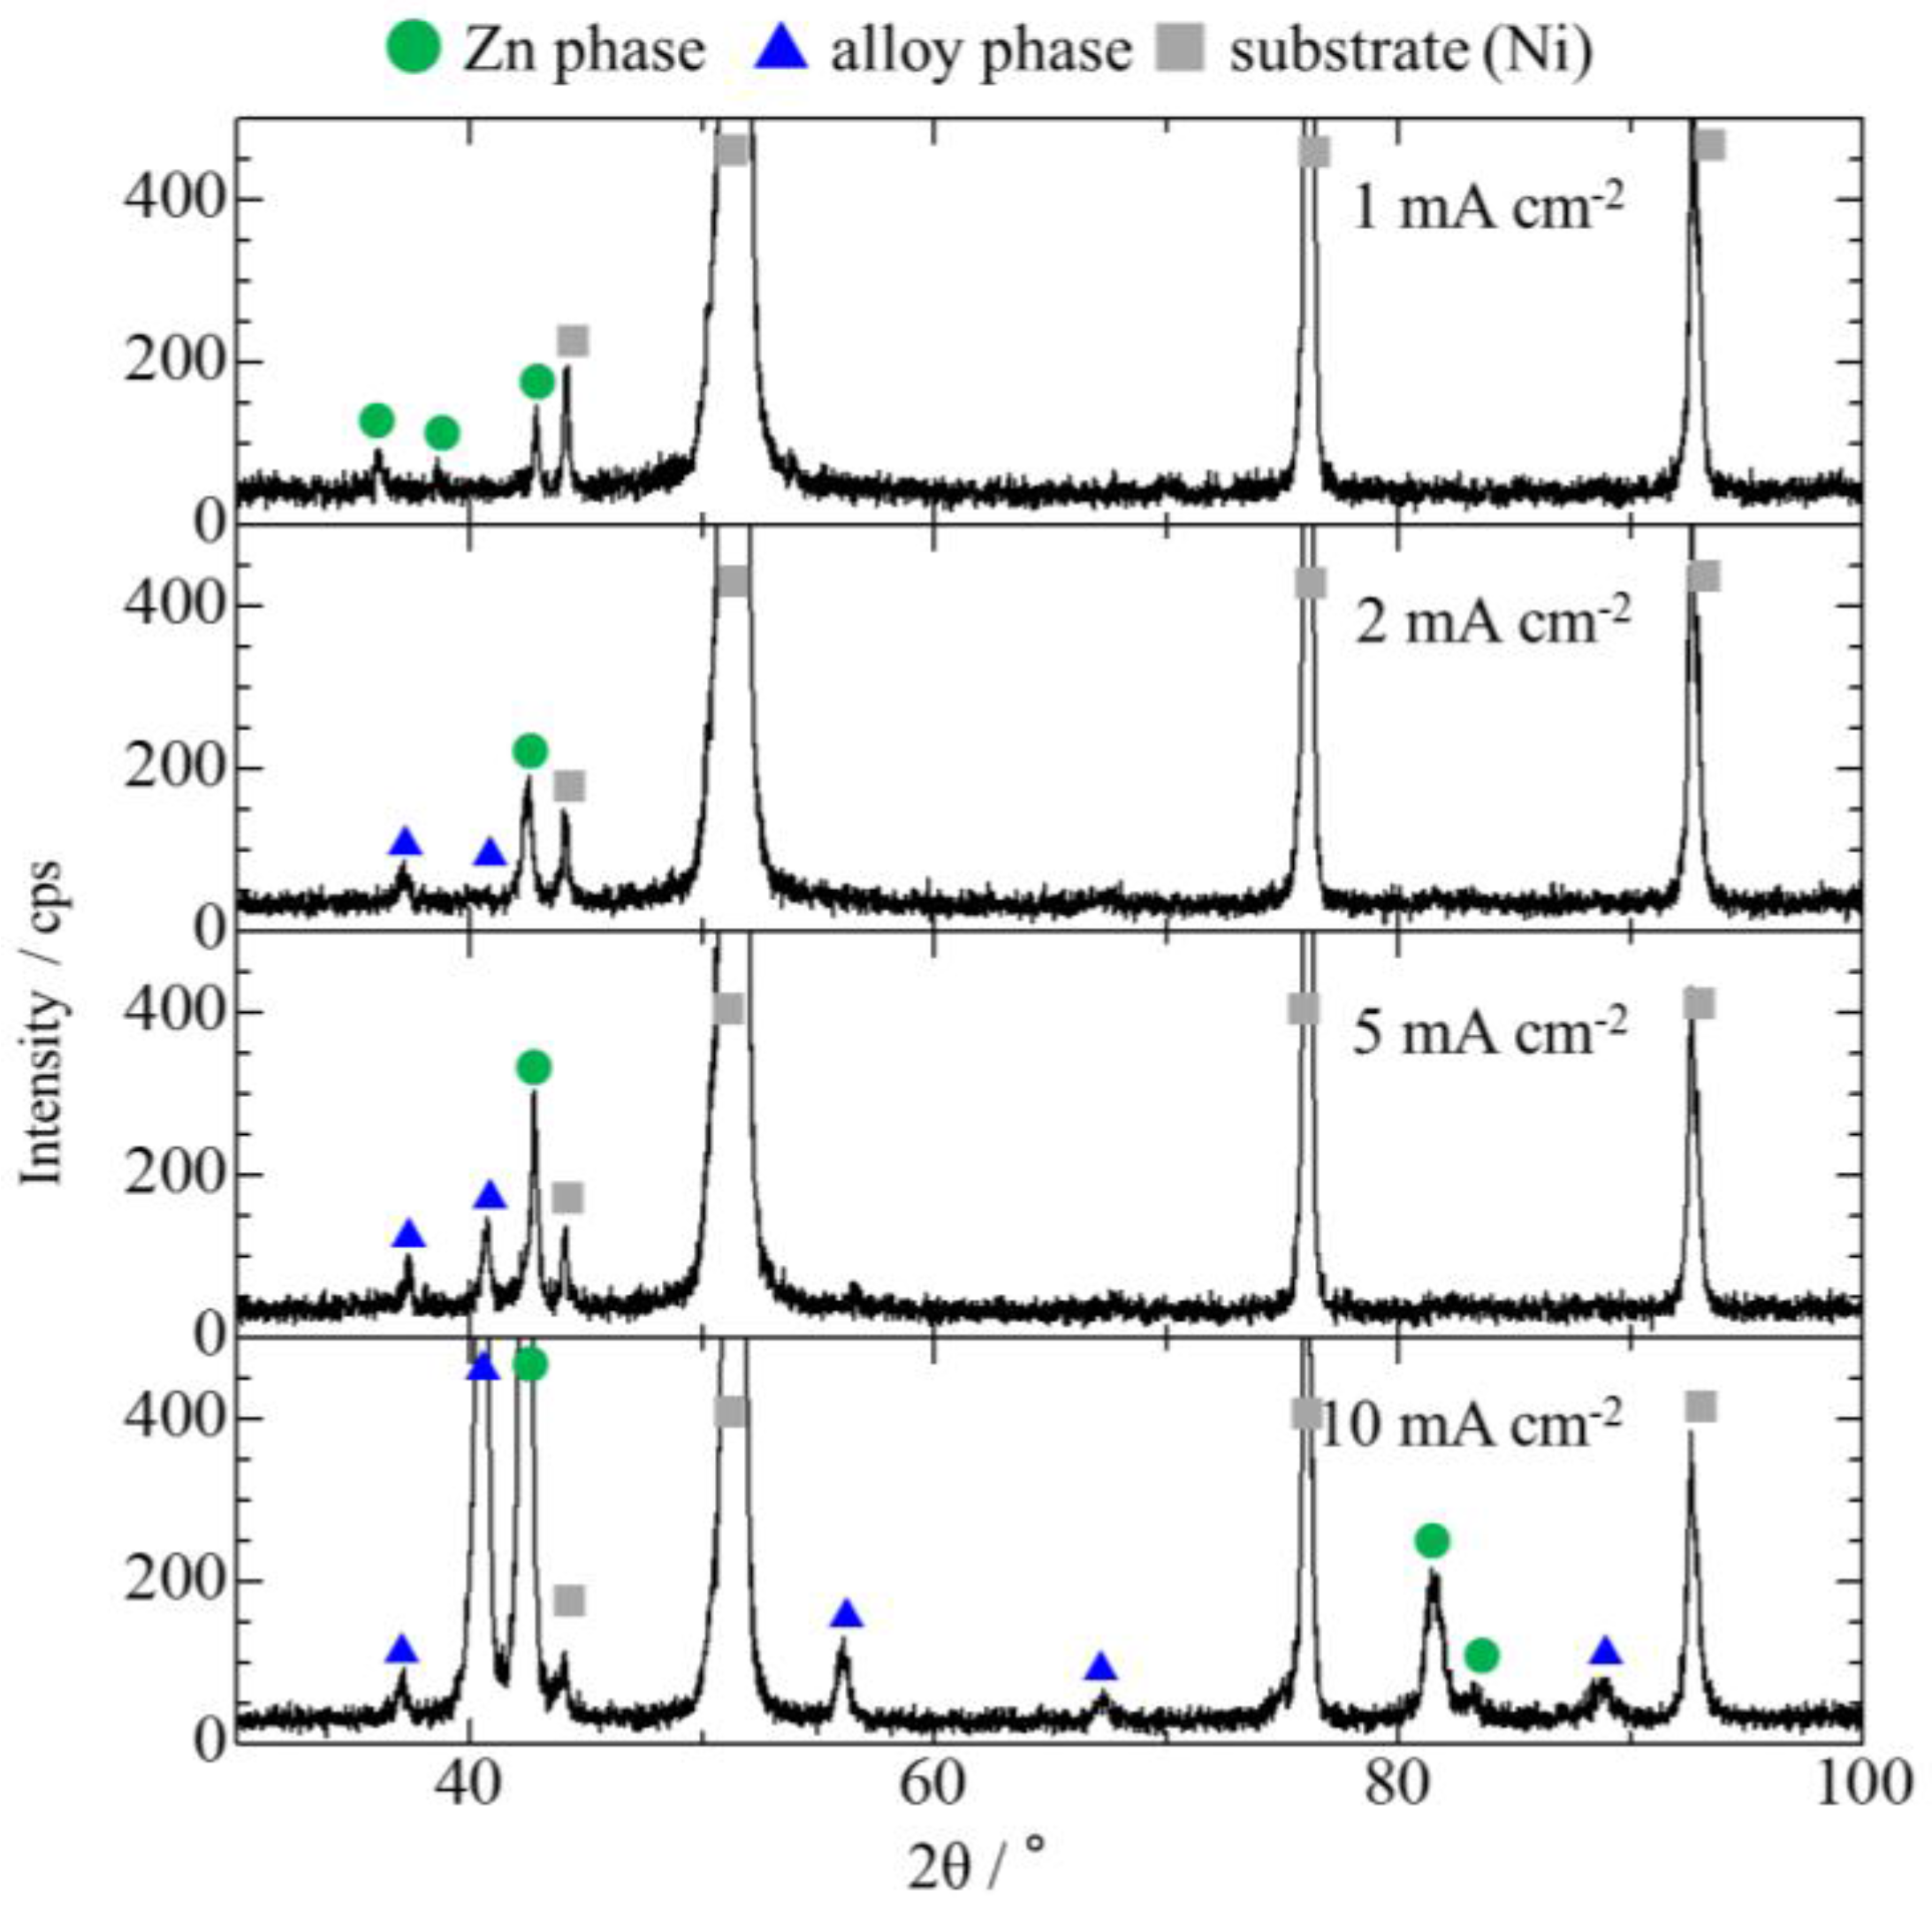
Figure 10 shows the XRD patterns of the platings deposited at various current densities. With increasing current density, peaks corresponding to the alloy phase were observed. The peak of the alloy phase became more intense as the current density increased. Even though a large amount of Mo was detected in platings deposited at low current densities, Mo could not be reduced to form alloys and could only exist as oxides or hydroxides.
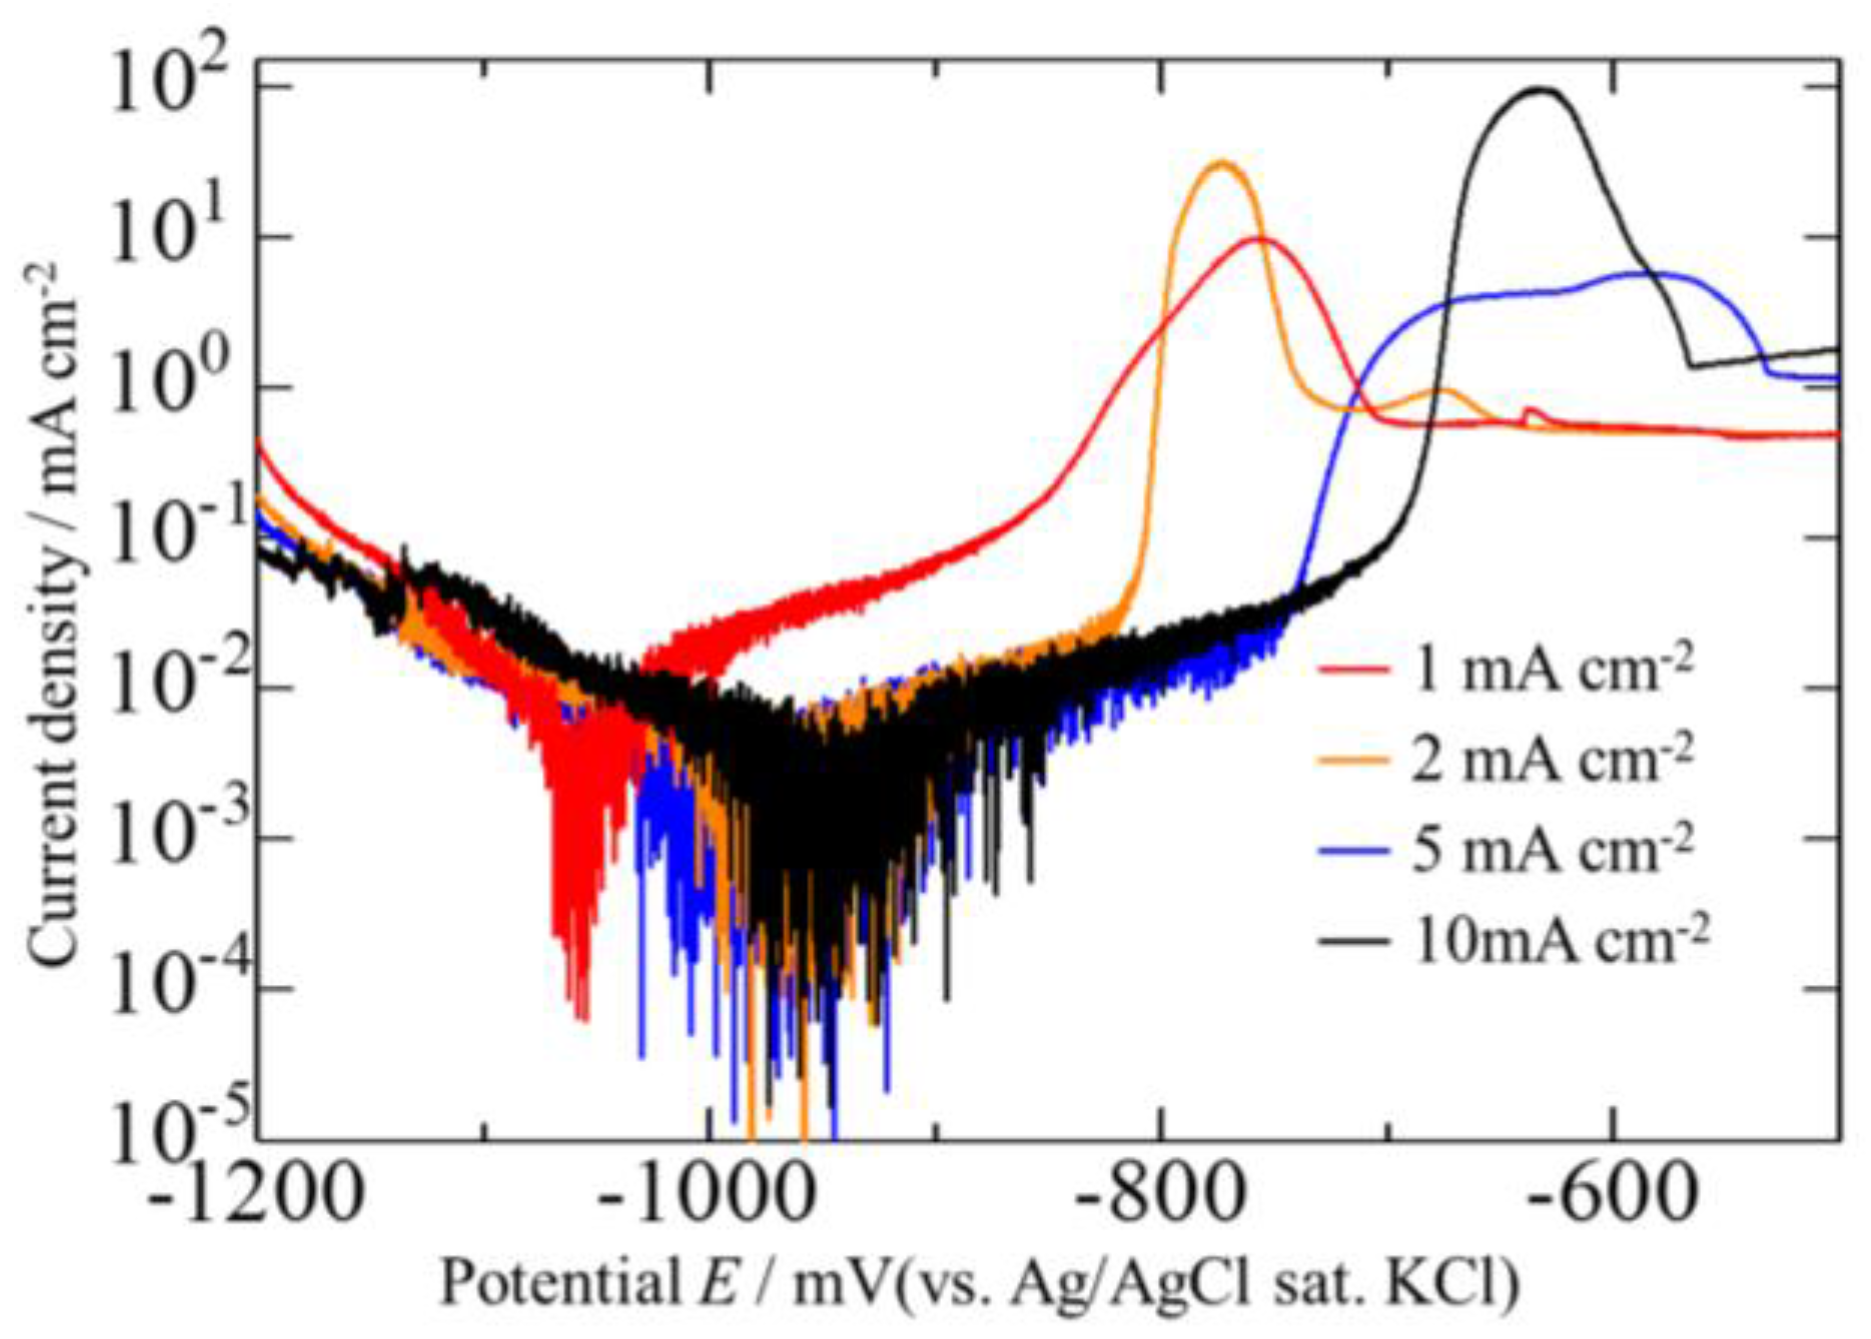
Figure 11 shows the anodic polarization curves of platings deposited at various current densities. With increasing current density, the potential shifted to a more noble value. The presence of an alloy phase is indicated to be crucial, as anticipated in Section 3.1.
3.3. Effect of Mo Concentration of Plating Bath on Zn-Fe-Mo Platings
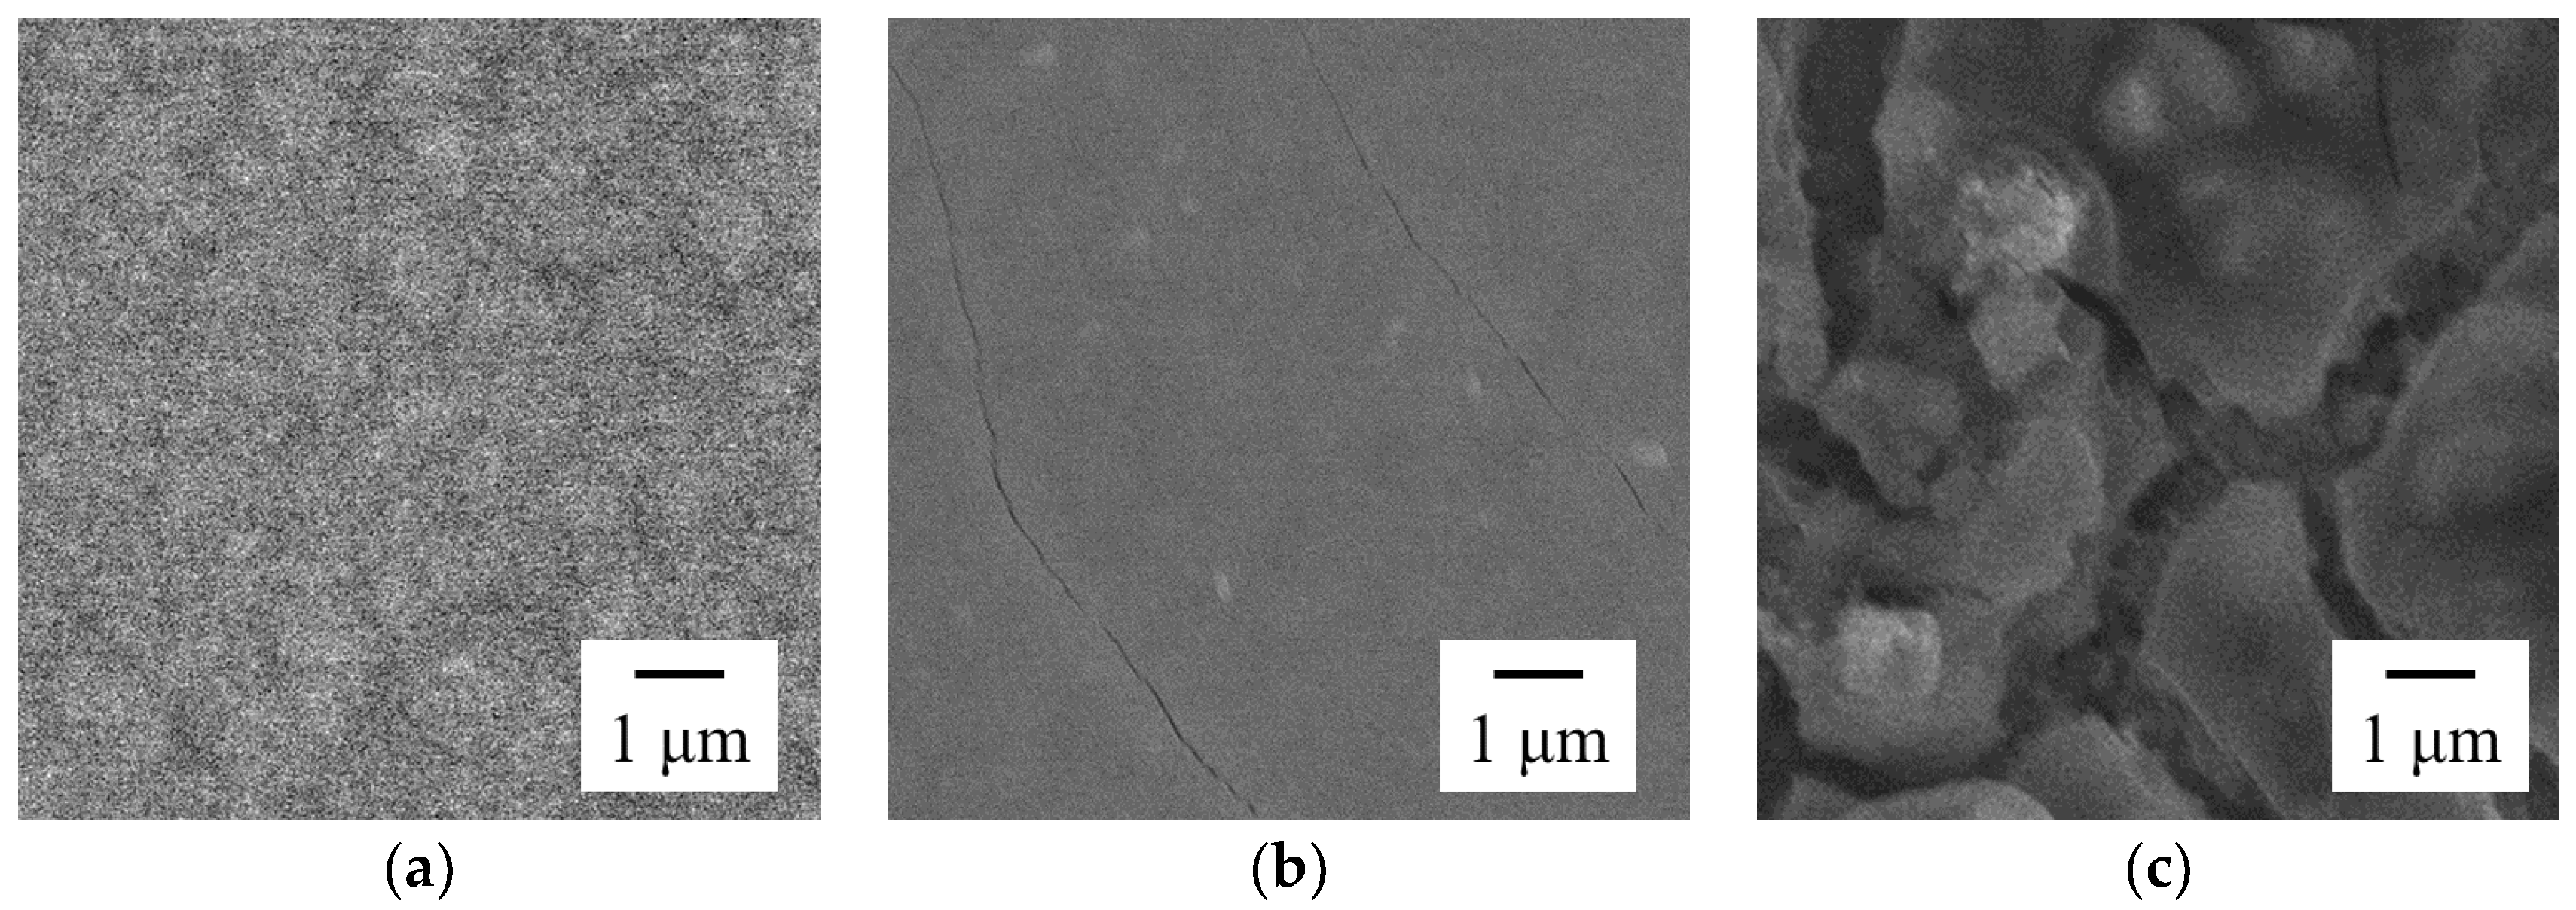
The SEM image of platings obtained when using plating baths with different Mo concentration is shown in Figure 12. The Mo concentration was 0.01 mol dm−3, 0.02 mol dm−3, and 0.1 mol dm−3. The plating obtained from the 0.01 mol dm−3 Mo containing bath showed smooth and homogeneous surface; however, small cracks were observed by increasing the Mo concentration to 0.02 mol dm−3 and a rough surface with even more cracks were observed by further increasing the Mo concentration to 0.1 mol dm−3. An increase in Mo concentration of the plating bath seems to have had a negative effect on the plating quality.
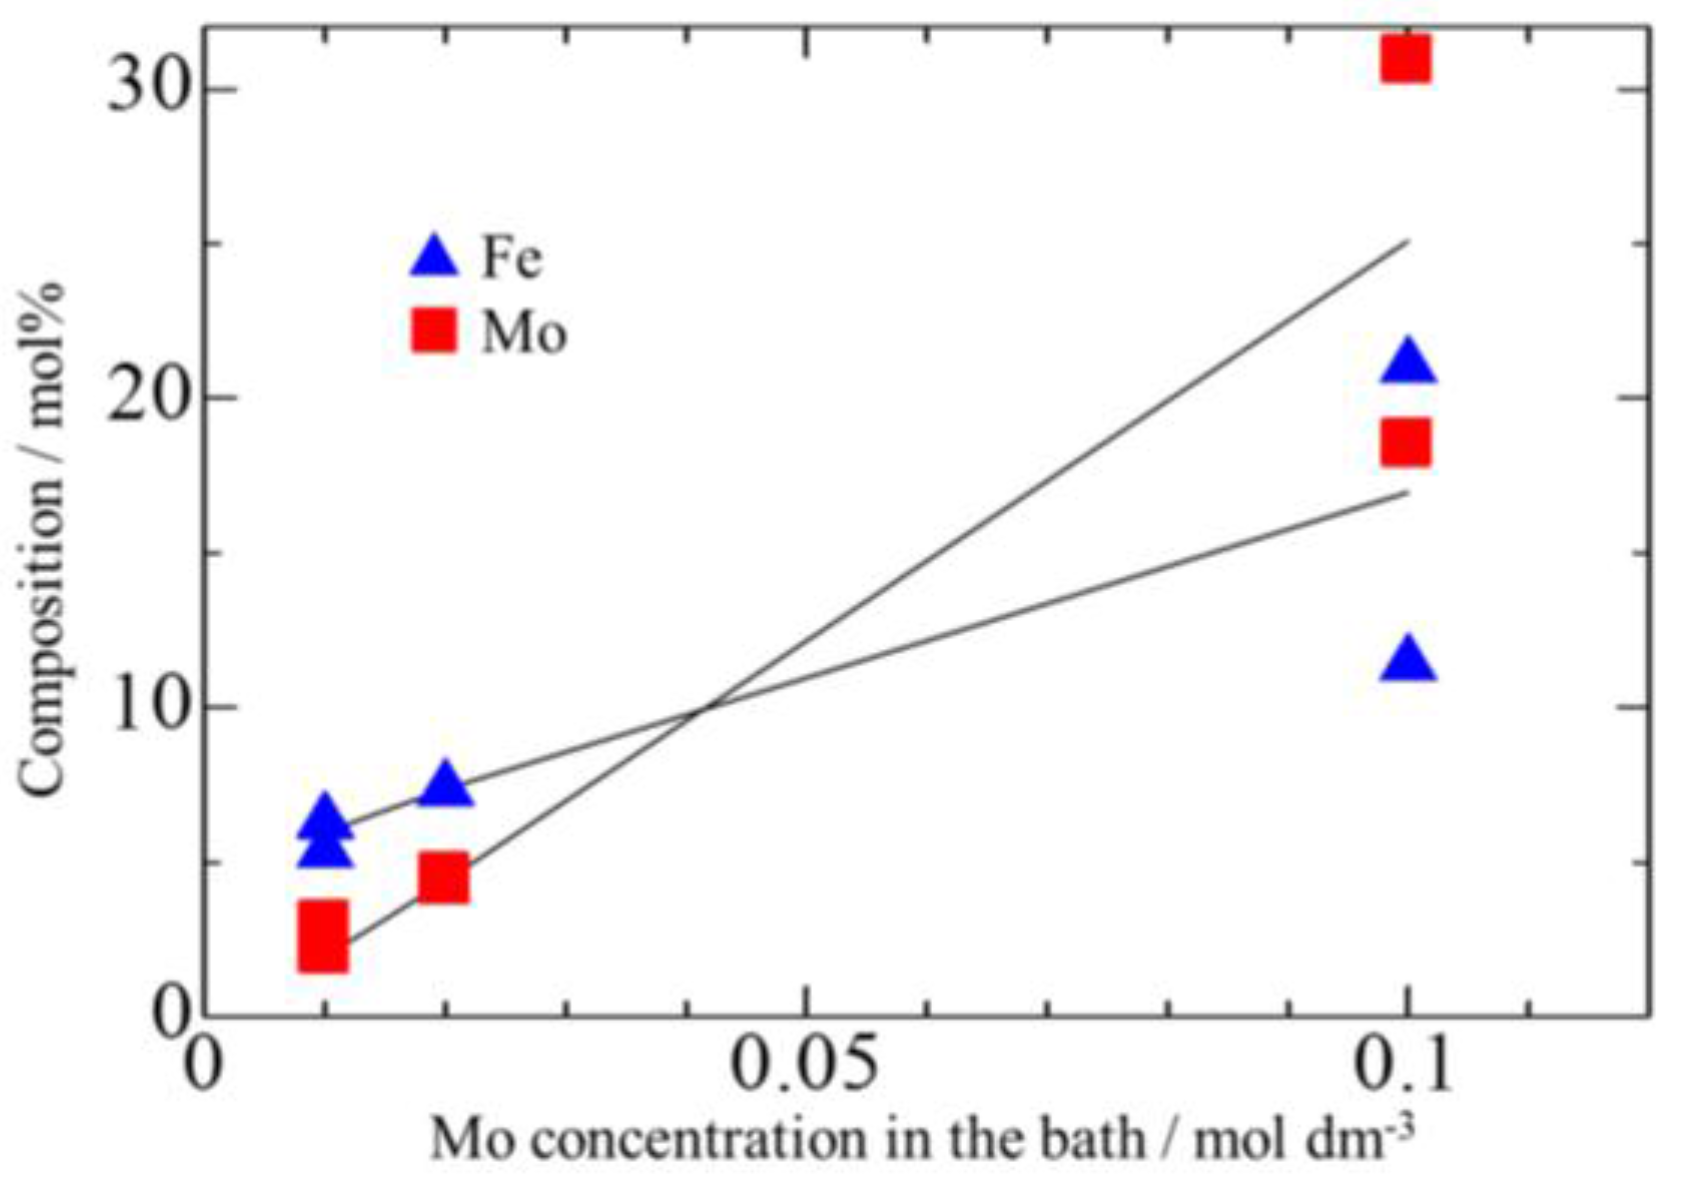
The composition of Mo content in the platings are shown in Figure 13. An increase in the content of Fe and Mo in the platings was observed by increasing the Mo concentration of the plating bath. This is because more MoO2− were supplied and adsorbed onto the surface of the substrate along with the increase in Mo concentration in the plating bath.
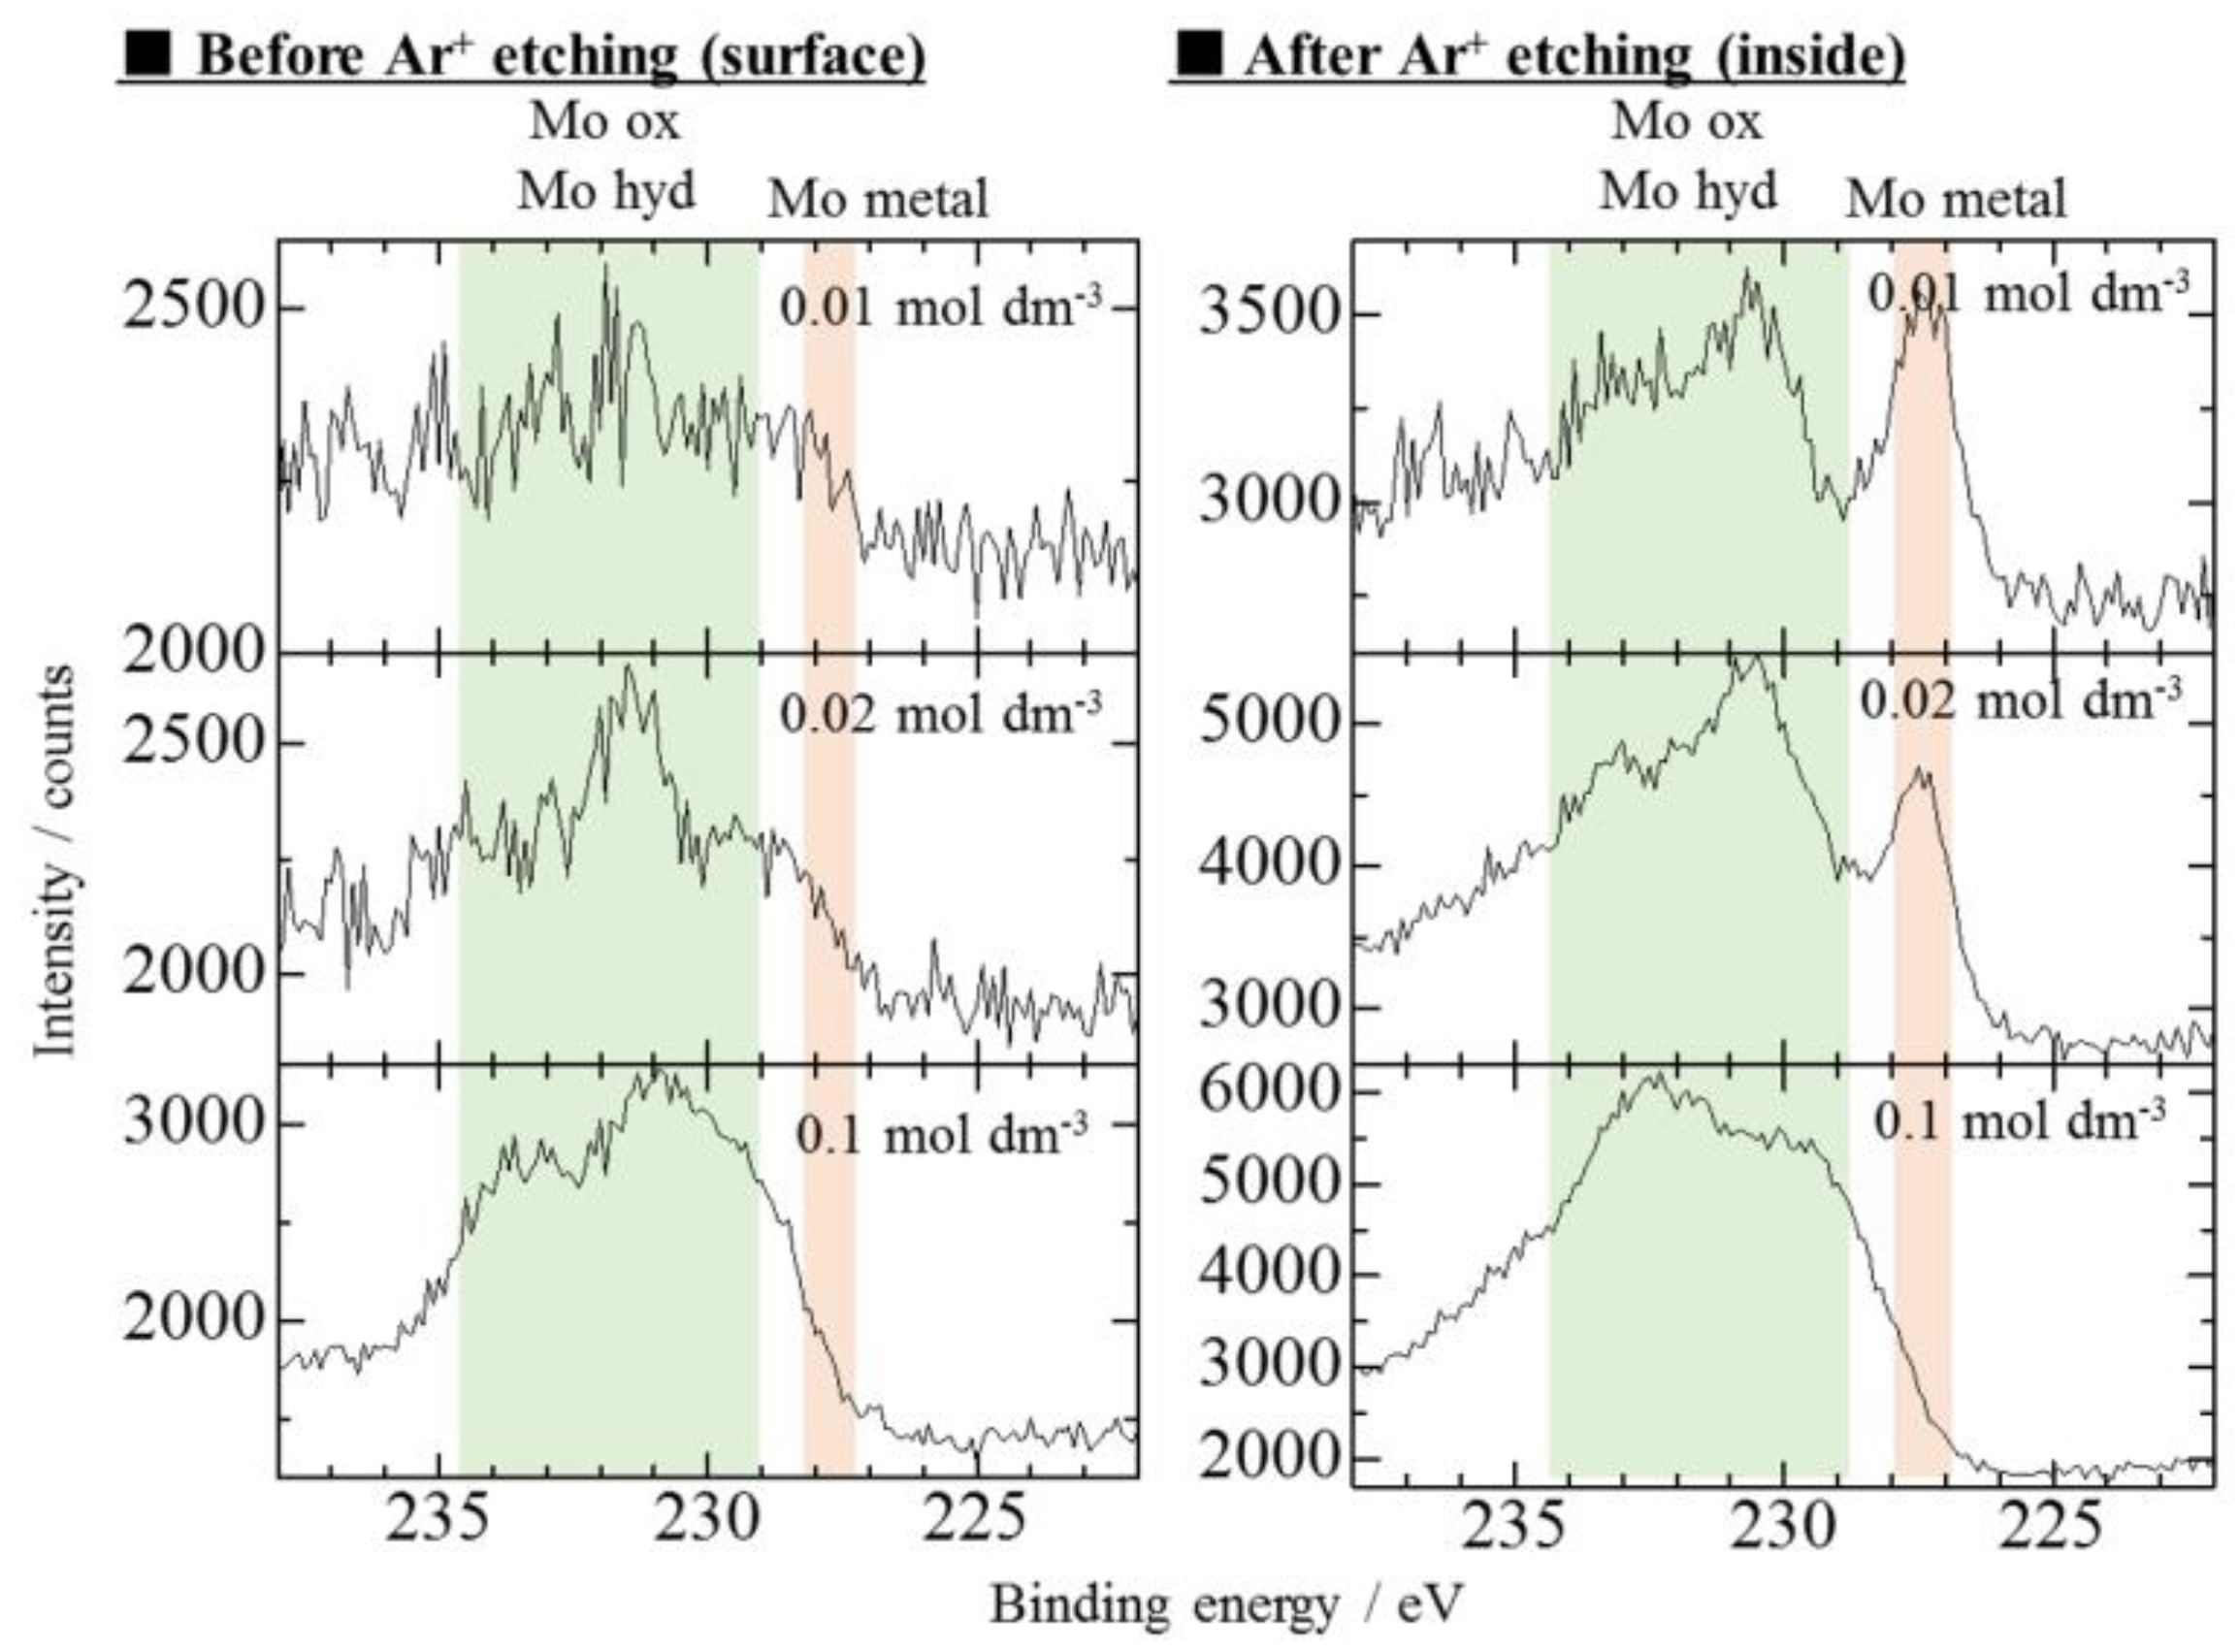
Figure 14 shows the result obtained from the XPS analysis of platings deposited from plating baths with different Mo concentrations. Again, Mo (0) was not observed on the plating surface. After Ar-ion etching, Mo (0) was observed for plating deposited from baths containing 0.01 and 0.02 mol dm−3 Mo, however, not from baths containing 0.1 mol dm−3 Mo. At low Mo concentration, both Fe and hydroxide of Mo by reduction of MoO2− shall coexist on the surface of the substrate and Mo may thus be reduced since the atomic hydrogen can be held at the unpaired 3d electrons on the Fe metals [28]. In contrast, at high Mo concentrations, the surface of the substrate will be covered with excess hydroxides of Mo, making it difficult for Fe to approach the plating surface. Thus, further reduction of hydroxides of Mo must be prevented due to the lack of Fe; i.e., the lack of atomic hydrogen. Zn must have been prevented as well by the hydroxide of Mo.
Figure 15 shows the relationship between the Mo concentration in the plating bath and current efficiency. The current efficiency decreased by increasing the Mo concentration in the plating bath. The increasing formation of hydroxide of Mo on the surface prevents Fe deposition, resulting in a lower current efficiency [29]. The trend of the current efficiency seems to support this expectation.
Figure 16 shows the XRD patterns of the platings deposited from baths of various Mo concentrations. The intense peaks of alloy phase were detected as decreasing the Mo concentration. This also supports the idea that Mo in the plating existed in the Mo (0) form and lower Mo concentration led to enhanced formation of Mo (0).
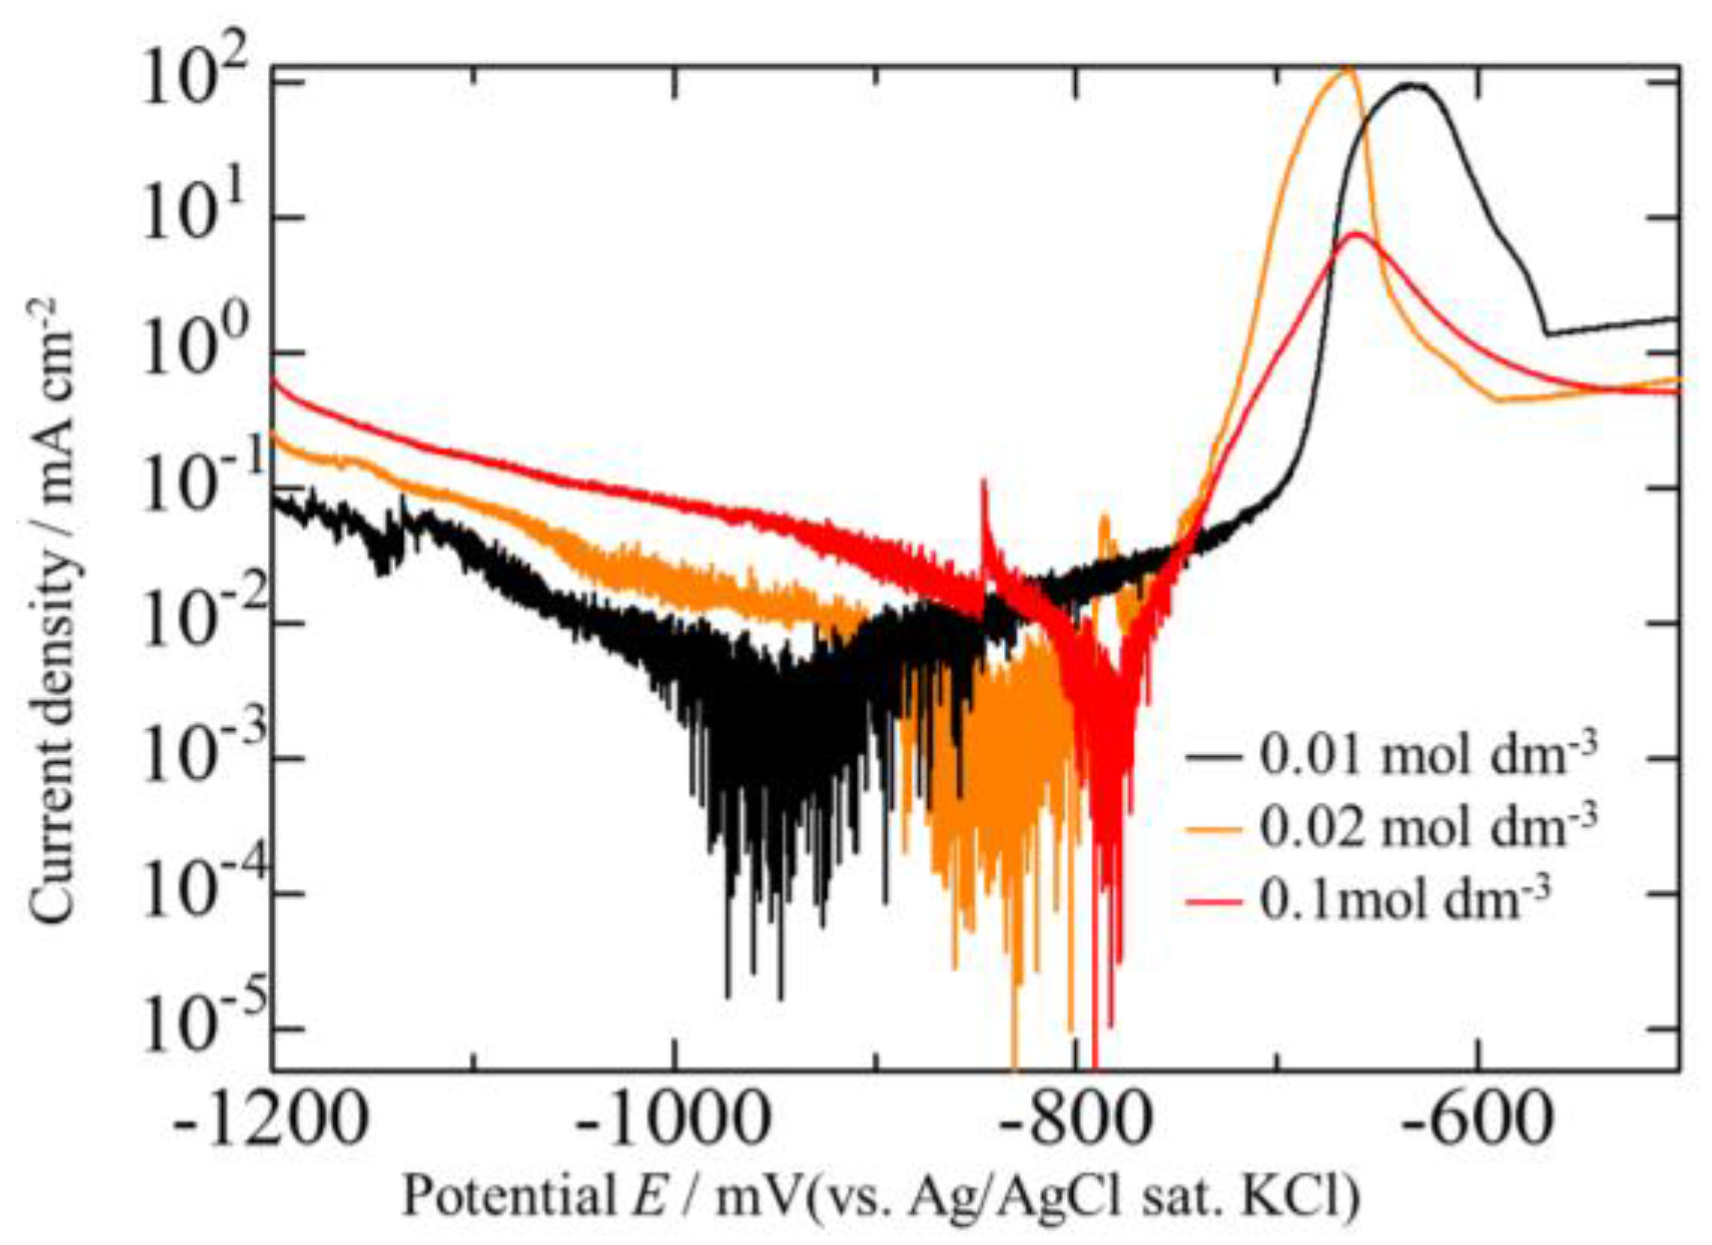
Figure 17 shows the anodic polarization curves of platings deposited from baths with various Mo concentrations. All three platings showed relatively noble potentials. A decrease in Mo concentration of the plating bath, corresponding to more intense peaks of the alloy phase, shifted the potential to a more noble value. Again, the results support the idea that the presence of an alloy phase is important.
3.4. Corrosion Potentials of the Zn–Fe–Mo Platings
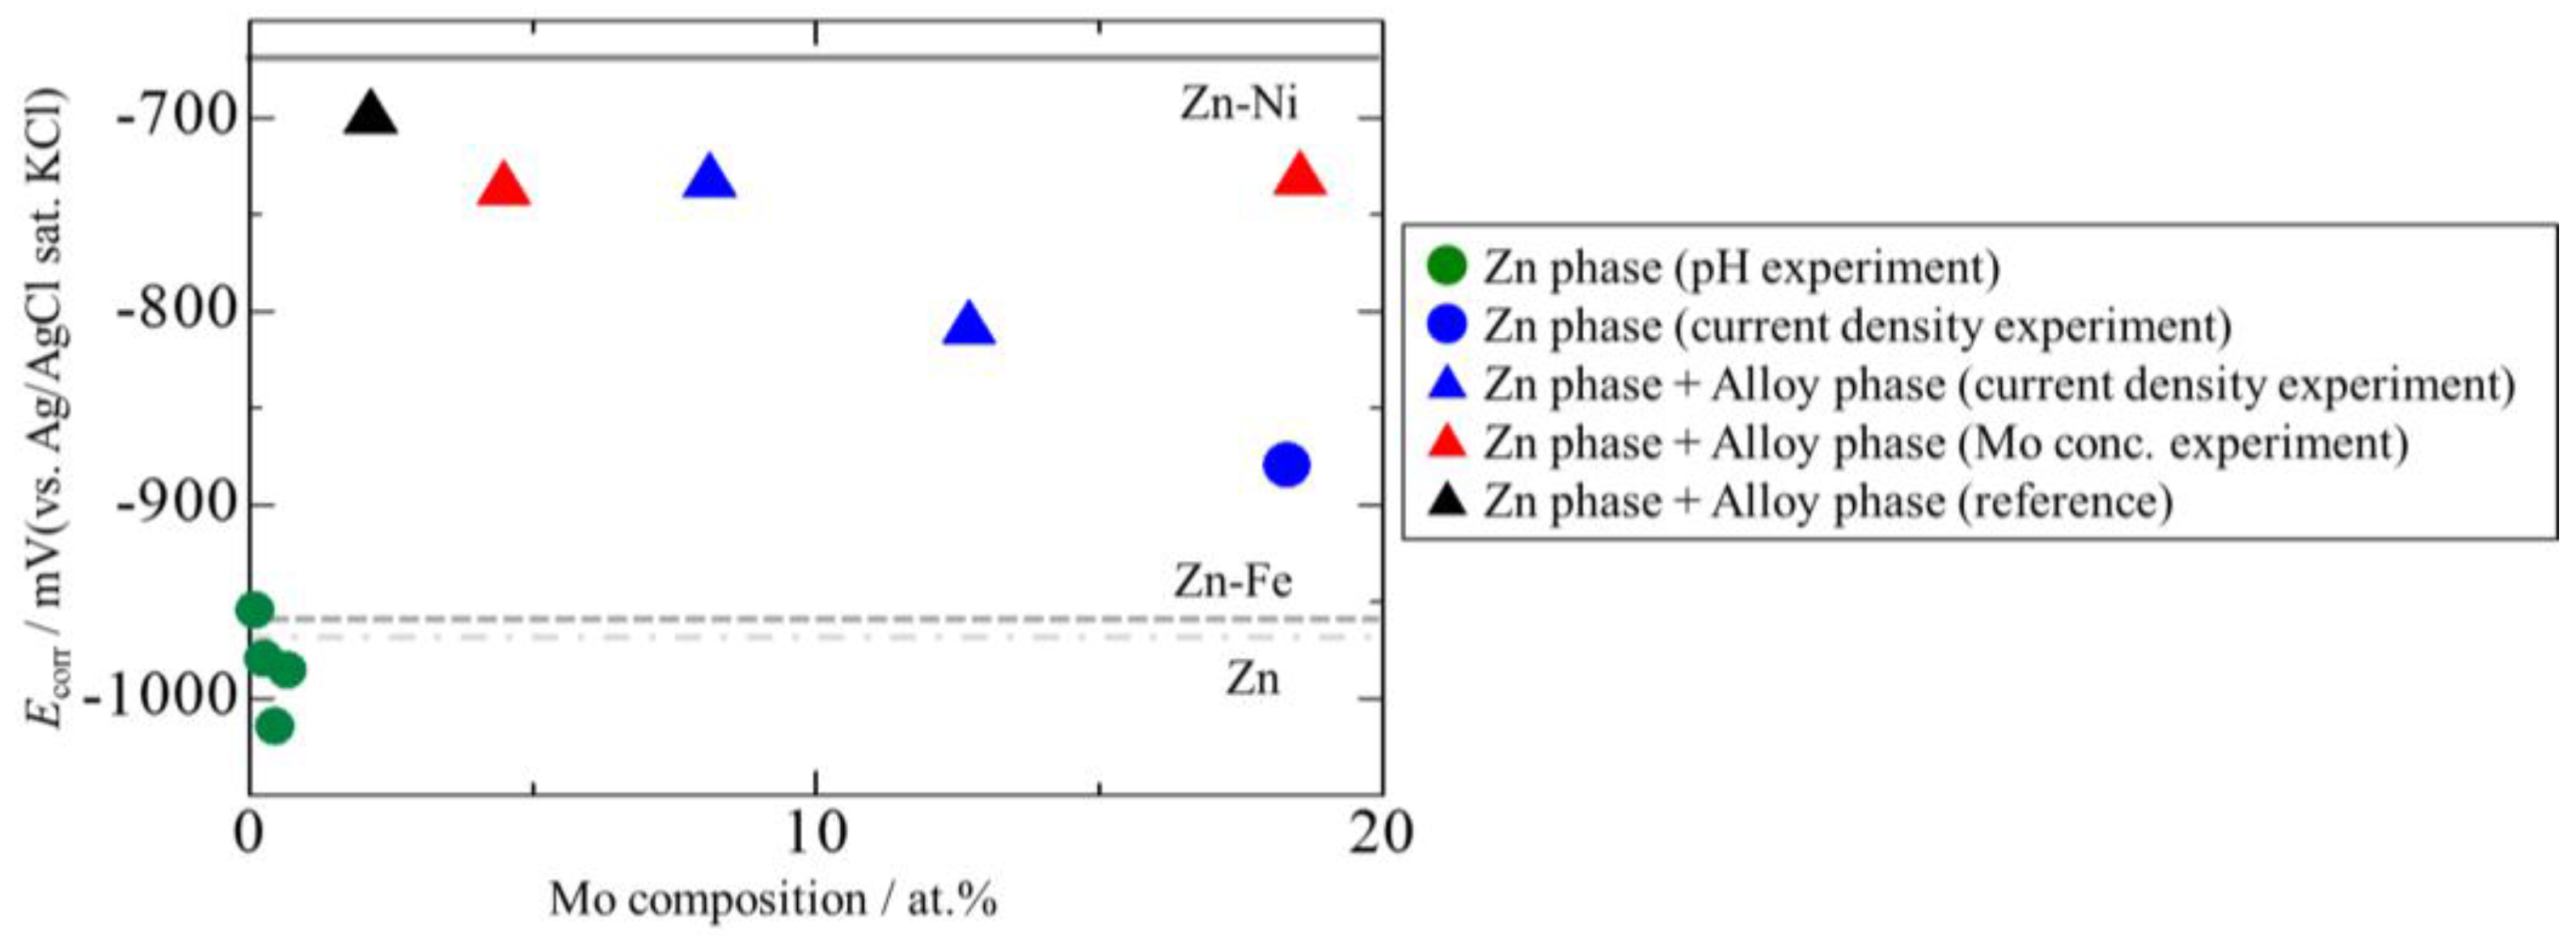
Figure 18 shows the relationship between the content of Mo in the plating and Ecorr, as well as the Ecorr values for Zn, Zn–Fe, and Zn–Ni platings. A low Mo content led to high Ecorr; however, it was not proportional to the content of Mo in the plating. This indicated that the Mo content in the plating is not the primary factor improving the corrosion resistance of the plating.
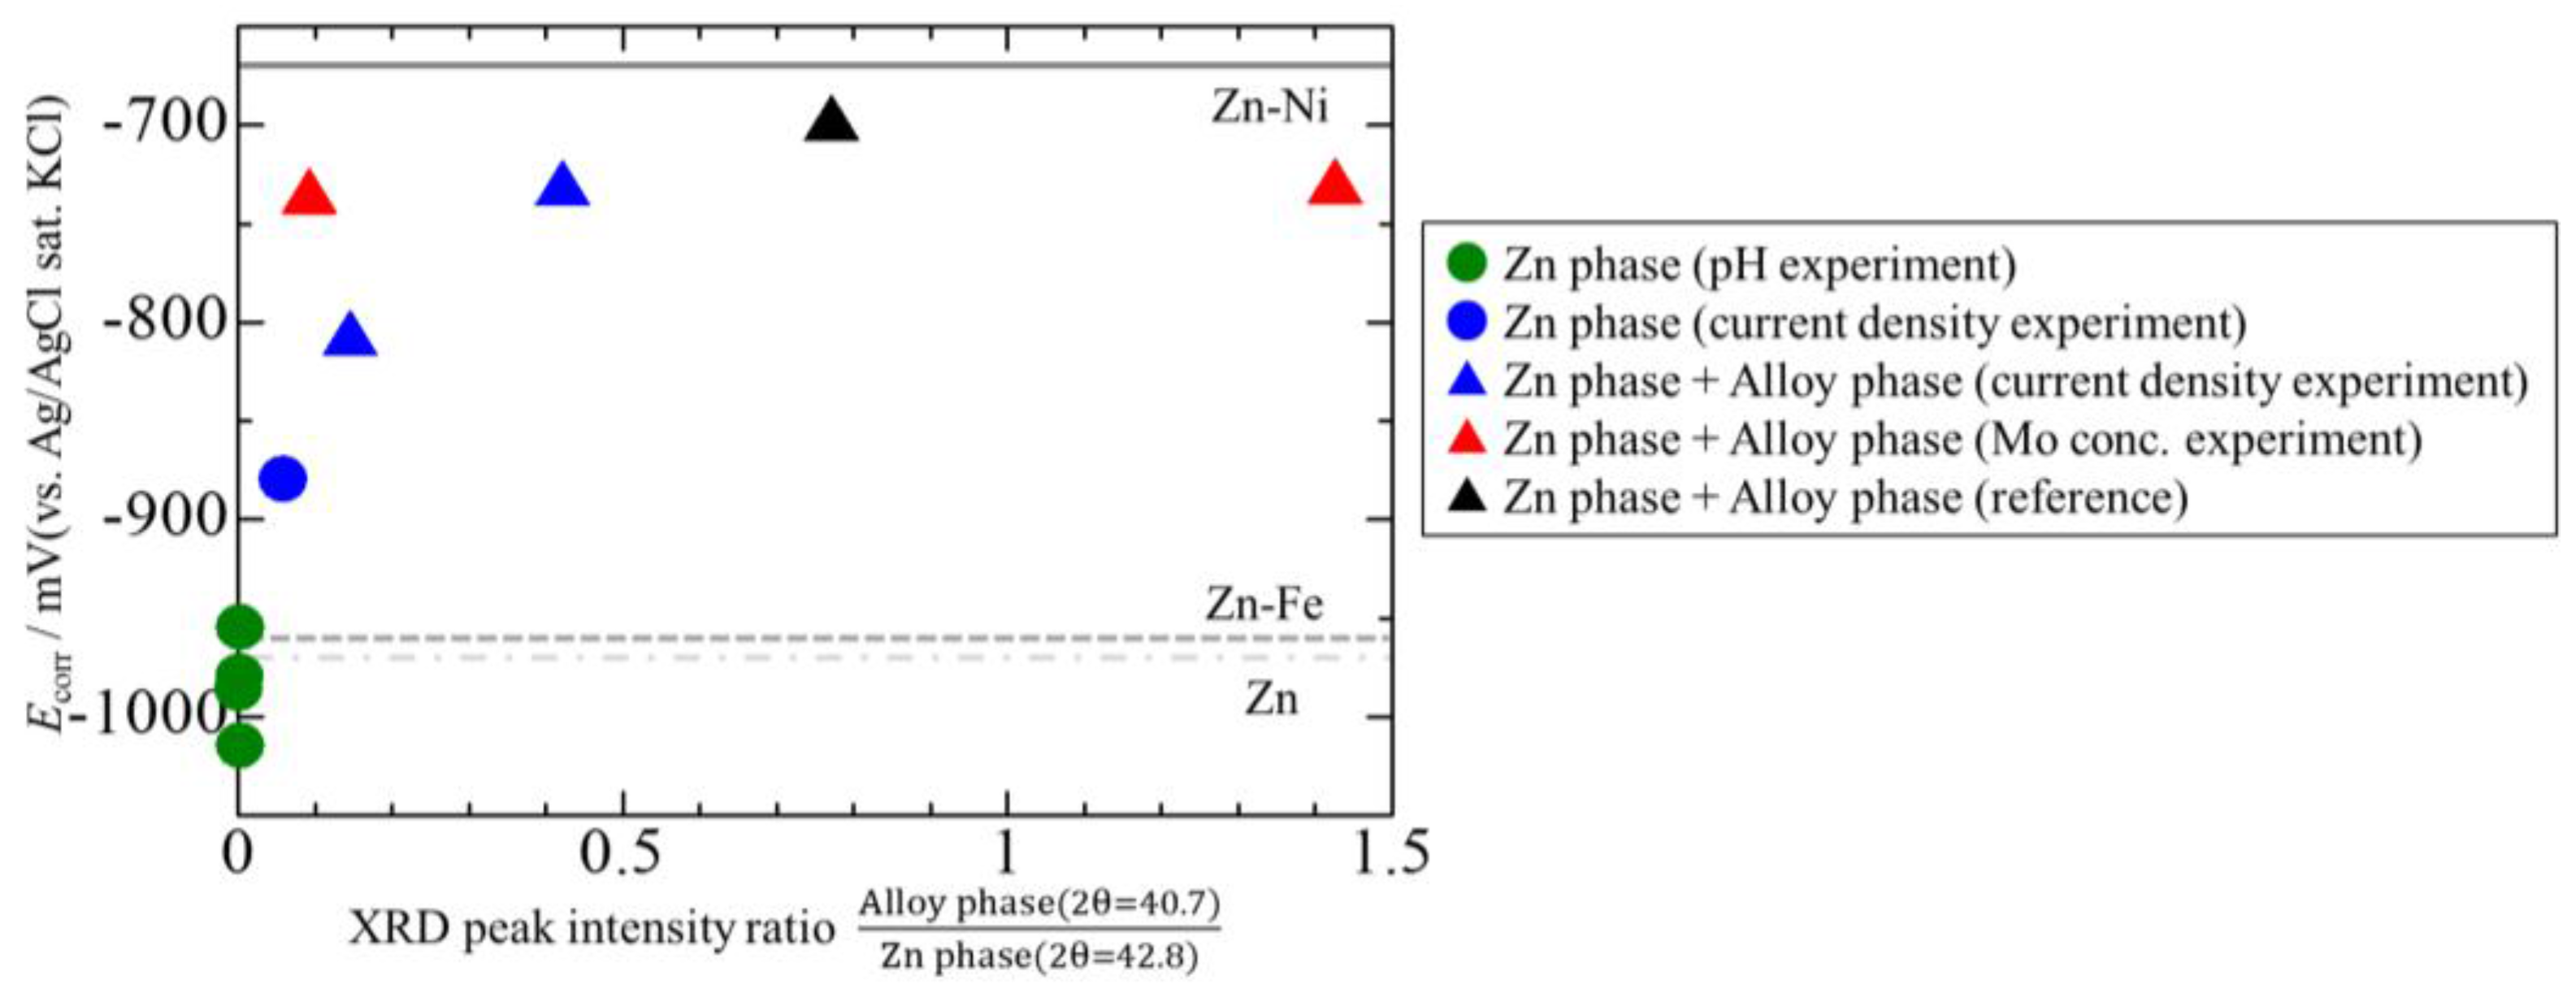
Figure 19 shows the relationship between the peak intensity ratio of the alloy and Zn phases from XRD and Ecorr to discuss the effect of alloy phase. Peaks corresponding to the alloy and Zn phases were observed at 2θ values of 40.7° and 42.8°, respectively, apparently indicating that the deposition of the alloy phase is crucial for high corrosion resistance.
4. Conclusions
In this study, the addition of Mo into the Zn–Fe platings was considered to improve its corrosion resistance. The following results were obtained.
- The Zn–Fe–Mo platings obtained by this experiment exhibited high corrosion resistance when the electrically-deposited layer formed a Fe3Mo-based alloy phase.
- The best plating exhibited high corrosion resistance comparable with that of Zn–Ni platings, revealing promise for Zn–Fe–Mo platings as potential alternatives for Zn–Ni platings.
- For the co-deposition of Mo, it is crucial to control the pH to approximately 5.7 to ensure that Mo does not form large polyoxides and Zn does not form hydroxides.
- Co-deposition does not effectively occur at low current densities, and a high Mo concentration in the bath as Mo (IV) cannot be efficiently reduced to Mo (0).
Author Contributions
Daichi Kosugi mainly performed the experiments and analyses; Takeshi Hagio considered the data and wrote the paper; Yuki Kamimoto gave important advice throughout the experiments; and Ryoichi Ichino conceived and designed the experiments.
Conflicts of Interest
The authors declare no conflict of interest.
References
- Nesic, S.; Postlethwaite, J.; Olsen, S. An electrochemical model for prediction of corrosion of mild steel in aqueous carbon dioxide solutions. Corrosion 1996, 52, 280–294. [Google Scholar] [CrossRef]
- Lo, K.H.; Shek, C.H.; Lai, J.K.L. Recent developments in stainless steels. Mater. Sci. Eng. 2009, 65, 39–104. [Google Scholar] [CrossRef]
- Mackowiak, J.; Short, N.R. Metallurgy of galvanized coatings. Int. Met. Rev. 1979, 24, 1–19. [Google Scholar] [CrossRef]
- Byk, T.V.; Gaevskaya, T.V.; Tsybulskaya, L.S. Effect of electrodeposition conditions on the composition, microstructure, and corrosion resistance of Zn–Ni alloy coatings. Surf. Coat. Technol. 2008, 202, 5817–5823. [Google Scholar] [CrossRef]
- Tozar, A.; Karahan, I.H. Structural and corrosion protection properties of electrochemically deposited nano-sized Zn–Ni alloy coatings. Appl. Surf. Sci. 2014, 318, 15–23. [Google Scholar] [CrossRef]
- Yadav, A.P.; Katayama, H.; Noda, K.; Masuda, H.; Nishikata, A.; Tsuru, T. Effect of Fe–Zn alloy layer on the corrosion resistance of galvanized steel in chloride containing environments. Corros. Sci. 2007, 49, 3716–3731. [Google Scholar] [CrossRef]
- Boshkov, N.; Petrov, K.; Vitkova, S.; Nemska, S.; Raichevsky, G. Composition of the corrosion products of galvanic alloys Zn–Co and their influence on the protective ability. Surf. Coat. Technol. 2002, 157, 171–178. [Google Scholar] [CrossRef]
- Shibuya, A.; Kurimoto, T.; Korekawa, K.; Noji, K. Corrosion-resistance of electroplated Ni–Zn alloy steel sheet. Tetsu-to-Hagane 1980, 7, 771–778. (In Japanese) [Google Scholar] [CrossRef]
- Gnanamuthu, M.R.; Mohan, S.; Saravanan, G.; Leea, C.W. Comparative study on structure, corrosion and hardness of Zn–Ni alloy deposition on AISI 347 steel aircraft material. J. Alloys Compd. 2012, 513, 449–454. [Google Scholar] [CrossRef]
- Goldenberg, A.; Admani, S.; Janice, J.L.; Jacob, S.E. Belt buckles—Increasing awareness of nickel exposure in children: A case report. Pediatrics 2015, 136, 691–693. [Google Scholar] [CrossRef] [PubMed]
- Saito, M.; Arakaki, R.; Yamada, A.; Tsunematsu, T.; Kudo, Y.; Ishimaru, N. Molecular mechanisms of nickel allergy. Mol. Sci. 2016, 17. [Google Scholar] [CrossRef] [PubMed]
- Qun, Z.L. Electrodeposition of zinc-iron alloy from an alkaline zincate bath. Met. Finish. 1998, 96, 56–57. [Google Scholar] [CrossRef]
- Sriraman, K.R.; Raman, S.G.S.; Seshadri, S.K. Corrosion behaviour of electrodeposited nanocrystalline Ni–W and Ni–Fe–W alloys. Mater. Sci. Eng. 2007, 460–461, 39–45. [Google Scholar] [CrossRef]
- Naka, M.; Hashimoto, K.; Masumoto, T. High corrosion resistance of amorphous Fe–Mo and Fe–W alloys in HCl. J. Non-Cryst. Solids 1978, 29, 61–65. [Google Scholar] [CrossRef]
- Akiyama, T.; Fukushima, H. Recent study on the iron-group metal alloy. ISIJ Int. 1992, 32, 787–798. [Google Scholar] [CrossRef]
- Podlaha, E.J.; Landolt, D. Induced codeposition I. An experimental investigation of Ni–Mo alloys. J. Electrochem. Soc. 1996, 143, 885–892. [Google Scholar] [CrossRef]
- Winiarski, J.; Tylus, W.; Winiarska, K.; Szczygieł, B. The influence of molybdenum on the corrosion resistance of ternary Zn–Co–Mo alloy coatings deposited from citrate–sulphate bath. Corros. Sci. 2015, 91, 330–340. [Google Scholar] [CrossRef]
- Szczygieł, B.; Laszczyńska, A.; Tylus, W. Influence of molybdenum on properties of Zn–Ni and Zn–Co alloy coatings. Surf. Coat. Technol. 2010, 204, 1438–1444. [Google Scholar] [CrossRef]
- Keyvani, A.; Yeganeh, M.; Rezaeyan, H. Electrodeposition of Zn-Co-Mo alloy on the steel substrate from citrate bath and its corrosion behavior in the chloride media. J. Mater. Eng. Perform. 2017, 26, 1958–1966. [Google Scholar] [CrossRef]
- Winiarski, J.; Tylus, W.; Krawczyk, M.S.; Szczygieł, B. The influence of molybdenum on the electrodeposition and properties of ternary Zn–Fe–Mo alloy coatings. Electrochim. Acta 2016, 196, 708–726. [Google Scholar] [CrossRef]
- Winiarski, J.; Leśniewicz, A.; Pohl, P.; Szczygieł, B. The effect of pH of plating bath on electrodeposition and properties of protective ternary Zn–Fe–Mo alloy coatings. Surf. Coat. Technol. 2016, 299, 81–89. [Google Scholar] [CrossRef]
- Gómez, E.; Pelaez, E.; Vallés, E. Electrodeposition of zinc+iron alloys: I. Analysis of the initial stages of the anomalous codeposition. J. Electroanal. Chem. 1999, 469, 139–149. [Google Scholar]
- Gómez, E.; Pellicer, E.; Vallés, E. Influence of the bath composition and the pH on the induced cobalt–molybdenum electrodeposition. J. Electroanal. Chem. 2003, 556, 137–145. [Google Scholar] [CrossRef]
- Kazimierczaka, H.; Ozga, P.; Sochab, R.P. Investigation of electrochemical co-deposition of zinc and molybdenum from citrate solutions. Electrochim. Acta 2013, 104, 378–390. [Google Scholar] [CrossRef]
- Jung, S.M. Quantitative analysis of FeMo alloys by X-ray fluorescence spectrometry. Am. J. Anal. Chem. 2014, 5, 766–774. [Google Scholar] [CrossRef]
- Ma, S.; Xing, J.; Fu, H.; Yi, D.; Zhang, J.; Li, Y.; Zhang, Z.; Zhu, B.; Ma, S. Interfacial morphology and corrosion resistance of Fe–B cast steel containing chromium and nickel in liquid zinc. Corr. Sci. 2011, 53, 2826–2834. [Google Scholar] [CrossRef]
- Chassaing, E.; Quang, K.V.; Wiart, R. Mechanism of nickel-molybdenum alloy electrodeposition in citrate electrolytes. J. Appl. Electrochem. 1989, 19, 839–844. [Google Scholar] [CrossRef]
- Fukushima, H.; Akiyama, T.; Akagi, S.; Higashi, K. Role of iron-group metais in the induced codeposition of molybdenum from aqueous olution. Trans. JIM 1979, 20, 358–364. [Google Scholar] [CrossRef]
- Kubota, A.; Tashiro, Y.; Yamasaki, K.; Nakano, H.; Oue, S.; Kobayashi, S.; Akiyama, T.; Fukushima, H. Electrodeposition behavior and properties of iron-group metal alloys with W from ammoniacal citrate baths. Tetsu-to-Hagane 2000, 86, 116–122. (In Japanese) [Google Scholar] [CrossRef]
Figure 1.
SEM images of the Zn–Fe–Mo platings deposited at various pH values. (a) pH 4.0; (b) pH 4.5; (c) pH 5.0; (d) pH 5.5; and (e) pH 5.7.
Figure 1.
SEM images of the Zn–Fe–Mo platings deposited at various pH values. (a) pH 4.0; (b) pH 4.5; (c) pH 5.0; (d) pH 5.5; and (e) pH 5.7.

Figure 2.
The content of Fe and Mo in Zn–Fe–Mo plating deposited at various pH values.

Figure 3.
XRD patterns of the Zn–Fe–Mo plating deposited at various pH values.
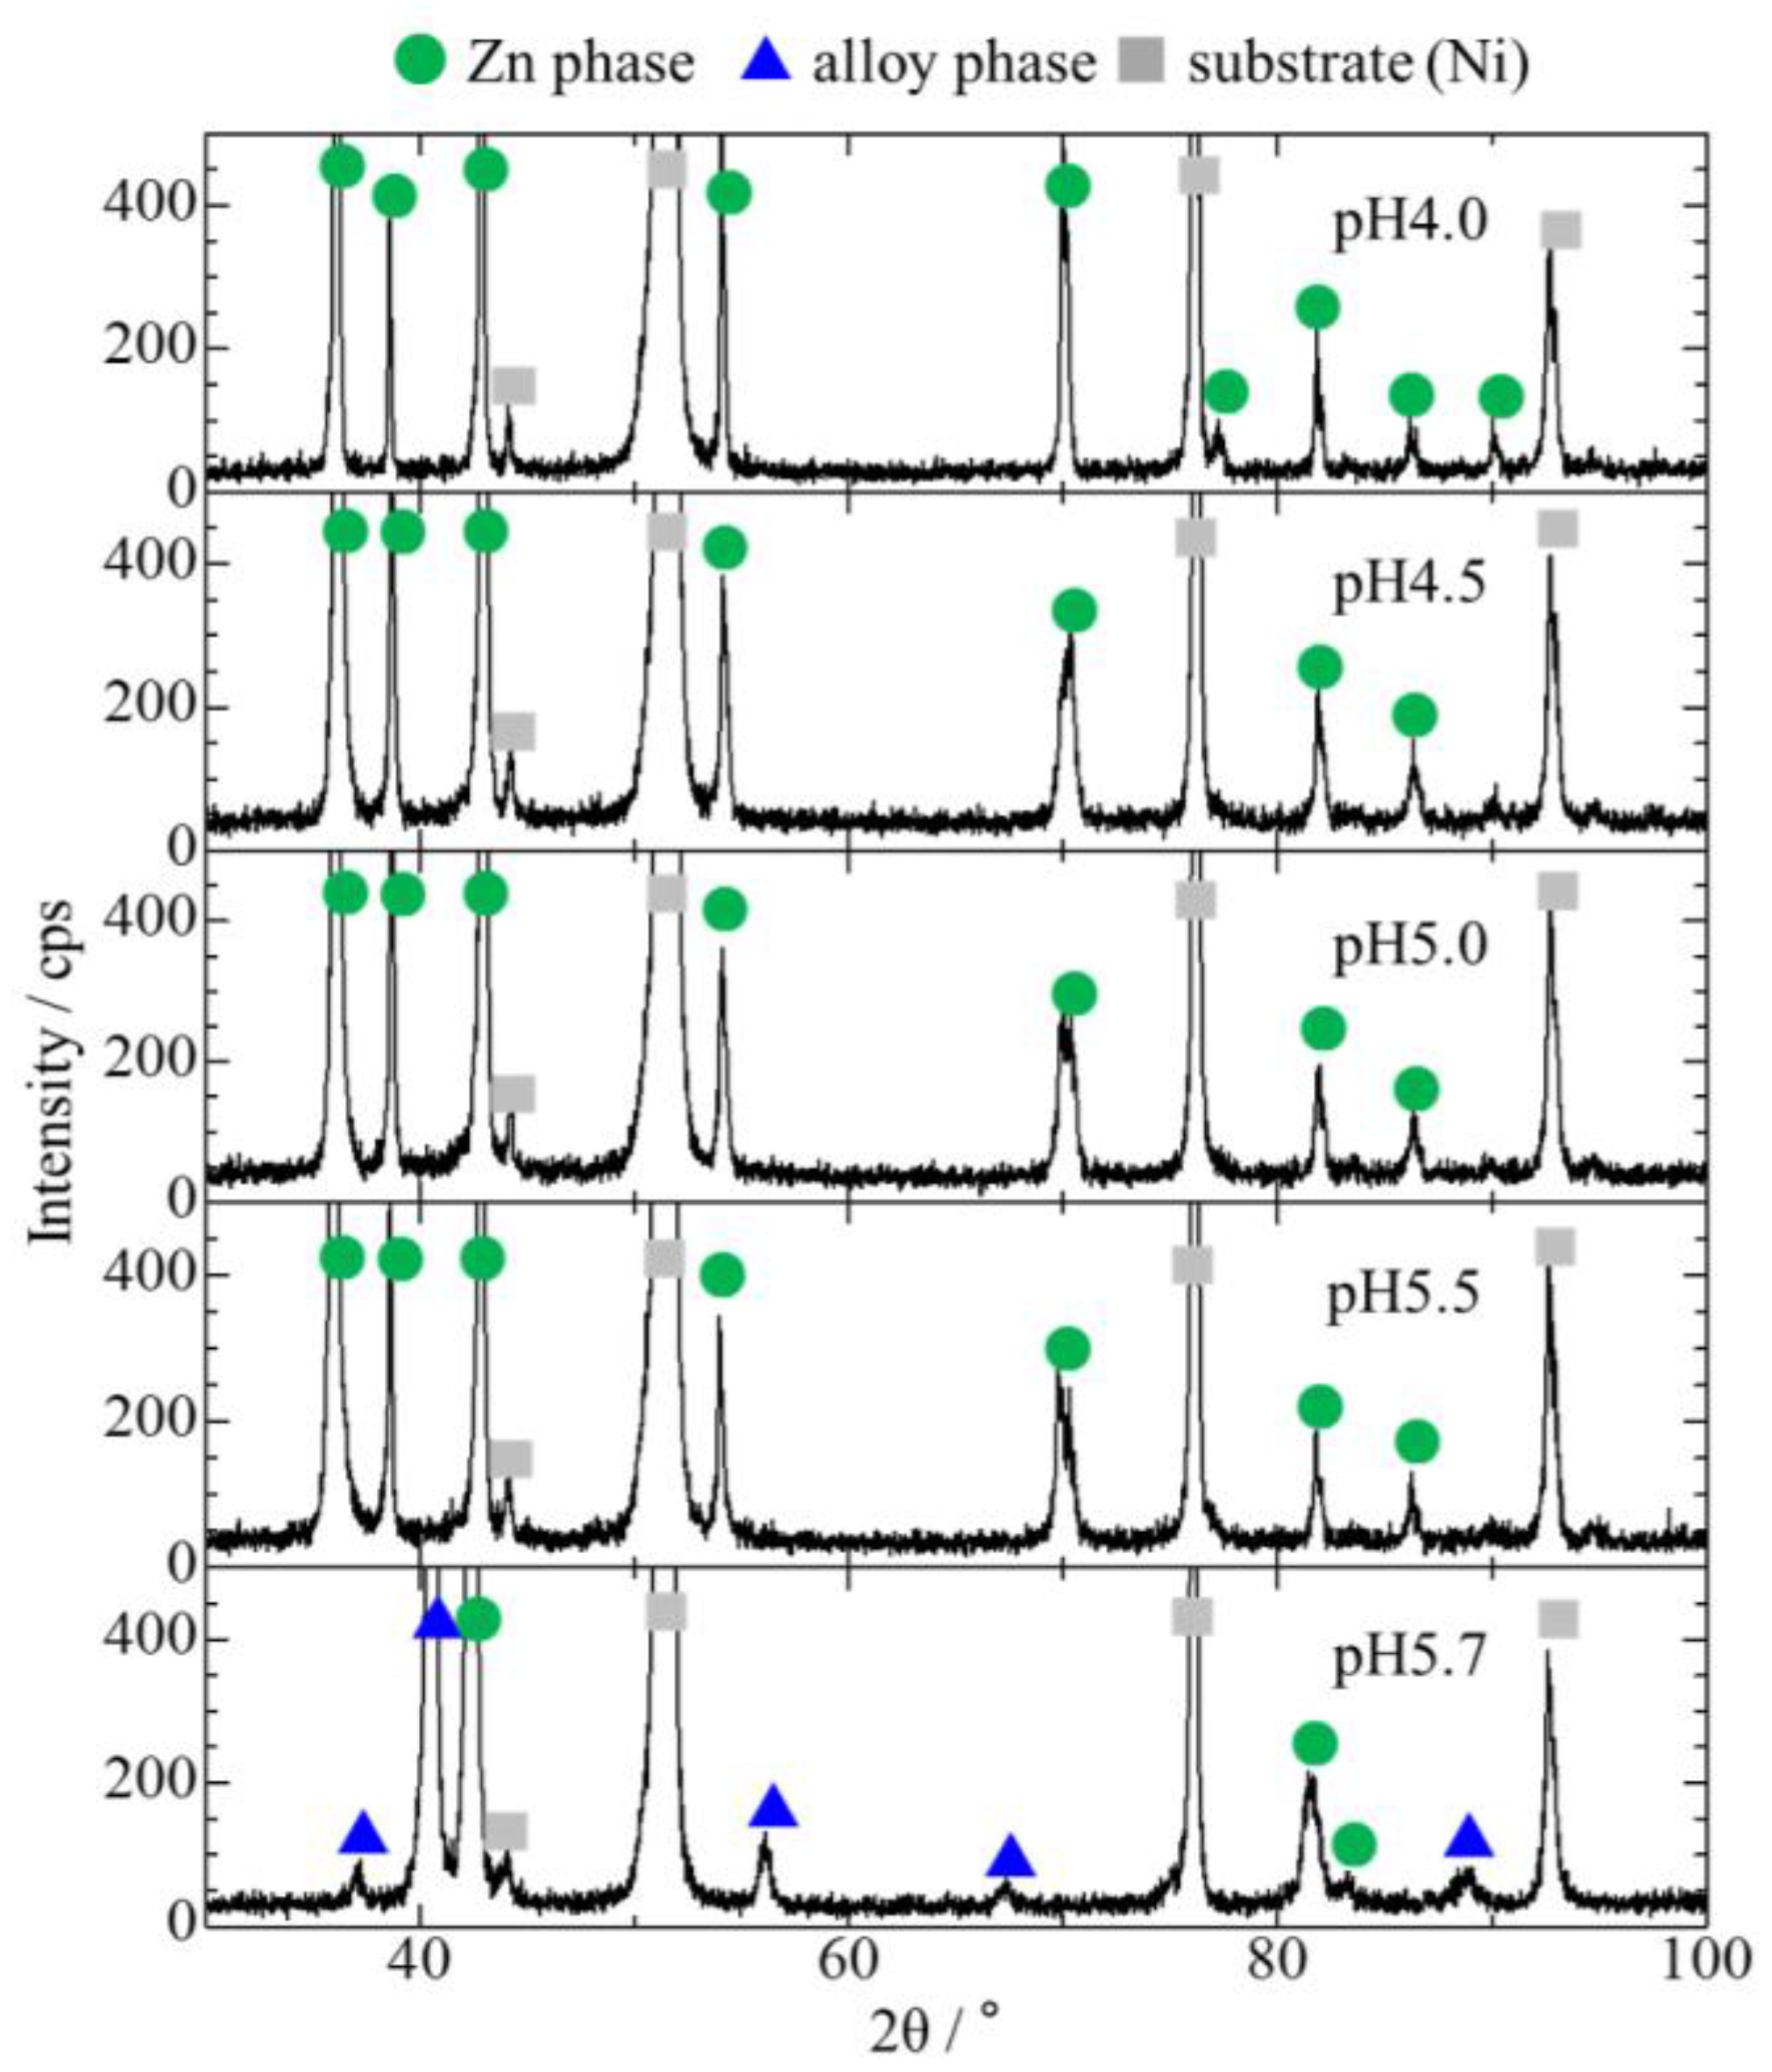
Figure 4.
Anodic polarization curves of the Zn–Fe–Mo plating deposited at various pH values.
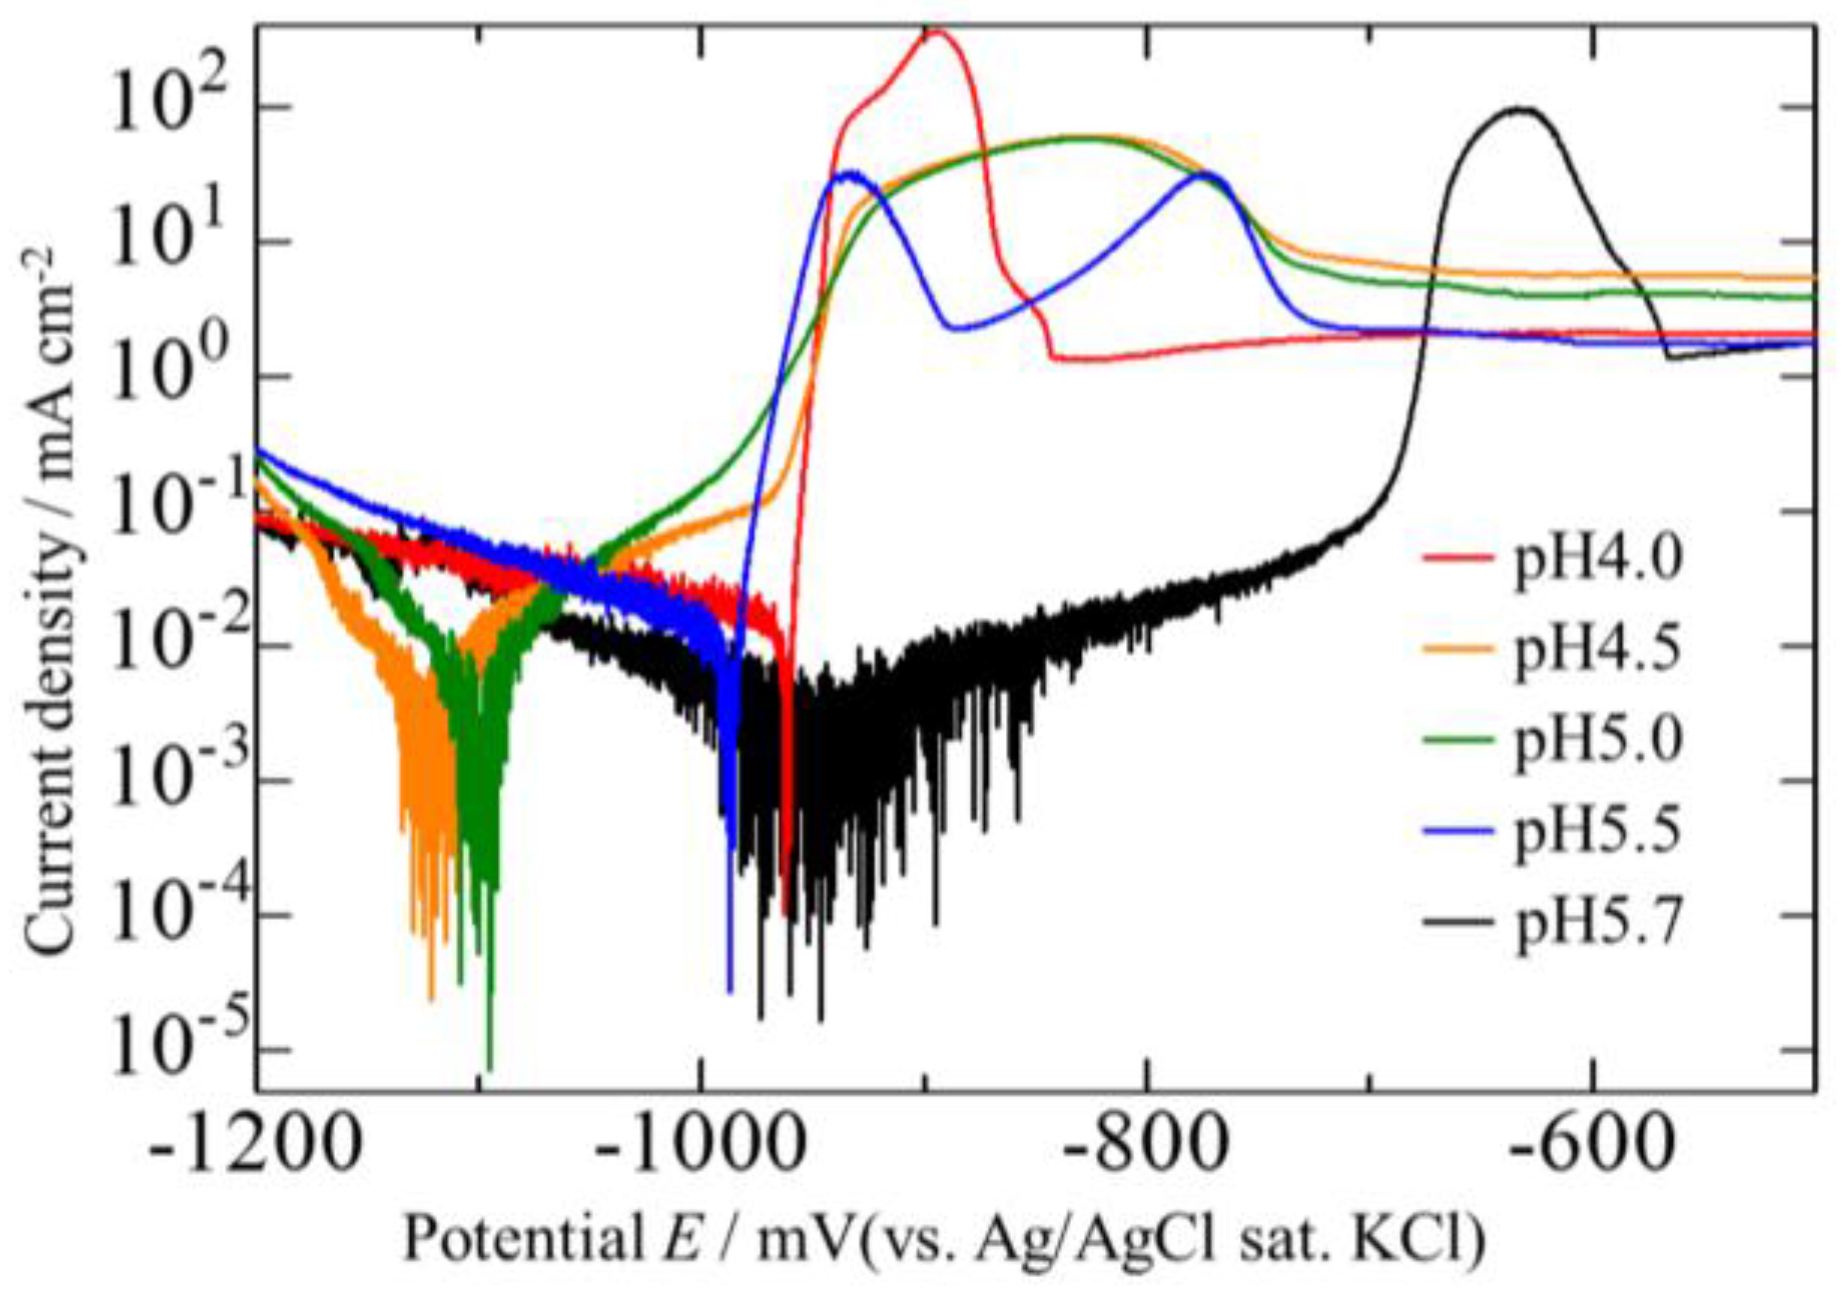
Figure 5.
Cathodic polarization curves obtained from different baths.

Figure 6.
SEM images of the Zn–Fe–Mo plating deposited at various current densities. (a) 1 mA cm−2; (b) 2 mA cm−2; (c) 5 mA cm−2; and (d) 10 mA cm−2.
Figure 6.
SEM images of the Zn–Fe–Mo plating deposited at various current densities. (a) 1 mA cm−2; (b) 2 mA cm−2; (c) 5 mA cm−2; and (d) 10 mA cm−2.

Figure 7.
The content of Fe and Mo in the Zn–Fe–Mo plating deposited at various current densities.
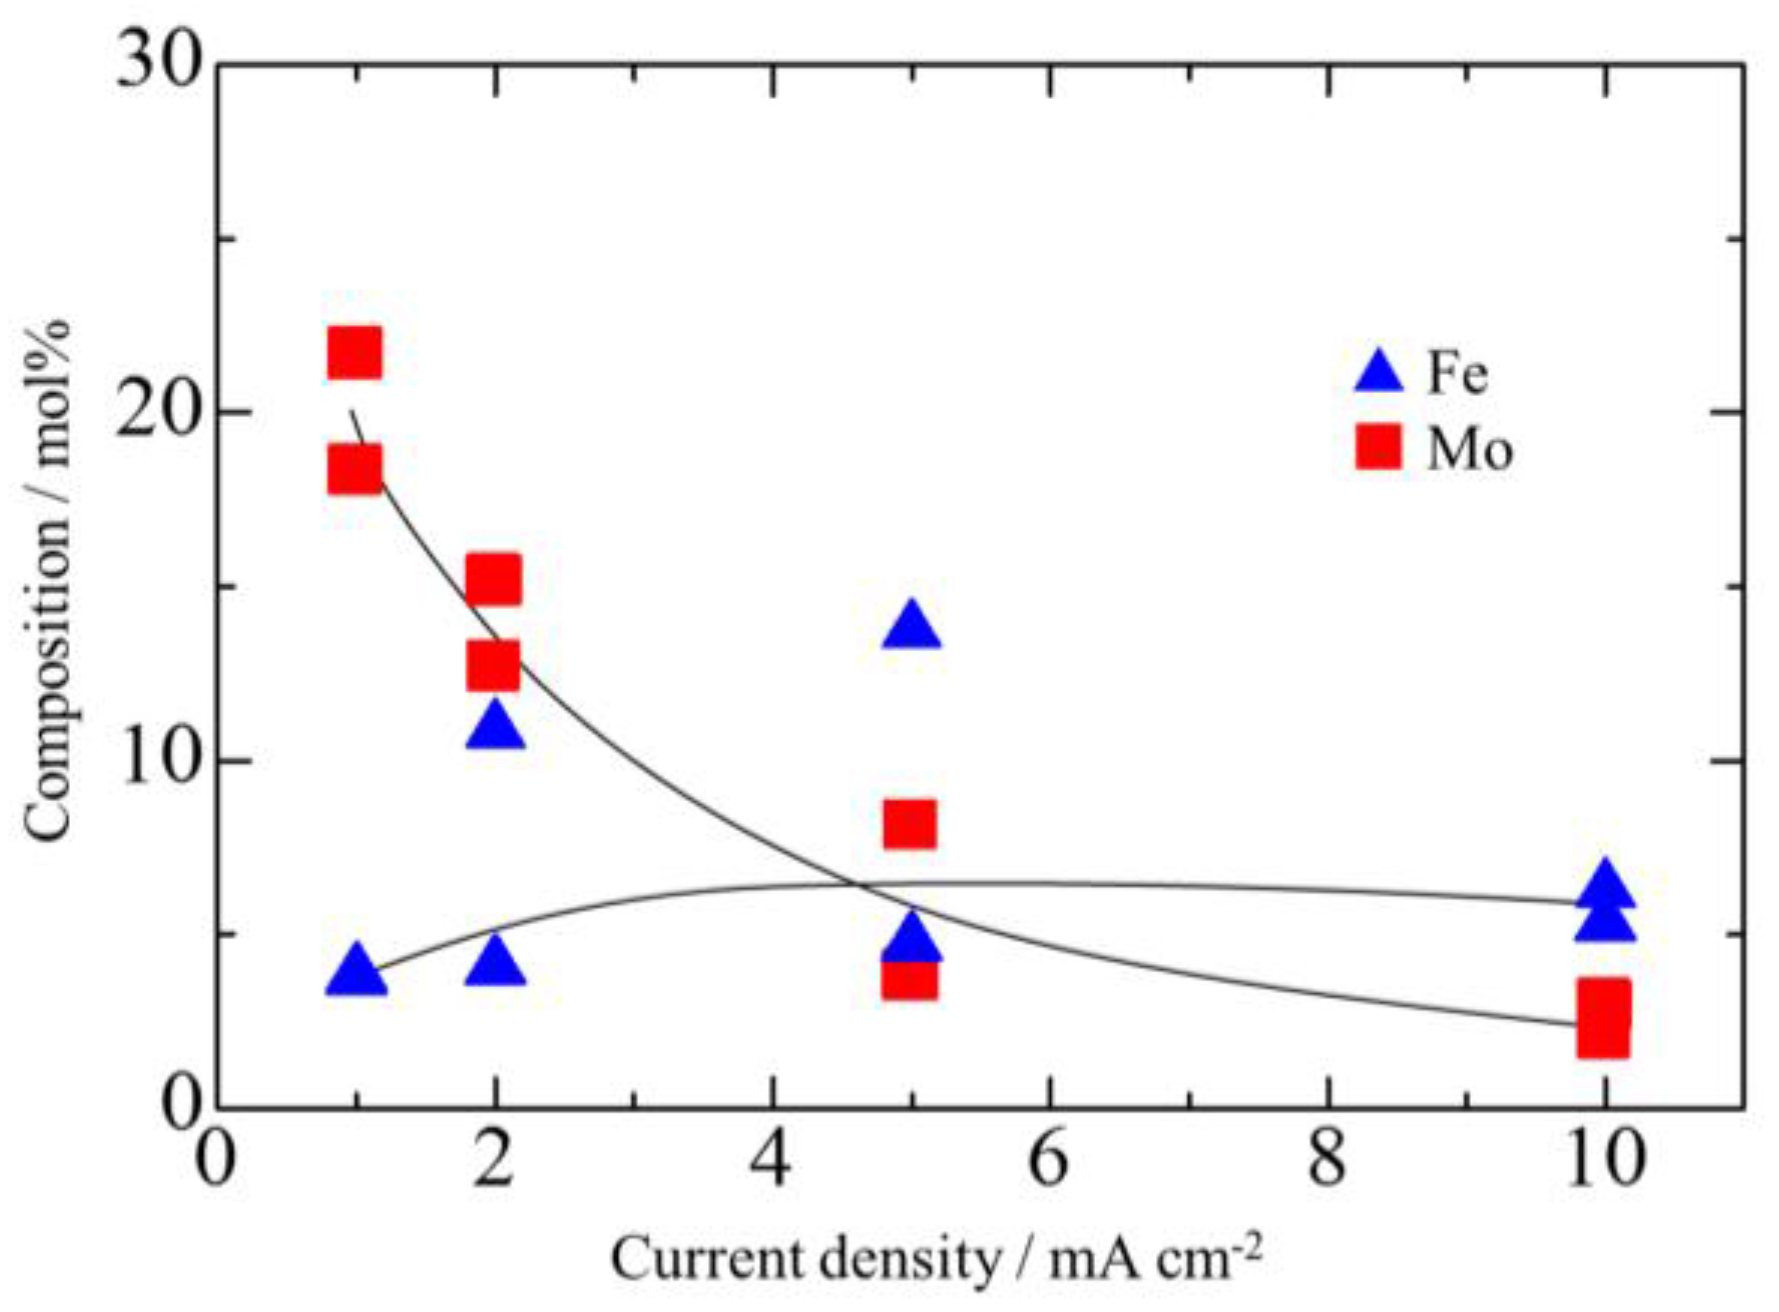
Figure 8.
XPS analysis results of the Zn–Fe–Mo platings deposited at various current densities.
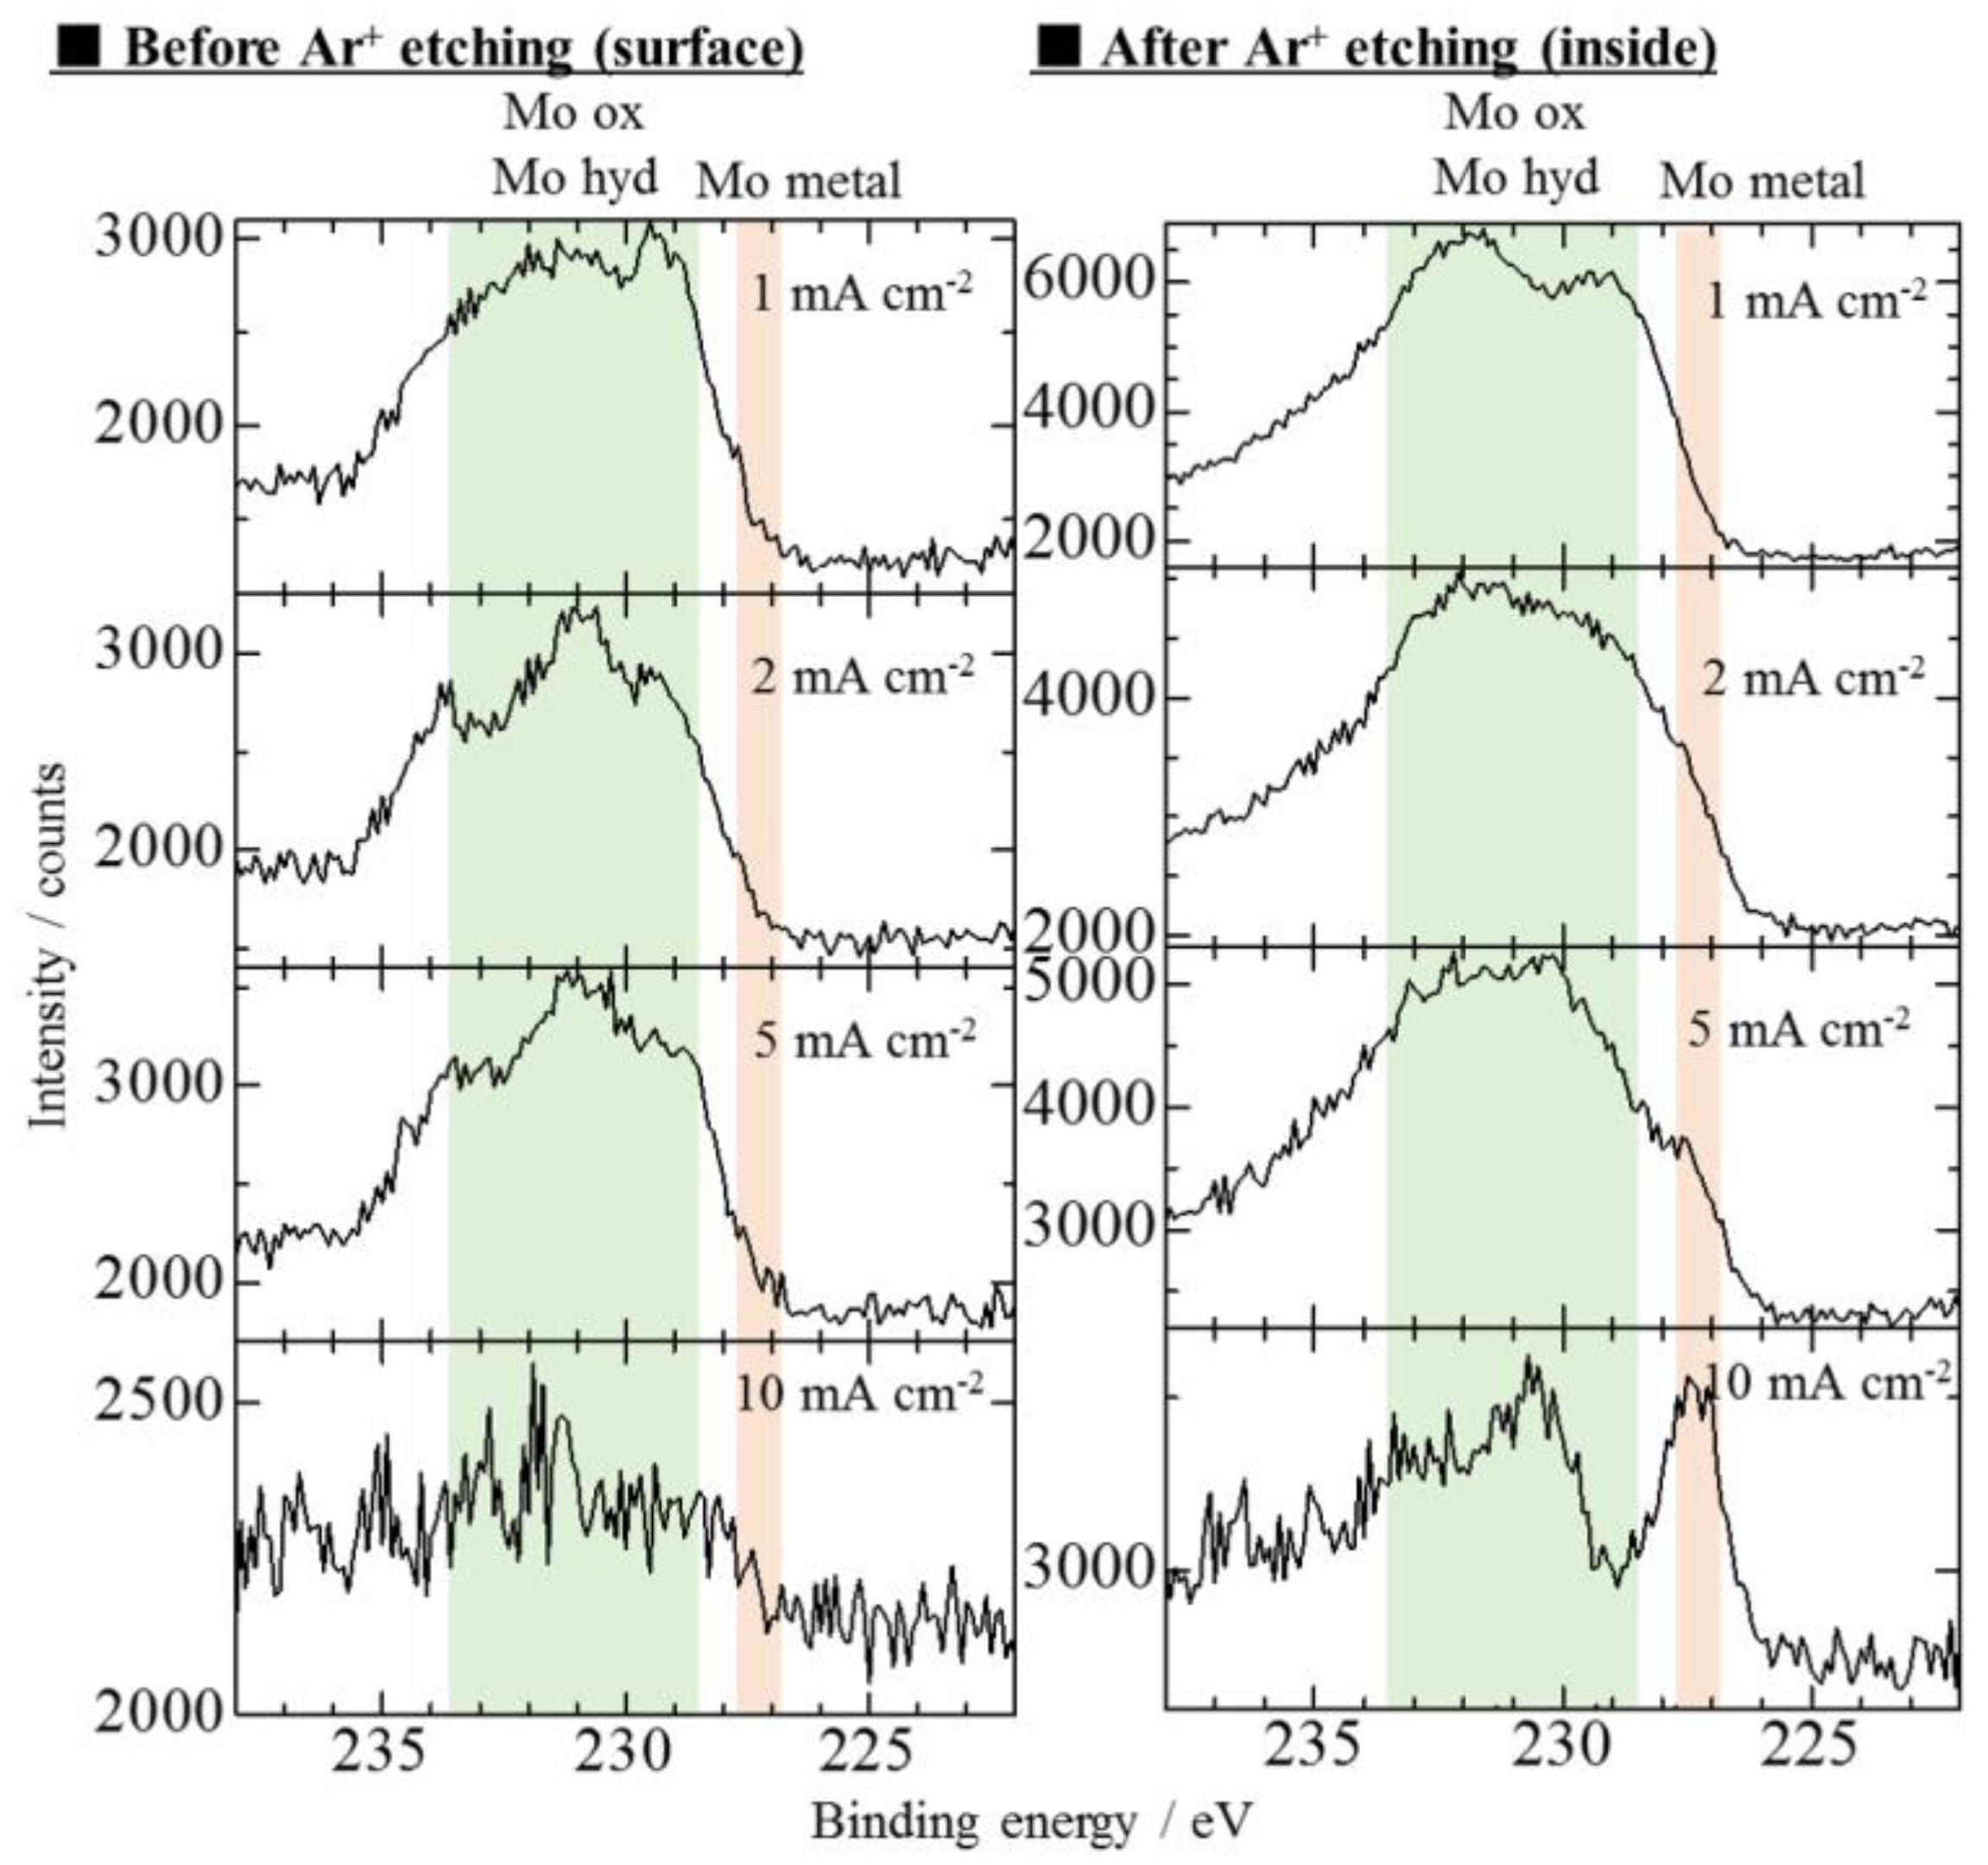
Figure 9.
The relationship between current density and current efficiency.
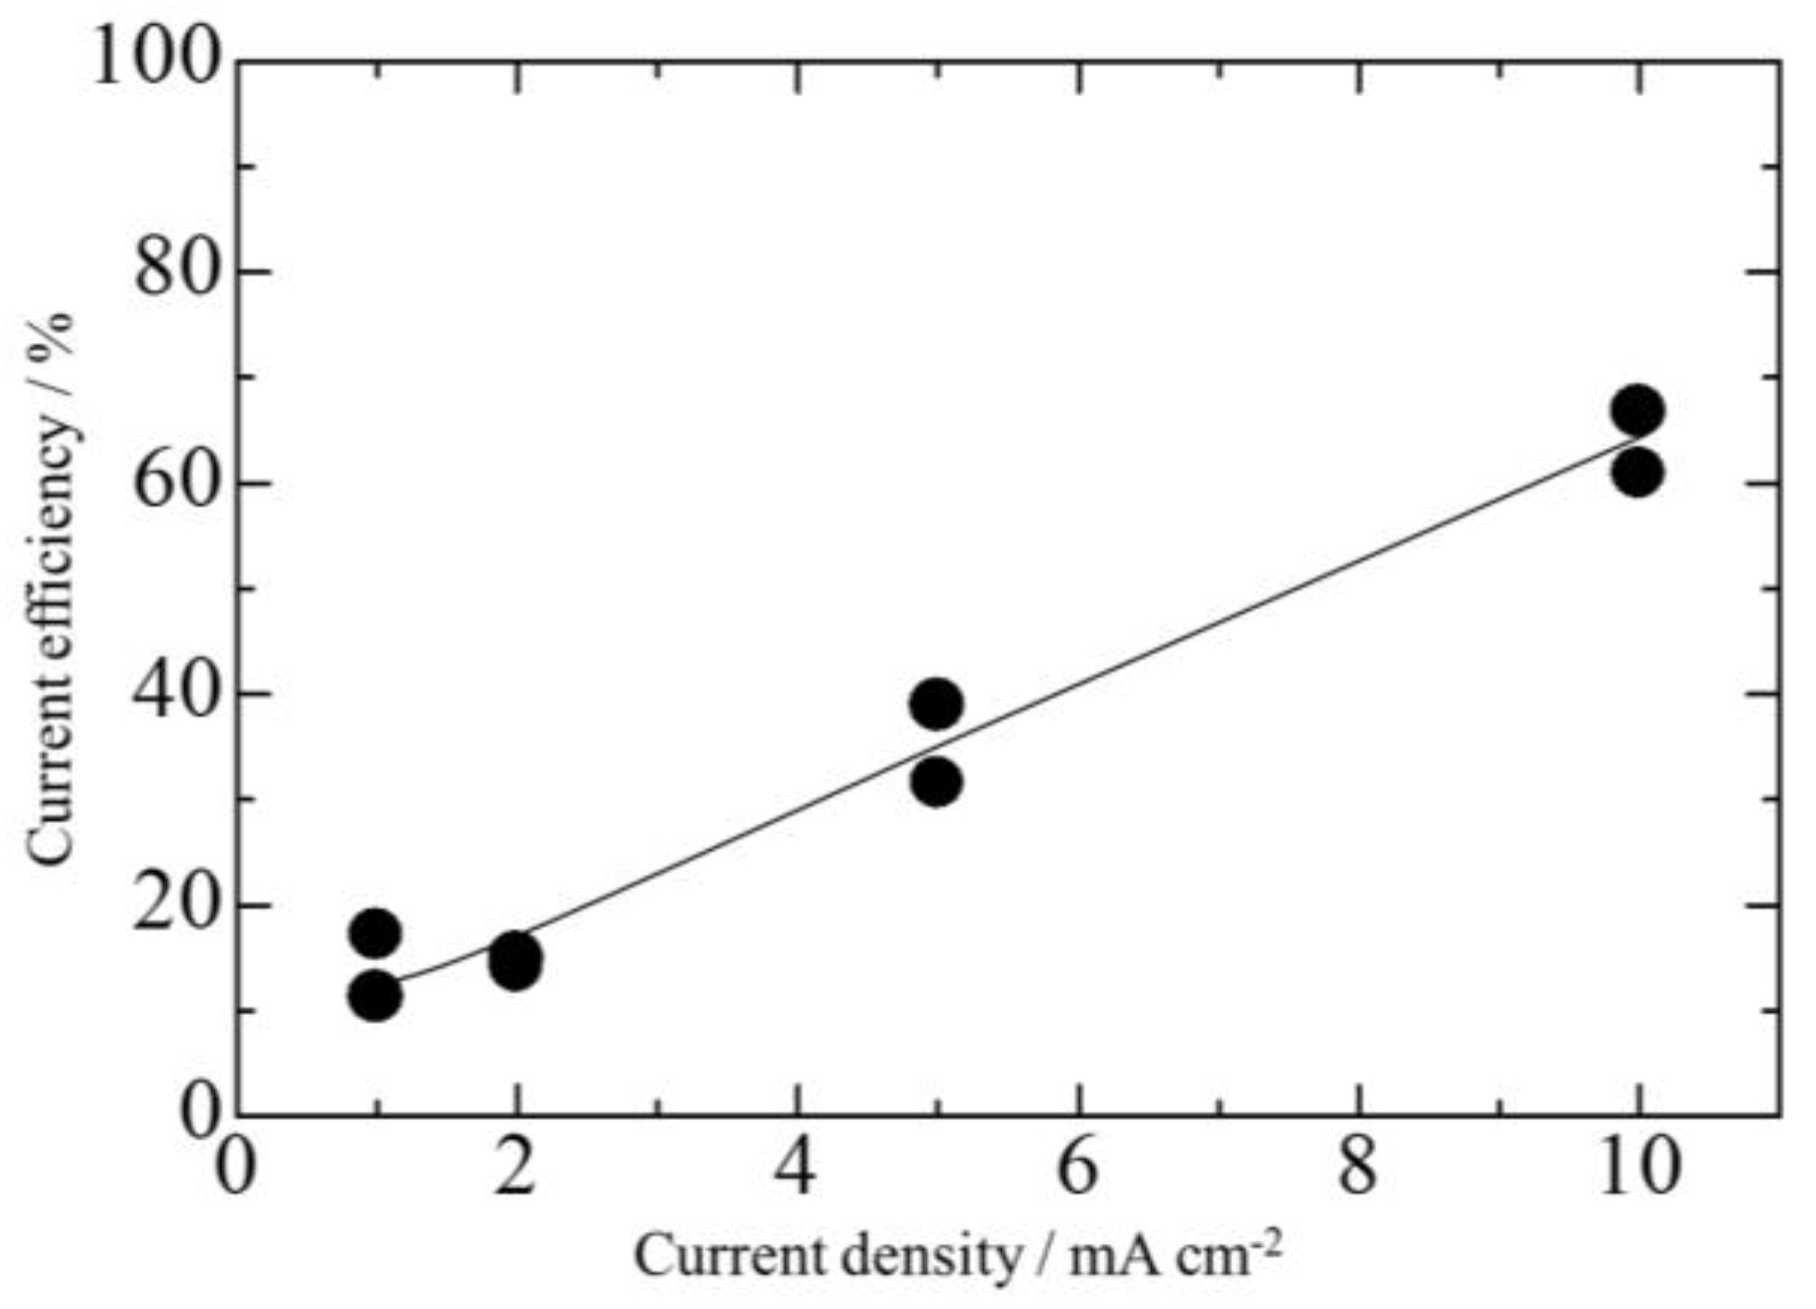
Figure 10.
XRD patterns of the Zn–Fe–Mo platings deposited at various current densities.

Figure 11.
Anodic polarization curves of the Zn–Fe–Mo platings deposited at various current densities.
Figure 11.
Anodic polarization curves of the Zn–Fe–Mo platings deposited at various current densities.

Figure 12.
SEM images of Zn–Fe–Mo plating deposited at various Mo concentration. (a) 0.01 mol dm−3; (b) 0.02 mol dm−3; and (c) 0.1 mol dm−3.
Figure 12.
SEM images of Zn–Fe–Mo plating deposited at various Mo concentration. (a) 0.01 mol dm−3; (b) 0.02 mol dm−3; and (c) 0.1 mol dm−3.

Figure 13.
Content of Fe and Mo in the Zn–Fe–Mo plating deposited from a plating bath with different Mo concentrations.
Figure 13.
Content of Fe and Mo in the Zn–Fe–Mo plating deposited from a plating bath with different Mo concentrations.

Figure 14.
XPS analysis results of the Zn–Fe–Mo plating deposited from a plating bath with different Mo concentrations.
Figure 14.
XPS analysis results of the Zn–Fe–Mo plating deposited from a plating bath with different Mo concentrations.

Figure 15.
The relationship between Mo concentration and current efficiency.
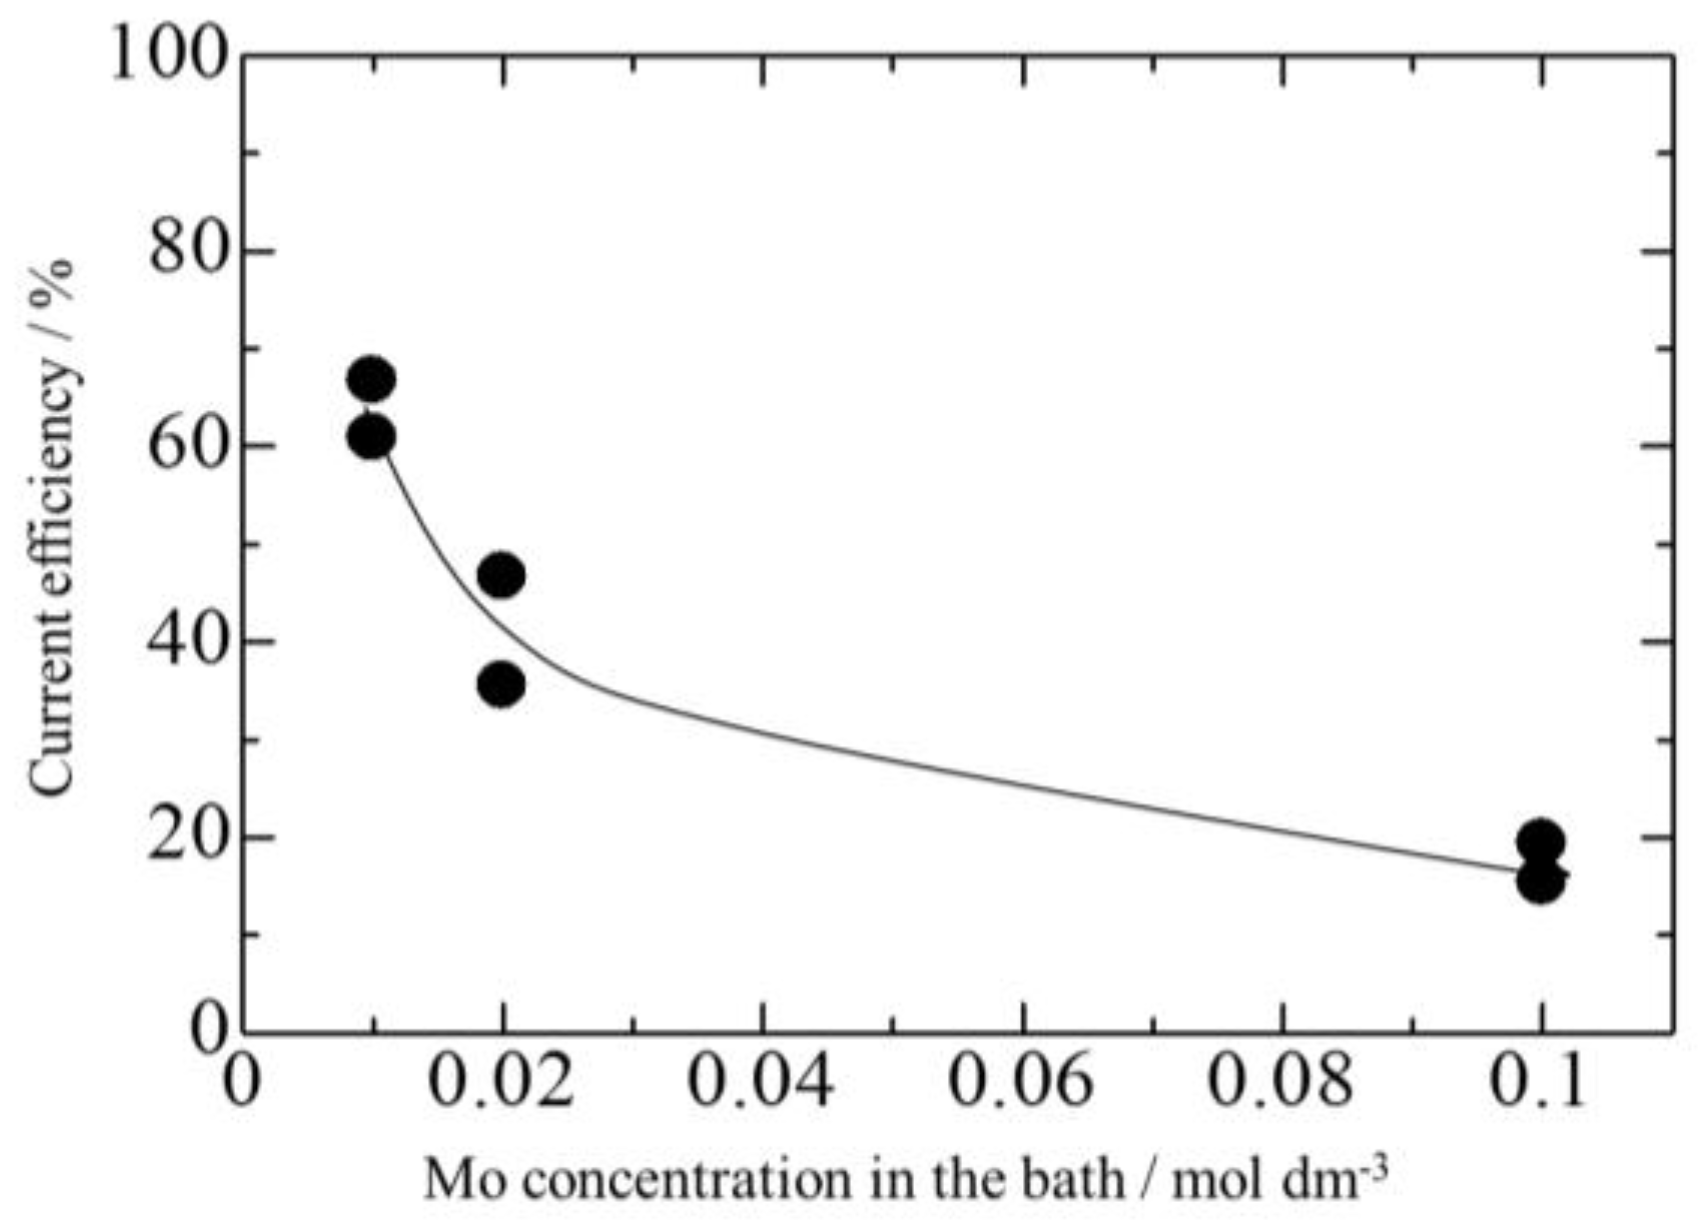
Figure 16.
XRD patterns of the Zn–Fe–Mo plating deposited from a plating bath with different Mo concentrations.
Figure 16.
XRD patterns of the Zn–Fe–Mo plating deposited from a plating bath with different Mo concentrations.
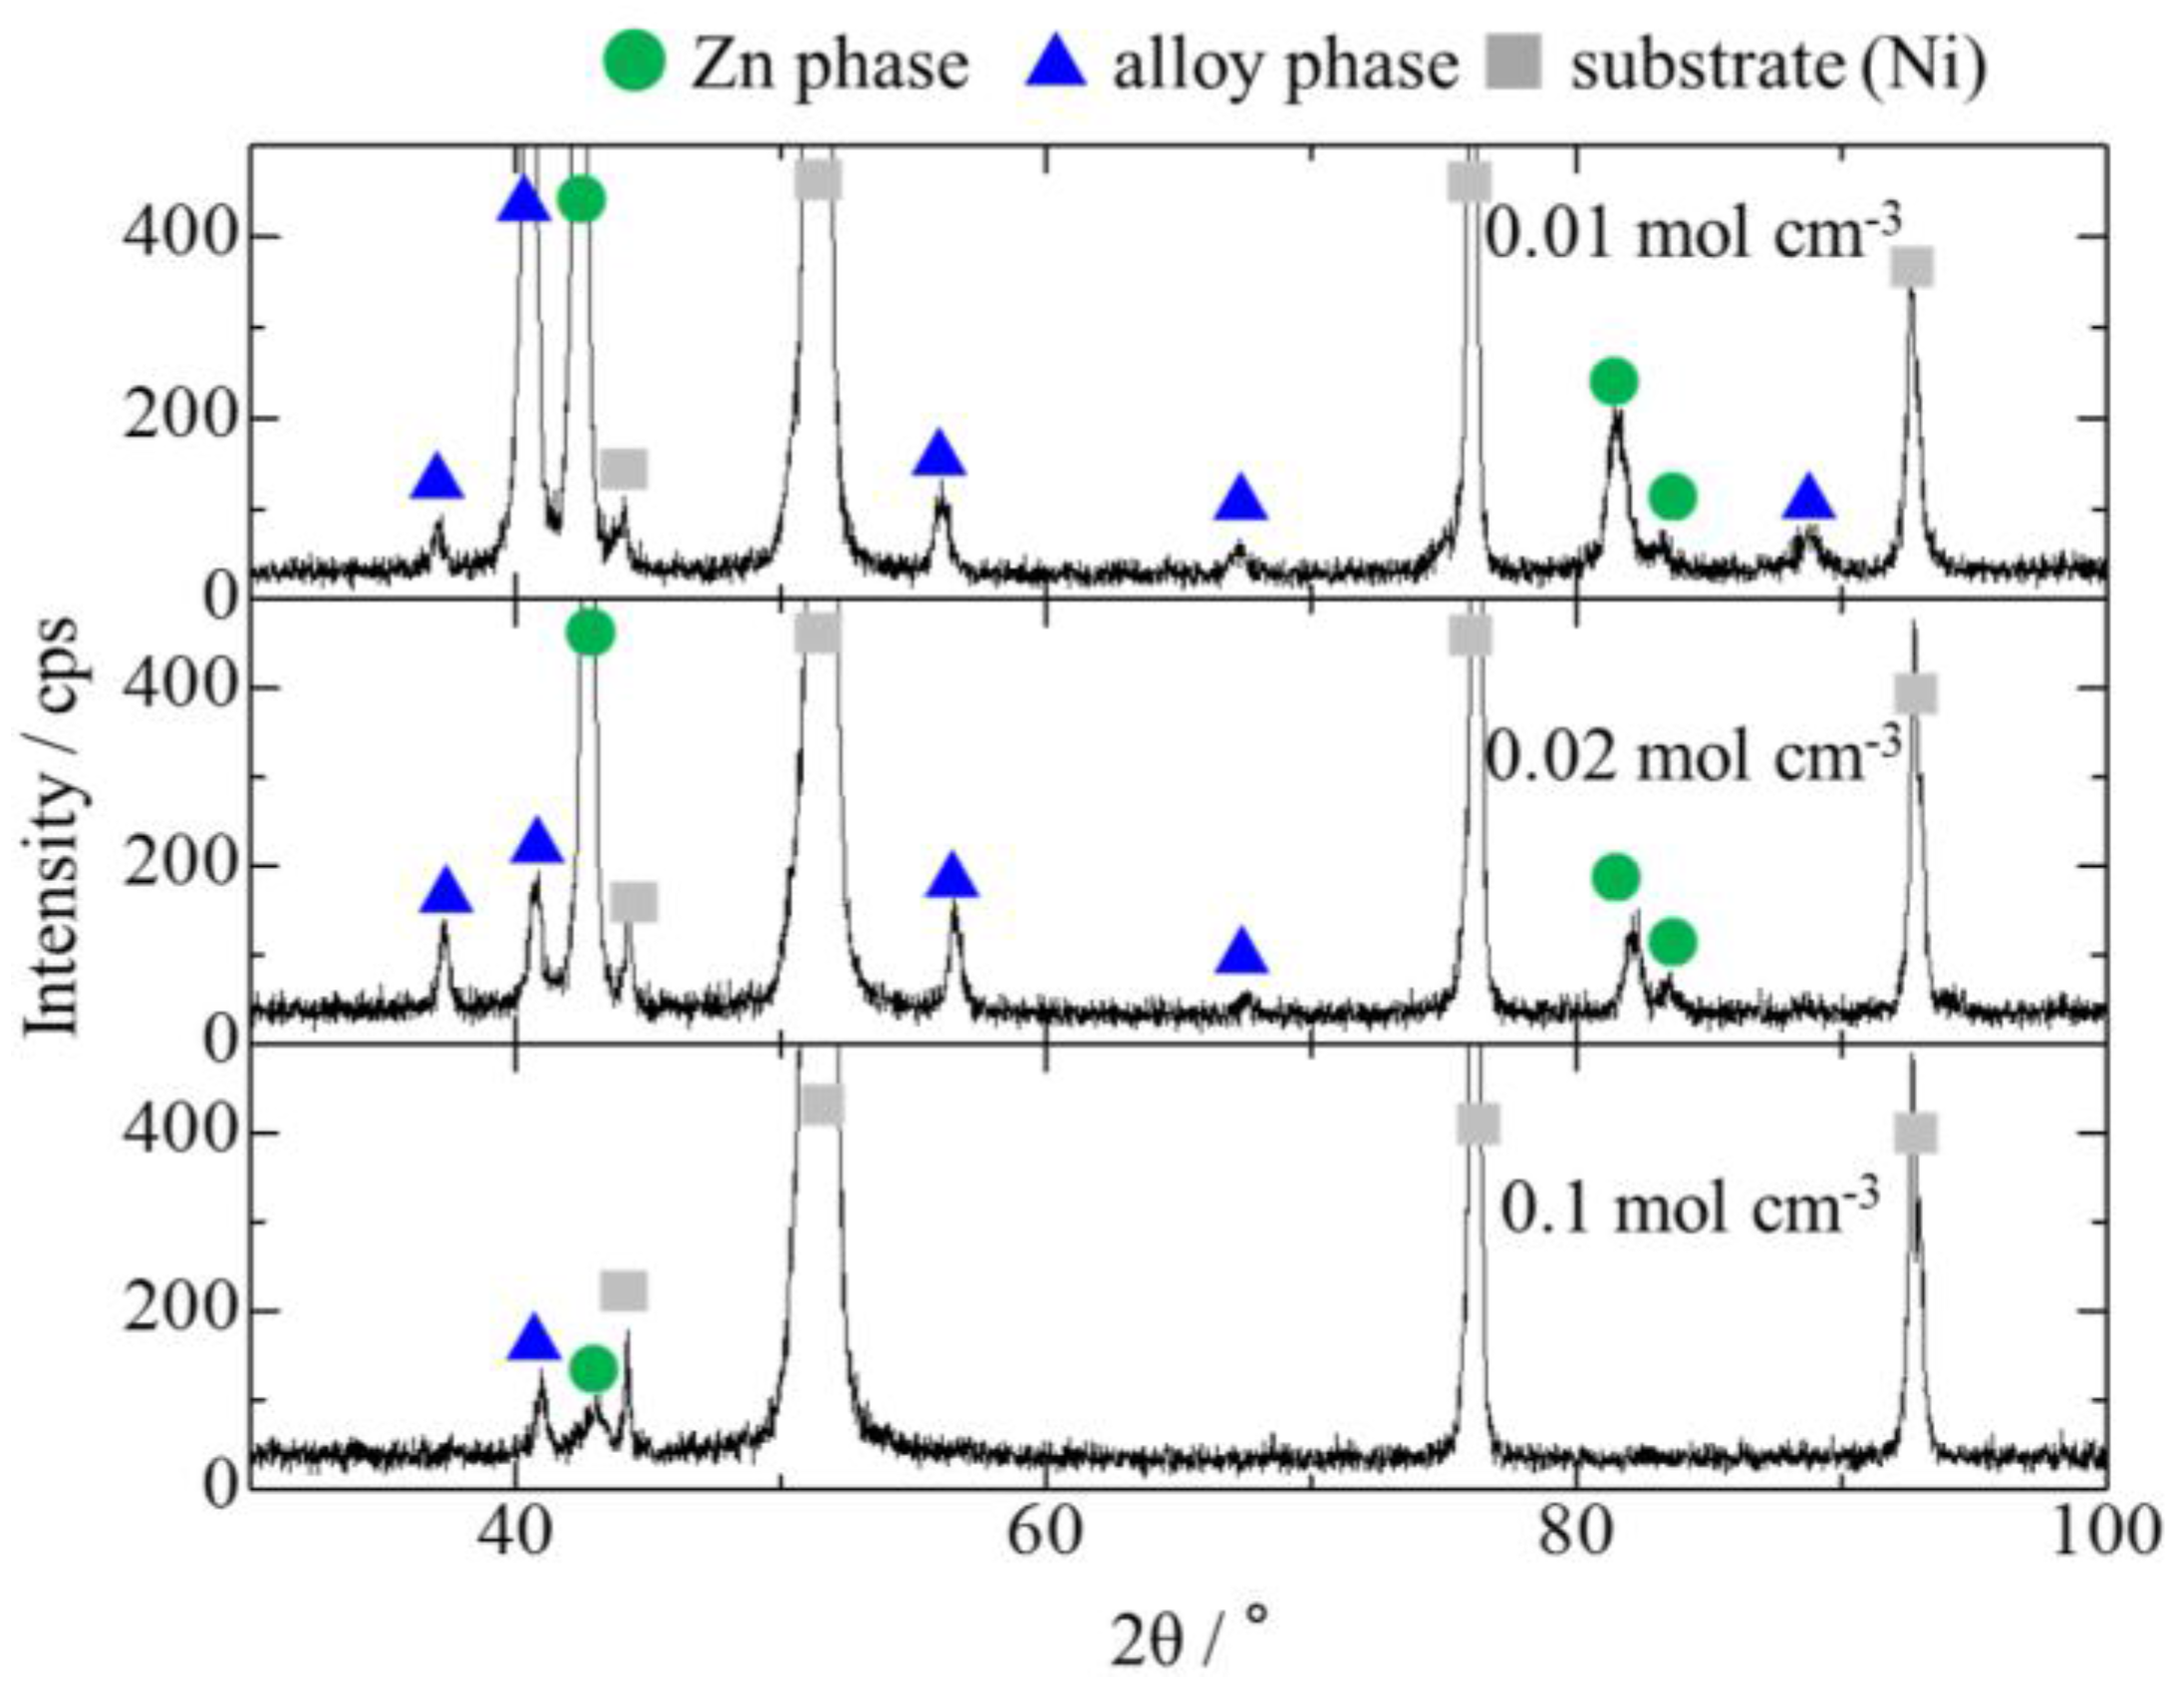
Figure 17.
Anodic polarization curves of the Zn–Fe–Mo platings deposited at various Mo concentrations.
Figure 17.
Anodic polarization curves of the Zn–Fe–Mo platings deposited at various Mo concentrations.

Figure 18.
The relationship between the content of Mo in the plating and Ecorr.

Figure 19.
The relationship between the peak intensity ratio of the alloy phase and Zn phase from the XRD and Ecorr.
Figure 19.
The relationship between the peak intensity ratio of the alloy phase and Zn phase from the XRD and Ecorr.

Table 1.
Bath compositions used in this study.
| Type of Bath | Composition of Bath (mol dm−3) | ||||
|---|---|---|---|---|---|
| ZnSO4 | FeSO4 | Na2MoO4 | C6H5Na3O7 | Na2SO4 | |
| Base | – | – | – | 0.2 | 0.1 |
| Zn | 0.2 | – | – | 0.2 | 0.1 |
| Fe | – | 0.2 | – | 0.2 | 0.1 |
| Zn–Fe | 0.2 | 0.2 | – | 0.2 | 0.1 |
| Zn–Fe–Mo | 0.2 | 0.2 | 0.01–0.1 | 0.2 | 0.1 |
© 2017 by the authors. Licensee MDPI, Basel, Switzerland. This article is an open access article distributed under the terms and conditions of the Creative Commons Attribution (CC BY) license (http://creativecommons.org/licenses/by/4.0/).
Share and Cite
MDPI and ACS Style
Kosugi, D.; Hagio, T.; Kamimoto, Y.; Ichino, R. Effect of the Addition of Molybdenum on the Structure and Corrosion Resistance of Zinc–Iron Plating. Coatings 2017, 7, 235. https://doi.org/10.3390/coatings7120235
AMA Style
Kosugi D, Hagio T, Kamimoto Y, Ichino R. Effect of the Addition of Molybdenum on the Structure and Corrosion Resistance of Zinc–Iron Plating. Coatings. 2017; 7(12):235. https://doi.org/10.3390/coatings7120235
Chicago/Turabian StyleKosugi, Daichi, Takeshi Hagio, Yuki Kamimoto, and Ryoichi Ichino. 2017. "Effect of the Addition of Molybdenum on the Structure and Corrosion Resistance of Zinc–Iron Plating" Coatings 7, no. 12: 235. https://doi.org/10.3390/coatings7120235
Note that from the first issue of 2016, this journal uses article numbers instead of page numbers. See further details here.