Corrosion Protection of Steel by Epoxy-Organoclay Nanocomposite Coatings
by
Domna Merachtsaki
, 
Panagiotis Xidas
,
Panagiotis Giannakoudakis
,
Konstantinos Triantafyllidis
* and
Panagiotis Spathis
* Department of Chemistry, Aristotle University of Thessaloniki, University Campus, Thessaloniki 54124, Greece
*
Authors to whom correspondence should be addressed.
Coatings 2017, 7(7), 84; https://doi.org/10.3390/coatings7070084
Submission received: 16 March 2017
/
Revised: 29 May 2017
/
Accepted: 13 June 2017
/
Published: 22 June 2017
(This article belongs to the Special Issue New Generation Coatings for Metals)
Abstract
:The purpose of the present work was to study the corrosion behavior of steel coated with epoxy-(organo) clay nanocomposite films. The investigation was carried out using salt spray exposures, optical and scanning electron microscopy examination, open circuit potential, and electrochemical impedance measurements. The mechanical, thermomechanical, and barrier properties of pristine glassy epoxy polymer and epoxy-clay nanocomposites were examined. The degree of intercalation/exfoliation of clay nanoplatelets within the epoxy polymer also was determined. The mechanical, thermomechanical, and barrier properties of all the epoxy-clay nanocomposites were improved compared to those of the pristine epoxy polymer. In addition, both the pristine epoxy and the epoxy nanocomposite coatings protected the steel from corrosion. Furthermore, the protective properties of the nanocomposite coatings were superior compared to those of the pristine epoxy polymer. The protective properties of the nanocomposite coatings varied with the modified clay used. The epoxy-montmorillonite clay modified with primary octadecylammonium ions, Nanomer I.30E, had a better behavior than that modified with quaternary octadecylammonium ions, Nanomer I.28E.
1. Introduction
Organic coatings are widely used to prevent corrosion of metallic structures. However, these polymeric coatings are usually permeable to small gaseous molecules such as water vapor and oxygen, which can result in gradual corrosion of the surface. It is generally accepted that the coating efficiency is dependent on the barrier and mechanical (resistance to cracking) properties of the organic film, on the adherence of the polymeric coating to the metal substrate, and on the degree of environmental aggressiveness. Among various protective coatings, epoxy resins are commonly used as organic coatings, due to their strong adhesion capability to metallic substrates, their excellent resistance to chemicals, and their relatively high mechanical and impact strength. However, the pristine epoxy resins exhibit measureable adsorption and permeability of water vapor, which diffuses to the epoxy/steel interface and initiates corrosion of the metal substrate particularly in intensely wet conditions. Therefore, effort has been devoted in recent years to develop epoxy-based protective coatings with good barrier properties, at least with regard to water vapor and oxygen [1,2,3].
One way to improve the properties of a polymeric protective coating is the addition of inorganic nano-fillers, leading to the formation of nanocomposite materials. Nanoparticles with sizes in the range of ca. 1–50 nm can enhance the effectiveness of a coating by filling the micro voids and crevices in the pristine polymer coating. When the nanoparticles are in the form of 2D-nanolayers with a high aspect ratio (ca. 100–2000), they can act as barriers to the diffusion of small molecules by increasing the length of the diffusion paths (tortuous paths) of the corroding agent through the polymeric nanocomposite coating, thus inhibiting the corrosion process. The use of clays as fillers of polymeric coatings has great potential to improve the barrier properties of the coatings, provided that the nano-sized clay tactoids or the individual clay nanolayers can be dispersed effectively within the polymer matrix. However, substantial improvements of barrier properties can be achieved when the nanolayers are oriented parallel to the substrate surface [4].
During the last 20 years, considerable attention has been paid to the development of polymer-based nanocomposites, with clays being the first and most studied inorganic nanofillers used [5,6]. It has been reported that the incorporation of a small amount (1–5 wt %) of clay in a polymer matrix can lead to significant improvements in the mechanical performance, thermal stability, and barrier properties of the pristine polymer. These improvements are related to the morphology of clay micro-sized particles, which consists of tactoids with highly oriented nano-layers, as explained above. An ideal exfoliated structure of polymer-clay nanocomposites is obtained when a complete separation and dispersion of the individual clay nano-layers occurs within the polymer matrix. In this case, there is no longer any interaction between the layers, which are completely dissociated and separated by a large volume of the polymer. An intermediate case is the intercalated structure where a finite number of polymer chains penetrate the interlayer space, thus significantly increasing the spacing between the layers (ca. up to 100 Å) without destroying the ordered parallel structure of the nanolayers, at least at the level of individual tactoids.
The most widely used layered silicate is montmorillonite (MMT), which has attracted intense research interest for the preparation of polymer clay nanocomposites. The MMT-based nanocomposites exhibit enhanced physical properties compared to the pristine polymer, such as improved thermal properties (e.g., thermal stability, flame retardant, thermal conductivity), mechanical properties (e.g., mechanical strength, hardness, abrasion resistance), permeability properties (e.g., gas barrier, pervaporation), and corrosion protection properties [1,2,7,8,9,10,11]. The chemical structure of MMT consists of two tetrahedral silica sheets fused to a central edge-shared octahedral-based sheet of either magnesium or aluminum hydroxide [12]. In general, the surface of the clay needs to be organo-modified in order to become more compatible with the polymer matrix and to improve its dispersibility in the polymeric network. The organic modification of layered silicates can be realized through the replacement of the Na+ and/or Ca2+ cations in the intragallery space, as well as on the external surfaces of the clay particles, by organic cations through a cation exchange reaction [13,14]. The improvement in the corrosion resistance of aluminium alloys and of cold rolled steel with polymeric films reinforced with organically modified clay has been clearly demonstrated. Corrosion protection was essentially related to the enhancement of the barrier properties of the coating. The formation of an organophilic environment between the clay layers is critical for the insertion of polymer chains amongst them and the formation of an intercalated structure, which seems to present the greater improvement of barrier properties. Amongst the various polymers for coating applications, epoxy resins lately have evoked intensive studies in the preparation of nanocomposite materials, due to their high tensile strength and modulus, good adhesive properties, good chemical and corrosion resistance, low shrinkage in cure, and excellent dimensional stability [1,8,15,16,17,18,19].
In the present study, the protection capabilities of epoxy-clay nanocomposite coatings were examined. The montmorillonite clay used has been modified with quaternary or primary octadecylammonium ions. Both the pristine glassy epoxy polymer and the epoxy-clay nanocomposites were characterized for their mechanical and thermomechanical properties, thermal stability, and barrier properties. The degree of intercalation/exfoliation of clay nanoplatelets within the epoxy polymer was determined. The corrosion behavior investigation was carried out using salt spray tests, optical and scanning electron microscopy examination, open circuit potential, and electrochemical impedance measurements.
2. Materials and Methods
2.1. Materials and Epoxy Coatings
The steel test material was cold rolled steel (DC 01—ASTM A366 [20] with a chemical composition max %, 0.12 C, 0.045 P, 0.045 S, 0.60 Mn, and the specimens were cut from a plate of 0.3 cm thickness. The dimensions of the test coupons were 5 cm × 1.5 cm, the total exposed area for the salt spray tests was 15 cm2, and for the electrochemical measurements was 6 cm2. The steel surface before coating was mechanically cleaned by scrubbing with a bristle brush and chemically cleaned using acetone and alcohol.
The metallic specimens were coated with a ~20 μm thin film of pristine glassy epoxy polymer or epoxy-clay nanocomposite films. No pinholes or other defects were observed on the coatings. The pristine liquid epoxy resin was diglycidyl ether of bisphenol A (DGEBA) (EPON 828RS, Hexion, Columbus, OH, USA) with an average epoxide equivalent weight of ~187 (MW = 370) and was mixed at 50 °C with the appropriate amount of an aliphatic polyoxypropylene diamine (Jeffamine D-230, MW ≈ 230, Huntsman, The Woodlands, TX, USA), which acted as the curing agent. The molecular structures of the epoxy resin and diamine curing agent are shown in Figure 1A,B, respectively.
The curing agent was mixed with the epoxy resin under a stoichiometric ratio of 1:1 of amine reactive hydrogens to epoxy rings. The metallic specimens were dipped in the liquid uncured mixture and then were kept in a vertical position so that the excess liquid was removed and left to cure at ambient conditions for 24 h. Final post-curing was performed at 75 °C for 3 h and 125 °C for another 3 h. The same procedure was applied for the coating of the specimens with the epoxy-clay nanocomposites, except that prior to adding the curing agent, the epoxy pre-polymer (DGEBA) was mixed with the (organo) clay for 1 h at 50 °C. The clay loading in the nanocomposites was 3 and 6 wt % on a silicate basis.
The clays used for preparing the nanocomposite coating were the Nanomer I.28E and the Nanomer I.30E, both kindly provided by Nanocor Inc. (Hoffman Estates, IL, USA), which are montmorillonite clays that have been modified with quaternary and primary octadecylammonium ions, respectively. The parent, inorganic Na+-PGW clay (Polymer Grade Wyoming, Nanocor Inc.) was also used for preparing specimens of epoxy-clay nanocomposites for comparing the structure and properties of the bulk nanocomposites samples. All three clays used were polymer grade (PG) montmorillonites which are high purity aluminosilicate minerals with the theoretical chemical formula: M+y(Al2−y Mgy)(Si4)O10(OH)2·nH2O. The chemical composition, as measured by Inductively Coupled Plasma Atomic Emission Spectroscopy, ICP-AES, chemical analysis, of the Na+-PGW montmorillonite clay and the two organoclays is presented in Table 1 below. Obviously, there is a dramatic reduction of Na+ cations in the composition of the organoclays.
The average particle size of Na-PGW as measured by a laser particle size analyzer (Mastersizer S, Malvern Instruments, Malvern, UK) in 0.4 wt % aqueous suspensions was ~2 μm (with a distribution of 0.5–10 μm). Various relevant physicochemical properties of the clays used, as provided by Nanocor Inc., are given in Table 2.
2.2. Characterization and Testing of Epoxy Polymer and Nanocomposites
Both the pristine glassy epoxy polymer and the epoxy-clay nanocomposites were characterized for their mechanical properties (tensile measurements), thermomechanical properties (Dynamic Mechanical Analysis, DMA), thermal stability (Thermogravimetric Analysis, TGA), and barrier properties (O2 permeability measurements). X-ray diffraction (XRD) was also applied in order to determine the degree of intercalation/exfoliation of clay nanoplatelets within the epoxy polymer. The dispersion of clay nanolayers within the polymer matrix was investigated by means of High Resolution Transmission Electron Microscopy (HRTEM).
XRD measurements were performed on a Siemens D-500 (Siemens AG, Karlsruhe, Germany) type automated diffractometer, with Cu(Kα) λ = 1.5418 Å radiation, in the range 2°–10° 2θ and at a scan rate of 1°/min. HRTEM measurements were performed on a JEOL 2011 high resolution transmission electron microscope (Jeol, Peabody, MA, USA) with a LaB6 filament (TED PELLA Inc., Redding, CA, USA) and an accelerating voltage of 200 kV, a point resolution of 0.23 nm, and a spherical aberration coefficient of Cs = 1 mm. The TEM samples were prepared by supporting thin sections (80–100 nm) of the nanocomposite samples onto a lacy carbon film supported on a 3 mm diameter, 300 mesh copper grid. The specimens were further coated with a carbon layer in order to enhance conductivity and avoid destruction of the epoxy polymer.
The mechanical properties of the samples were measured with an Instron 3344 dynamometer (Instron, Norwood, MA, USA) according to the Standard Method (ASTM D638) [21], with a stress rate of 5 mm/min. Τhe specimens had a dogbone shape and dimensions of 40 mm × 5 mm × 2 mm and were prepared in rubber molds by curing of the epoxy/amine mixture, as described above. The thermomechanical properties were measured using a Perkin Elmer Diamond DMA analyser (Perkin Elmer, Waltham, MA, USA). The bending method was used with a frequency of 1 Hz in a temperature range 25–150 °C. The heating rate was 2 °C/min and the applied stress was 4 N. Τhe samples had a rectangular shape with dimensions of 50 mm × 13 mm × 2 mm, also prepared in rubber molds. Thermogravimetric (TGA) experiments on the epoxy nanocomposites were performed using an SDT2956 (TA instruments, New Castle, DE, USA) thermobalance under Ar inert gas flow (100 cm3/min) and at a constant heating rate of 10 °C/min in the temperature range of 25–900 °C.
Oxygen permeability measurements were performed on an Analyzer M8001 (Systech Illinois, Johnsburg, IL, USA) according to the Standard Method (ASTM D3985) [22]. The oxygen transmission rate (OTR, cc/m2 day) and permeability (OTR specimen thickness, cc mm/m2 day) were measured at a constant temperature of 23 °C and zero relative humidity (0% RH). The specimens tested were the pristine epoxy polymer disks and the epoxy-clay nanocomposite disks, with an average thickness of 2 mm.
2.3. Characterization of Coated Specimens and Protective Properties
Four types of specimens were tested in both salt spray and electrochemical experiments: (a) blank (not coated); (b) coated with pristine glassy epoxy polymer; (c) and (d) coated with the two types of epoxy-clay nanocomposites, i.e., with I.28E and I.30E organoclays. The times of exposure were 1, 2, or 4 days. The salt spray tests were carried out in a corrosive environment of 100% saturated moisture + 5 wt % NaCl solution, according to Standard Methods (ASTM B117) [23,24]. For each tested specimen the weight loss/gain during the exposure in the corrosive environment was measured and the corrosion behaviour was examined by optical and microscopic (scanning electron microscopy) investigation. Three specimens were prepared for each salt spray test. Each tested specimen was washed in clean running water to remove salt deposits from their surface, dried, and weighted, according to ASTM standard B117 [23]. Different specimens were used for the calculation of the corrosion weight loss at 1 or 4 days. After exposure for 1, 2, or 4 days in a corrosive environment of 3.5% NaCl solution, electrochemical impedance spectroscopy measurements were carried out according to Standard Methods (ASTM G106, ASTM B457) [25,26]. Impedance measurements in the controlled potential mode were performed with a system consisting of an impedance spectrum analyzer (Zahner Elektrik IM6, potensiostat DC ±10 V, ±3 A, frequency generator and analyzer, Zahner Elektrik GmbH & Co. KG, Kronach, Germany) connected in serial to a PC terminal computer. We used the THALES evaluation software (Zahner Elektrik GmbH & Co. KG) that runs under the TASC system (Zahner Elektrik GmbH & Co. KG) and combines the MS-DOS system (Microsoft) of the PC terminal with the AMOS/ANDI data acquisition system (Zahner Elektrik GmbH & Co. KG) in a IM6 unit. The frequency scan was carried out over a range from 10,000 Hz (10 kHz) to 0.1 Hz (100 MHz). In all the measurements, ten frequency points per decade were taken and the potential amplitude was 10 mV. A conventional 3 compartment glass cell was used. A platinum foil with a surface area of 2 cm2 was used as the counter electrode. A fritted glass separated the anodic compartment. A saturated calomel reference electrode was placed close to the cathode through a Luggin capillary. The supporting electrolyte was 0.1 M LiClO4. All impedance measurements were carried out at 25 °C, in de-aerated conditions and at the potential value of the corrosion potential (Ecorr). The open circuit potential (OCP) for all types of specimens and times of exposure also was determined.
3. Results and Discussion
3.1. Structure and Morphology of Organo-Clays and Epoxy-Clay Nanocomposites
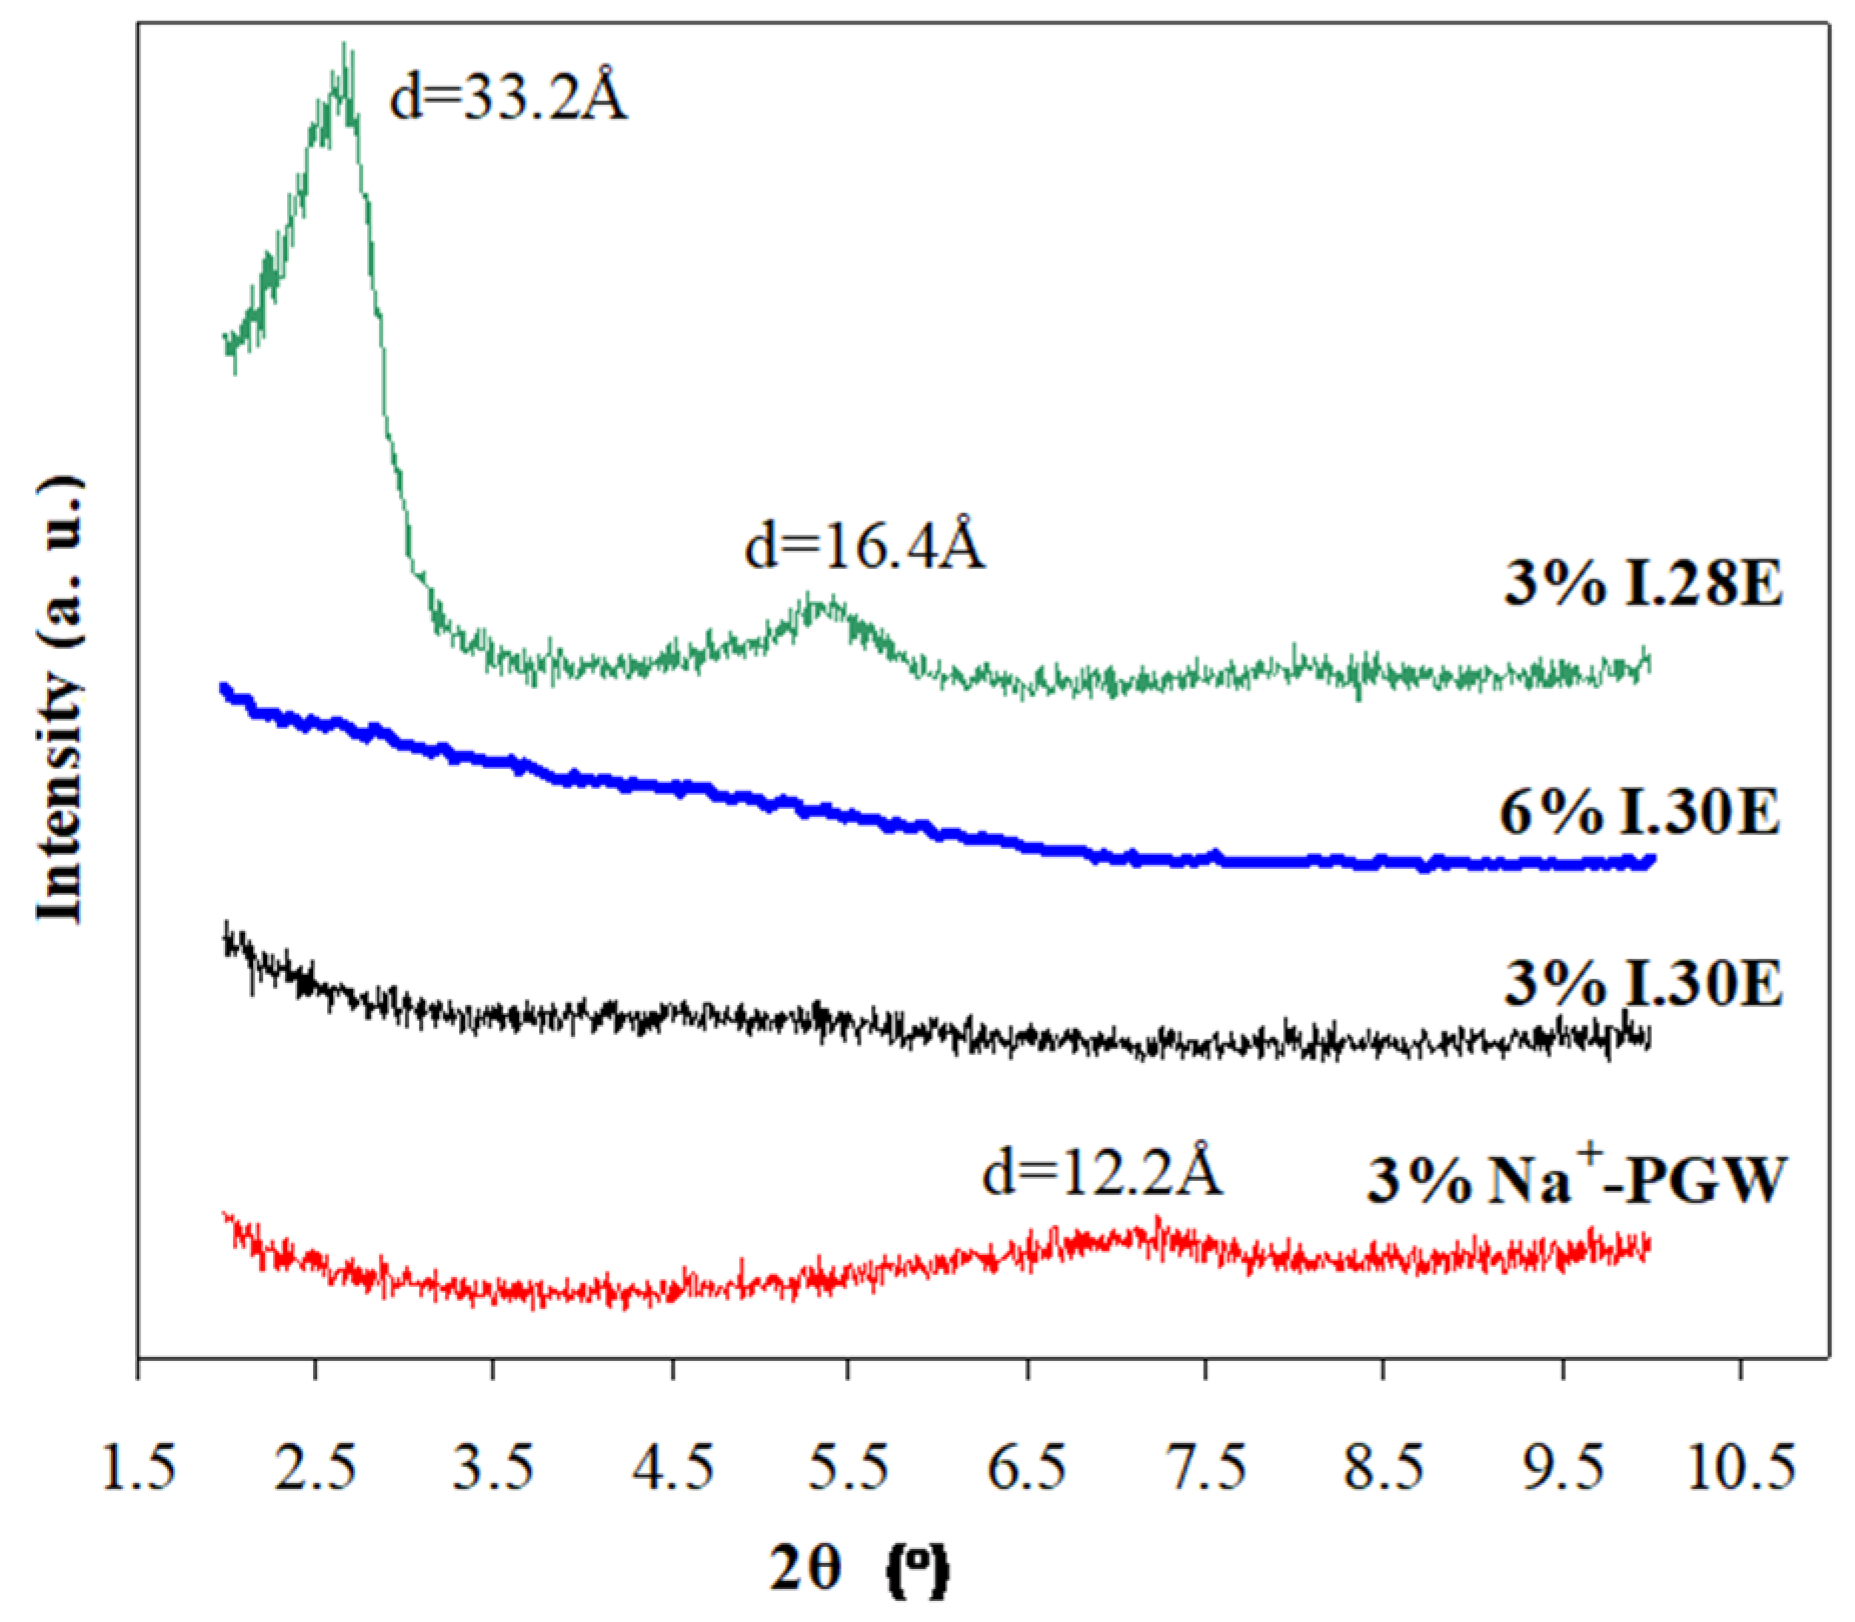
The XRD patterns of the parent sodium montmorillonite clay (Na+-PGW) and the two organoclays (Nanomer I.28E and I.30E) are shown in Figure 2.
As can be seen from the patterns and the d-spacing data in Figure 2, the hydrophilic Na+-PGW parent clay exhibits a basal spacing of 12.5 Å (corresponding to the interlayer distance of approximately 2.5 Å), due to the presence of water molecules (12 wt % moisture) in the region between the aluminosilicate clay layers (intragallery). The ion-exchange of Na+ cations with octadecylammonium ions in both the organo-clay samples was as high as 93%–95% (determined by carbon analysis), resulting in a significant increase of the basal spacing (23.5–24.5 Å) for both Nanomer I.30E (exchanged with primary onium ions) and Nanomer I.28E (exchanged with quaternary onium ions). The relatively broader and less intense (001) peak in the XRD pattern of the organoclay I.30E compared to that of organoclay I.28E indicates that there was greater disorder of the intercalated layered structure and a broader distribution of basal spacings.
The structure of epoxy-clay nanocomposites, i.e., the degree of clay nanolayer intercalation or exfoliation within the bulk epoxy polymer, was studied by XRD and HRTEM experiments. The XRD results from the epoxy-(organo) clay nanocomposites are shown in Figure 3.
The XRD pattern of the epoxy composite prepared with the parent inorganic clay Na+-PGW (3 wt %) exhibited the characteristic peak (d-spacing of 12.2 Å) of the parent inorganic clay (the epoxy polymer is amorphous), indicating that no intercalation of the epoxy polymer between the clay nanolayers had occurred, as was expected, due to the hydrophilic nature of the inorganic clay surfaces. By comparing the XRD patterns of the nanocomposites prepared by the I.28E (modified with quaternary C18 alkylammonium ions) and I.30E (modified with primary C18 alkylammonium ions) organoclays, we showed that the latter organoclay enabled the formation of an exfoliated clay nanocomposite structure (indicated by the absence of XRD peaks due to ordered nanolayers) in contrast to the former organoclay, which induced the formation of a highly ordered intercalated structure. The actual presence of clay nanolayers in the nanocomposite specimen of I.30E was verified by the XRD peak in the range 60°–65° 2θ, which was attributed to the crystalline structure of the aluminosilicate clay layers (not shown here for brevity). The basal spacing of I.28E increased from 24.5 Å in the powder organoclay to 32.2 Å in the nanocomposite, thus indicating that single or double layers of epoxy polymer chains were intercalated between the organo-functionalized clay nanolayers. The positive effect of the primary alkylammonium ions versus quaternary ions was attributed to the catalytic effect of the acidic protons from the primary alkylammonium ions, which initiate polymerization within the gallery space, thus facilitating exfoliation of the nanolayers and their dispersion in the bulk polymer [18].
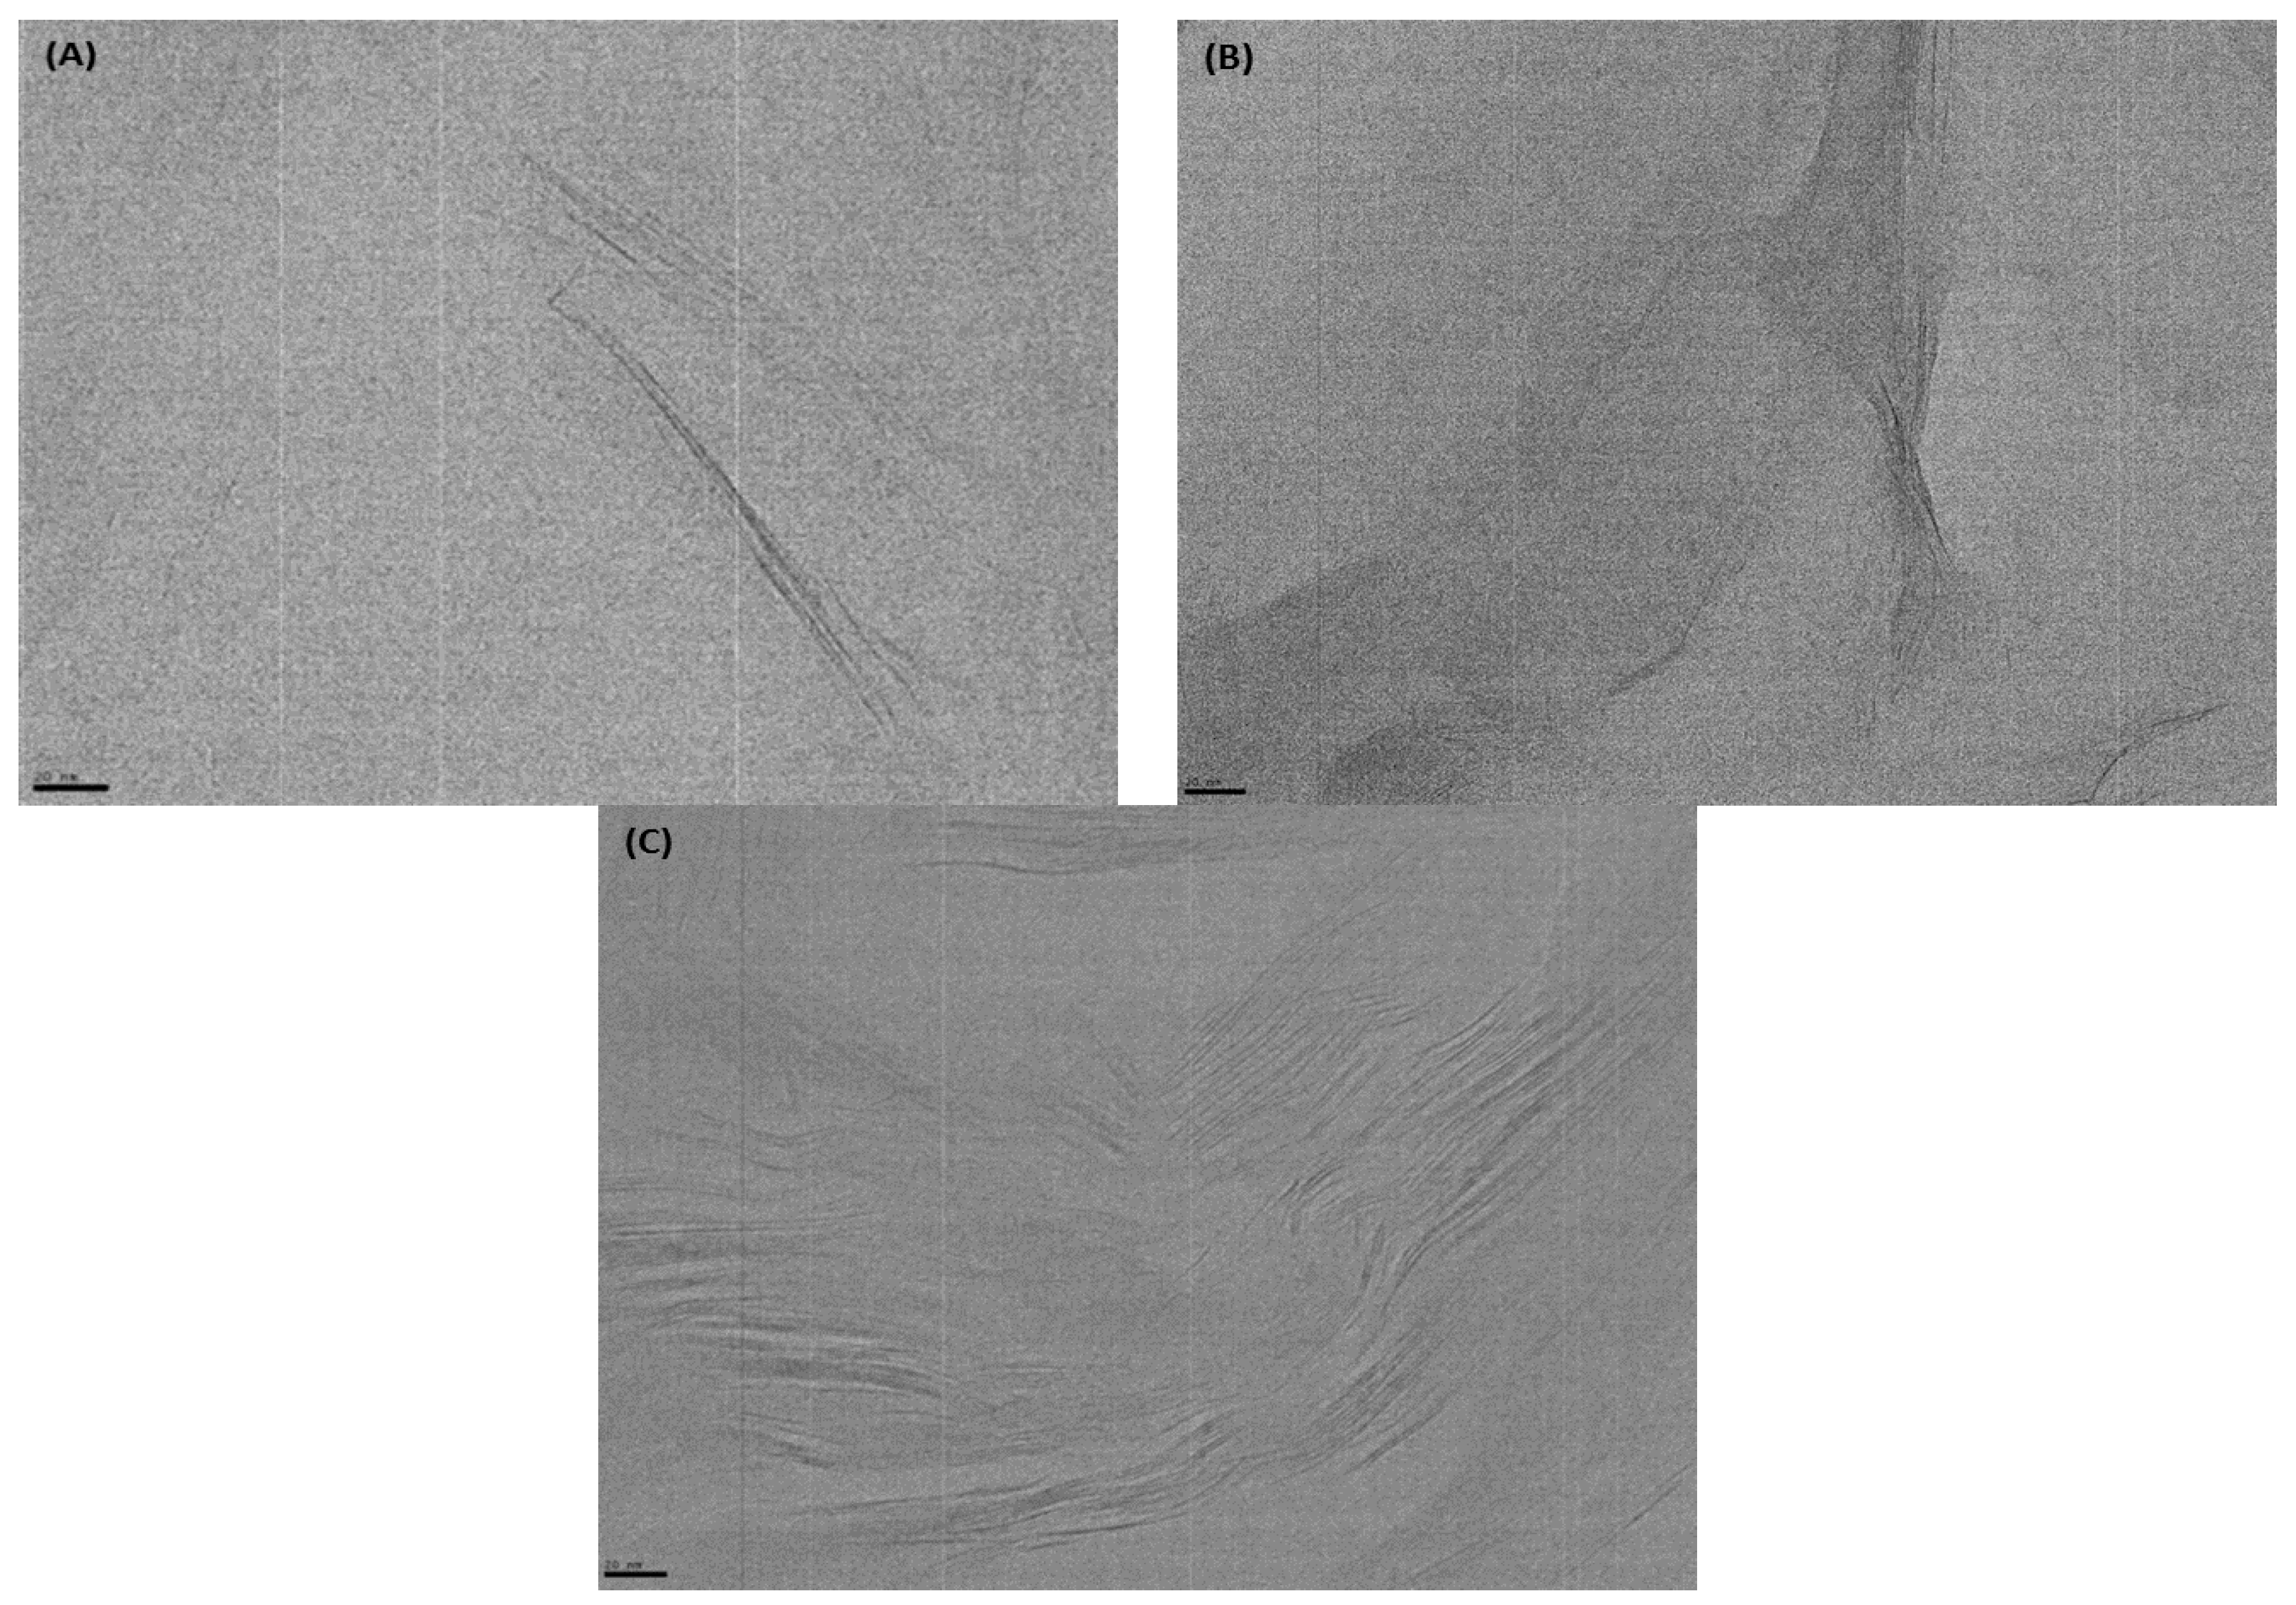
The structure of the nanocomposites and the dispersion of the clay layers in the coatings were further studied with high resolution TEM (HRTEM) images. Representative images of the glassy epoxy-clay nanocomposites prepared by 6 wt % organoclay I.30E and 6 wt % organoclay I.28E are shown in Figure 4A–C, respectively.
The main difference between the I.30E and I.28E organoclays is that the first is modified with a primary C18 alkylammonium ion while the second is modified with the same alkylammonium ion but in its quaternary form. Although their powder XRD patterns seem very similar due to the successful incorporation of these two onium ions with similar size, when mixed with the epoxy resin a substantial difference in their dispersion has been identified, resulting in two different nanocomposite structures. The primary ammonium ions (I.30E) provide acidic H+ ions which can catalyse the fast opening of the epoxy rings, thus enhancing the cross-linking polymerization of the epoxy monomers by the amine curing agents. As a result, a partially exfoliated clay nanolayer structure is formed with enhanced interfacial interactions. On the other hand, quaternary ammonium ions are significantly weaker proton donors. So, when in contact with the epoxide, they react with a slower rate thus resulting in an overall slower cross-linking polymerization and eventually leading to intercalated nanocomposite structures.
The above suggested clay dispersion and nanocomposite structures are supported by the XRD patterns, where in the case of I.30E no diffraction peaks can be observed even in the case of the 6 wt % filler (the actual presence of clay in the XRD specimens was verified by the high angle XRD peaks owing to the crystalline structure of the clay). On the other hand, clear distinct XRD peaks are observed in the pattern of the I.28E nanocomposite. From the increase of the d-spacing when compared to the pattern of the I.28E organoclay, it is clear that polymer chains have been inserted within the clay galleries and have induced a further broadening of the interlayer space.
The exfoliated or at least partially exfoliated clay nanolayer structure of the 6 wt % I.30E nanocomposite has been also verified by the TEM images (Figure 4). The presented images are representative of the bulk nanocomposite and show the presence of either isolated single clay nanolayers or bundles of ca. less than 7–8 layers, with varying interlayer distance. It is also known from the literature that, when the distance among the galleries is higher than 50–70 Angstrom and the number of layers is less than 8–10, no diffraction peak can be observed in the XRD. These observations apply also for the 6 wt % I.30E nanocomposite in our study. On the other hand, as can be seen in Figure 4C, the nanocomposite prepared with the organoclay I.28E consists mostly of bundles with more than ca. 20 highly oriented and stratified nanolayers, capable of inducing the XRD profile observed in the respective patterns.
3.2. Properties of Epoxy-Clay Nanocomposites
The mechanical and thermomechanical properties of the pristine epoxy polymer as well as the glassy epoxy nanocomposites are summarized in Table 3.
As can be seen from the data in Table 3, the glassy epoxy nanocomposites prepared by 3 wt % inorganic sodium MMT (Na+-PGW) exhibited slightly improved tensile strength and elastic modulus with a concomitant small decrease of the strain at breaking point. Although the XRD data (Figure 3) showed that the clay nanolayers were not intercalated by the epoxy resin in the (nano)composite sample, it can still be suggested that the observed changes in mechanical properties, with even 3 wt % filler, were derived from the interaction of the epoxy matrix with the external surfaces of the micro-particles of the inorganic clay. The absence of organic modifiers in the inorganic clays allows direct adhesion of the polymer chains to the stiff inorganic external surfaces of the clay particles. In the case of the epoxy nanocomposite prepared using 3 wt % of the I.28E organoclay (modified with quaternary C18 alkylammonium ions), the stress and elongation at breaking load were slightly reduced (the elastic modulus remained unchanged), while with the I.30E organoclay (modified with primary acidic C18 alkylammonium ion), the tensile strength was increased by 12% (with a slight reduction of elongation at the breaking load) and the elastic modulus increased by 10%. In the exfoliated structure of this nanocomposite, the nanolayers were highly dispersed, thus increasing the polymer volume fraction that was being affected by the presence of the stiff clay layers. In addition, the catalytic function of the acidic/primary alkylammonium ions in initiating the epoxy polymerization via the epoxy ring opening led to a stronger interaction of the polymer chains with the surface of the clay layers, compared to the case of the non-reactive quaternary ion modifiers such as those in the I.28E organoclay. An increase in the organoclay concentration from 3 to 6 wt % led to an increase in the elastic modulus with both organoclays (up to a 16% increase compared to the pristine glassy epoxy), with a concomitant decrease in the stress and strain at breaking load, most pronounced in the case of the I.28E organoclay. This behavior was typical for glassy polymer matrices such as the glassy epoxy resins, as increasing the stiffness of the nanocomposite (increase of the modulus) due to the effect of the clay nanolayers leads to more brittle materials that break at lower strain [27,28].
The storage modulus (DMA measurements, Table 3) of the glassy epoxy matrix at 40 °C (glassy region) changed slightly (±5%) with the addition of 3 wt % (silicate basis) of the inorganic sodium MMT, but increased remarkably with the addition of 3 wt % (silicate basis) of both the C18 alkylammonium modified organoclays (70% increase with the I.30E organoclay modified with primary C18 alkylammonium ions and 50% increase with the I.28E organoclay modified with quaternary C18 alkylammonium ions). Both the organoclays also exhibited substantial improvement of the storage modulus at 100 °C (elastic region) (≥60% increase compared to the pristine polymer). The Tg generally showed a slight fluctuation (up to ±2 °C) compared to that of the pristine glassy epoxy polymer with the addition of the inorganic and organo-modified clays. The small decrease of Tg in the case of the nanocomposite prepared by the I.30E organoclay can be attributed to the plasticizing effect induced by the chains of C18 alkylammonium ion modifier, which becomes more pronounced in this exfoliated clay nanocomposite compared to the intercalated structures formed with the I.28E organoclay. As mentioned above, in the exfoliated nanocomposite structure a larger volume of the polymer matrix is affected by the organo-modified clay surfaces due to the high dispersion of isolated clay layers. The direct interaction with the stiff inorganic layers increases the modulus of the nanocomposite while, on the other hand, penetration of the modifier’s dangling chains within the polymer network reduces the Tg. A greater decrease of the Tg is observed as the organoclay loading increases, due to the increasing concentration of the C18 alkylammonium modifier within the polymer matrix. The storage modulus at 40 °C decreased with the addition of 6 wt % organoclay compared to the nanocomposites with 3 wt % clay, but it was still higher compared to that of the pristine epoxy polymer. The addition of a small percentage of organoclay (≤3 wt %) is improving the thermo-mechanical properties without causing a distortion of the epoxy crosslinked network in the glassy region. A further increase of the organoclay content (≥6 wt %) may cause defects in the polymer network, increase the stiffness substantially, and restrict the flexibility of the polymer chains (glassy region). While the temperature increases, a small degree of elasticity (polymeric chains movement) is induced in the system thus allowing the organoclay sheets to penetrate among the epoxy chains without interrupting the epoxy network (rubbery state). The result of this thermo-mechanical behavior is a small deterioration of the storage modulus values in the glassy region when increasing the organoclay content and in contrast, an increase of these values in the rubbery region.
The TGA curves of the pristine glassy epoxy polymer and the respective epoxy nanocomposites are shown in Figure 5.
From the curves in Figure 5, it can be seen that the presence of the clay filler had a minor effect on the thermal stability of the epoxy polymer, which can be evaluated by comparing the percent weight loss at a certain temperature (for instance at 350 °C, as can be seen in the inset of Figure 5). This behavior can be attributed to the relatively low clay loading, at least for the nanocomposites with 3 wt % clay, which is not sufficient to significantly affect the thermal stability and decomposition rate of the polymeric matrix. The addition of 6 wt % I.30 organoclay induced a slightly faster decomposition, as can be seen in the inset of Figure 5, possibly due to the acidic function of the primary alkylammonium ions of this organoclay, which can catalyze the pyrolysis/decomposition of the polymeric chains.
With regard to the barrier properties of the epoxy polymer and the epoxy-clay nanocomposites, a 30% and 40% reduction of oxygen permeability was observed for the nanocomposites prepared by the addition of I.28E and I.30E organoclays (6 wt %), respectively, compared to that of the pristine polymer (oxygen permeability: 105 cc mm/m2 day). The reduction of permeability with the addition of the inorganic clay was not significant.
3.3. Salt Spray Corrosion Tests
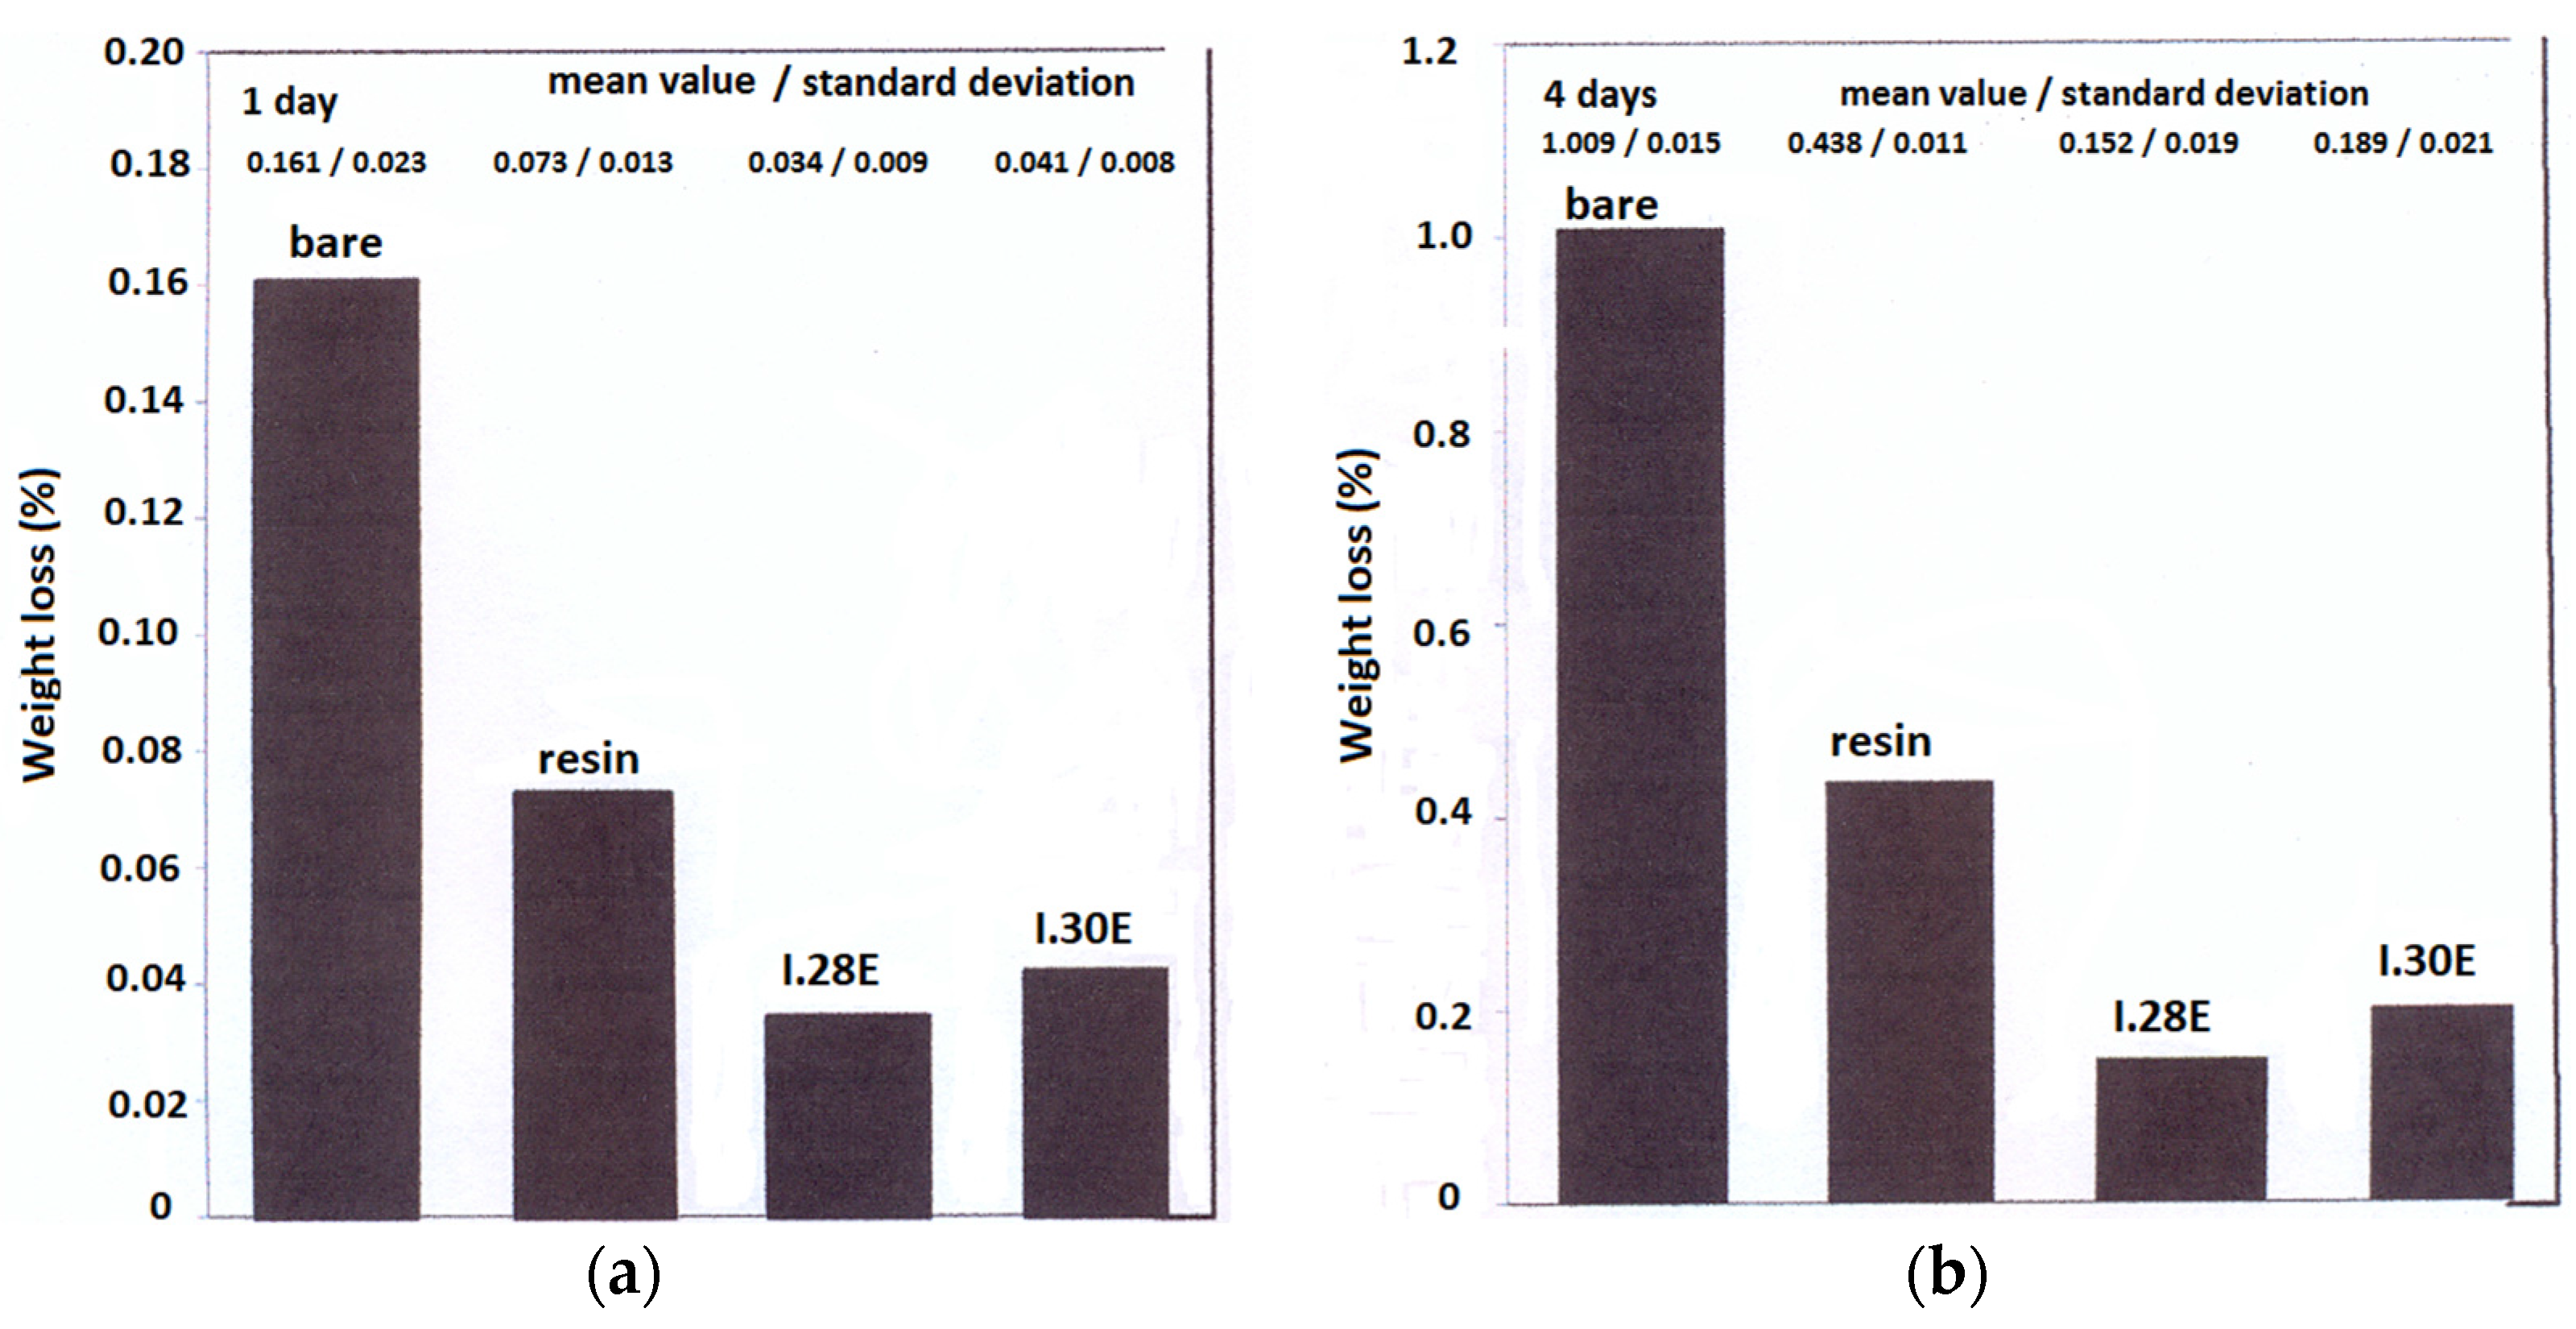
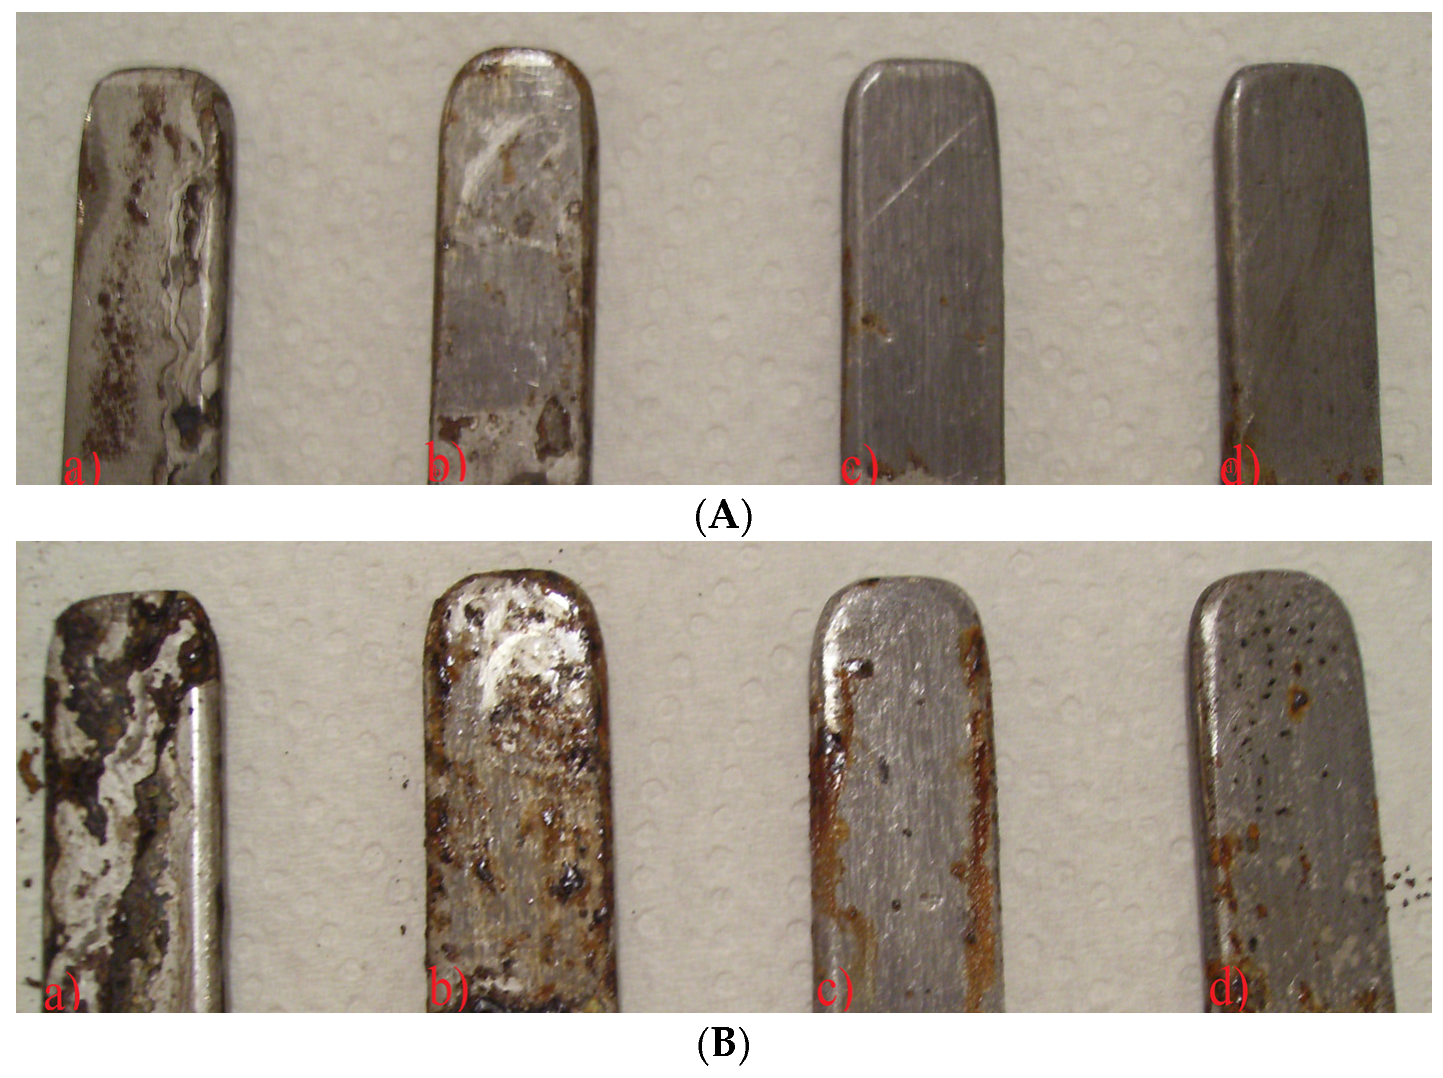
The results of the weight loss of the steel specimens (bare and covered with pristine epoxy and nanocomposites) upon salt spray exposures are summarized in Figure 6. Optical images of the specimens are shown in Figure 7, while representative scanning electron (SEM) images of the bare and coated specimens are shown in Figure 8.
From the weight loss results (Figure 6) it can be seen that after 1 day of exposure the weight loss of bare steel was about 0.16 wt % and was raised to 1 wt % after 4 days. The neat epoxy polymer showed a relatively good protection efficiency by reducing the weight loss, at 0.07 wt % and 0.4 wt % for the first and fourth day, respectively. A greater improvement in protection was offered by both the epoxy nanocomposites (with I.28E and I.30E organoclays) which inhibited the weight loss, exhibiting similar very low values of ca. 0.03–0.04 wt % and 0.15–0.18 wt % after 1 and 4 days of exposure. These latter values correspond to 75% and 80–90% less weight loss, after 1 and 4 days of exposure, by the use of the epoxy nanocomposites compared to the pristine steel specimens. The differences in corrosion between the bare steel specimen and those covered by the thin epoxy polymer or the epoxy nanocomposites, can be also clearly observed in the respective optical photographs, after 1 and 4 days of exposure, as shown in Figure 7. From these images it follows that the corrosion of coated specimens, especially I.28 and I.30 coated steel—Figure 7c,d, after 1 or 4 days of exposure, is less intense than the corresponding bare steel specimens. The SEM images of the various specimens before the salt spray test (no exposure) and after 1 or 4 days of exposure are shown in Figure 8. In the same figure the cross-section image of I.30 coated steel is shown. In these images the differences in the initial morphology and the corrosion behaviour of the bare and coated steels as well as the coating thickness and the coating-steel interface can be observed.
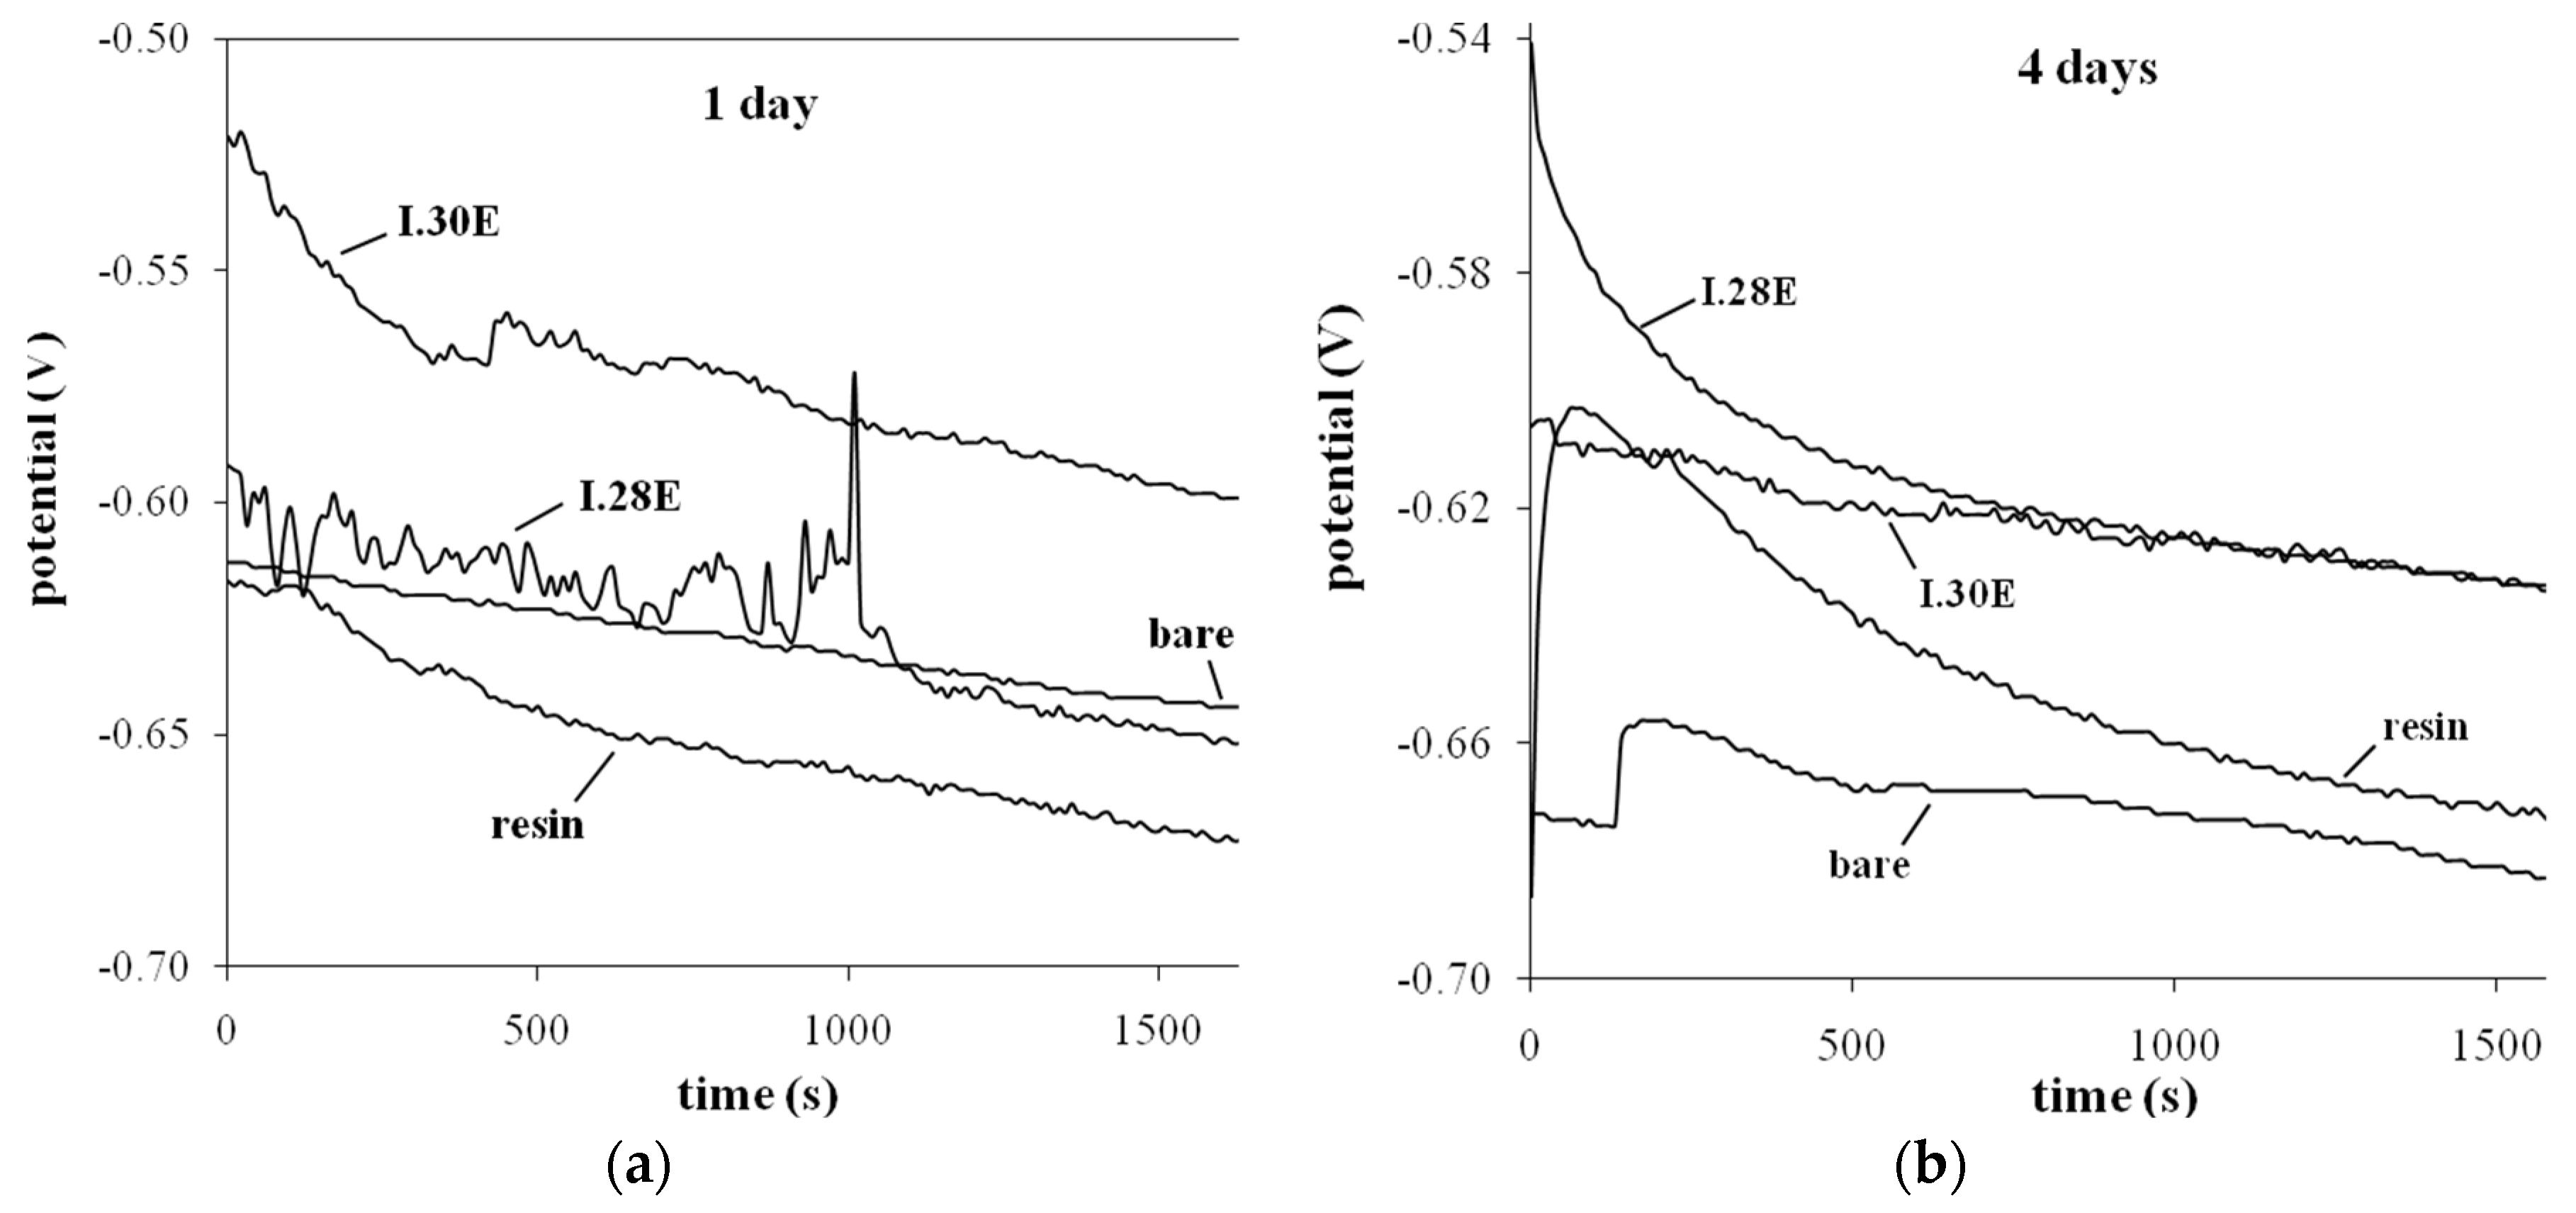
3.4. Electrochemical—Open Circuit Potential Measurements
The results of the open circuit potential measurements (OCP) of all types of bare or coated specimens after 1 or 4 days of exposure are shown in Figure 9.
Open circuit potential measurements were used for a preliminary and indicative prediction of the corrosion behavior. As it is known, the general criterion for the estimation of corrosion behavior, based on open circuit potential values, is that the more anodic (lower negative value) the OCP, the lower the corrosion susceptibility. However, this criterion is not absolute. The estimation depends on the variations of the potential during the monitoring period and an indication of better corrosion behavior is the stability of the corrosion potential with time [2,16,23,29]. From the open circuit potential with time diagram, after 1 day of exposure (Figure 9), it can be seen that the more anodic value of OCP was obtained for the I.30E nanocomposite coating (−595 mV) and the corresponding more cathodic value was obtained for bare steel (−670 mV). All curves moved linearly towards the cathodic direction and oscillations were observed mainly in the case of the I.28E nanocomposite coating. This decrease of OCP indicated a continuous dissolution of the surface layers of the steel specimens. From the open circuit potential with time diagram, after 4 days of exposure (Figure 9), it can be seen that the more anodic value of OCP was obtained for both the I.30 and I.28 nanocomposite coatings (−625 mV) and the corresponding more cathodic value was obtained for bare steel (−680 mV). OCP curves of bare and resin coated specimens move initially in the anodic direction and after that continuously towards more cathodic values, indicating the formation of a non-passive oxide layer (in the case of the bare specimen) or the non-passive behavior of the coating (in the case of the resin coated specimen) that cracks and so the potential decreases and corrosion increases. The I.30 nanocomposite coating curve only decreased slightly (from −605 to −625 mV), indicating an increased stability of the coating and better corrosion behavior.
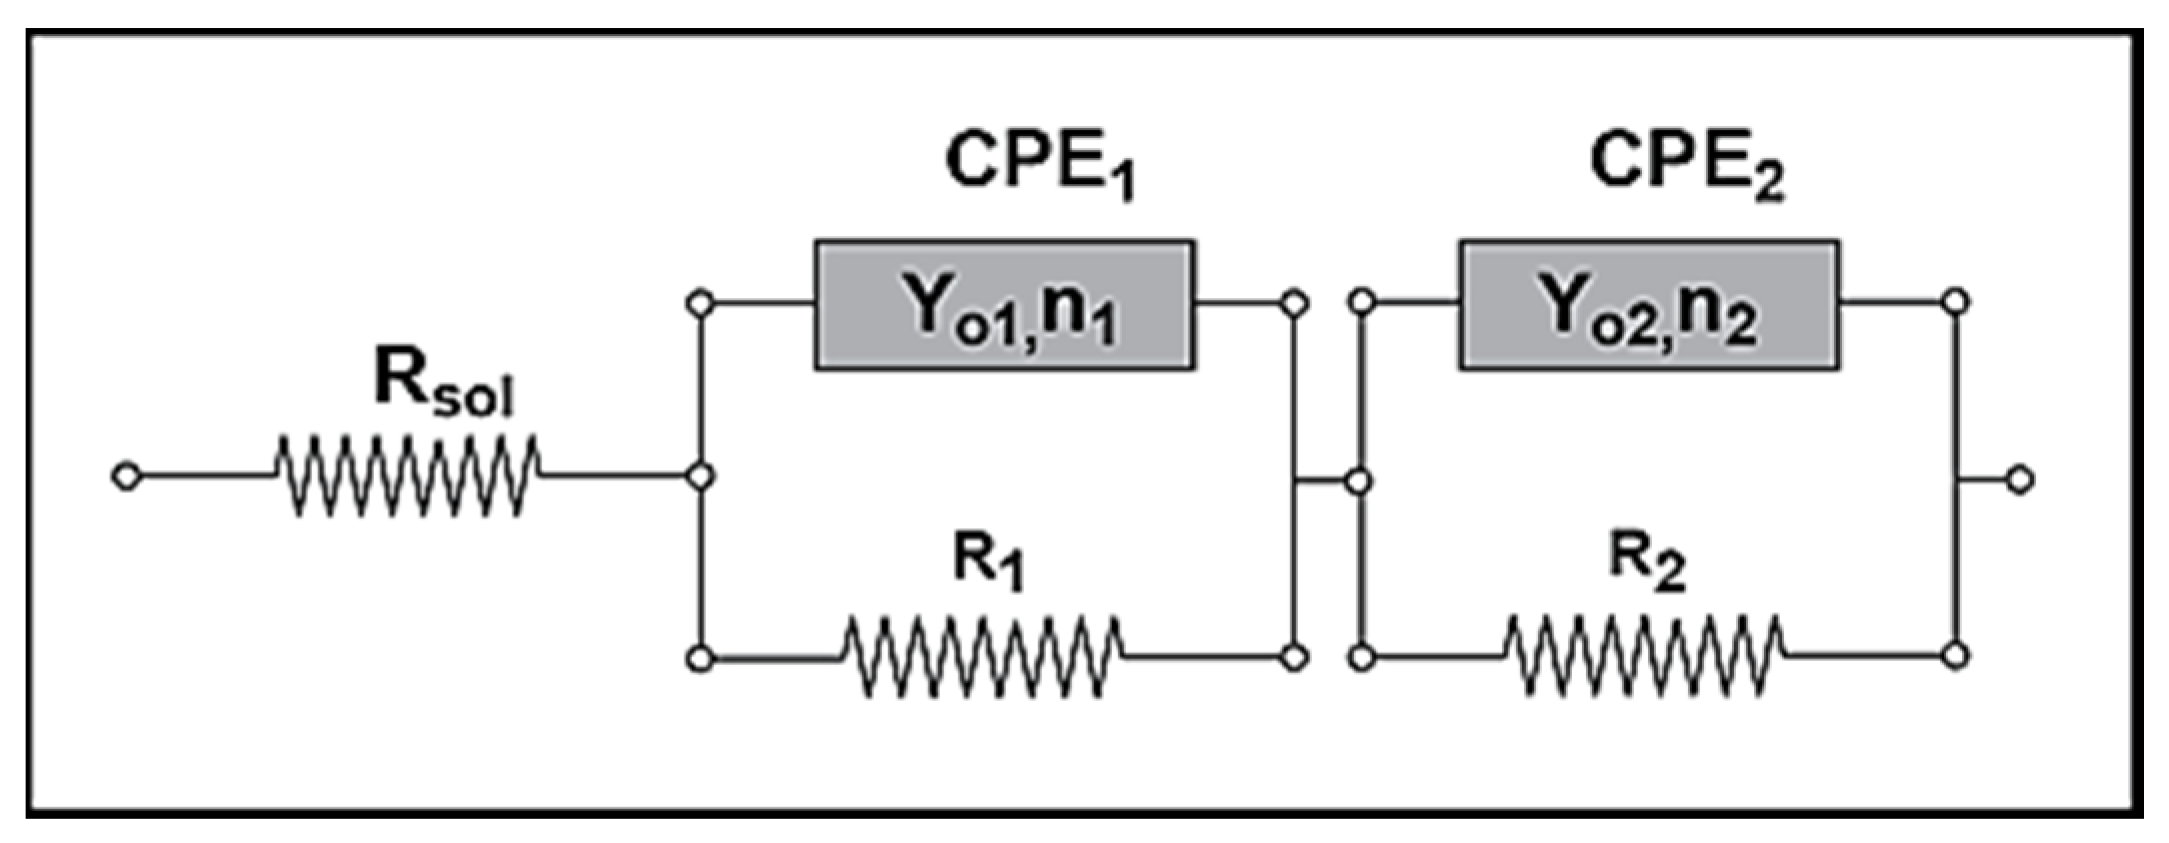
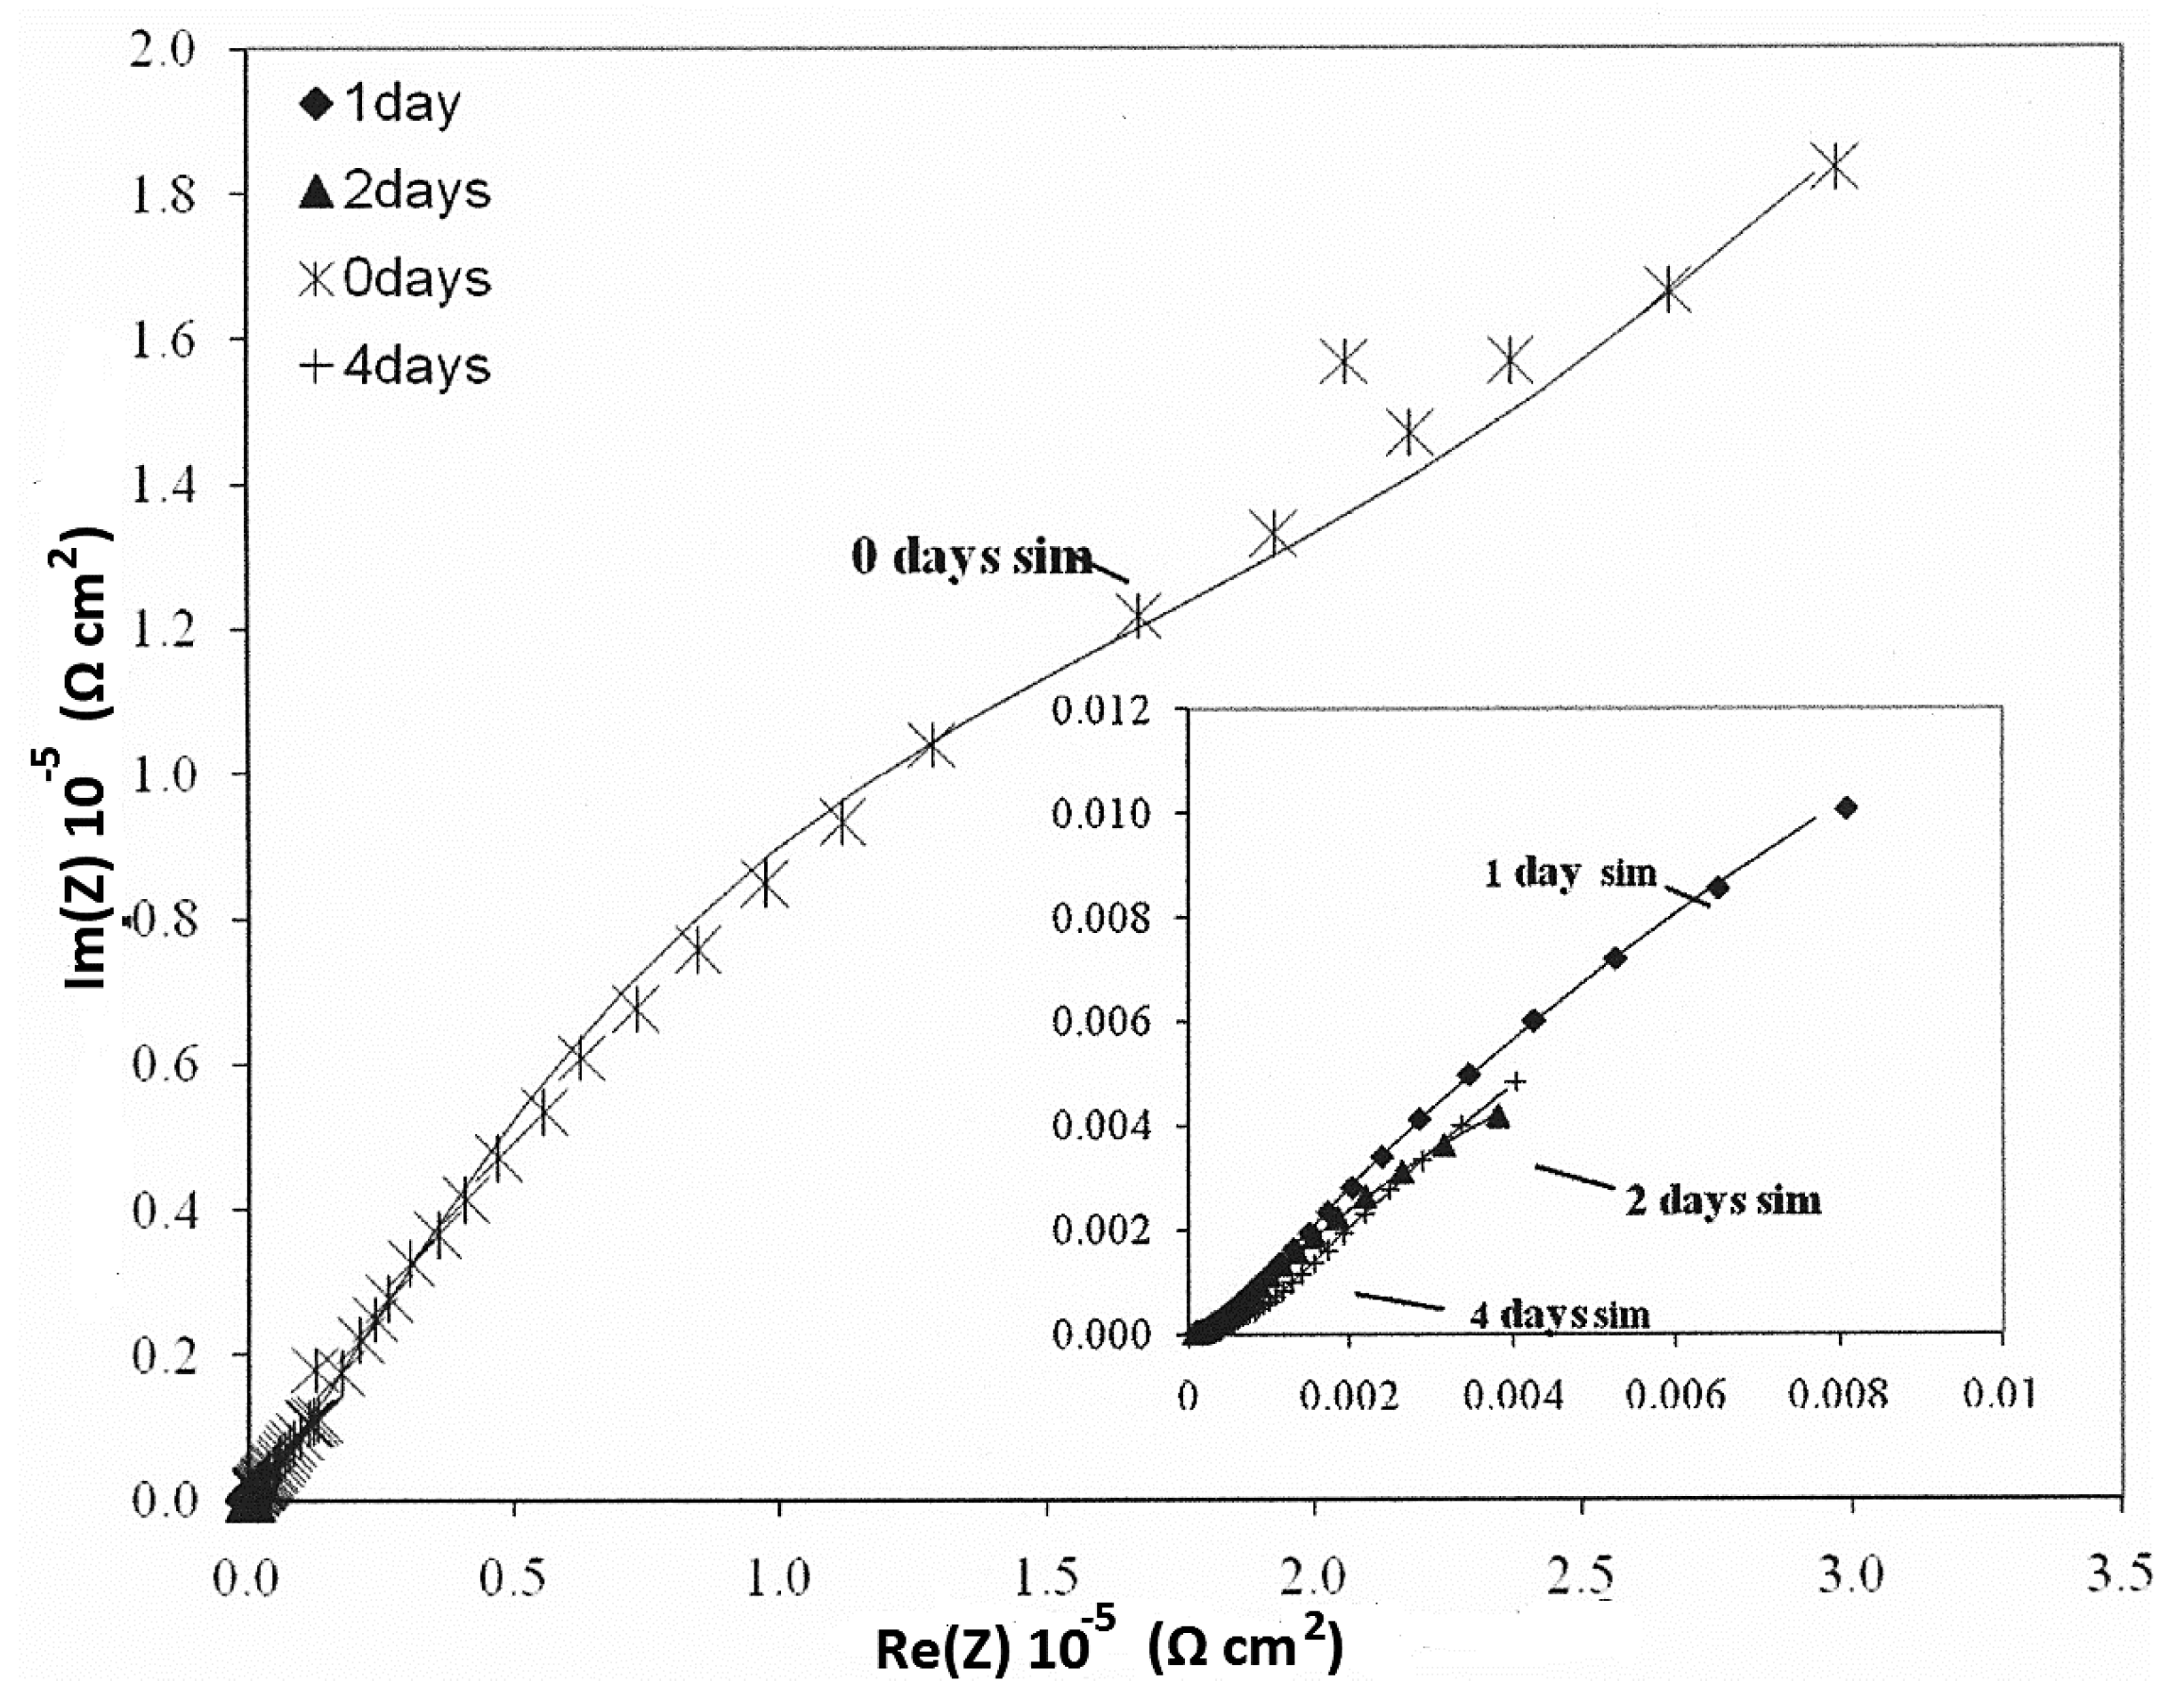
The electrochemical impedance response is a fundamental characteristic of an electrochemical system. Knowledge of the frequency dependency of impedance for a corroding system enables a model equivalent electrical circuit describing that system to be created [29,30,31,32]. Processing of the experimental data and fitting of the electrochemical impedance measurements was based on the equivalent circuit shown in Figure 10 for bare and coated steels, using a non-linear regression analysis. The results are presented in Figure 11, Figure 12, Figure 13, Figure 14, Figure 15 and Figure 16 (Nyquist diagrams) and Table 4 (Resistance values).
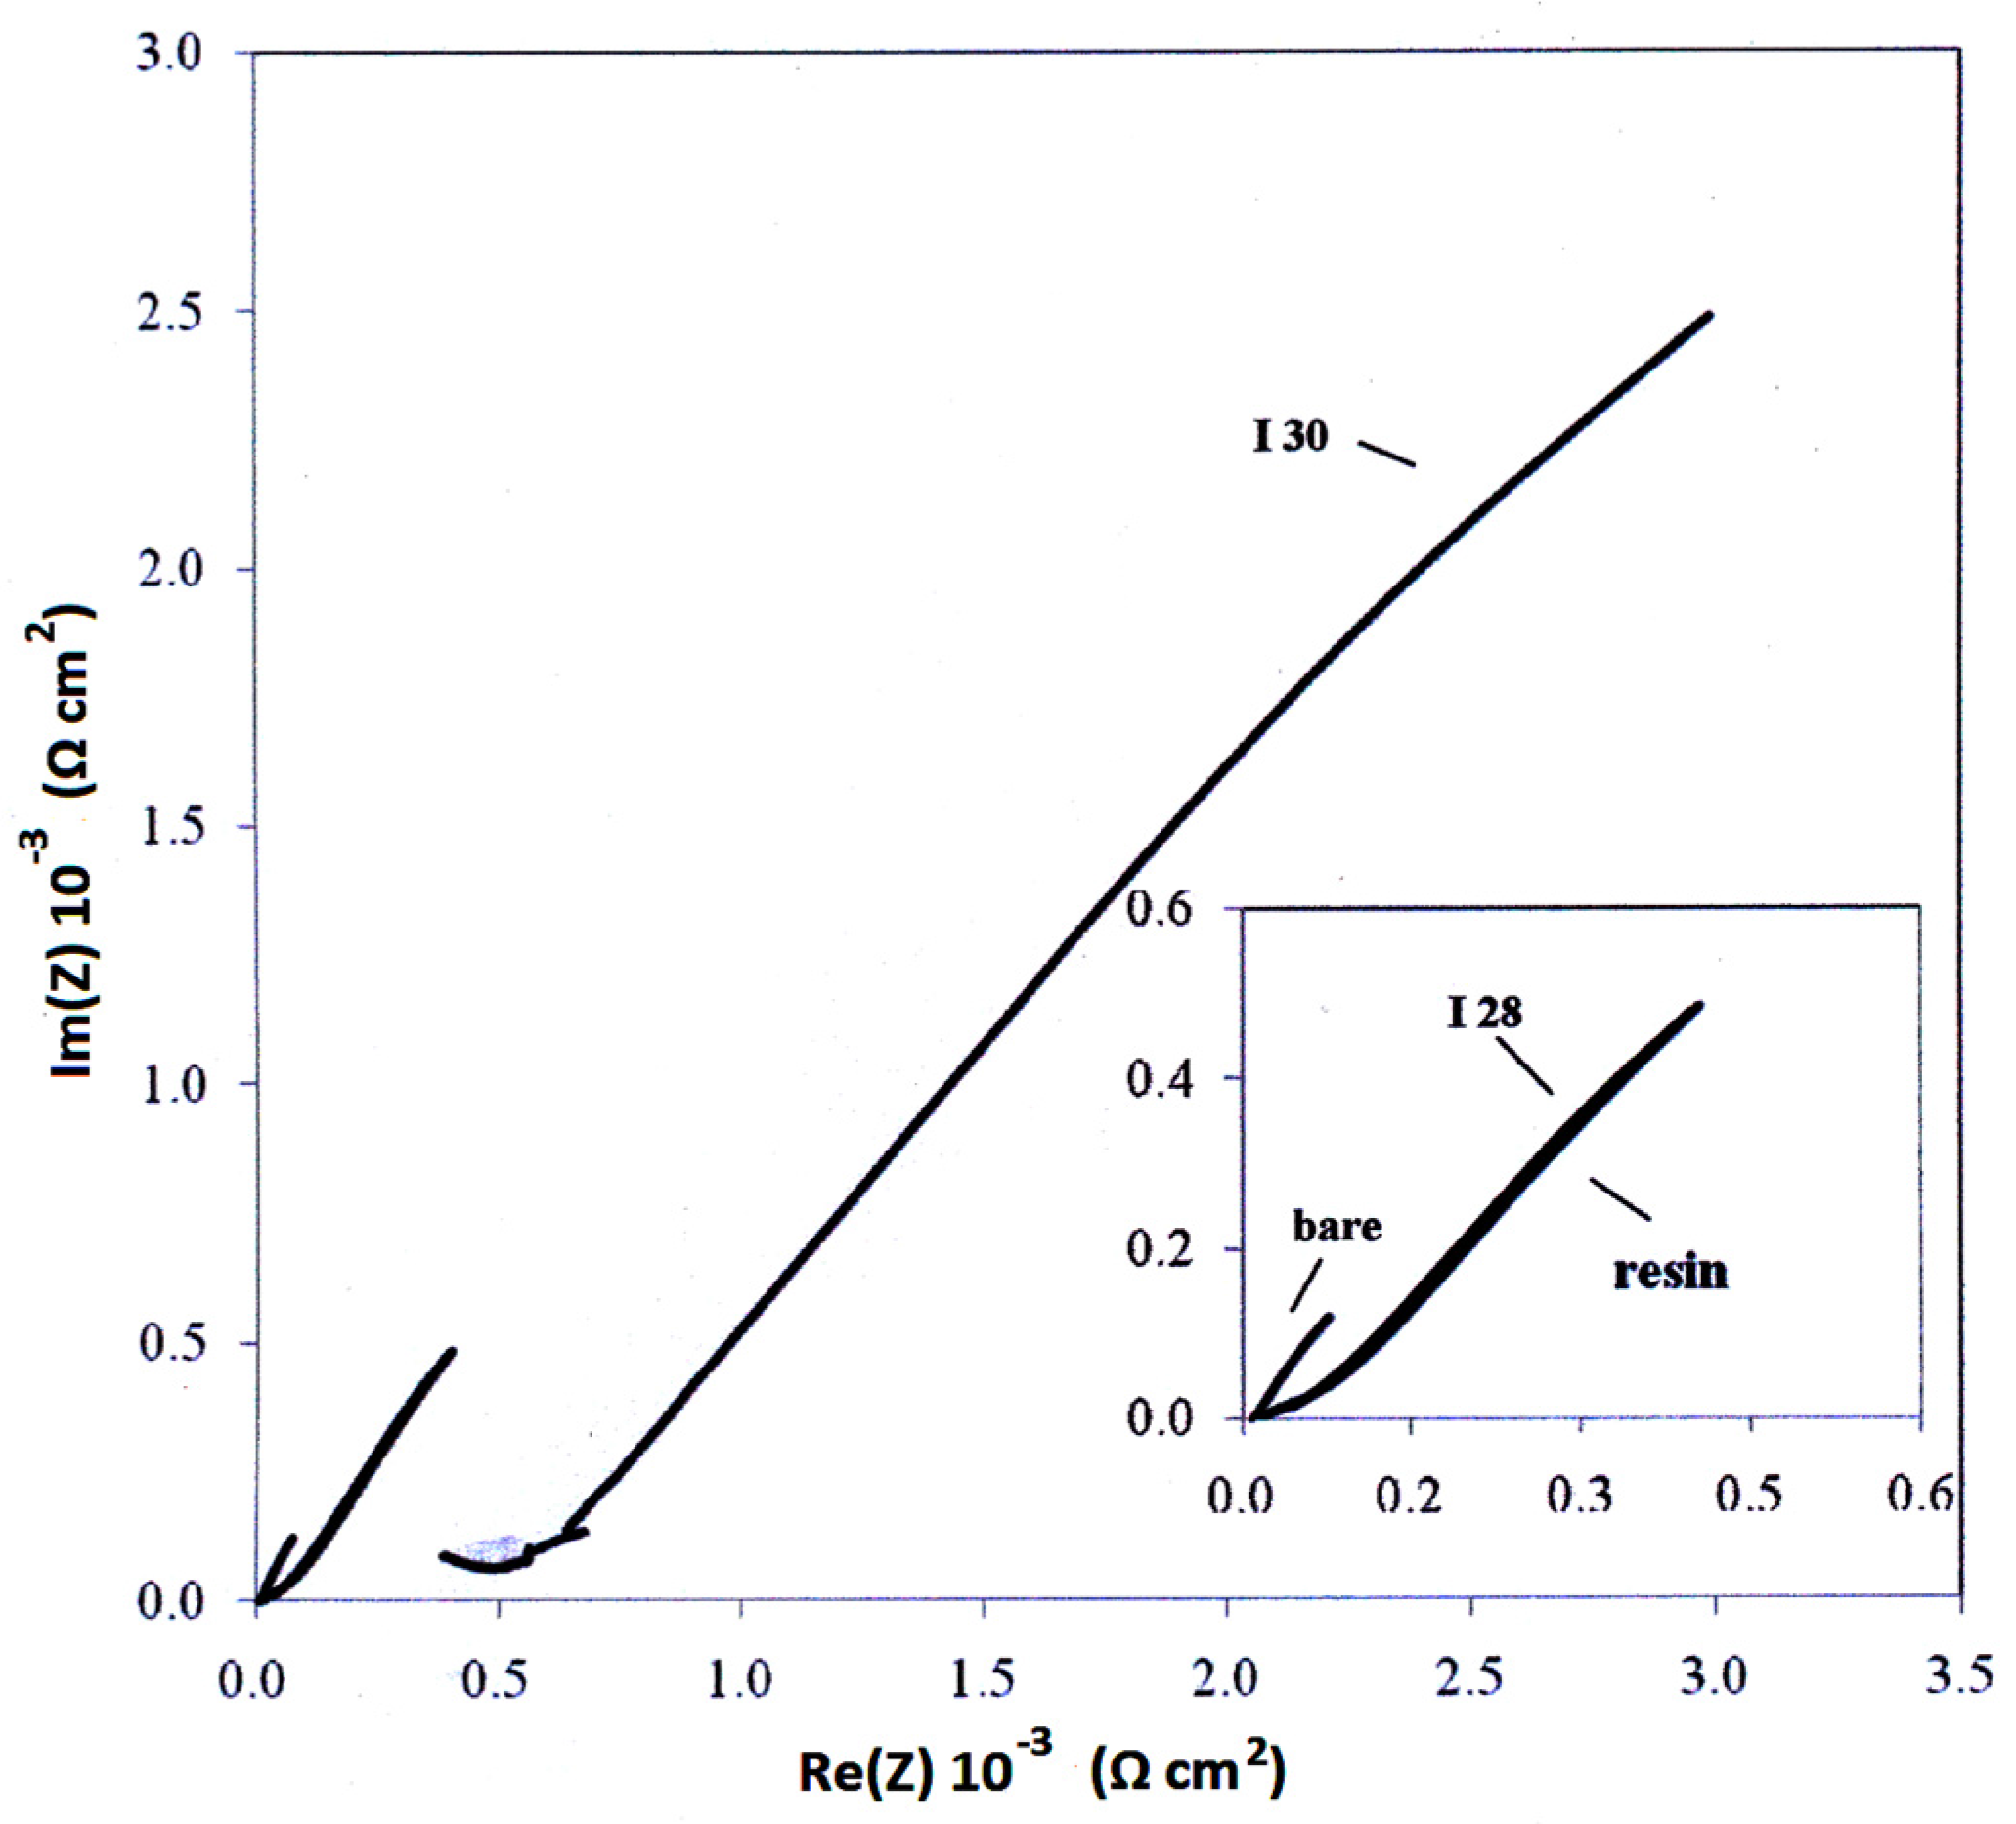
From the results of the electrochemical impedance measurements (Figure 11, Figure 12, Figure 13, Figure 14, Figure 15 and Figure 16 and Table 4), it follows that all the coatings used increased the total resistance and both nanocomposites had greater total resistance values than the pristine glassy epoxy polymer, indicating improved protection properties. Thus, the total resistance value, Rtot, after 4 days exposure in the corrosive environment, increased from 1.03 × 10² of bare steel, to 5.34 × 10³ in the case of pristine resin, to 7.40 × 10³ in the case of I.28E, and to 2.96 × 10⁴ (Ω cm2) in the case of I.30E coated specimens. In the case of bare steel, the total resistance values decrease continuously with exposure time and the relation between these two factors was observed to be linear, indicating a constant corrosion rate. A high total resistance value in the case of pristine resin coated steel in conditions of no prior exposure in the corrosive environment (0 days) was observed, 6.80 × 10⁵ Ω cm2, that decreased quickly in any conditions of exposure, 5.34 × 10³ Ω cm2 after 4 days, indicating high corrosion rate values and the fast evolution of corrosion. In the case of nanocomposite coated steel, the total resistance values decreased after four days of exposure, from 7.99 × 10⁴ to 7.40 × 10³ Ω cm2 in the case of I.28E and from 2.03 × 10⁵ to 2.96 × 10⁴ Ω cm2 in the case of I.30E, as it was expected due to corrosion initiation. However, the decrease is much smaller and so the corrosion evolution is also lower.
The superior protection performance, indicated from the higher total resistance value, of the epoxy nanocomposite with the I.30E organo-clay compared to that with the I.28E organic-clay, can be attributed to the higher dispersion of the clay nanolayers in the former nanocomposite (XRD and TEM results), which also induced slightly improved barrier properties.
4. Conclusions
The mechanical, thermomechanical, and barrier properties of all the epoxy—organoclay nanocomposites were improved compared to those of the pristine epoxy polymer. Both the pristine epoxy and the epoxy nanocomposite coatings offered substantial protection to steel from corrosion. The protective properties of the nanocomposite coatings were superior compared to those of the pristine epoxy polymer, as it was revealed from the weight loss results, the optical and microscopy examination of the specimens after the exposure in the corrosive environment, the open circuit potential measurements, and the electrochemical impedance spectroscopy measurements. The protective properties of the nanocomposite coatings varied with the organo-clay used. The epoxy—montmorillonite clay modified with primary octadecylammonium ions, Nanomer I.30E, had a better behaviour than the clay modified with quaternary octadecylammonium ions, Nanomer I.28E. This was attributed to the higher dispersion of the nanolayers in the nanocomposite formed with the I.30E organoclay compared to that formed with I.28E. The enhanced mechanical properties and thermal stability of both epoxy—clay nanocomposites, in combination with their high protection efficiency, renders them as attractive candidates for various demanding coating applications.
Author Contributions
Panagiotis Giannakoudakis, Konstantinos Triantafyllidis and Panagiotis Spathis conceived and designed the experiments; Domna Merachtsaki and Panagiotis Xidas performed the experiments; Domna Merachtsaki, and Panagiotis Xidas analyzed the data; Panagiotis Giannakoudakis, Konstantinos Triantafyllidis and Panagiotis Spathis contributed reagents/materials/analysis tools; Domna Merachtsaki, Panagiotis Xidas and Panagiotis Spathis wrote the paper.
Conflicts of Interest
The authors declare no conflict of interest.
References
- Hang, T.T.X.; Truc, T.A.; Olivier, M-G.; Vandermiers, C.; Guérit, N.; Pébère, N. Corrosion protection of carbon steel by an epoxy resin containing organically modified clay. Surf. Coat. Technol. 2007, 201, 7408–7415. [Google Scholar] [CrossRef]
- Yeh, J.M.; Huang, H.Y.; Chen, C.L.; Su, W.F.; Yu, Y.H. Siloxane-modified epoxy resin—Clay nanocomposite coatings with advanced anticorrosive properties prepared by a solution dispersion approach. Surf. Coat. Technol. 2006, 200, 2753–2763. [Google Scholar] [CrossRef]
- Kouloumbi, N.; Ghivalos, L.G.; Pantazopoulou, P. Determination of the performance of epoxy coatings containing feldspars filler. Pigment Resin Technol. 2005, 34, 148–153. [Google Scholar] [CrossRef]
- Triantafyllidis, K.S.; LeBaron, P.C.; Park, I.; Pinnavaia, T.J. Epoxy-clay fabric film composites with unprecedented oxygen-barrier properties. Chem. Mater. 2006, 18, 4393–4398. [Google Scholar] [CrossRef]
- Pinnavaia, T.G.; Beall, G.W. (Eds.) Polymer–Clay Nanocomposites, Wiley Series in Polymer Science; John Wiley & Sons: Oxford, UK, 2000. [Google Scholar]
- Vaia, R.A.; Giannelis, E.P. Polymer Nanocomposites: Status and Opportunities. MRS Bull. 2001, 26, 394–401. [Google Scholar] [CrossRef]
- Allie, L.; Thorn, J.; Aglan, H. Evaluation of nanosilicate filled poly (vinyl chloride-co-vinyl acetate) and epoxy coatings. Corros. Sci. 2008, 50, 2189–2196. [Google Scholar] [CrossRef]
- Dai, C.-F.; Li, P.-R.; Yeh, J.M. Comparative studies for the effect of intercalating agent on the physical properties of epoxy resin-clay based nanocomposite materials. Eur. Polym. J. 2008, 44, 2439–2447. [Google Scholar] [CrossRef]
- Yu, H.J.; Wang, L.; Shi, Q.; Jiang, G.H.; Zhao, Z.R.; Dong, X.C. Study on nano-CaCO3 modified epoxy powder coatings. Prog. Org. Coat. 2006, 55, 296–300. [Google Scholar] [CrossRef]
- Hosseini, M.G.; Raghibi-Boroujeni, M.; Ahadzadeh, I.; Najjar, R.; Seyed Dorraji, M.S. Effect of polypyrrole—Montmorillonite nanocomposites powder addition on corrosion performance of epoxy coatings on Al 5000. Prog. Org. Coat. 2009, 66, 321–327. [Google Scholar] [CrossRef]
- Rezaul Karim, M.; Hyun Yeum, J. In situ intercalative polymerization of conducting polypyrrole/montmorillonite nanocomposites. J. Polym. Sci. Part B 2008, 46, 2279–2285. [Google Scholar] [CrossRef]
- Pinnavaia, T.J. Intercalated Clay Catalysts. Science 1983, 220, 365–371. [Google Scholar] [CrossRef] [PubMed]
- Triantafillidis, C.S.; LeBaron, P.C.; Pinnavaia, T.J. Thermoset Epoxy—Clay Nanocomposites: The Dual Role of α, ω-Diamines as Clay Surface Modifiers and Polymer Curing Agents. J. Solid State Chem. 2002, 167, 354–362. [Google Scholar] [CrossRef]
- Triantafillidis, C.S.; LeBaron, P.C.; Pinnavaia, T.J. Homostructured mixed inorganic-organic ion clays: A new approach to epoxy polymer-exfoliated clay nanocomposites with a reduced organic modifier content. Chem. Mater. 2002, 14, 4088–4095. [Google Scholar] [CrossRef]
- Kouloumbi, N.; Moundoulas, P. Anticorrosive performance of organic coatings on steel surfaces exposed to deionized water. Pigment Resin Technol. 2002, 4, 206–215. [Google Scholar] [CrossRef]
- Yeh, J.-M.; Hsieh, C.-F.; Jaw, J.-H.; Kuo, T.-H.; Huang, H.-Y.; Lin, C.-L.; Hsu, M.-Y. Organo-Soluble Polyimde (ODA-BSAA)/Montmorillonite Nanocomposite Materials Prepared by Solution Dispersion Technique. J. Appl. Polym. Sci. 2005, 95, 1082–1090. [Google Scholar] [CrossRef]
- Sung, J.H.; Choi, H.J. Effect of pH on physical characteristics of conducting poly (O-ethoxyaniline) nanocomposites. J. Macromol. Sci. Part B 2005, 44, 365–375. [Google Scholar] [CrossRef]
- Xidas, P.I.; Triantafyllidis, K.S. Effect of the type of alkylammonium ion clay modifier on the structure and thermal/mechanical properties of glassy and rubbery epoxy-clay nanocomposites. Eur. Polym. J. 2010, 46, 404–417. [Google Scholar] [CrossRef]
- Triantafyllidis, K.S.; Xidas, P.I.; Pinnavaia, T.J. Alternative Synthetic Routes to Epoxy Polymer—Clay Nanocomposites using Organic or Mixed-Ion Clays Modified by Protonated Di/Triamines (Jeffamines). Macromol. Symp. 2008, 267, 41–46. [Google Scholar] [CrossRef]
- ASTM A366/A366M-97e1 Standard Specification for Commercial Steel (CS) Sheet, Carbon (0.15 Maximum Percent) Cold-Rolled (Withdrawn 2000); ASTM International: West Conshohocken, PA, USA, 1998.
- ASTM D638-14 Standard Test Method for Tensile Properties of Plastics; ASTM International: West Conshohocken, PA, USA, 2014.
- ASTM D3985-05(2010)e1 Standard Test Method for Oxygen Gas Transmission Rate Through Plastic Film and Sheeting Using a Coulometric Sensor; ASTM International: West Conshohocken, PA, USA, 2010.
- ASTM B117 Standard Practice for Operating Salt Spray (Fog) Apparatus; ASTM International: West Conshohocken, PA, USA, 2003.
- Baboian, R. Corrosion Tests and Standards: Application and Interpretation, 2nd ed.; ASTM International: West Conshohocken, PA, USA, 2005. [Google Scholar]
- ASTM G106 Standard Practice for Verification of Algorithm and Equipment for Electrochemical Impedance Measurements; ASTM International: West Conshohocken, PA, USA, 2004.
- ASTM B457 Standard Test Method for Measurement of Impedance of Anodic Coatings on Aluminum; ASTM International: West Conshohocken, PA, USA, 2003.
- Becker, O.; Simon, G.P.; Dusek, K. Inorganic Polymeric Nanocomposites and Membranes; Springer: Berlin, Germany, 2005. [Google Scholar]
- Ho, M.-W.; Lam, C.-K.; Lau, K.-T.; Ng, D.H.L.; Hui, D. Mechanical properties of epoxy-based composites using nanoclays. Compos. Struct. 2006, 75, 415–421. [Google Scholar] [CrossRef]
- Bard, A.J.; Faulkner, L.R. Electrochemical Methods: Fundamentals and Applications, 2nd ed.; John Wiley & Sons: Oxford, UK, 2001. [Google Scholar]
- Orazem, M.; Tribollet, B. Electrochemical Impedance Spectroscopy; the Electrochemical Society Series; John Wiley & Sons: Oxford, UK, 2008. [Google Scholar]
- Perez, N. Electrochemistry and Corrosion Science; Kluwer Academic Publishers: New York, NY, USA, 2004. [Google Scholar]
- Brett, C.M.A.; Brett, A.M.O. Electrochemistry Principles, Methods, and Applications; Oxford University Press: Oxford, UK, 1994. [Google Scholar]
Figure 1.
Molecular structure of (A) diglycidyl ether of bisphenol-A (DGEBA) and (B) of aliphatic polyoxypropylene diamine (Jeffamine®).
Figure 1.
Molecular structure of (A) diglycidyl ether of bisphenol-A (DGEBA) and (B) of aliphatic polyoxypropylene diamine (Jeffamine®).
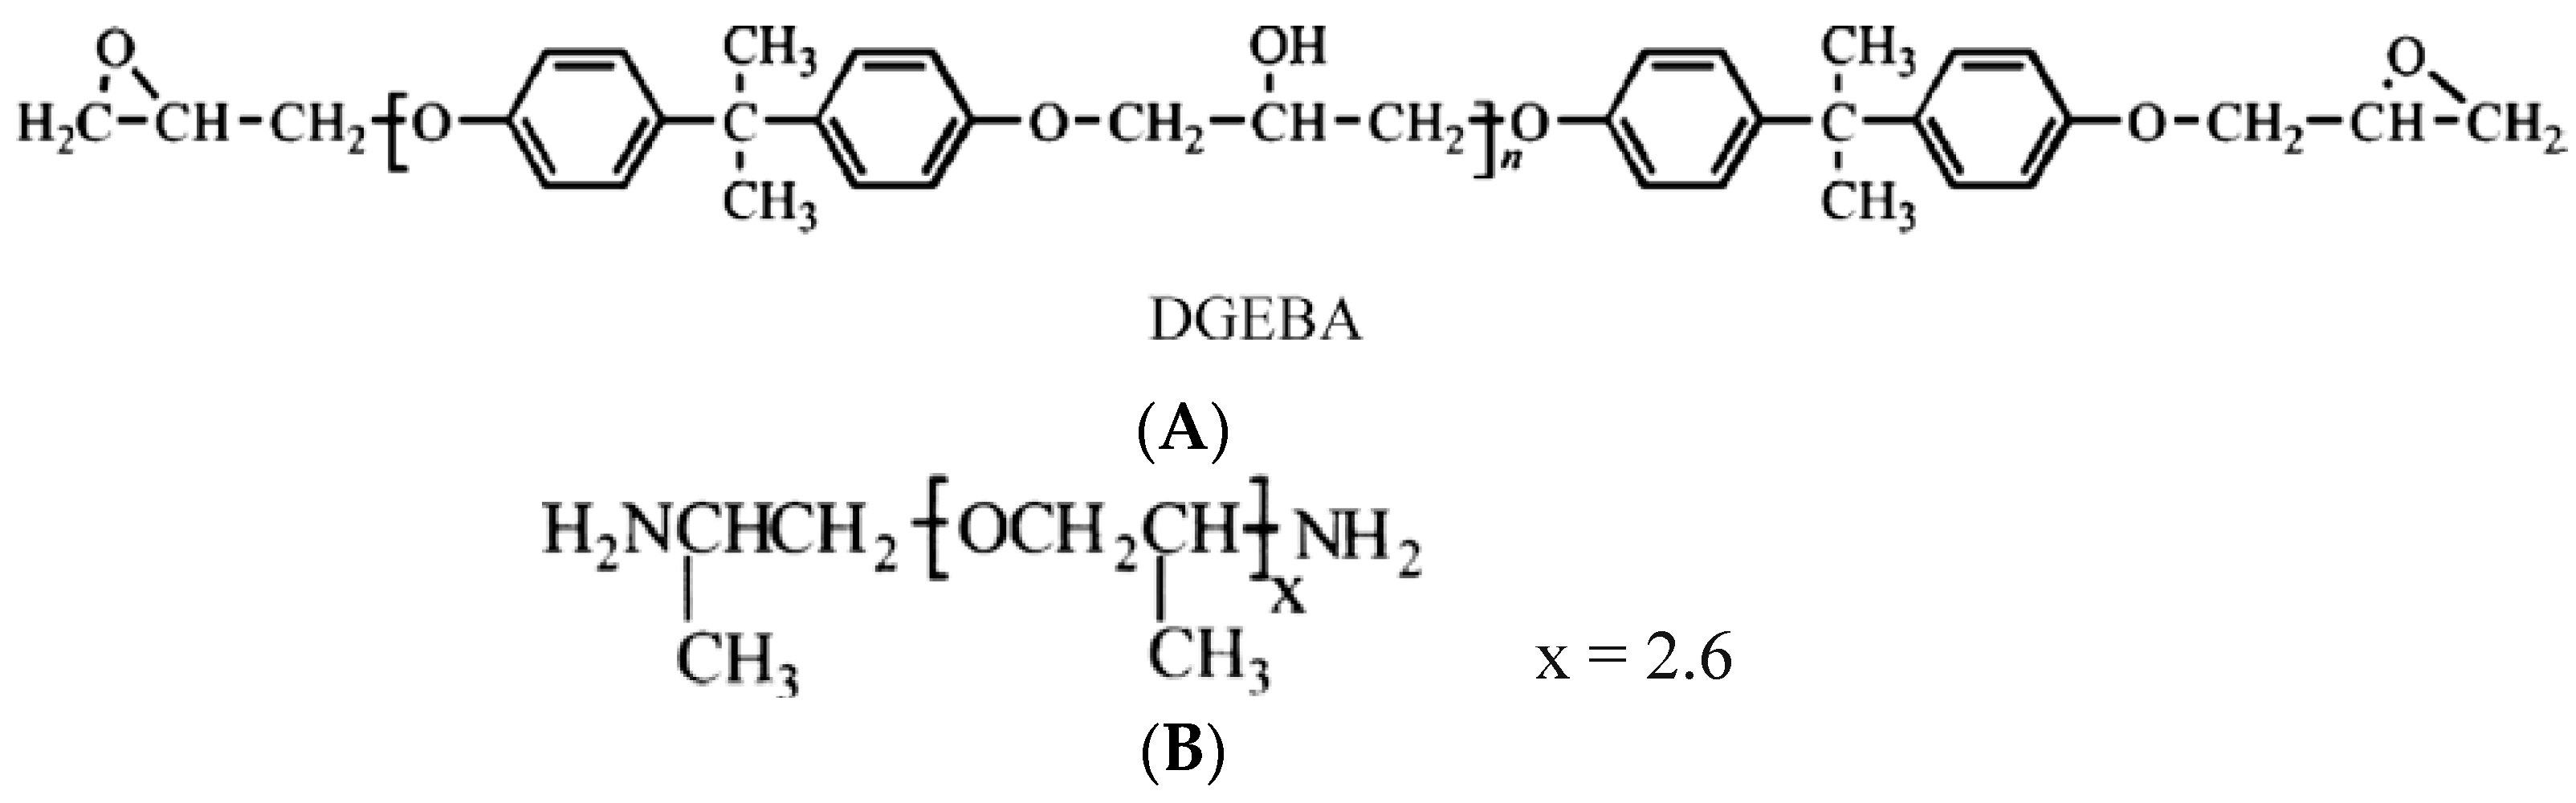
Figure 2.
X-ray diffraction (XRD) patterns of the inorganic Na+-montmorillonite (Na+-PGW) clay and the organo-montmorillonites Nanomer I.30E and Nanomer I.28E modified by primary and quaternary octadecylammonium ions, respectively.
Figure 2.
X-ray diffraction (XRD) patterns of the inorganic Na+-montmorillonite (Na+-PGW) clay and the organo-montmorillonites Nanomer I.30E and Nanomer I.28E modified by primary and quaternary octadecylammonium ions, respectively.
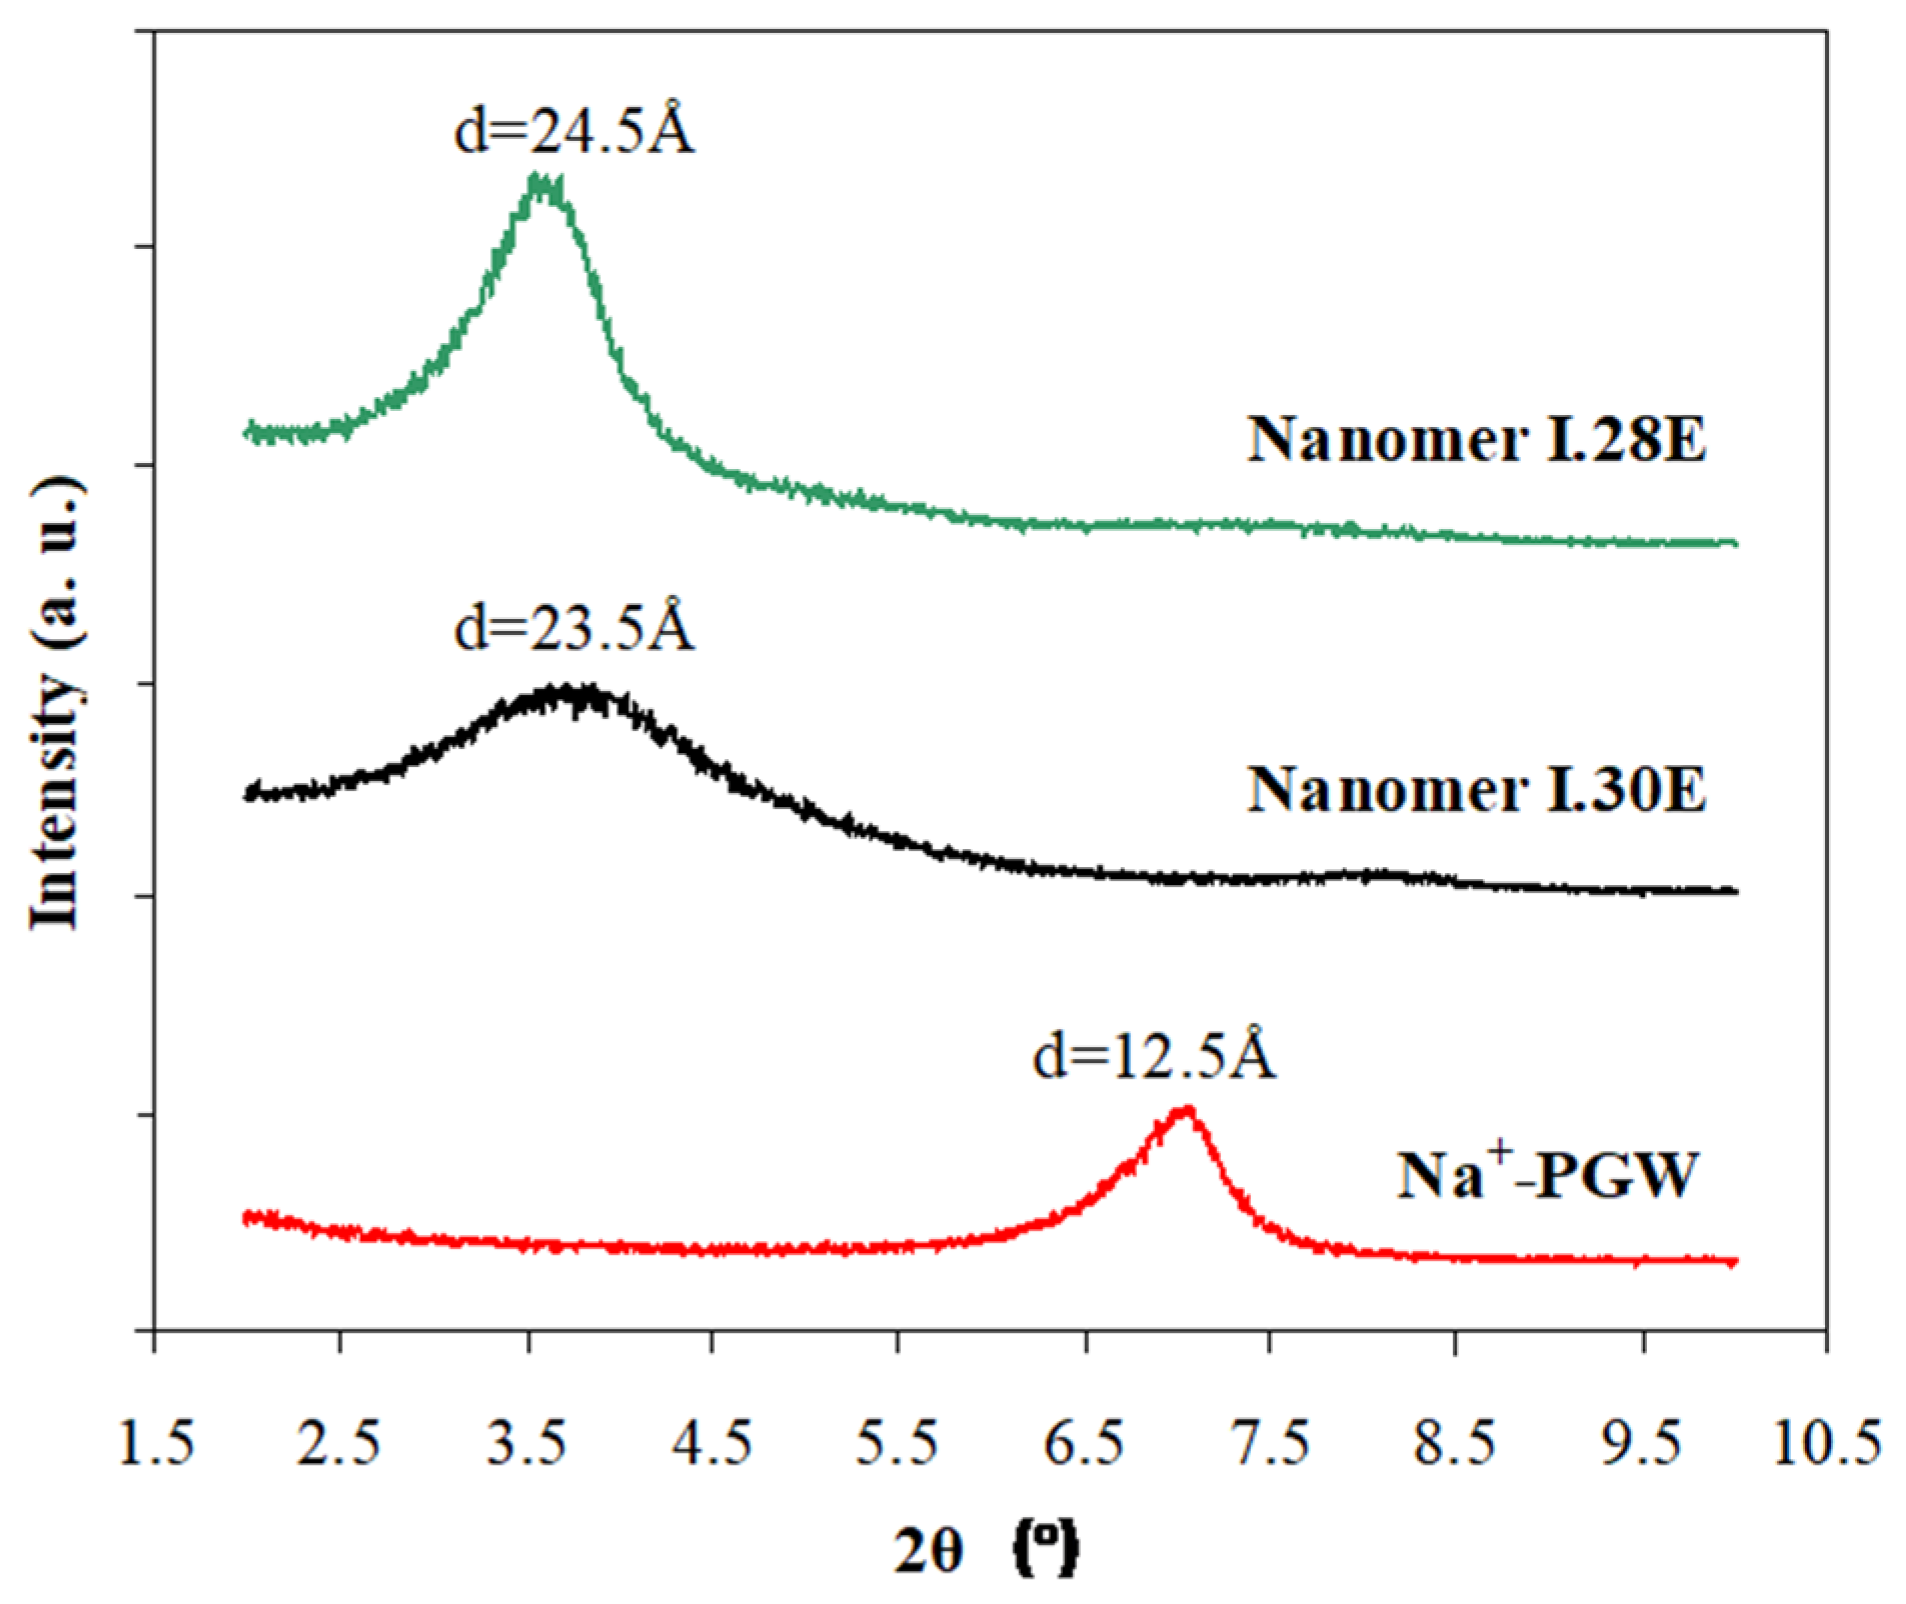
Figure 3.
XRD patterns of glassy (EPON 828RS + D-230 Jeffamine) epoxy—clay nanocomposites with inorganic clay Na+-PGW and the two organoclays I.28E and I.30E; the weight percent of organoclay addition has been estimated on a silicate basis and was 3 and 6 wt %.
Figure 3.
XRD patterns of glassy (EPON 828RS + D-230 Jeffamine) epoxy—clay nanocomposites with inorganic clay Na+-PGW and the two organoclays I.28E and I.30E; the weight percent of organoclay addition has been estimated on a silicate basis and was 3 and 6 wt %.

Figure 4.
Representative TEM images of partially exfoliated glassy epoxy—clay nanocomposites prepared by 6 wt % I.30E (A,B) and of intercalated epoxy—clay nanocomposite prepared by 6 wt % I.28E (C). Scale bar = 20 nm.
Figure 4.
Representative TEM images of partially exfoliated glassy epoxy—clay nanocomposites prepared by 6 wt % I.30E (A,B) and of intercalated epoxy—clay nanocomposite prepared by 6 wt % I.28E (C). Scale bar = 20 nm.

Figure 5.
Thermogravimetric analysis (TGA) curves of (A) glassy epoxy (EPON 828RS + D-230 Jeffamine) and epoxy—clay nanocomposites with (B) Na+-PGW, (C) I.30E, (D) I.28E (3 wt %, silicate basis), and (E) I.30E (6 wt %, silicate basis).
Figure 5.
Thermogravimetric analysis (TGA) curves of (A) glassy epoxy (EPON 828RS + D-230 Jeffamine) and epoxy—clay nanocomposites with (B) Na+-PGW, (C) I.30E, (D) I.28E (3 wt %, silicate basis), and (E) I.30E (6 wt %, silicate basis).
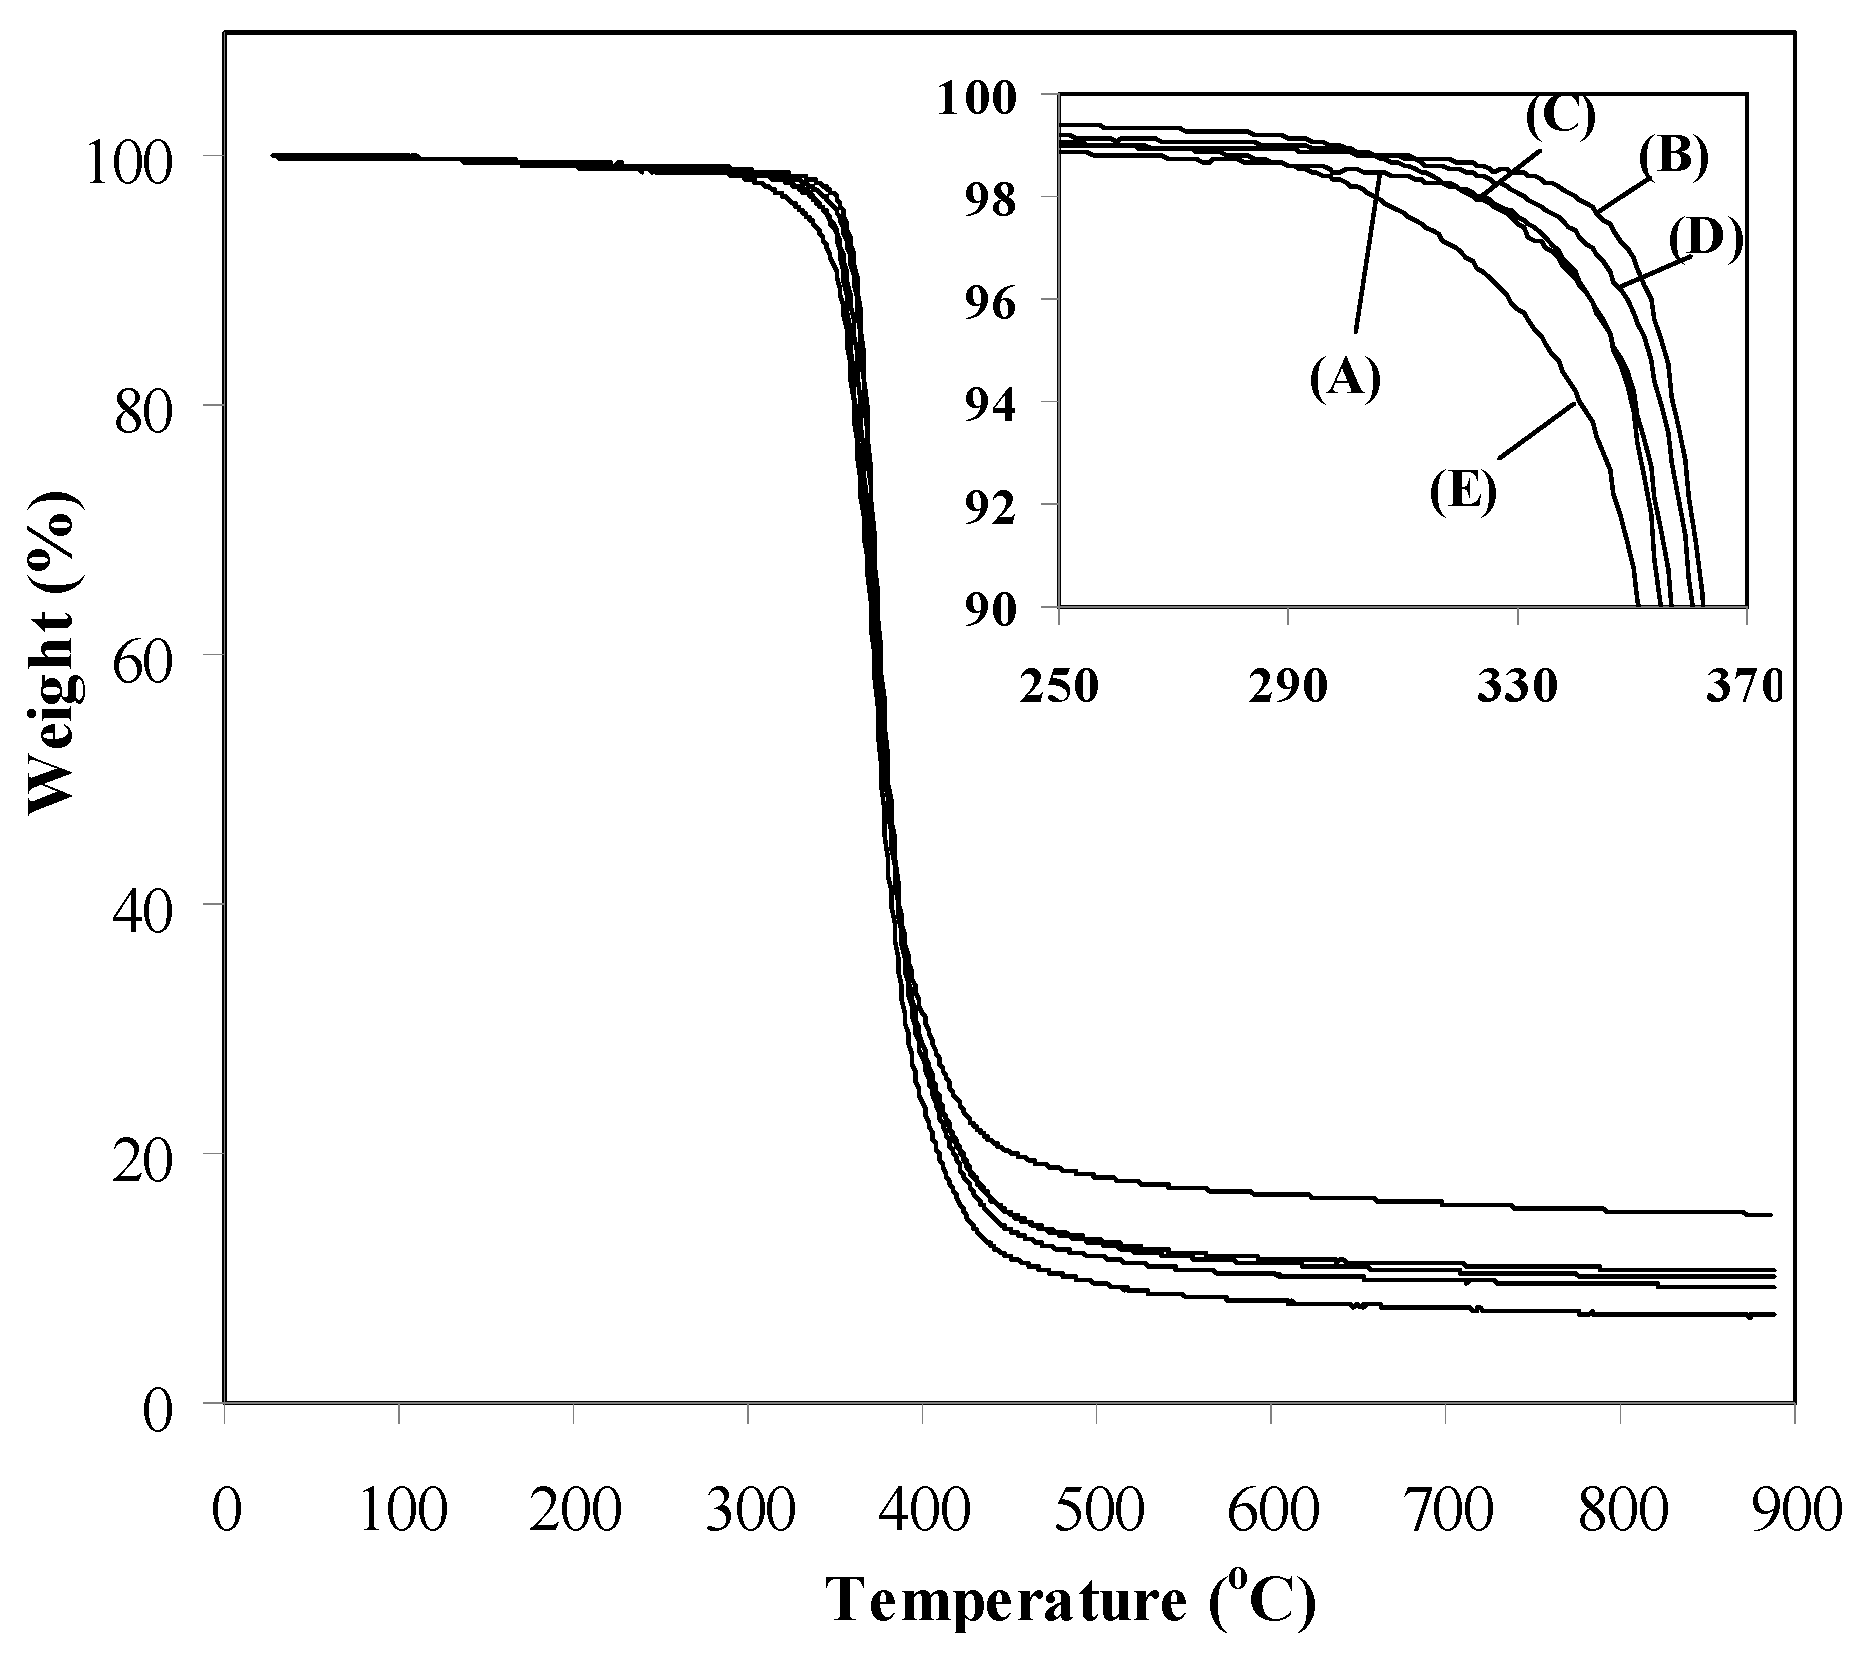
Figure 6.
Weight loss results from salt spray experiments for bare steel and steel coated with pristine epoxy resin, and nanocomposites with I.28 and I.30 organo-clays, after 1 day (a) and 4 days (b) of exposure in a corrosive environment of 100% saturated moisture + 5 wt % NaCl solution.
Figure 6.
Weight loss results from salt spray experiments for bare steel and steel coated with pristine epoxy resin, and nanocomposites with I.28 and I.30 organo-clays, after 1 day (a) and 4 days (b) of exposure in a corrosive environment of 100% saturated moisture + 5 wt % NaCl solution.

Figure 7.
Salt spray corrosion test samples after 1 day (A) and 4 days (B) of exposure in a corrosive environment of 100% saturated moisture + 5 wt % NaCl solution: (a) bare steel; (b) coated with pristine resin; (c) coated with I.28E nanocomposite; (d) coated with I.30E nanocomposite.
Figure 7.
Salt spray corrosion test samples after 1 day (A) and 4 days (B) of exposure in a corrosive environment of 100% saturated moisture + 5 wt % NaCl solution: (a) bare steel; (b) coated with pristine resin; (c) coated with I.28E nanocomposite; (d) coated with I.30E nanocomposite.

Figure 8.
Scanning electron micrographs of initial (no exposure) (A), cross section of steel coated with I.30E (B), and salt spray tested specimens after 1 day (C) and 4 days (D) of exposure in a corrosive environment of 100% saturated moisture + 5 wt % NaCl solution: (a) bare steel; (b) coated with pristine resin; (c) coated with I.28E nanocomposite; (d) coated with I.30E nanocomposite.
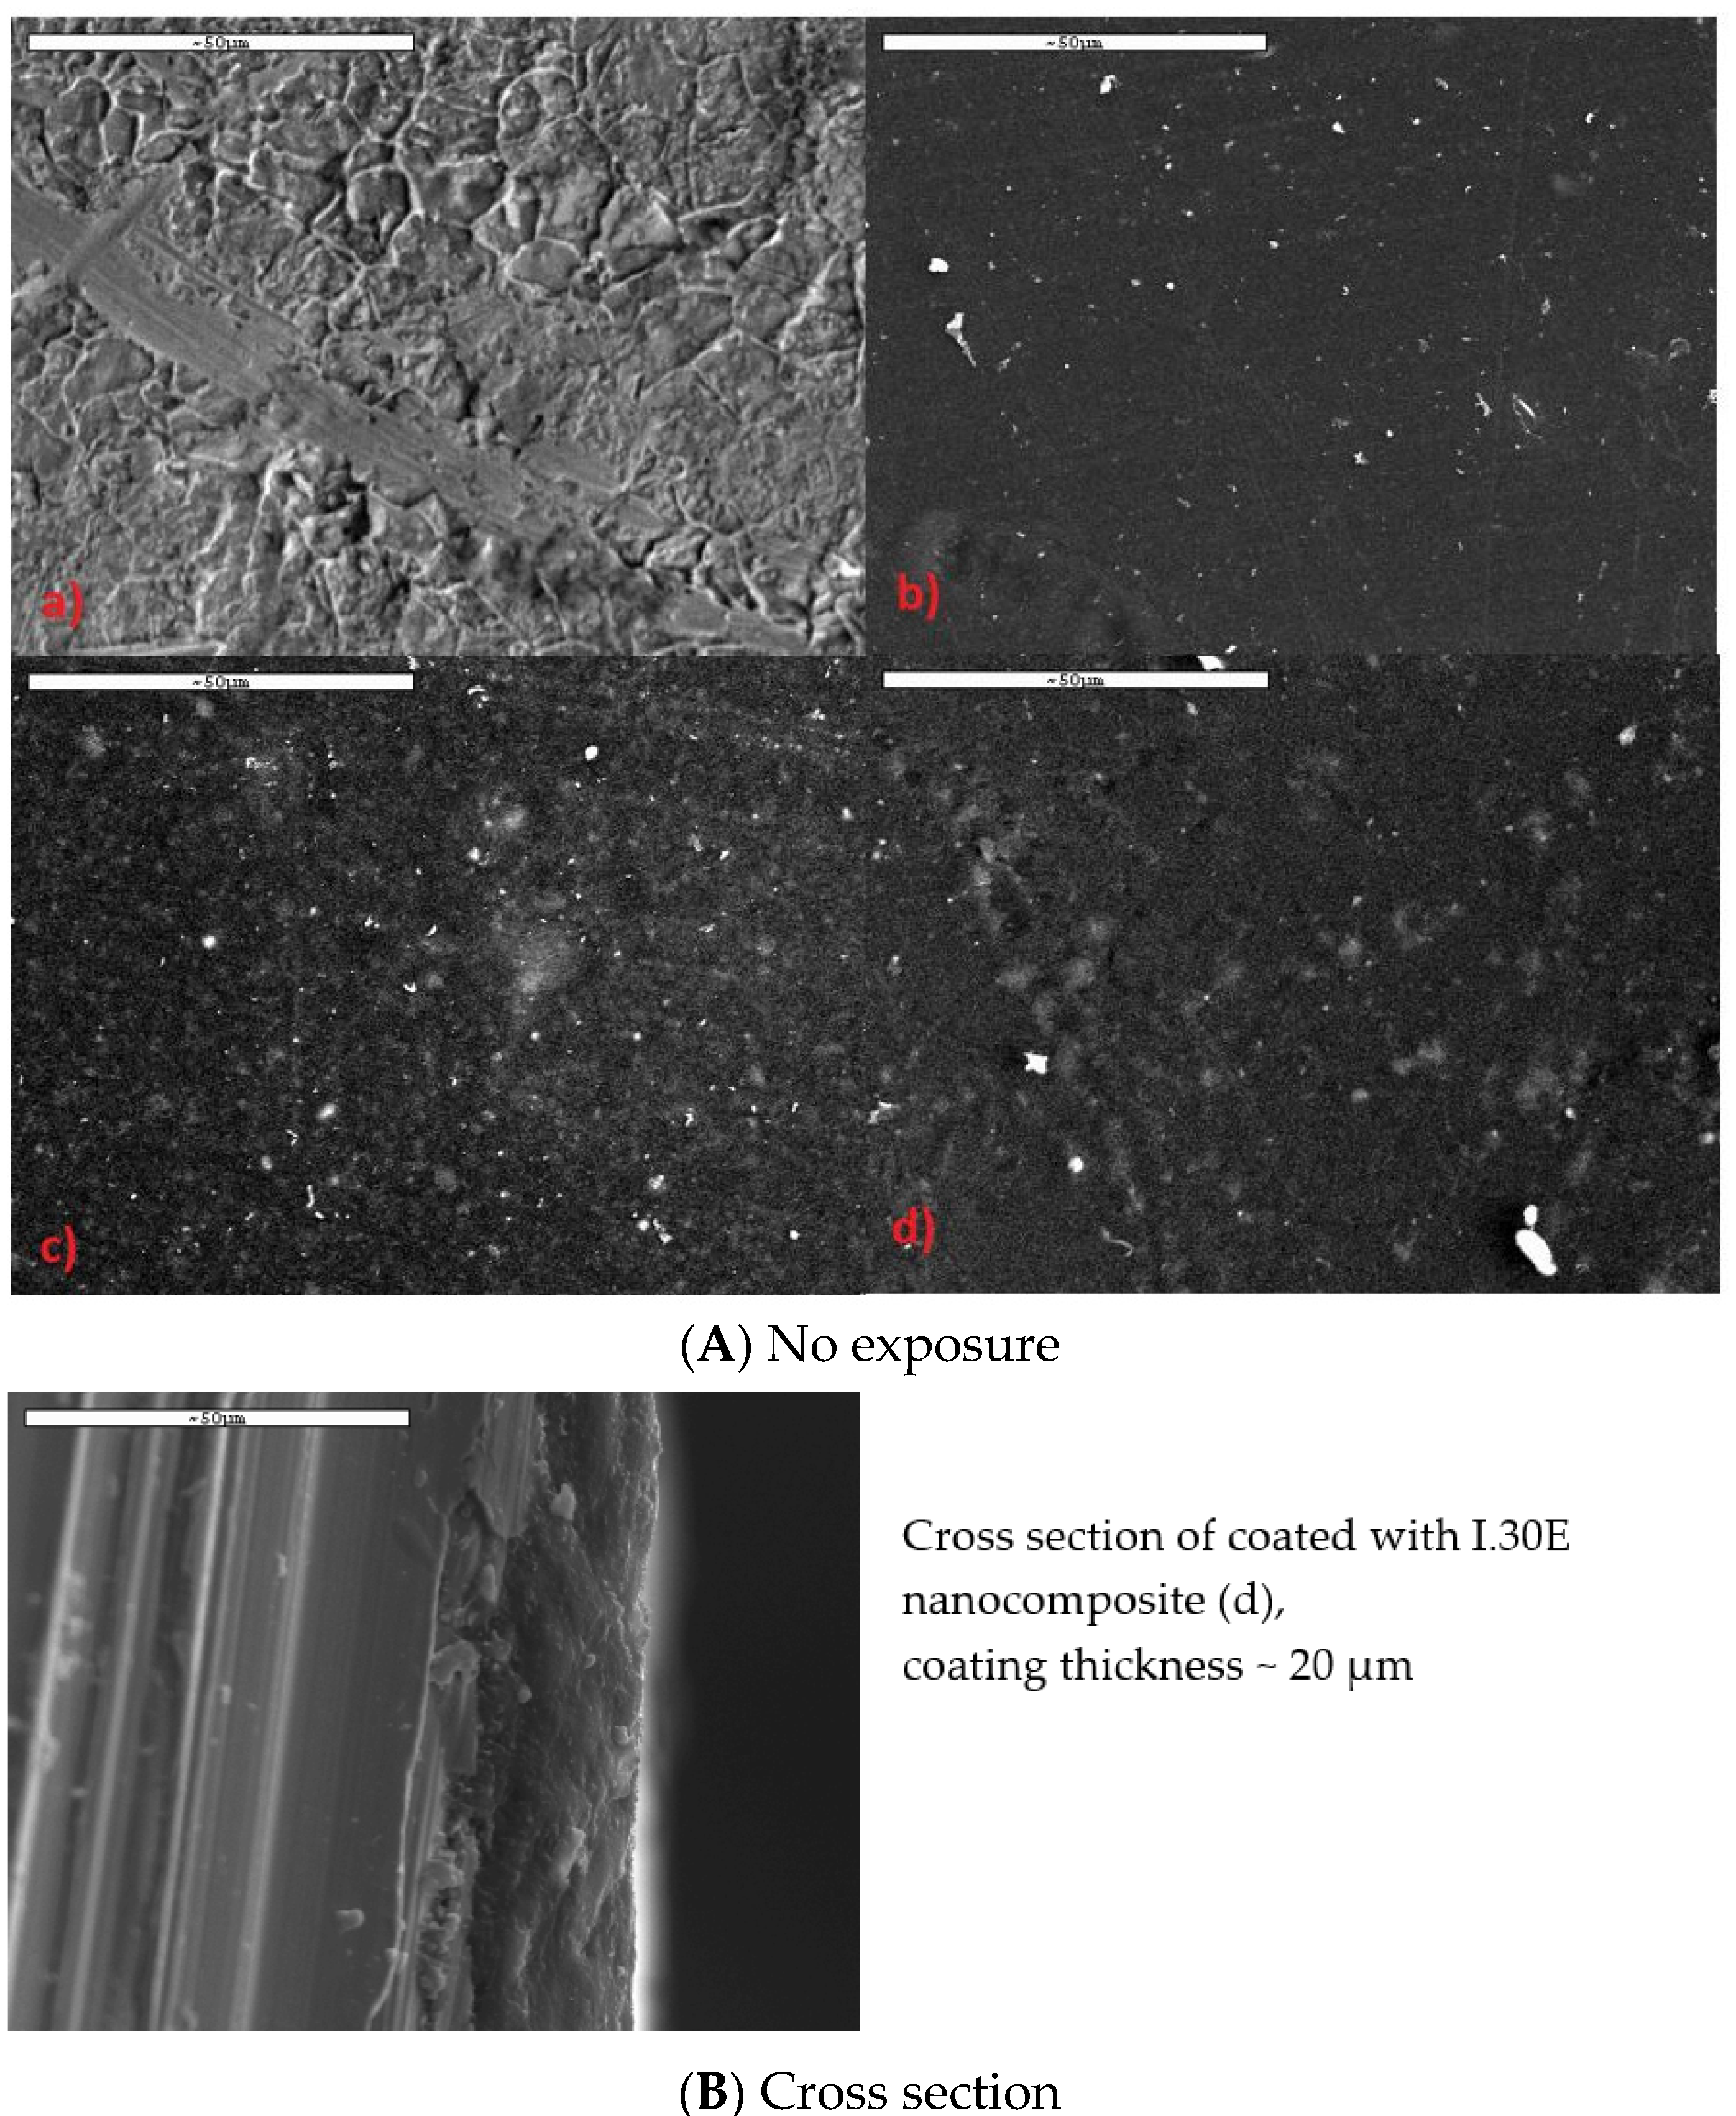
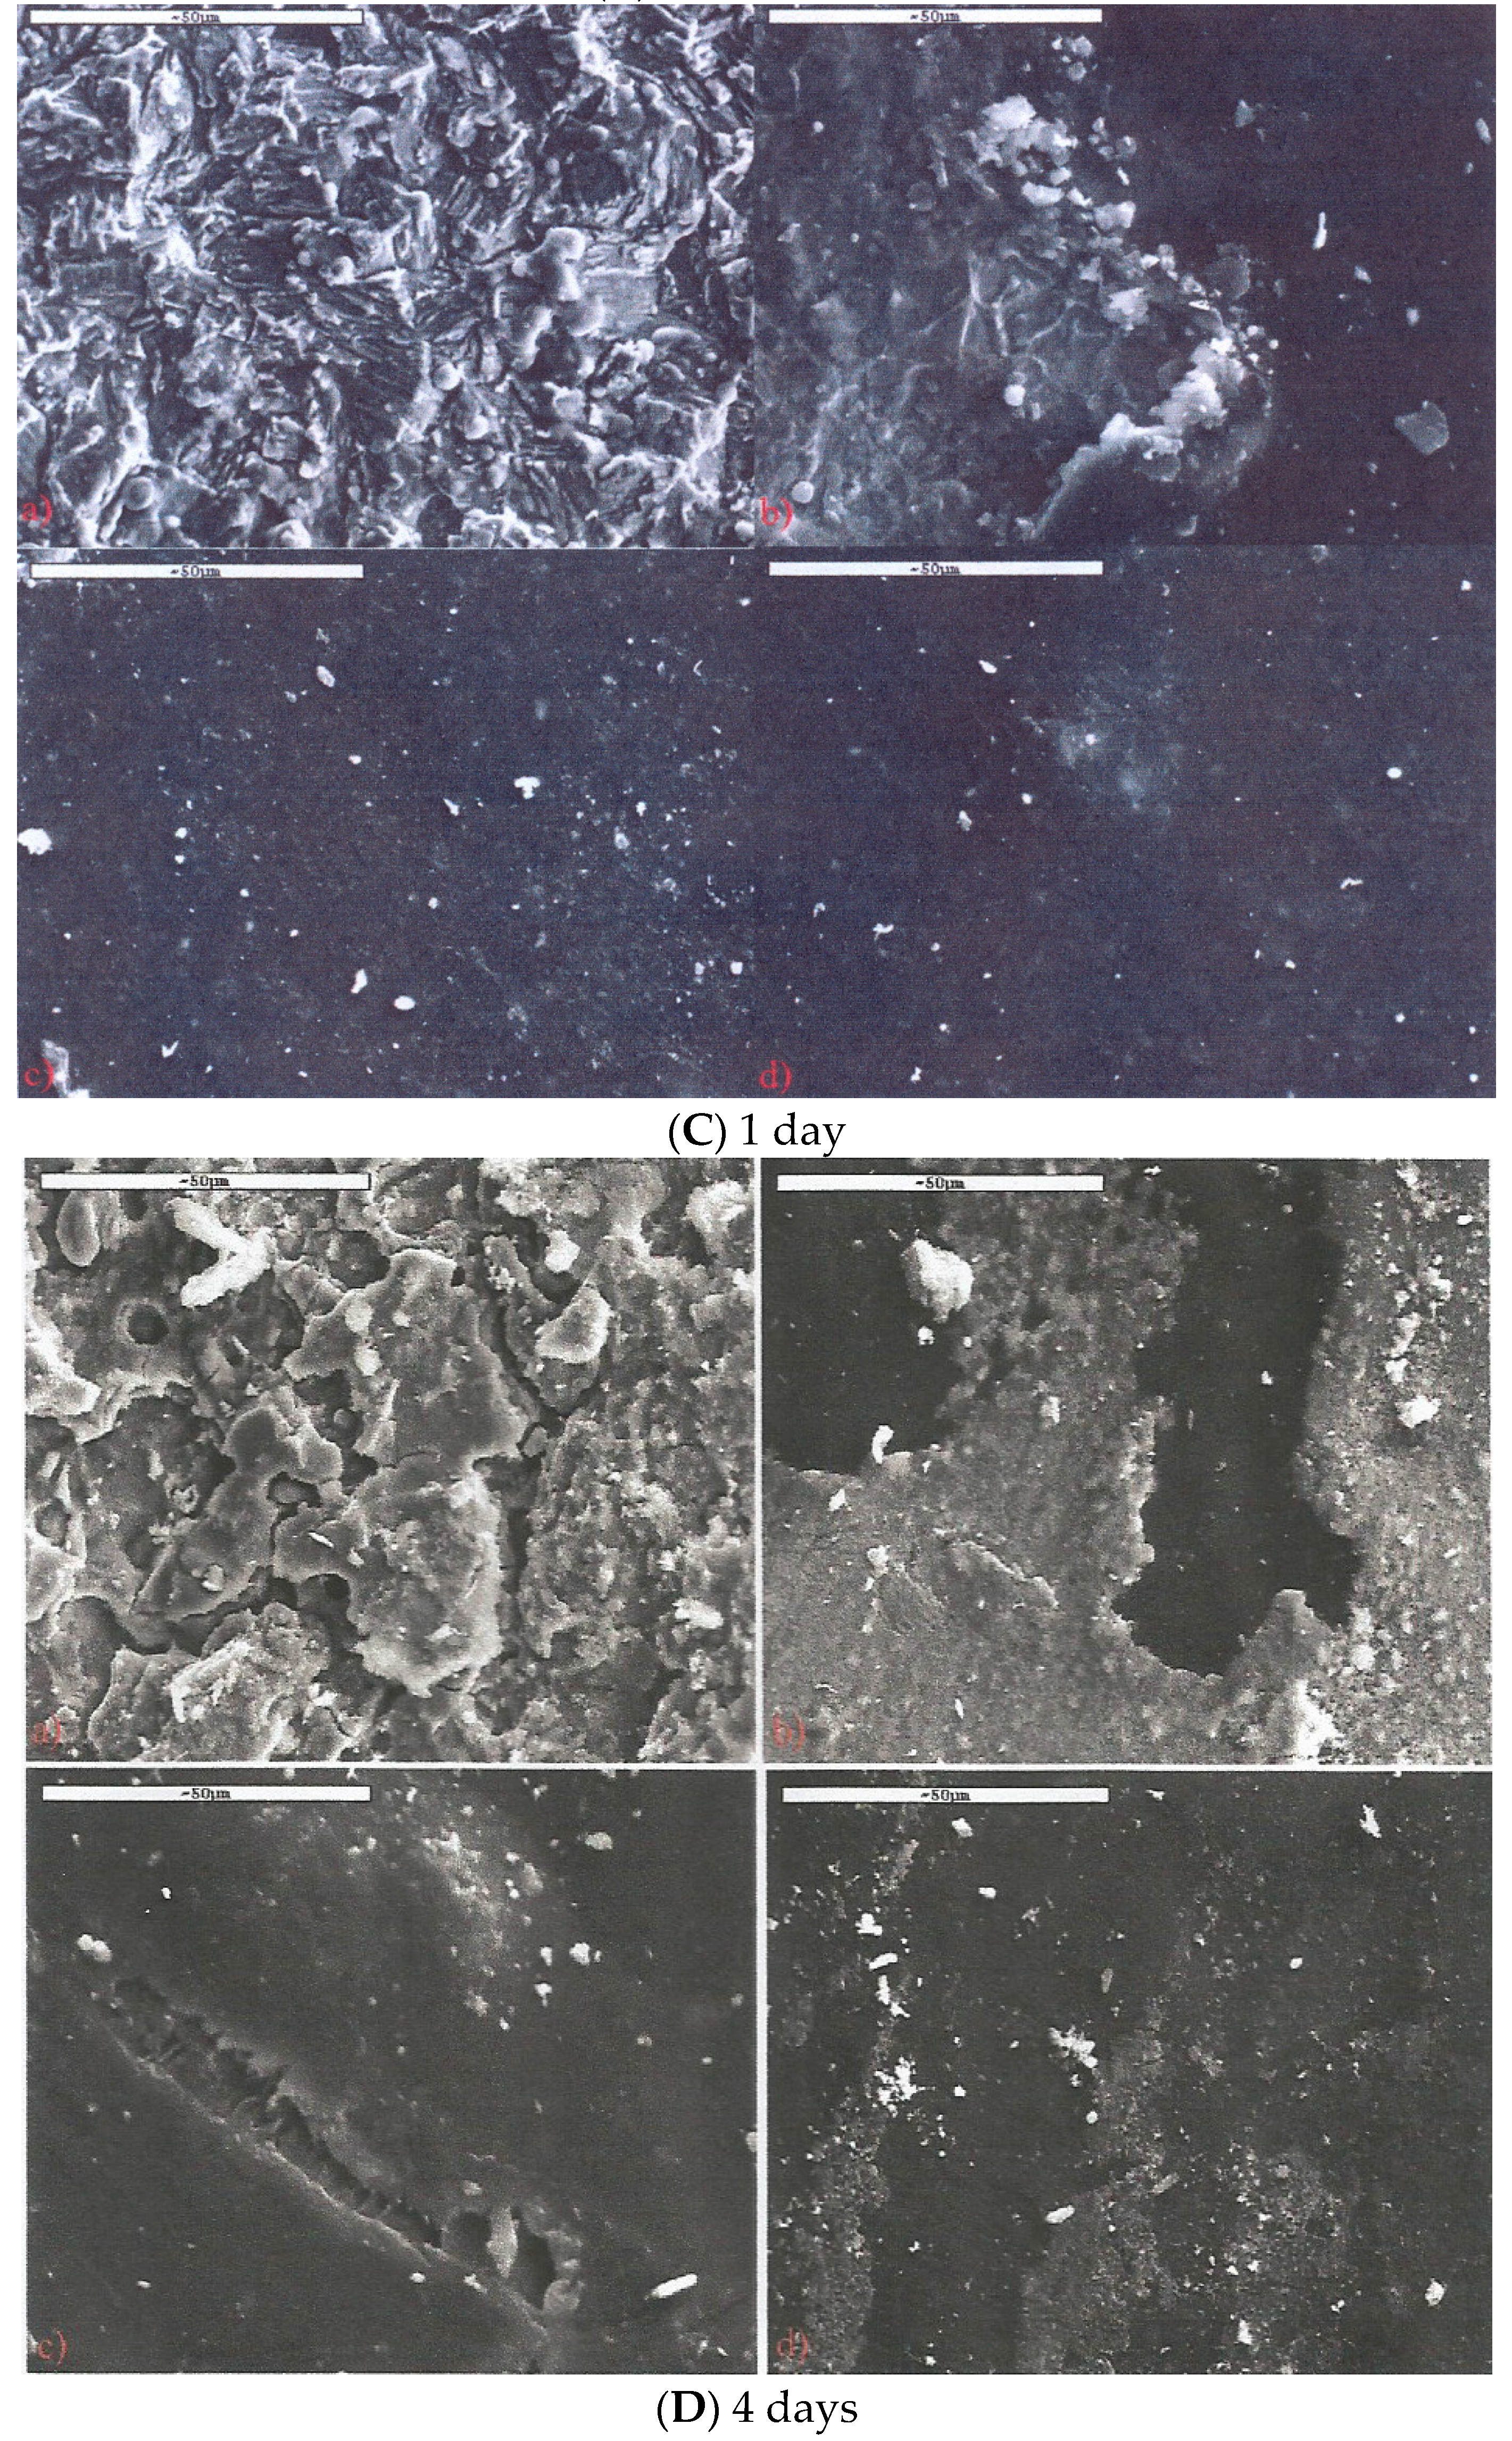
Figure 9.
Open circuit potential measurements of all types of bare or coated specimens after 1 day (a) and 4 days (b) of exposure in a corrosive environment of 3.5 wt % NaCl solution.
Figure 9.
Open circuit potential measurements of all types of bare or coated specimens after 1 day (a) and 4 days (b) of exposure in a corrosive environment of 3.5 wt % NaCl solution.

Figure 10.
Electrical equivalent circuit model simulating a corroding system metal/coating/electrolyte, Rs = solution resistance, R1, R2 = ohmic resistances, CPE1, CPE2 = constant phase elements with admittance Y0(jω)n.
Figure 10.
Electrical equivalent circuit model simulating a corroding system metal/coating/electrolyte, Rs = solution resistance, R1, R2 = ohmic resistances, CPE1, CPE2 = constant phase elements with admittance Y0(jω)n.

Figure 11.
Nyquist plots of impedance spectra, Re (Z), real part of impedance, and Im (Z), imaginary part of impedance, for bare specimens after 0, 1, 2, or 4 days of exposure in a corrosive environment of 3.5 wt % NaCl solution.
Figure 11.
Nyquist plots of impedance spectra, Re (Z), real part of impedance, and Im (Z), imaginary part of impedance, for bare specimens after 0, 1, 2, or 4 days of exposure in a corrosive environment of 3.5 wt % NaCl solution.
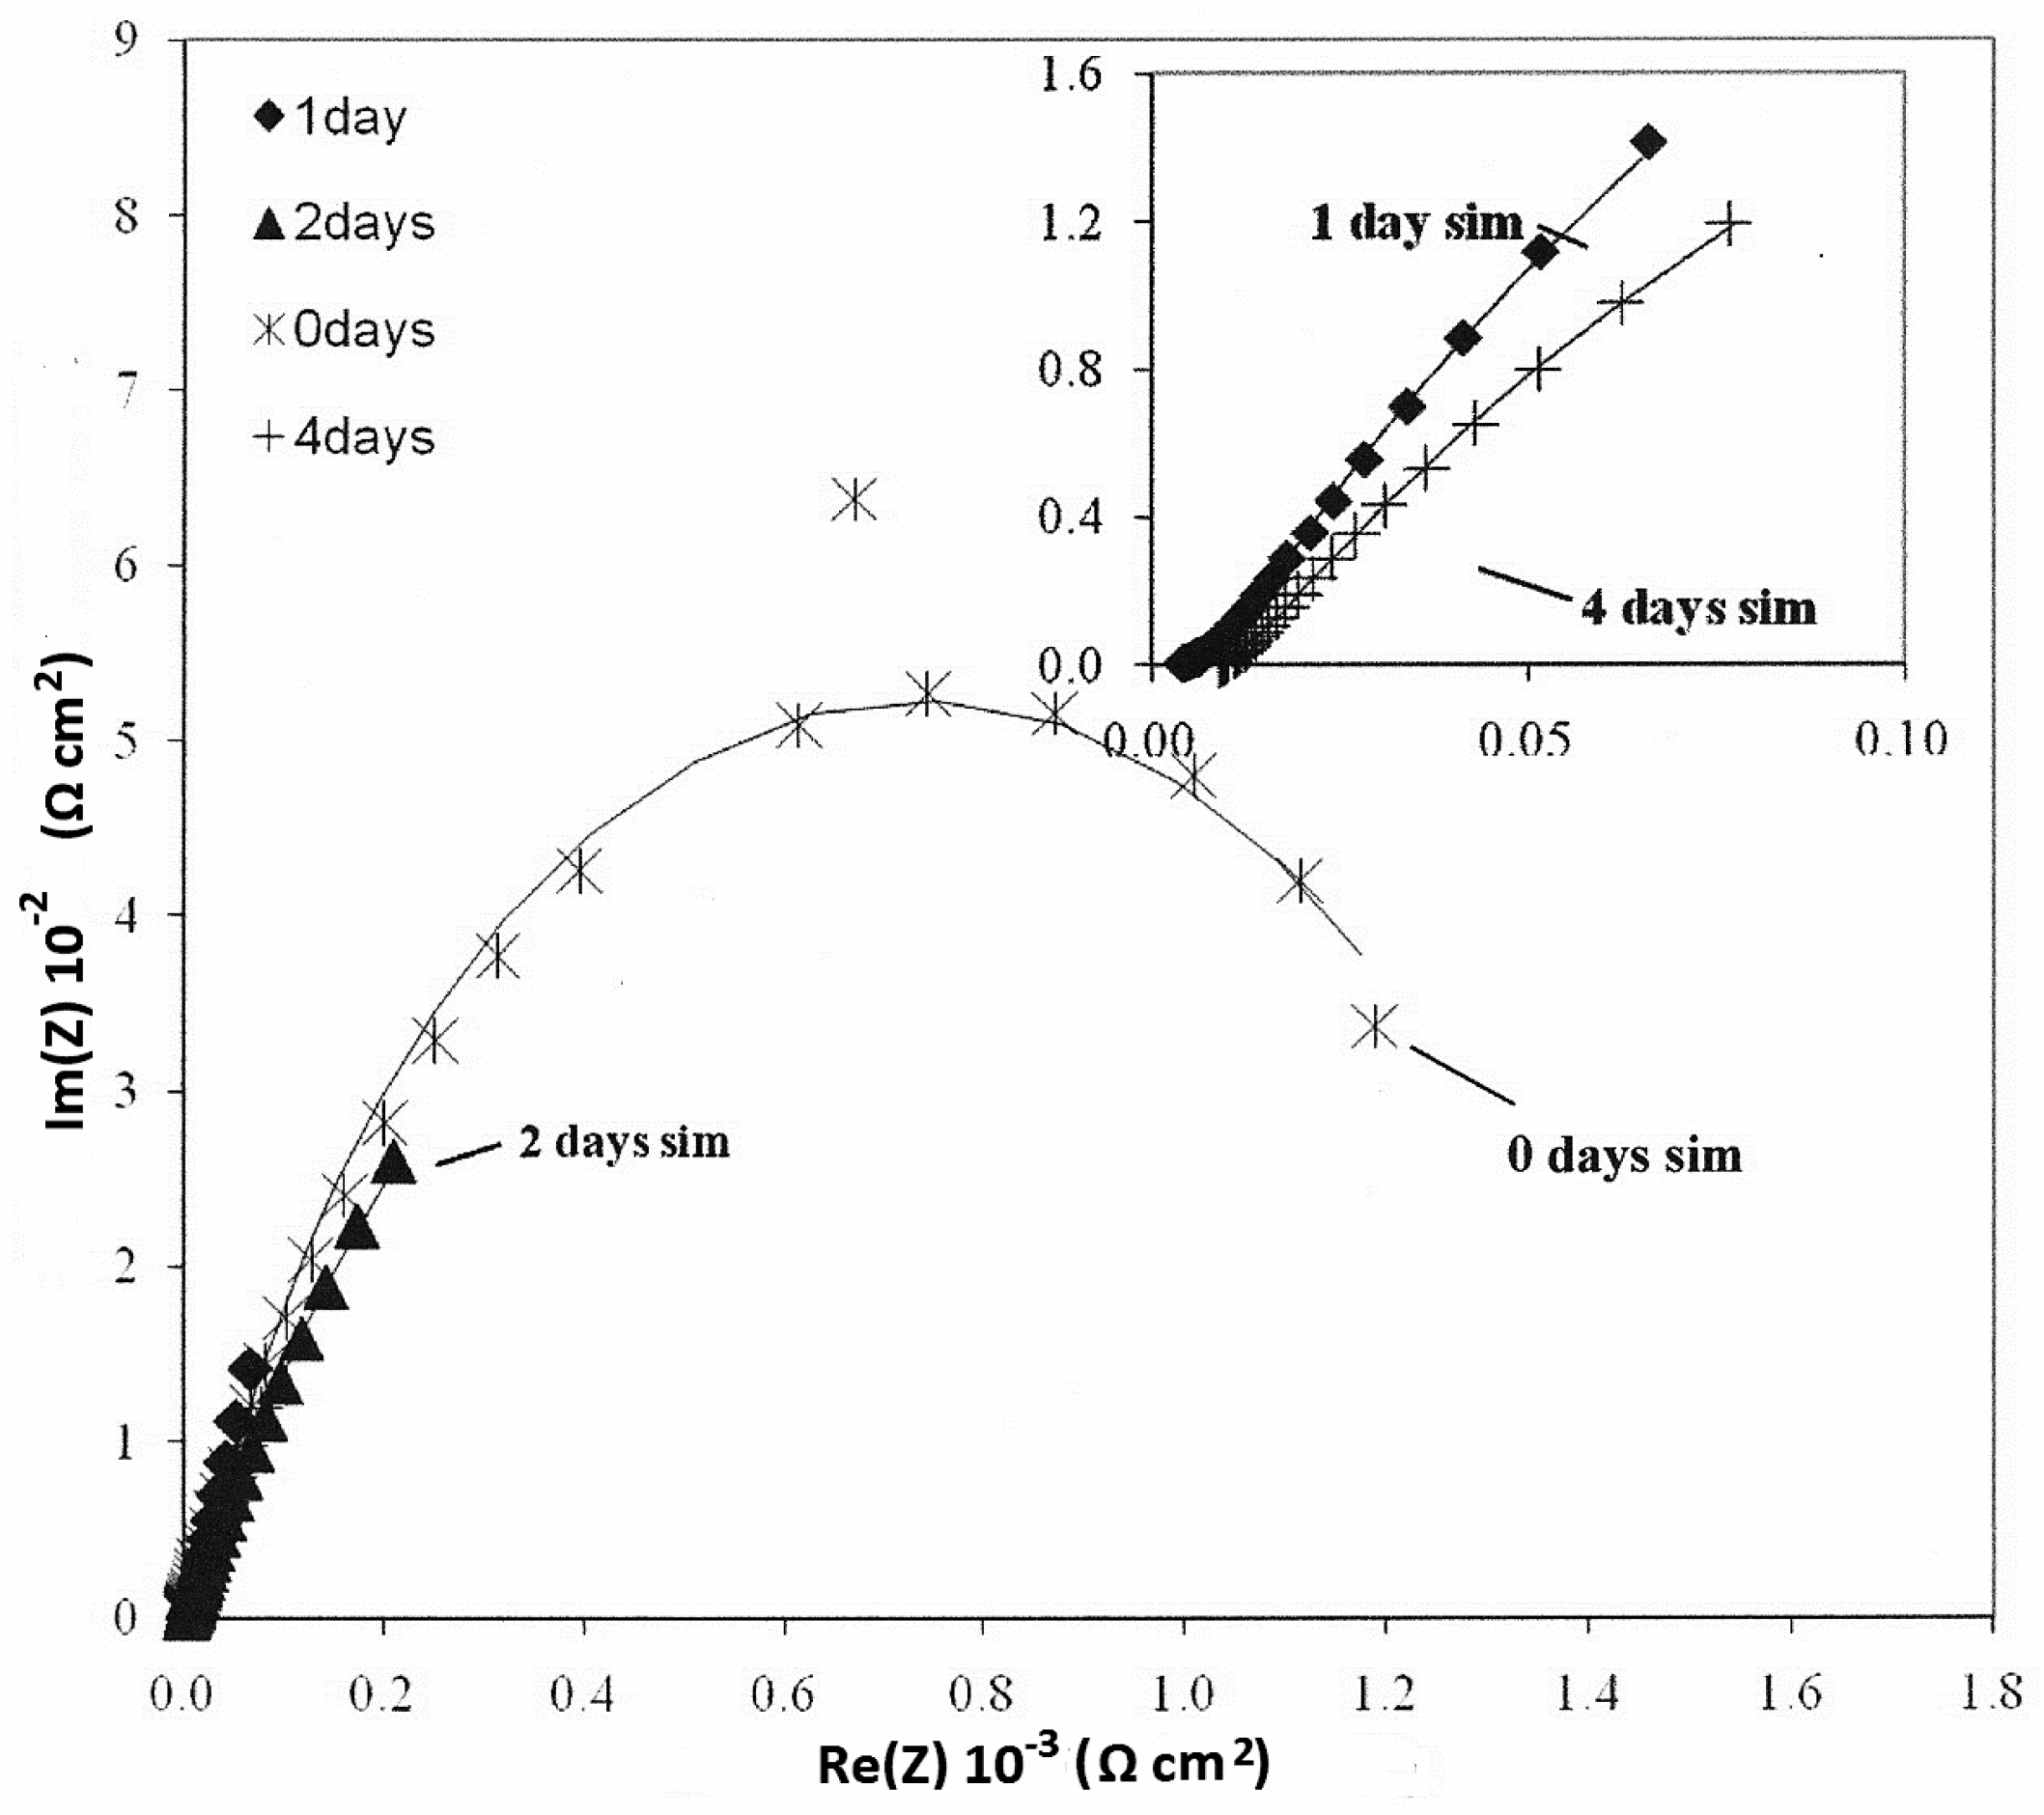
Figure 12.
Nyquist plots of impedance spectra, Re (Z), real part of impedance, and Im (Z), imaginary part of impedance, for epoxy coated specimens after 0, 1, 2, or 4 days of exposure in a corrosive environment of 3.5 wt % NaCl solution.
Figure 12.
Nyquist plots of impedance spectra, Re (Z), real part of impedance, and Im (Z), imaginary part of impedance, for epoxy coated specimens after 0, 1, 2, or 4 days of exposure in a corrosive environment of 3.5 wt % NaCl solution.

Figure 13.
Nyquist plots of impedance spectra, Re (Z), real part of impedance, and Im (Z), imaginary part of impedance, for I.28 nanocomposite coated specimens after 0, 1, 2, or 4 days of exposure in a corrosive environment of 3.5 wt % NaCl solution.
Figure 13.
Nyquist plots of impedance spectra, Re (Z), real part of impedance, and Im (Z), imaginary part of impedance, for I.28 nanocomposite coated specimens after 0, 1, 2, or 4 days of exposure in a corrosive environment of 3.5 wt % NaCl solution.
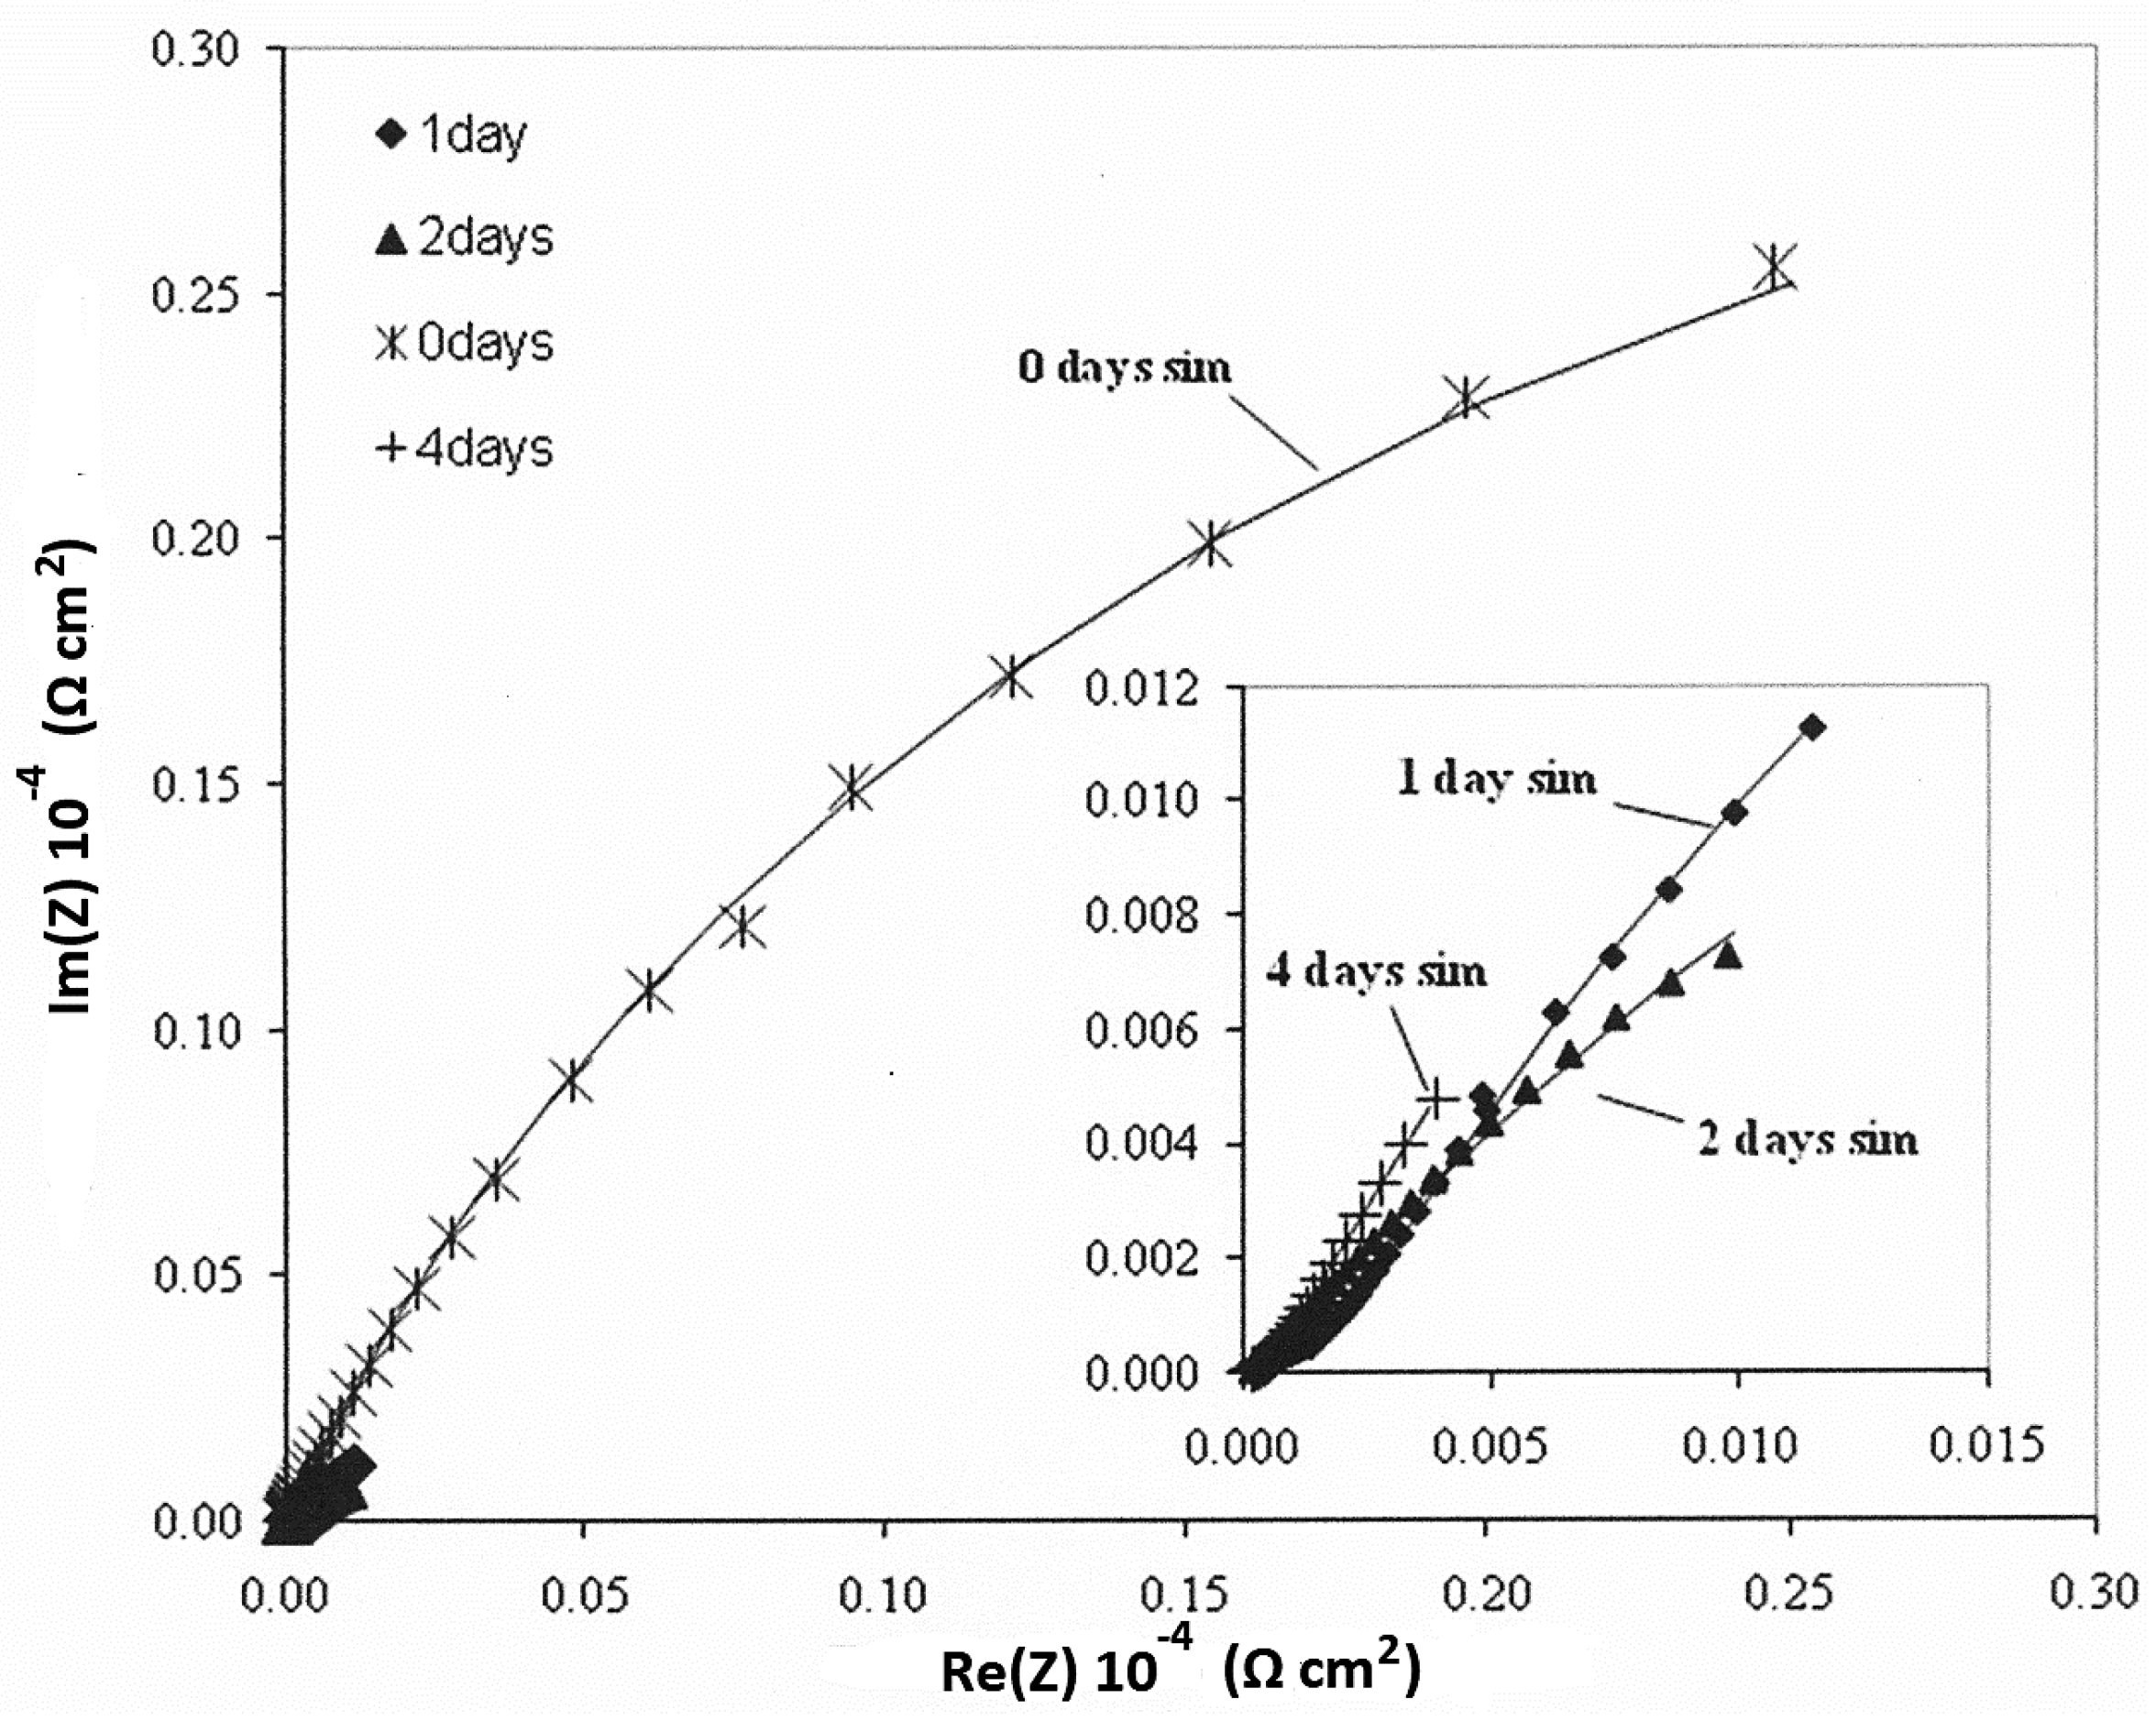
Figure 14.
Nyquist plots of impedance spectra, Re (Z), real part of impedance, and Im (Z), imaginary part of impedance, for I.30 nanocomposite coated specimens after 0, 1, 2, or 4 days of exposure in a corrosive environment of 3.5 wt % NaCl solution.
Figure 14.
Nyquist plots of impedance spectra, Re (Z), real part of impedance, and Im (Z), imaginary part of impedance, for I.30 nanocomposite coated specimens after 0, 1, 2, or 4 days of exposure in a corrosive environment of 3.5 wt % NaCl solution.
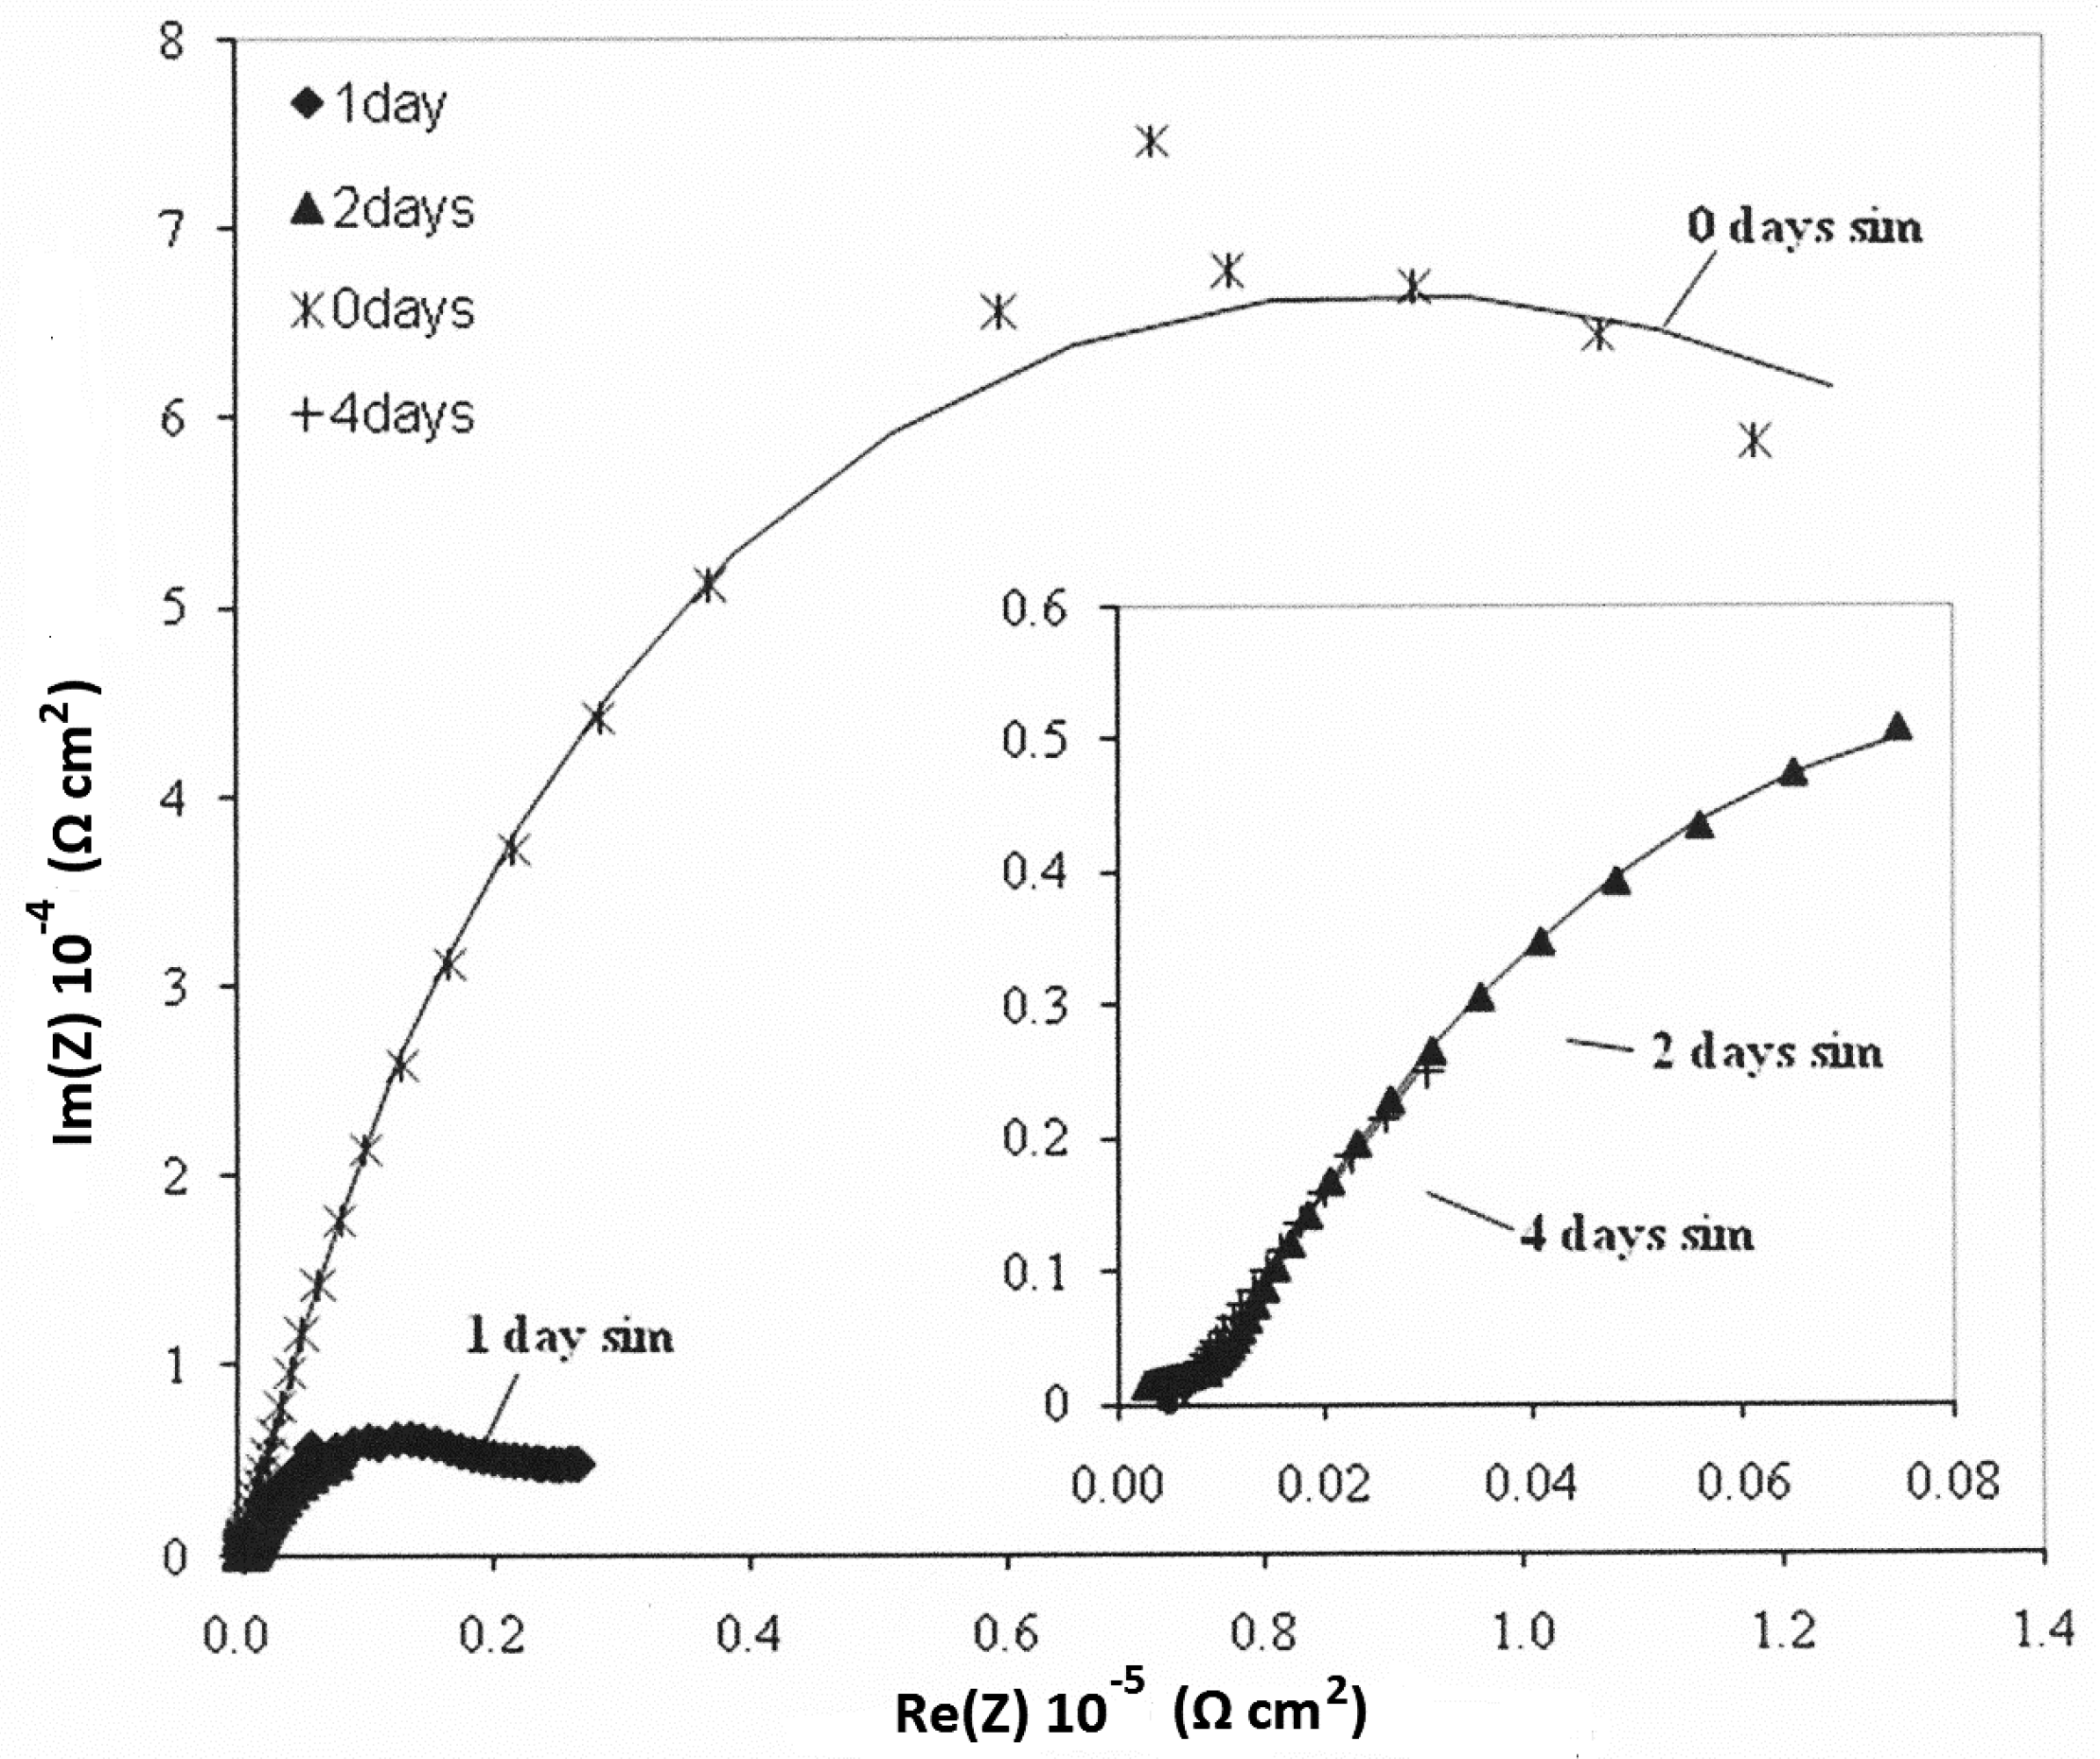
Figure 15.
Nyquist plots of impedance spectra, Re (Z), real part of impedance, and Im (Z), imaginary part of impedance, for bare and coated specimens after 1 day of exposure in a corrosive environment of 3.5 wt % NaCl solution.
Figure 15.
Nyquist plots of impedance spectra, Re (Z), real part of impedance, and Im (Z), imaginary part of impedance, for bare and coated specimens after 1 day of exposure in a corrosive environment of 3.5 wt % NaCl solution.
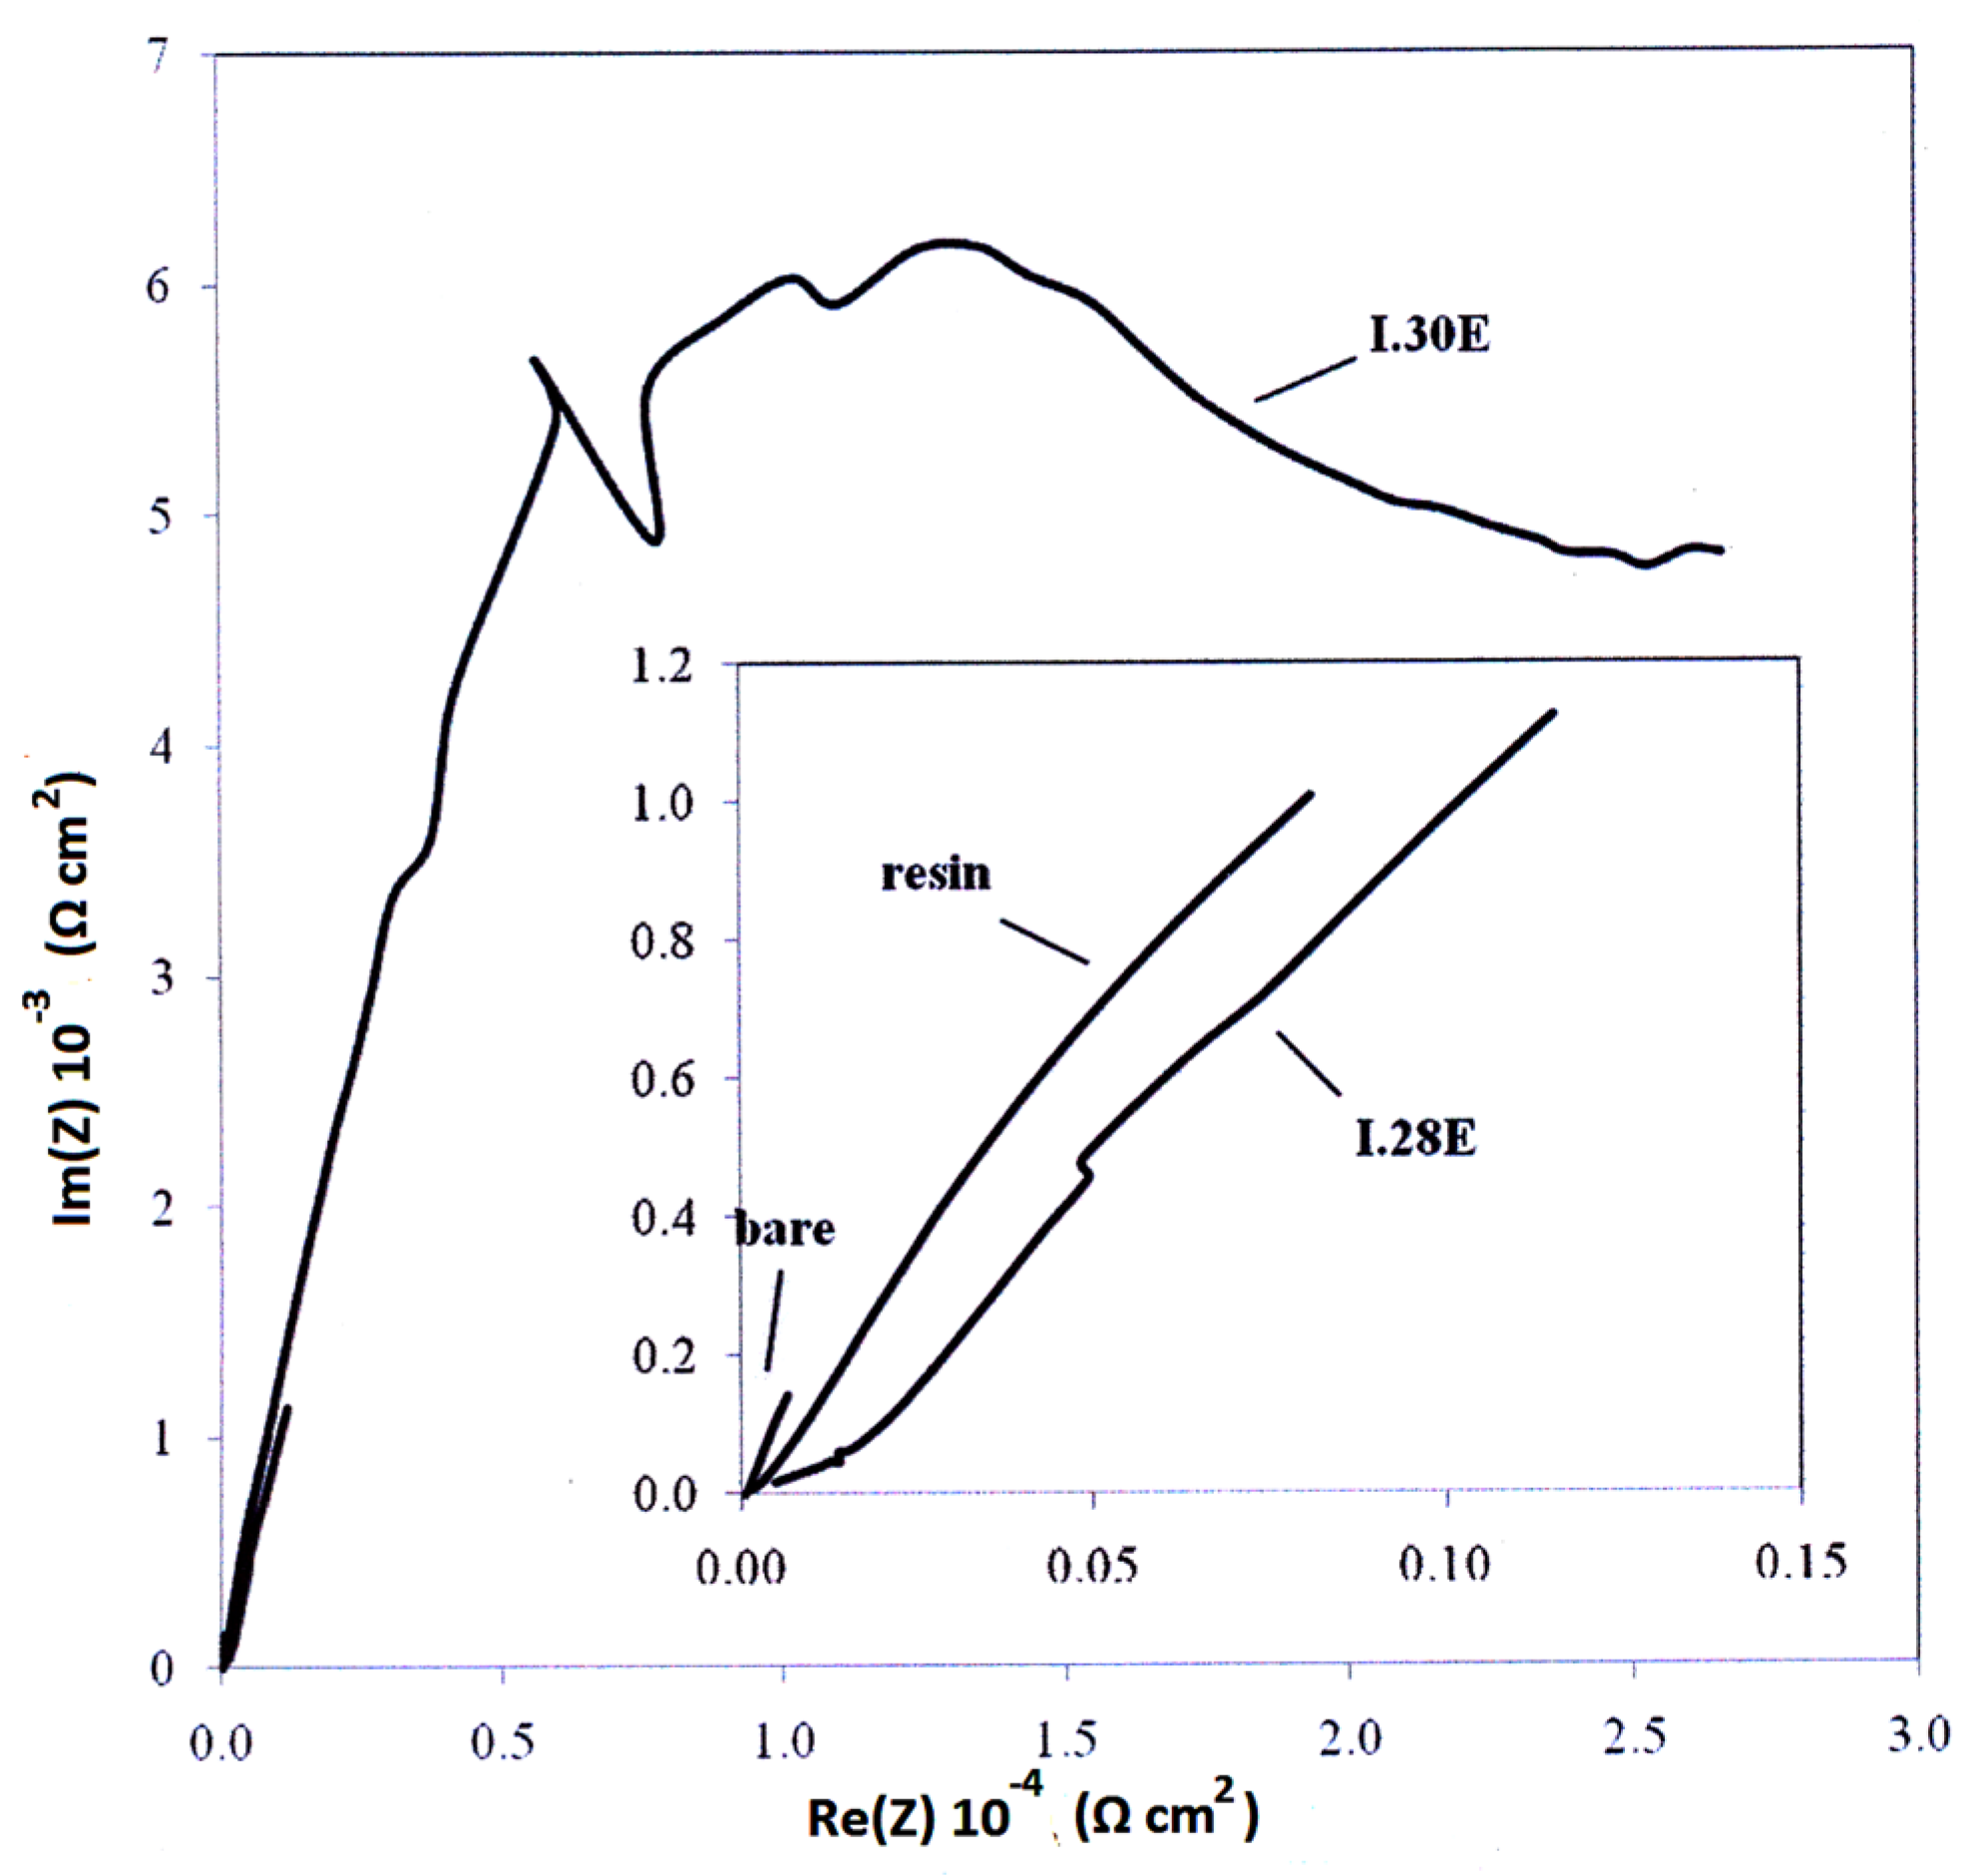
Figure 16.
Nyquist plots of impedance spectra, Re (Z), real part of impedance, and Im (Z), imaginary part of impedance, for bare and coated specimens after 4 days of exposure in a corrosive environment of 3.5 wt % NaCl solution.
Figure 16.
Nyquist plots of impedance spectra, Re (Z), real part of impedance, and Im (Z), imaginary part of impedance, for bare and coated specimens after 4 days of exposure in a corrosive environment of 3.5 wt % NaCl solution.

Table 1.
Data of ICP-AES chemical analysis of parent sodium montmorillonite PGW, I.28E quartenary octadecyl ammonium organoclay, and I.30E primary octadecyl ammonium organoclay.
Table 1.
Data of ICP-AES chemical analysis of parent sodium montmorillonite PGW, I.28E quartenary octadecyl ammonium organoclay, and I.30E primary octadecyl ammonium organoclay.
| Samples Were Calcined at 600 °C | Aluminum % (Al) | Calcium % (Ca) | Iron % (Fe) | Potassium % (K) | Magnesium % (Mg) | Sodium % (Na) |
|---|---|---|---|---|---|---|
| Na+-PGW | 12.02 | 0.36 | 1.57 | 0.16 | 2.3 | 3.31 |
| I.30E | 12.48 | 0.28 | 1.7 | 0.17 | 2.37 | 0.32 |
| I.28E | 12.17 | 0.22 | 1.74 | 0.23 | 2.3 | 0.08 |
Table 2.
Physical properties of Nanocor Inc. montmorillonite clays.
| Property | Na+-PGW | I.30E | I.28E |
|---|---|---|---|
| Color | White Powder | White Powder | White Powder |
| Cation Exchange Capacity, CEC (meq/100 g) ± 10% | 145 | – | – |
| Mean Dry Particle Size (μm) | ~2 (0.5–10) | 8–10 | 8–10 |
| Aspect Ratio | 200–400 | – | – |
| +325 Mesh Residue (%) | – | 0.1 | 0.1 |
| Specific Gravity | 2.6 | 1.71 | 1.9 |
| Max Moisture (%) | 12 | 3 | 3 |
| pH (5% dispersion) | 9.5–10.5 | – | – |
| Bulk Density (pounds/ft3) (gm/cc) | – | 250.41 | 260.42 |
| Mineral Purity (min %) | – | 98.5 | 98.5 |
Notes: Nanocor Inc. Vol. Lit. G-105 “POLYMER GRADE MONTMORILLONITES” (Nanocor, 2006); Nanocor Inc. Vol. Lit. T-11 “Epoxy Nanocomposites Using Nanomer® I.30E Nanoclay” (Nanocor, 2004); Nanocor Inc. Vol. Lit. T-12 “Nanocomposites Using Nanomer® I.28E Nanoclay” (Nanocor, 2004).
Table 3.
Tensile and thermo-mechanical properties of glassy epoxy–clay nanocomposites.
| Sample | Tensile Properties | Dynamic Mechanical Analysis | ||||
|---|---|---|---|---|---|---|
| Stress at Break (MPa) | Elongation at Break (%) | Elastic Modulus (MPa) | Storage Modulus at 40 °C (MPa) | Storage Modulus at 100 °C (MPa) | Tg (°C) | |
| Pristine | 62.5 | 7.9 | 3026 | 1660 | 16 | 84.5 |
| 3% Na+-PGW | 64.9 | 7.3 | 3139 | 1750 | 19 | 86.9 |
| 3% I.30E | 69.7 | 6.4 | 3315 | 2847 | 26 | 82.6 |
| 3% I.28E | 57.5 | 6.0 | 3030 | 2540 | 27 | 85.5 |
| 6% I.30E | 55.8 | 3.7 | 3514 | 2635 | 34 | 78.5 |
| 6% I.28E | 47.3 | 3.4 | 3279 | 2395 | 31 | 81.3 |
Table 4.
Resistance values (Ω cm2) for bare and coated specimens.
| Parameters of Equivalent Circuit | Bare— 0 day | Bare— 1 day | Bare— 2 days | Bare— 4 days | Epoxy— 0 day | Epoxy— 1 day | Epoxy— 2 days | Epoxy— 4 days |
|---|---|---|---|---|---|---|---|---|
| Rsol | 1.27 | 4.00 | 2.22 | 9.08 | 3.14 × 10² | 2.00 | 4.00 | 1.62 × 10 |
| R1 | 1.42 × 10³ | 9.93 × 10² | 6.55 × 10² | 3.67 | 2.15 × 10³ | 5.43 × 10 | 1.87 × 10 | 5.27 × 10³ |
| Y01 | 3.93 × 10⁻⁴ | 1.08 × 10⁻² | 3.97 × 10⁻² | 3.51 × 10⁻² | 1.62 × 10⁻⁶ | 4.43 × 10⁻³ | 1.05 × 10⁻³ | 2.33 × 10⁻³ |
| n1 | 8.08 × 10⁻¹ | 8.72 × 10⁻¹ | 7.01 × 10⁻¹ | 4.79 × 10⁻¹ | 6.26 × 10⁻¹ | 2.93 × 10⁻¹ | 4.86 × 10⁻¹ | 6.76 × 10⁻¹ |
| R2 | 2.48 × 10 | – | – | 1.03 × 10² | 6.78 × 10⁵ | 7.26 × 10³ | 5.38 × 10³ | 7.21 × 101 |
| Y02 | 1.26 × 10⁻³ | 5.92 × 10⁻² | 4.22 × 10⁻² | 9.99 × 10⁻² | 2.10 × 10⁻⁶ | 1.03 × 10⁻³ | 2.31 × 10⁻³ | 1.34 × 10⁻³ |
| n2 | 7.10 × 10⁻¹ | 3.37 × 10⁻¹ | 3.17 × 10⁻¹ | 7.61 × 10⁻¹ | 5.68 × 10⁻¹ | 6.93 × 10⁻¹ | 6.19 × 10⁻¹ | 4.60 × 10⁻¹ |
| Rtot (R1 + R2) | 1.44 × 10³ | 9.93 × 10² | 6.55 × 10² | 1.03 × 10² | 6.80 × 10⁵ | 7.31 × 10³ | 5.40 × 10³ | 5.34 × 10³ |
| Parameters of Equivalent Circuit | I.28E— 0 day | I.28E— 1 day | I.28E— 2 days | I.28E— 4 days | I.30E— 0 day | I.30E— 1 day | I.30E— 2 days | I.30E— 4 days |
| Rsol | 1.38 × 10 | 1.37 × 10 | 1.51 × 10 | 1.40 × 10 | 7.67 × 10 | 9.66 | 1.11 × 10 | 1.50 × 10 |
| R1 | 9.36 | 2.12 × 10² | 8.12 × 10³ | 7.35 × 10³ | 4.93 × 10⁴ | 1.80 × 10⁴ | 1.09 × 10³ | 6.03 × 10² |
| Y01 | 1.37 × 10⁻⁴ | 7.18 × 10⁻⁴ | 8.98 × 10⁻⁴ | 2.33 × 10⁻³ | 9.74 × 10⁻⁶ | 2.63 × 10⁻⁶ | 4.08 × 10⁻⁵ | 4.26 × 10⁻⁵ |
| n1 | 1.00 | 3.15 × 10⁻¹ | 4.94 × 10⁻¹ | 6.38 × 10⁻¹ | 1.00 | 6.53 × 10⁻¹ | 3.79 × 10⁻¹ | 2.96 × 10⁻¹ |
| R2 | 7.99 × 10⁴ | 8.99 × 10³ | 6.24 | 4.81 × 10 | 1.54 × 10⁵ | 2.63 × 10⁴ | 3.02 × 10⁴ | 2.90 × 10⁴ |
| Y02 | 3.02 × 10⁻⁵ | 8.25 × 10⁻⁴ | 1.63 × 10⁻⁴ | 1.44 × 10⁻³ | 8.72 × 10⁻⁶ | 7.49 × 10⁻⁵ | 1.15 × 10⁻⁴ | 3.59 × 10⁻⁴ |
| n2 | 7.69 × 10⁻¹ | 6.41 × 10⁻¹ | 7.01 × 10⁻¹ | 4.38 × 10⁻¹ | 7.10 × 10⁻¹ | 4.31 × 10⁻¹ | 6.95 × 10⁻¹ | 5.79 × 10⁻¹ |
| Rtot (R1 + R2) | 7.99 × 10⁴ | 9.21 × 10³ | 8.12 × 10³ | 7.40 × 10³ | 2.03 × 10⁵ | 4.43 × 10⁴ | 3.13 × 10⁴ | 2.96 × 10⁴ |
© 2017 by the authors. Licensee MDPI, Basel, Switzerland. This article is an open access article distributed under the terms and conditions of the Creative Commons Attribution (CC BY) license (http://creativecommons.org/licenses/by/4.0/).
Share and Cite
MDPI and ACS Style
Merachtsaki, D.; Xidas, P.; Giannakoudakis, P.; Triantafyllidis, K.; Spathis, P. Corrosion Protection of Steel by Epoxy-Organoclay Nanocomposite Coatings. Coatings 2017, 7, 84. https://doi.org/10.3390/coatings7070084
AMA Style
Merachtsaki D, Xidas P, Giannakoudakis P, Triantafyllidis K, Spathis P. Corrosion Protection of Steel by Epoxy-Organoclay Nanocomposite Coatings. Coatings. 2017; 7(7):84. https://doi.org/10.3390/coatings7070084
Chicago/Turabian StyleMerachtsaki, Domna, Panagiotis Xidas, Panagiotis Giannakoudakis, Konstantinos Triantafyllidis, and Panagiotis Spathis. 2017. "Corrosion Protection of Steel by Epoxy-Organoclay Nanocomposite Coatings" Coatings 7, no. 7: 84. https://doi.org/10.3390/coatings7070084
Note that from the first issue of 2016, this journal uses article numbers instead of page numbers. See further details here.