Investigation on the Cathodic Protection Effect of Low Pressure Cold Sprayed AlZn Coating in Seawater via Numerical Simulation

1
Science and Technology on Marine Corrosion and Protection Laboratory, Luoyang Ship Material Research Institute, Qingdao 266101, China
2
State Key Laboratory of Advanced Technology for Materials Synthesis and Processing, Wuhan University of Technology, Wuhan 430070, China
3
Sunrui Marine Environment Engineering Co., Ltd., Qingdao 266101, China
*
Author to whom correspondence should be addressed.
Coatings 2017, 7(7), 93; https://doi.org/10.3390/coatings7070093
Submission received: 8 May 2017
/
Revised: 18 June 2017
/
Accepted: 28 June 2017
/
Published: 4 July 2017
(This article belongs to the Special Issue Coatings for Corrosion Mitigation)
Abstract
:Cold spray can deposit a composite coating simply by spraying mechanically-mixed Al and Zn powders, while no quantitative data has been reported on the anti-corrosion performance of different composite cold-sprayed coatings. In the present work, the finite element method was used to estimate the cathodic protection effect by simulating the potential distribution on a damaged cold-sprayed AlZn coating on Q235 steel. The results indicate that AlZn coating can only provide a limiting cathodic protection for substrate, because it can only polarize a very narrow zone negative to −0.78 V (vs. SCE, saturated calomel electrode). The remaining area of the steel substrate still has a very high residual corrosion rate. Computational methods can be used to predict the corrosion rate of AlZn coating, and the simulation results were validated by the results of a weight loss experiment.
1. Introduction
Anodic metallic coatings (especially Al, Zn, and AlZn coating) are acknowledged as a long-term effective anticorrosion method which can significantly prolong the lifetime of steel structures to more than 20 years [1,2]. For example, zinc and aluminum coatings have been known to be very efficient for the corrosion prevention of steel structures because of both the sacrificial behavior and self-healing properties against local damage such as scratches and impacts occurring on the coated steel structures. The protective mechanism of an anodic metal layer includes three aspects: barrier action of the metallic layer itself, cathodic protection as a sacrificial anode, and barrier action of corrosion products of metallic layer [3,4,5], which can be illustrated in Figure 1. As for the cathode protection, the coating acts as an anode and provides current for substrate at the penetrated pore and scratch location. Numerous researchers have studied the corrosion behavior and anticorrosion performance of anodic metallic coatings [6,7,8], using electrochemical methods, local electrochemical impedance methods, and exposure methods. Additionally, many works have been focused on the corrosion products, since the barrier action of the metallic layer plays a principal role in corrosion prevention for steel [9,10]. Cold spray methods can deposit a composite coating simply by spraying mechanically-mixed Al and Zn powders, which can simplify the coating deposition process significantly. In addition to its high cohesion strength, low porosity, and low oxidation, cold spraying methods have attracted great attention in the corrosion field; the research results also indicate that cold-sprayed coatings have advantages in anticorrosion [11,12,13]. There have already been numerous simulation studies (BEM, boundary element method) on the corrosion behaviors of thermal-sprayed AlZn coating in atmosphere environment for thermal-sprayed AlZn coating [14]. Most of the work addressed the potential distribution, and seldom with the residual corrosion of substrate [12,15,16,17]. However, the anti-corrosion performance is always different for AlZn alloy coatings and AlZn composite coatings. By now, no investigation on the corrosion protection of cold-sprayed AlZn coatings has been done by simulation methods. The corrosion rate of substrate under cathodic protection by coating has also yet to be studied.
In the present work, commercial finite element method (FEM) software Comsol Multiphysics (5.1, Comsol Company, Burlington, VT, USA) was adopted to simulate the potential distribution on the scratched coating. A cold-sprayed Al coating, a Al30Zn coating, and a Al60Zn coating were adopted to protect the Q235 substrate. Different damaged areas of the coating were used to understand the protection degree and scopes.
2. Materials and Methods
2.1. Fundamentals of Cathodic Protection Numerical Simulation
The distribution of the potential (E) and current density (i) in the water (Ω) is governed by Laplace’s Equation (1) and Ohm’s law (2) [14,15]. It can be calculated, knowing the electrical conductivity of the water (k). At the same time, the cathodic protection system is in steady-state, which means Q = 0, where Q is the amount of electric charge in a cell.
in which is the Laplacian operator. The solution can be obtained by solving these two equations within the electrolyte domain (i.e., the water) by imposing the boundary conditions that describe on the surface. On insulating surfaces—which do not exchange current—the boundary condition is to set a null current density in the normal direction to the surface (in Ω), which is equivalent to setting the gradient of potential over this direction to zero.
On the surface of the cathode and anode, the current density exchanged through the surface is a function of the potential on the metal in the electrolyte, Ec and Ea, respectively. The boundary conditions match with the polarization curves of the materials. The potential distribution in the domain describes the ohmic drop in the water between two generic points. Then, at any time in a micro cubic cell dxdydz, the variation of Q can be written as Equation (3).
Equation (5) can be obtained by combining the Green Equations (3) and (4), where Γ is the boundary of the domain Ω.
Constant c(ξ) is the shape coefficient (which is determined by the shape of the boundary), and E*(ξ,x), and i*(ξ,x) are the base solution of Laplace’s Equation of potential and current density. For a three-dimensional problem, the solution can be written as Equation (6).
In Equation (6), r is the distance between the location ξ and x, the region Γ is divided into N parts.
Then, Equation (5) can be written as Equation (7) after the boundary Γ is divided into multiple units (N).
In Equation (7), ci is the angle between a boundary and its tangent.
Supposing that the H is the potential array and G is the current density array,
δij is Kronecker delta, then Equation (8) can be written as Equation (9).
The distribution of potential and current density can be obtained by solving Equation (9).
2.2. Physical Model
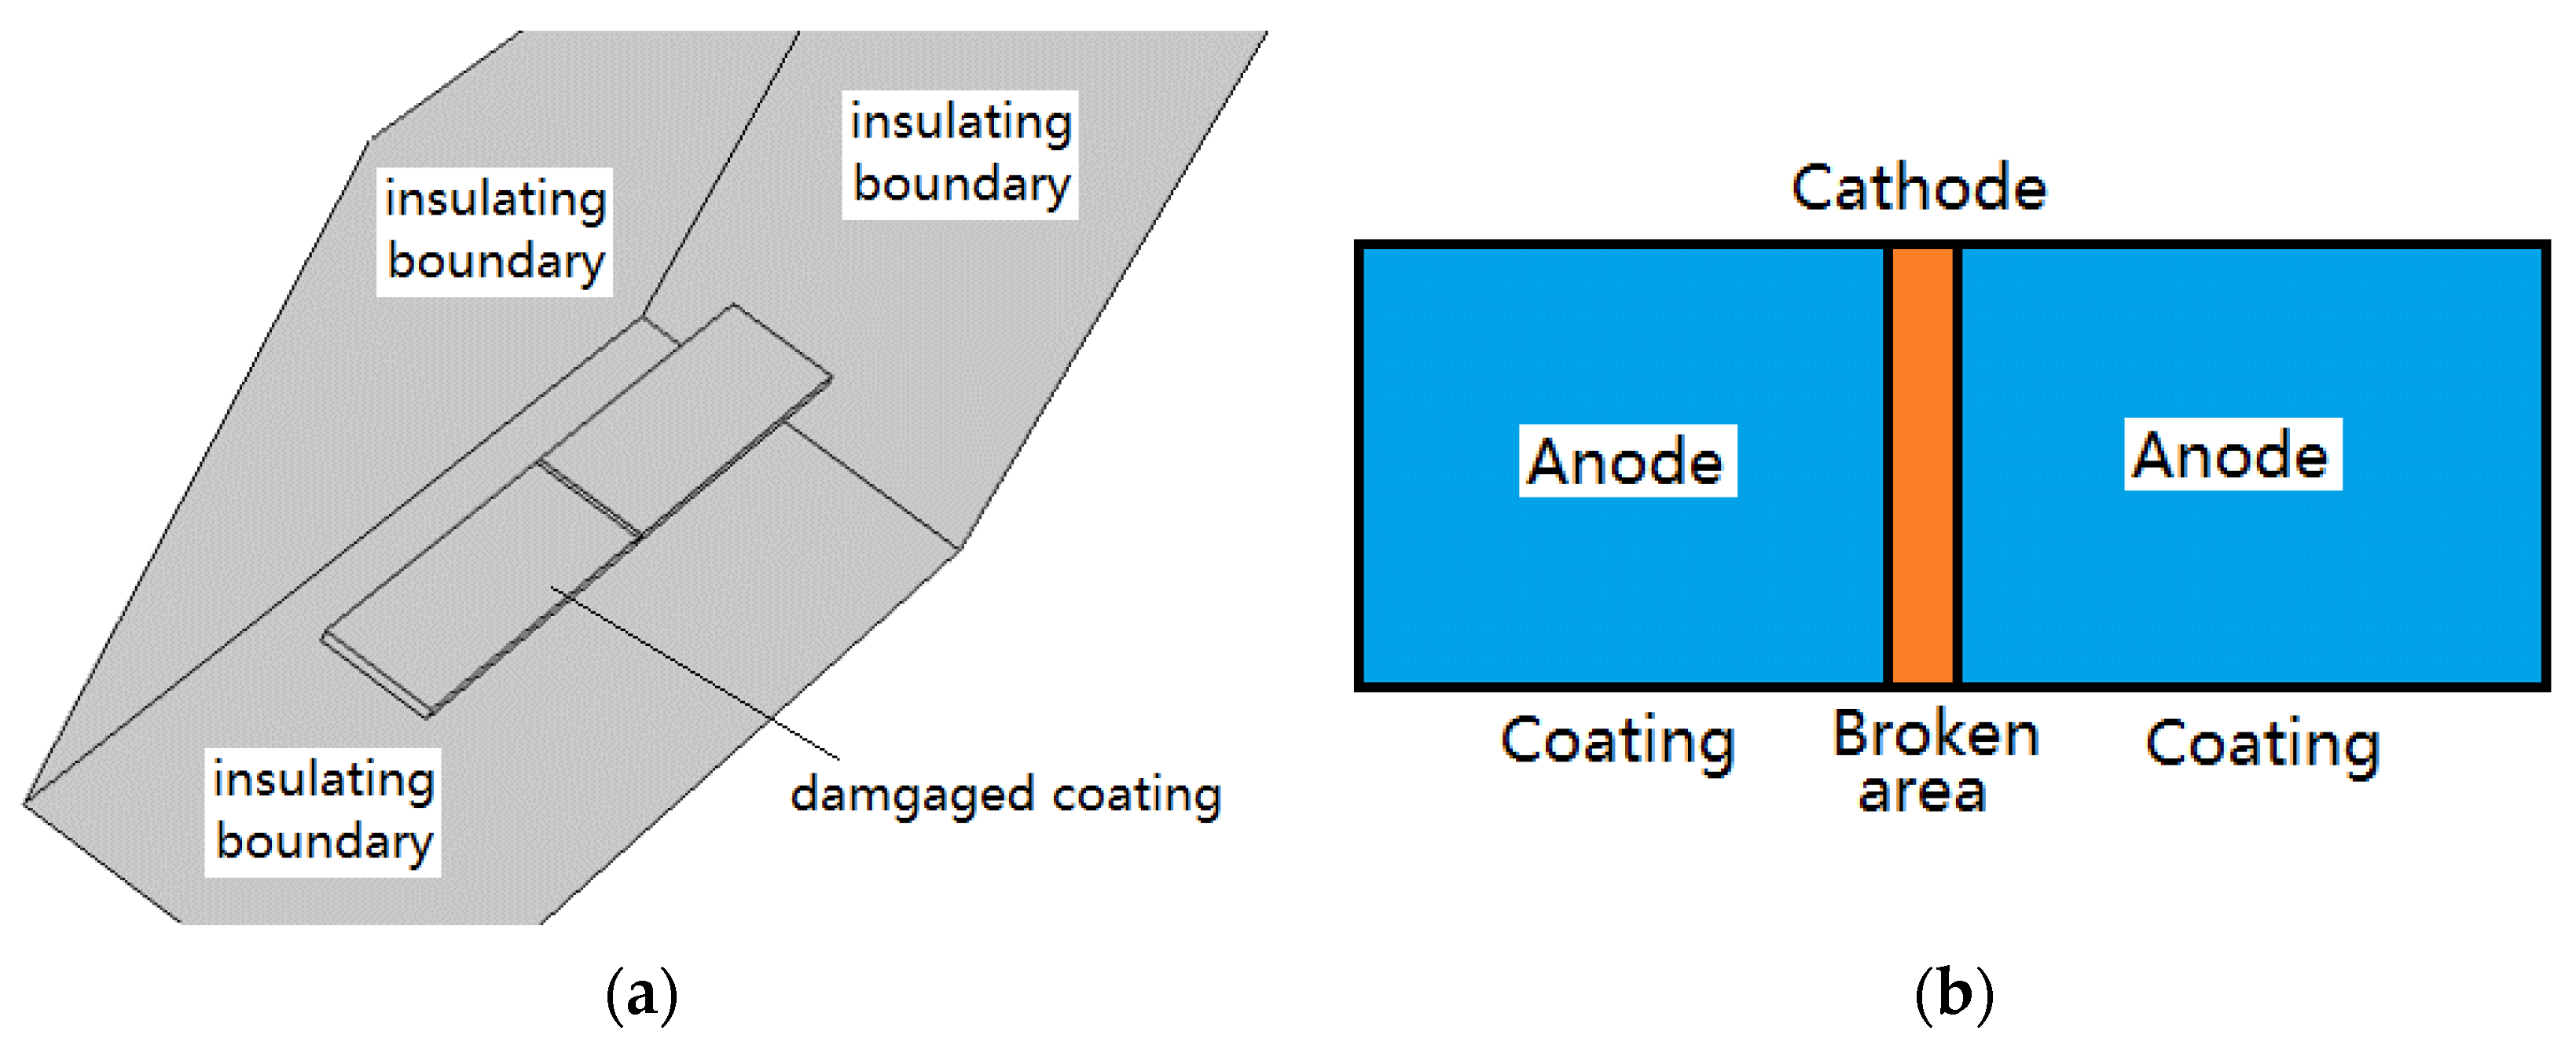
The simulation experiments were carried out on a sample of coated Q235 steel substrate immersed in seawater by the commercial finite element software Comsol Multiphysics, which is shown in Figure 2a in a beaker. Different broken coating areas were tested, including 1–10 mm as shown in Figure 2b. The calculation results’ independence to mesh density were checked. The results had no evidence of difference as the mesh is divided by the following strategy: the whole simulation domain and the coating samples were discretized by using a three-dimensional model as shown in Figure 3, by 2 × 10⁴ tetragonal elements with dimension in the range of 0.5–50 mm, refined near the broken areas. The mesh is heterogeneous and the size growth ratio is 1.1 between adjacent units. The insulating boundary condition was applied to the out layer of the computational domain and the remaining surface of the samples since the beaker wall and the epoxy resin-covered surface are truly insulating [16,17,18]. The seawater is the electrolyte, which is around the coating samples with an isotropic 5 S/m conductivity. The coating area is set as anode, and its boundary condition is the potential and polarization curve obtained experimentally; the damaged substrate is set as cathode, and its boundary condition is the potential and polarization curve obtained experimentally. This is a steady-state problem, so a stationary UMFPACK solver (https://en.wikipedia.org/wiki/UMFPACK) was adopted to solve the equations. The calculation will be terminated until the convergence criteria (residuals smaller than 10−6 for all parameter) conditions are satisfied.
2.3. Boundary Condition and Data Collection
The polarization behavior is basically determined by the electrochemical reaction of the anode and cathode. The anode reactions (Ι) and (ΙΙ) is always Al or Zn losing its electrons. The cathode reaction (ΙΙΙ) is always the reduction of oxygen in neutral seawater [19,20].
Zn → 2e− + Zn2+
Al → 3e− + Al3+
O2 + 2H2O + 4e− → 4(OH)−
In which the reaction rate i and the over-potential η obey the Butler–Volmer Equation (10) for both anode and cathode when the reaction is controlled by electrochemical stage.
In which i is the exchange current density of metal under equivalent potential. In real conditions, the relationship between η and i is influenced by the surface condition such as coatings, corrosion production formation, and oxygen diffusion rate. n is the number of electrons lost in the corrosion reaction. F is the Faraday constant, 26.8 A·h. R is the gas constant. Consequently, the polarization curves must be collected by experiments. For a sacrificial anode cathodic protection system, the anodic region polarization curve of the anode and the cathodic region polarization curve of the cathode must be contained to define the boundary conditions. Additionally, the open circuit potential must be obtained for boundary conditions and can be acquired by voltmeter.
The potentiodynamic polarization curve collection process can be illustrated as follows: The potentiodynamic polarization was performed on Q235 steel, Al coating, Al30Zn coating, and Al60Zn coating. The polarization scan was started from −160 mV relative to the open circuit potential (OCP) with a scan rate of 0.167 mV/s, and was ended when the potential was higher than +400 mV relative to the OCP for aluminum coating. The polarization scan was started from +50 mV relative to the OCP with a scan rate of 0.167 mV/s, and was ended when the potential was negative than +800 mV relative to the OCP for Q235 substrate. All of the electrochemical tests were performed at room temperature in seawater, with saturated calomel electrode (SCE) as reference electrode, Pt counter, and working electrode of specimens. A potentiostat (2273, Perkin Elmer Company, Waltham, MA, USA) was employed for the measurements. The seawater used in the test was natural seawater taken from Maidao test site (Qingdao, Chian, which is authorized by the China Corrosion Association), with a NaCl content of about 3.5 wt %.
2.4. Validation of Simulation Results
2.4.1. Low-Pressure Cold-Sprayed AlZn Coating Preparation
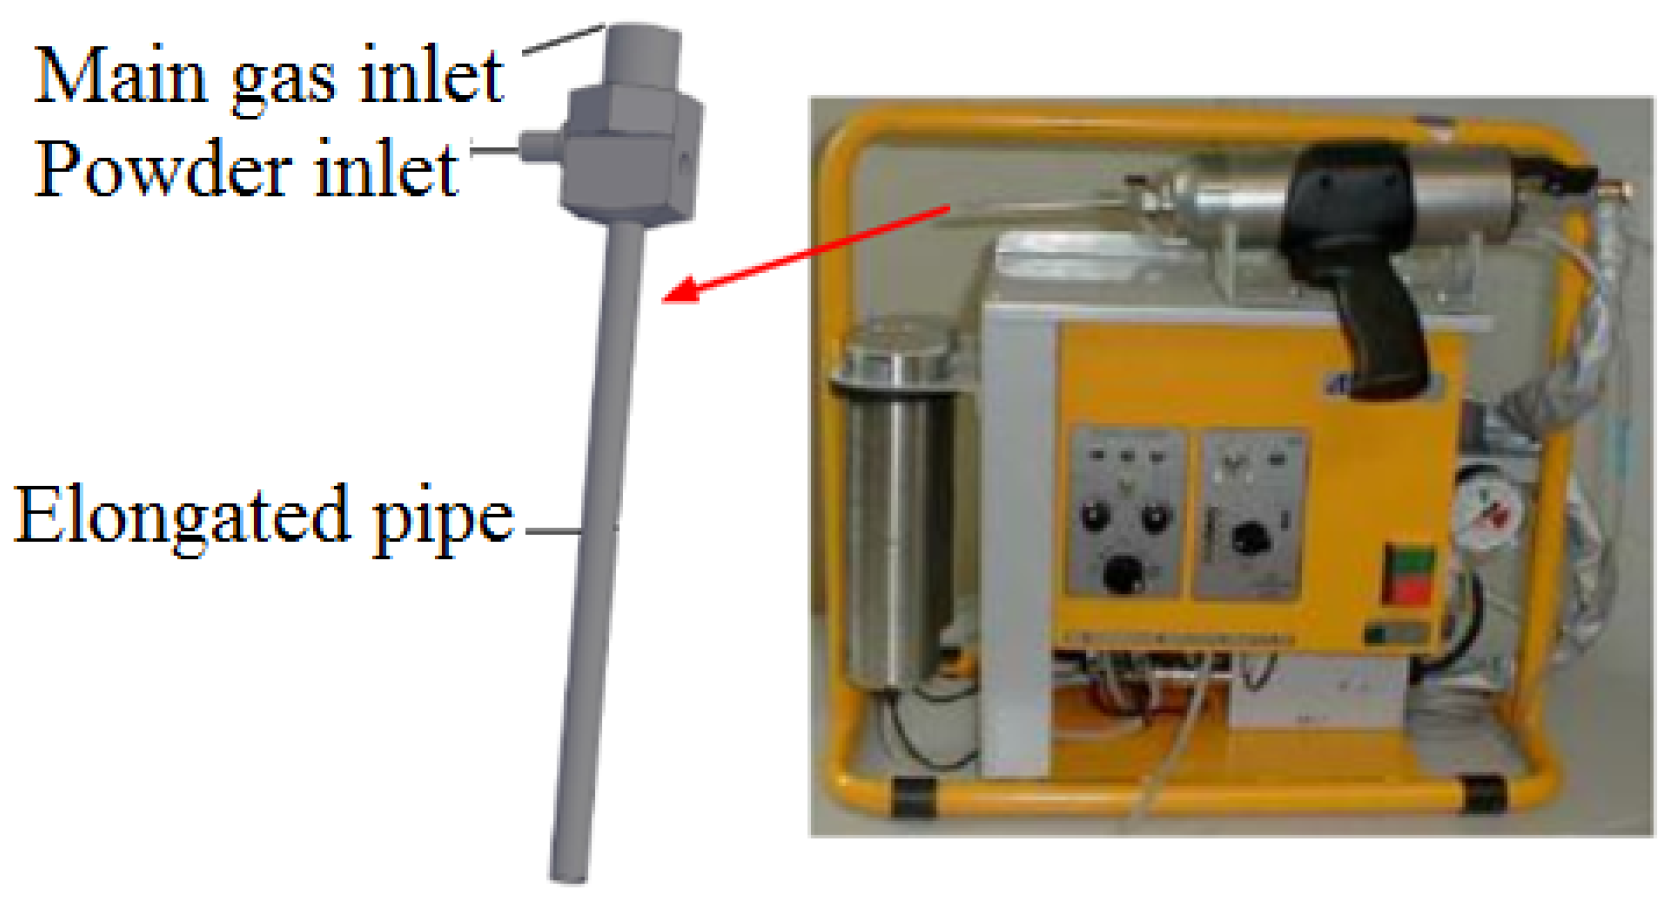
A commercial ion atomized aluminum powder was provided by Jiangsu Tianyuan Powder Company (Taizhou, China) with size ranging from 10 to 50 μm, and purity of 99.9%. A commercial ion-atomized zinc powder was provided by Zhoucheng Powder company (Zhoucheng, China), with size ranging from 5 to 30 μm and purity 99.7%. The raw powder for preparing Al30Zn and Al60Zn coating is a mechanical mixture of aluminum and zinc powder with corresponding weight content. Q235 steel was used as substrate with thickness of 3 mm, abraded with emery paper of number 280 and 600 in sequence. A commercial low-pressure cold spray system (Dymet 413, Dycomet B.V. Europe, Akkrum, The Netherlands) was used to deposit coatings, as shown in Figure 4. The nozzle and the gas parameters adopted in this study are listed in Table 1, and Al coating, Al30Zn coating, and Al60Zn coating samples were prepared with the same parameter. The surface of the coatings with different width damage were also prepared.
2.4.2. Verification of Simulation Results
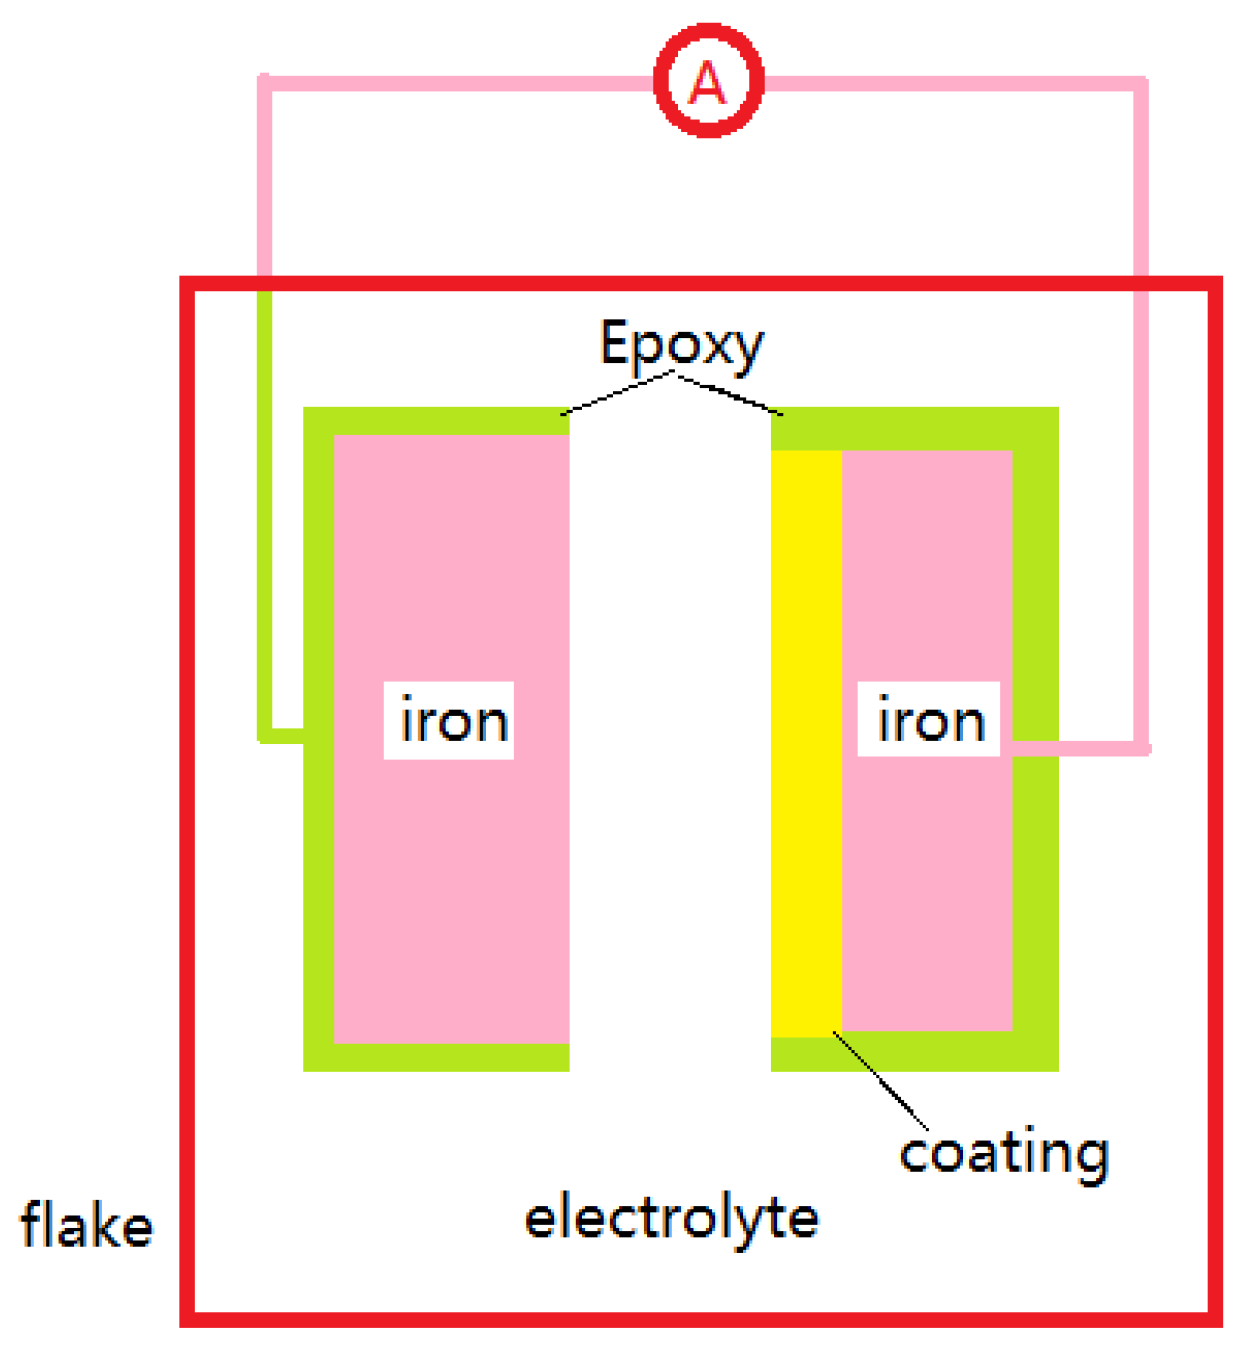
The coating and the substrate were separated into two parts as shown in Figure 5, since it is difficult to investigate the cathodic protection effect of the coating. The weight loss of cathode-protected Q235 substrate and unprotected substrate was tested during 30 days immersion, and the apparent surface area of samples for Q235 and AlZn coatings was equal, 50 mm × 50 mm × 3 mm. The corrosion rate of the coating was not calculated because it is impossible to obtain the accurate weight loss. For porous metal coating and organic coating, the corrosion products will fill into the pores, and will make it impossible to get the accurate weight loss of substrate. Additionally, during the immersion, the mixed potential of the coating and the Q235 steel were measured by a voltmeter with an SCE.
3. Results
3.1. Open Circuit Potential and Potentiodynamic Polarization Curves
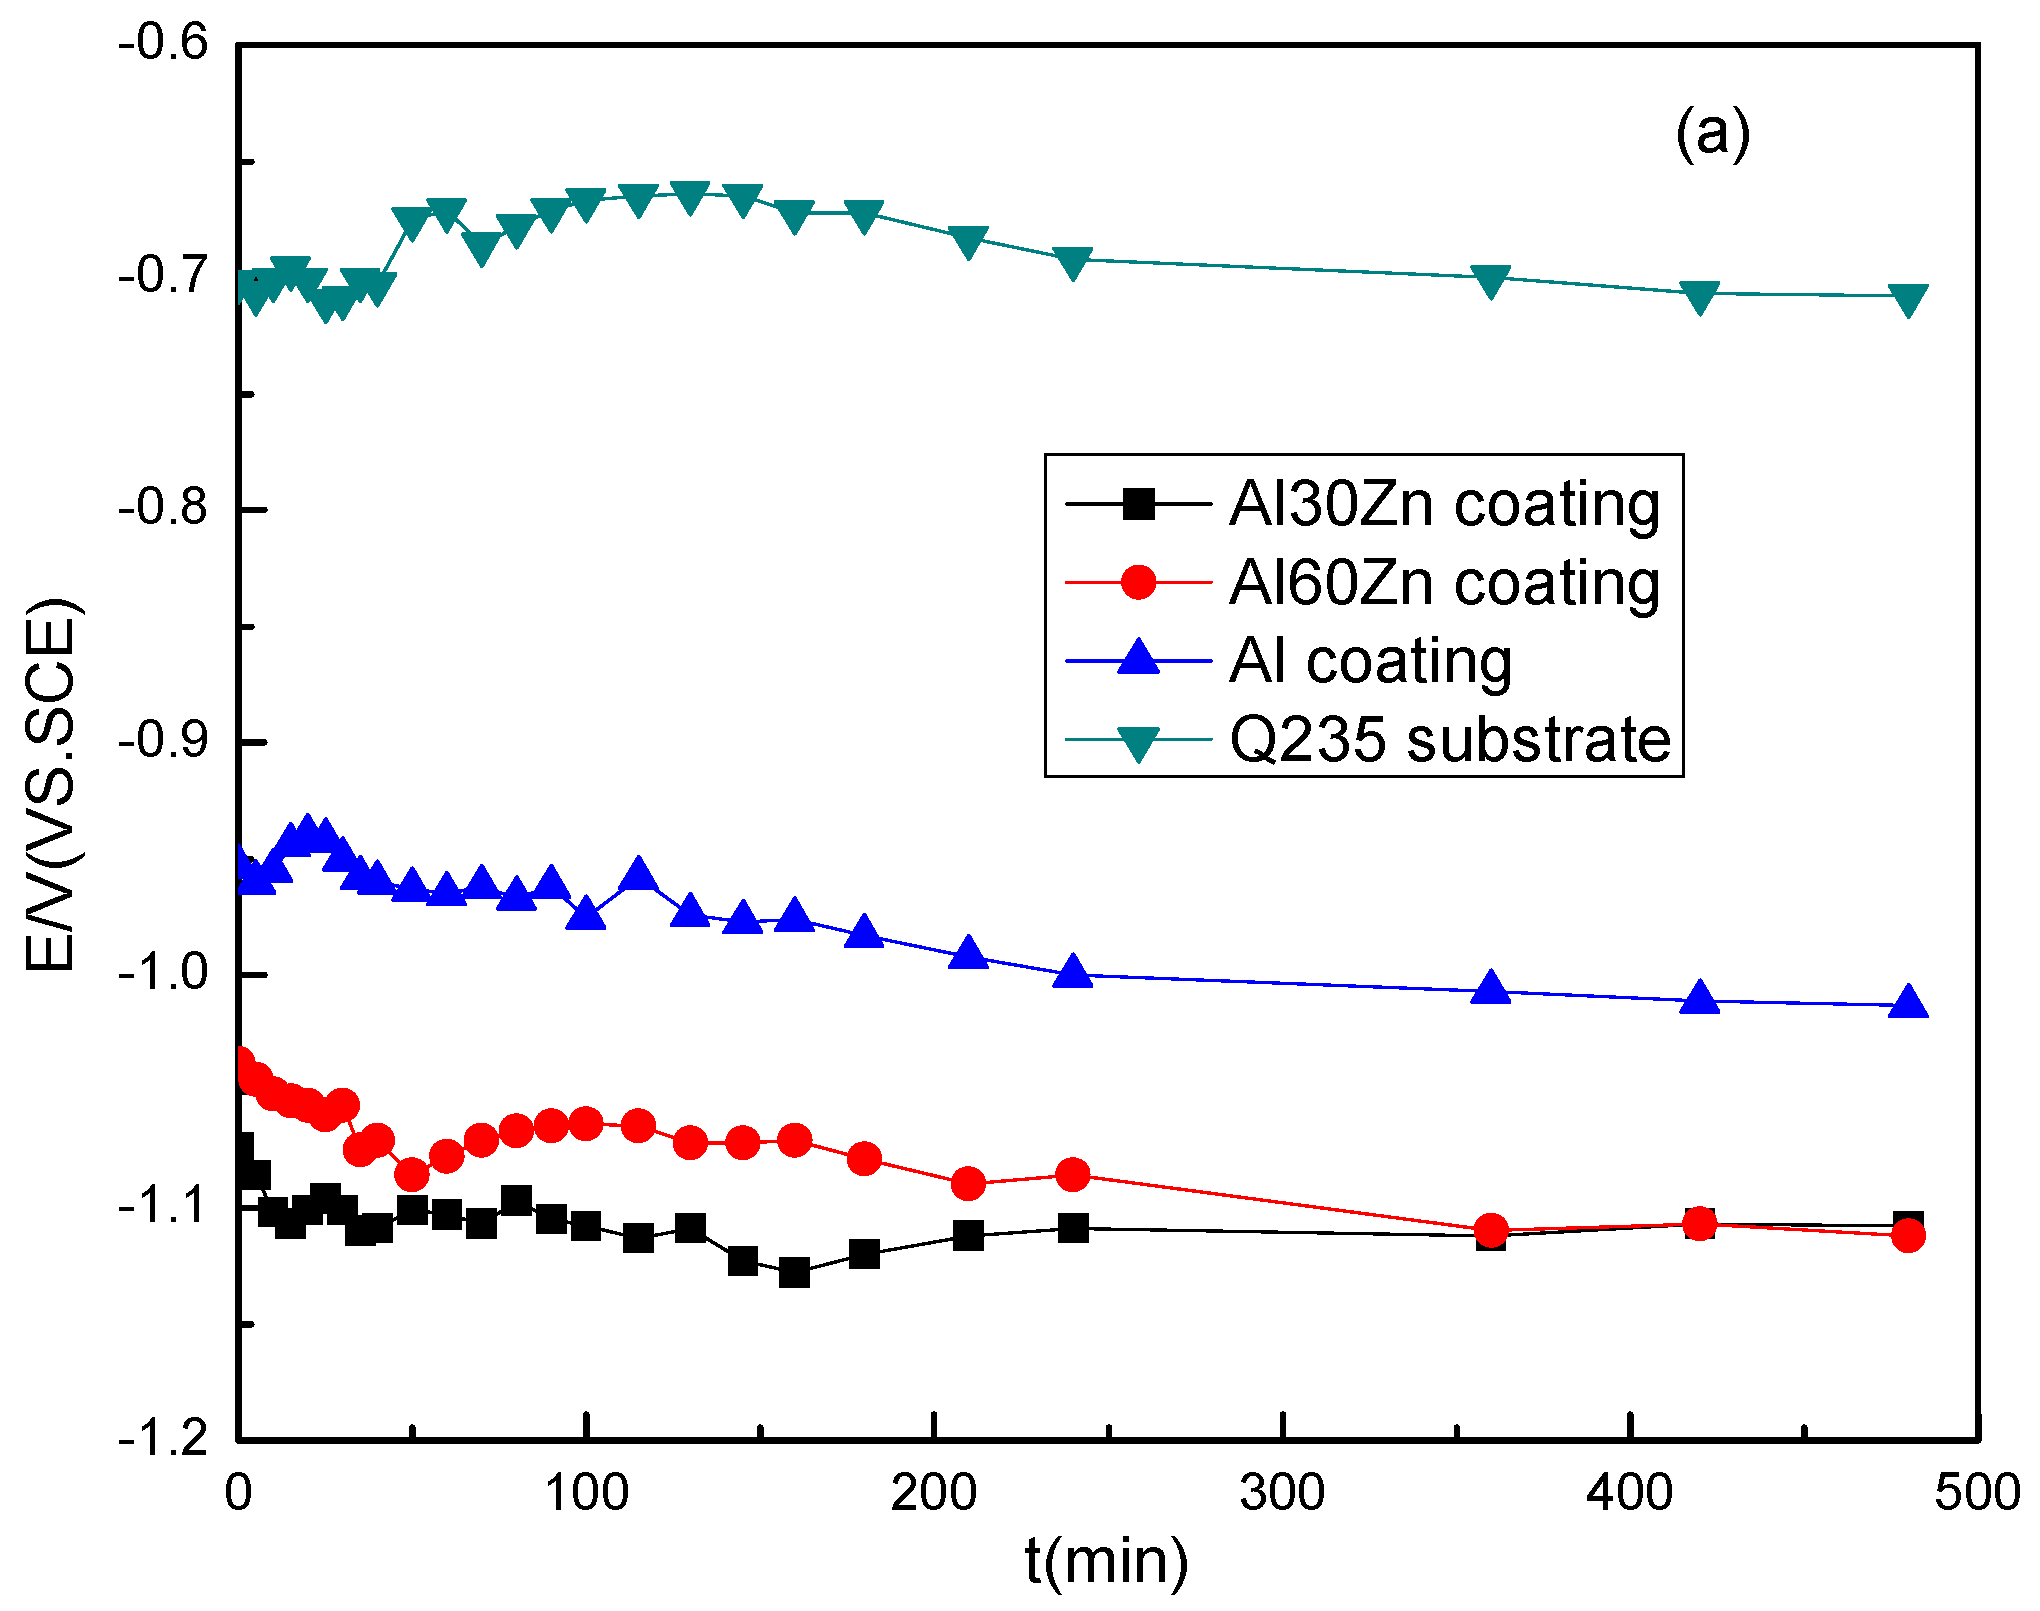
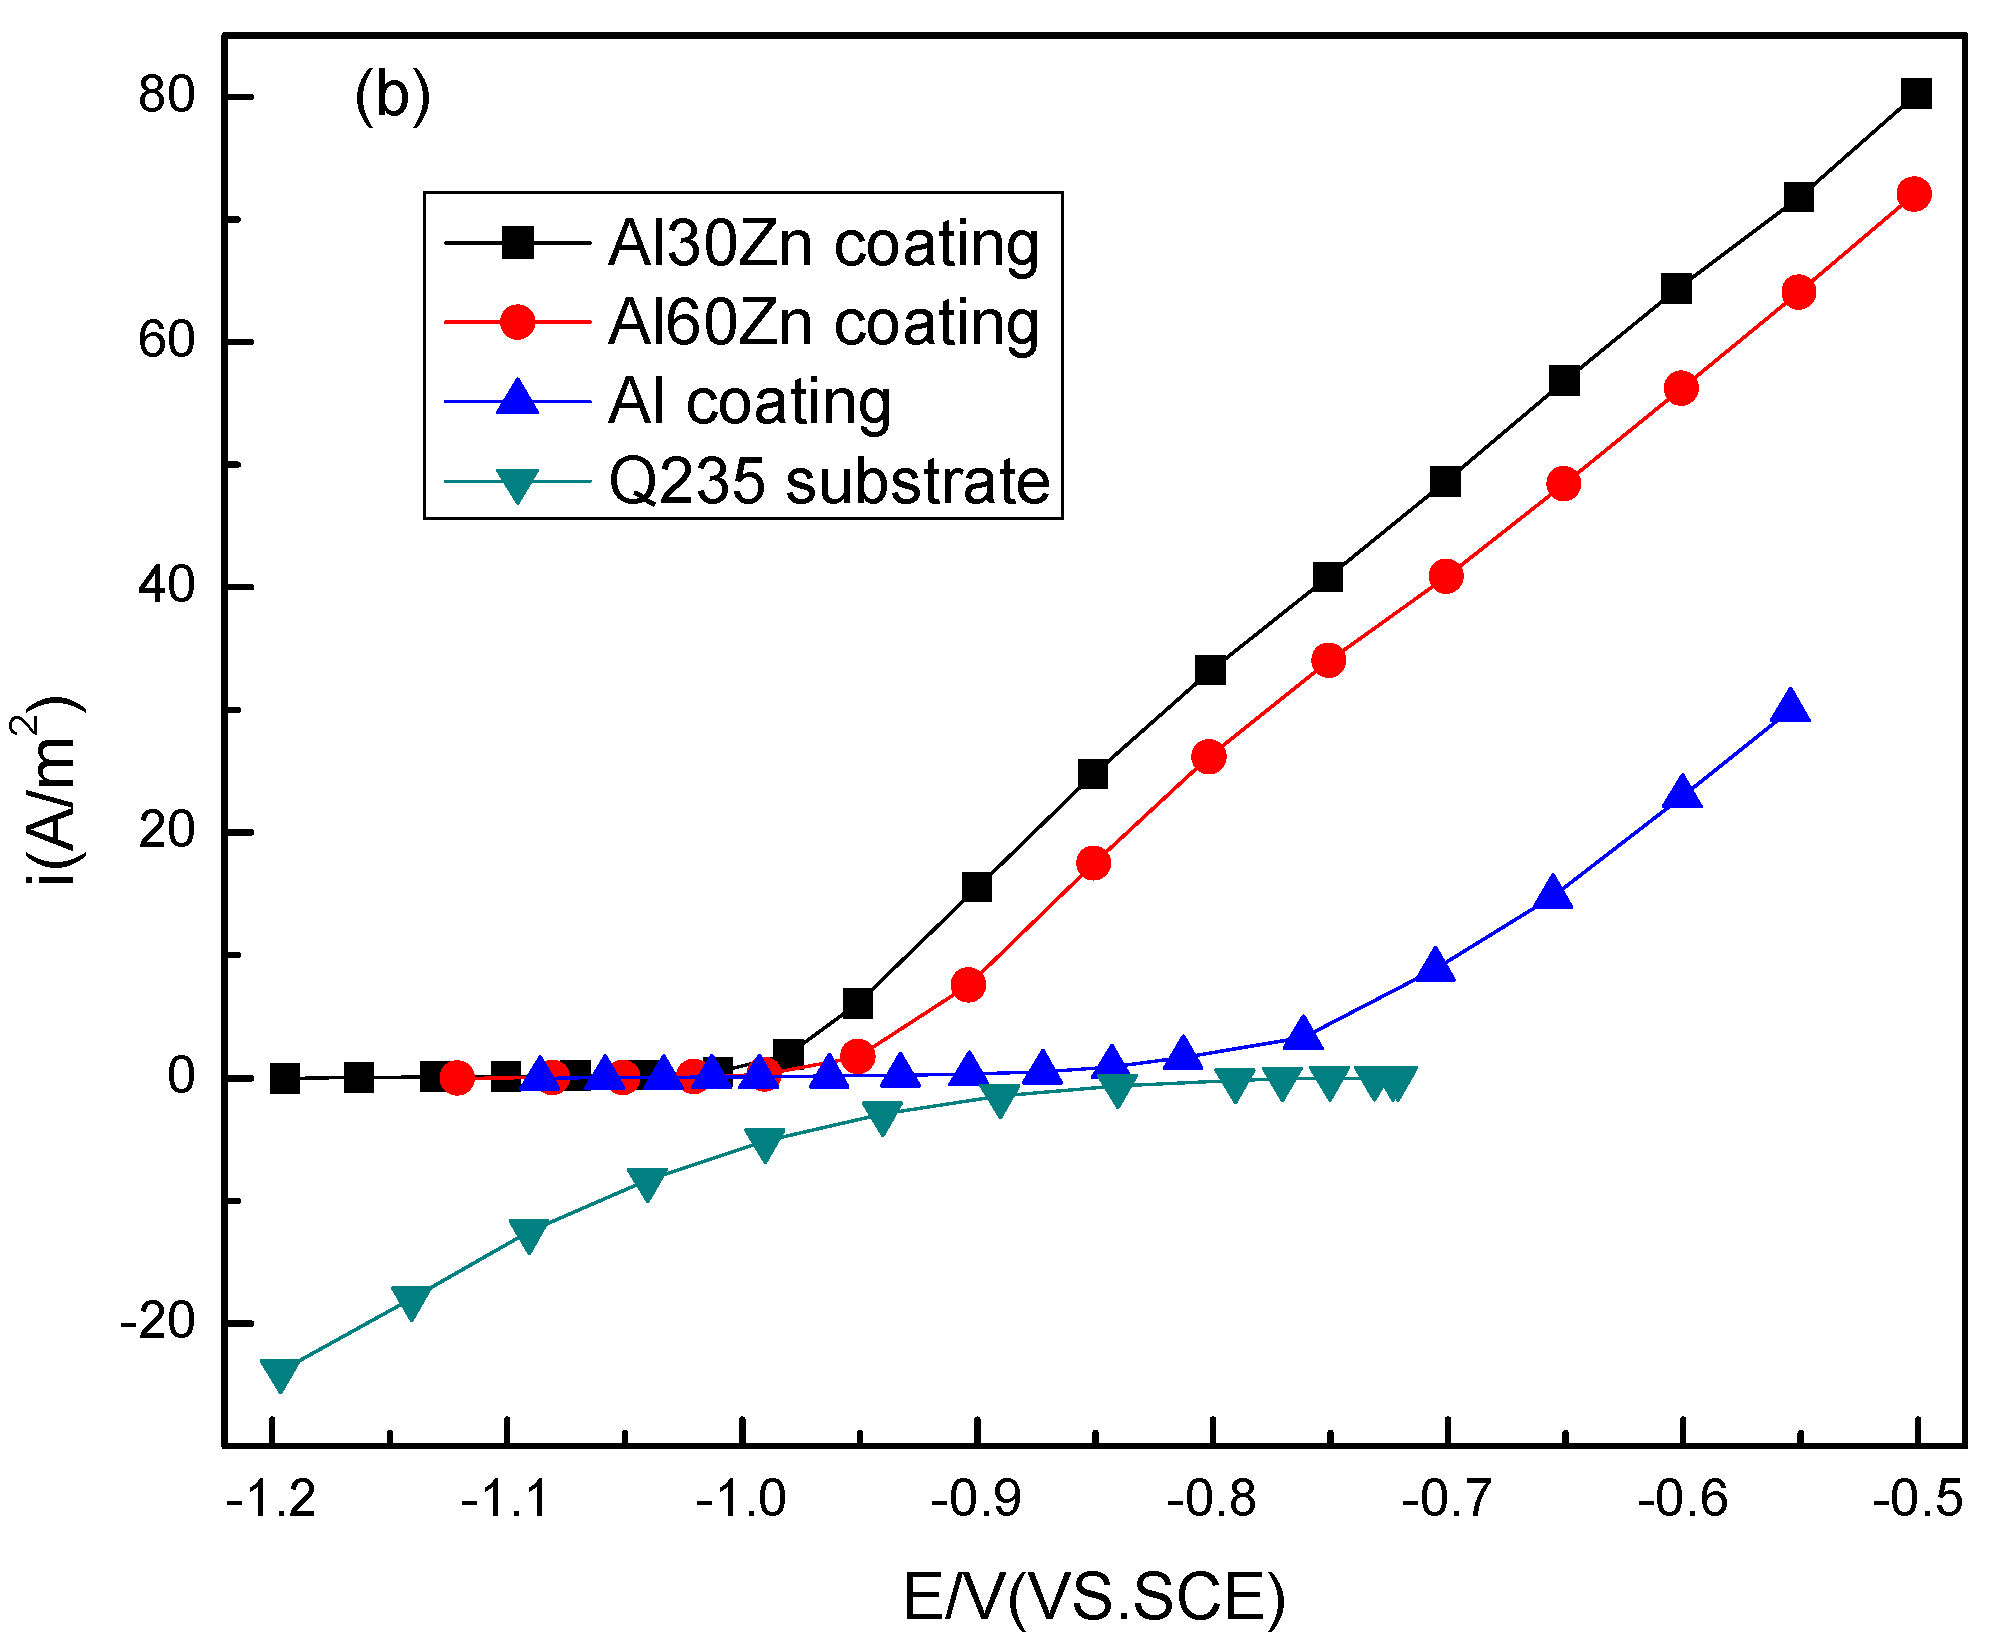
The open circuit potential of Q235 steel and AlZn coatings are shown in Figure 6a; the potential of each sample became stable after about 480 min immersion. From Figure 6, the open circuit potential for Q235 steel, Al coating, and AlZn coating can be set as −0.71, −1.00, and −1.12 V, respectively in the software during simulation. The potentiodynamic polarization curves are shown in Figure 6b. It can be seen that the Al30Zn coating has the highest polarization slope, which means that it can provide the highest current for cathodic protection. The pure Al coating can provide the lowest current for cathodic protection.
3.2. The Potential Distribution of Different Coatings
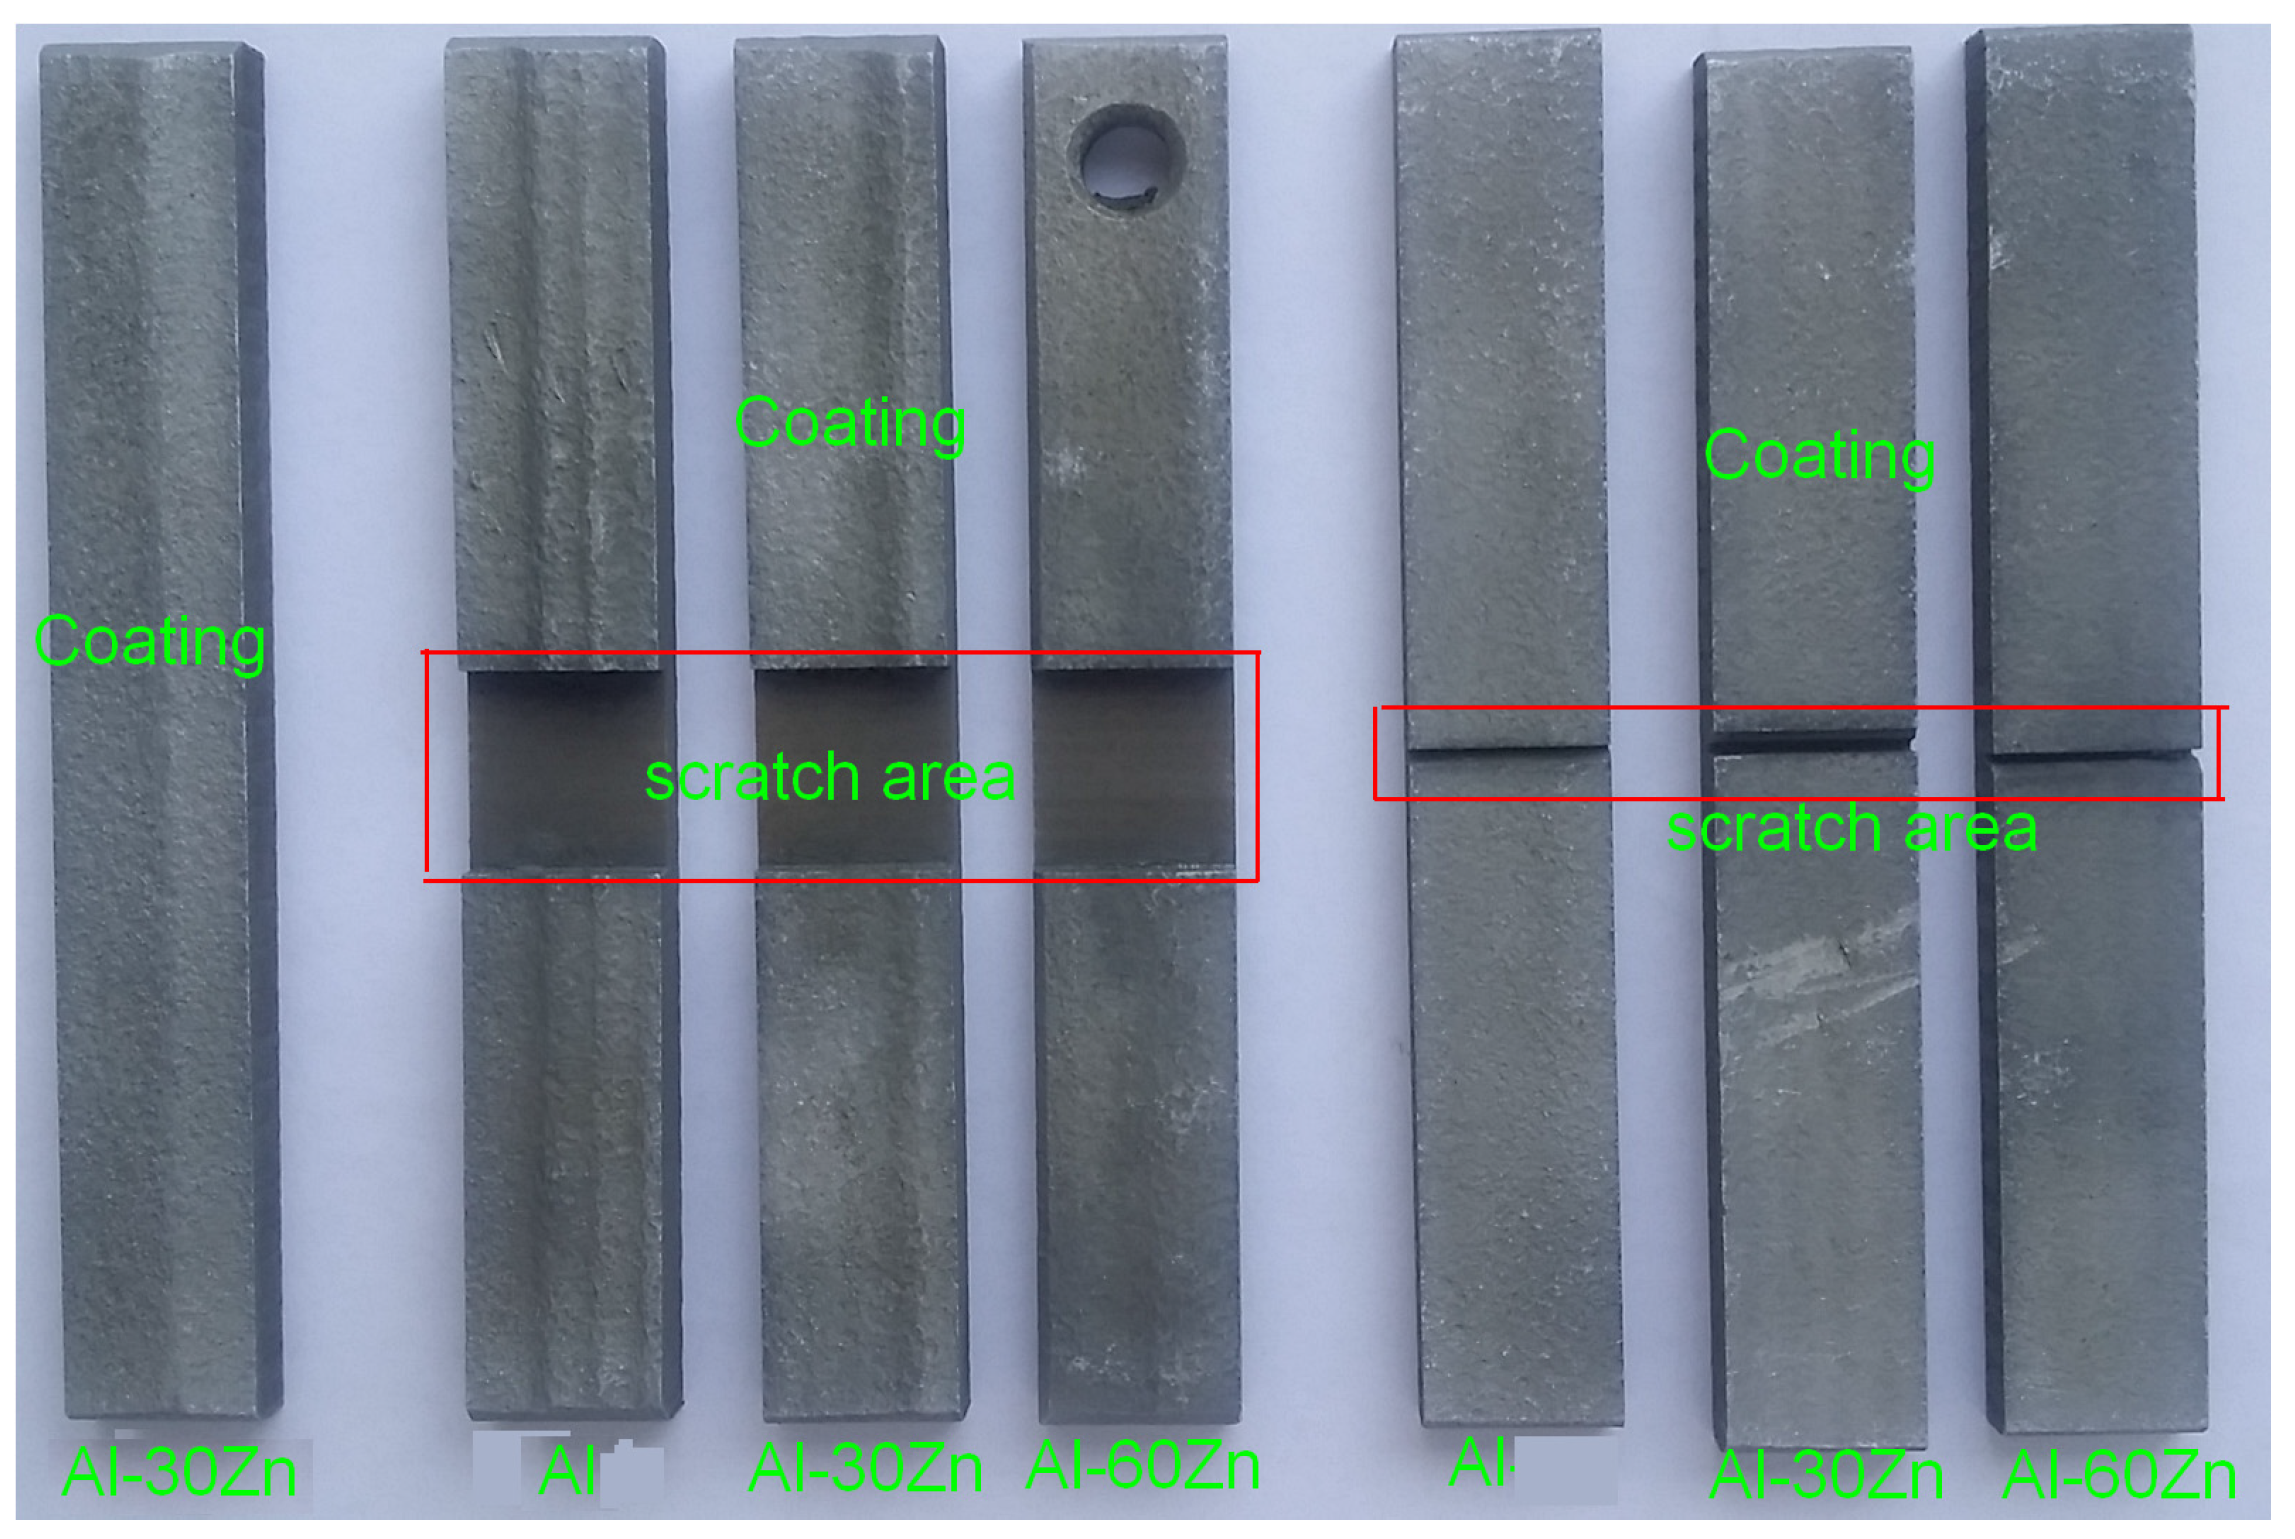
The samples with and without damage are shown in Figure 7. The surface of the coating was uneven, but the appearance of the surface indicates that it was in a good bonding condition. The average thickness of all coating samples was about 250 μm as examined by a thickness meter. Most of the thicknesses ranged from 220 to 300 μm—this has little influence on the electrochemical behavior of coating, since the porosity of the coating is low. The percentage of penetrated pores can be neglected.
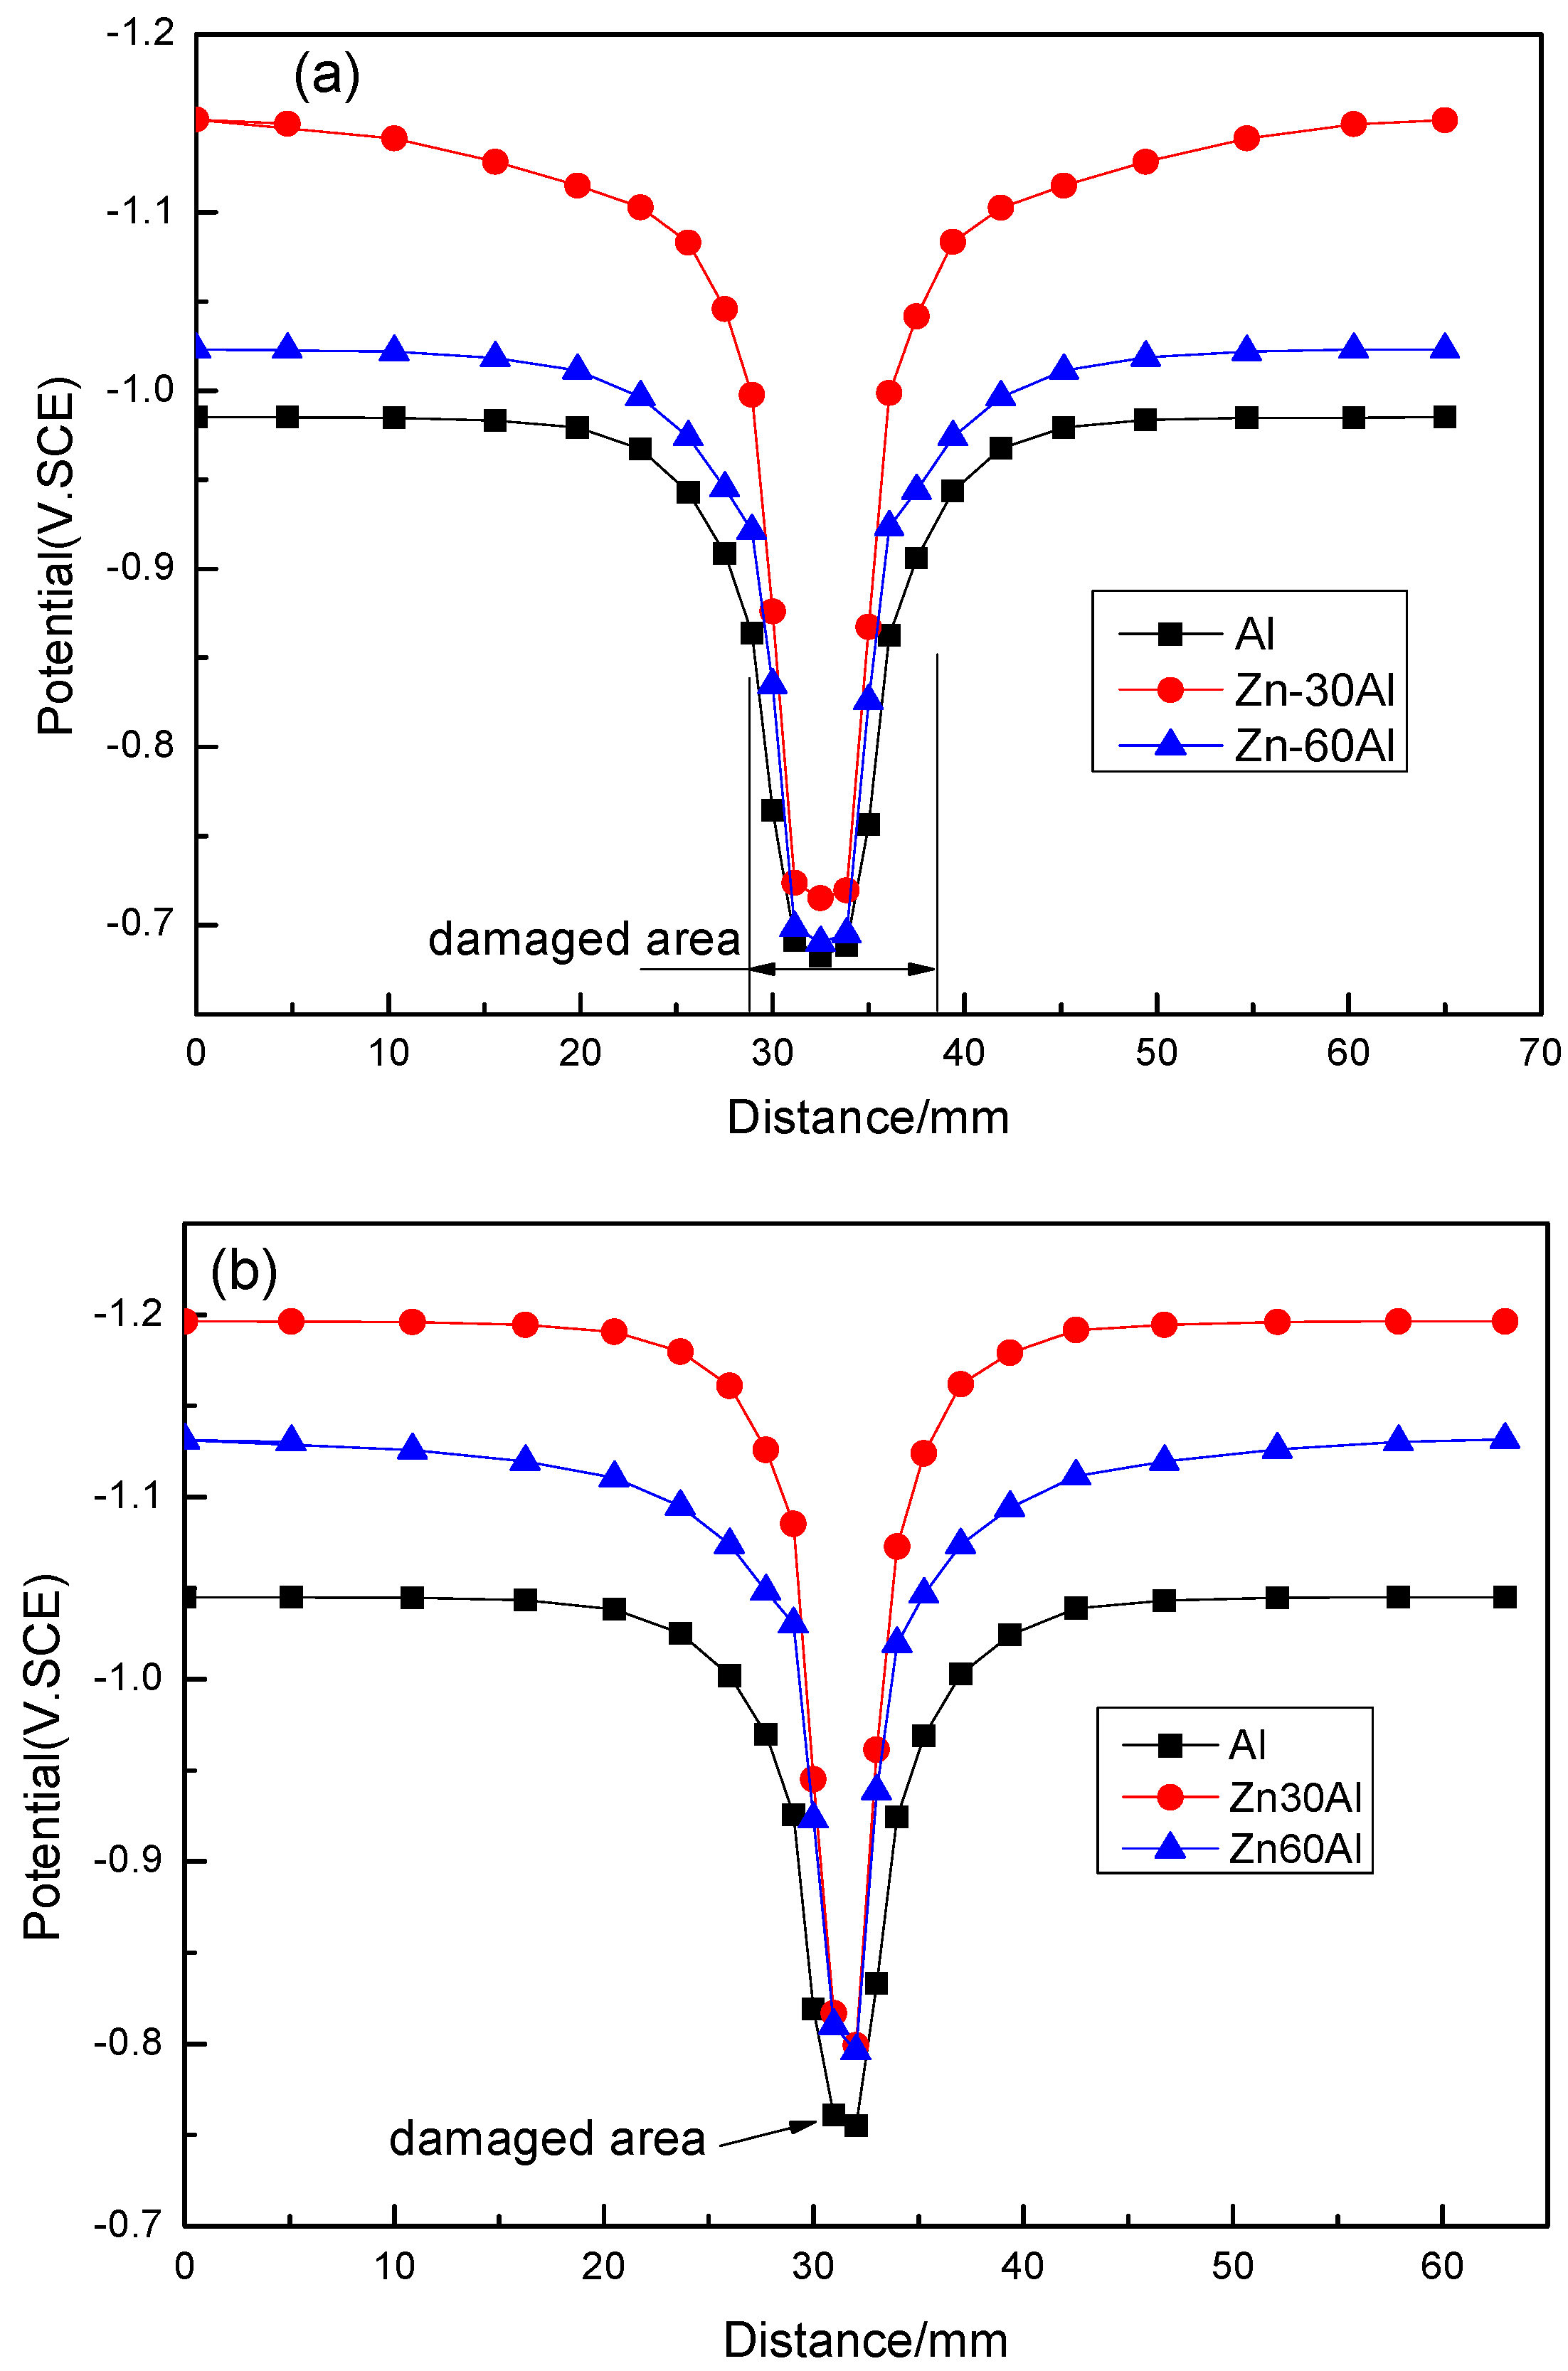
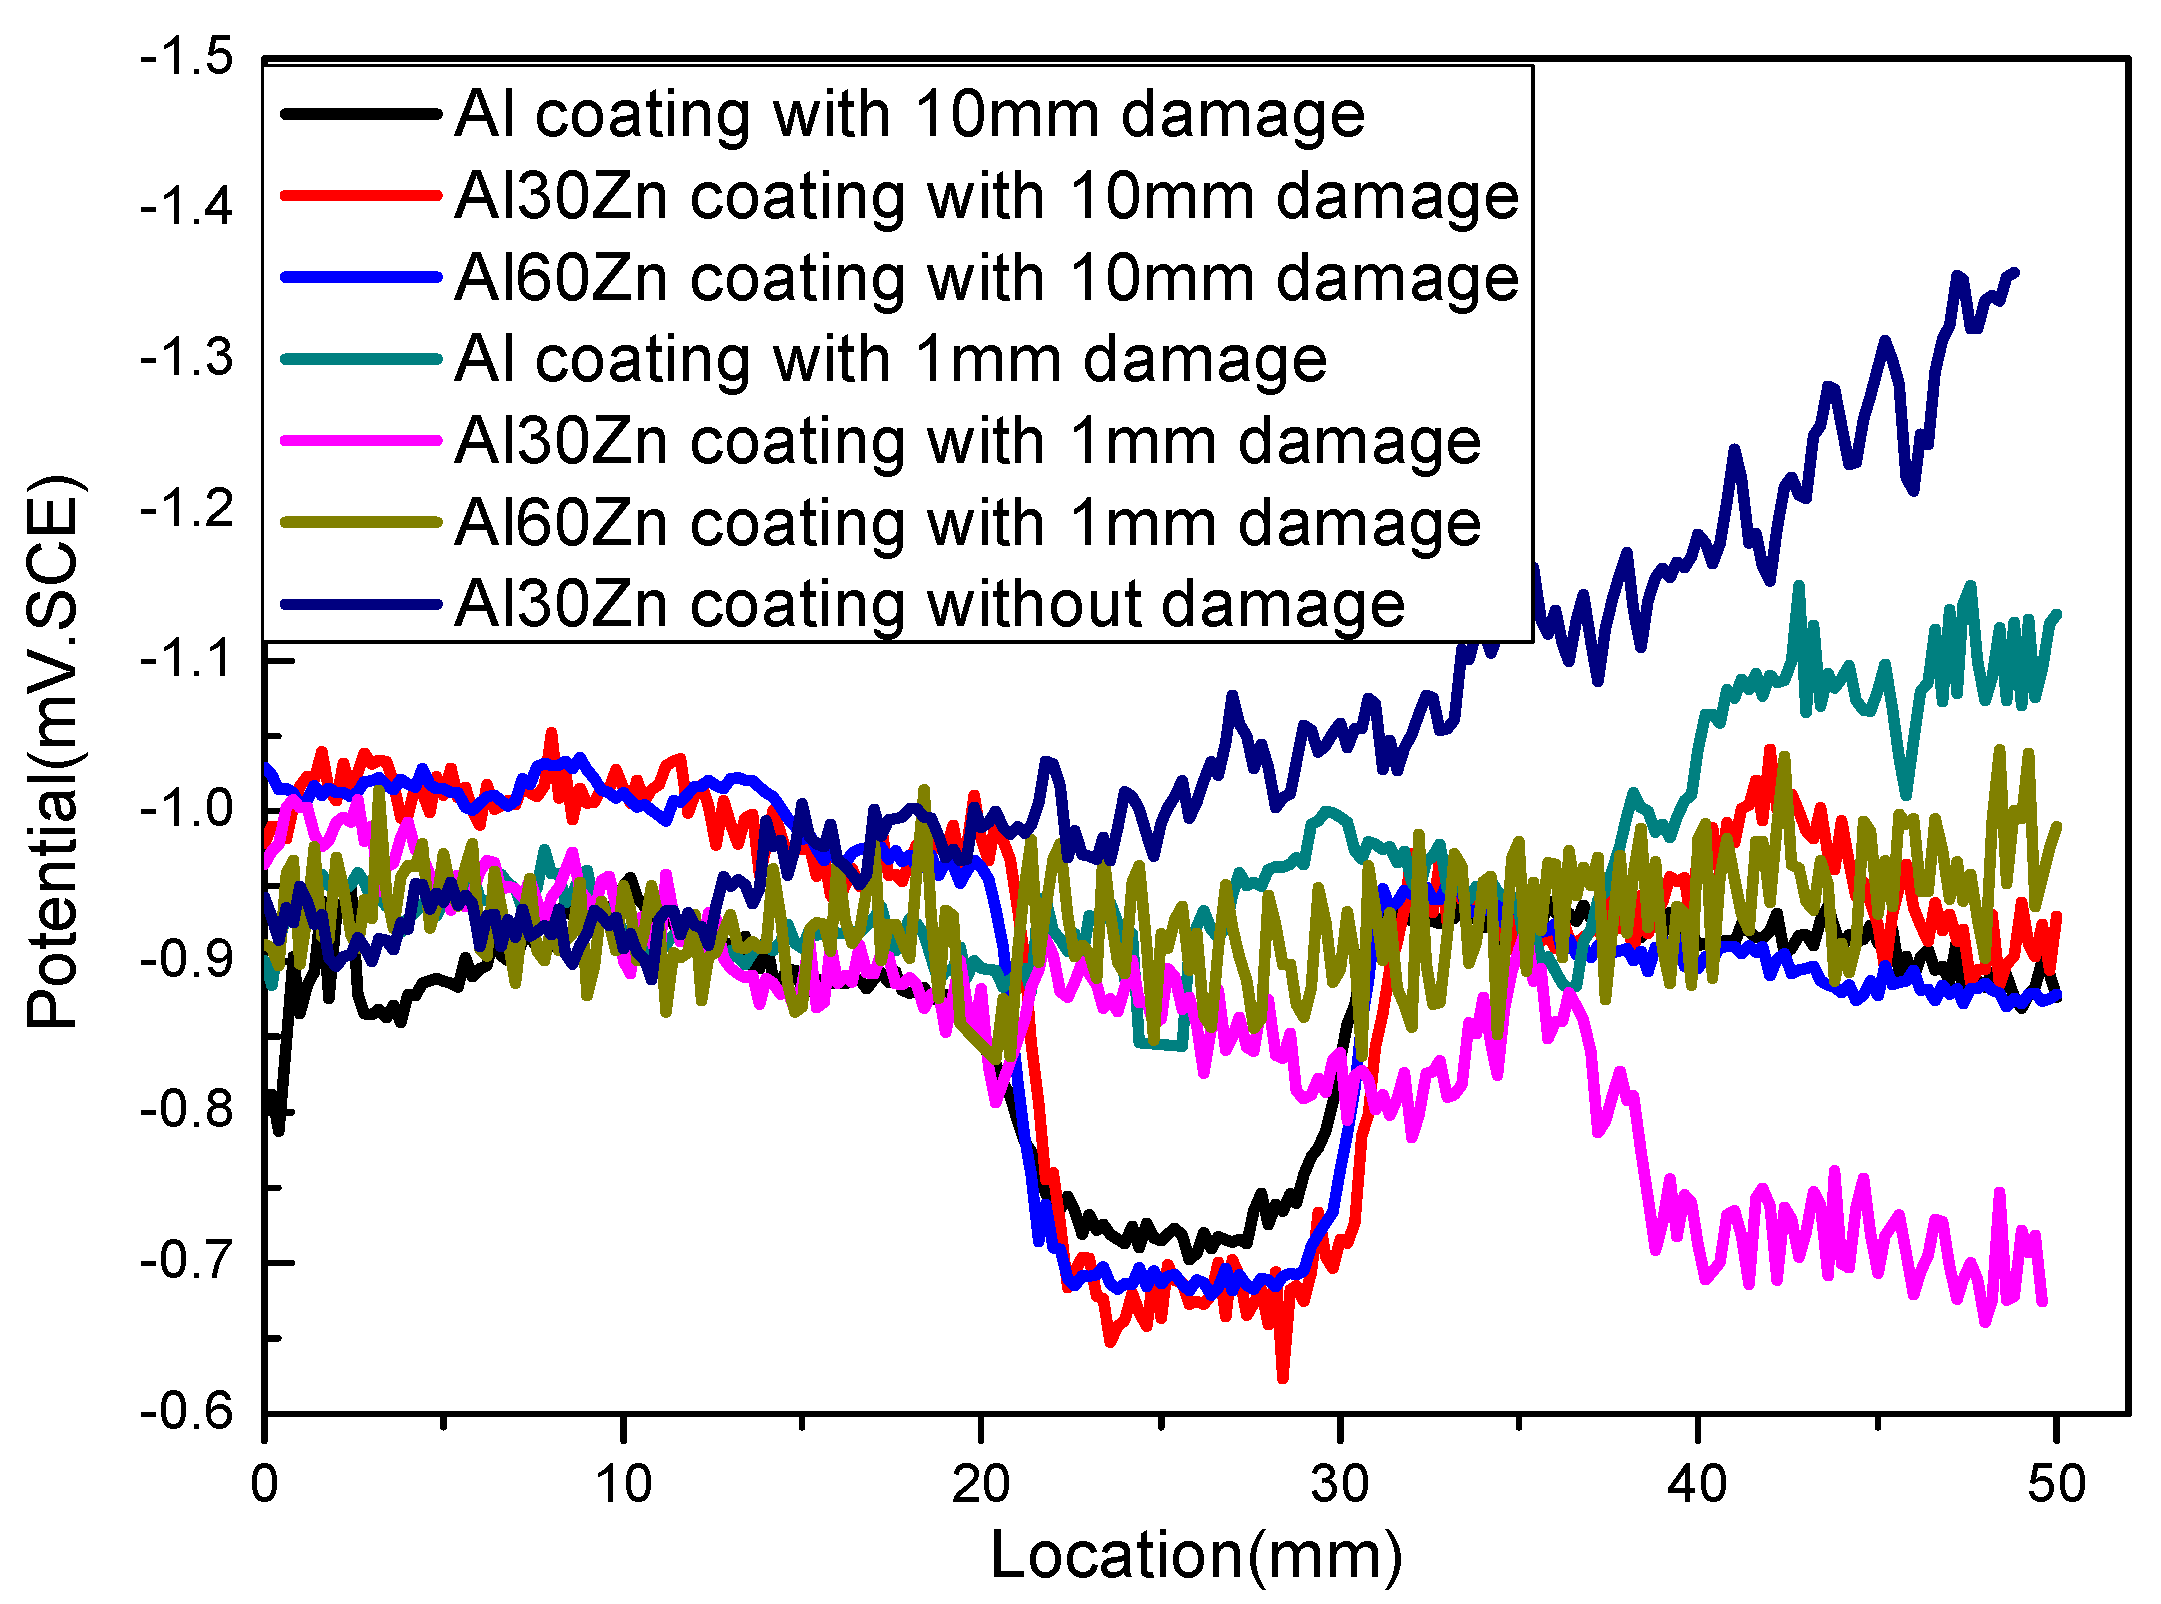
The potential distributions of different coatings with different damaged areas are shown in Figure 8 and Figure 9. It can be seen that the effective protection area is influenced by the ratio of coating to damaged area. When the damaged part is 1 mm in width, the lowest potential can be polarized to −0.8 V. When the damaged part is 10 mm in width, the lowest potential can be polarized to −0.72 V, slightly negative than the open circuit potential. It can be seen that the polarization zone and potential value for the 10 mm damage is narrower than 1 mm. This occurs because the 10 mm damaged sample had a small coating area and a large substrate area, which means that less current can be provided by the coating to polarize the larger substrate. According to standard DNV-RP-401 [21], the corrosion of Q235 can be completely prevented if the potential is polarized to −0.78 V (vs. SCE) or more negative. Apparently, cold-sprayed Al coating, Al30Zn coating, and Al60Zn coating can only provide sufficient protection for a narrow width of damaged area. For complete coating with inherent porosity, coating can provide effective protection since the pore is always far smaller than 1 mm. The SKP (scan Kelvin probe) data for damaged samples shown in Figure 9 indicates that the experimental results for 10 mm damaged samples are consistent with the simulation results. The test potential is about −0.70 to −0.75 V. The experimental results for the 1 mm damaged samples are consistent with the simulation results of the left part of the sample, but the right part of the data becomes fluctuating. At the damaged location, the most negative potential reaches to about −0.81 V. The undamaged Al30Zn coating potential ranges from −0.9 to −1.2 V, which may be due to some fluctuation in measurement.
3.3. Residual Corrosion Rate of the Q235 Steel Substrate
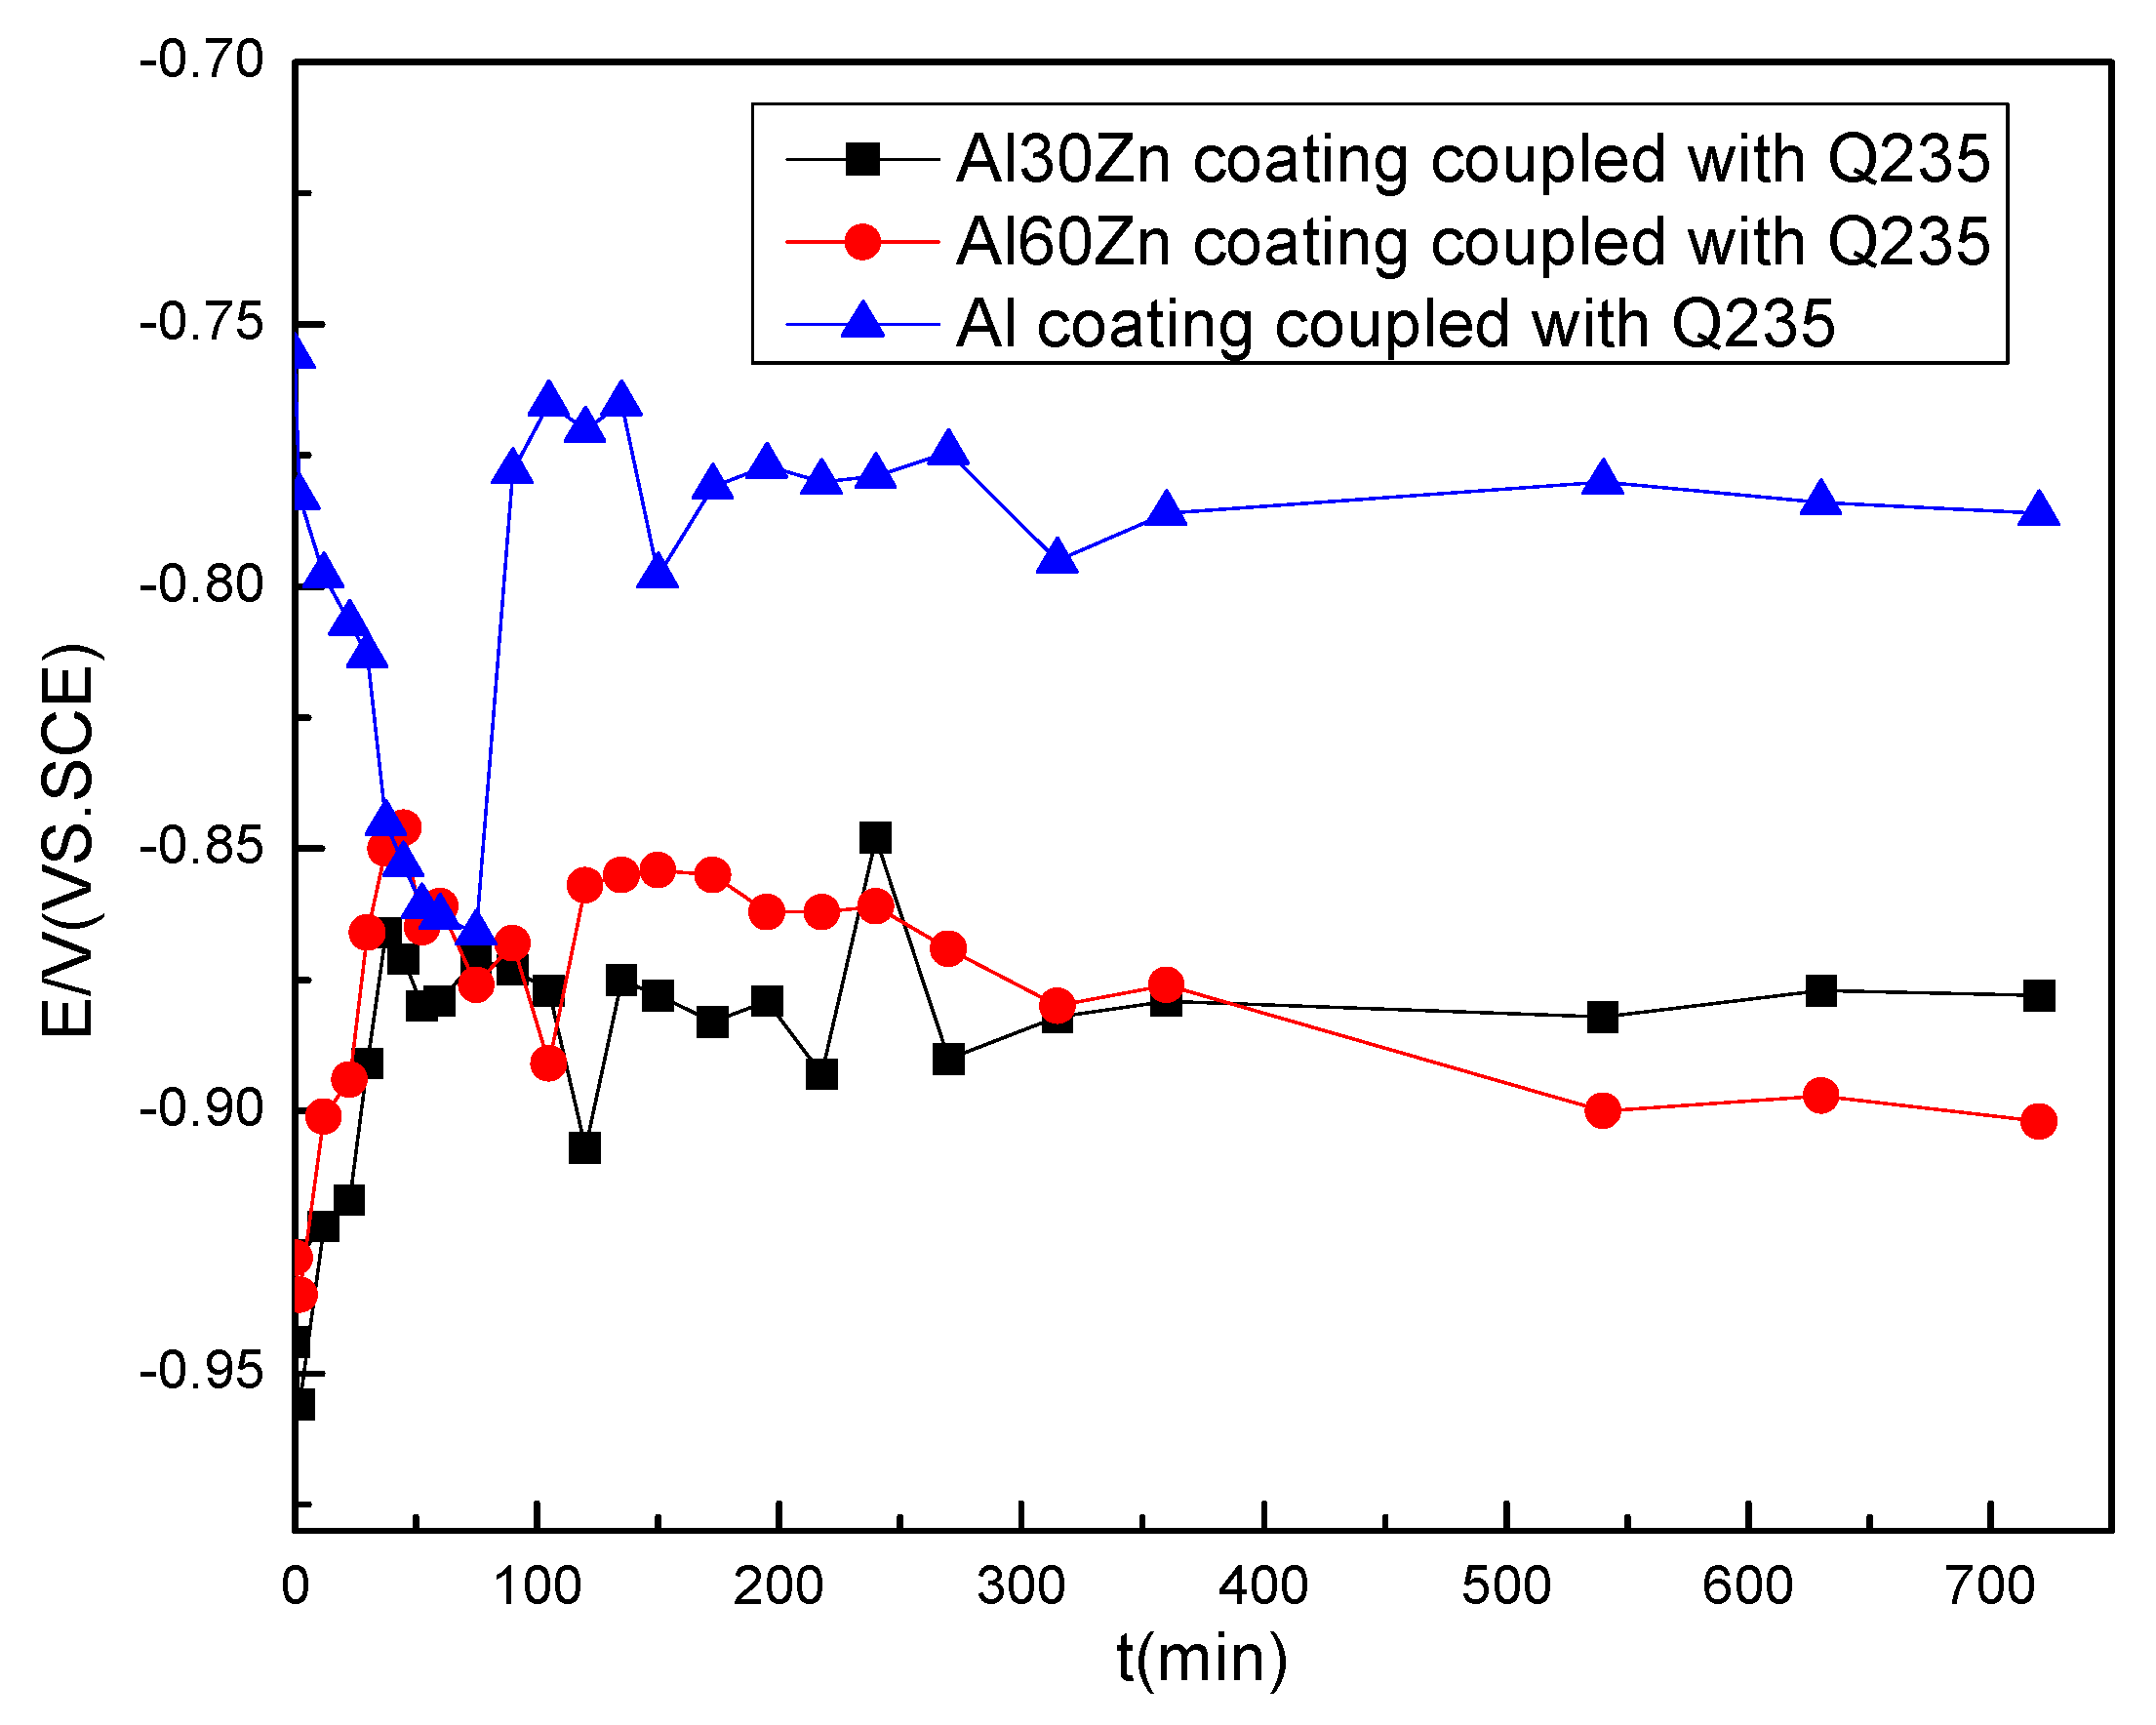
The mixed potential of Q235 steel and AlZn coatings in seawater is shown in Figure 10. The aluminum coating can only polarize the Q235 steel potential to about −0.80 V with the same area. The potential also indicates that all coupled samples can reach a stable potential state. Then the corrosion rate of the Q235 steel coupled with different coatings can be roughly estimated. The simulated corrosion rate of samples immersed in seawater is shown in Figure 11. According to Pourbaix photograph, the corrosion of steel will be halted as the potential is polarized to −0.78 V or more negative. Theoretically, the corrosion rate will decrease to about 10% when the potential is shift 100 mV in negative direction.
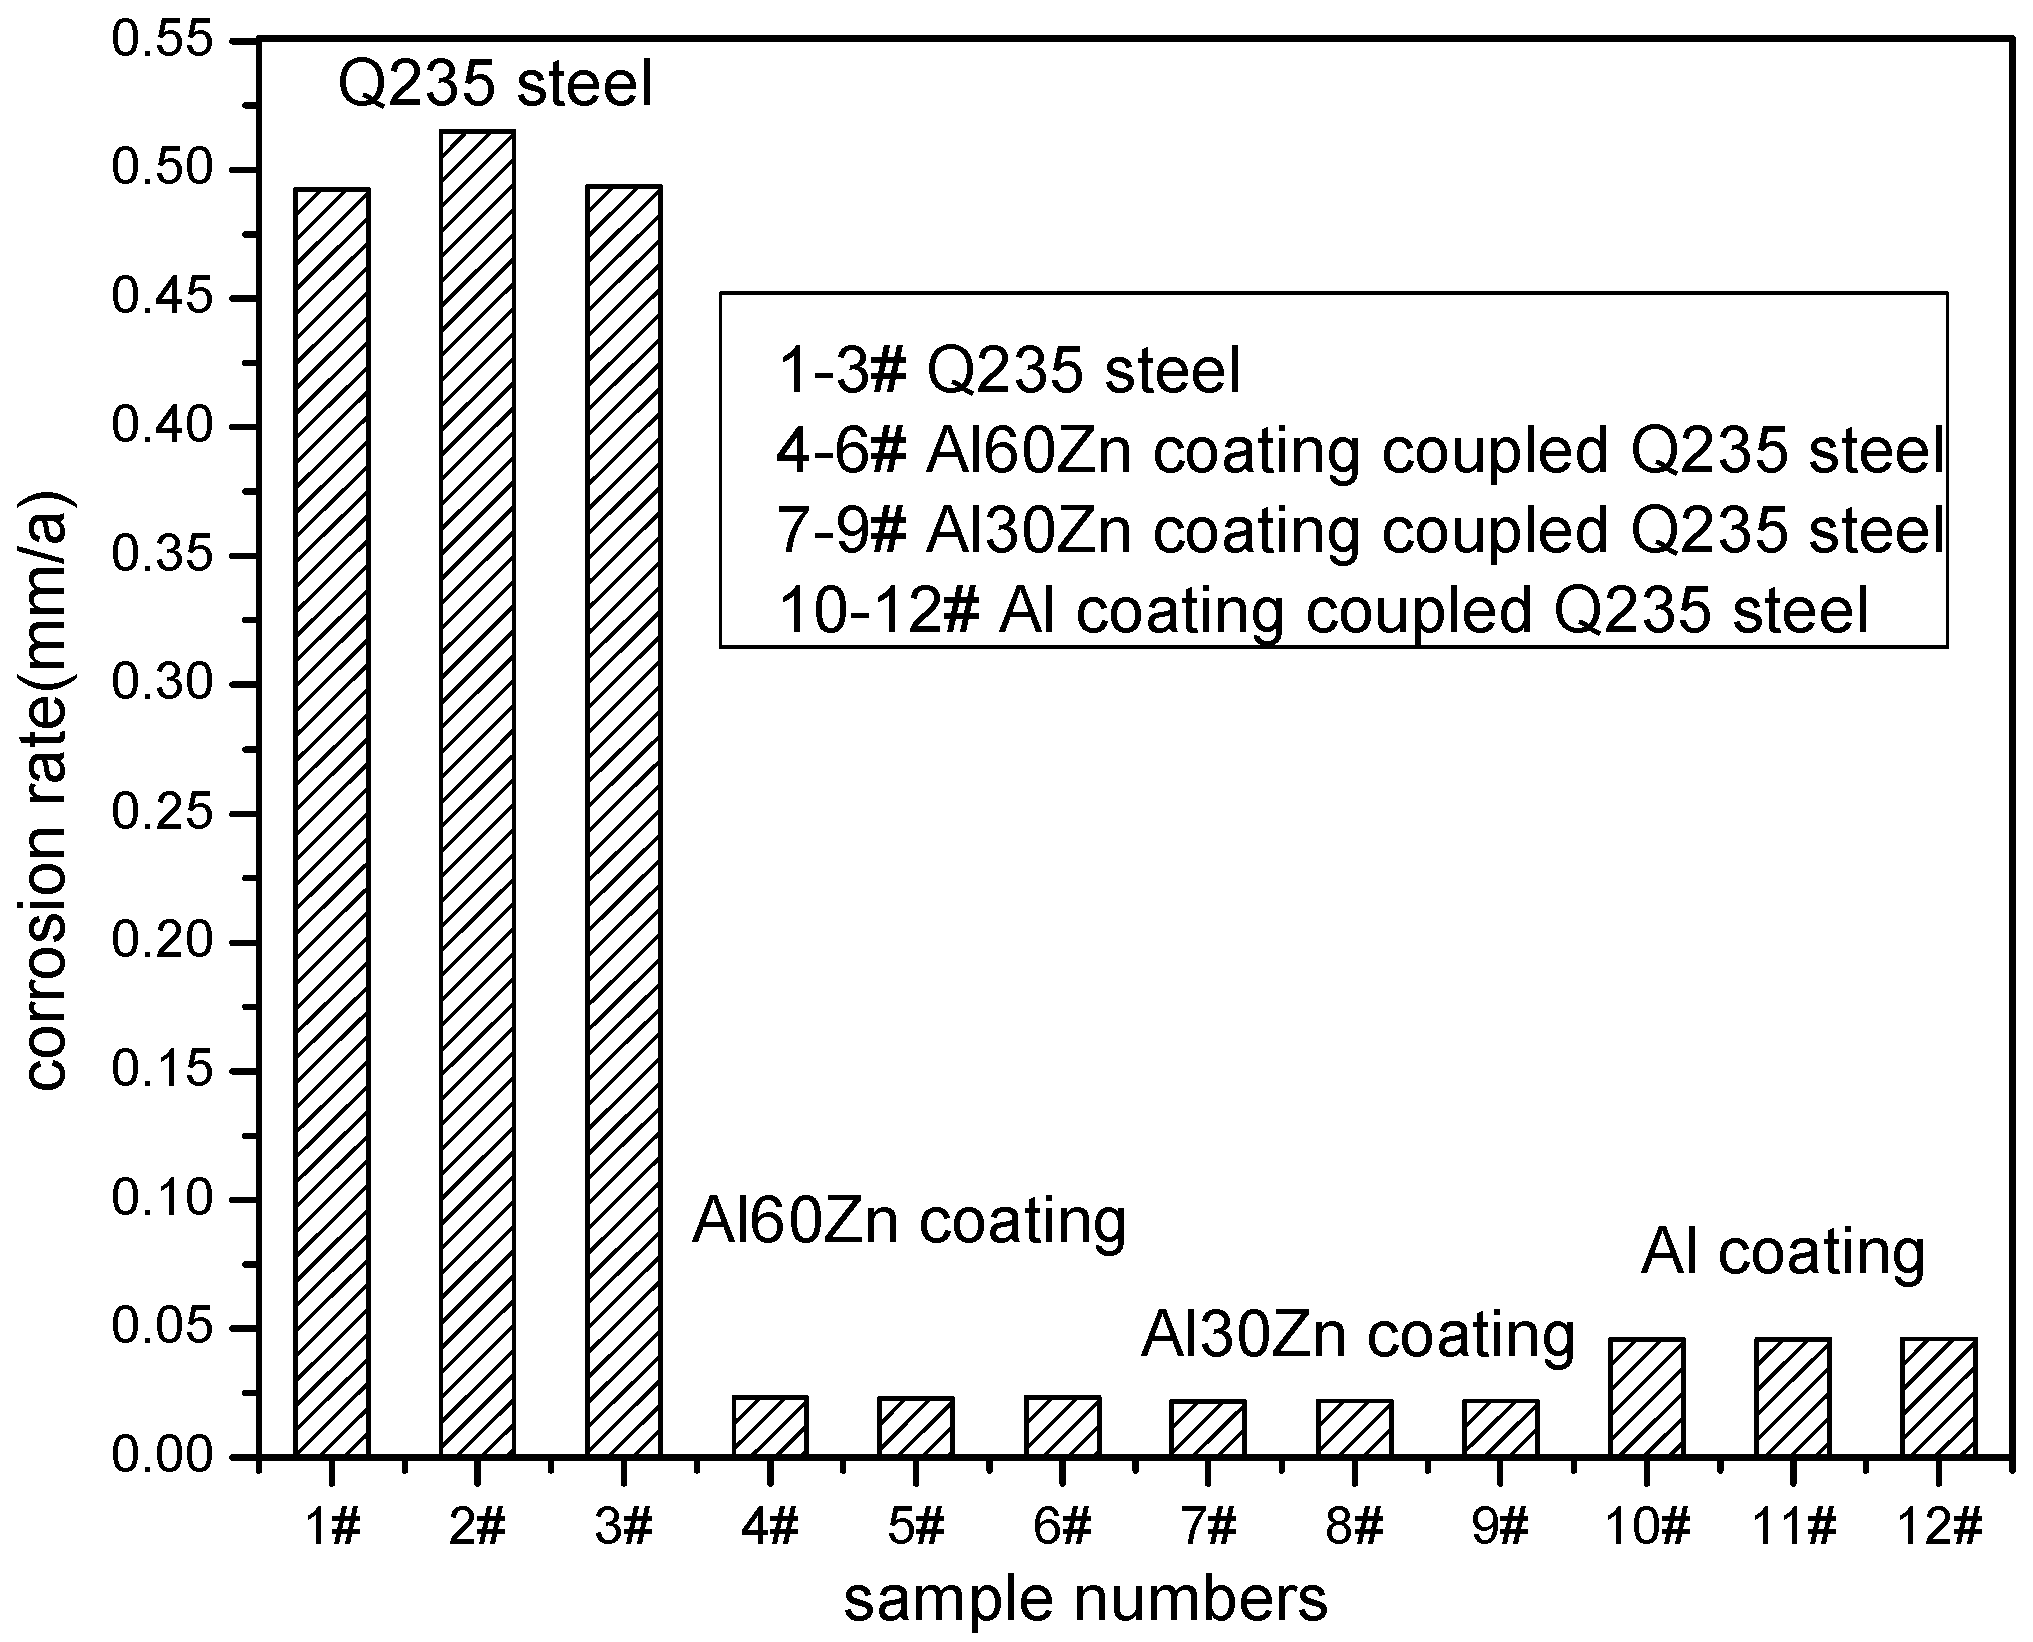
The corrosion rate of Q235 steel protected with different AlZn coatings is shown in Figure 12. It can be seen that the corrosion rate of Q235 steel in seawater is 0.496 mm/a. The corrosion rate of Q235 steel coupled with AlZn coating is about 0.028 mm/a. The corrosion rate of Q235 steel coupled with pure Al coating is about 0.046 mm/a. In the experiments, the corrosion rate of protected Q235 by Al coating is about 1/10 of Q235 steel without protection. The corrosion rate of Q235 steel protected with Al30Zn coating and Al60Zn coating is far less than 1/10 of Q235 steel without protection.
4. Discussion
Numerous studies have discussed the accuracy of potential in computational simulation, and it is thought that the calculation error can be controlled within ±5% for potential, although it is hard to obtain an accurate polarization curve [22]. The polarization behavior of metal in solution is influenced by many factors, such as gas bubbles, surface morphology, and distribution of corrosion products. The accuracy of Tafel extrapolation is dependent to the selection of potential range. The potential of a corrosion system is always stable with some 3–5 mV fluctuation; this 3–5 mV fluctuation will lead to a large deviation in calculating the corrosion current. So, the emphasis of this paper is the accuracy of the corrosion rate.
The residual corrosion rate of Q235 steel can be written as Equation (11) [23].
In which ic is the corrosion current density of metal under a controlled potential ηc. icorr is the corrosion current of metal under open circuit potential, which can be obtained by Tafel extrapolation from Figure 6. In this study, the corrosion rate of Q235 steel under open circuit potential is about 50 μA/cm2, and during the test period, the corrosion rate remains stable. Actually, the corrosion rate of Q235 in seawater varies in a large range [24].
The corresponding corrosion rate in depth is Rcorr (mm/a), which can be written as Equation (12) [25].
In which M is the molecular weight of ferrous element, i is the corrosion rate in current density (A/cm2), n is the number of electrons lost in the corrosion reaction, F is the Faraday constant (26.8 A·h), and ρ is the density of ferrous (7.8 g/cm3). Thus, the current density of Figure 6a corresponds to 0.585 mm/a. The simulated corrosion rate obtained from Figure 11a is about 5.02 μA/cm2 under the potential of about −0.78 V, 52.2 μA/cm2 under open circuit potential. The experimental data acquired from Figure 12 is about 0.4986 mm/a, corresponding to 42.62 μA/cm2. Although data obtained with these three methods deviates from real physical problems, it is valuable to make a comparison. Since the weight loss experiment is relatively accurate, the weight loss rate is set as a standard. Then, the deviation of corrosion rate obtained from Tafel extrapolation is about 26.7%. The deviation of corrosion rate from simulation is about 22.5%. As pointed out by Montoya [26], corrosion rate obtained by Tafel extrapolation has very large deviation because it is influenced by the selection of voltage ranges. The comparison between the corrosion rate of experimental data and the simulation results are listed in Table 2.
It can be seen that the deviation of the simulation results is larger than 10%. The largest deviation in these simulations is 27.7% when the potential is −0.78 V. These large deviations are attributed to the comparison method. The corrosion rate from experiments is an average value of 30 days. The simulated corrosion rate is the instantaneous value at 2 h. As time passes, calcareous deposits on the surface will decelerate the corrosion rate of Q235 steel. Then, the average corrosion value would certainly be smaller than the corrosion rate at 2 h. Thus, it is more reasonable to compare the experimental results to the average value of simulation results during 30 days. It worth noting that it is difficult to get an accurate polarization curve; to select a proper polarization curve is the key factor in a successful simulation. It is very hard to get the exact polarization curves of the calcareous deposits-covered Q235 steel since the calcareous deposits thickness varies under different polarized potentials with time.
5. Conclusions
Based on the results of this paper, the following conclusions can be drawn.
- Computational simulation method can be used to clarify the cathodic protection effect of cold-sprayed AlZn coating on steel substrate. The deviation is large in predicting the corrosion rate of coating-protected Q235 steel. More conditions must be taken into consideration to get more accurate results, such as calcareous deposits on steel and corrosion products of coating.
- Cold-sprayed AlZn coating can provide effective cathodic protection for substrate if the coating is in complete form, while it cannot provide effective cathodic protection if the damaged area is larger than 1 mm in width.
- The Al30Zn coating has best cathodic protection effect among three kinds of coating. All results did not take the barrier effect of corrosion products into consideration, which will influence the polarization behavior of AlZn coating. Additionally, in the future, the calcareous deposits on the Q235 surface will be taken into account to get more accurate simulation results.
Acknowledgments
This work had been supported by the Research Fund of State Key Laboratory for Marine Corrosion and Protection of Luoyang Ship Material Research Institute (LSMRI) under the contract No. 9140C2501060C25002.
Author Contributions
Hongren Wang and Guosheng Huang conceived and designed the experiments; Xiangbo Li performed the experiments and analyzed the data; Xiaodan Lou and Lukuo Xing carried out the simulation work; Guosheng Huang wrote the paper.
Conflicts of Interest
The authors declare no conflict of interest.
References
- Kuroda, S.; Takemoto, M.; Kawakita, J. An 18 year exposure test of thermal-sprayed Zn, Al, and Zn-Al coatings in marine environment. Corrosion 2006, 62, 860–863. [Google Scholar] [CrossRef]
- Esfahani, E.; Salimijazi, H.; Golozar, M.; Mostaghimi, J.; Pershin, L. Study of corrosion behavior of arc Sprayed Aluminum Coating on Mild Steel. J. Therm. Spray Technol. 2012, 21, 1195–1202. [Google Scholar] [CrossRef]
- Mcmurray, H.; Magill, S.; Jeffs, B. Scanning reference electrode technique as tool for investigating localised corrosion phenomena in galvanised steels. Ironmak. Steelmak. 1996, 23, 183–188. [Google Scholar]
- Fujita, S.; Mizuno, D. Corrosion and corrosion test methods of zinc coated steel sheets on automobiles. Corros. Sci. 2007, 49, 211–219. [Google Scholar] [CrossRef]
- Yadav, A.; Nishikata, A.; Tsuru, T. Degradation mechanism of galvanized steel in wet–dry cyclic environment containing chloride ions. Corros. Sci. 2004, 46, 361–376. [Google Scholar] [CrossRef]
- Yadav, A.; Nishikata, A.; Tsuru, T. Electrochemical impedance study on galvanized steel corrosion under cyclic wet–dry conditions-influence of time of wetness. Corros. Sci. 2004, 46, 169–181. [Google Scholar] [CrossRef]
- Nishikata, A.; Ichihara, Y.; Tsuru, T. An application of electrochemical impedance spectroscopy to atmospheric corrosion study. Corros. Sci. 1995, 37, 897–911. [Google Scholar] [CrossRef]
- Chung, S.; Sung, S.; Hsien, C.; Hsih, H. Application of EIS to the initial stages of atmospheric zinc corrosion. J. Appl. Electrochem. 2000, 30, 607–615. [Google Scholar] [CrossRef]
- Ohtsuka, T. Corrosion products of zinc coating layer in the presence of NaCl precipitates under atmospheric environments. Univ. Read. 2004, 17, 1149–1152. [Google Scholar]
- Volovitch, P.; Allely, C.; Ogle, K. Understanding corrosion via corrosion product characterization: I. Case study of the role of mg alloying in Zn–Mg coating on steel. Corros. Sci. 2009, 51, 1251–1262. [Google Scholar] [CrossRef]
- Liu, C.S.; Cheng, J.W.; Zheng, J.X. Numerical simulation of gas-particle two phase flow in the process of cold spraying aluminum zinc-base alloy powder. Appl. Mech. Mater. 2010, 37–38, 735–738. [Google Scholar] [CrossRef]
- Liang, Y.L.; Wang, Z.B.; Zhang, J.B. Formation of interfacial compounds and the effects on stripping behaviors of a cold-sprayed Zn–Al coating on interstitial-free steel. Appl. Surf. Sci. 2015, 340, 89–95. [Google Scholar] [CrossRef]
- Li, N.; Li, W.Y.; Yang, X.W.; Alexopoulos, N.D.; Niu, P.L. Effect of powder size on the long-term corrosion performance of pure aluminium coatings on mild steel by cold spraying. Mater. Corros. 2017, 68, 546–551. [Google Scholar] [CrossRef]
- Volovitch, P.; Allely, C.; Ogle, K. Understanding Corrosion via Corrosion Product Characterization: II. Role of Alloying Elements in Improving the Corrosion Resistance of Zn–Al–Mg Coatings on Steel. Corros. Sci. 2011, 53, 2437–2445. [Google Scholar] [CrossRef]
- Durstewitz, C.B.; Almerayacalderon, F.; Jaquez, R.N.; Tiburcio, C.F.; Villafae, A.M. Simulation and modelling of cathodic protection systems by the finite elements and the boundary elements methods. Port. Electrochim. Acta 2005, 23, 123–137. [Google Scholar] [CrossRef]
- Santos, W.; Santiago, J.; Telles, J. Optimal positioning of anodes and virtual sources in the design of cathodic protection systems using the method of fundamental solutions. Eng. Anal. Bound. Elem. 2014, 46, 67–74. [Google Scholar] [CrossRef]
- Xing, S.; Li, Y.; Song, H.; Yan, Y.; Sun, M. Optimization the quantity, locations and output currents of anodes to improve cathodic protection effect of semi-submersible crane vessel. Ocean Eng. 2016, 113, 144–150. [Google Scholar] [CrossRef]
- Wang, W.; Yi, J.; Chen, L.; Li, X. Numerical simulation of transient process for corrosion environment in coating crevice with cathodic protection. J. Comput. Theor. Nanosci. 2012, 9, 1395–1398. [Google Scholar] [CrossRef]
- Miltiadou, P.; Wrobel, L. A BEM-based genetic algorithm for identification of polarization curves in cathodic protection systems. Int. J. Numer. Methods Eng. 2002, 54, 159–174. [Google Scholar] [CrossRef]
- Okada, N.; Takebayashi, M.; Matsumoto, M.; Kimoto, M.; Kodou, T. Numerical analysis of cathodic protection distance for steel-zinc couple under thin layer electrolytes (Surface Treatment and Corrosion). Tetsu Hagane 2006, 92, 667–675. [Google Scholar] [CrossRef]
- Standard DNV-RP-401: Cathodic Protection Design. Available online: http://rules.dnvgl.com/docs/pdf/DNV/codes/docs/2011-04/RP-B401.pdf (accessed on 8 May 2017).
- Yadav, A.; Katayama, H.; Noda, K. Surface potential distribution over a zinc/steel galvanic couple corroding under thin layer of electrolyte. Electrochim. Acta 2007, 52, 3121–3129. [Google Scholar] [CrossRef]
- Ou, K.; Wu, J. Effect of calcareous deposits formation on the hydrogen absorption of steel. Mater. Chem. Phys. 1997, 48, 52–55. [Google Scholar] [CrossRef]
- Mueller, W.A. Theory of the polarization curve technique studying corrosion and electrochemical protection. Can. J. Chem. 2011, 38, 576–587. [Google Scholar] [CrossRef]
- Murakami, D.; Seri, O.; Shimamura, R.; Kimura, M. Polarization curve and its resistance curve of Galvanically-Coupled Al/Cu specimen as simulation of bimetallic corrosion. J. Jpn. Inst. Light Met. 2015, 65, 389–395. [Google Scholar] [CrossRef]
- Montoya, R.; Rendon, O.; Genesca, J. Mathematical simulation of a cathodic protection system by finite element method. Mater. Corros. 2005, 56, 404–411. [Google Scholar] [CrossRef]
Figure 1.
The schematic of protection effects of the cold-sprayed AlZn coating in solution.
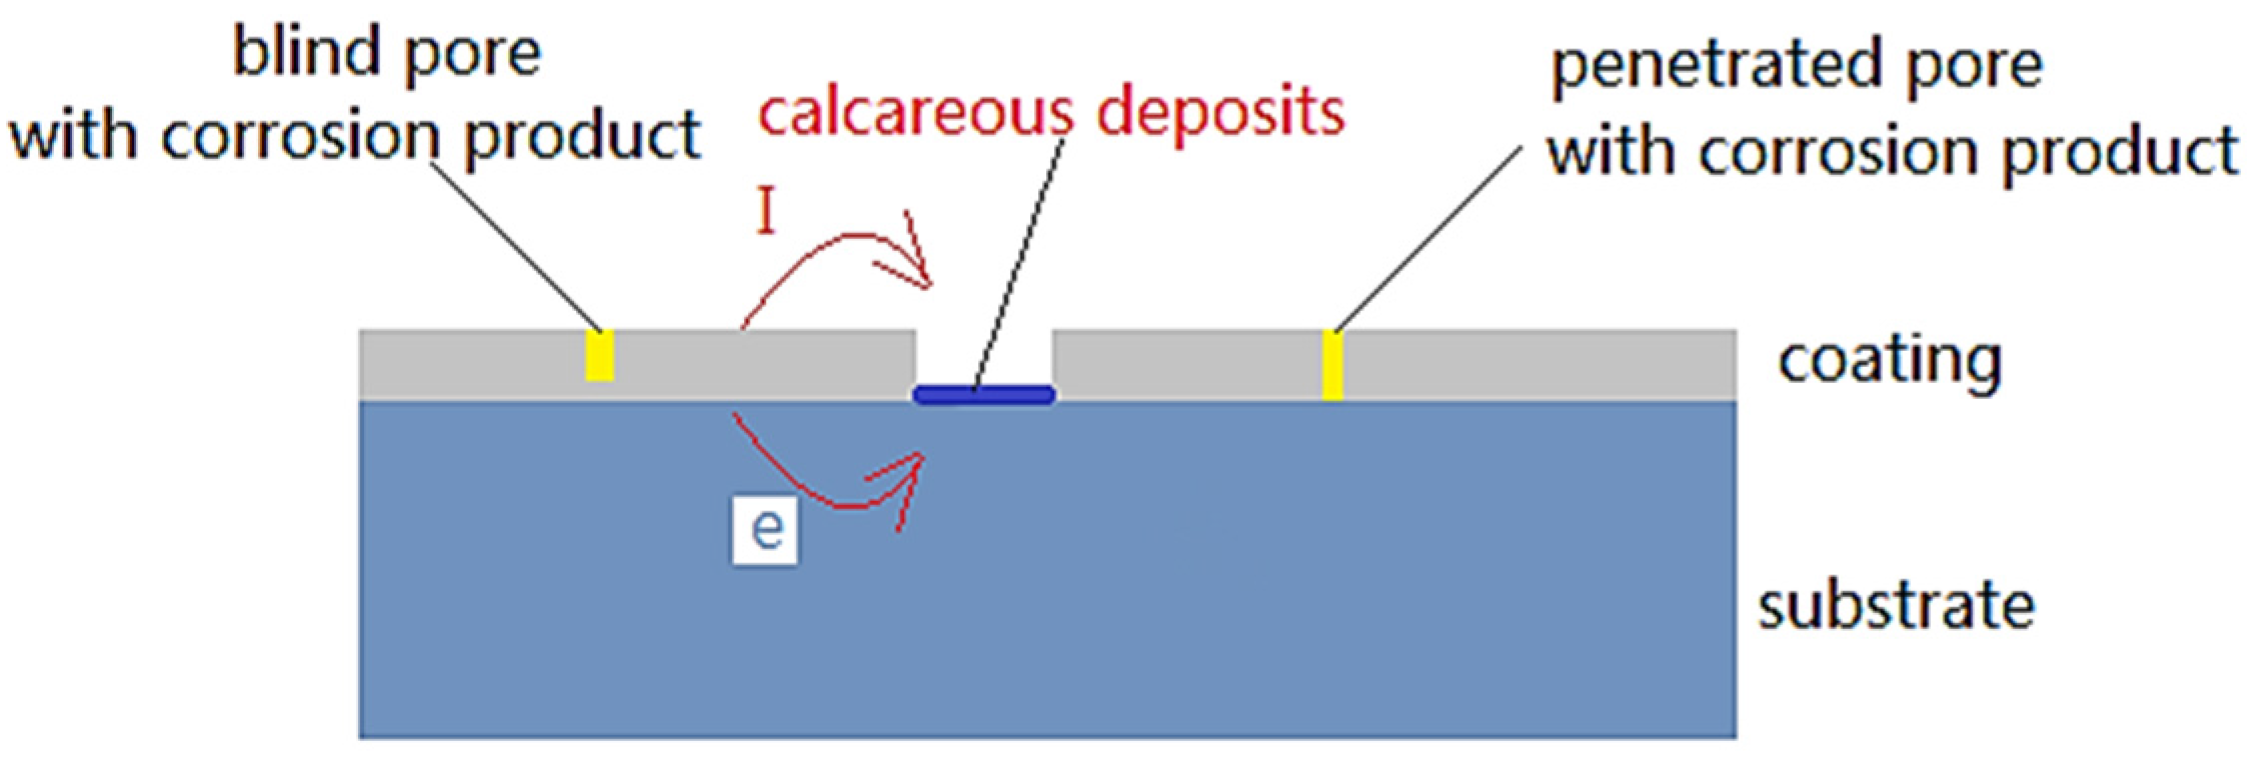
Figure 2.
Schematic of computational domain for studying the cathodic protection effect: (a) whole simulation domain; (b) the surface of damaged coating samples.
Figure 2.
Schematic of computational domain for studying the cathodic protection effect: (a) whole simulation domain; (b) the surface of damaged coating samples.

Figure 3.
Meshing strategies for computational domain: (a) the surface of whole simulation domain; (b) the surface of the damaged coating sample.
Figure 3.
Meshing strategies for computational domain: (a) the surface of whole simulation domain; (b) the surface of the damaged coating sample.
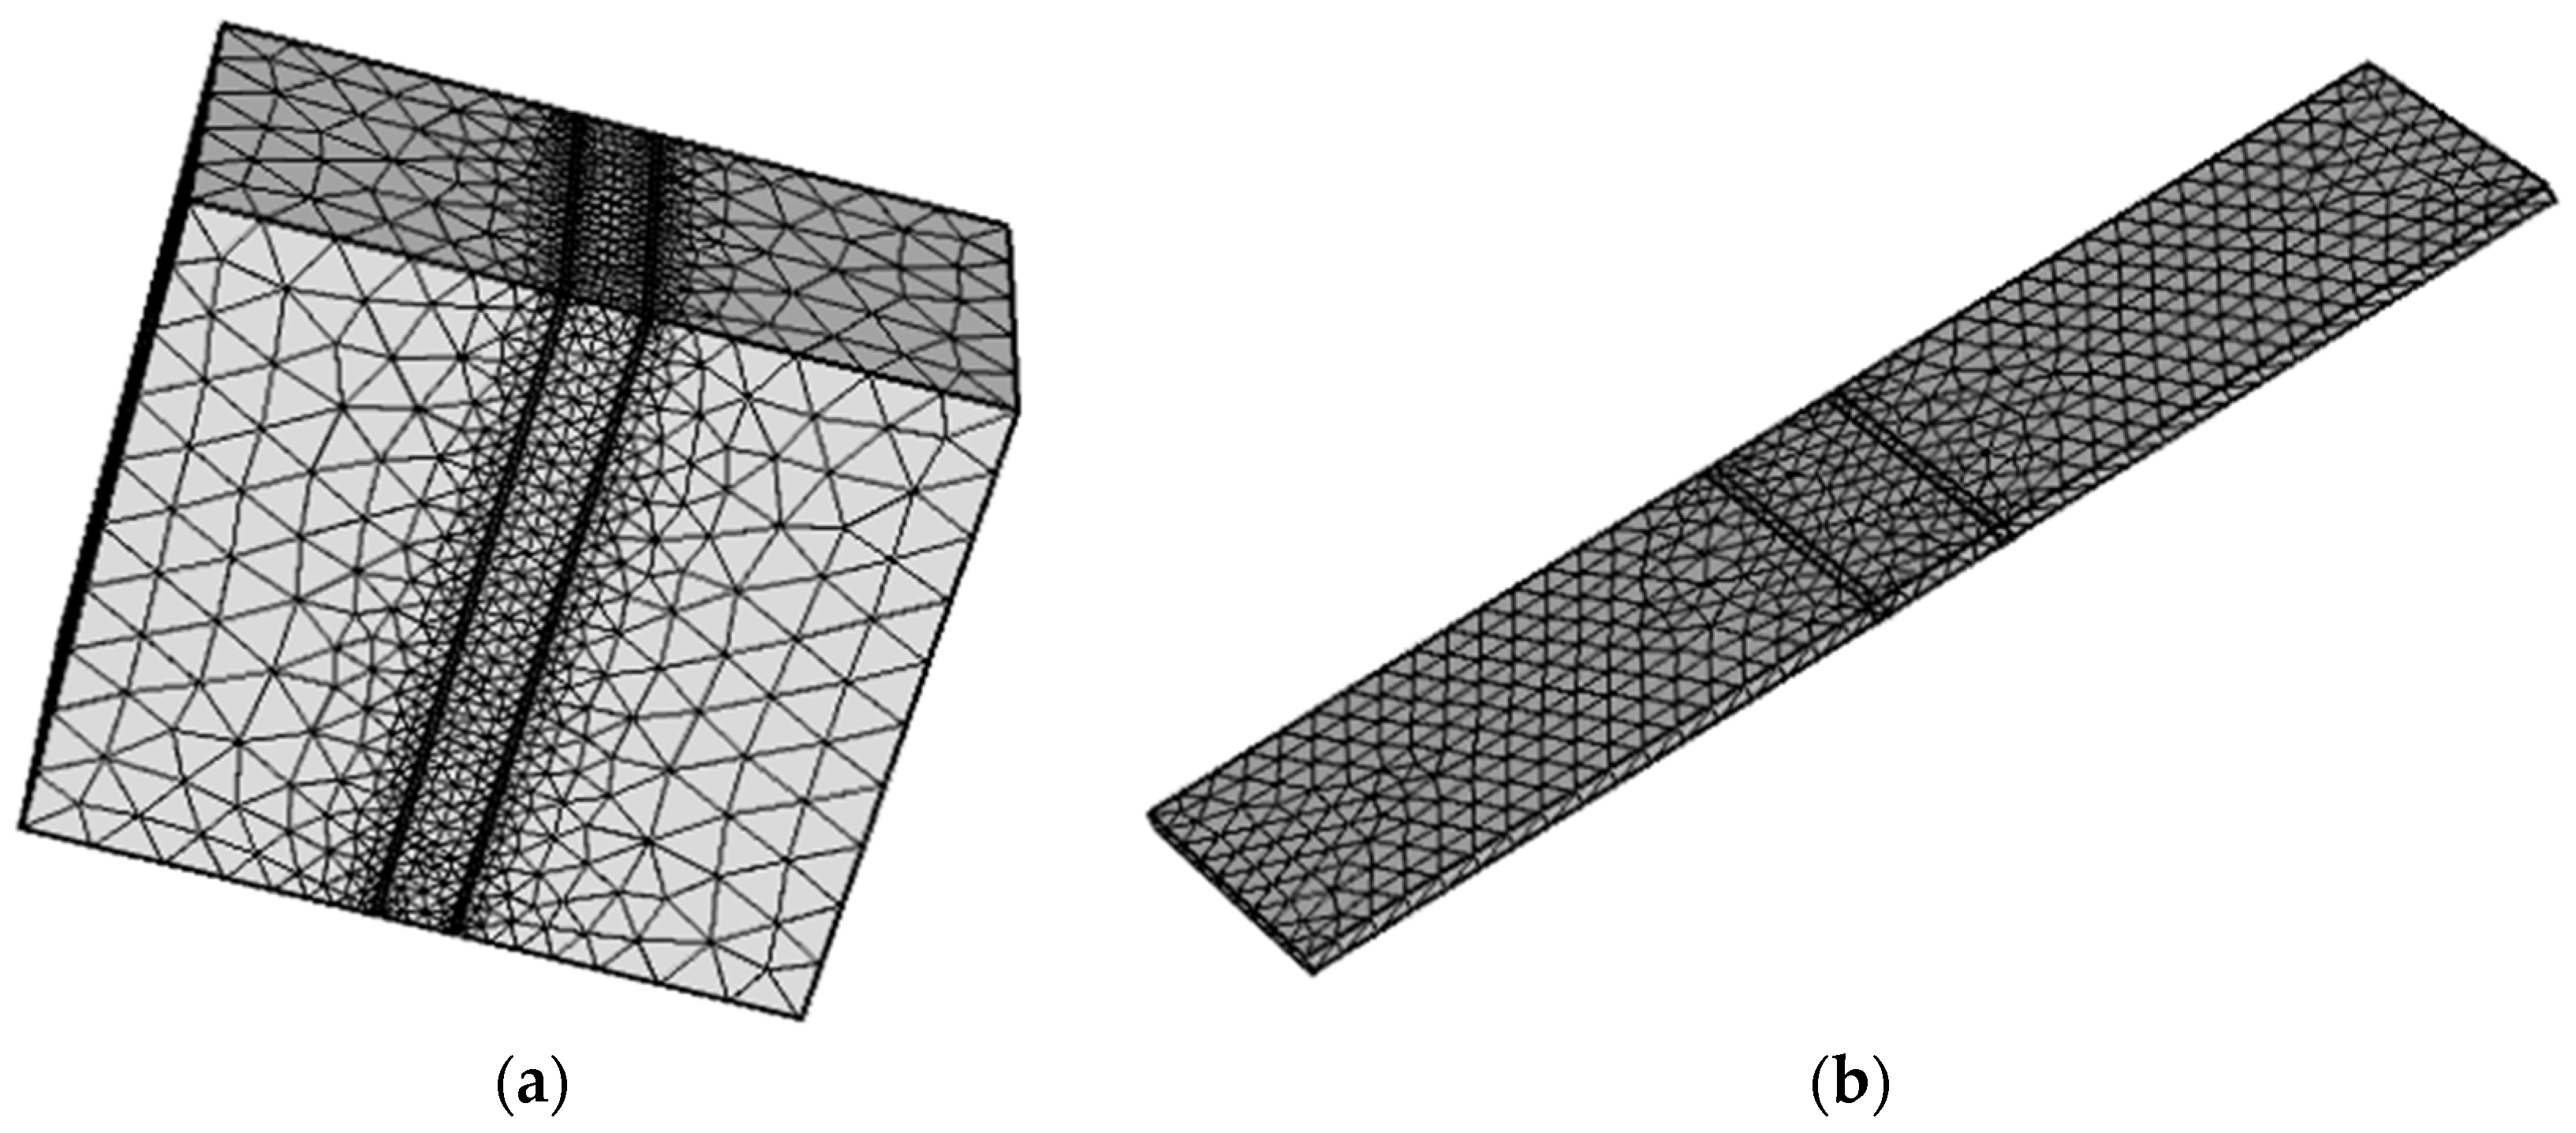
Figure 4.
Photograph of equipment of low-pressure cold spray system Dymet 413 and its nozzle structure.
Figure 4.
Photograph of equipment of low-pressure cold spray system Dymet 413 and its nozzle structure.

Figure 5.
The schematic of cathodic protection experiments in seawater for Q235 steel and AlZn composites coating system.
Figure 5.
The schematic of cathodic protection experiments in seawater for Q235 steel and AlZn composites coating system.

Figure 6.
Electrochemical behavior of samples: (a) Variation of open circuit potential of different AlZn coatings with time in seawater; (b) Potentiodynamic polarization curves of AlZn coatings and Q235 steel in seawater after 2 h immersion. SCE: saturated calomel electrode.
Figure 6.
Electrochemical behavior of samples: (a) Variation of open circuit potential of different AlZn coatings with time in seawater; (b) Potentiodynamic polarization curves of AlZn coatings and Q235 steel in seawater after 2 h immersion. SCE: saturated calomel electrode.


Figure 7.
Photograph of cold-sprayed AlZn coatings with different scratch areas.

Figure 8.
The potential distribution on different cold-sprayed AlZn coatings with different damaged areas after 2 h immersion along the sample: (a) coatings with 10 mm damaged area; (b) coatings with 1 mm damaged area. SCE: saturated calomel electrode.
Figure 8.
The potential distribution on different cold-sprayed AlZn coatings with different damaged areas after 2 h immersion along the sample: (a) coatings with 10 mm damaged area; (b) coatings with 1 mm damaged area. SCE: saturated calomel electrode.

Figure 9.
The potential distribution of the different cold-sprayed AlZn coatings with different damaged areas after 2 h immersion collected by scan Kelvin probe (SKP) data (calibrated by SCE).
Figure 9.
The potential distribution of the different cold-sprayed AlZn coatings with different damaged areas after 2 h immersion collected by scan Kelvin probe (SKP) data (calibrated by SCE).

Figure 10.
Variation of mixed polarized potential of Q235 steel coupled with different AlZn coatings with time in seawater.
Figure 10.
Variation of mixed polarized potential of Q235 steel coupled with different AlZn coatings with time in seawater.

Figure 11.
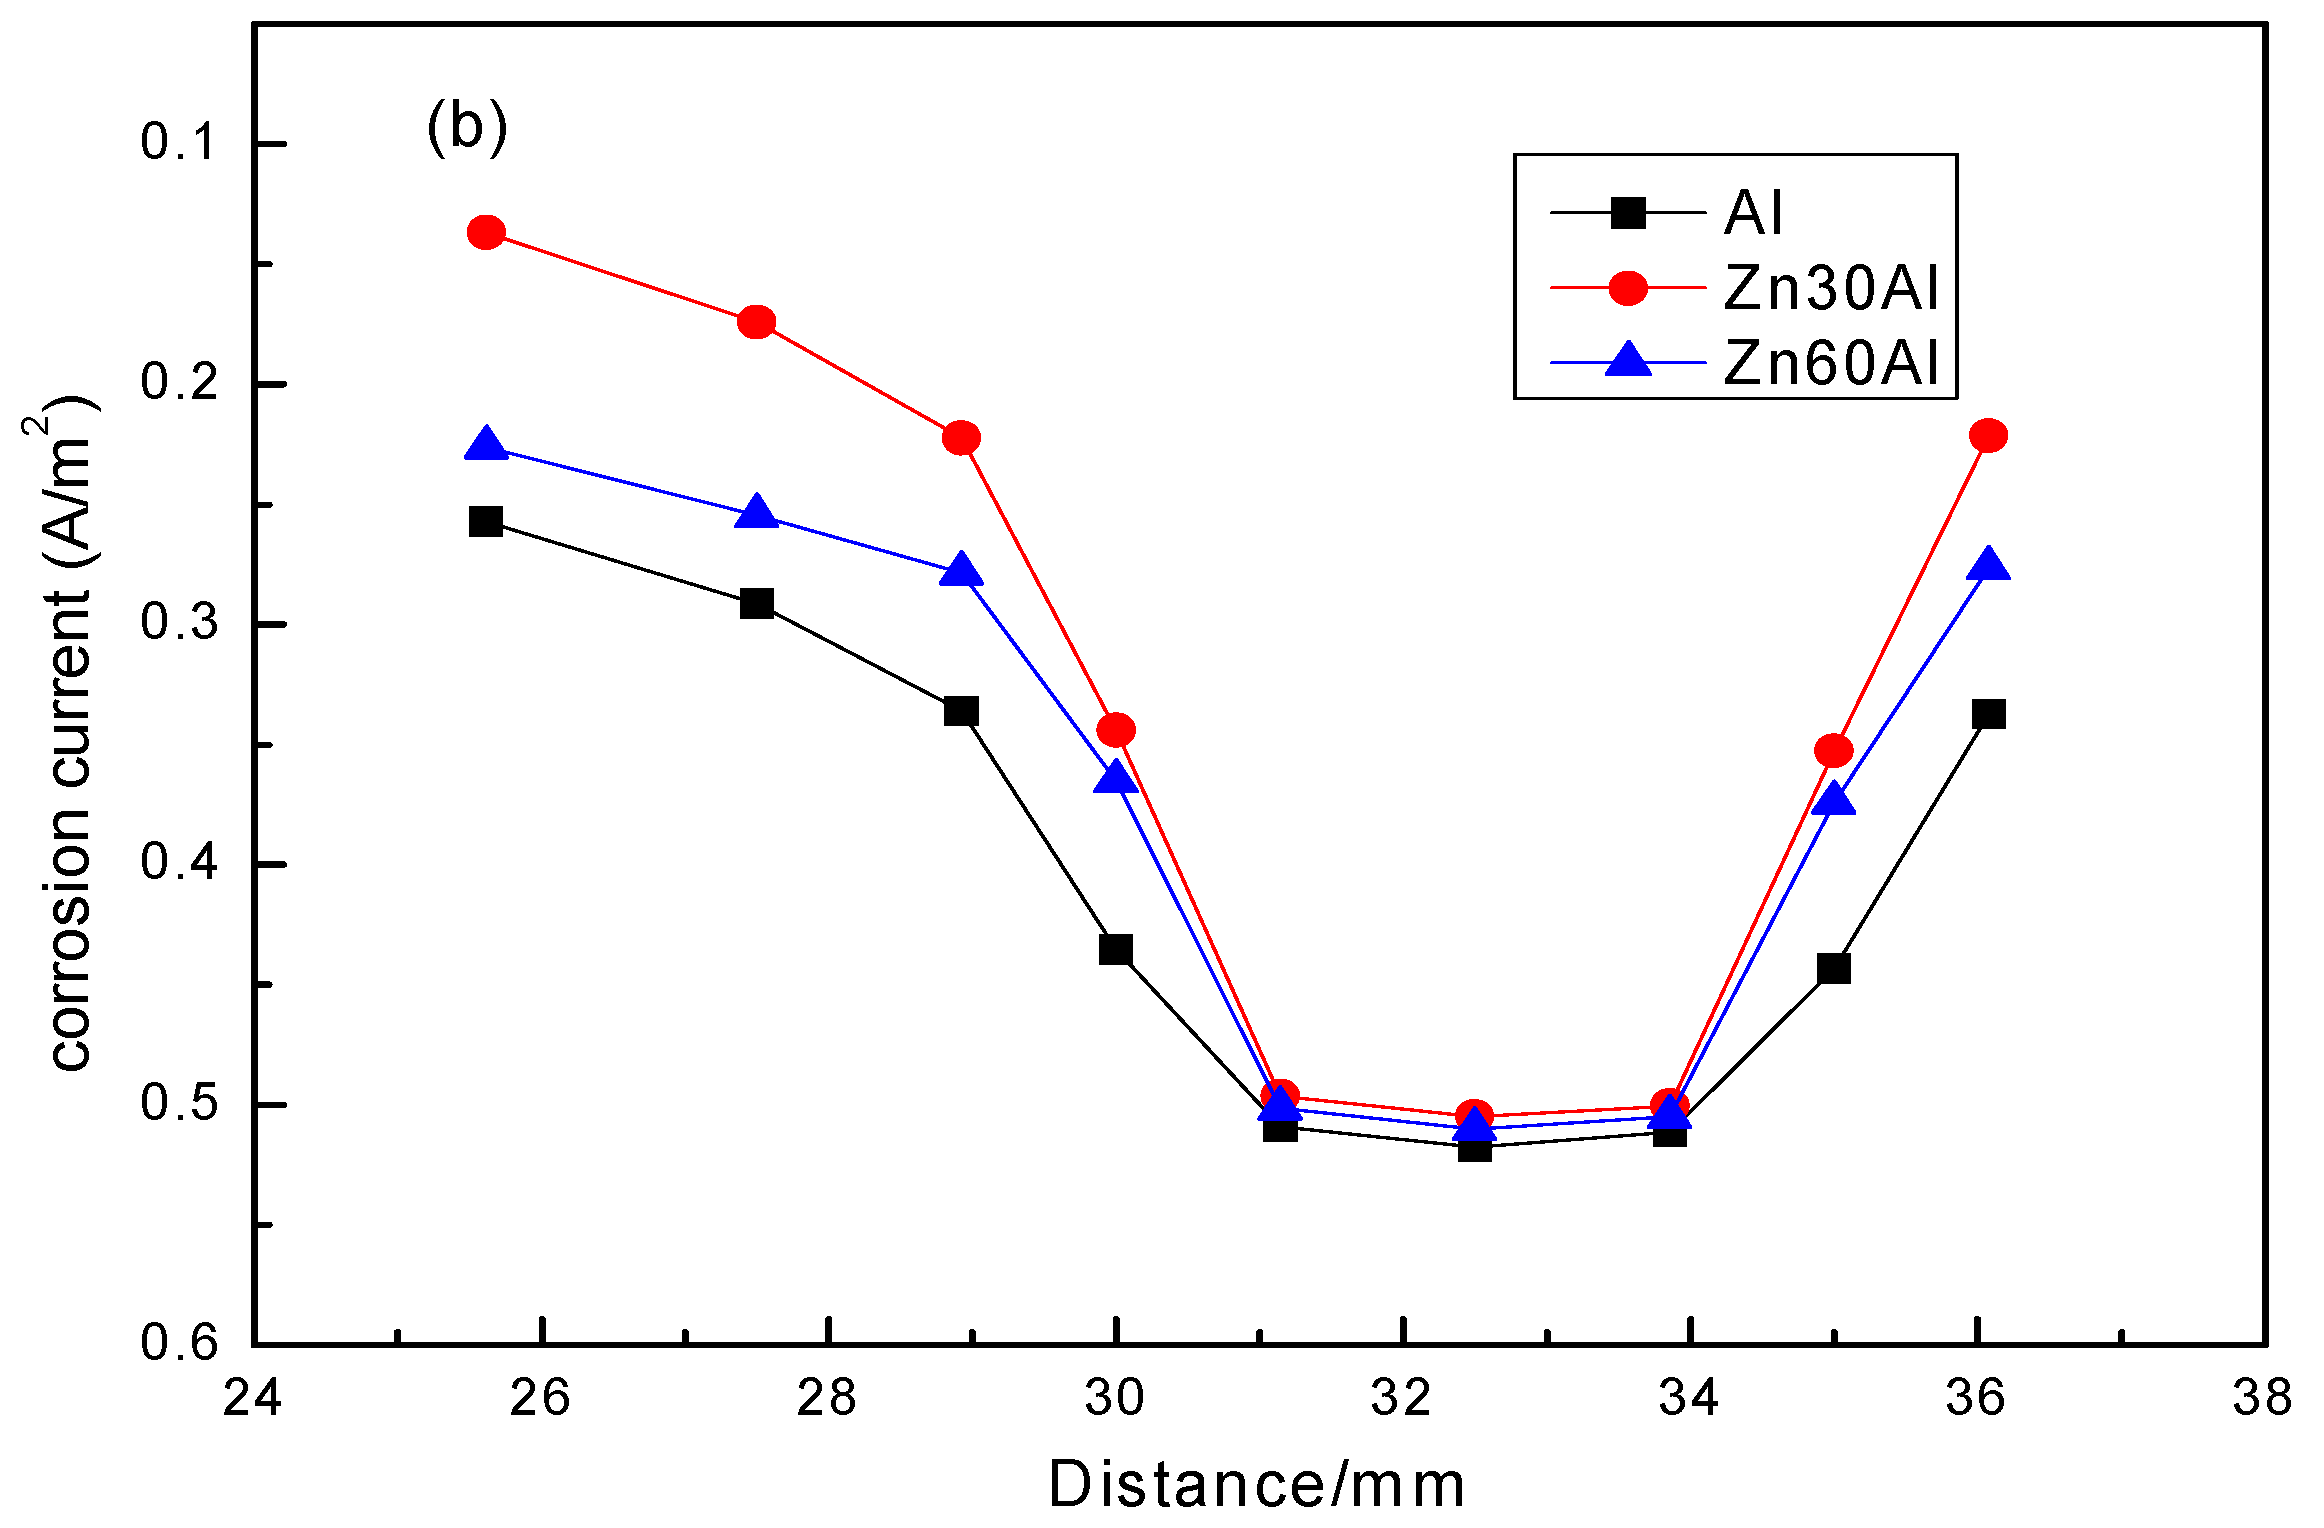
The corrosion current density distribution on the different cold-sprayed AlZn coatings with different damaged areas after 2 h immersion along the sample: (a) AlZn coatings with 1 mm damaged area; (b) AlZn coatings with 10 mm damaged area.
Figure 11.
The corrosion current density distribution on the different cold-sprayed AlZn coatings with different damaged areas after 2 h immersion along the sample: (a) AlZn coatings with 1 mm damaged area; (b) AlZn coatings with 10 mm damaged area.
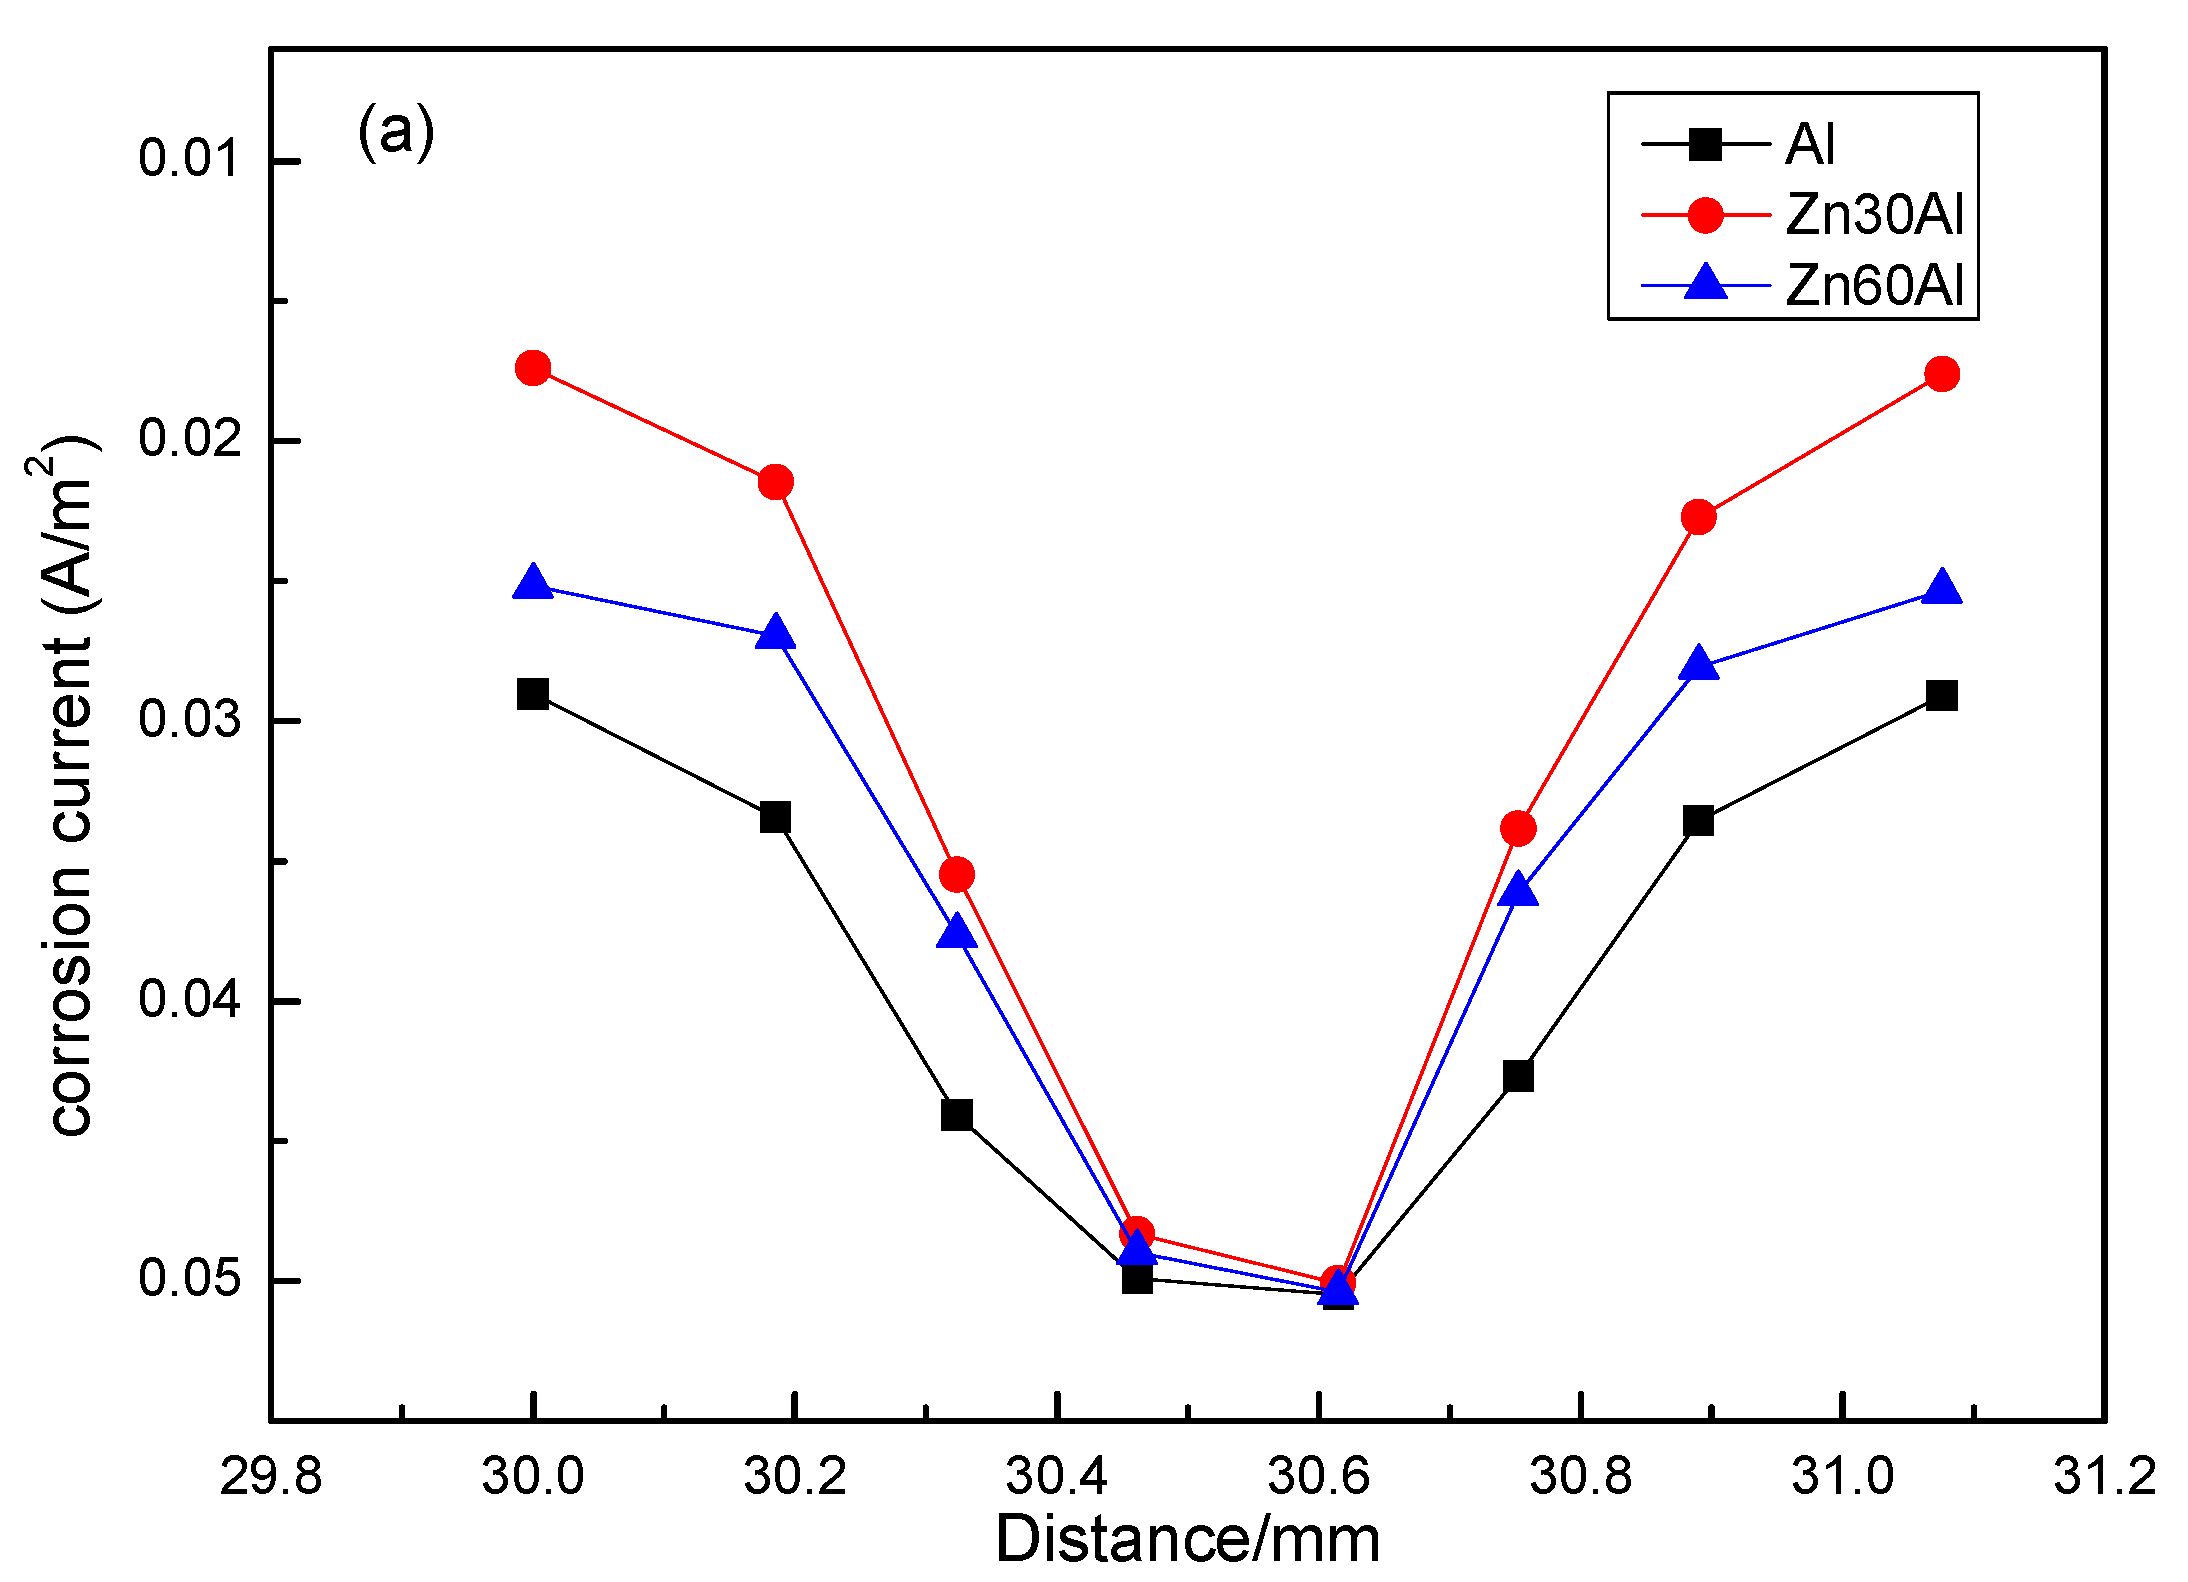

Figure 12.
The corrosion rate of Q235 steel coupled with different AlZn coatings in seawater after 30 days immersion.
Figure 12.
The corrosion rate of Q235 steel coupled with different AlZn coatings in seawater after 30 days immersion.

Table 1.
Summary of geometric parameters and working conditions of DYMET 413 used for preparing AlZn composite coatings.
Table 1.
Summary of geometric parameters and working conditions of DYMET 413 used for preparing AlZn composite coatings.
| Geometric Parameter | Value |
|---|---|
| Expansion ratio | 3.13 |
| Diameter of nozzle throat | 2.54 |
| Length of converging part | 10 mm |
| Length of diverging part | 10 mm |
| Length of elongated part | 120 mm |
| Standoff distant from nozzle exit to substrate | 20 mm |
| Pressure in prechamber | 0.6 MPa |
| Temperature in prechamber | 686 K |
| Powder feeding rate | 0.51–0.59 g/s |
| Transverse speed of nozzle | 20 mm/s |
Table 2.
Comparison between corrosion rate of weight loss experiment data and simulation results.
| Potential(V) | Corrosion Rate (Experiment Data) | Corrosion Rate (Simulation Results from 2 h) | Deviation (%) |
|---|---|---|---|
| −0.71 | 42.62 | 52.2 | 22.5 |
| −0.78 | 3.93 | 5.02 | 27.7 |
| −0.85 | 1.97 | 2.36 | 19.8 |
| −0.90 | 1.16 | 1.28 | 10.3 |
© 2017 by the authors. Licensee MDPI, Basel, Switzerland. This article is an open access article distributed under the terms and conditions of the Creative Commons Attribution (CC BY) license (http://creativecommons.org/licenses/by/4.0/).
Share and Cite
MDPI and ACS Style
Huang, G.; Lou, X.; Wang, H.; Li, X.; Xing, L. Investigation on the Cathodic Protection Effect of Low Pressure Cold Sprayed AlZn Coating in Seawater via Numerical Simulation. Coatings 2017, 7, 93. https://doi.org/10.3390/coatings7070093
AMA Style
Huang G, Lou X, Wang H, Li X, Xing L. Investigation on the Cathodic Protection Effect of Low Pressure Cold Sprayed AlZn Coating in Seawater via Numerical Simulation. Coatings. 2017; 7(7):93. https://doi.org/10.3390/coatings7070093
Chicago/Turabian StyleHuang, Guosheng, Xiaodan Lou, Hongren Wang, Xiangbo Li, and Lukuo Xing. 2017. "Investigation on the Cathodic Protection Effect of Low Pressure Cold Sprayed AlZn Coating in Seawater via Numerical Simulation" Coatings 7, no. 7: 93. https://doi.org/10.3390/coatings7070093
Note that from the first issue of 2016, this journal uses article numbers instead of page numbers. See further details here.