Nanoscale Characterization of Glass Flake Filled Vinyl Ester Anti-Corrosion Coatings

1
Department of Civil Engineering, Curtin University, Perth, WA 6845, Australia
2
Department of Mechanical Engineering, Johns Hopkins University, Baltimore, MD 21218, USA
*
Author to whom correspondence should be addressed.
Coatings 2017, 7(8), 116; https://doi.org/10.3390/coatings7080116
Submission received: 21 June 2017
/
Revised: 27 July 2017
/
Accepted: 2 August 2017
/
Published: 4 August 2017
(This article belongs to the Special Issue Coatings for Corrosion Mitigation)
Abstract
:Vinyl ester is a thermoset matrix resin that is widely used in the coating industry. The presence of glass flakes further enhances the anti-corrosion performance of this coating. This paper reports the nanoscaled characterization of glass flake filled vinyl ester anti-corrosion coatings on mild steel. Bond strength properties of one uncoated and four coated samples with different thicknesses (300, 600, 900 and 1200 μm) were studied using nanoscratch technique and ASTM Standard Test. It was found that the bond strength of coating with thickness 900 μm was the highest. The frequency distributions of elastic modulus on coating with 900 μm thickness determined using nanoindentation indicated that only 20–25% of the coating is composed of glass flakes and the balance is vinyl ester matrix. The critical depth at which the material is subject to failure due to external load and abrasion, was found to be around 100 nm.
1. Introduction
Mild steel has been used in many fields including marine, chemical processing, petroleum production, mining and construction industries, mainly due its versatility and cost effectiveness [1,2,3,4,5,6,7]. However, the major drawback of mild steel is its limited resistance to corrosion [8,9]. Therefore, in order to maximize the reliability of structures constructed using mild steel there is a need to protect these from corrosive environments. In fact, corrosion protection is a serious challenge for both the developing and developed nations. Every year many billions of dollars are invested to save the heritage structures, monuments, machinery, etc., from corrosion and other forms of chemical damage.
Owing to its outstanding saltwater resistance, good insulating properties and strong adhesion/affinity to heterogeneous materials, vinyl ester, a thermoset matrix resin, is commonly used as an effective anti-corrosion coating in many industrial applications to protect steel structures [10,11,12,13]. Generally, vinyl ester coatings reduce the corrosion of a metallic substrate not only by acting as a physical barrier layer to control the ingress of deleterious species, but also by serving as a reservoir for corrosion inhibitors to aid the steel surface in resisting attack by aggressive species such as chloride ions. However, the applications of vinyl ester coatings introduce localized defects in the substrate and impair their appearance and mechanical strength. Vinyl ester coatings also experience large volume shrinkage upon curing and can absorb water from their surroundings [14,15]. The barrier performance of vinyl ester coatings can be improved by the incorporation of a second phase (such as glass flakes) into the polymer matrix [16]. This decreases the porosity and restrains the diffusion path for deleterious species of the coatings.
In order to achieve the best performance of coatings there is a need to understand not only the mechanism of coating formation, but also the bond strength and the nanomechanical properties. While the mechanism of formation of such coatings is well established [17], the determination of bond strength is still difficult because of heterogeneity of the material. There are a number of laboratory-based techniques to evaluate the bond strength of coatings [18]. However, none of them may be regarded as ideal and are associated with a number of calculation errors. Some of the standardized methods for bond test include gluing the two samples and then pulling them apart. These types of tests are even more complicated and also limited by the properties of the glue.
The mechanical properties of coatings can be evaluated by using the nanoindentation test [19,20]. In addition, nanoindentation can be used to estimate the fracture toughness of coatings, which cannot be measured by other conventional penetration tests [21]. Over the last two decades commercial nanomechanical testing instruments have expanded the range of their test techniques beyond simple nanoindentation. Nowadays, it is possible to carry out nanotribological measurements using nanoindentation. Nanoscratch testing in particular is increasingly becoming an established nanomechanical characterisation method. It is mainly used to determine the adhesion strength and evaluate the failure modes of coatings. The majority of published work in nanoscratch testing area relates to establishing mechanical parameters of various coating/substrate systems [22,23,24,25]. However not a much has been done to characterize the mechanical and tribological properties of reinforced barrier coatings. The use of nanoscratch to measure the bond strength could give new insight regarding the anti-corrosion performance of reinforced barrier coating. The bond strength and various nanomechanical properties as a function of the coating thickness is also a fairly underexplored problem. Although an international standard for nanoindentation now exists, nanoscratch testing is yet to be standardised despite being in increasingly common use. Therefore, an attempt is made in this research to evaluate the bond strength of the coatings using nanoscratch technique and the nanomechanical properties (elastic modulus and hardness) of the coatings using nanoindentation.
2. Experimental Methods
2.1. Sample Preparation
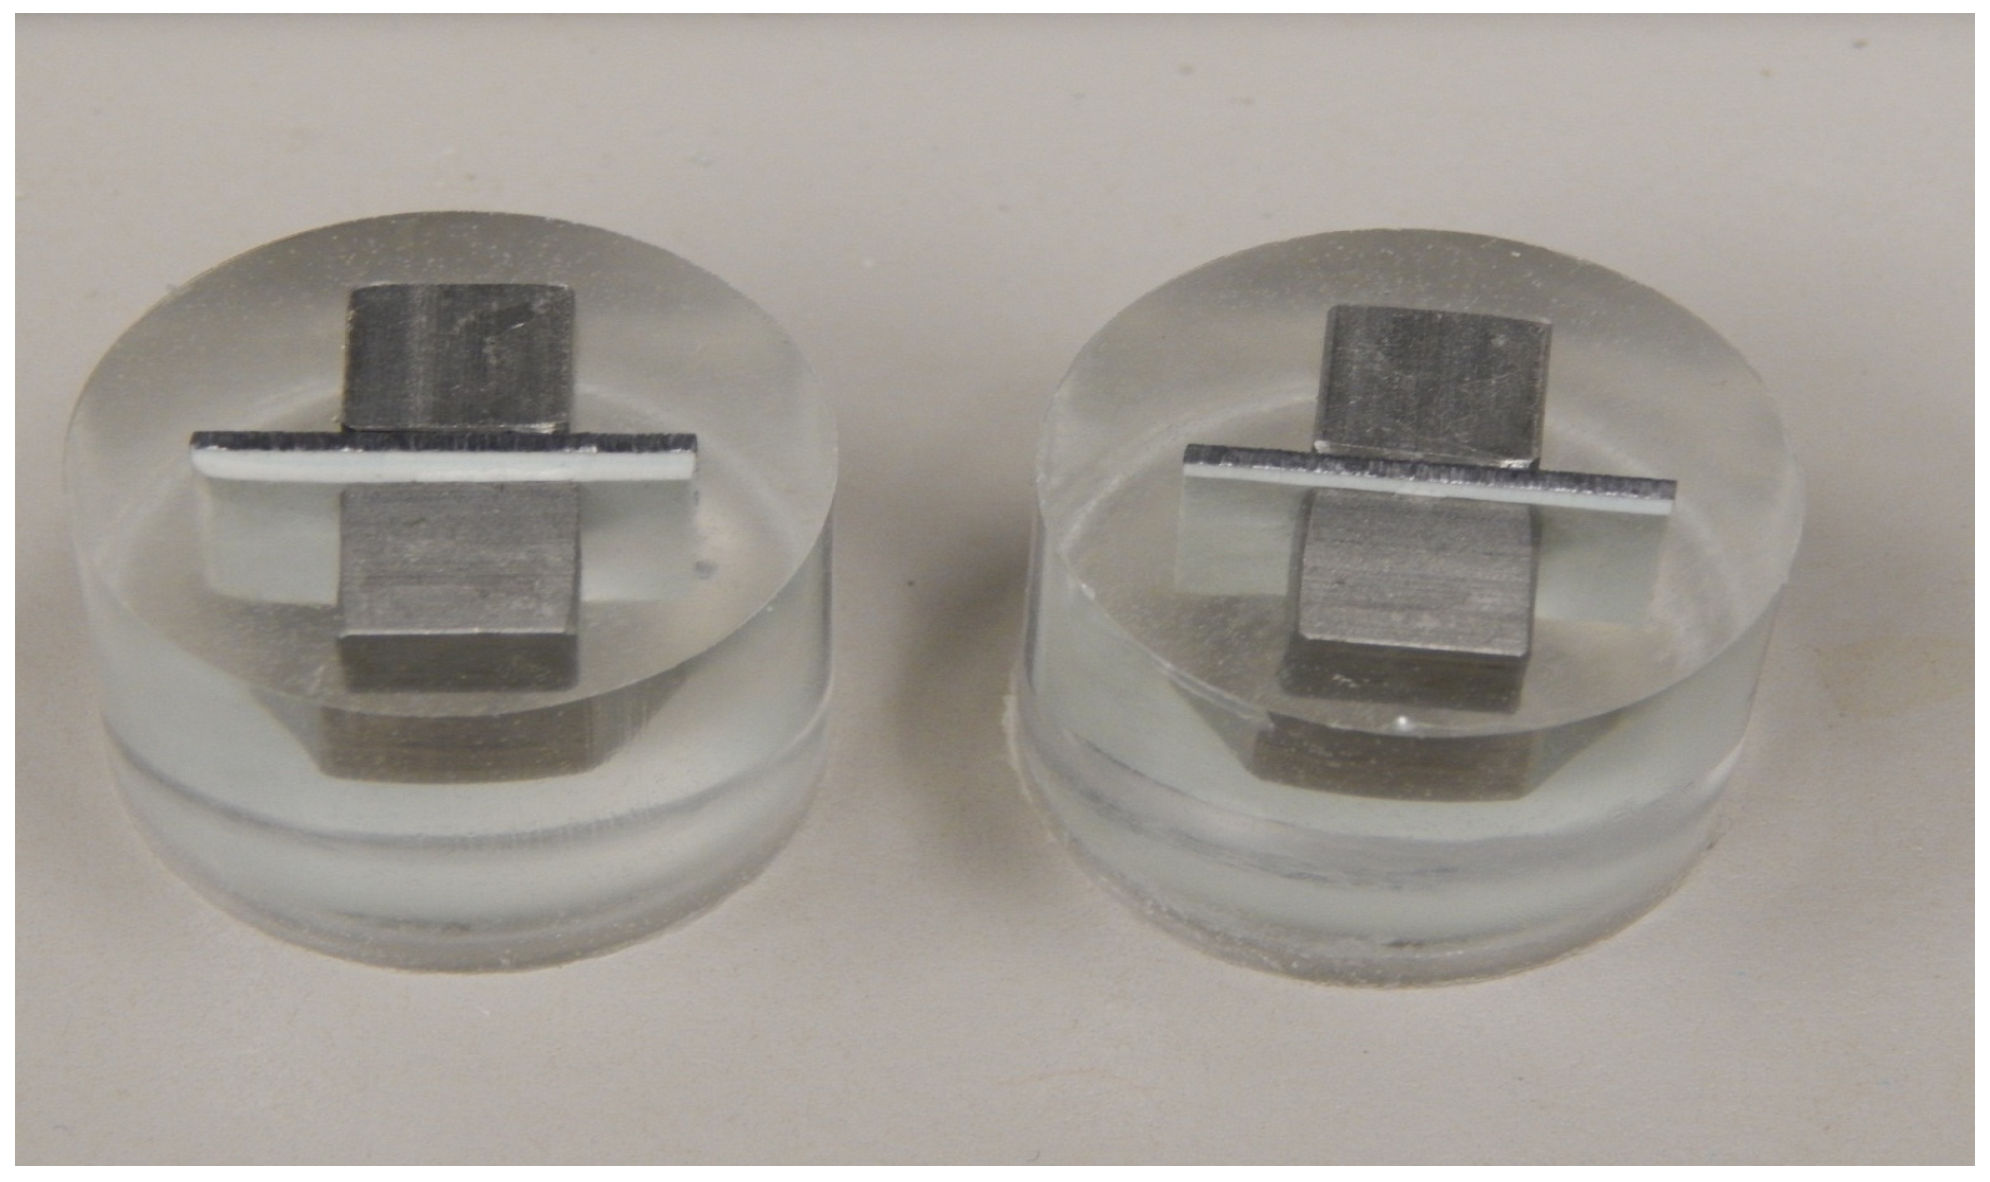
The coating was applied to a mild steel sample plate of 2 mm thickness with four different thicknesses viz. 300 μm, 600 μm, 900 μm and 1200 μm. Prior to coating the surface of the substrate was prepared using a grit blasting technique. For nanoscratch and nanoindentation testing samples of size 20 mm × 20 mm were cut using a band saw, so that their cross section is exposed and then embedded in resin with a suitable curing agent in a vibration/noise free environment as shown in Figure 1.
Grinding was carried on a Buehler AutoMet 250 (Buheler, Lake Bluff, IL, USA) in four steps of reducing diamond carbide paper roughness: 240, 360, 800 and 1200 grit, equivalent to 52.2, 35.0, 21.8 and 15.3 μm respectively. Samples were polished on Buehler AutoMet 250 grinder–polisher using a polycrystalline diamond suspension of varying roughness: 9, 6, 3, 1, 0.25, 0.1 μm. All samples were polished with an applied force of 20 N for 5 min on each particle size with the exception of the 9 μm that was applied for 10 min. The surface roughness of the samples were measured with nanovision Scanning under the nanoindenter (Keysight Technologies, Inc., Santa Rosa, CA, USA). This was calculated by taking the average of 5 different sampling areas of 100 μm × 100 μm each. A total of 200 × 200 data points were scanned in X and Y directions respectively which produced an image of step size and resolution of about 0.5 μm.
2.2. Test Methods
2.2.1. Nanoscratch Test
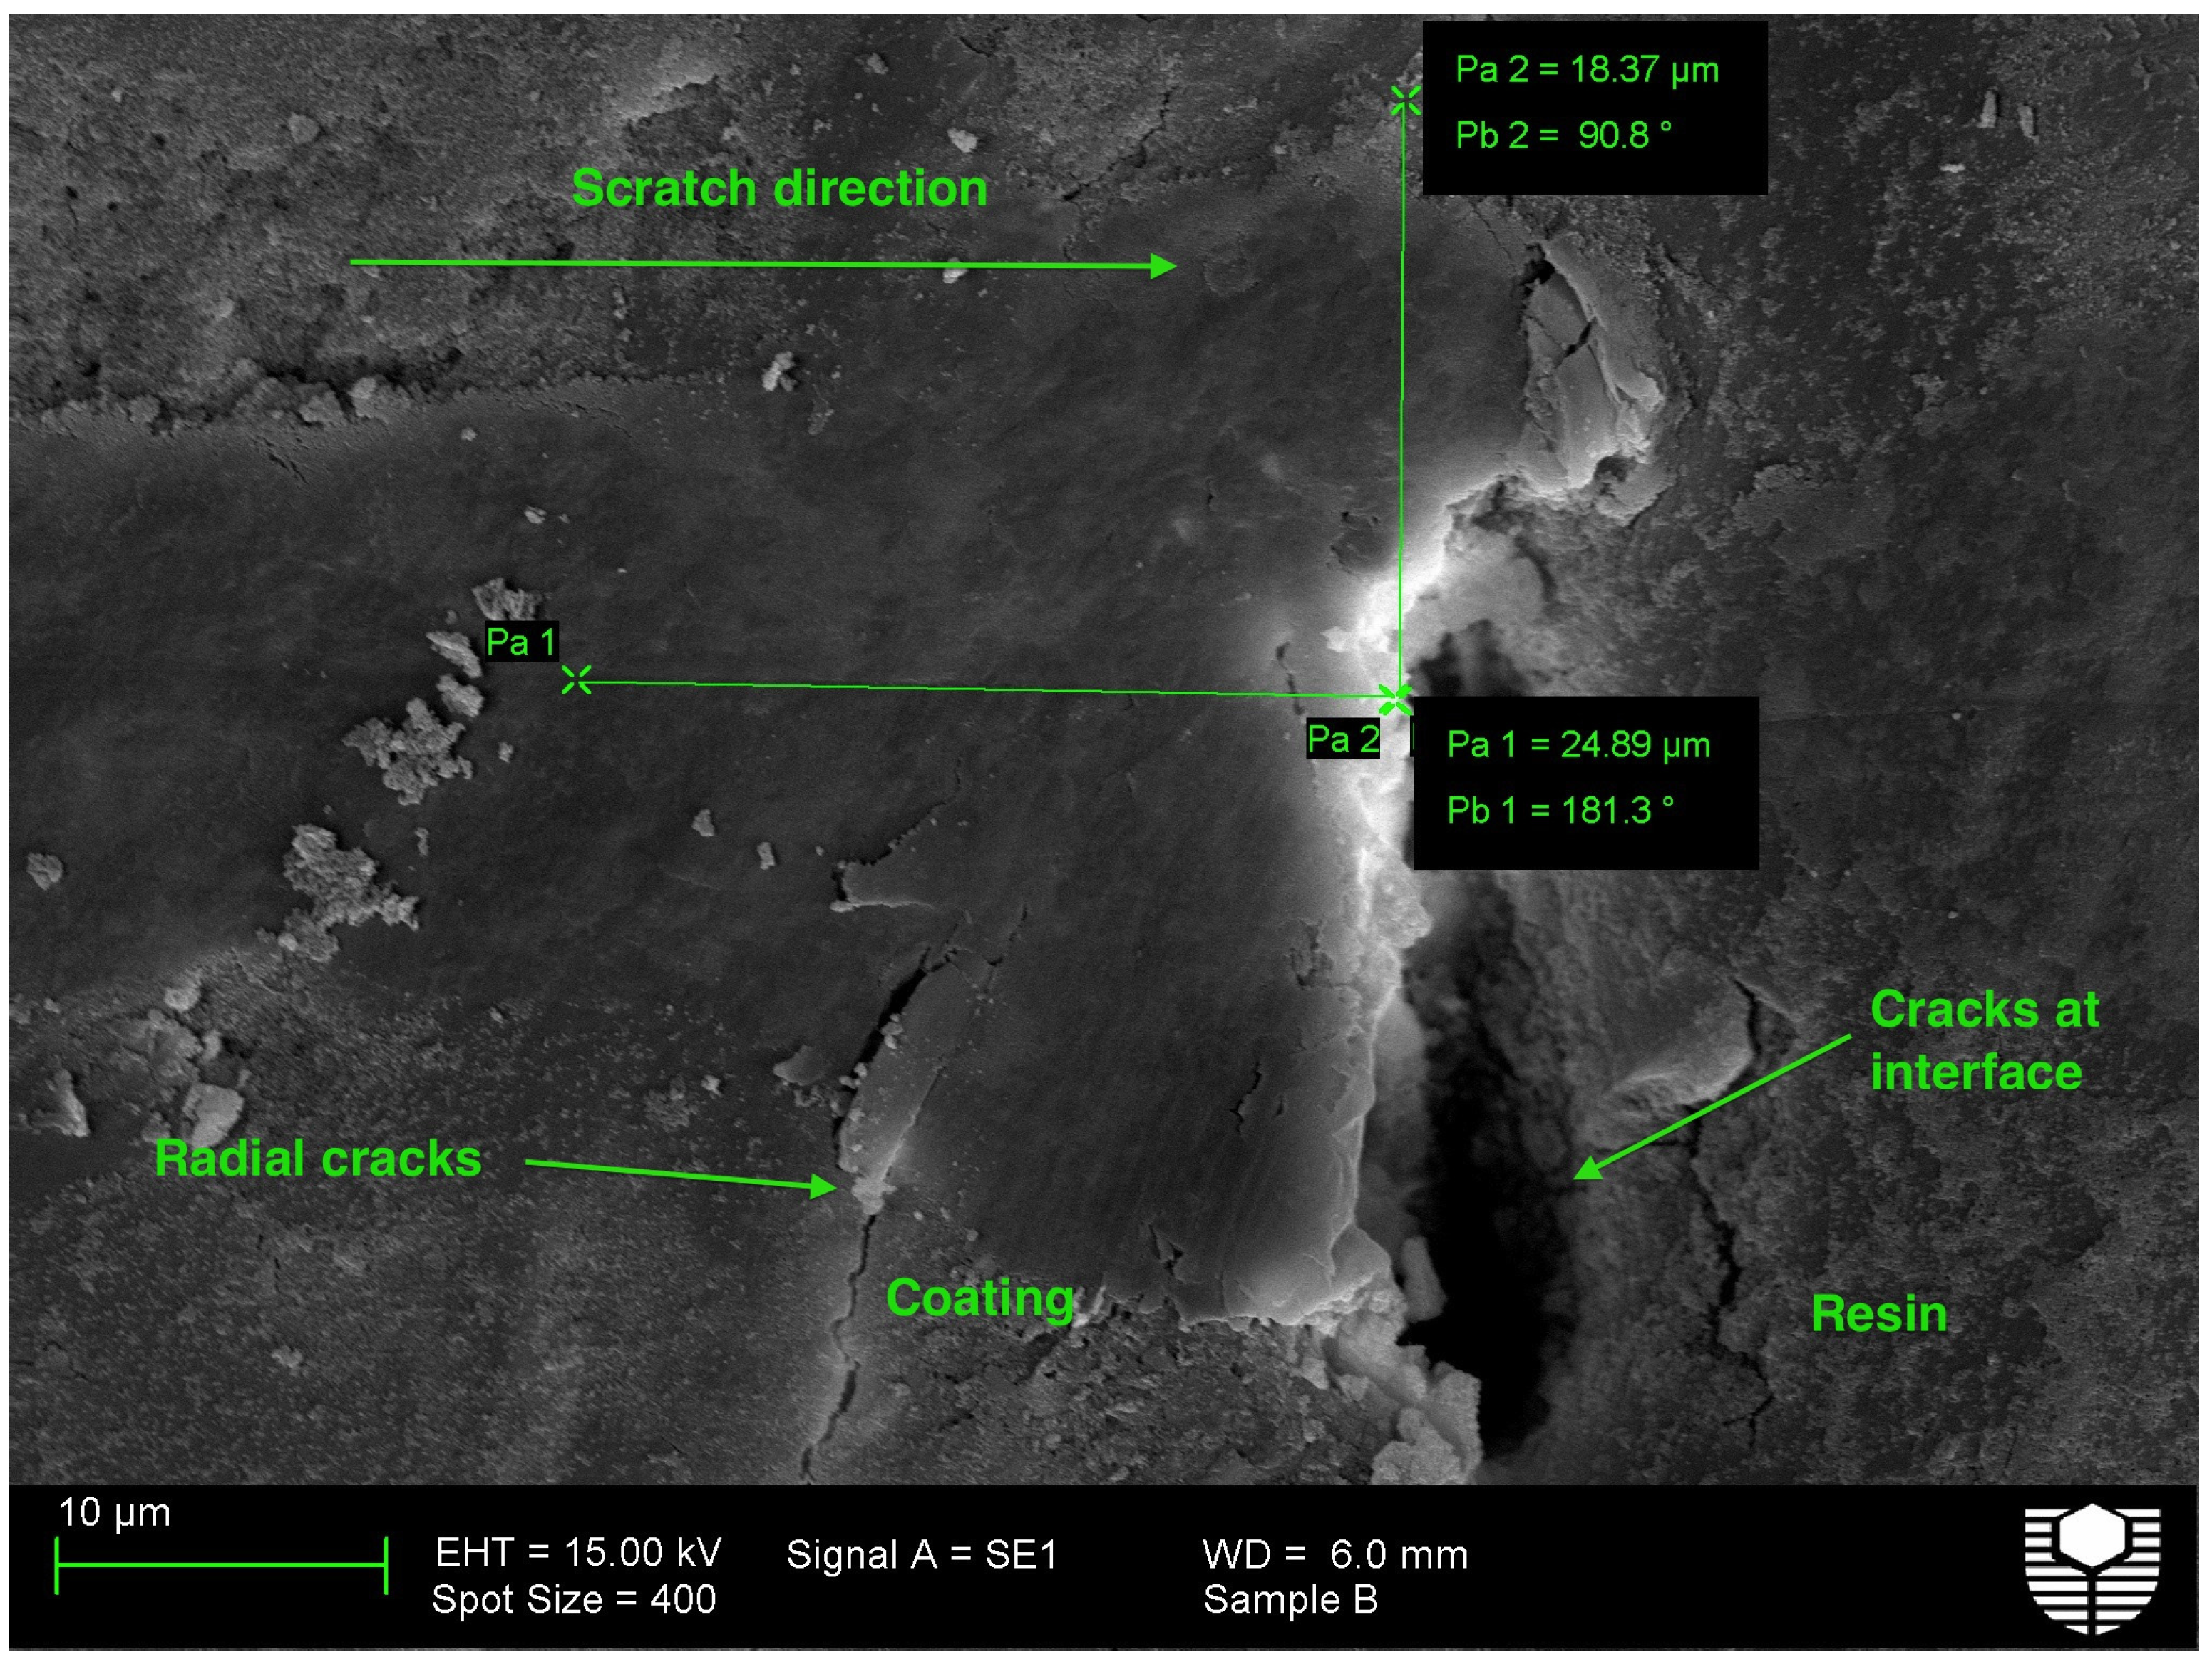
Nanoscratch testing was carried out to assess the mechanical failure behaviour mode and the bond strength of the coatings. The tests were conducted by moving the indenter tip. This was made when the indenter tip was in contact with the specimen surface. The Berkovich tip (Keysight Technologies, Inc., Santa Rosa, CA, USA) was used to conduct pre- and post-scratch scans of the surface with a force of 5 µN at a rate of 2 µm/s. Data were recorded during these scans at a rate of 5 points/µm. A scratch length of 100 µm was made at each focused site, with the indentation tip used to scan the approach and parting zones of the scratch site at 20 µm each. During the scratching step, a velocity of 2 µm/s was used to apply a maximum load of 50 mN, which is imposed perpendicular to the plane of sample faces. After nanoscratch tests the samples were examined using a Scanning Electron Microscope (Tescan Mira3, Brno, Czech Republic) to calculate the projected area of the cone shaped fracture. Based on previous studies [26], he projected area A is chosen as the most suitable parameter for comparison as it shows a monotonic relationship with the scratch load.
2.2.2. Tensile Bond Strength Test
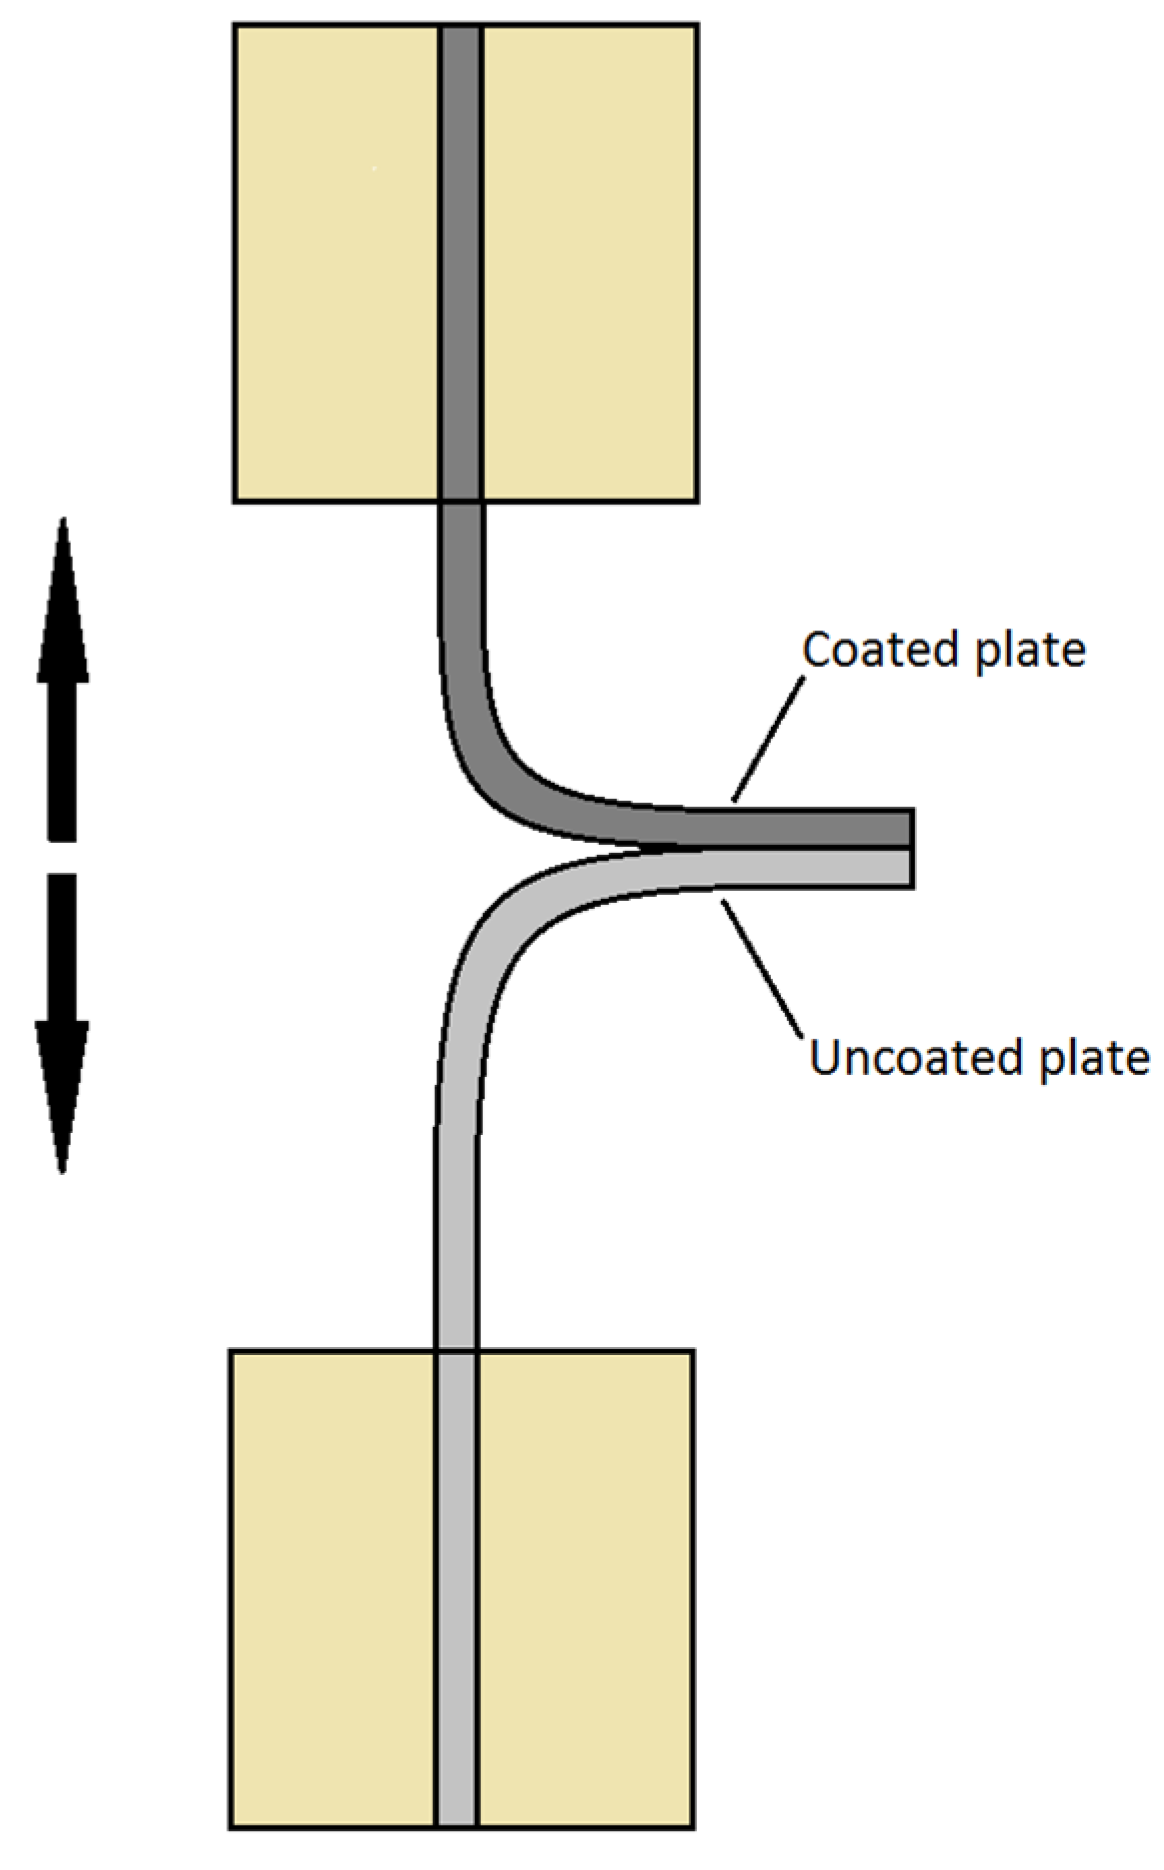
The tensile bond strength tests were performed according to ASTM D1876-08 (2015) [27]. The geometry of the samples was rectangular coated plates 8 cm × 2 cm bent at 90°. The test plate is glued to another uncoated plate of the same dimension forming a T like structure as shown in Figure 2. The free arms are held from both sides by the machine and pulled apart to observe the mode of failure. The bond strength was calculated by dividing the maximum (failure) load by the cross-sectional area of the bonded part of the sample.
2.2.3. Nanoindentation
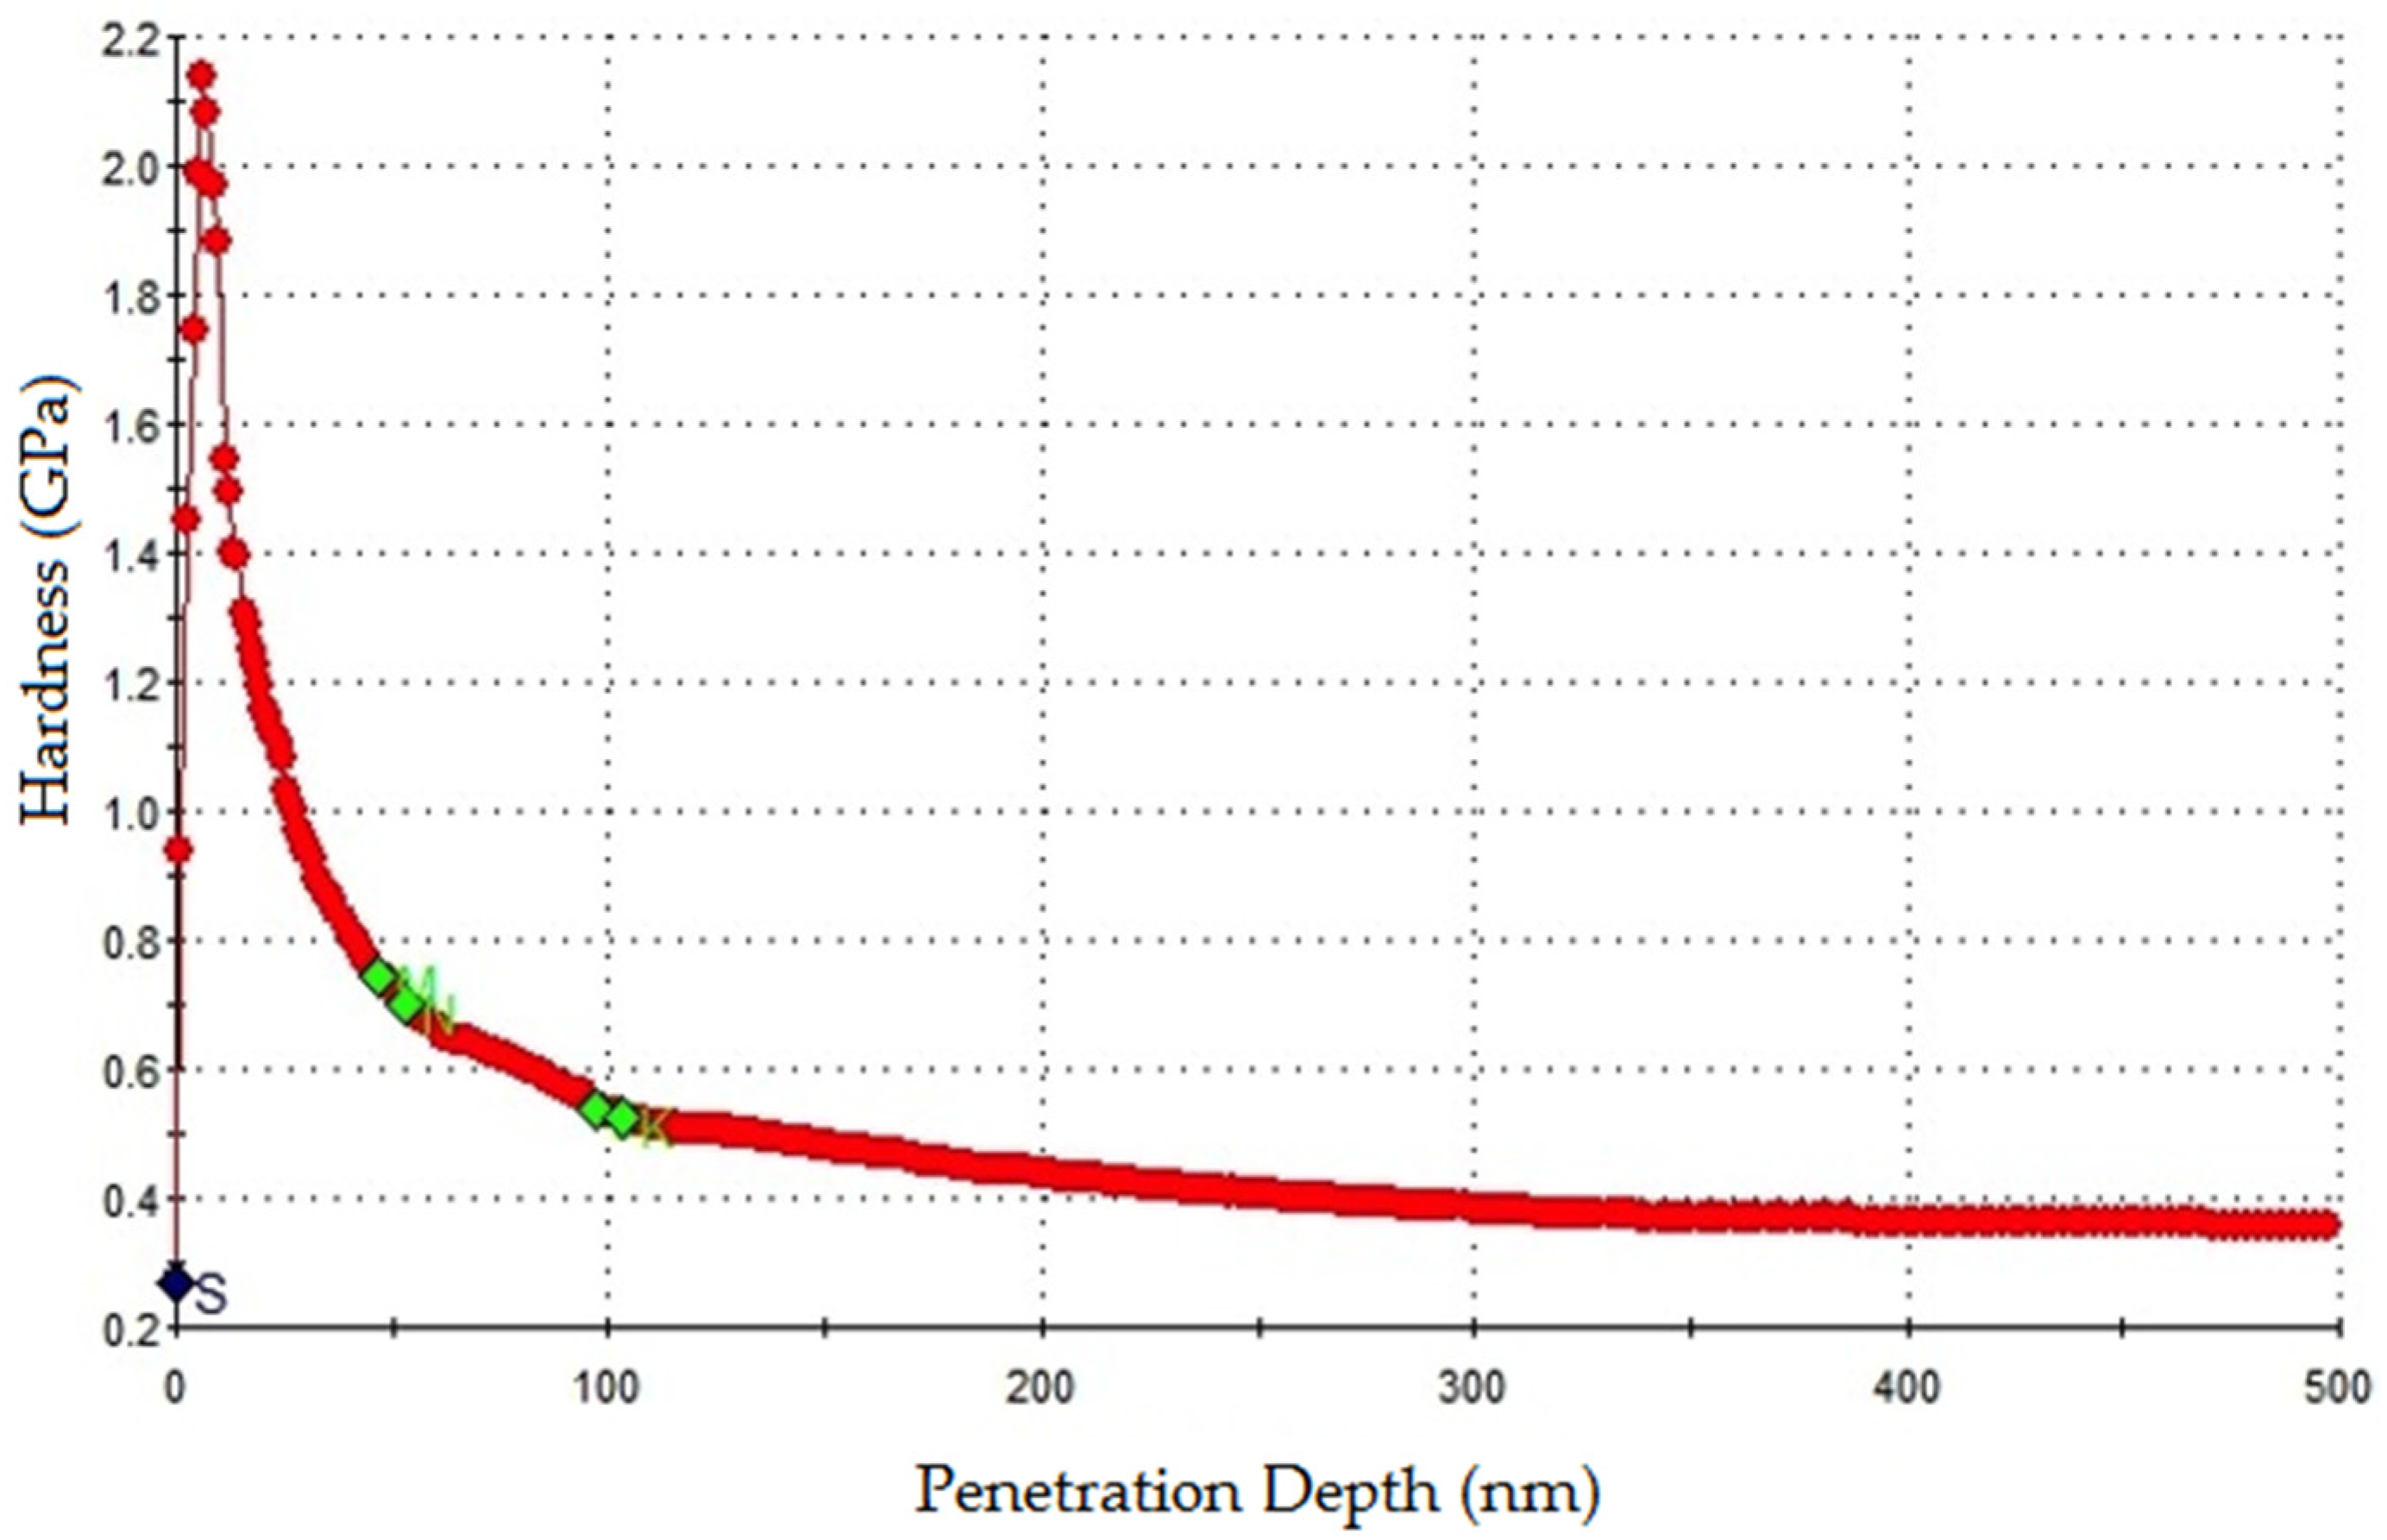
The polished samples were indented with a diamond Berkovich with a tip of size 20 nm. The indentation was performed in a grid like fashion with each grid having 40 indents (10 × 4). The grid location was chosen in such a way so that both the vinyl ester and the embedded glass flakes came under the grids. This was done to observe the variation in the elastic modulus and hardness values at the interface. Figure 3 shows a typical load- displacement curve obtained during a load-controlled indentation. The indentation was carried out in two cycles with a maximum load of 1 mN. The sequence of operation during each indentation cycle is: loading-holding period-unloading. The displacement into the surface during the holding period when the maximum load is maintained may be attributed to creep. The poison’s ratio is taken as 0.25 and a distance of 20 µm separated the indents so that one indent does not affect the results of other indents. Indentations were carried out at six different locations on the coating. The calibrated contact area function was derived from indentation tests conducted previously on a fused quartz standard specimen.
The slope at the beginning of the unloading curve is defined as the contact stiffness (S), which is given by:
where P is the indentation load and h is the indentation depth.
The initial part of the unloading curve is fitted by a Power law equation shown below:
where Er is the reduced modulus, Ac is the contact area of the indenter and β is a constant for the indenter geometry.
Er is related to the elastic modulus of the sample (E) and the elastic modulus of the indenter (Ei) by the following equation:
where ν and νi are Poisson’s ratios of the sample and the indenter, respectively. For the Berkovich indenter, the values of Ei and νi are known to be 1140 GPa and 0.07. Therefore, the reduced elastic modulus, Er can be defined as:
The hardness is defined by:
where Pmax is the peak load.
3. Results and Discussion
3.1. Bond Strength Using Nanoscratch
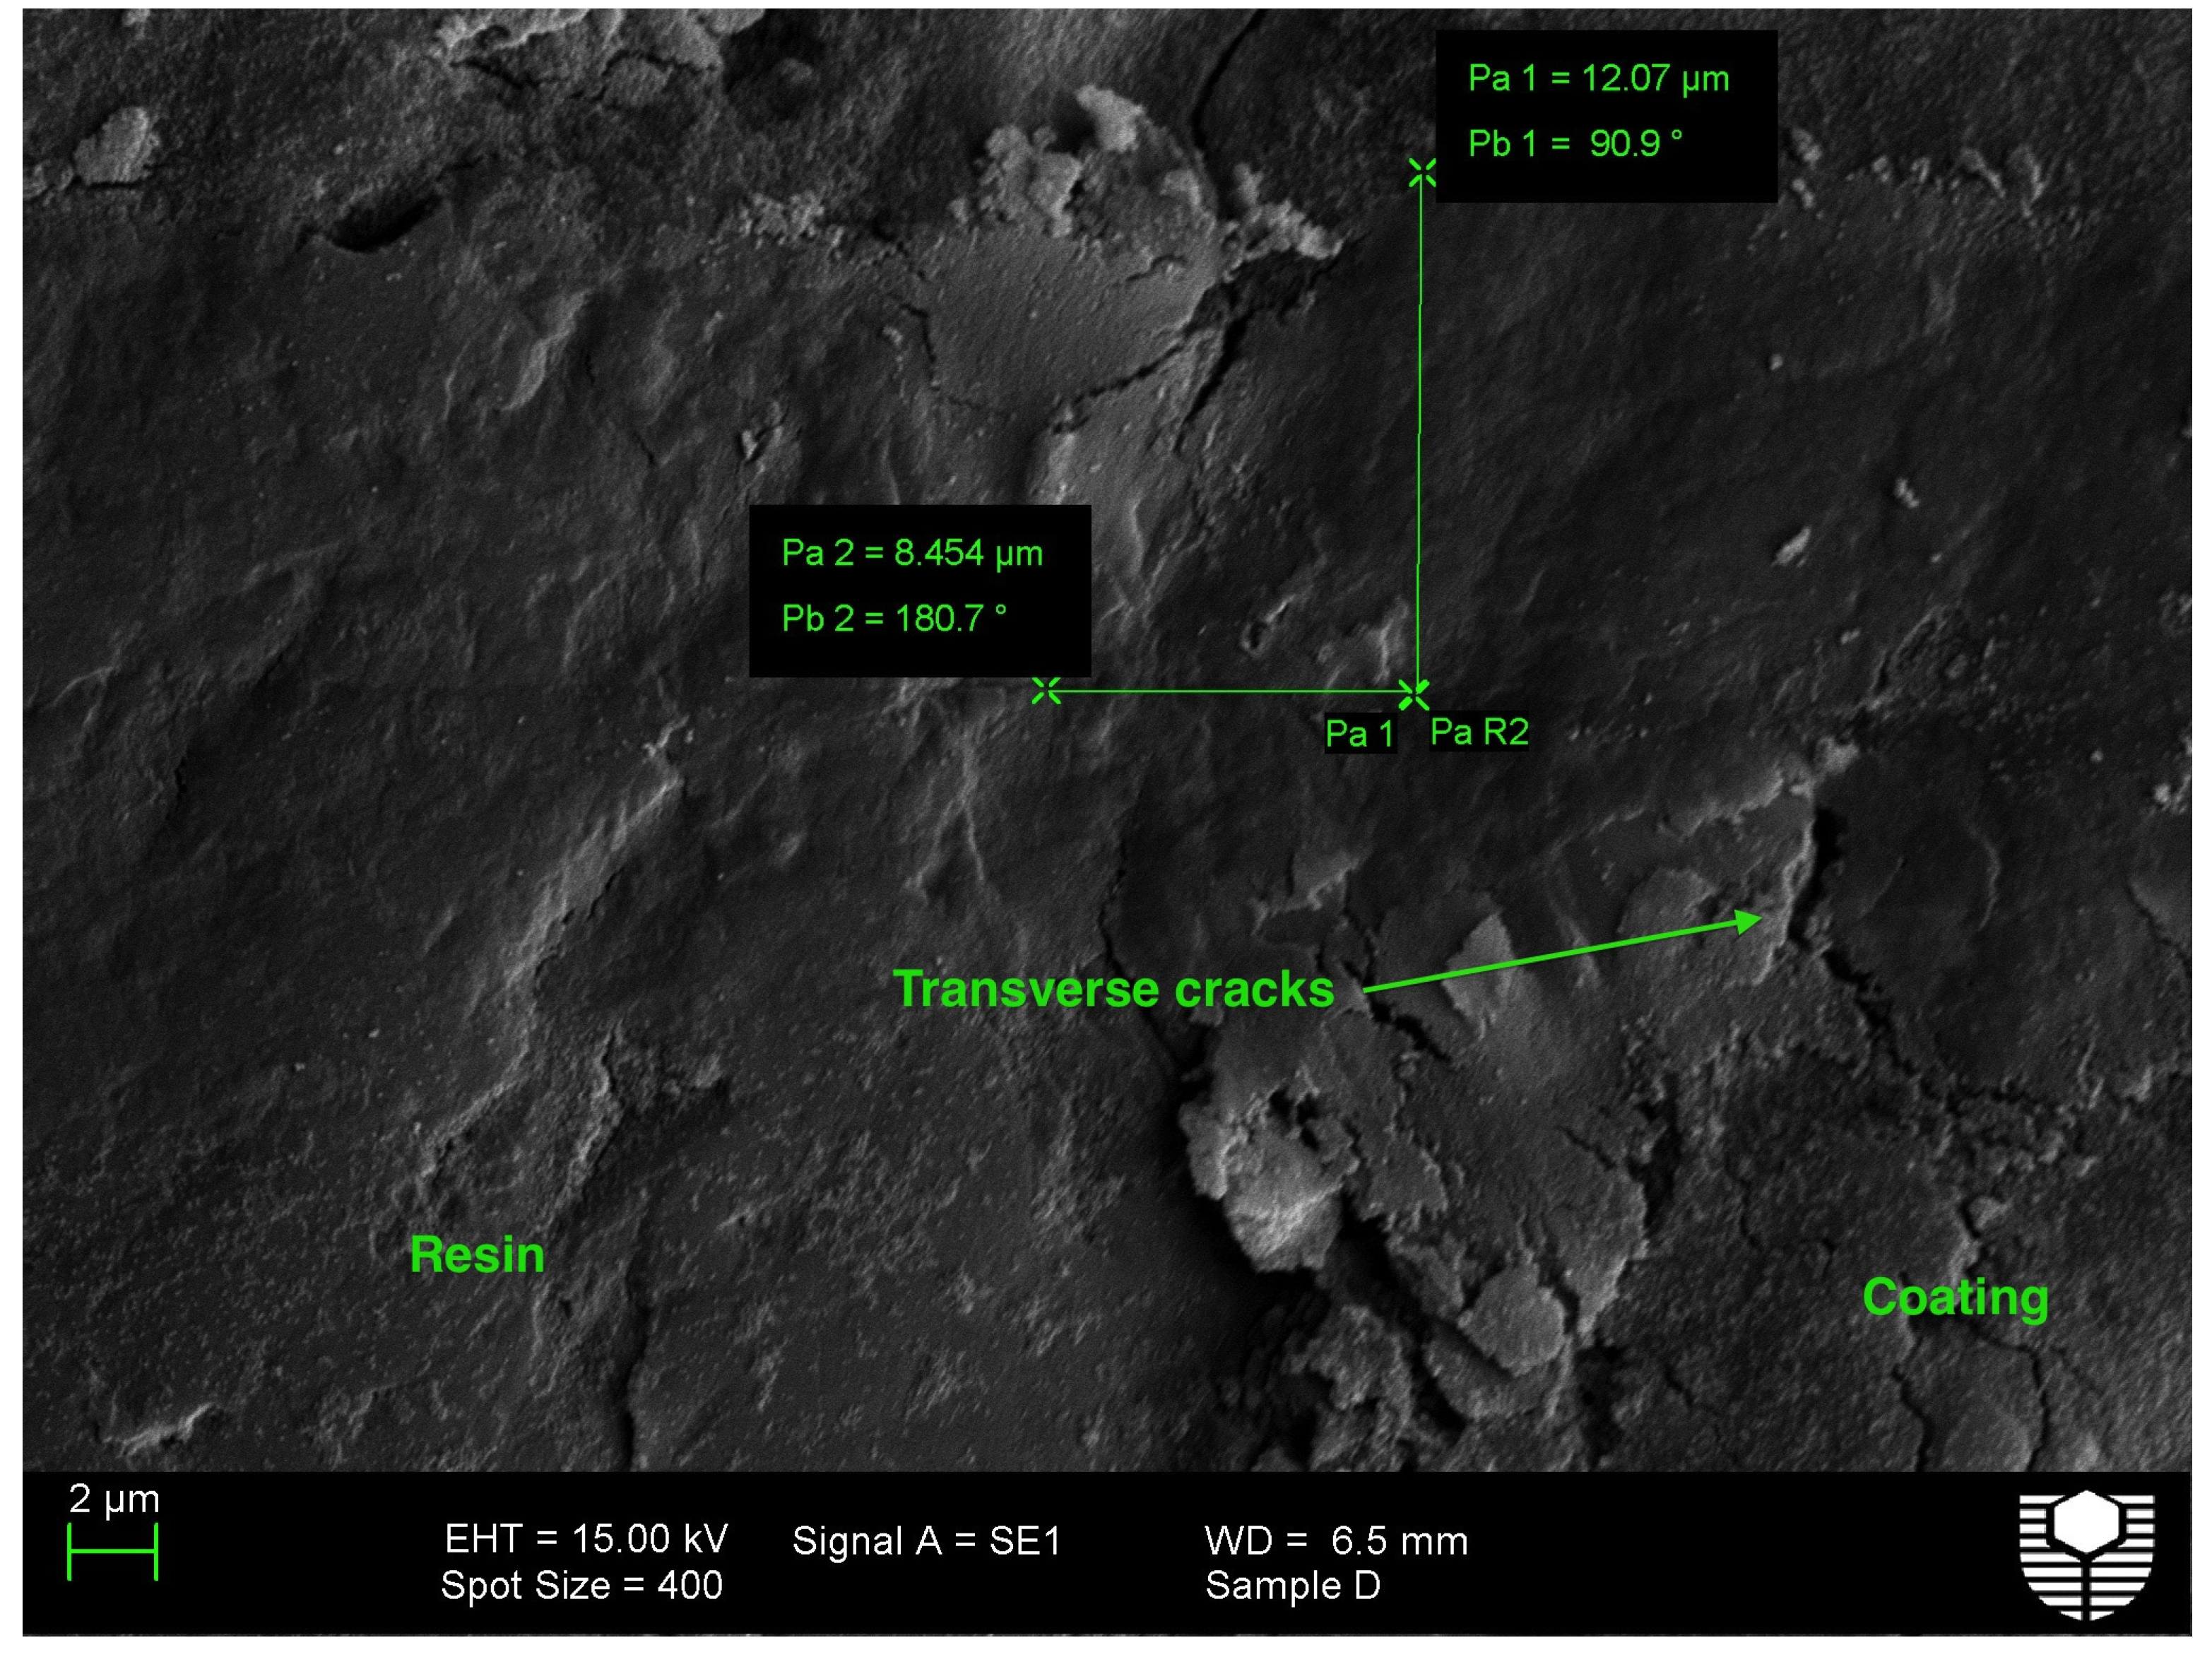
The SEM images showing the formation of cones at the coating-resin interface and coating-substrate interface for different thicknesses are shown in Figure 4, Figure 5, Figure 6 and Figure 7. These cones are marked for calculation of their projected areas, which can be correlated to their failure behavior. In Figure 4 and Figure 6, the cones at the interface are quite sharp and clear, whereas in other figures they are difficult to identify. From the SEM images, the geometric values such as cone length Lx, cone width 2Ly, angle α, and projected area A are calculated and summarized in Table 1. As can be seen from Table 1, the coatings with thickness 1200 μm showed the minimum projected cone area, whereas the coatings with thickness of 300 μm showed the maximum projected cone area. The higher the projected area of the coating, the lower is the bond strength.
The mode (adhesion/cohesion) of failure, which is critical for the coating, is also summarized in Table 1. In coatings with thickness 300 μm, the mode of failure may be assumed to be adhesion failure as the fracture cones are quite prominent at the coating-substrate interface. For coatings with 600 μm and 900 μm thickness the failure modes are more likely to be cohesion failure in nature. This can be attributed to the presence of cracks inside the coatings and around the scratch as can be seen the images in Figure 4 and Figure 5. In the case of coatings with thickness 1200 μm, pores and cracks were observed on the coatings as well as on the coating-substrate interface. Therefore, the mode of failure could be either adhesion or cohesion failure.
3.2. Tensile Bond Strength
The tensile bond strengths of coatings for the four thicknesses tested as per ASTM D1876-08 (2015) [27] are summarized in Table 2. The minimum bond strength of 32 MPa was observed in case of coatings of thickness 300 μm. The tensile bond strength gradually increased from 300 to 900 μm, but then decreased in the case of coatings with 1200 μm thickness. It was observed that the coatings with thickness 900 μm had the maximum bond strength of 59 MPa. For the coatings with thickness 300 μm, during the tests, the failure occurred at the interface between the coating and the substrate and some portion came out from the substrate. Therefore, it was considered as adhesion failure. For the coatings with thickness 600 and 900 μm, during the tests, the failure occurred at the coating layers. Some portion of the coating came out in the form of layers. This may be due to the cohesion failure of the coatings. In the case of coatings with thickness 1200 μm the failure occurred both at the coating–substrate interface and in the coating layers. Therefore, the failure mode could be either adhesion or cohesion failure.
Tensile bond strength of coatings depends on many factors and some of the important ones are the amount of unmelted particles and pores in the coating. The presence of pores is very evident in the SEM image of coatings for thickness 300 μm (Figure 4). Similarly, the SEM image of coatings for thickness 600 μm shows the presence of cracks at the interface (Figure 5), while SEM image of coatings for thickness 1200 μm shows transvers cracks (Figure 6). The highest bond strength obtained for the 900 μm thick coating may be due to the fact that the coatings with 900 μm thickness showed the lowest amount of pores, transverse cracks and cracks at the interface compared to the coatings with other thickness.
3.3. Nanomechanical Properties
The mean, standard deviation and coefficient of variation of the elastic modulus and hardness values determined using nanoindentation technique for the six locations are summarized in Table 3. Each grid has 40 equally spaced indents placed at a predetermined position of the surface of the coating. As the nanoindentation tests were not done on the same nanoscaled position for all the specimens, there could be some difference in the obtained results. In order to satisfy an equal variance assumption for all the 6 grids, the paired non-parametric test and the paired p-tests were performed on log transformed elastic modulus data at a 5% level. The p-value from the test was less than the alpha level (=0.05). The variation in the values of elastic modulus and hardness in Table 3 can be attributed to the fact that some indents are on vinyl ester whereas some are on the glass flakes. The variation of modulus with the number of indents is shown in Figure 8. The same result holds good for hardness values of the coating as well. In Figure 7, the zone between 10th and 15th indent lies on a glass flake as may be interpreted from the modulus values which lies between 10 and 25 GPa, whereas the positions of the 15th–25th indent lies on vinyl ester, as the modulus values are in the range of 4–8 GPa. The boundary region of the glass flakes and resin has the highest stress concentration and therefore is a weak zone as can be observed in Figure 8. The indents appear relatively shallower on glass flakes because the hardness of glass flakes is higher than that of vinyl ester matrix.
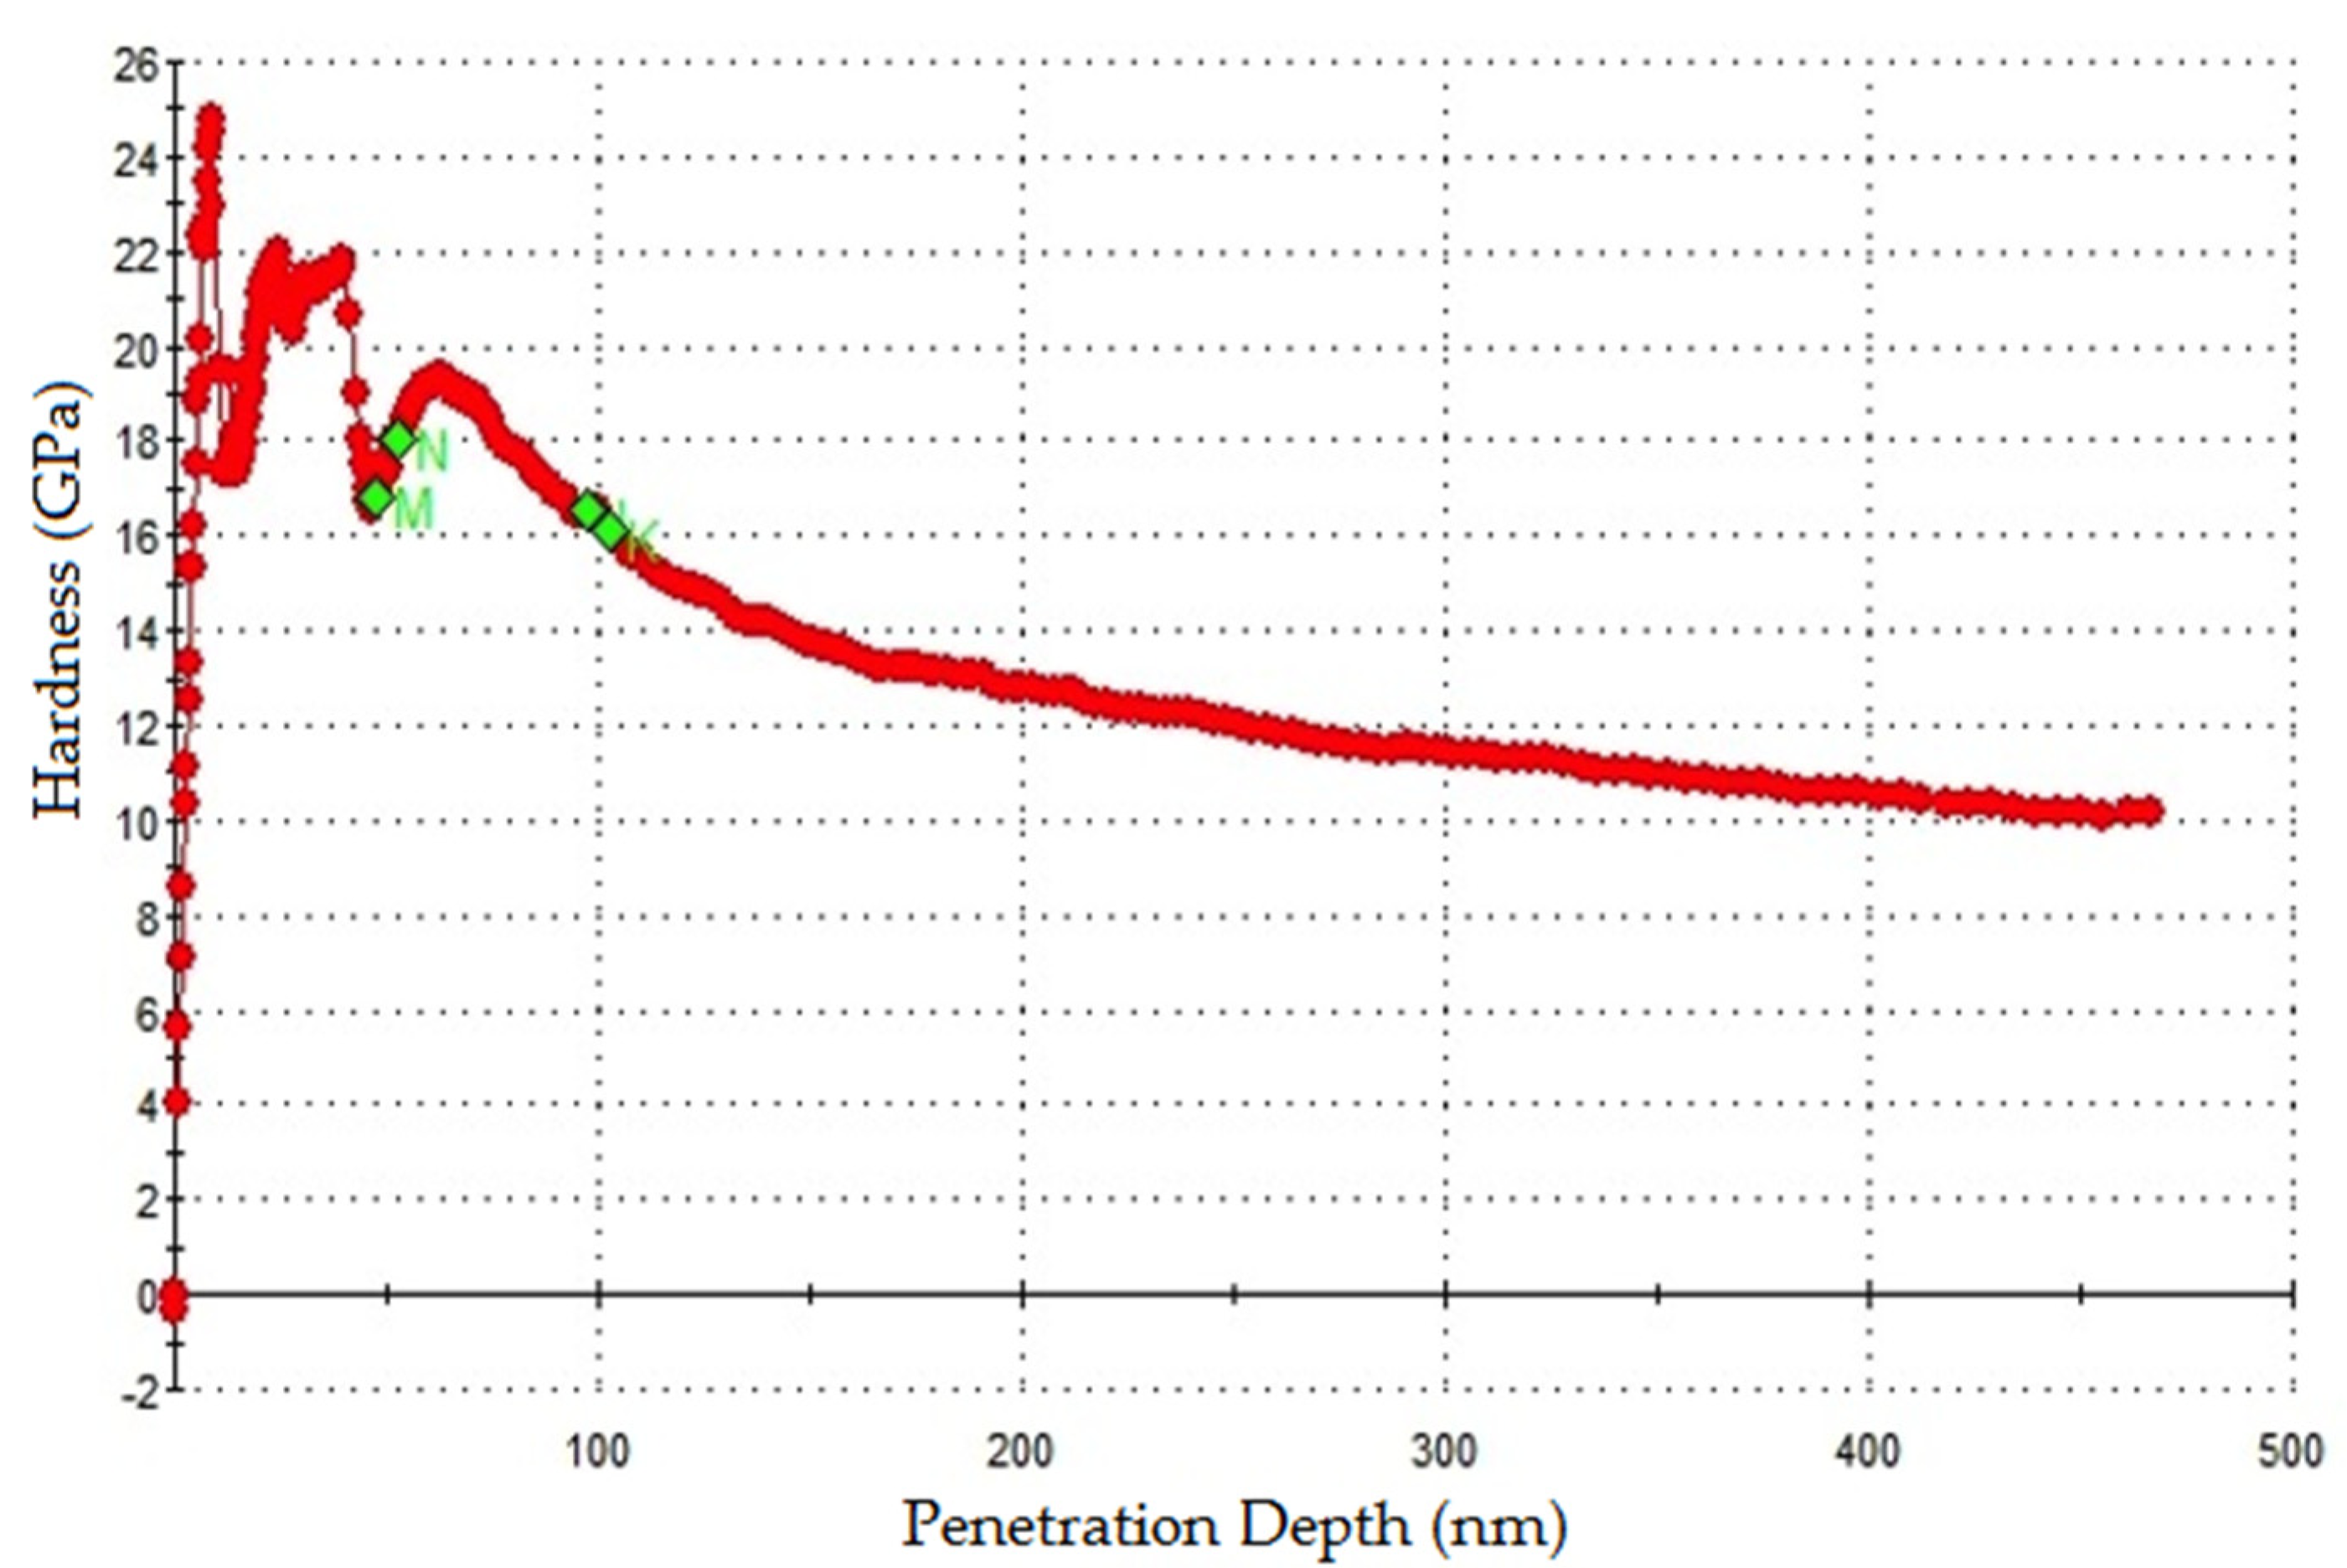
The variations of elastic modulus and hardness with the depth of indentation on glass flakes are shown in Figure 9 and Figure 10, whereas those of vinyl ester matrix are shown in Figure 11 and Figure 12. It can be seen that the modulus of the glass flake phase is higher than that of the matrix. Both the elastic modulus and hardness values tend to decease with the depth of penetration and then attain a constant value. The depth of indentation, where the slope of the curve changes, is considered to be the critical depth. The critical depth is found to be around 100 nm. The coatings above the critical depth are subject to failure due to external load and abrasion. It is noteworthy that both elastic modulus and hardness are bulk properties and these are expected to remain constant for a substance. However, the behavior could be attributed to the elastic characteristics of the substrate and the coating material, which is also known as substrate effect.
4. Conclusions
Based on the results reported in this paper, the following conclusions can be made:
- The minimum bond strength of 32 MPa was observed in case of coatings of thickness 300 μm. The tensile bond strength gradually increased from 300 μm to 900 μm, but then decreased in the case of coatings with 1200 μm thickness. This could be due to the weak cohesion of the coatings with the substrate. It was observed that the coatings with thickness 900 μm had the maximum bond strength of 59 MPa.
- For the coatings with thickness 300 μm, the failure was considered to be an adhesion failure. For the coatings with thickness 600 and 900 μm, the failure was due to the cohesion failure of the coatings. In the case of coatings with thickness 1200 μm the failure occurred both at the coating–substrate interface and in the coating layers. Therefore, the failure mode could be either adhesion or cohesion failure.
- The frequency distributions of elastic modulus and hardness obtained from nanoindentation indicated that only 20–25% of the coating is composed of glass flakes and balance is of vinyl ester matrix.
- Both the elastic modulus and hardness decreased with the increase in the depth of penetration and then stabilizes to reach a mean value. The critical depth, at which the material is subject to fail due to external load and abrasion, was found to be around 100 nm.
- Nanoscratch is a simple and accurate technique to evaluate the bond strength of glass flake filled vinyl ester coatings. The mode of failure can also be determined from the nanoscratch test.
Author Contributions
Salim Barbhuiya conceived and designed the experiments and wrote the paper. Mohammad Ikbal Choudhury performed the experiments and analysed the data.
Conflicts of Interest
The authors declare no conflict of interest.
References
- Hosseini, S.; Heidarpour, A.; Collins, F.; Hutchinson, C.R. Effect of strain ageing on the mechanical properties of partially damaged structural mild steel. Constr. Build. Mater. 2015, 77, 83–93. [Google Scholar] [CrossRef]
- Zhou, C.; Lu, X.; Xin, Z.; Liu, J.; Zhang, Y. Polybenzoxazine/SiO2 nanocomposite coatings for corrosion protection of mild steel. Corros. Sci. 2014, 80, 269–275. [Google Scholar] [CrossRef]
- Yurchenko, R.; Pogrebova, L.; Pilipenko, T.; Shubina, T. Anticorrosive properties of N-acetylmethylpyridinium bromides. Russ. J. Appl. Chem. 2006, 79, 1100–1104. [Google Scholar] [CrossRef]
- Abdallah, M.; Helal, E.A.; Fouda, A.S. Aminopyrimidine derivatives as inhibitors for corrosion of 1018 carbon steel in nitric acid solution. Corros. Sci. 2006, 48, 1639–1654. [Google Scholar] [CrossRef]
- Fayomi, O.S.I.; Popoola, A.P.I.; Aigbodion, V.S. Investigation on microstructural, anti-corrosion and mechanical properties of doped Zn–Al–SnO2 metal matrix composite coating on mild steel. J. Alloys Compd. 2015, 623, 328–334. [Google Scholar] [CrossRef]
- Hosseini, M.G.; Ehteshamzadeh, M.; Shahrabi, T. Protection of mild steel corrosion with Schiff bases in 0.5 M H2SO4 solution. Electrochim. Acta 2007, 52, 3680–3685. [Google Scholar] [CrossRef]
- Shetty, S.D.; Shetty, P.; Nayak, H.V.S. The inhibition action of N-furfuryl-N′-phenyl thiourea on the corrosion of mild steel in acid media. J. Ser. Chem. Soc. 2006, 71, 1073–1082. [Google Scholar] [CrossRef]
- Chowdhury, M.A.; Debnath, U.K.; Nuruzzaman, D.M.; Islam, M. Erosion of mild steel for engineering design and applications. J. Bio- Tribo-Corros. 2017, 3, 34. [Google Scholar] [CrossRef]
- El Azzouzi, M.; Aouniti, A.; Tighadouin, S.; Elmsellem, H.; Radi, S.; Hammouti, B.; El Assyry, A.; Bentiss, F.; Zarrouk, A. Some hydrazine derivatives as corrosion inhibitors for mild steel in 1.0 M HCl: Weight loss, electrochemichal, SEM and theoretical studies. J. Mol. Liq. 2016, 221, 633–641. [Google Scholar] [CrossRef]
- Barbhuiya, S.; Choudhury, I.; Memon, S. Anti-corrosion behavior of VE/GF coatings on mild steel. Int. J. Mater. Res. 2014, 105, 1227–1229. [Google Scholar] [CrossRef]
- Haddadi, S.A.; Mahdavian, M.; Karimi, E. Evaluation of the corrosion protection properties of an epoxy coating containing sol–gel surface modified nano-zirconia on mild steel. RSC Adv. 2015, 5, 28769–28777. [Google Scholar] [CrossRef]
- Yabuki, A.; Kawashima, A.; Fathona, I.W. Self-healing polymer coatings with cellulose nanofibers served as pathways for the release of a corrosion inhibitor. Corros. Sci. 2014, 85, 141–146. [Google Scholar] [CrossRef]
- Galliano, F.; Landolt, D. Evaluation of corrosion protection properties of additives for waterborne epoxy coatings on steel. Prog. Org. Coat. 2002, 44, 217–225. [Google Scholar] [CrossRef]
- Zaarei, D.; Sarabi, A.A.; Sharif, F.; Kassiriha, S.M. Structure, properties and corrosion resistivity of polymeric nanocomposite coatings based on layered silicates. J. Coat. Technol. Res. 2008, 5, 241–249. [Google Scholar] [CrossRef]
- Sobrinho, L.L.; Ferreira, M.; Bastian, F.L. The effects of water absorption on an ester vinyl resin system. Mater. Res. 2009, 12, 353–361. [Google Scholar] [CrossRef]
- Ehsani, M.; Khonakdar, H.A.; Ghadami, A. Assessment of morphological, thermal, and viscoelastic properties of epoxy vinyl ester coating composites: Role of glass flake and mixing method. Prog. Org. Coat. 2013, 76, 238–243. [Google Scholar] [CrossRef]
- Jin, T.; Kong, F.M.; Bai, R.Q.; Zhang, R.L. Anti-corrosion mechanism of epoxy-resin and different content Fe2O3 coatings on magnesium alloy. Front. Mater. Sc. 2016, 10, 367–374. [Google Scholar] [CrossRef]
- Bouzakis, K.D.; Asimakopoulos, A.; Michailidis, N.; Pavlidou, E.; Erkens, G. The inclined impact test, an efficient method to characterize coatings cohesion and adhesion properties. Tribol. Ind. 2005, 27, 3–11. [Google Scholar] [CrossRef]
- Tiwari, A. Nanomechanical analysis of hybrid silicones and hybrid epoxy coatings—A brief review. Adv. Chem. Eng. Sc. 2012, 2, 34–44. [Google Scholar] [CrossRef]
- Hu, H.; Onyebueke, L.; Abatan, A. Characterizing and modeling mechanical properties of nanocomposites —Review and evaluation. J. Miner. Mater. Charact. Eng. 2010, 9, 275–319. [Google Scholar] [CrossRef]
- Herbert, E.G.; Oliver, W.C.; Pharr, G.M. Nanoindentation and the dynamic characterization of viscoelastic solids. J. Phys. D Appl. Phys. 2008, 41, 742–751. [Google Scholar] [CrossRef]
- Roy, S.; Darque-Ceretti, E.; Felder, E.; Raynal, F.; Bispo, I. Experimental analysis and finite element modelling of nanoscratch test applied on 40–120 nm SiCN thin films deposited on Cu/Si substrate. Thin Solid Films 2010, 518, 3859–3865. [Google Scholar] [CrossRef]
- Vencl, A.; Arostegui, S.; Favaro, G.; Zivic, F.; Mrdak, M.; Mitrović, S.; Popovic, V. Evaluation of adhesion/cohesion bond strength of the thick plasma spray coatings by scratch testing on coatings cross-sections. Tribol. Int. 2011, 44, 1281–1288. [Google Scholar] [CrossRef]
- Beake, B.D.; Vishnyakov, V.M.; Harris, A.J. Nano-scratch testing of (Ti,Fe)Nx thin films on silicon. Surf. Coat. Technol. 2017, 309, 671–679. [Google Scholar] [CrossRef]
- Kabir, M.S.; Munroe, P.; Zhou, Z.; Xie, Z. Scratch adhesion and tribological behaviour of graded Cr/CrN/CrTiN coatings synthesized by closed-field unbalanced magnetron sputtering. Wear 2017, 380, 163–175. [Google Scholar] [CrossRef]
- Yu, H.; Zhang, W.; Wang, H.; Guo, Y.; Wei, M.; Song, Z.; Wang, Y. Bonding and sliding wear behaviors of the plasma sprayed NiCrBSi coatings. Tribol. Int. 2013, 66, 105–113. [Google Scholar] [CrossRef]
- ASTM D1876-08(2015)e1 Standard Test Method for Peel Resistance of Adhesives (T-Peel Test); ASTM International: West Conshohocken, PA, USA, 2015.
Figure 1.
Samples embedded in resin.

Figure 2.
Schematic of the tensile test used.

Figure 3.
Typical load–displacement curve.
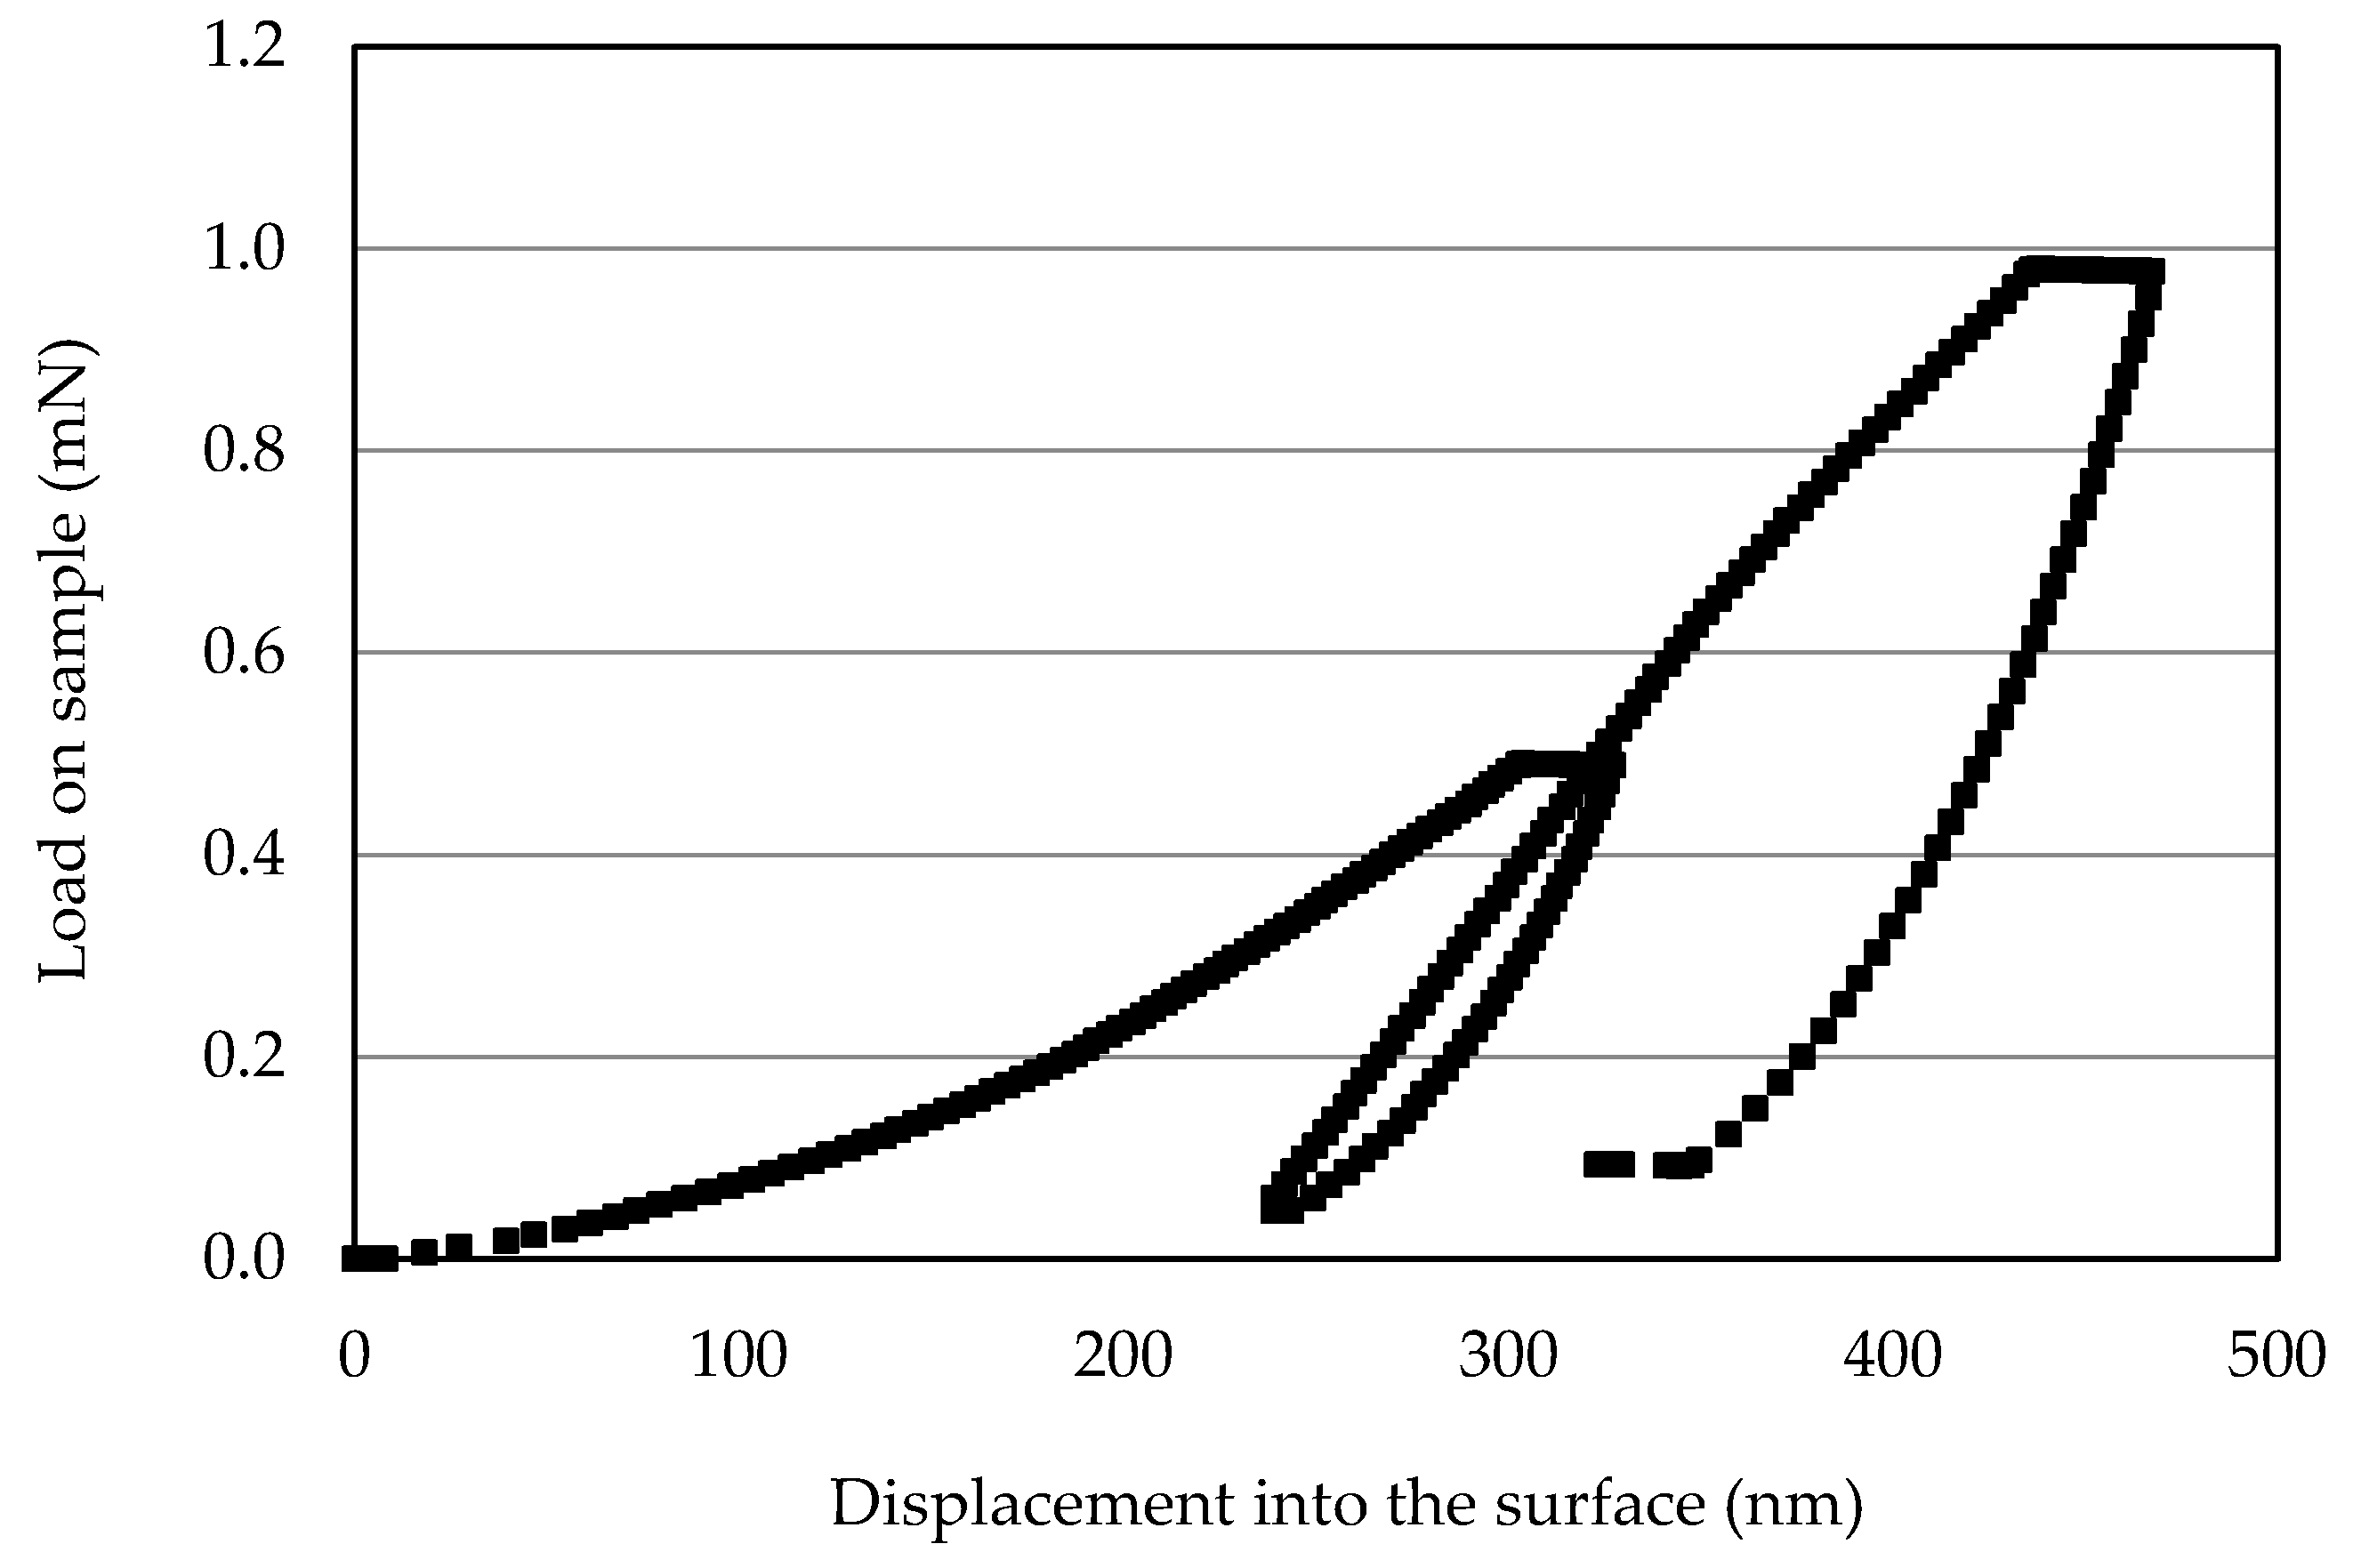
Figure 4.
SEM image showing cone formation (coating thickness: 300 μm).

Figure 5.
SEM image showing cone formation (coating thickness: 600 μm).

Figure 6.
SEM image showing cone formation (coating thickness: 900 μm).

Figure 7.
SEM image showing cone formation (coating thickness: 1200 μm).

Figure 8.
Variation of elastic modulus with the number of indents on the coating (300 μm).
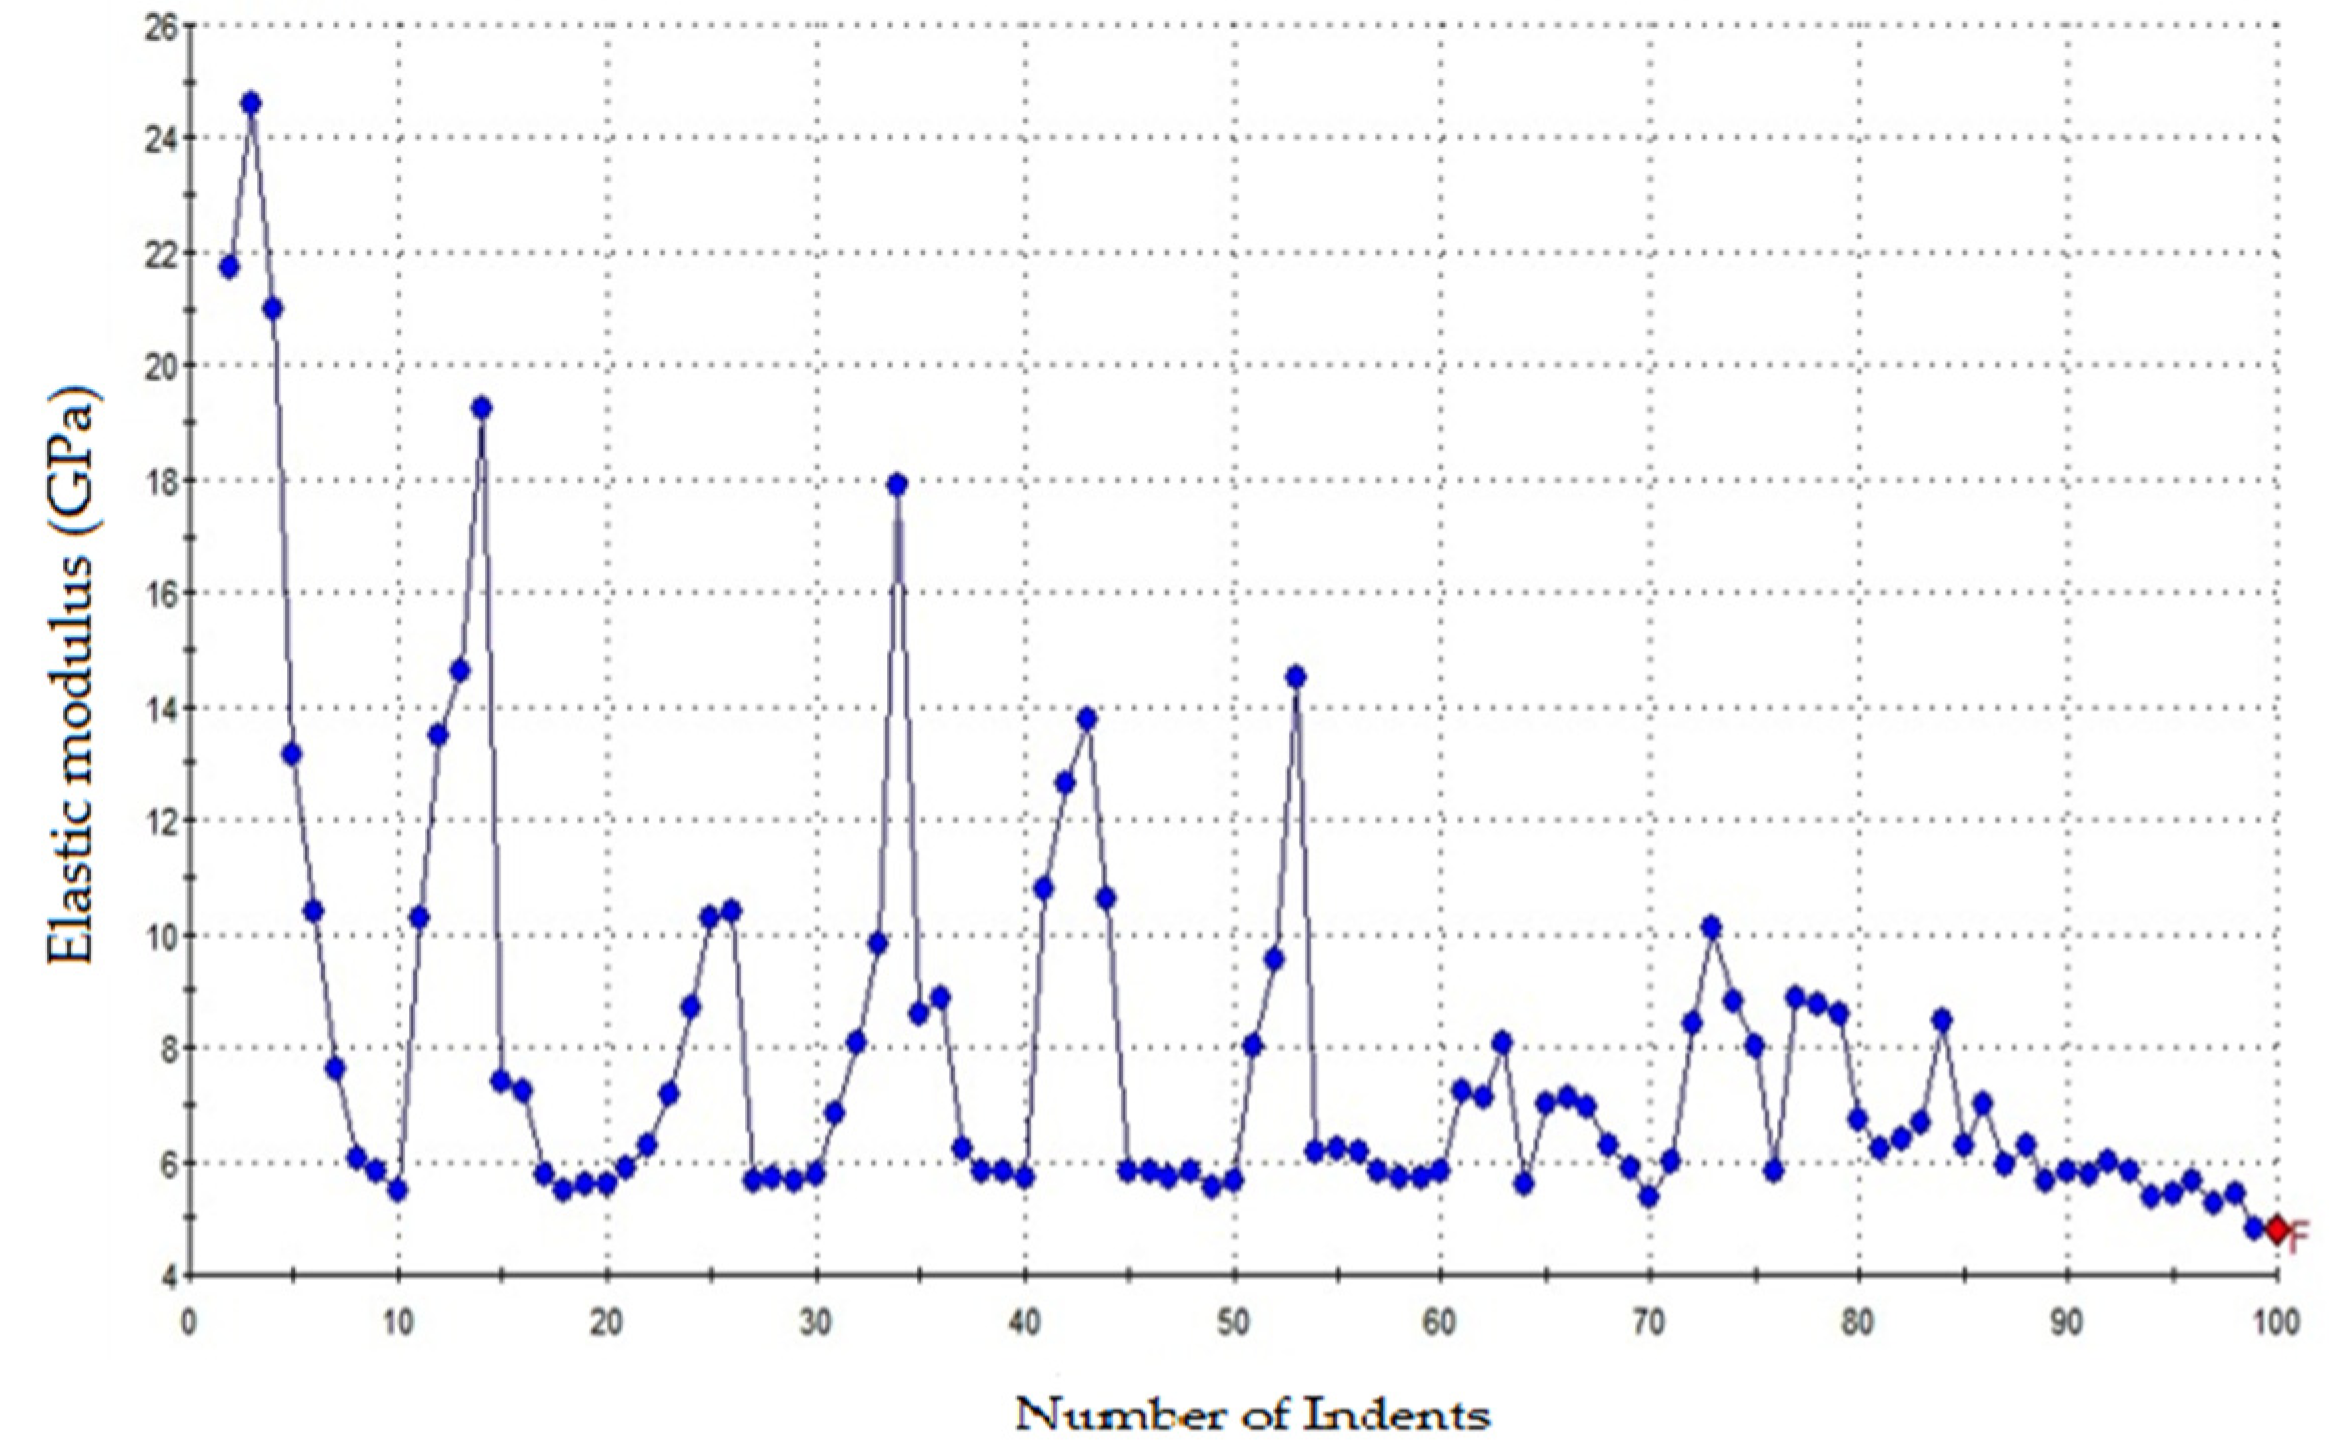
Figure 9.
Variation of elastic modulus with the depth of indentation on glass flakes.
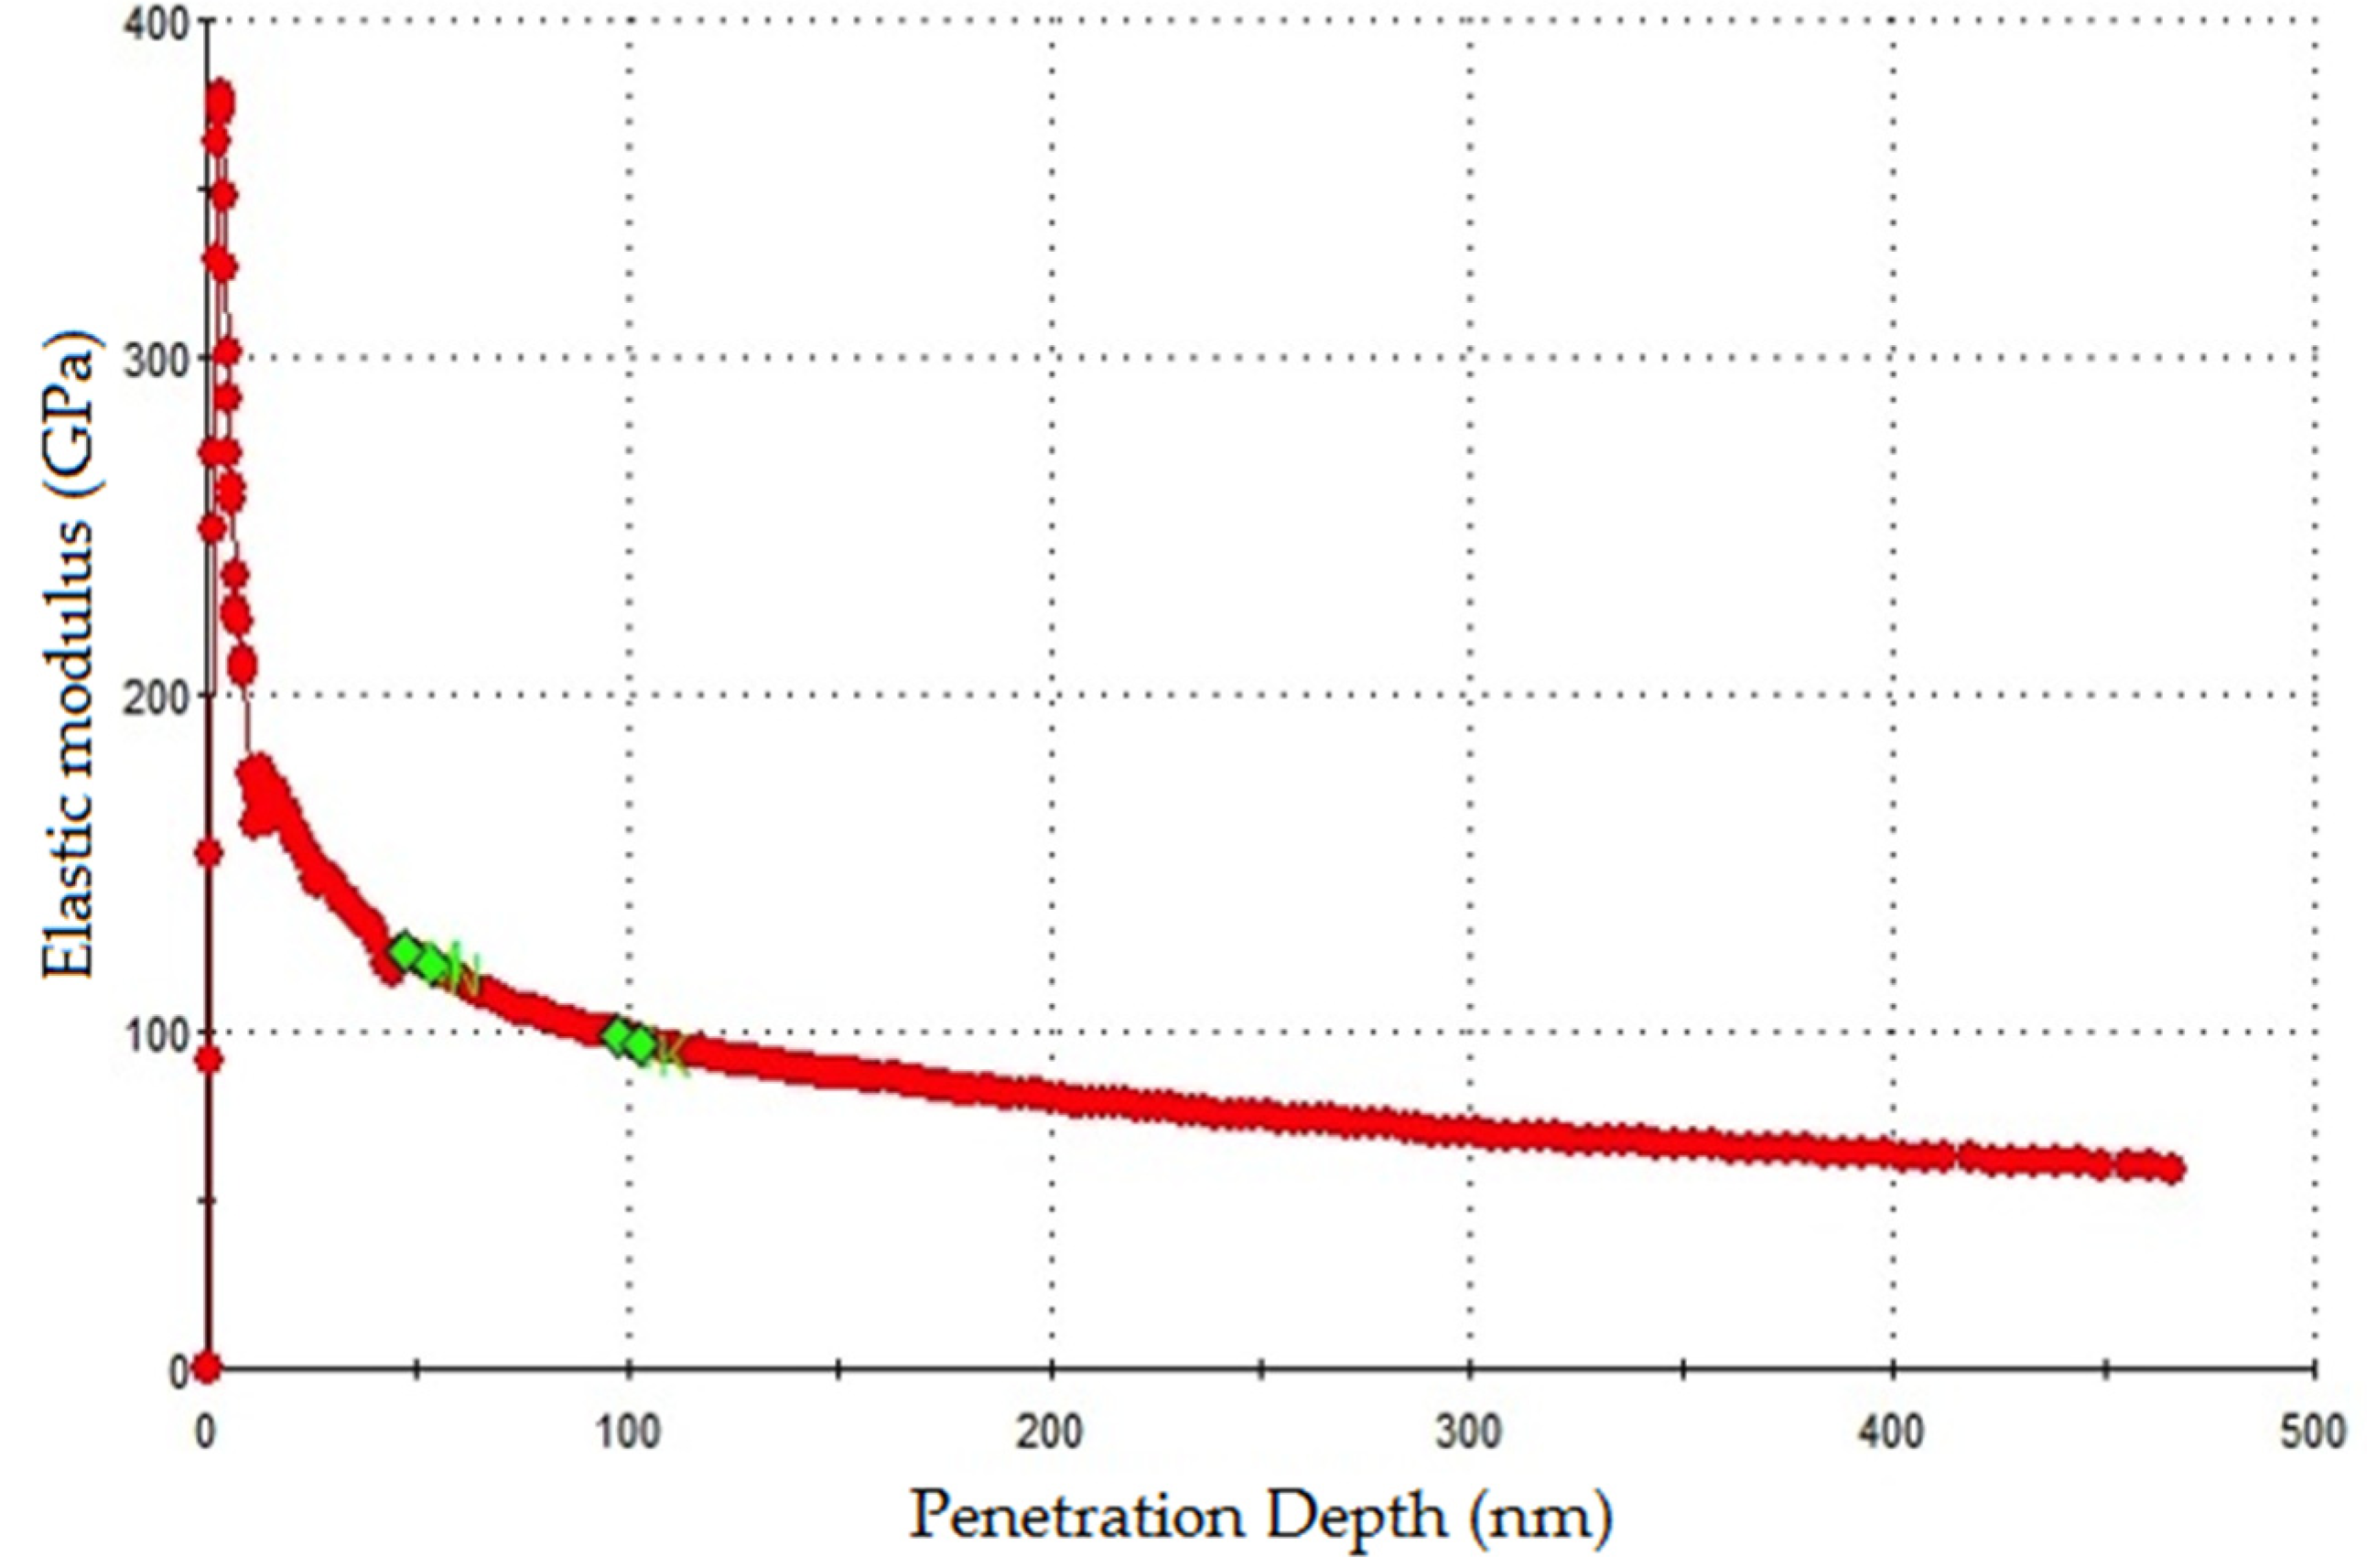
Figure 10.
Variation of hardness with the depth of indentation on glass flakes.

Figure 11.
Variation of elastic modulus with the depth of indentation on vinyl ester matrix.
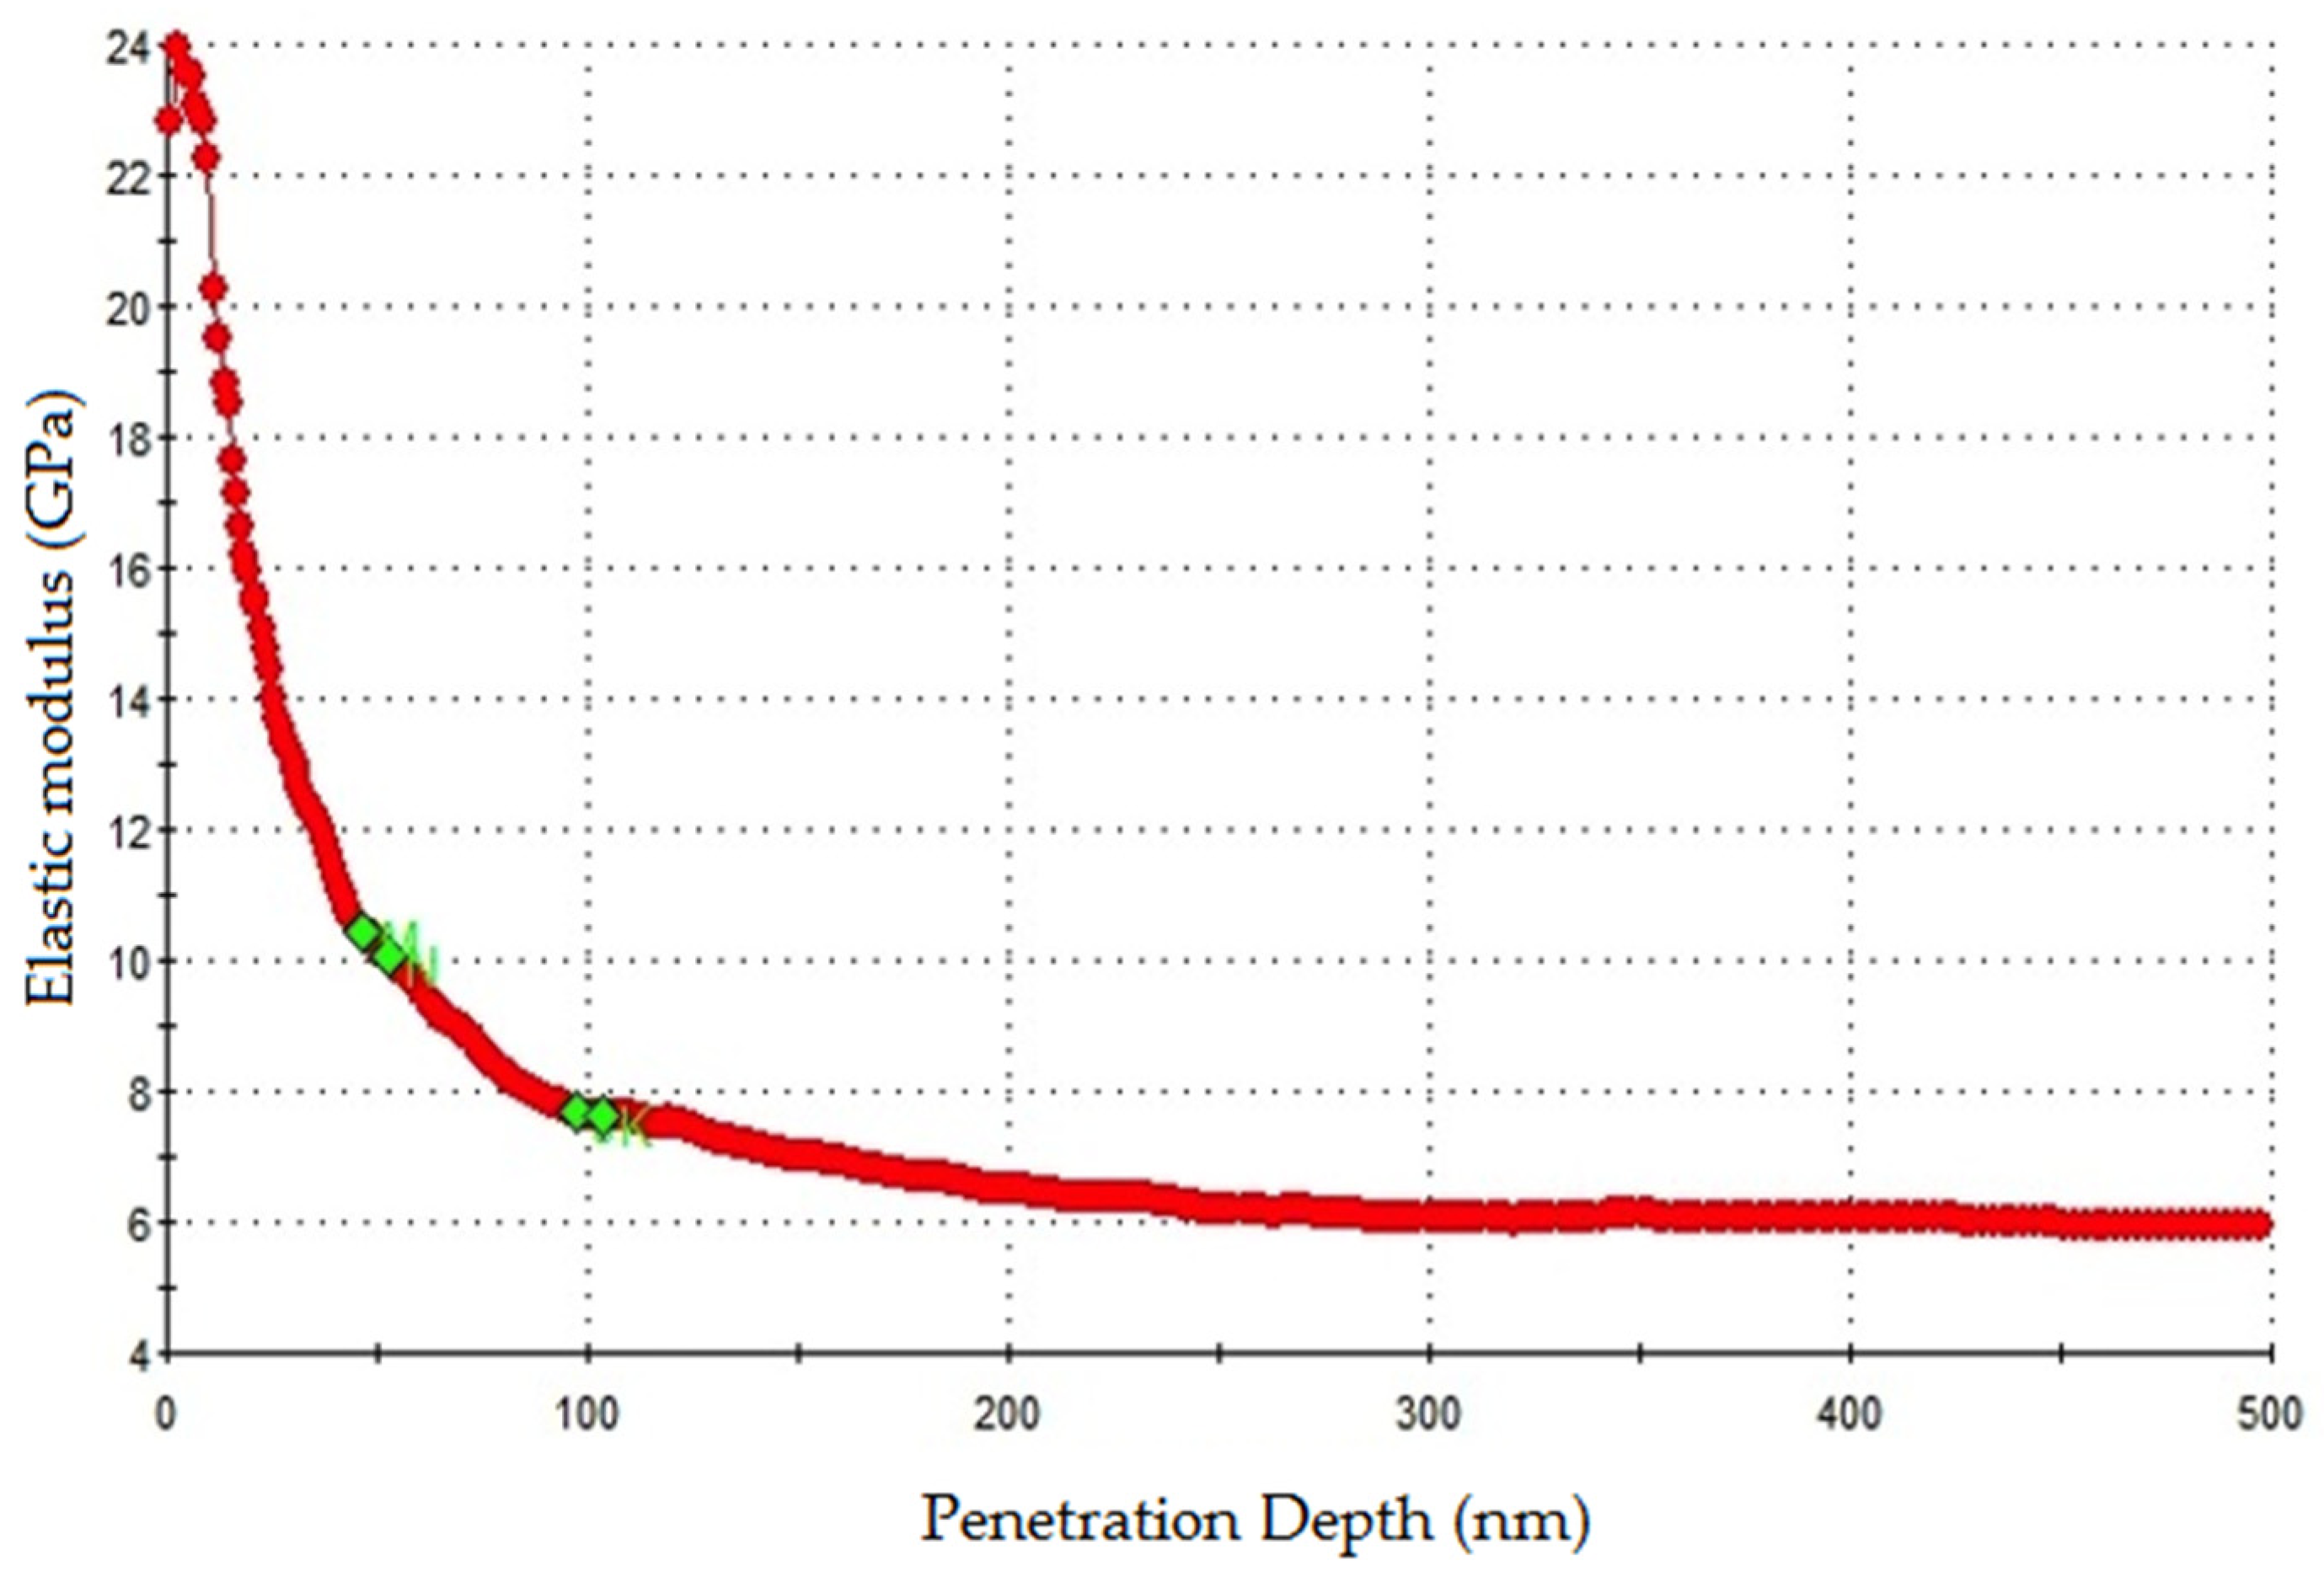
Figure 12.
Variation of hardness with the depth of indentation on vinyl ester matrix.

Table 1.
Summary of parameters obtained from SEM after nanoscratch.
| Coating Thickness (μm) | Cone Length, Lx (μm) | Cone Width, 2Ly (μm) | Projected Cone Area, A (μm2) | Mode of Failure |
|---|---|---|---|---|
| 300 | 7.16 | 8.96 | 32.08 | Adhesion failure |
| 600 | 5.36 | 7.25 | 19.43 | Cohesion failure |
| 900 | 3.59 | 4.46 | 8.02 | Cohesion failure |
| 1200 | 6.42 | 7.14 | 22.85 | Adhesion/Cohesion failure |
Table 2.
Tensile bond strengths of coatings using ASTM D1876-08 (2015) [27].
Table 2.
Tensile bond strengths of coatings using ASTM D1876-08 (2015) [27].
| Coating Thickness (μm) | Bond Strength (MPa) | Mode of Failure |
|---|---|---|
| 300 | 32.2 | Adhesion failure |
| 600 | 48.6 | Cohesion failure |
| 900 | 59.0 | Cohesion failure |
| 1200 | 46.7 | Adhesion/Cohesion failure |
Table 3.
Nanomechanical properties of coatings.
| Indentation Grids | Elastic Modulus (GPa) | Hardness (GPa) | ||||
|---|---|---|---|---|---|---|
| Mean | Std. Dev. | % COV | Mean | Std. Dev. | % COV | |
| Grid 1 | 5.466 | 1.854 | 33.91 | 0.256 | 0.107 | 41.88 |
| Grid 2 | 8.014 | 9.759 | 121.7 | 0.682 | 1.211 | 177.53 |
| Grid 3 | 14.761 | 16.284 | 110.32 | 1.534 | 2.295 | 149.62 |
| Grid 4 | 12.141 | 19.223 | 158.33 | 1.057 | 2.585 | 244.56 |
| Grid 5 | 9.103 | 10.858 | 119.29 | 0.566 | 1.031 | 181.97 |
| Grid 6 | 6.45 | 4.638 | 71.91 | 0.373 | 0.661 | 177.15 |
© 2017 by the authors. Licensee MDPI, Basel, Switzerland. This article is an open access article distributed under the terms and conditions of the Creative Commons Attribution (CC BY) license (http://creativecommons.org/licenses/by/4.0/).
Share and Cite
MDPI and ACS Style
Barbhuiya, S.; Choudhury, M.I. Nanoscale Characterization of Glass Flake Filled Vinyl Ester Anti-Corrosion Coatings. Coatings 2017, 7, 116. https://doi.org/10.3390/coatings7080116
AMA Style
Barbhuiya S, Choudhury MI. Nanoscale Characterization of Glass Flake Filled Vinyl Ester Anti-Corrosion Coatings. Coatings. 2017; 7(8):116. https://doi.org/10.3390/coatings7080116
Chicago/Turabian StyleBarbhuiya, Salim, and Mohammad Ikbal Choudhury. 2017. "Nanoscale Characterization of Glass Flake Filled Vinyl Ester Anti-Corrosion Coatings" Coatings 7, no. 8: 116. https://doi.org/10.3390/coatings7080116
Note that from the first issue of 2016, this journal uses article numbers instead of page numbers. See further details here.