A Study of CO2 Laser Treatment on Colour Properties of Cotton-Based Fabrics

Institute of Textiles and Clothing, The Hong Kong Polytechnic University, Hung Hom, Kowloon, Hong Kong, China
*
Author to whom correspondence should be addressed.
Coatings 2017, 7(8), 131; https://doi.org/10.3390/coatings7080131
Submission received: 18 July 2017
/
Revised: 16 August 2017
/
Accepted: 18 August 2017
/
Published: 20 August 2017
(This article belongs to the Special Issue Laser Surface Treatment)
Abstract
:In this study, laser was applied to two types of cotton-based woven fabrics in order to study the effect of CO2 laser technology on colour and fabric strength properties. The woven fabrics had different fibre compositions, i.e., one was 100% cotton while the other had 60% cotton blended with 40% polyester. They were treated with different combinations of laser processing parameters, i.e., resolution (52, 60, and 68 dpi) and pixel time (110, 120, 130, and 140 μs). There were two approaches adopted: (1) laser treated and then dyed (LD); and (2) first dyed and then laser treated (DL), in order to study the effects of the two different sequences on the resultant colour. Colour properties include reflectance value, colour yield, CIE L*a*b* values and levelness measured by spectrophotometer; pH value and tensile strength were also measured. It was discovered that laser treatment had no influence on chromaticity of cotton fabrics. Moreover, fabrics treated with laser had a lighter shade than the control samples. This confirmed that both approaches, i.e., laser treatment conducted before and after dyeing, can provide a colour fading effect. The tensile strength of fabrics was affected differently in relation to the dyeing and laser process. According to results obtained from the pH measurement, it is confirmed that laser treatment can provide a colour fading effect without affecting the pH value, and the fabrics can be used instantly right after the laser treatment.
1. Introduction
Colour is one of the most important characteristics of fabric or apparel that the consumer considers when buying and wearing clothes. Colour reflects one’s personality and mood. By simply changing the hue of different colours, patterns can be created. From the mid-1980s onwards, several treatments have been used for fabric colouring effects, especially in denim. These treatments include stonewashing, sand blasting, bleaching, brushing, etc. [1,2,3,4,5,6]. However, the increasing concerns of pollution and protection of the environment have resulted in the need for environment-friendly methods of surface treatment. Laser treatment is essentially a physical process which offers advantages over the conventional chemical methods. It enables precise surface modification in a short time. It is easy to apply and control and is also environmentally clean as there is no consumption of water and chemicals.
In many studies, the effect of laser treatment on the colour properties is mainly focused on the decolourisation of 100% cotton fabric [1,2,7]. However, the effect of laser treatment, using commercially production scale laser machine, on colour properties, involving its effect of dyeing, on 100% cotton woven fabrics has been studied in recent years [7,8,9,10] but its effect on cotton-blended fabrics, such as cotton/polyester fabrics, have been seldom reported. In our previous work [8,11], we compared some physical and chemical properties of laser treated pure cotton and cotton/polyester blended fabrics. In order to have a better understanding of the effect of treatment approach on the change in colour shade under different parameters after laser treatment, colour properties of pure cotton and cotton/polyester blended fabric have been studied and evaluated in this study. Parameters considered in this study include fibre composition and treatment approaches. In addition, the change in fabric strength because of colour change due to laser treatment has also been investigated. This study would provide useful coloristic information for industrial production if laser effect would be applied for pure cotton or cotton/polyester blended fabrics.
2. Experimental
2.1. Materials
Two ready-for-dyeing twill woven fabrics were supplied by Lai Tak Enterprises Company Limited, Hong Kong, with specifications as shown in Table 1 [8]. The main difference between the two was percentage of cotton fibre. The fabrics were rinsed with 30 mL/L acetone (Sigma-Aldrich, Hong Kong, China) for 10 min to remove any grease and dirt on the surface. After washing, the fabrics were rinsed with water and hydro-extracted in a Nyborg C290R Hydro-extractor (Electrolux, Stockholm, Sweden) for 5 min. Lastly, the fabrics were dried in a Nyborg T4350 tumble dryer (Electrolux, Stockholm, Sweden) for 15 min. All the cleaned fabrics were conditioned under the standard condition of 65 ± 2% relative humidity and 21 ± 1 °C for at least 24 h prior to experiments.
2.2. Laser Treatment
Commercial pulsed CO2 laser engraving machine (GFK Marcatex FLEXI-150, Jeanologia S.L., Valencia, Spain) was used under normal atmospheric conditions, coupled with an Easymark 2009 laser system (Rofin, Hamburg, Germany). Specifications of the laser machine and parameters used for the experiment are listed in Table 2 [11]. Fabric pieces of size 20 cm × 20 cm were subjected to laser treatment under different combinations of resolution and pixel time for easy comparison [12,13].
2.3. Laser Treatment Approach
Fabrics were treated with different processing approaches: (1) laser treated and then dyed (LD); and (2) dyed and then laser treated (DL). For approach 1 (LD), fabrics were first laser treated under different combinations of laser parameters. After being conditioned (relative humidity: 65 ± 2%; temperature: 21 ± 1 °C; at least 24 h), the laser treated fabrics were dyed. For approach 2 (DL), fabrics were first dyed and then taken for laser treatment after being dried and conditioned (relative humidity: 65 ± 2%; temperature: 21 ± 1 °C; at least 24 h).
2.4. Dyeing
C.I. Reactive Blue 19 (RB19) (Figure 1) supplied by DyStar Limited Company (Shanghai, China) was used, without further purification. Other auxiliaries (Reagent Grade) used for dyeing were purchased from the Kou Hing Hong Scientific Supplies Limited Company, Hong Kong. Three dye concentrations were used, i.e., 0.1%, 1% and 5% owf (on-weight of fabric). The dyeing recipes and procedures were as shown in Table 3 and Figure 2 respectively. After dyeing, the samples were rinsed with cold water and soaped with 1 g/L detergent for 10 min at 90 °C. Then, the samples were rinsed in cold water again and dried in oven at 90 °C.
2.5. Colour Measurement
Colour properties, reflectance curve, colour yield (termed as K/S value) and CIE L*a*b* values, were measured by Macbeth Color-Eye7000A spectrophotometer (GretagMacbeth, Singapore) using parameters of D65 daylight with large aperture and 10° standard observer within the visible spectrum (λ = 400–700 nm) at an interval of 10 nm.
2.6. Levelness
The levelness (termed as relative unlevelness index, RUI) was measured in accordance with Chong et al. (1992) [14]. RUI values of <0.2, 0.2–0.49, 0.5–1.0 and >1.0 represent excellent levelness, unlevelness not detectable, good levelness (noticeable unlevelness under close examination), poor levelness (apparent unlevelness) and bad levelness (conspicuous unlevelness), respectively.
2.7. Tensile Strength
The tensile strength of the sample was measured according to ASTM D5034-09 (2013) (Standard Test Method for Breaking Strength and Elongation of Textile Fabric (Grab Test)) using Instron 4411 universal testing machine (ITW, Glenview, IL, USA).
2.8. pH Value Measurement
The pH value of the sample was determined by AATCC Test Method 81-2012 (pH of Water-extract for Wet Processed Textiles). pH in the range of 5–6.5 is the most suitable for human skin [13].
3. Results and Discussion
3.1. Reflectance Value
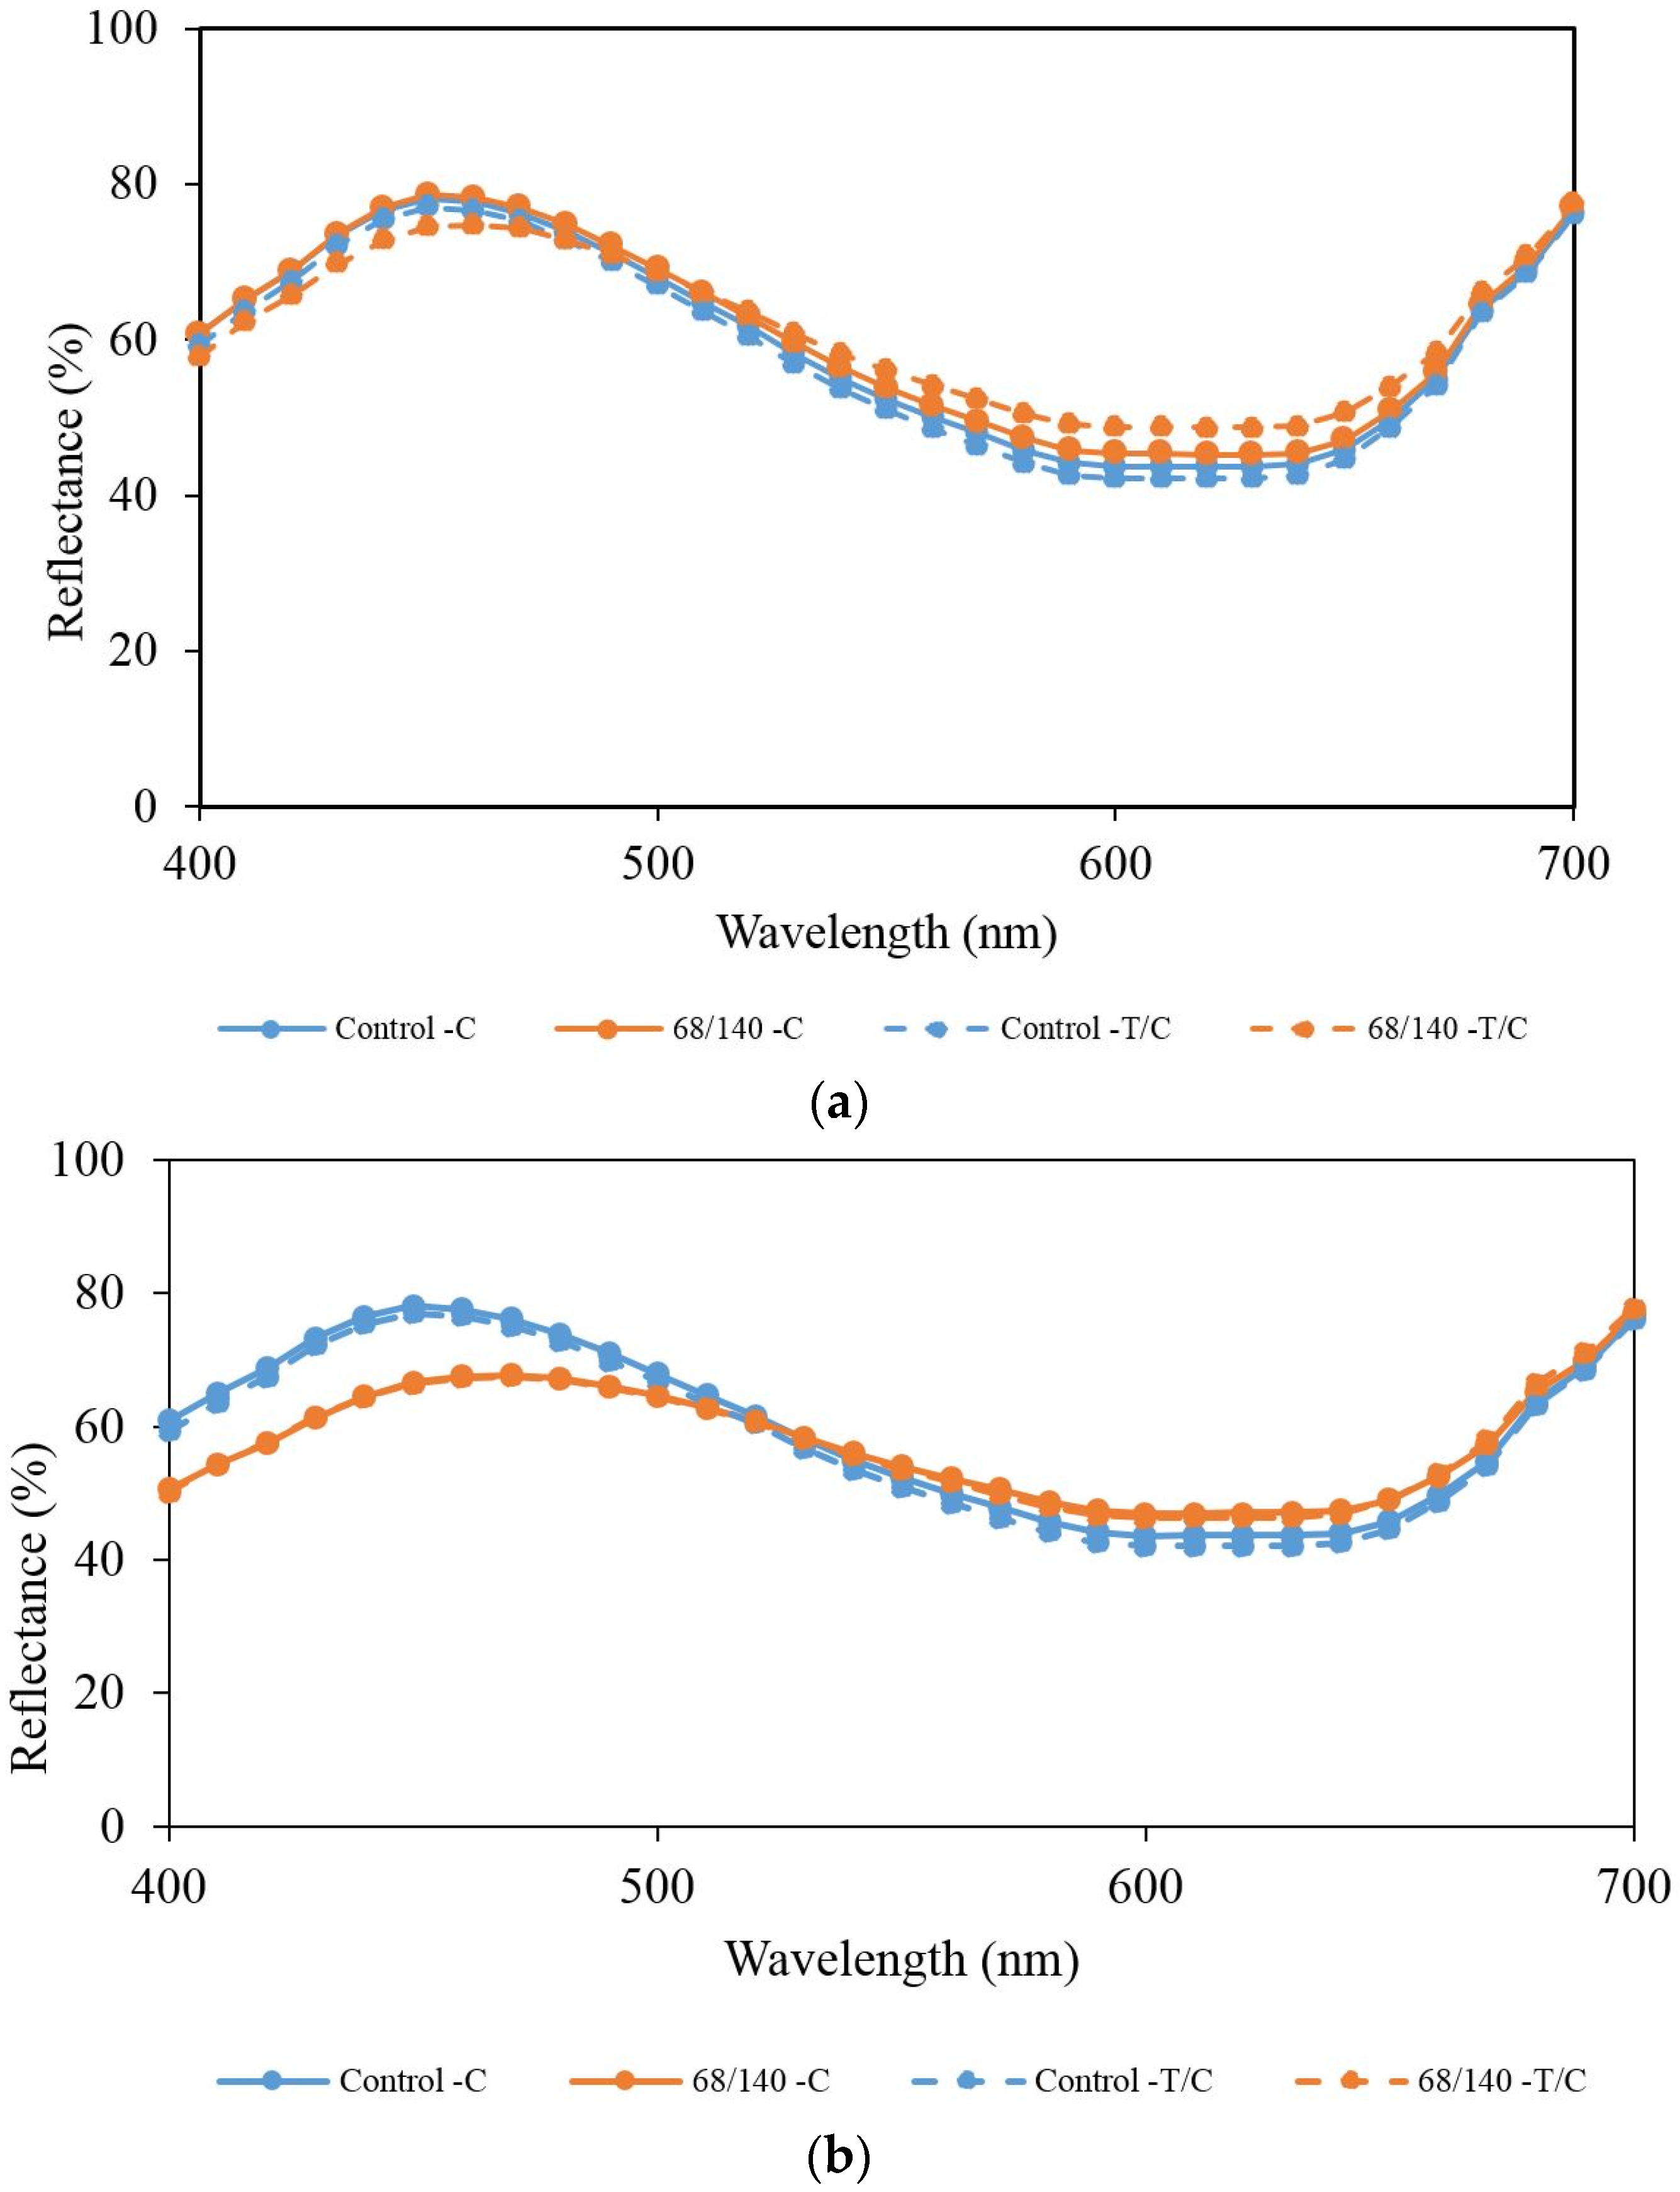
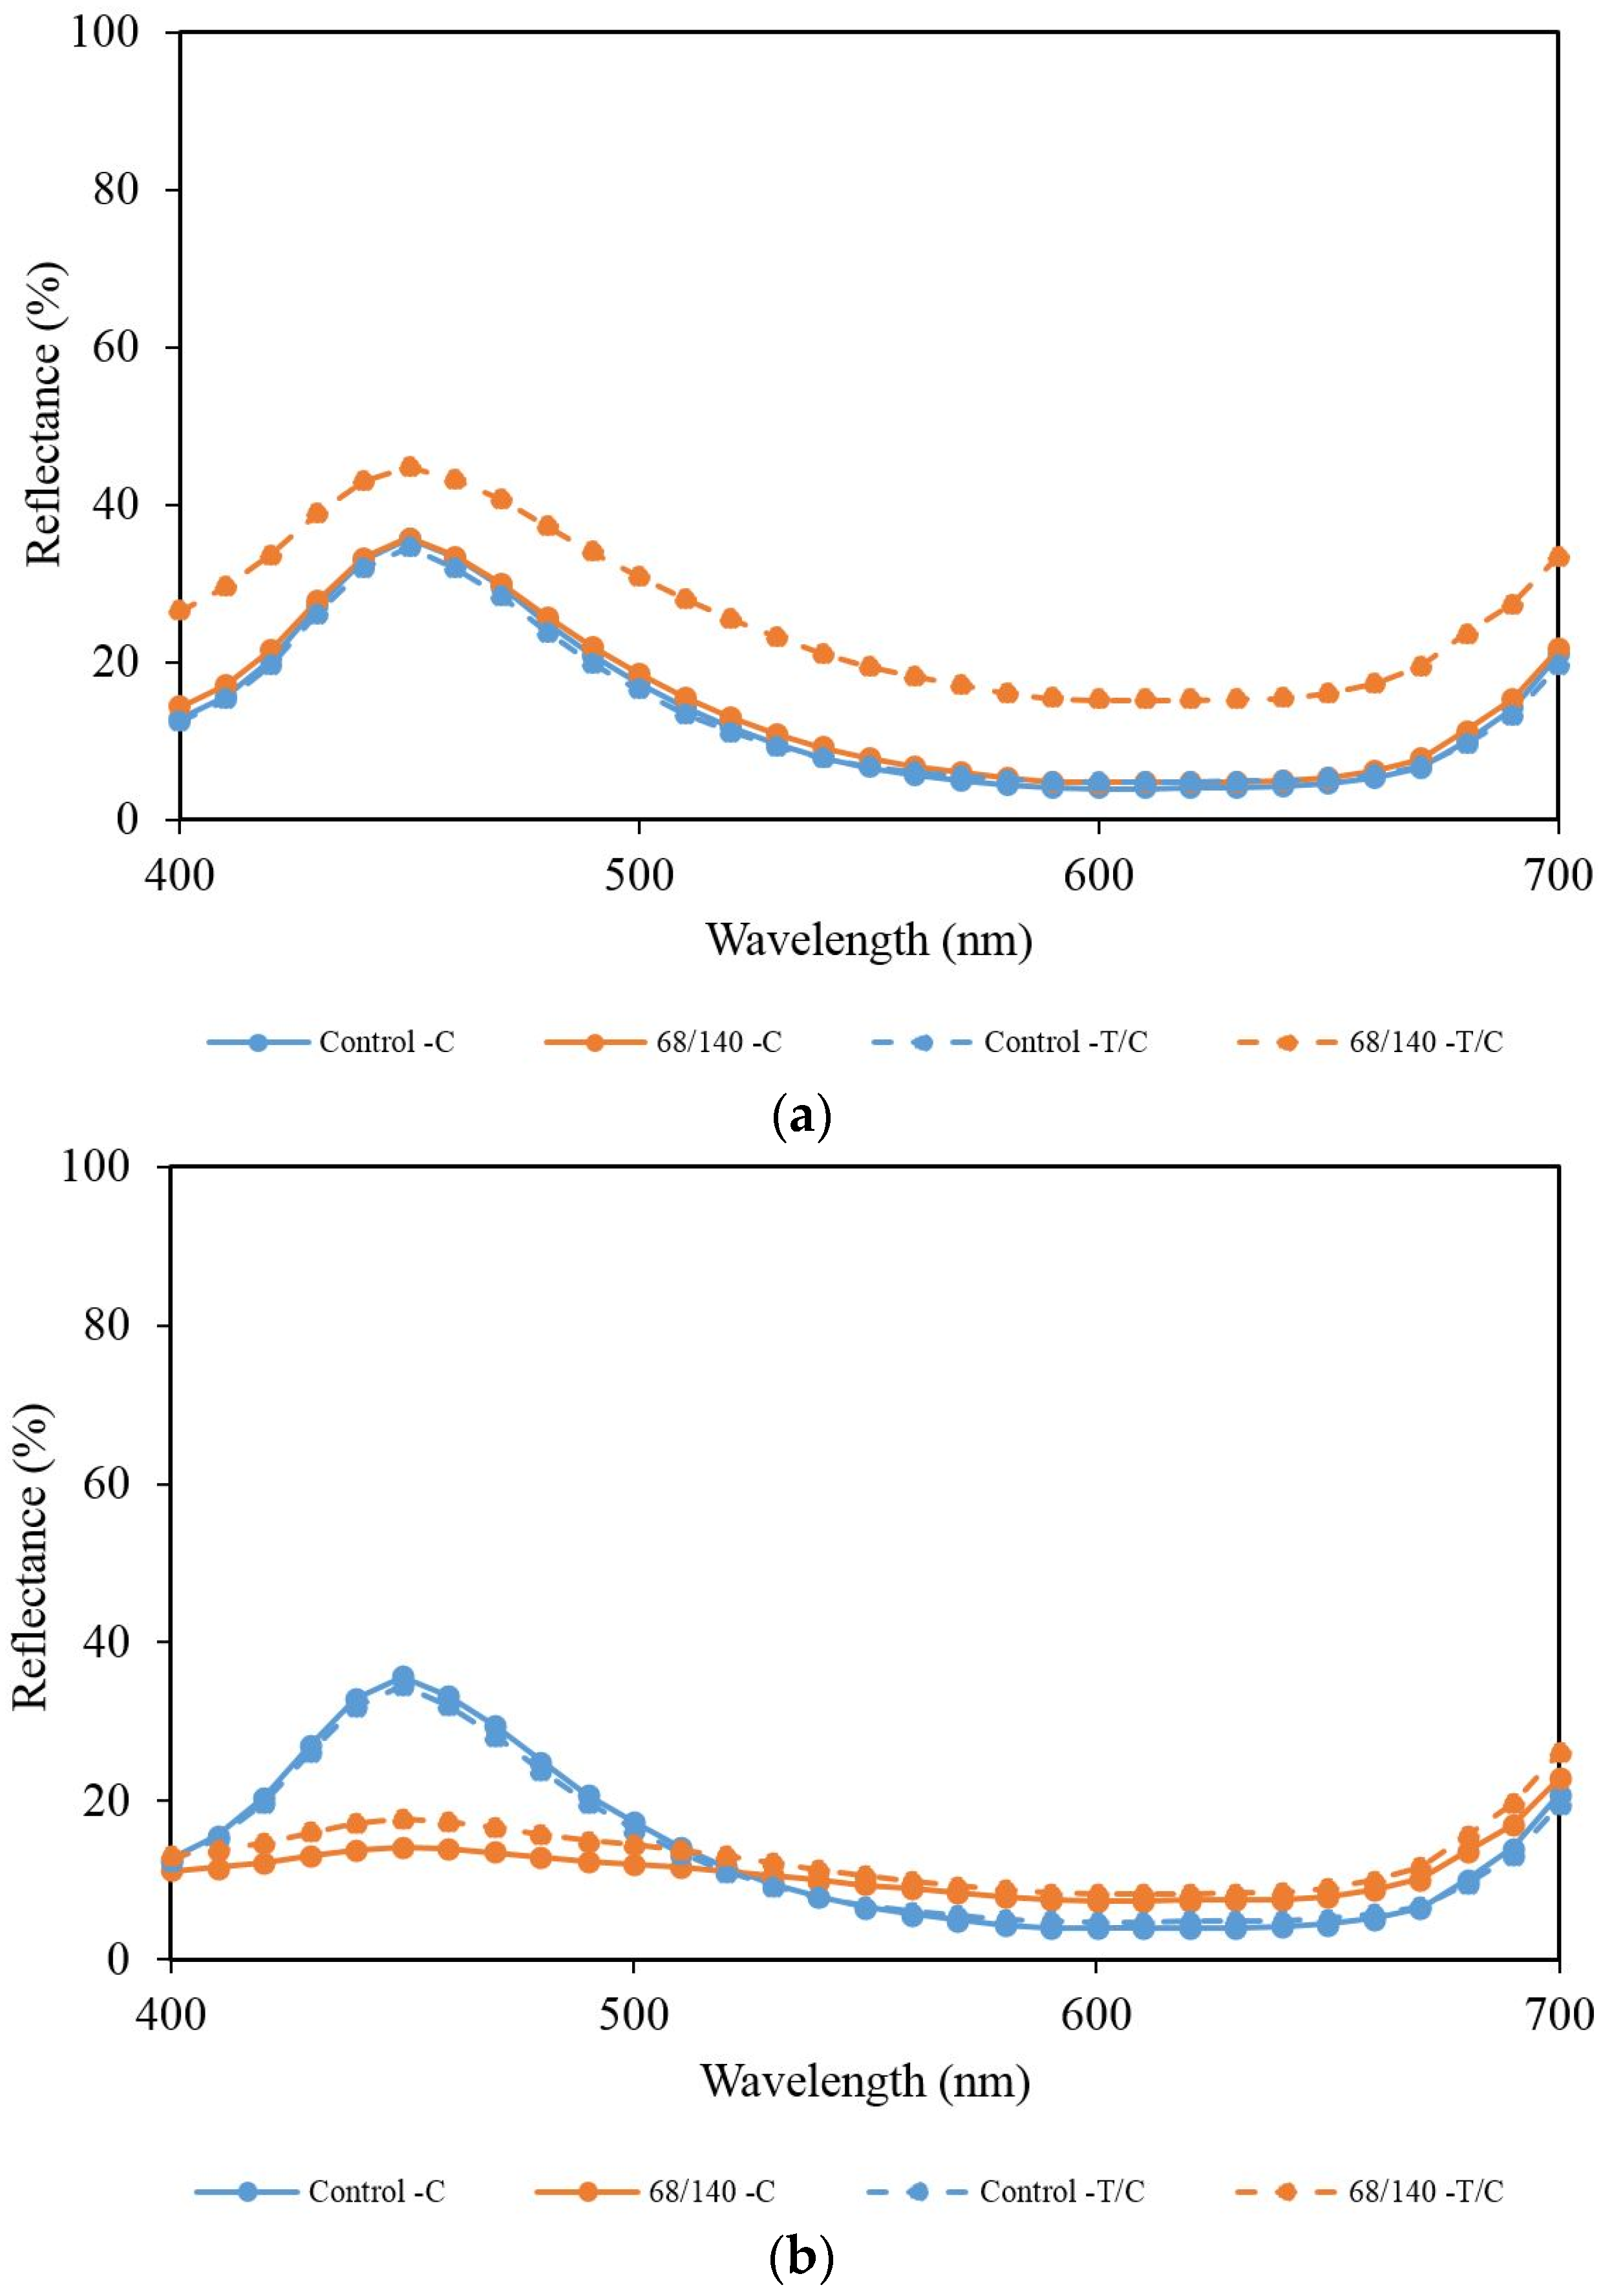
The reflectance curves of C.I. Reactive Blue 19 (RB19) are shown in Figure 3, Figure 4 and Figure 5, for dye concentrations of 0.1%, 1% and 5%, respectively. All the fabrics are dyed either after laser (LD) or before laser (DL). The laser parameters were set to resolution of 52, 60 and 68 dpi and the pixel time of 110, 120, 130 and 140 μs.
Figure 3, Figure 4 and Figure 5 show that reflectance curves (using 68 dpi/140 μs laser parameter as example) have the peak at around 450 nm while a sharp peak appears from between 400 nm and 500 nm. This indicates blue colour region and since the fabrics are dyed with RB19 (a blue dye with three different concentrations), colour of the fabrics appears to be blue. When the shapes of reflectance curves of different approaches are compared with samples without laser treatment, there is no obvious change in the shape. Therefore, laser treatment does not affect chromaticity of cotton fabrics.
Besides the shapes of reflectance curves, positions of curves of samples dyed with three concentrations reveal a similar order for both approaches (Figure 3, Figure 4 and Figure 5). Cotton fabrics dyed with 0.1% blue (Figure 3) have the highest reflectance curves followed by 1% blue (Figure 4), while the 5% blue (Figure 5) has the lowest reflectance curves. The higher the reflectance curve, the lighter is the colour of the fabric and vice versa.
The depth of blue shade for the control and laser-treated samples (LD and DL) are compared (Figure 3, Figure 4 and Figure 5) and the two approaches present different results. The reflectance curves of the LD-treated fabrics are higher compared with fabrics dyed without laser treatment i.e., the control sample. This shows that samples treated with laser before dyeing have a lighter blue surface appearance than the control sample. According to SEM images of cotton fibres in previous papers [8,9], pores are created on the fibre surface due to absorption of thermal heat leading to swelling and bursting during laser irradiation. As a result, parts of the fibres are damaged and removed. In addition, the damaged fibres absorb less dye after laser treatment. It is also proven from the FTIR results discussed in a previous paper [8,9] that the loss of hydroxyl groups reduces the bonding between the dye and the polymer chains within the fibre, thereby lowering the dye absorption. Therefore, LD-treated fabrics have a lighter colour than the control sample. In other words, laser treatment may not improve dyeing performance of cotton fabric but, on the other hand, it can create different colour shades. Patterns with colour shades lighter than the background can be created on the fabric by application of laser before dyeing. The DL-treated fabrics revealed inconsistent patterns throughout the visible spectrum compared with the control sample. In the shorter region of 400–500 nm, reflectance curves of the control sample are higher than the DL-treated fabrics. However, at 520 nm–700 nm, the positions are changed and the DL-treated fabrics are located higher than the control sample. The same pattern is obtained when reflectance curves of LD-treated and DL-treated fabrics are compared. Due to the inconsistency of the curves throughout the visible wavelength, the difference in depth is evaluated using the K/S values.
3.2. Colour Yield
Colour yield of fabric is indicated by the K/S value. The higher the value, the better the colour yield is [15]. Table 4 shows K/S values of cotton fabrics treated with different approaches and dye concentrations. For both LD and DL approaches, the higher the dye concentration, the higher is the K/S sum value. The order is 0.1% < 1% < 5% which is related to those found in the reflectance curves. Besides, the increase in the K/S value is caused by enhancement of dye concentration; the results also show that dyeing properties of fabrics with reactive dye are changed by laser irradiation. Table 4 shows that K/S values of the control cotton samples, i.e., 5.40, 38.99, 167.17 for 0.1%, 1% and 5%, respectively, are higher than those of laser-treated fabrics. This indicates that, without laser treatment, cotton fabric is able to absorb more dyestuff resulting in darker colours. In the two different approaches, the LD-treated cotton fabrics have higher K/S values than DL-treated cotton fabrics under different laser parameters in concentrations of 1% and 5%. In 0.1%, colour yield depends on the combination of laser parameters.
Table 4 shows K/S values of cotton/polyester blended fabrics treated with two different approaches, i.e., LD and DL. The higher the concentration of dye is, the higher is the K/S value. Results of both approaches follow the order of dye concentration, i.e., 0.1% < 1% < 5% which follows the sequence found in the reflectance curves. Besides the increase in the K/S value caused by enhancement of dye concentration, it is also found that K/S values of the control cotton/polyester blended fabrics, i.e., 5.88, 44.81, 150.90 for 0.1%, 1% and 5% respectively, are higher than those of laser-treated cotton/polyester blended fabrics. This indicates that without laser treatment, the fabrics absorb more dye, resulting in darker colour. According to Table 4, cotton/polyester blended fabrics treated with the two approaches and dyed with 5% dye concentration have higher K/S values for DL than LD. As for K/S value of fabric dyed with 1% concentration, K/S values of both approaches are similar when treated with 52 dpi and 110–140 μs. This pattern changes when the cotton/polyester blended fabrics are treated with a higher laser power, i.e., the DL-treated cotton/polyester blended fabrics have higher K/S values than the LD-treated cotton/polyester blended fabrics. With regard to dyeing with concentration of 0.1%, it is similar to 1%. The difference between these two approaches is found when the fabrics are treated with laser power higher than 60 dpi/120 μs. The lower colour yield obtained in the LD-treated cotton/polyester blended fabrics may be due to removal of cotton fibres during laser irradiation. At the same time, polyester fibres melt due to the high temperature and are re-solidified when the reaction stops. Moreover, the melted polyester fibres flow and are bridged together, thereby covering the neighbouring cotton fibres [8]. As a result, less dye gets absorbed into these fibres, resulting in lighter colour.
When the effect of laser processing parameters on colour yield of the two approaches is studied, there is a slight increase of K/S values in the DL-treated cotton/polyester blended fabrics as the laser power is increased. In the case of LD-treated cotton/polyester blended fabrics, K/S values drop when the laser power is increased, and the change is more significant than in the case of DL-treated cotton/polyester blended fabrics. There is around 50% decrease in K/S values of LD-treated cotton/polyester fabrics dyed with 5% dye concentration. The decreasing trend was more predictable with the increase of resolution and pixel time leading to the decrease of K/S values progressively.
3.3. CIE L* Value
CIE L* value defines the lightness of the measured samples. The higher the L* value, the lighter the sample colour will be. The lower the L* value, the deeper the colour of the sample will be. The CIE L* values of control, LD-treated and DL-treated cotton fabrics dyed with different dye concentrations are in the range of 36.80 to 78.79, 38.08 to 81.60 and 37.25 to 81.53 respectively. The control cotton fabric samples have a lower CIE L* value than the laser-treated samples. This reveals that the control samples have a darker shade than the laser-treated samples. The result obtained is equivalent to that found in the colour yield but the difference between CIE L* values of LD-treated and DL-treated cotton fabrics dyed in RB19 is very small.
In the case of cotton/polyester blended fabrics dyed with three different dye concentrations, CIE L* values of all laser-treated samples (LD-treated: 45.03 to 81.71; DL-treated: 39.78 to 80.13) are higher than the control samples (36.90 to 77.99). This means that colour of the control cotton/polyester blended sample is darker than that of the laser-treated sample. CIE L* values of LD-treated cotton/polyester blended fabrics are higher than DL-treated cotton/polyester blended fabrics. The decrease in CIE L* values means that the fabrics have a darker shade when the resolution and pixel time are increased. The decrease in lightness value found in DL treated fabrics may have resulted from the char formed on the fabric surface which imparts a yellowish hue to the fabrics. Thermal oxidation caused by laser treatment makes the fabrics become yellow [9,16]. Since laser is applied to the fabric after dyeing in the case of DL approach, the chars formed remain on the fabric. In the case of the LD approach, the cotton/polyester blended fabrics are dyed and rinsed after laser treatment. As a result, the chars are removed during washing, thereby leaving less or no chars on the fabric surface during colour evaluation. CIE L* values of cotton and cotton/polyester fabrics do not vary much with the two laser treatment approaches.
3.4. CIE a* Value
CIE a* value denotes the greenish or reddish hue of the sample. Positive CIE a* value means a reddish hue while a negative value means a greenish hue. In the case of cotton fabric, Table 5 shows that all samples were located at the negative CIE a* region except the control and LD-treated cotton fabrics dyed with 5% dye concentration which are in the positive CIE a* region. This indicates that except the control and LD-treated cotton fabrics dyed with 5% dye concentration, all have a greenish appearance. When the dye concentration is increased from 0.1% to 1%, the control cotton sample has a less greenish appearance as the bluishness of the fabric increases, thereby lowering the greenish hue of the fabric. The difference between the laser-treated cotton samples i.e., LD and DL, and the control cotton samples in terms of greenish hue in 0.1% and 1% dye concentration was found to be small. CIE a* values of LD-treated and DL-treated cotton fabrics are generally more negative than the control cotton sample. This implies that the laser-treated cotton samples are more greenish than the control cotton samples. Due to the thermal effect generated by the laser beam during treatment, the fibres are carbonised and chars are formed. The yellowish substances contribute to the greenish appearance by mixing with the blue colour of the fabrics [9,16]. As a result, LD-treated and DL-treated cotton fabrics have a more greenish appearance than the control cotton samples. Moreover, when LD and DL approaches were compared in terms of the difference in CIE a* value, the LD-treated cotton fabrics were found to have a less greenish appearance than the DL-treated cotton fabrics. This may be due to washing away of the yellowish char during dyeing after laser treatment [9,16]. The fabrics may thus look less greenish with less yellowish substance left on the fabric surface after dyeing. When the dye concentration is increased to 5%, the reddish shade increases and the control cotton sample has a reddish colour. Similar to the control cotton sample, the LD-treated cotton fabrics also carry a reddish colour when dyed with 5% dye concentration. However, DL-treated cotton fabrics have a different result when dyed with 5% dye. The fabrics have a greenish appearance which may be due to the formation of tars after laser treatment. This yellowish substance gets mixed with the blue colour and a little red colour of the fabric causing the greenish appearance. The greenish appearance found in DL-treated cotton fabrics dyed with 5% dye concentration is less than those dyed with 1% and 0.1%. As the dye concentration is increased, the bluish shade of the RB19 dye becomes dark enough to cover some of the yellowish hue.
In the case of cotton/polyester blended fabric, control cotton/polyester blended samples dyed with both 0.1% and 1% concentration show a negative CIE a* value which indicates that the control cotton/polyester blended sample has a greenish hue. Since 0.1% has a more negative value than 1%, 0.1% had a more greenish hue. However, when the control cotton/polyester blended sample was dyed with 5% concentration, it had a positive CIE a* value which means the control cotton/polyester blended sample had a reddish hue. However, all treated samples, treated by both approaches and dyed with three different dye concentrations, have negative CIE a* values. Hence, cotton/polyester blended samples have a greenish appearance, irrespective of whether laser treatment was before or after dyeing. This may be due to formation of chars on cotton fibres during the laser irradiation [9,16]. These yellowish brown chars formed on the fabric got mixed with the blue colour, resulting in a blue colour with greenish shade. CIE a* values of DL-treated cotton/polyester blended fabrics are more negative than those of LD-treated cotton/polyester blended fabrics. In the case of LD-treated cotton/polyester blended fabrics, some of the chars formed on the fabric surface may have been washed away during dyeing, leaving fewer chars and resulting in a less greenish hue than the DL-treated cotton/polyester blended fabrics. When CIE a* values of cotton and cotton/polyester blended fabrics are compared, it is noted that in the cases of 0.1% and 1.0% concentration, both control and laser-treated samples have similar CIE a* values. In the case of 5%, DL treatment on cotton and cotton/polyester blended fabrics can obtain similar CIE a* values but there is a large difference between control and LD-treated samples. In addition, in terms of the depth of 5%, CIE a* values of cotton and cotton/polyester blended fabrics are decreased after laser treatment. The reduction in CIE a* value indicates that the shade of fabric becomes greenish after laser treatment. This greenish shade is due to the yellowing by laser induced thermal oxidation together with the original blue shade in the dyed fabrics.
3.5. CIE b* Value
CIE b* value represents the yellowish or bluish colour of the sample. A positive CIE b* value means a yellowish colour, while a negative CIE b* means a bluish colour. All samples treated with the two different approaches are located at the negative CIE b* region as they were all dyed in blue. Hence, the fabrics appeared to be blue in colour. Furthermore, when concentration of the dye is increased, CIE b* value becomes more negative. This indicates that the fabrics appear to be more bluish when concentration of dye is increased.
CIE b* values of control cotton samples (ranged −18.22 to −41.89) have more negative values than the laser-treated cotton samples (LD-treated: −15.78 to −39.65; DL-treated: −7.64 to −17.45). This shows that without laser treatment, the fabrics are more bluish. As compared to DL-treated cotton fabrics, LD-treated cotton fabrics are located at the more negative CIE b* region. Hence, LD-treated cotton fabrics are more bluish than the DL-treated cotton fabrics.
Since all cotton/polyester blended fabrics are dyed in blue dye, CIE b* values of all cotton/polyester blended samples are negative, indicating that they have a bluish colour. The negative CIE b* value increases (more negative) when concentration of dye is increased. Hence, samples with higher dye concentration are in dark blue. It is obvious that all control cotton/polyester blended samples (−18.70 to −40.06) have higher negative CIE b* values than laser treated cotton/polyester blended samples (LD-treated: −11.58 to −34.47; DL-treated: −9.48 to −19.58), implying that control cotton/polyester blended fabrics without laser treatment have a deeper blue hue. In addition, LD-treated cotton/polyester blended fabrics have more negative CIE b* values than the DL-treated cotton/polyester blended fabrics, irrespective of dye concentration. Hence, LD-treated cotton/polyester blended fabrics have a darker blue shade. The effect of various laser parameters on the change of colour depth is similar for both LD-treated and DL-treated cotton/polyester blended fabrics. When the resolution and pixel time are increased, the negative CIE b* changes to less negative. Therefore, the fabrics are less bluish when the number of dots per inch and treatment time are increased. The blue colour is lighter in shade because of the laser-induced thermal oxidation which causes yellowing of the fabric surface [9,16].
Comparison of CIE b* values of cotton and cotton/polyester blended fabrics shows that the laser treatment increases CIE b* values, to less negative. Regarding the laser parameters, increasing the laser power and pixel time further increases the b* values to less negative. This indicates a lighter blue colour, caused by the laser-induced thermal oxidation effect which yellows the fabric surface.
3.6. Levelness Value
Levelness is essential in dyeing, besides the shade and fastness [5]. In order to evaluate the effect of laser treatment on the degree of levelness, fabrics treated with laser before and after dyeing, i.e., LD and DL, were measured using the objective instrumental method for quantifying the unlevelness. The results are expressed in terms of the relative unlevelness index (RUI). Table 6 shows the levelness of cotton fabrics dyed with three different concentrations.
Control cotton samples are found to have excellent levelness of colour, except the sample dyed with 5% dye concentration. The overall levelness of cotton fabrics before laser treatment is better than good. The RUI values are generally lower than 0.2, meaning excellent colour uniformity. When using 1% and 5% concentrations, RUI values are found to be smaller for LD-treated cotton fabric than DL-treated cotton fabric. The RUI values ranging from 0.2–0.49 to 0.5–1.0 indicate that the levelness is only good or even poor in the case of DL-treated cotton fabric. Among the 24 laser-treated samples dyed with 1% and 5% dye concentration, there are seven samples reaching poor levelness. The LD-treated cotton fabrics have excellent results when using dye concentration of 1%. Colour levelness of LD-treated fabrics is generally good when dyed with 5%. After considering RUI results for cotton fabric, it is concluded that the LD approach provides a better levelness than the DL approach. The better levelness found in the LD approach may be due to the sequence of application of the laser treatment. The formation of chars generated from the thermal effect of laser irradiation may cause some yellowish appearance on the fabric surface, resulting in lower levelness. Since laser treatment is applied before dyeing in the case of LD, the yellowish chars are removed during dyeing. With regard to the DL approach, the yellowish chars remain on the fabric surface as laser treatment is applied to the fabric after dyeing. The levelness of the DL approach could be improved by washing the fabrics after the laser treatment so as to remove the yellowish tar. However, this means increased use of water. Hence, the LD approach is better in terms of providing colour fading effect with better levelness.
Control cotton/polyester blended samples have RUI values lower than 0.49 (Table 6), which indicates that the colour levelness is good or even excellent. The levelness is enhanced after laser treatment with 0.1% concentration, regardless of the sequence of dyeing and laser treatment and in 1% blue when laser is applied to the fabric before dyeing. When the two different approaches are compared, the LD-treated cotton/polyester blended fabrics are found to have better levelness than the DL-treated cotton/polyester blended fabrics. There are no instances of poor colour levelness found in fabrics treated with LD approach, and the results are generally considered as good or even excellent. With regard to fabrics treated with the DL approach, the results are generally considered as good but six fabric samples had poor levelness. As a result, it is concluded that the visual appearance of levelness is better when the laser is applied to the fabric before dyeing especially when the colour depth is higher.
The relationship (R2) between K/S value and levelness of laser-treated cotton and cotton/polyester blended fabrics is shown in Table 7. It is noted that the K/S value and levelness do not have strong correlation [17]. This means that colour yield of the dyed fabric would not contribute significant effect on the final colour levelness with different laser treatments.
3.7. pH Measurement
The pH values of cotton and cotton/polyester blended fabrics treated with LD and DL approaches are within the range of 6.3 to 6.5 which is similar to the range most suitable for human skin, i.e., pH 4.0 to 7.0 [18] and these values also meet different product requirements of Oeko-Tex Standard 100 (Class I (baby): 4.0–7.5; Class II (in direct contact with skin): 4.0–7.5; Class III (with no direct contact with skin): 4.0–9.0 and Class IV (decoration material): 4.0–9.0) [19]. Therefore, laser treatment using both LD and DL approaches can provide the colour fading effect without affecting the pH values; the process of laser treatment is safe for the customer to wear right after treatment.
3.8. Tensile Strength
Table 8 shows the tensile strength of control and laser-treated cotton samples dyed with different concentrations of RB19. The tensile strength in both warp and weft directions decreases significantly after laser treatment. This indicates that the fabric is damaged by the high temperature during laser treatment leading to lower tensile strength. In Table 9, it is also obvious that, as the treatment parameters are increased, tensile strength of fabrics decreases. Similar trend of results is obtained in both warp and weft directions. The LD-treated cotton fabrics dyed with three different concentrations have a higher tensile strength in the warp direction when the treatment parameters are the same as the DL-treated fabrics. In the weft direction, tensile strength of DL-treated cotton fabrics dyed with 1% is found to be higher than that of LD-treated cotton fabrics. However, the difference between these two different approaches using 0.1% and 5% is not significant.
Table 9 shows the tensile strength of control and laser-treated cotton/polyester blended samples dyed with different concentrations. The tensile strength of laser-treated cotton/polyester blended fabrics dyed with RB19 is weakened in both warp and weft directions, compared with the control cotton/polyester blended sample. Laser irradiation of fabrics causes the formation of pores and cracks on cotton fibres as well as the melting of polyester fibres [8]. The changes to the fibres create weak points on the yarn resulting in lower tensile strength. When the change in tensile strength of the LD-treated and DL-treated cotton/polyester blended fabrics is studied, LD-treated cotton/polyester blended fabrics are found to have a larger decrease of tensile strength (all three different concentrations). Under most circumstances, the larger decrease of tensile strength found in LD-treated cotton/polyester blended fabrics may suggest that fewer pores are formed on the cotton and melting of polyester happens in DL-treated cotton/polyester blended fabrics [9,16]. Dyes present on the fabric surface are first removed by laser during laser-treatment and then the interaction between the yarn surface and laser occurs. Alternatively, LD-treated cotton/polyester fabrics are first semi-bleached and the surface is therefore clean and clear. Therefore, laser is directly irradiated onto the fabric surface causing the damage before dyeing. Therefore, this could explain the lower tensile strength of LD-treated cotton/polyester blended fabrics.
4. Conclusions
Colour properties and tensile strength of cotton fabrics treated with two different approaches were studied. It was discovered that laser treatment had no influence on chromaticity of cotton fabrics. Moreover, fabrics treated with laser had a lighter shade than the control samples. This confirms that both approaches, i.e., laser treatment conducted before and after dyeing, can provide a colour fading effect. The DL-treated cotton fabrics showed lighter shades with a more greenish hue and less of bluish colour after laser treatment. On the other hand, LD-treated cotton fabrics had a better colour yield and levelness, but with less of the greenish hue and more of bluish colour appearance. It was also discovered that the LD-treated cotton fabrics had a higher tensile strength and levelness than the DL-treated cotton when dyed with RB19. Whether the laser treatment should be applied before or after dyeing needs to be considered carefully to obtain the desired colour effect.
In the case of cotton/polyester blended fabrics, after dyeing with RB19, the LD-treated fabrics appeared to be of a lighter shade with more bluish appearance, while the DL-treated fabrics became more greenish. Therefore, the LD approach had a stronger colour fading effect, better levelness but a lower tensile strength when the cotton/polyester blended fabrics were dyed with RB19.
According to the results obtained from the pH measurement, it is confirmed that laser treatment can provide a colour fading effect without affecting the pH value, and the garments can be worn instantly right after the laser treatment for both cotton and cotton/polyester blended fabrics.
Acknowledgments
Authors would like to thank The Hong Kong Polytechnic University for the financial support provided for this work (account: G-UA9M and 1-ZE27).
Author Contributions
On-na Hung and Chi-wai Kan conceived and designed the experiments; On-na Hung performed the experiments; On-na Hung and Chi-wai Kan analyzed the data; On-na Hung wrote the paper and Chi-wai Kan provided technical advice on the paper.
Conflicts of Interest
The authors declare no conflict of interest.
References
- Dascalu, T.; Acosta-Ortiz, S.E.; Ortiz-Morales, M.; Compean, I. Removal of the indigo color by laser beam-denim interaction. Opt. Lasers Eng. 2000, 34, 179–189. [Google Scholar] [CrossRef]
- Ortiz-Morales, M.; Poterasu, M.; Acosta-Ortiz, S.E.; Compean, I.; Hernandez-Alvarado, M.R. A comparison between characteristics of various laser-based denim fading processes. Opt. Lasers Eng. 2003, 39, 15–24. [Google Scholar] [CrossRef]
- Ondogan, Z.; Pamuk, O.; Ondogan, E.N.; Ozguney, A. Improving the appearance of all textile products from clothing to home textile using laser technology. Opt. Laser Technol. 2005, 37, 631–637. [Google Scholar] [CrossRef]
- Tarhan, M.; Sarıışık, M. A comparison among performance characteristics of various denim fading processes. Text. Res. J. 2009, 79, 301–309. [Google Scholar] [CrossRef]
- Štěpánková, M.; Wiener, J.; Dembický, J. Impact of laser thermal stress on cotton fabric. Fibres Text. East. Eur. 2010, 80, 70–73. [Google Scholar]
- Jucienė, M.; Urbelis, V.; Juchnevičienė, Ž.; Čepukonė, L. The effect of laser technological parameters on the color and structure of denim fabric. Text. Res. J. 2014, 84, 662–670. [Google Scholar] [CrossRef]
- Hung, O.N.; Chan, C.K.; Kan, C.W.; Yuen, C.W.M.; Song, L.J. Artificial neural network approach for predicting colour properties of laser-treated denim fabrics. Fibers Polym. 2014, 15, 1330–1336. [Google Scholar] [CrossRef]
- Hung, O.N.; Chan, C.K.; Kan, C.W.; Yuen, C.W.M. An analysis of some physical and chemical properties of CO2 laser-treated cotton-based fabrics. Cellulose 2017, 24, 363–381. [Google Scholar] [CrossRef]
- Hung, O.N.; Chan, C.K.; Kan, C.W. Introducing variations in colour of cotton fabric-reactive dye systems through irradiation with a carbon dioxide laser. Color Technol. 2016, 132, 35–48. [Google Scholar] [CrossRef]
- Hung, O.N.; Chan, C.K.; Kan, C.W.; Yuen, C.W.M. Effect of the CO2 laser treatment on properties of 100% cotton knitted fabrics. Cellulose 2017, 24, 1915–1926. [Google Scholar] [CrossRef]
- Hung, O.N.; Chan, C.K.; Kan, C.W.; Yuen, C.W.M. Microscopic study of the surface morphology of CO2 laser-treated cotton and cotton/polyester blended fabric. Text. Res. J. 2017, 87, 1107–1120. [Google Scholar] [CrossRef]
- Kan, C.W. Colour fading effect of indigo-dyed cotton denim fabric by CO2 laser. Fibers Polym. 2014, 15, 426–429. [Google Scholar] [CrossRef]
- Kan, C.W. CO2 laser treatment as a clean process for treating denim fabric. J. Clean. Prod. 2014, 66, 624–631. [Google Scholar] [CrossRef]
- Chong, C.L.; Li, S.Q.; Yeung, K.W. An objective method for the assessment of levelness of dyed materials. J. Soc. Dyers Colour. 1992, 108, 528–530. [Google Scholar] [CrossRef]
- Kan, C.W.; Yuen, C.W.M.; Cheng, C.W. Color Fading of Indigo-dyed Cotton Denim Fabric by Laser. Adv. Mater. Res. 2012, 441, 187–191. [Google Scholar] [CrossRef]
- Esteves, F.; Alonso, H. Effect of CO2 laser radiation on surface and dyeing properties of synthetic fibres. Res. J. Text. Appar. 2007, 11, 42–47. [Google Scholar] [CrossRef]
- Israeli, O. A shapley-based decomposition of the R-square of a linear regression. J. Econ. Inequal. 2007, 5, 199–212. [Google Scholar] [CrossRef]
- Lambers, H.; Piessens, S.; Bloem, A.; Pronk, H.; Finkel, P. Natural skin surface pH is on average below 5, which is beneficial for its resident flora. Int. J. Cosmet. Sci. 2006, 28, 359–370. [Google Scholar] [CrossRef] [PubMed]
- Oeko-Tex. Standard 100 by Oeko-Tex. Available online: https://www.oeko-tex.com/en/business/oeko_tex_certified_products/oeko_tex_certified_products.html (assessed on 3 March 2017).
Figure 1.
Chemical structure of C.I. Reactive Blue 19.
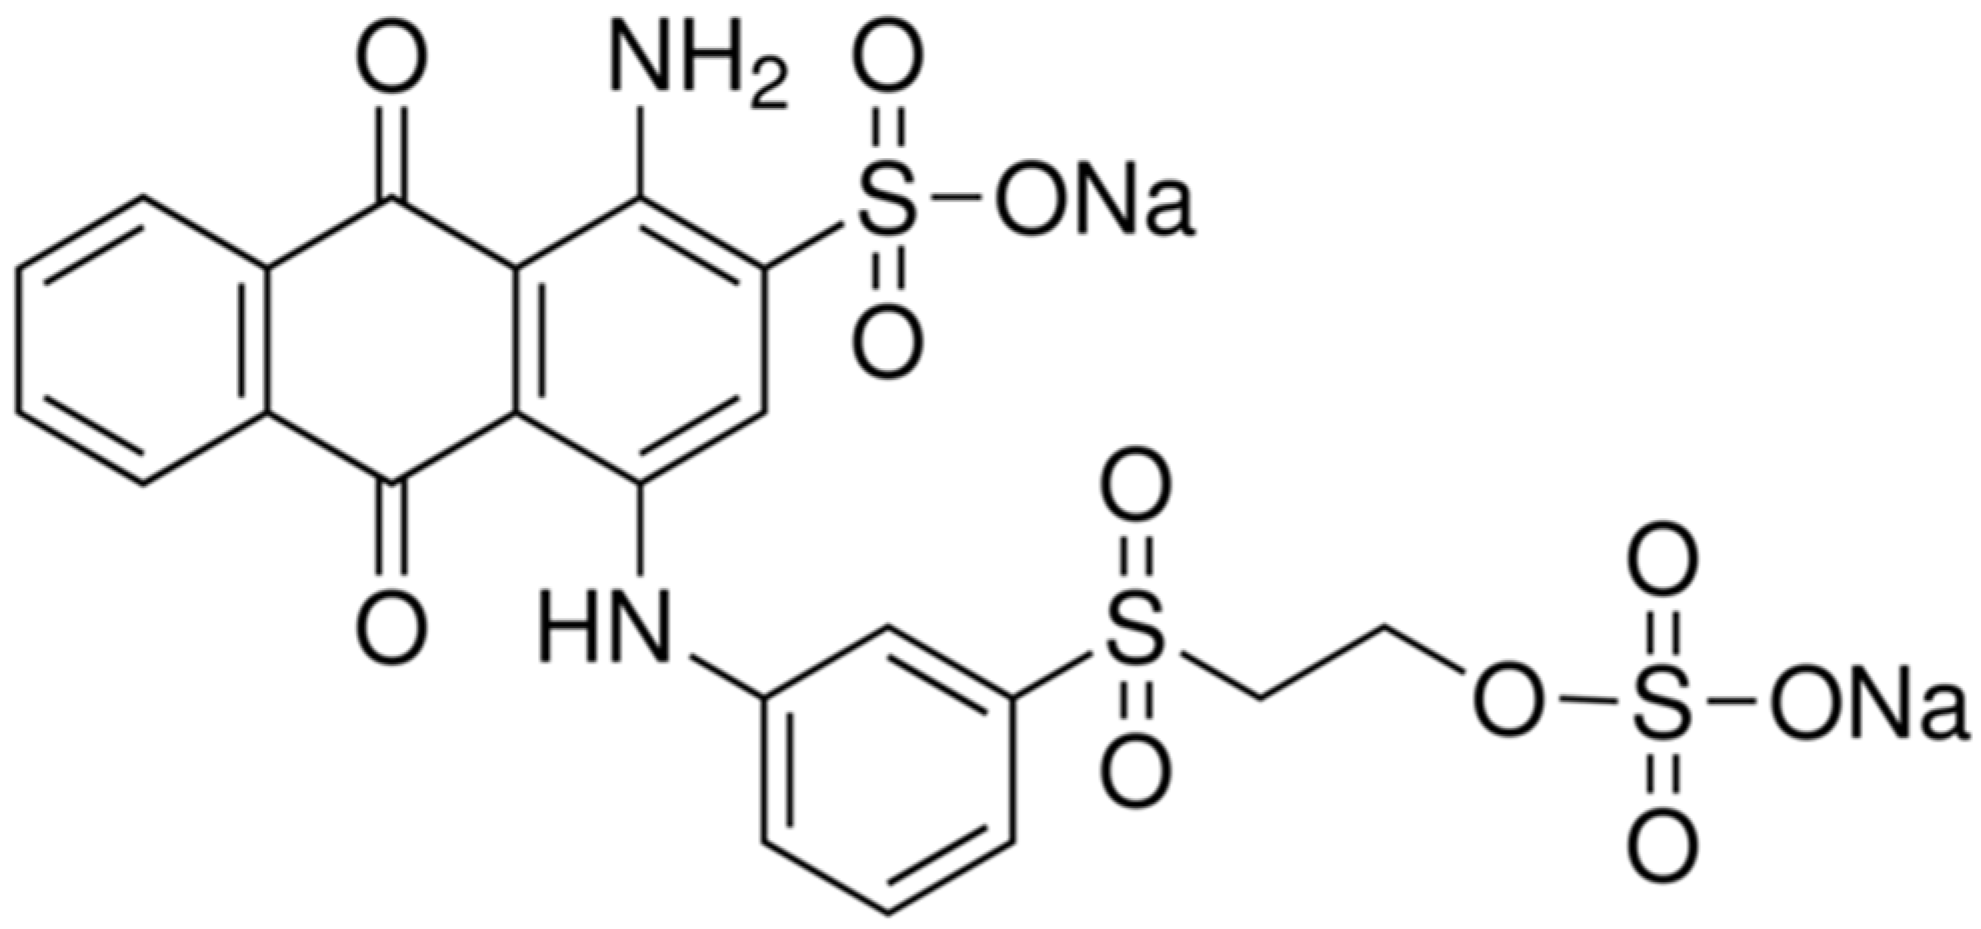
Figure 2.
Dyeing procedure [9].
Figure 2.
Dyeing procedure [9].
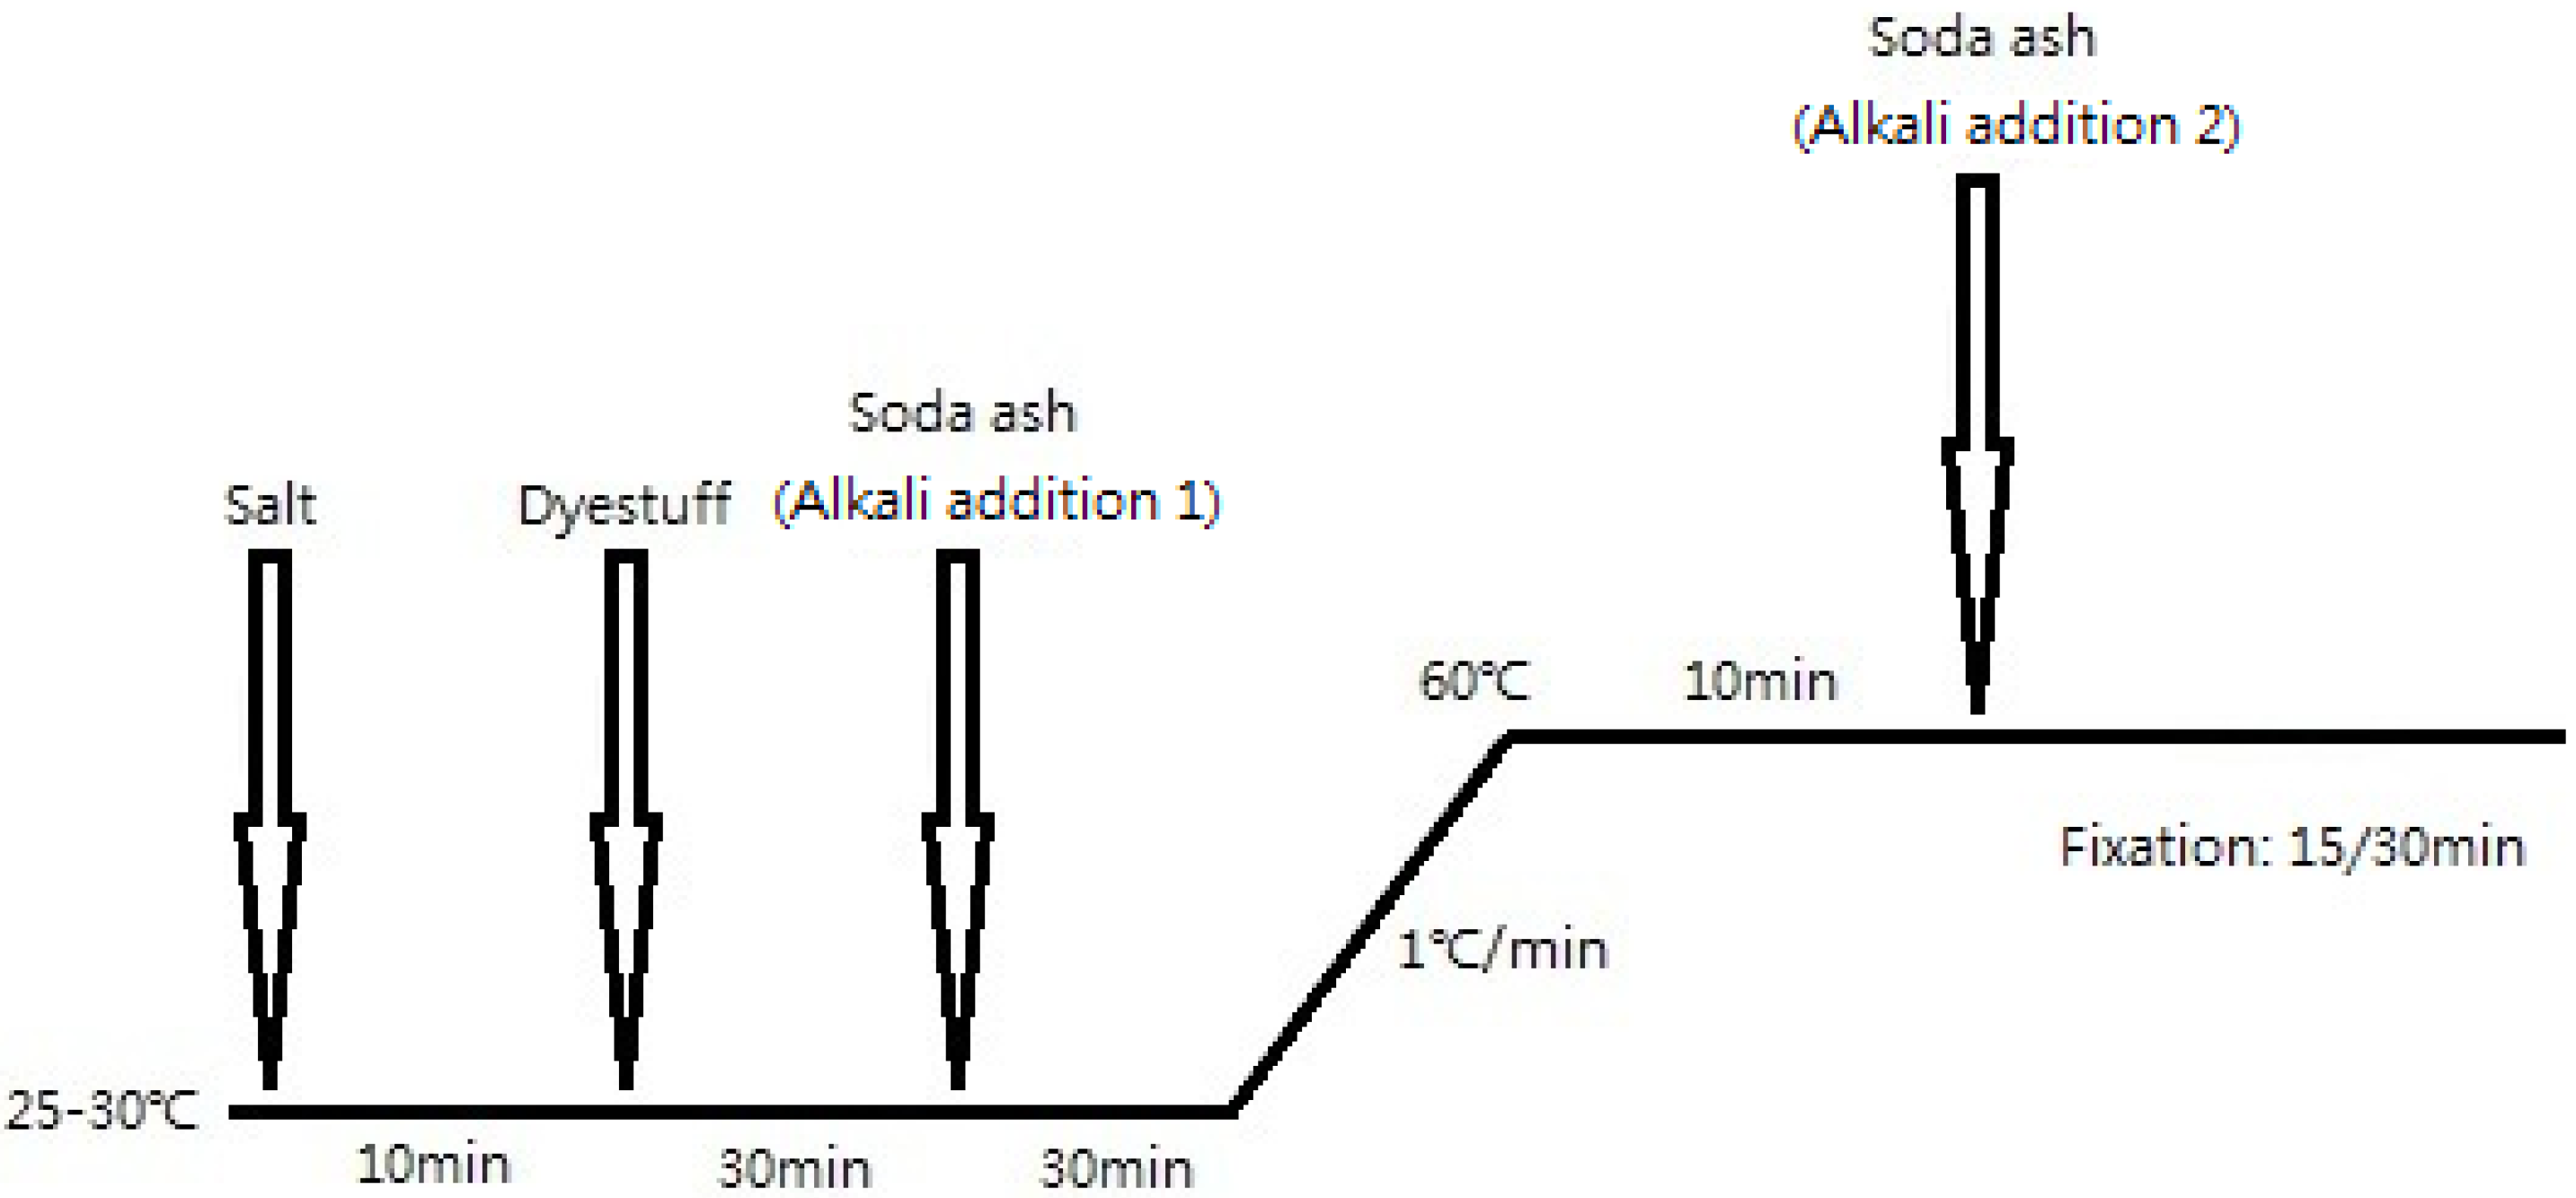
Figure 3.
Reflectance curves of 0.1% dyed RB19: (a) LD; (b) DL (reflectance data of cotton (C) were extracted from Hung et al., 2016 [9] for comparison).
Figure 3.
Reflectance curves of 0.1% dyed RB19: (a) LD; (b) DL (reflectance data of cotton (C) were extracted from Hung et al., 2016 [9] for comparison).

Figure 4.
Reflectance curves of 1% dyed RB19: (a) LD; and (b) DL (reflectance data of cotton (C) were extracted from Hung et al., 2016 [9] for comparison).
Figure 4.
Reflectance curves of 1% dyed RB19: (a) LD; and (b) DL (reflectance data of cotton (C) were extracted from Hung et al., 2016 [9] for comparison).
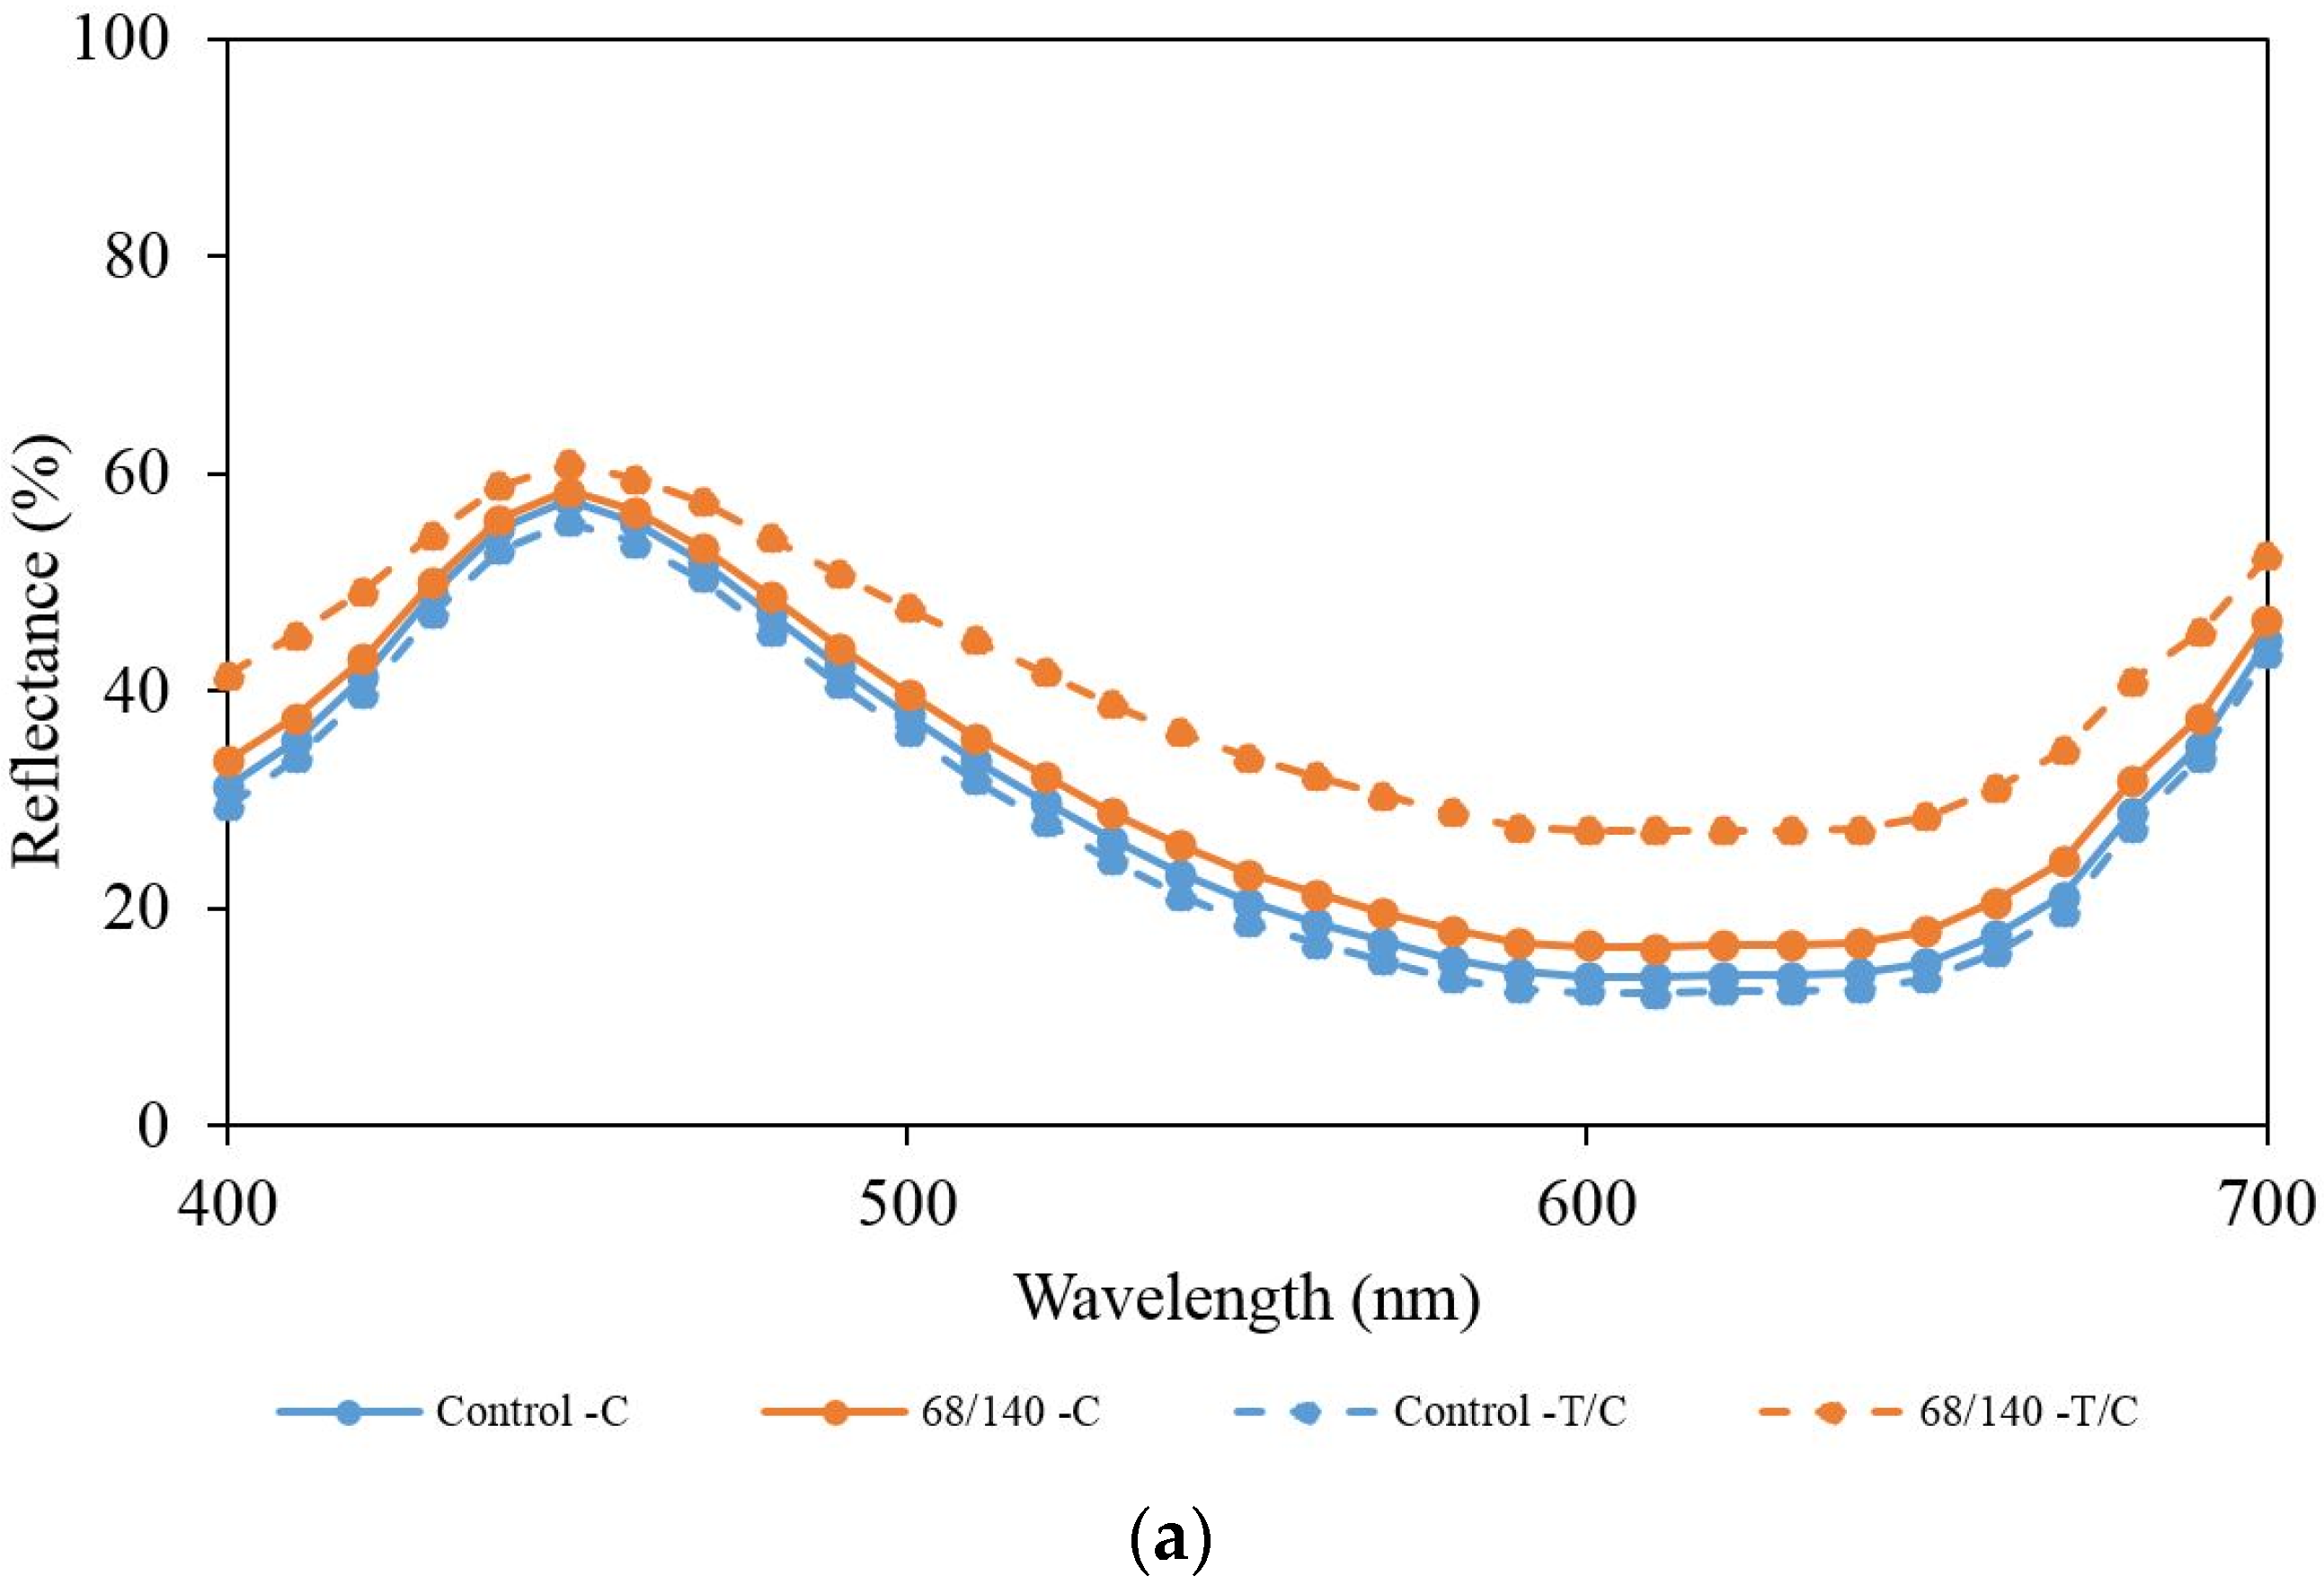
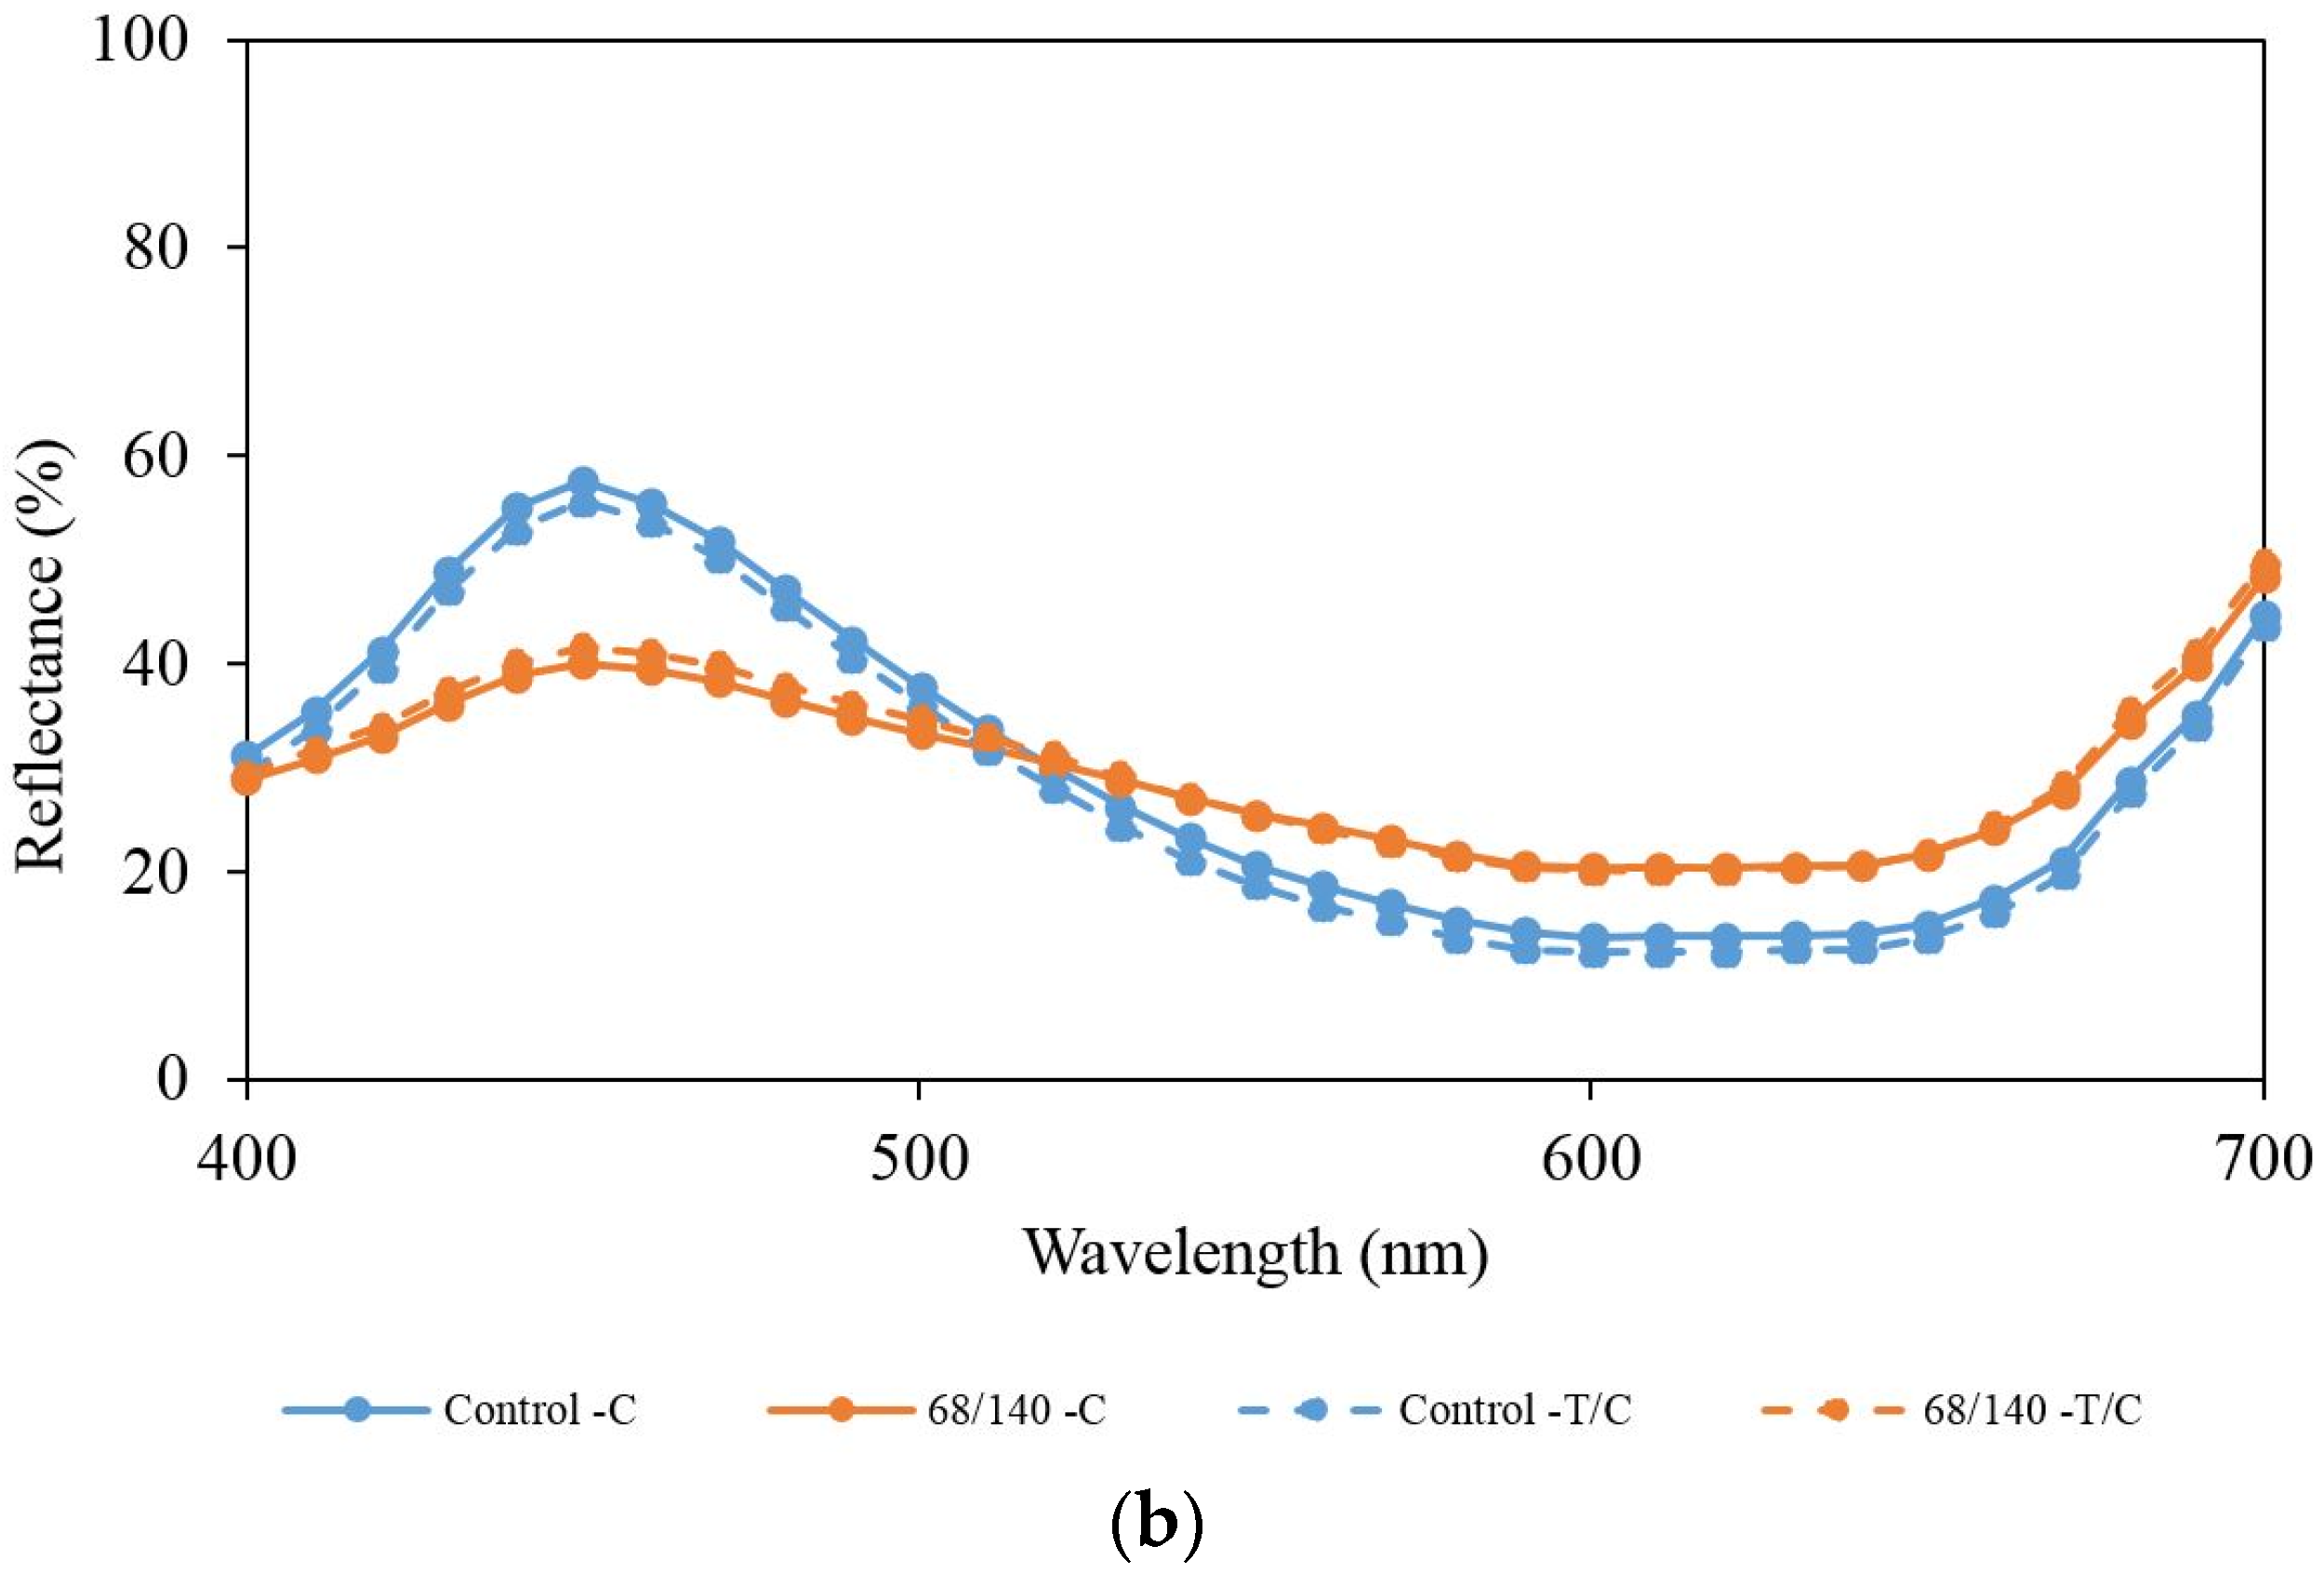
Figure 5.
Reflectance curves of 5% dyed RB19: (a) LD; and (b) DL (reflectance data of cotton (C) were extracted from Hung et al., 2016 [9] for comparison).
Figure 5.
Reflectance curves of 5% dyed RB19: (a) LD; and (b) DL (reflectance data of cotton (C) were extracted from Hung et al., 2016 [9] for comparison).


Table 1.
Fabric specifications.
| Fabric Type | Fabric Structure | Composition | Fabric Weight | Warp Density | Weft Density | Warp Count | Weft Count |
|---|---|---|---|---|---|---|---|
| (g/m2) | (end/inch) | (pick/inch) | (Tex) | (Tex) | |||
| Cotton | 3/1 Twill | 100% Cotton | 240 | 144 | 58 | 34 | 30 |
| Cotton/Polyester Blended | 3/1 Twill | 62% Cotton/ 38% Polyester | 229 | 122 | 60 | 29 | 38 |
Table 2.
Specifications of CO2 sources laser engraving machine.
| Manufacturer Model | Laser Medium | Wavelength | Wave Mode | Energy per Pulse | Resolution (dpi) | Pixel Time (μs) |
|---|---|---|---|---|---|---|
| GFK Marcetex FLEXI-150 | Carbon Dioxide | 10.6 μm | Pulsed | 5–230 mJ | 52, 60, 68 | 110, 120, 130, 140 |
Table 3.
Dyeing recipe [9].
Table 3.
Dyeing recipe [9].
| Dye Concentration (% owf) | Salt (g/L) | Soda Ash (Alkali Addition 1) (g/L) | Soda Ash (Alkali Addition 2) (g/L) | Fixation Time (min) |
|---|---|---|---|---|
| 0.1 | 20 | 2 | 3 | 15 |
| 1 | 40 | 3 | 7 | 30 |
| 5 | 80 | 10 | 10 | 30 |
Table 4.
Colour yield (K/S value) of different samples (C, Cotton fabric; T/C, Cotton/Polyester fabric) (data of cotton fabric were extracted from Hung et al., 2016 [9] for comparison).
Table 4.
Colour yield (K/S value) of different samples (C, Cotton fabric; T/C, Cotton/Polyester fabric) (data of cotton fabric were extracted from Hung et al., 2016 [9] for comparison).
| Laser Parameter (Resolution/Pixel Time) | Depth | |||||||||||
|---|---|---|---|---|---|---|---|---|---|---|---|---|
| 0.1% | 1% | 5% | ||||||||||
| LD | DL | LD | DL | LD | DL | |||||||
| C | T/C | C | T/C | C | T/C | C | T/C | C | T/C | C | T/C | |
| Control | 5.40 | 5.88 | 5.40 | 5.88 | 38.99 | 44.81 | 38.99 | 44.81 | 167.17 | 150.90 | 167.17 | 150.90 |
| 52/110 | 3.93 | 4.41 | 4.14 | 4.89 | 30.03 | 23.55 | 26.42 | 22.86 | 134.98 | 77.16 | 109.46 | 89.37 |
| 52/120 | 4.35 | 4.17 | 3.99 | 4.68 | 32.75 | 23.18 | 22.40 | 22.45 | 134.60 | 77.32 | 100.47 | 89.94 |
| 52/130 | 4.39 | 4.78 | 4.40 | 4.98 | 29.22 | 22.53 | 26.82 | 23.16 | 143.94 | 63.69 | 109.89 | 93.78 |
| 52/140 | 4.39 | 4.68 | 4.45 | 5.03 | 32.19 | 21.93 | 23.88 | 22.23 | 143.26 | 60.83 | 110.26 | 93.83 |
| 60/110 | 4.50 | 4.77 | 4.57 | 4.68 | 30.86 | 21.04 | 24.48 | 22.96 | 142.88 | 60.41 | 109.28 | 92.39 |
| 60/120 | 5.00 | 4.99 | 4.52 | 4.88 | 31.41 | 19.89 | 27.10 | 23.43 | 145.67 | 54.33 | 103.23 | 92.20 |
| 60/130 | 4.97 | 4.17 | 5.00 | 4.90 | 30.40 | 20.32 | 24.92 | 24.16 | 144.74 | 53.66 | 110.71 | 91.81 |
| 60/140 | 4.95 | 3.40 | 4.58 | 5.26 | 32.00 | 19.10 | 26.05 | 24.98 | 142.69 | 50.12 | 105.73 | 93.43 |
| 68/110 | 4.84 | 4.31 | 4.70 | 5.51 | 32.87 | 18.30 | 27.53 | 24.96 | 137.53 | 47.58 | 119.53 | 94.32 |
| 68/120 | 4.79 | 4.60 | 5.06 | 5.67 | 28.45 | 17.55 | 26.03 | 26.98 | 130.62 | 44.54 | 114.23 | 93.52 |
| 68/130 | 4.95 | 4.51 | 5.10 | 5.66 | 29.92 | 16.68 | 27.91 | 27.95 | 130.70 | 42.54 | 115.03 | 94.74 |
| 68/140 | 4.98 | 4.46 | 5.40 | 5.49 | 31.61 | 16.37 | 29.13 | 28.64 | 140.10 | 41.81 | 121.31 | 101.94 |
Table 5.
CIE a* values of different samples (C—Cotton fabric; T/C—Cotton/Polyester fabric) (data of cotton fabric were extracted from Hung et al., 2016 [9] for comparison).
Table 5.
CIE a* values of different samples (C—Cotton fabric; T/C—Cotton/Polyester fabric) (data of cotton fabric were extracted from Hung et al., 2016 [9] for comparison).
| Laser Parameter (Resolution/Pixel Time) | CIE a* | |||||||||||
|---|---|---|---|---|---|---|---|---|---|---|---|---|
| 0.1% | 1% | 5% | ||||||||||
| LD | DL | LD | DL | LD | DL | |||||||
| C | T/C | C | T/C | C | T/C | C | T/C | C | T/C | C | T/C | |
| Control | −5.55 | −5.72 | −5.55 | −5.72 | −4.22 | −4.02 | −4.22 | −4.02 | 2.69 | 4.42 | 2.69 | 4.42 |
| 52/110 | −5.37 | −5.07 | −5.31 | −5.40 | −4.60 | −4.57 | −4.43 | −4.79 | 1.02 | −0.41 | −3.05 | −3.08 |
| 52/120 | −5.54 | −5.16 | −5.24 | −5.47 | −4.40 | −4.33 | −4.52 | −4.73 | 1.08 | −0.51 | −3.15 | −3.15 |
| 52/130 | −5.50 | −5.35 | −5.69 | −5.77 | −4.59 | −4.51 | −4.51 | −4.85 | 1.53 | −0.69 | −3.19 | −3.18 |
| 52/140 | −5.58 | −5.22 | −5.75 | −5.70 | −4.44 | −4.36 | −4.58 | −4.71 | 1.44 | −0.82 | −3.28 | −3.44 |
| 60/110 | −5.60 | −5.29 | −5.72 | −5.67 | −4.54 | −4.55 | −4.40 | −4.73 | 1.49 | −1.09 | −3.29 | −3.34 |
| 60/120 | −5.58 | −5.23 | −5.85 | −5.81 | −4.51 | −4.44 | −4.59 | −4.81 | 1.48 | −1.26 | −3.38 | −3.75 |
| 60/130 | −5.62 | −5.31 | −6.06 | −5.94 | −4.57 | −4.37 | −4.82 | −4.77 | 1.38 | −1.39 | −3.49 | −3.59 |
| 60/140 | −5.74 | −4.98 | −6.02 | −6.02 | −4.38 | −4.51 | −4.78 | −4.85 | 1.25 | −1.89 | −3.48 | −3.64 |
| 68/110 | −5.40 | −5.38 | −5.81 | −6.01 | −4.32 | −4.52 | −4.73 | −5.20 | 1.04 | −1.90 | −3.48 | −3.43 |
| 68/120 | −5.45 | −5.46 | −6.27 | −6.22 | −4.30 | −4.41 | −4.94 | −5.31 | 0.75 | −2.08 | −3.59 | −3.81 |
| 68/130 | −5.50 | −5.51 | −6.10 | −6.23 | −4.17 | −4.51 | −4.72 | −5.09 | 0.73 | −2.10 | −3.55 | −3.88 |
| 68/140 | −5.58 | −5.31 | −6.24 | −6.45 | −4.03 | −4.52 | −4.95 | −5.38 | 1.18 | −2.21 | −3.67 | −3.79 |
Table 6.
Levelness value of different samples (C—Cotton fabric; T/C—Cotton/Polyester fabric) (data of cotton fabric were extracted from Hung et al., 2016 [9] for comparison).
Table 6.
Levelness value of different samples (C—Cotton fabric; T/C—Cotton/Polyester fabric) (data of cotton fabric were extracted from Hung et al., 2016 [9] for comparison).
| Laser Parameter (Resolution/Pixel Time) | Levelness | |||||||||||
|---|---|---|---|---|---|---|---|---|---|---|---|---|
| 0.1% | 1% | 5% | ||||||||||
| LD | DL | LD | DL | LD | DL | |||||||
| C | T/C | C | T/C | C | T/C | C | T/C | C | T/C | C | T/C | |
| Control | 0.11 | 0.32 | 0.11 | 0.32 | 0.17 | 0.34 | 0.17 | 0.34 | 0.45 | 0.08 | 0.45 | 0.08 |
| 52/110 | 0.08 | 0.10 | 0.14 | 0.19 | 0.19 | 0.04 | 0.40 | 0.14 | 0.22 | 0.16 | 0.24 | 0.47 |
| 52/120 | 0.21 | 0.09 | 0.06 | 0.10 | 0.08 | 0.07 | 0.11 | 0.15 | 0.15 | 0.18 | 0.09 | 0.24 |
| 52/130 | 0.16 | 0.11 | 0.04 | 0.04 | 0.16 | 0.09 | 0.57 | 0.71 | 0.38 | 0.12 | 0.22 | 0.64 |
| 52/140 | 0.08 | 0.09 | 0.04 | 0.08 | 0.13 | 0.10 | 0.36 | 0.22 | 0.36 | 0.06 | 0.28 | 0.34 |
| 60/110 | 0.23 | 0.11 | 0.05 | 0.14 | 0.19 | 0.07 | 0.06 | 0.10 | 0.32 | 0.10 | 0.38 | 0.44 |
| 60/120 | 0.10 | 0.34 | 0.04 | 0.10 | 0.06 | 0.09 | 0.28 | 0.32 | 0.08 | 0.03 | 0.51 | 0.09 |
| 60/130 | 0.07 | 0.15 | 0.15 | 0.10 | 0.11 | 0.02 | 0.25 | 0.18 | 0.08 | 0.03 | 0.35 | 0.85 |
| 60/140 | 0.08 | 0.08 | 0.06 | 0.13 | 0.17 | 0.21 | 0.34 | 0.18 | 0.21 | 0.08 | 0.66 | 0.45 |
| 68/110 | 0.16 | 0.28 | 0.08 | 0.17 | 0.18 | 0.07 | 0.19 | 0.29 | 0.35 | 0.16 | 0.20 | 0.48 |
| 68/120 | 0.07 | 0.08 | 0.21 | 0.23 | 0.07 | 0.06 | 0.15 | 0.64 | 0.31 | 0.10 | 0.61 | 0.30 |
| 68/130 | 0.14 | 0.10 | 0.15 | 0.07 | 0.17 | 0.10 | 0.52 | 0.96 | 0.25 | 0.03 | 0.56 | 0.55 |
| 68/140 | 0.07 | 0.20 | 0.18 | 0.13 | 0.09 | 0.06 | 0.29 | 0.37 | 0.30 | 0.14 | 0.56 | 0.24 |
Table 7.
R2 of K/S value and levelness.
| Treatment Type | Cotton | Cotton/Polyester Blended |
|---|---|---|
| LD-0.1% | 0.0736 | 0.1013 |
| DL-0.1% | 0.4645 | 0.0916 |
| LD-1.0% | 0.00003 | 0.0211 |
| DL-1.0% | 0.2001 | 0.3416 |
| LD-5.0% | 0.0213 | 0.195 |
| DL-5.0% | 0.0516 | 0.0273 |
Table 8.
Tensile strength of different cotton samples (data of cotton fabric were extracted from Hung et al., 2016 [9] for comparison).
Table 8.
Tensile strength of different cotton samples (data of cotton fabric were extracted from Hung et al., 2016 [9] for comparison).
| Laser Parameter (Resolution/Pixel Time) | 0.1% | 1% | 5% | |||||||||
|---|---|---|---|---|---|---|---|---|---|---|---|---|
| Warp | Weft | Warp | Weft | Warp | Weft | |||||||
| Control | 447.65 | 353.08 | 431.72 | 356.63 | 501.24 | 338.69 | ||||||
| – | LD | DL | LD | DL | LD | DL | LD | DL | LD | DL | LD | DL |
| 52/110 | 337.85 | 291.4 | 340.8 | 351.94 | 374.36 | 354.23 | 315.43 | 340.18 | 318.4 | 313.24 | 335.12 | 336.75 |
| 52/120 | 329.39 | 283.48 | 326.3 | 337.71 | 340.53 | 333.98 | 314.09 | 332.51 | 300.12 | 299.19 | 307.47 | 321.16 |
| 52/130 | 310.73 | 264.16 | 304.83 | 320.93 | 327.31 | 304.27 | 295.7 | 325.1 | 288.45 | 281.26 | 290.94 | 301.3 |
| 52/140 | 292.34 | 253.82 | 297.71 | 294.09 | 254.22 | 236.47 | 295.3 | 316.88 | 277.91 | 234.29 | 285.06 | 295.58 |
| 60/110 | 279.86 | 234.36 | 297.58 | 298.6 | 254.09 | 212.22 | 294.09 | 310.77 | 274.22 | 218.61 | 278.83 | 292.66 |
| 60/120 | 243.22 | 209.53 | 290.2 | 297.91 | 244.96 | 200.72 | 271.27 | 302.91 | 230.29 | 215.47 | 265.61 | 268.84 |
| 60/130 | 230.87 | 195.83 | 278.79 | 282.41 | 235.7 | 183.02 | 258.12 | 291.41 | 229.15 | 207.29 | 262.53 | 267.48 |
| 60/140 | 217.85 | 191.4 | 268.85 | 269.78 | 190.2 | 180.57 | 255.7 | 288.84 | 215.29 | 204.85 | 247.02 | 261.27 |
| 68/110 | 175.97 | 157.58 | 261.61 | 264.36 | 168.99 | 149.59 | 246.71 | 281.36 | 197.03 | 173.41 | 236.18 | 238.02 |
| 68/120 | 157.65 | 150.87 | 241.2 | 239.79 | 150.06 | 115.18 | 241.61 | 262.58 | 187.64 | 117.71 | 224.59 | 237.81 |
| 68/130 | 145.97 | 139.73 | 235.97 | 239.12 | 135.83 | 101.65 | 207.65 | 247.28 | 183 | 105.65 | 187.36 | 221.06 |
| 68/140 | 108.99 | 88.99 | 173.82 | 214.09 | 120.4 | 75.55 | 183.75 | 205.43 | 87.85 | 82.15 | 157.32 | 164.86 |
Table 9.
Tensile strength of different cotton/polyester blended samples.
| Laser Parameter (Resolution/Pixel Time) | 0.1% | 1% | 5% | |||||||||
|---|---|---|---|---|---|---|---|---|---|---|---|---|
| Warp | Weft | Warp | Weft | Warp | Weft | |||||||
| Control | 537.44 | 312.75 | 575.1 | 360.46 | 540.49 | 369.93 | ||||||
| – | LD | DL | LD | DL | LD | DL | LD | DL | LD | DL | LD | DL |
| 52/110 | 258.3 | 265.57 | 167.91 | 221.74 | 275.43 | 309.96 | 224.69 | 226.44 | 274.91 | 283.39 | 194.69 | 199.11 |
| 52/120 | 222.81 | 234.49 | 150.6 | 186.04 | 220.53 | 226.56 | 183.62 | 174.55 | 235.36 | 262.61 | 187.77 | 182.67 |
| 52/130 | 192.68 | 195.57 | 135.97 | 165.36 | 218.92 | 226.44 | 171.27 | 162.41 | 180.6 | 200.33 | 154.11 | 138.45 |
| 52/140 | 177.44 | 184.02 | 131 | 163.75 | 193.02 | 207.55 | 151.54 | 115.04 | 161.82 | 166.3 | 148.19 | 136.6 |
| 60/110 | 168.32 | 180.8 | 125.77 | 146.84 | 172.08 | 193.73 | 133.55 | 114.72 | 148.41 | 156.32 | 145.19 | 133.08 |
| 60/120 | 159.32 | 161.47 | 112.21 | 129.26 | 126.3 | 169.72 | 130.87 | 110.05 | 105.17 | 124.13 | 136.69 | 129.39 |
| 60/130 | 134.89 | 142.28 | 110.06 | 116.3 | 106.97 | 147.28 | 116.77 | 88.49 | 97.46 | 116.27 | 132.48 | 74.88 |
| 60/140 | 98.52 | 116.51 | 87.04 | 99.06 | 94.63 | 98.55 | 90.33 | 84.19 | 86.71 | 109.95 | 84.03 | 72.2 |
| 68/110 | 65.1 | 95.43 | 75.97 | 79.06 | 71 | 87.16 | 85.63 | 65.78 | 84.49 | 108.95 | 72.71 | 55.47 |
| 68/120 | 35.3 | 83.08 | 62.68 | 67.24 | 55.3 | 58.66 | 79.73 | 67.56 | 48.84 | 70.82 | 70.59 | 54.76 |
| 68/130 | 35.16 | 61.47 | 58.38 | 59.46 | 26.44 | 36.89 | 65.1 | 56.27 | 43.52 | 54.17 | 47.94 | 46.54 |
| 68/140 | 20.53 | 38.12 | 35.57 | 45.77 | 20.93 | 36.37 | 37.18 | 41.41 | 36.8 | 41.97 | 34.48 | 38.42 |
© 2017 by the authors. Licensee MDPI, Basel, Switzerland. This article is an open access article distributed under the terms and conditions of the Creative Commons Attribution (CC BY) license (http://creativecommons.org/licenses/by/4.0/).
Share and Cite
MDPI and ACS Style
Hung, O.-n.; Kan, C.-w. A Study of CO2 Laser Treatment on Colour Properties of Cotton-Based Fabrics. Coatings 2017, 7, 131. https://doi.org/10.3390/coatings7080131
AMA Style
Hung O-n, Kan C-w. A Study of CO2 Laser Treatment on Colour Properties of Cotton-Based Fabrics. Coatings. 2017; 7(8):131. https://doi.org/10.3390/coatings7080131
Chicago/Turabian StyleHung, On-na, and Chi-wai Kan. 2017. "A Study of CO2 Laser Treatment on Colour Properties of Cotton-Based Fabrics" Coatings 7, no. 8: 131. https://doi.org/10.3390/coatings7080131
Note that from the first issue of 2016, this journal uses article numbers instead of page numbers. See further details here.