Effects of the Oxide Coating Thickness on the Small Flaw Sizing Using an Ultrasonic Test Technique

1
College of Automotive and Mechanical Engineering, Changsha University of Science & Technology, Changsha 410000, China
2
Key Laboratory for Traffic Safety on Track, Ministry of Education, Changsha 410000, China
3
School of Traffic and Transportation Engineering, Central South University, Changsha 410000, China
*
Author to whom correspondence should be addressed.
Coatings 2018, 8(2), 69; https://doi.org/10.3390/coatings8020069
Submission received: 26 December 2017
/
Revised: 29 January 2018
/
Accepted: 7 February 2018
/
Published: 9 February 2018
(This article belongs to the Special Issue Advanced Nondestructive Evaluation and Characterization of Surface)
Abstract
:When magnesium alloys are tested using ultrasonic techniques, their oxide coating will affect the transmitted ultrasonic energy and the accuracy of the flaw sizing. In this work, the effects of the coating thickness on the flaw sizing are investigated. An ultrasonic measurement model is employed to predict the flaw response signal, and the reflected and transmitted ultrasonic energy in the coated surface are corrected by modifying the reflection and transmission coefficients related to the effects of the coating thickness. The effectiveness of these coefficients and the ultrasonic measurement model are verified through experiments. With the correction of the coating thickness effects, the flaw-sizing curves predicted using the ultrasonic measurement model are provided. The flaws in magnesium alloy specimens with different coating thicknesses are tested, and the determined flaw sizes from these curves agree well with the actual sizes, which reveals the effectiveness of the proposed work. This work provides an effective tool to improve the flaw sizing performance using ultrasonic techniques in practical applications.
1. Introduction
The AZ80 magnesium alloys have been widely used in aerospace, ship infrastructure, military, and automotive because they have high strength and stiffness and low density and can bear a large impact load [1]. Prior to application, the alloys are usually coated with oxide layers, and the surface coatings can be used to extensively protect the substrate materials from environmental damages, such as corrosion, abrasion, and oxidation [2].
Ultrasonic techniques can be used to nondestructively test material damages and evaluate flaw sizes [3]. However, the oxide coatings will affect the ultrasonic energy transmitted into the substrate material because the acoustic impendences of oxide coating and substrate material are different, and the transmission coefficient will be different when the oxide coating thickness varies [4]. The measured signal amplitudes of small flaws, which are smaller than the sound beams, can be different because of the effects of the oxide coating thickness [5]. Therefore, when the flaw sizes are evaluated from the flaw signals using the ultrasonic technique, the effects of the oxide coating thickness have to be considered.
The distance–gain–size (DGS) curve and distance–amplitude curve (DAC) are the widely used methods for sizing small flaws [6,7]. The conventional method for obtaining these curves is based on an empirical formula which may lose its accuracy in the near sound-field distance of the transducer, or based on the experimental results which need many test blocks and a heavy workload [8]. In addition, when these curves are obtained, the reference signals reflected from the front or bottom surfaces are needed. However, when the tested materials are covered by coatings, it is hard to measure these reference signals precisely. Thus, more work is needed to accurately size the small flaws in coated materials and make these curves more suitable for practical applications using ultrasonic techniques.
In this work, the effects of the oxide coating thickness on the small flaw sizing will be discussed. The ultrasonic measurement model is introduced to predict the flaw response signal, and a new flaw-sizing curve for flaw sizing, based on the model, is proposed. In order to account for the coating thickness effects, the reflection and transmission coefficients associated with the coating thickness are derived, and a method to correct these effects is proposed. A flaw-sizing method suitable for coated materials is provided, and its effectiveness is verified by evaluating the flaw sizes in coated AZ80 magnesium alloys.
2. Theory
2.1. Ultrasonic Measurement Model
A widely used ultrasonic measurement model (UMM) includes the configuration of the transducer and the component being inspected, as well as a description of the wave generation, propagation, and reception, and is used to predict the output signals to anomalies in the measured component [9,10]. Considering a generic ultrasonic measurement system for interrogating a flaw immersed in water in a pulse-echo setup, as shown in Figure 1, the output voltage response, VR(ω), for a flaw can be expressed using a number of physical processes. On the basis of the theory developed by Schmerr, the flaw response can be described as [9]
where s(ω) is the system function, which considers all the electrical and electromechanical parts in the measurement system and tA(ω) is the elastic/acoustic transfer function, which describes the propagation, reflection, scattering, and reception processes of ultrasonic acoustics.
VR(ω) = s(ω) tA(ω)
In the measurement setup, the system function is usually calibrated at first. It can be computed by the deconvolution of an experimental signal obtained from a reference reflector by a corresponding theoretical reference model, which can be described as [11]
where Vexp(ω) is an experimentally measured voltage, is the average received velocity by the theoretical reference model, and W(ω) is a Wiener filter. The measured voltage from a well-polished large surface is usually used as the reference signal, and in this case the theoretical reference model can be written as [12]
where Rws is the ideal reflection coefficient in the water specimen surface, kw is the wavenumber in water, αf is the frequency-dependence attenuation coefficient, a is the radius of the transducer, and Jn denotes the nth order Bessel function.
The natural occurring flaws, such as cracks, are typically irregular in shape, therefore, when sizing defects, it is necessary to determine their equivalent sizes. In most of ultrasonic nondestructive evaluations, one may simply size the flaws in terms of some comparable reference scatterer such as flat bottom holes. So, when we consider a pulse-echo measurement of a flat bottom hole inside a solid specimen immersed in water, the transfer function tA(ω) can be obtained through the integration of incident wave fields over the flaw plane surface:
where ρ and c are the density and sound velocity, respectively, the subscripts s and w denote the specimen and water, respectively, ST is the transducer surface, Sf is the surface of the flaw, and V(x,ω) is the sound beam over the flaw surface, which can be calculated using the multi-Gaussian beam model as [13,14]
where DR = kwa2/2 is the Rayleigh distance, Am and Bm are 25 terms of complex coefficients, and Tws is the ideal transmission coefficient in the water specimen surface.
Note the effects of diffraction, attenuation, and transmission coefficient have to be considered to calculate the sound beams. The flaw response signals can be obtained by combining the system function and the transfer function. In the following sections, the effects of the coating thickness on the reflected and transmitted sound beam energy will be discussed.
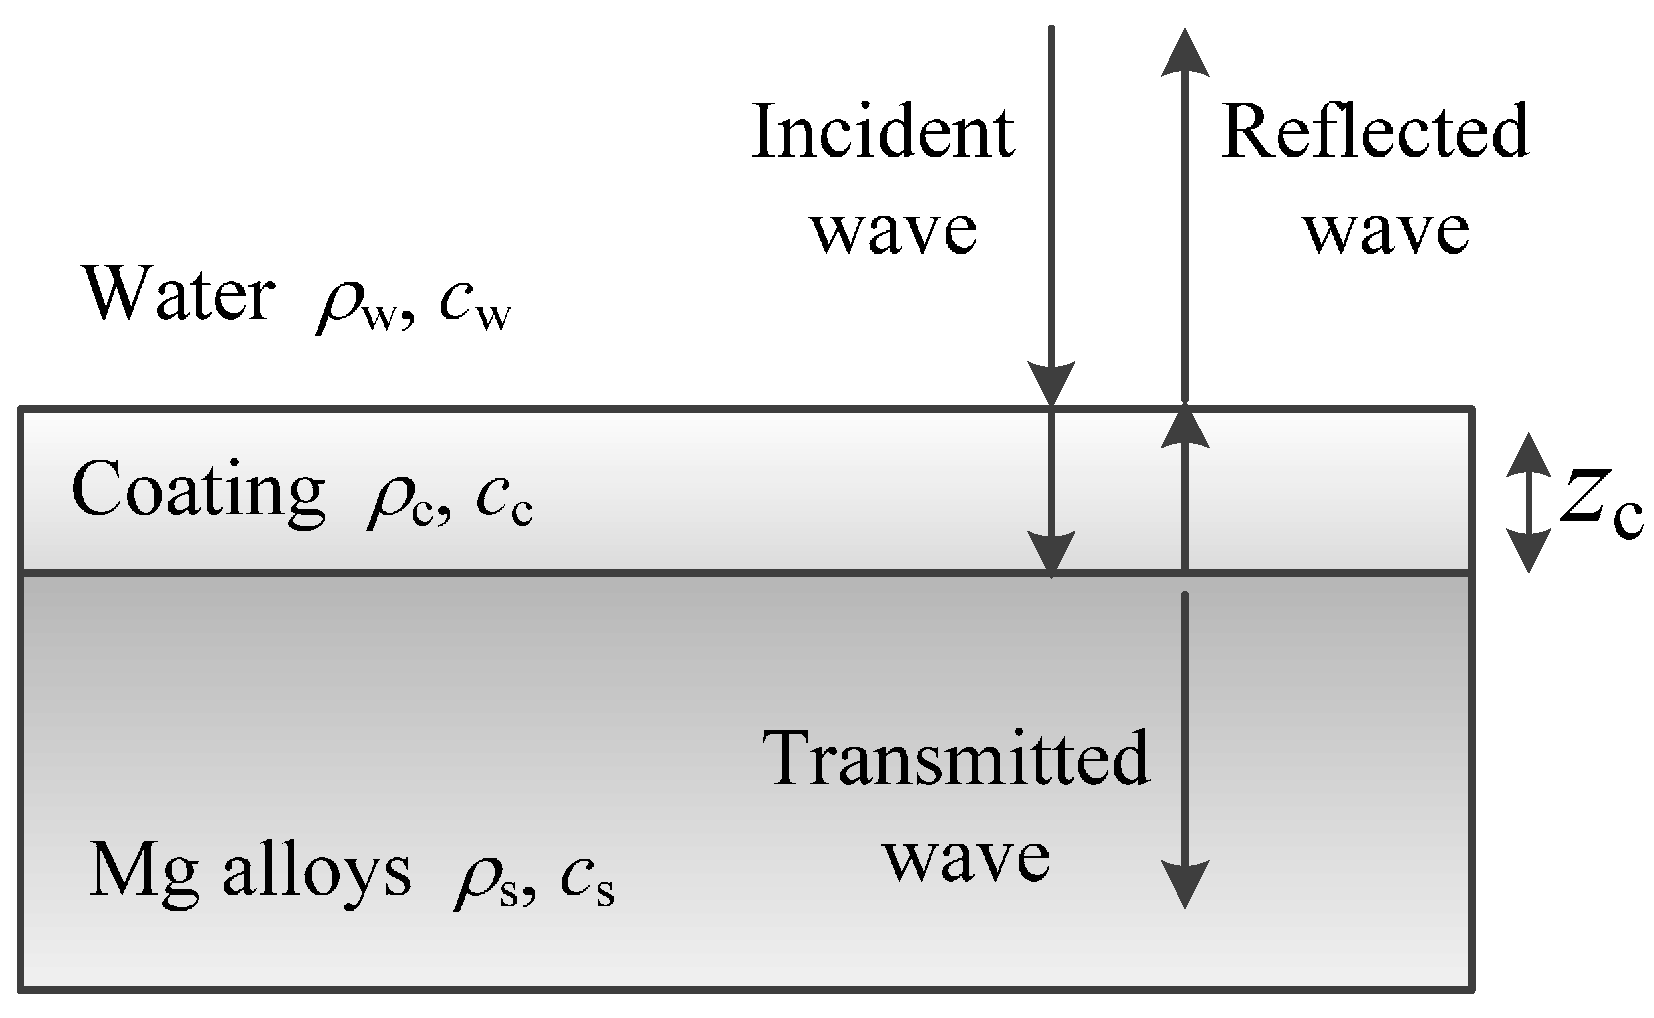
2.2. Effects of the Coating Thickness
Figure 2 shows the diagram of ultrasonic propagation in a water–coating–substrate system. In the AZ80 magnesium alloys, the oxide coating thickness is usually less than 0.5 mm. Since the most ultrasonic nondestructive tests are conducted in a low frequency, i.e., less than 20 MHz, the echo signals from the front and the back surfaces of the coating cannot be separated in the time domain. However, the magnitudes of the reflected and transmitted signals will be different because of the coating effects. Fortunately, the changes of the reflected and transmitted ultrasonic energies can be determined quantitatively through the reflection–transmission theory. The expression of the complex reflection coefficient at normal incidence from the water specimen surface with consideration of the coating can be written as [15]
with
where the subscript “c” refers to the coating, and d is the coating thickness.
On the basisi of the conservation of energy and using the acoustic intensity of a plane wave, the transmission coefficient to the specimen can be derived as
Therefore, when the acoustic impendence and the thickness of the coating are known, the reflected and transmitted acoustic energies can be corrected using the above reflection and transmission coefficients, respectively. When the coated materials are tested, the system function can be determined through Equation (2) by correcting the reflection coefficient, and the flaw response signals can be obtained by combining the system function and the transfer function Equation (4) with the corrected transmission coefficient.
3. Experiments
3.1. Materials
Three AZ80 magnesium alloy specimens, with the size of 100 × 50 × 20 mm3, are prepared. One of the specimens (S1) is the original one without coating, while two of the specimens (S2 and S3) have oxide coatings, which are made by the anodization method. The average thicknesses of the coatings in S2 and S3 are about 0.25 mm and 0.5 mm, respectively. Each specimen contains three different sizes of flat bottom holds (0.8, 1.2, and 2 mm) at a depth of 10 mm. The density, ultrasonic velocity, and attenuation coefficients of water, coating, and substrate are shown in Table 1.
3.2. Experimental Process
The experimental setup is shown in Figure 3. An immersion transducer (I3-1008-R, Olympus, Waltham, MA, USA) with center frequency of 10 MHz and diameter of 12.5 mm is used in the experiment. In the experiments, the transducer is normal to the interface, and the water path is 20 mm. A pulser–receiver (NDT 5072PR, Panametrics, Waltham, MA, USA) is used to drive the focused transducer and receive the pulse-echo signals. Three specimens are well scanned, and the electrical output signals are received by an ultrasonic card (PCIUT3100, Ultratek, New York, NY, USA) and processed with an industrial computer for further investigations.
4. Results and Discussions
4.1. System Functions
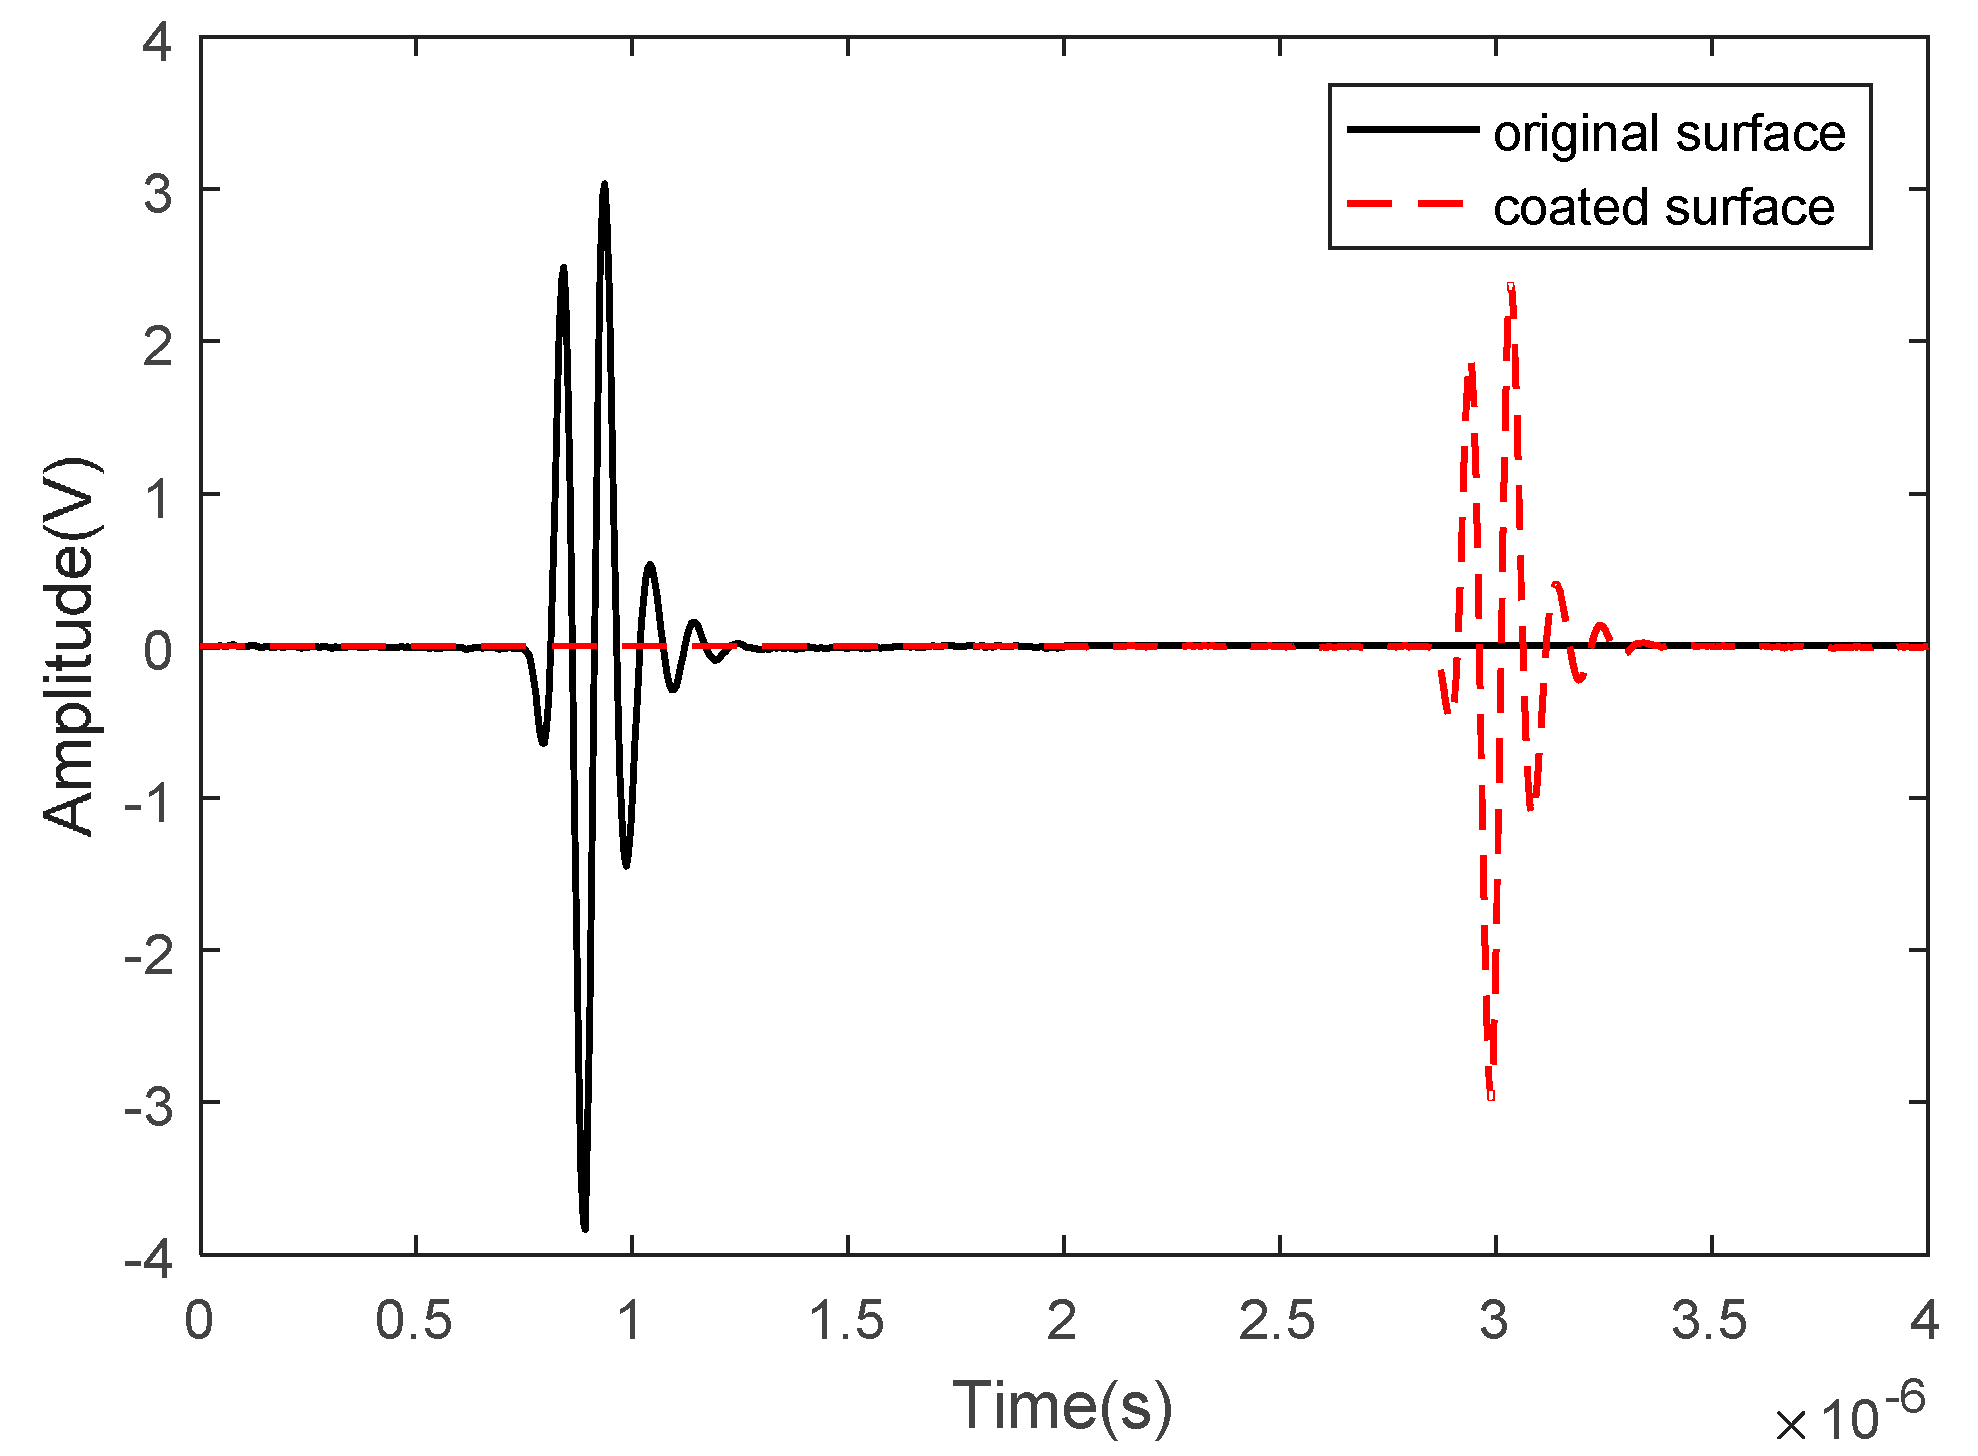
Figure 4 shows the front original surface reflection signals experimentally captured from S1. The system function can be determined through the deconvolution (Equation (2)) of this signal by the reference reflector model (Equation (3)). The determined system function is shown in Figure 5.
In order to discuss the effects of the coating on the reflected signal, the front coated surface reflection signals experimentally determined from S2 is also shown in Figure 4 for comparison. It can be seen that the signal magnitude from the coated surface is smaller than that from an original surface because the reflection coefficient become smaller. When the signal is used to predict the system function, the reflection coefficient in the reference reflector model equation (Equation (3)) has to be corrected using the Equation (4). The predicted system function from the coated surface signal is shown in Figure 5 for comparison. Although the measured reflected signals are different, it is found that the two determined system functions agree well with each other in the broad-band frequency. The results indicate that the correction for the reflection coefficient is correct and also show that the effect of coating on the signal spectrum is insignificant.
4.2. Flaw Responses
The effects of the coating thickness on the flaw response will be discussed by comparing the measured flaw signals with the predicted ones in different specimens. All these experiments are conducted in the same system conditions, and the maximum flaw signals are selected by well adjusting the transducer’s position. The pulse-echo responses of the flat bottom holes in the frequency domain can be calculated using Equation (2) of the UMM, and, through the inverse Fourier transform, the predicted time domain signals can be obtained. Figure 6a shows the comparison results of the measured and predicted signals for the flat bottom hole of 2 mm diameter in S1. The agreement between the predictions and the experiments demonstrates the accuracy of the UMM.
Figure 6b shows the experimental results and predictions for the flat bottom hole of 2 mm diameter in S2. In “prediction 1”, the transmission coefficients are corrected by considering the effects of the coating thickness, whereas in ‘prediction 2’, there is no correction for the transmission coefficients, and this result is the same as the prediction shown in Figure 6a. By comparing Figure 6a,b, it can be found that the flaw signal becomes larger when the surface is coated. The reasons for the larger flaw signal are that the transmitted ultrasonic energies increase because the transmission coefficient, which can be calculated using Equation (8), gets larger. The flaw response magnitude has a quadratic relationship with the transmission coefficient, as can be seen from Equation (4). When the effects of the coating thickness are not considered, the predicted results will be smaller than the experimental results. However, the predictions and experiments will agree well with each other when these effects are well accounted.
4.3. Flaw-Sizing Problems
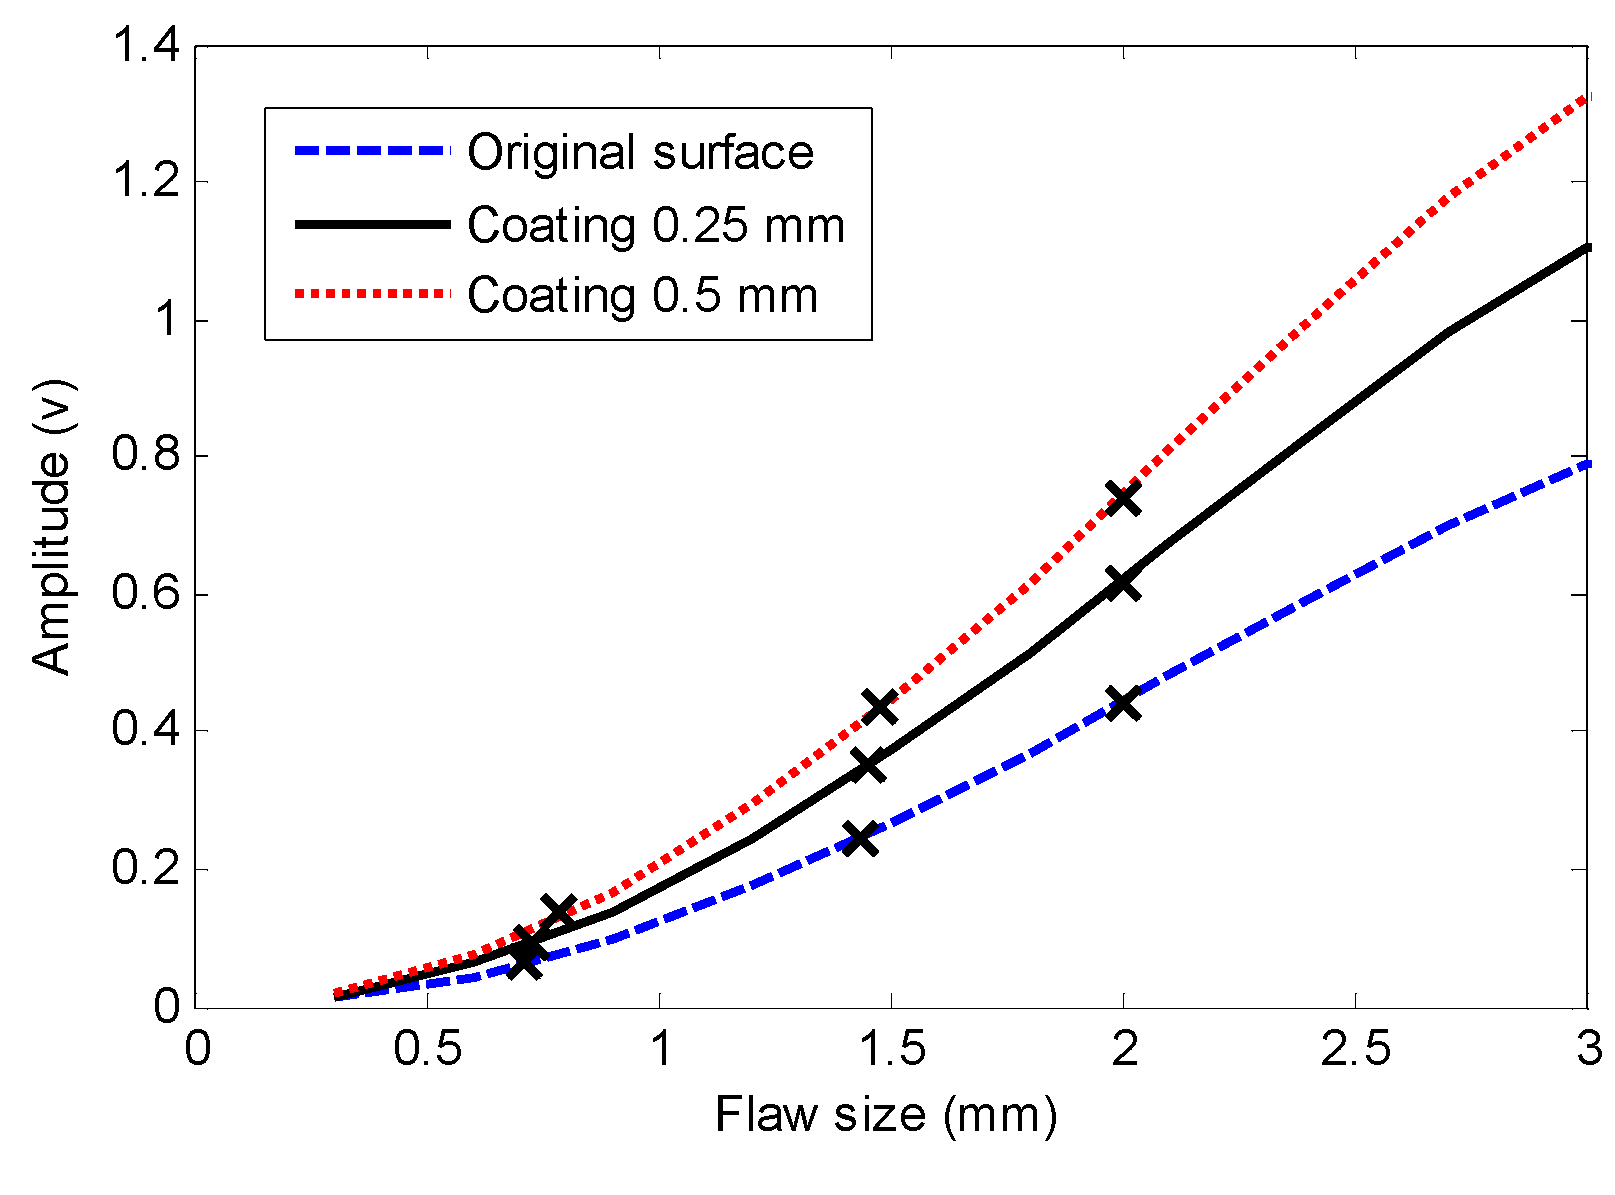
In order to solve the law accuracy and poor application of the traditional DGS and DAC curves for flaw sizing, a UMM considering the coating effects can be employed to predict the new flaw-sizing curves. When the system function is determined and the water path, flaw size, buried depth, and coating thickness are known, the flaw response in a coated specimen can be predicted, and the peak amplitude in the time domain can be introduced into the flaw-sizing curves. When the flaw sizes changes and all the other parameters are fixed, a set of flaw-sizing curves can be obtained; for the coated specimens with different coating thickness, a theoretical set of flaw-sizing curves can be determined, and these curves for this experimental condition are shown in Figure 7.
In these curves, a water path of 20 mm is used, the flaw size varies from 0 to 3 mm, and coating thicknesses of 0, 0.25, and 0.5 mm are introduced. It can be seen that the variation tendencies of these plots are the same but the magnitudes are different. It is also found that these plots increase irregularly when the flaw sizes increase. Note that these plots will increase until the flaw size exceeds the effective sound beam width of the transducer. However, the flaw sizing problem for large flaws is out of scope for this work.
Ultrasonic C-scanning is conducted for the specimens, and the signal from the center position of the flaw image is used to extract the peak amplitude of the flaw. All these measured peak data are shown in Figure 7. If the coating thickness is known but the flaw sizes are unknown, the flaw sizes can be extracted by matching these experimental data to the corresponding theoretical flaw-sizing curves. Table 2 shows the measured results. When the effects of thickness are considered, a good agreement, with errors lower than 10%, indicates that the model-based sizing for small flaws can be achieved.
Since this work is focused on the effects of the coating thickness on the flaw-sizing problems, ultrasonic test experiments are conducted in the same conditions, except that the coating thickness is different. However, it should be stressed that when the water path and buried depth change, the flaw-sizing curves can also be predicted using the proposed method by selecting the actual parameters.
5. Conclusions
In this work, the effects of the coating thickness on the flaw sizing using an ultrasonic nondestructive test are discussed. An ultrasonic measurement model is introduced to predict the flaw response, and, considering the effects of the coating thickness, the transmitted acoustic energy to the specimens is corrected through the transmission coefficients. On the basis of the ultrasonic measurement model and the correction method for the coating thickness, the flaw-sizing curve is provided for coated specimens. The coated AZ80 magnesium alloys specimens with different coating thickness are scanned, and the flaw sizes are characterized through the developed flaw-sizing curves. The determined sizes for these flaws agree well with the actual sizes, which indicates that the proposed method is effective in flaw sizing for coated materials. The study analyzes the effects of coatings on the reflected and transmitted ultrasonic energies and overcomes the inaccuracy of flaw sizing in coated materials. The proposed method using the ultrasonic measurement model to predict the flaw-sizing curves improves the accuracy for flaw sizing in practical applications.
Acknowledgments
This work was supported by the Project of Innovation-driven Plan in Central South University (Grant No. 2015CX003) and the National Science Foundation of China (Grant Nos. 51575541 and 51605044).
Author Contributions
Xiujuan Miao and Xiongbing Li conceived and designed the experiments; Shuzeng Zhang performed the experiments; Xiujuan Miao and Hongwei Hu analyzed the data; Guangjun Gao contributed reagents/materials/analysis tools; Xiujuan Miao and Xiongbing Li wrote the paper.
Conflicts of Interest
The authors declare no conflict of interest.
References
- Kim, W.J.; An, C.W.; Kim, Y.S.; Hong, S.I. Mechanical properties and microstructures of an AZ61 Mg alloy produced by equal channel angular pressing. Scr. Mater. 2002, 47, 39–44. [Google Scholar] [CrossRef]
- Zhao, Y.; Lin, L.; Li, X.M.; Lei, M.K. Simultaneous determination of the coating thickness and its longitudinal velocity by ultrasonic nondestructive method. NDT E Int. 2010, 43, 579–585. [Google Scholar] [CrossRef]
- He, J.; Ran, Y.; Liu, B.; Yang, J.; Guan, X. A Fatigue Crack Size Evaluation Method Based on Lamb Wave Simulation and Limited Experimental Data. Sensors 2017, 17, 2097. [Google Scholar] [CrossRef] [PubMed]
- Rose, J.L. Ultrasonic Waves in Solid Media, 2nd ed.; Cambridge University Press: Cambridge, UK, 1999. [Google Scholar]
- Schmerr, L.W.; Song, S.-J.; Sedov, A. Ultrasonic flaw sizing inverse problems. Inverse Probl. 2002, 18, 1775–1793. [Google Scholar] [CrossRef]
- Sodev, A.; Schmerr, L.W.; Song, S.J. Ultrasonic scattering by a flat-bottom hold in immersion testing: An analytical model. J. Acoust. Soc. Am. 1992, 92, 478–486. [Google Scholar] [CrossRef]
- Achenbach, J.D. Quantitative nondestructive evaluation. Int. J. Solids Struct. 2000, 37, 13–27. [Google Scholar] [CrossRef]
- Li, X.; Wang, Y.; Ni, P.; Hu, H.; Song, Y. Flaw sizing using ultrasonic c-scan imaging with dynamic thresholds. Insight 2017, 59, 603–608. [Google Scholar] [CrossRef]
- Schmerr, L.W. Fundamentals of Ultrasonic Nondestructive Evaluation: A Modeling Approach; Springer: New York, NY, USA, 1998. [Google Scholar]
- Thompson, R.B.; Gray, T.A. A model relating ultrasonic scattering measurements through liquid-solid interfaces to unbounded medium scattering amplitudes. J. Acoust. Soc. Am. 1983, 74, 1279–1290. [Google Scholar] [CrossRef]
- Zhao, X.; Gnag, T.; Xu, C. Prediction of side-drilled hole signals captured by a dual crystal contact probe. J. Nondestruct. Eval. 2010, 29, 105–110. [Google Scholar] [CrossRef]
- Rogers, P.H.; Van Buren, A.L. An exact expression for the Lommel diffraction correction integral. J. Acoust. Soc. Am. 1974, 55, 724–728. [Google Scholar] [CrossRef]
- Kim, H.J.; Schmerr, L.W.; Sedov, A. Generation of the basis sets for multi-Gaussian ultrasonic beam models—An overview. J. Acoust. Soc. Am. 2006, 119, 1971–1978. [Google Scholar] [CrossRef] [PubMed]
- Zhang, S.; Kube, C.M.; Song, Y.; Li, X. A self-reciprocity calibration method for broadband focused transducers. J. Acoust. Soc. Am. 2016, 140, EL236–EL241. [Google Scholar] [CrossRef] [PubMed]
- Brekhovskikh, L.M. Waves in Layered Media; Academic: New York, NY, USA, 1960. [Google Scholar]
Figure 1.
Ultrasonic measurement model for a pulse-echo immersion testing geometry.
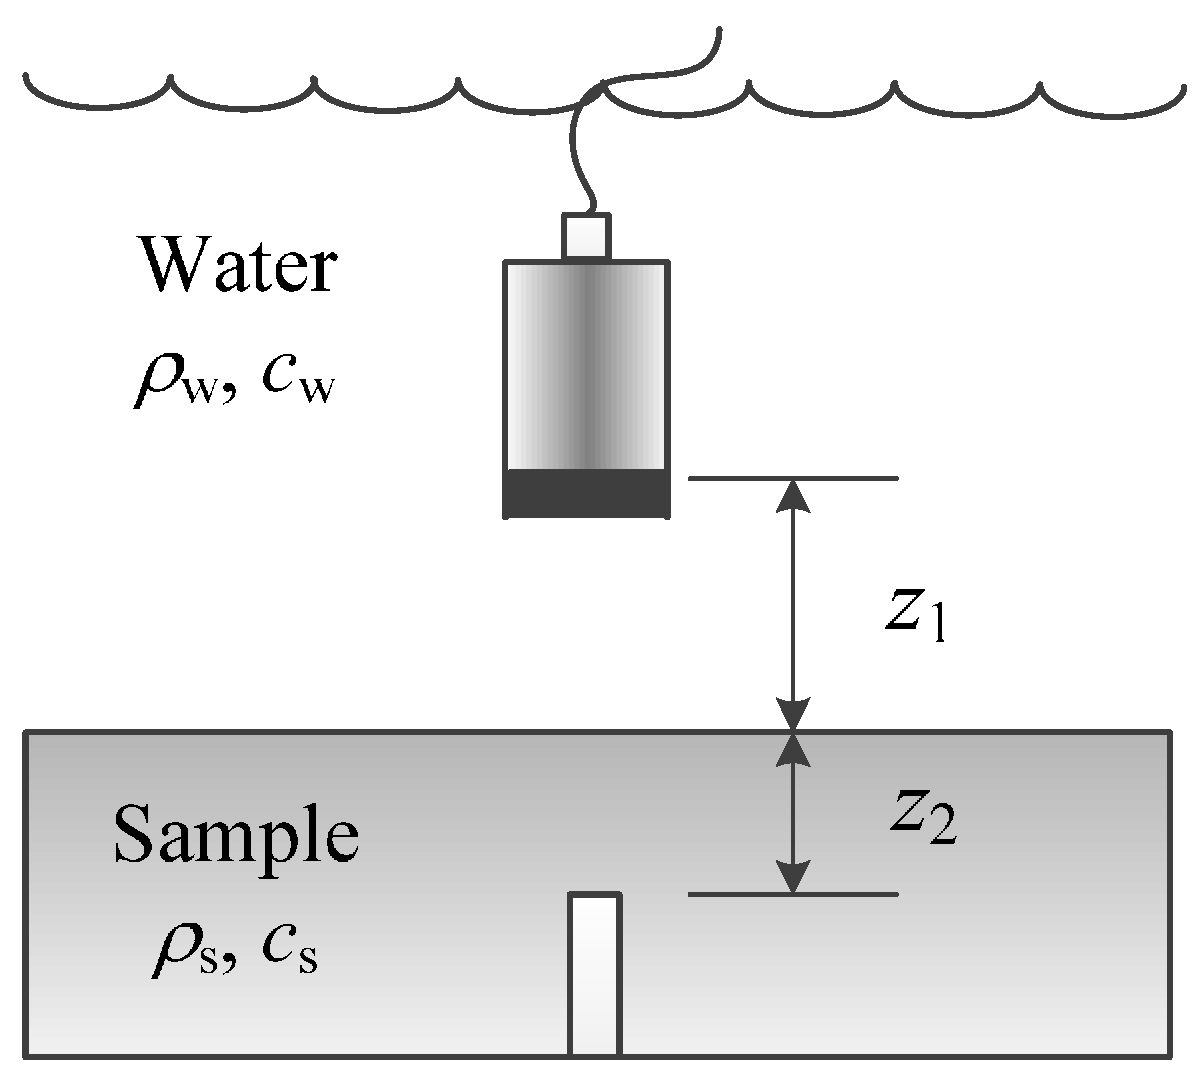
Figure 2.
The diagram of ultrasonic propagation in coated AZ80 magnesium alloys.

Figure 3.
Experimental setup.
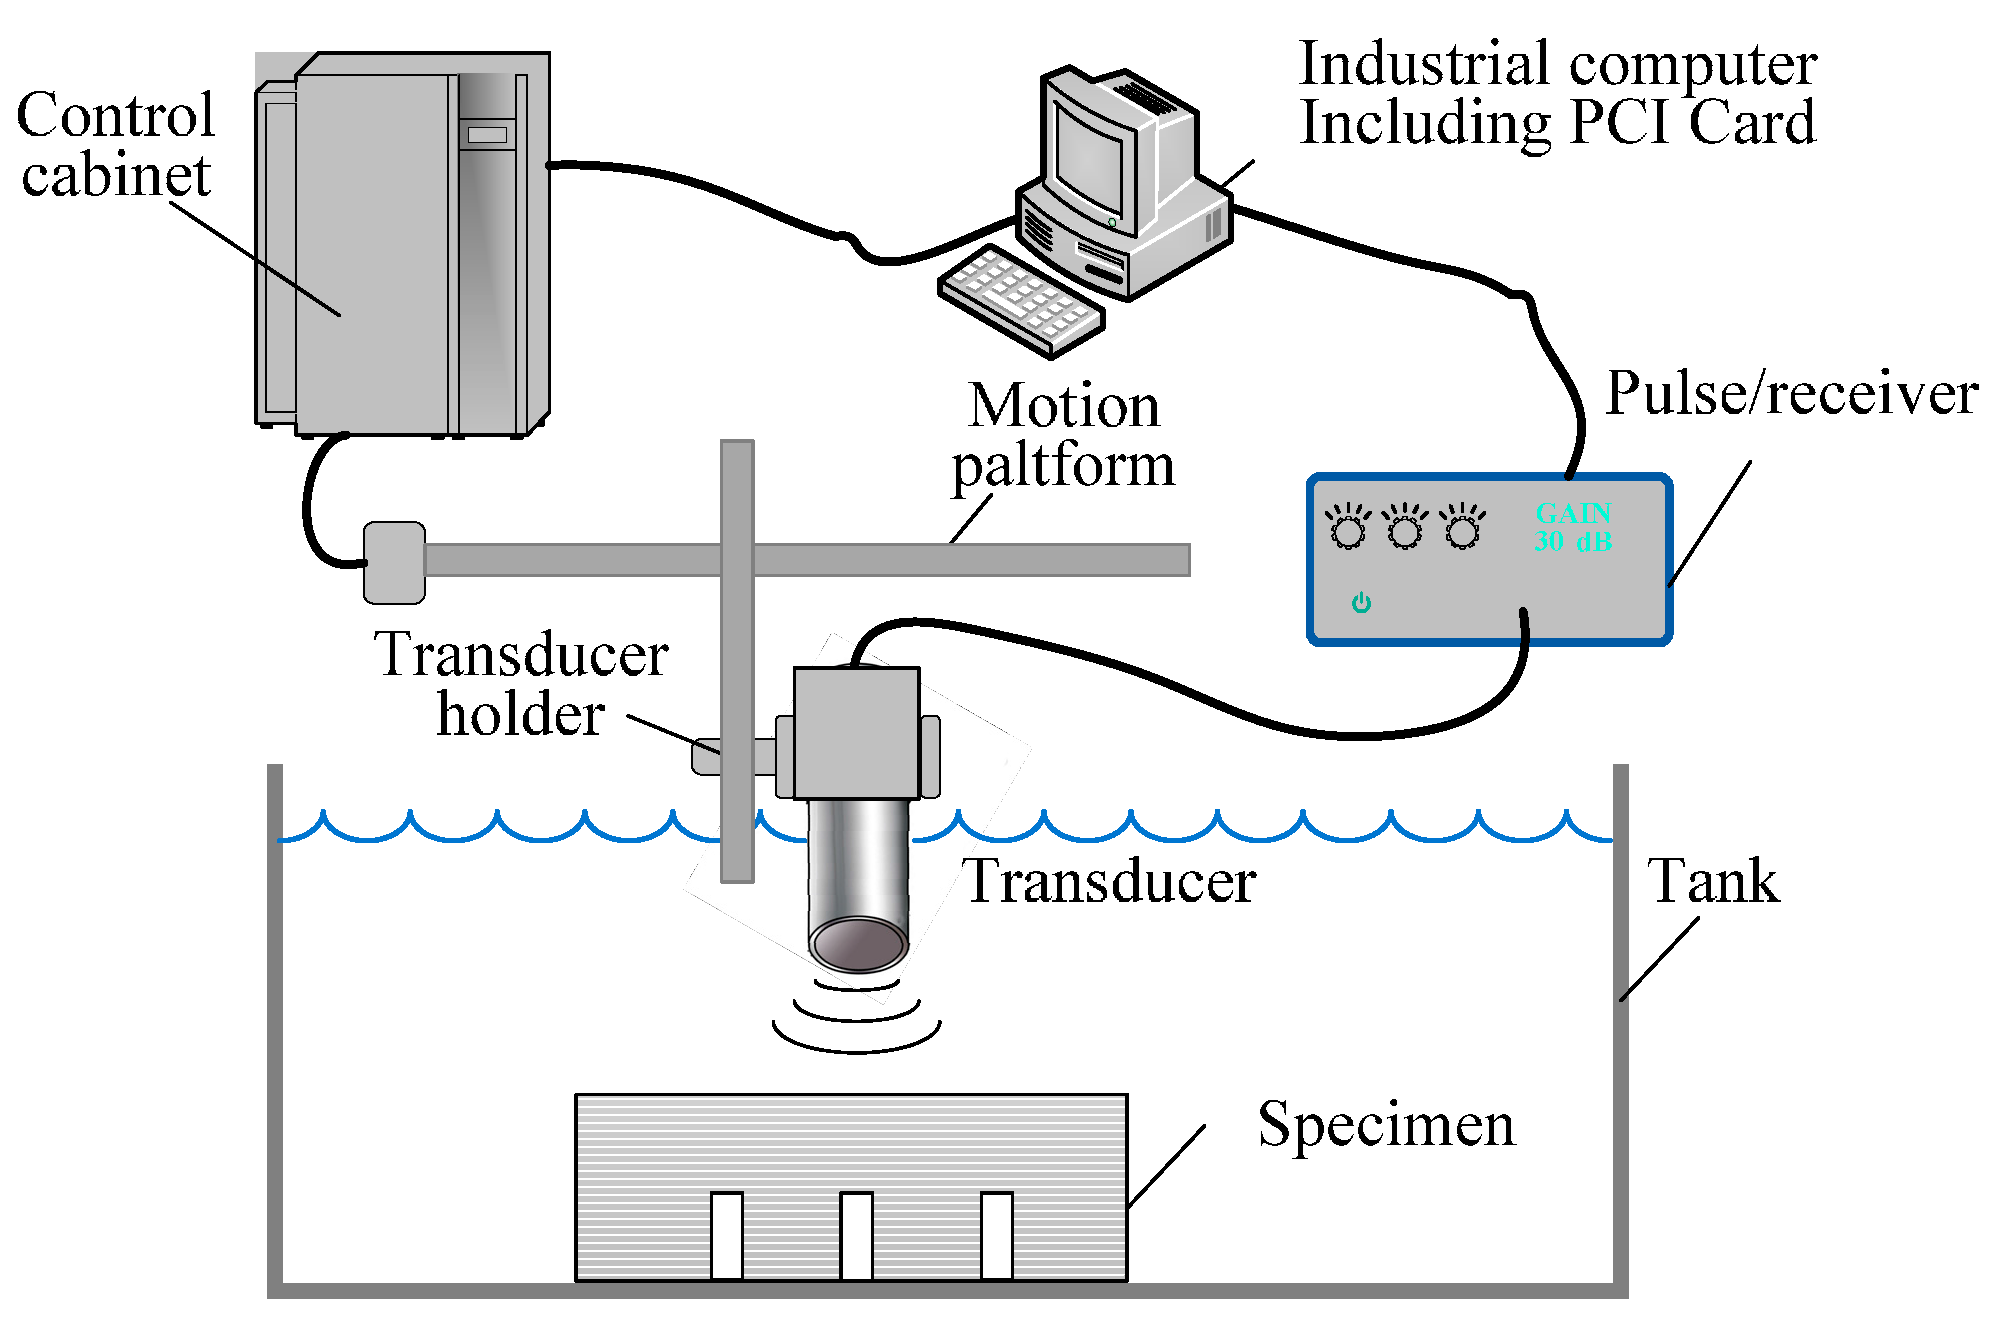
Figure 4.
The measured reference signals from the original and coated surfaces.

Figure 5.
The calibrated system functions using the signals from the original and coated surfaces.
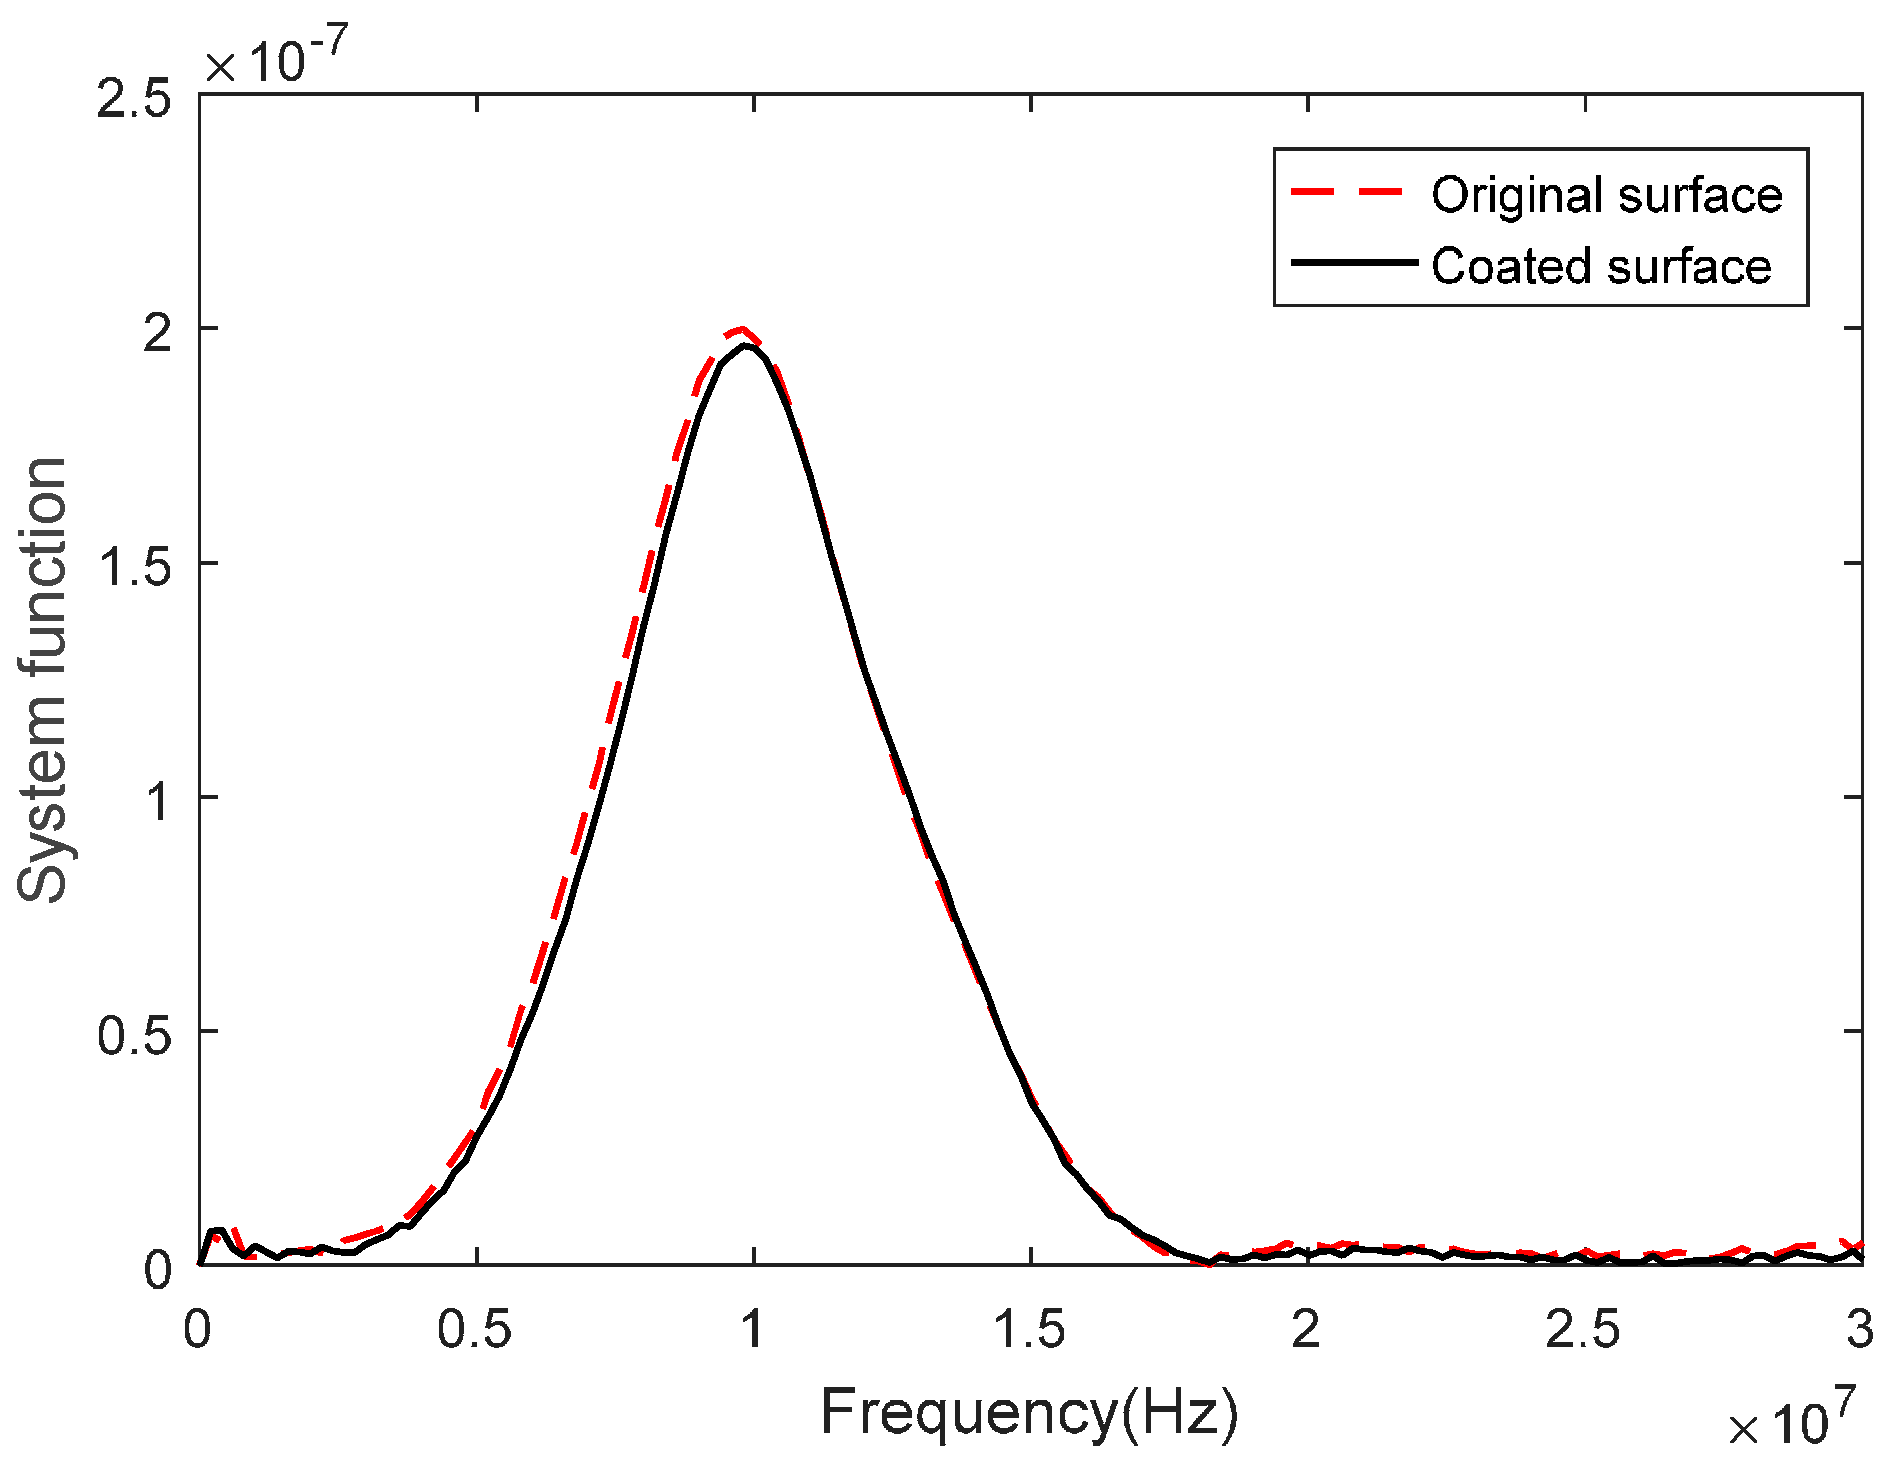
Figure 6.
Comparison of the predicted and measured flaw response signals in (a) the original specimen and (b) the coated specimen.
Figure 6.
Comparison of the predicted and measured flaw response signals in (a) the original specimen and (b) the coated specimen.
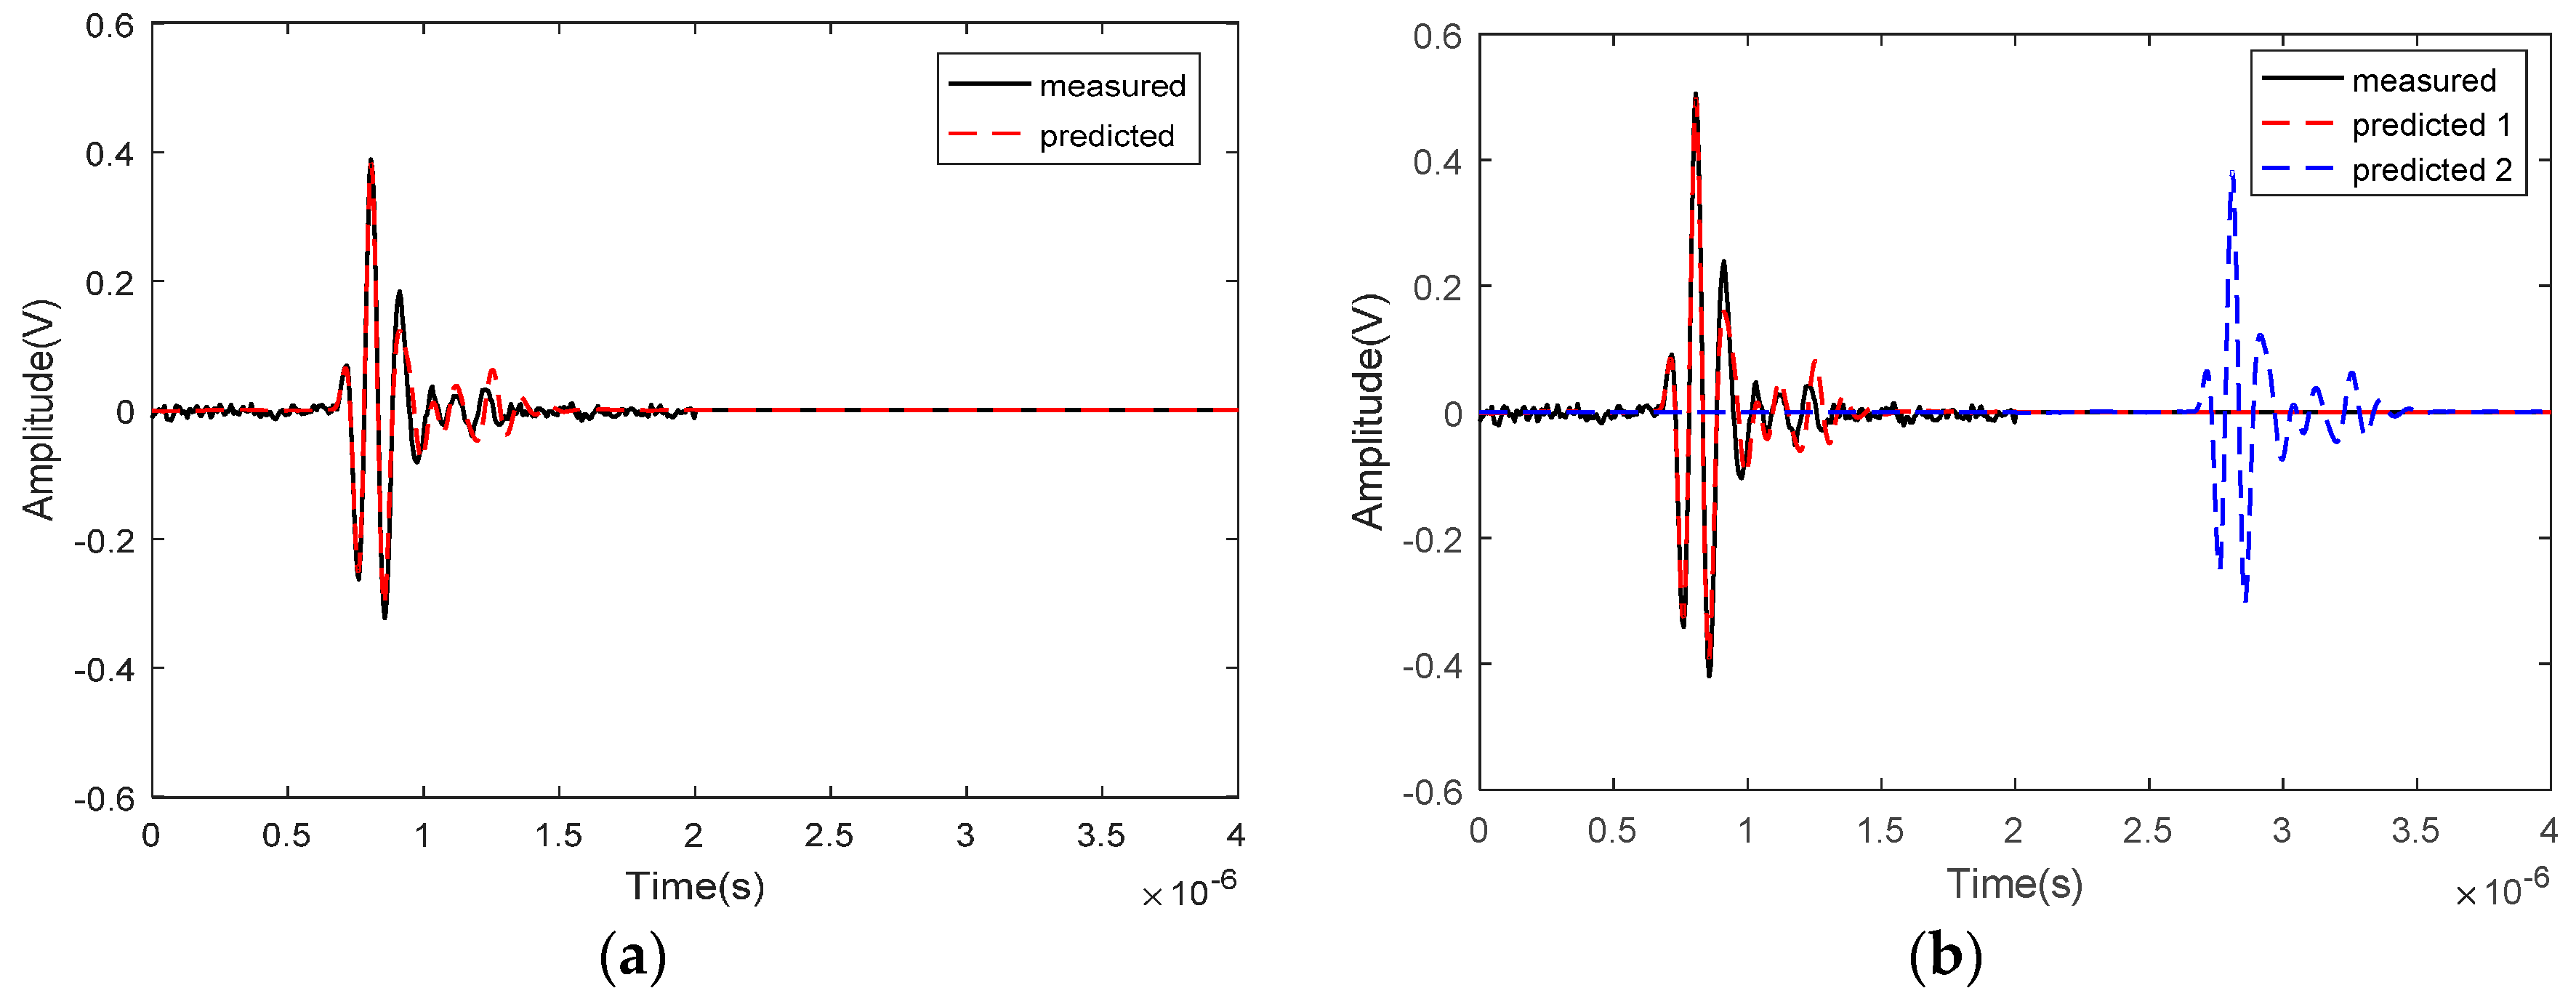
Figure 7.
Flaw-sizing curves for flaw sizing in coated specimens.


Table 1.
Acoustic parameters of the materials used in this work.
| Material | Density (kg/m3) | Velocity (m/s) | Attenuation (Np/m) |
|---|---|---|---|
| water | 1000 | 1482 | 25.3 × 10⁻¹⁵ f2 |
| oxide coating | 3500 | 5400 | – |
| Mg alloys | 1800 | 5740 | 45 × 10−15 f2 |
Table 2.
Determined flaw sizes from the flaw-sizing curves for coated specimens.
| Coating Thickness | 0.8 mm Flaw (mm) | 1.5 mm Flaw (mm) | 2 mm Flaw (mm) | |||
|---|---|---|---|---|---|---|
| Actual Size | Measured Size | Actual Size | Measured Size | Actual Size | Measured Size | |
| – | 0.8 | 0.72 | 1.5 | 1.44 | 2 | 1.97 |
| 0.25 mm | 0.8 | 0.73 | 1.5 | 1.45 | 2 | 1.97 |
| 0.5 m | 0.8 | 0.78 | 1.5 | 1.48 | 2 | 1.98 |
© 2018 by the authors. Licensee MDPI, Basel, Switzerland. This article is an open access article distributed under the terms and conditions of the Creative Commons Attribution (CC BY) license (http://creativecommons.org/licenses/by/4.0/).
Share and Cite
MDPI and ACS Style
Miao, X.; Li, X.; Hu, H.; Gao, G.; Zhang, S. Effects of the Oxide Coating Thickness on the Small Flaw Sizing Using an Ultrasonic Test Technique. Coatings 2018, 8, 69. https://doi.org/10.3390/coatings8020069
AMA Style
Miao X, Li X, Hu H, Gao G, Zhang S. Effects of the Oxide Coating Thickness on the Small Flaw Sizing Using an Ultrasonic Test Technique. Coatings. 2018; 8(2):69. https://doi.org/10.3390/coatings8020069
Chicago/Turabian StyleMiao, Xiujuan, Xiongbing Li, Hongwei Hu, Guangjun Gao, and Shuzeng Zhang. 2018. "Effects of the Oxide Coating Thickness on the Small Flaw Sizing Using an Ultrasonic Test Technique" Coatings 8, no. 2: 69. https://doi.org/10.3390/coatings8020069
Note that from the first issue of 2016, this journal uses article numbers instead of page numbers. See further details here.