The Effect of Xanthan Gum and Flaxseed Mucilage as Edible Coatings in Cheddar Cheese during Ripening

 , , and
Abstract
:1. Introduction
2. Methods and Materials
2.1. Raw Materials
2.2. Preparation of Coating Solutions
2.3. Cheese Coating Method
2.4. Microbial Analysis
2.5. Evaluation of Proteolysis
2.6. Evaluation of Lipolysis
2.7. Free Fatty Acid Composition Analysis
2.8. Compositional Analysis
2.9. Sensory Analysis
2.10. Statistical Analysis
3. Results and Discussion
3.1. Cheese Composition
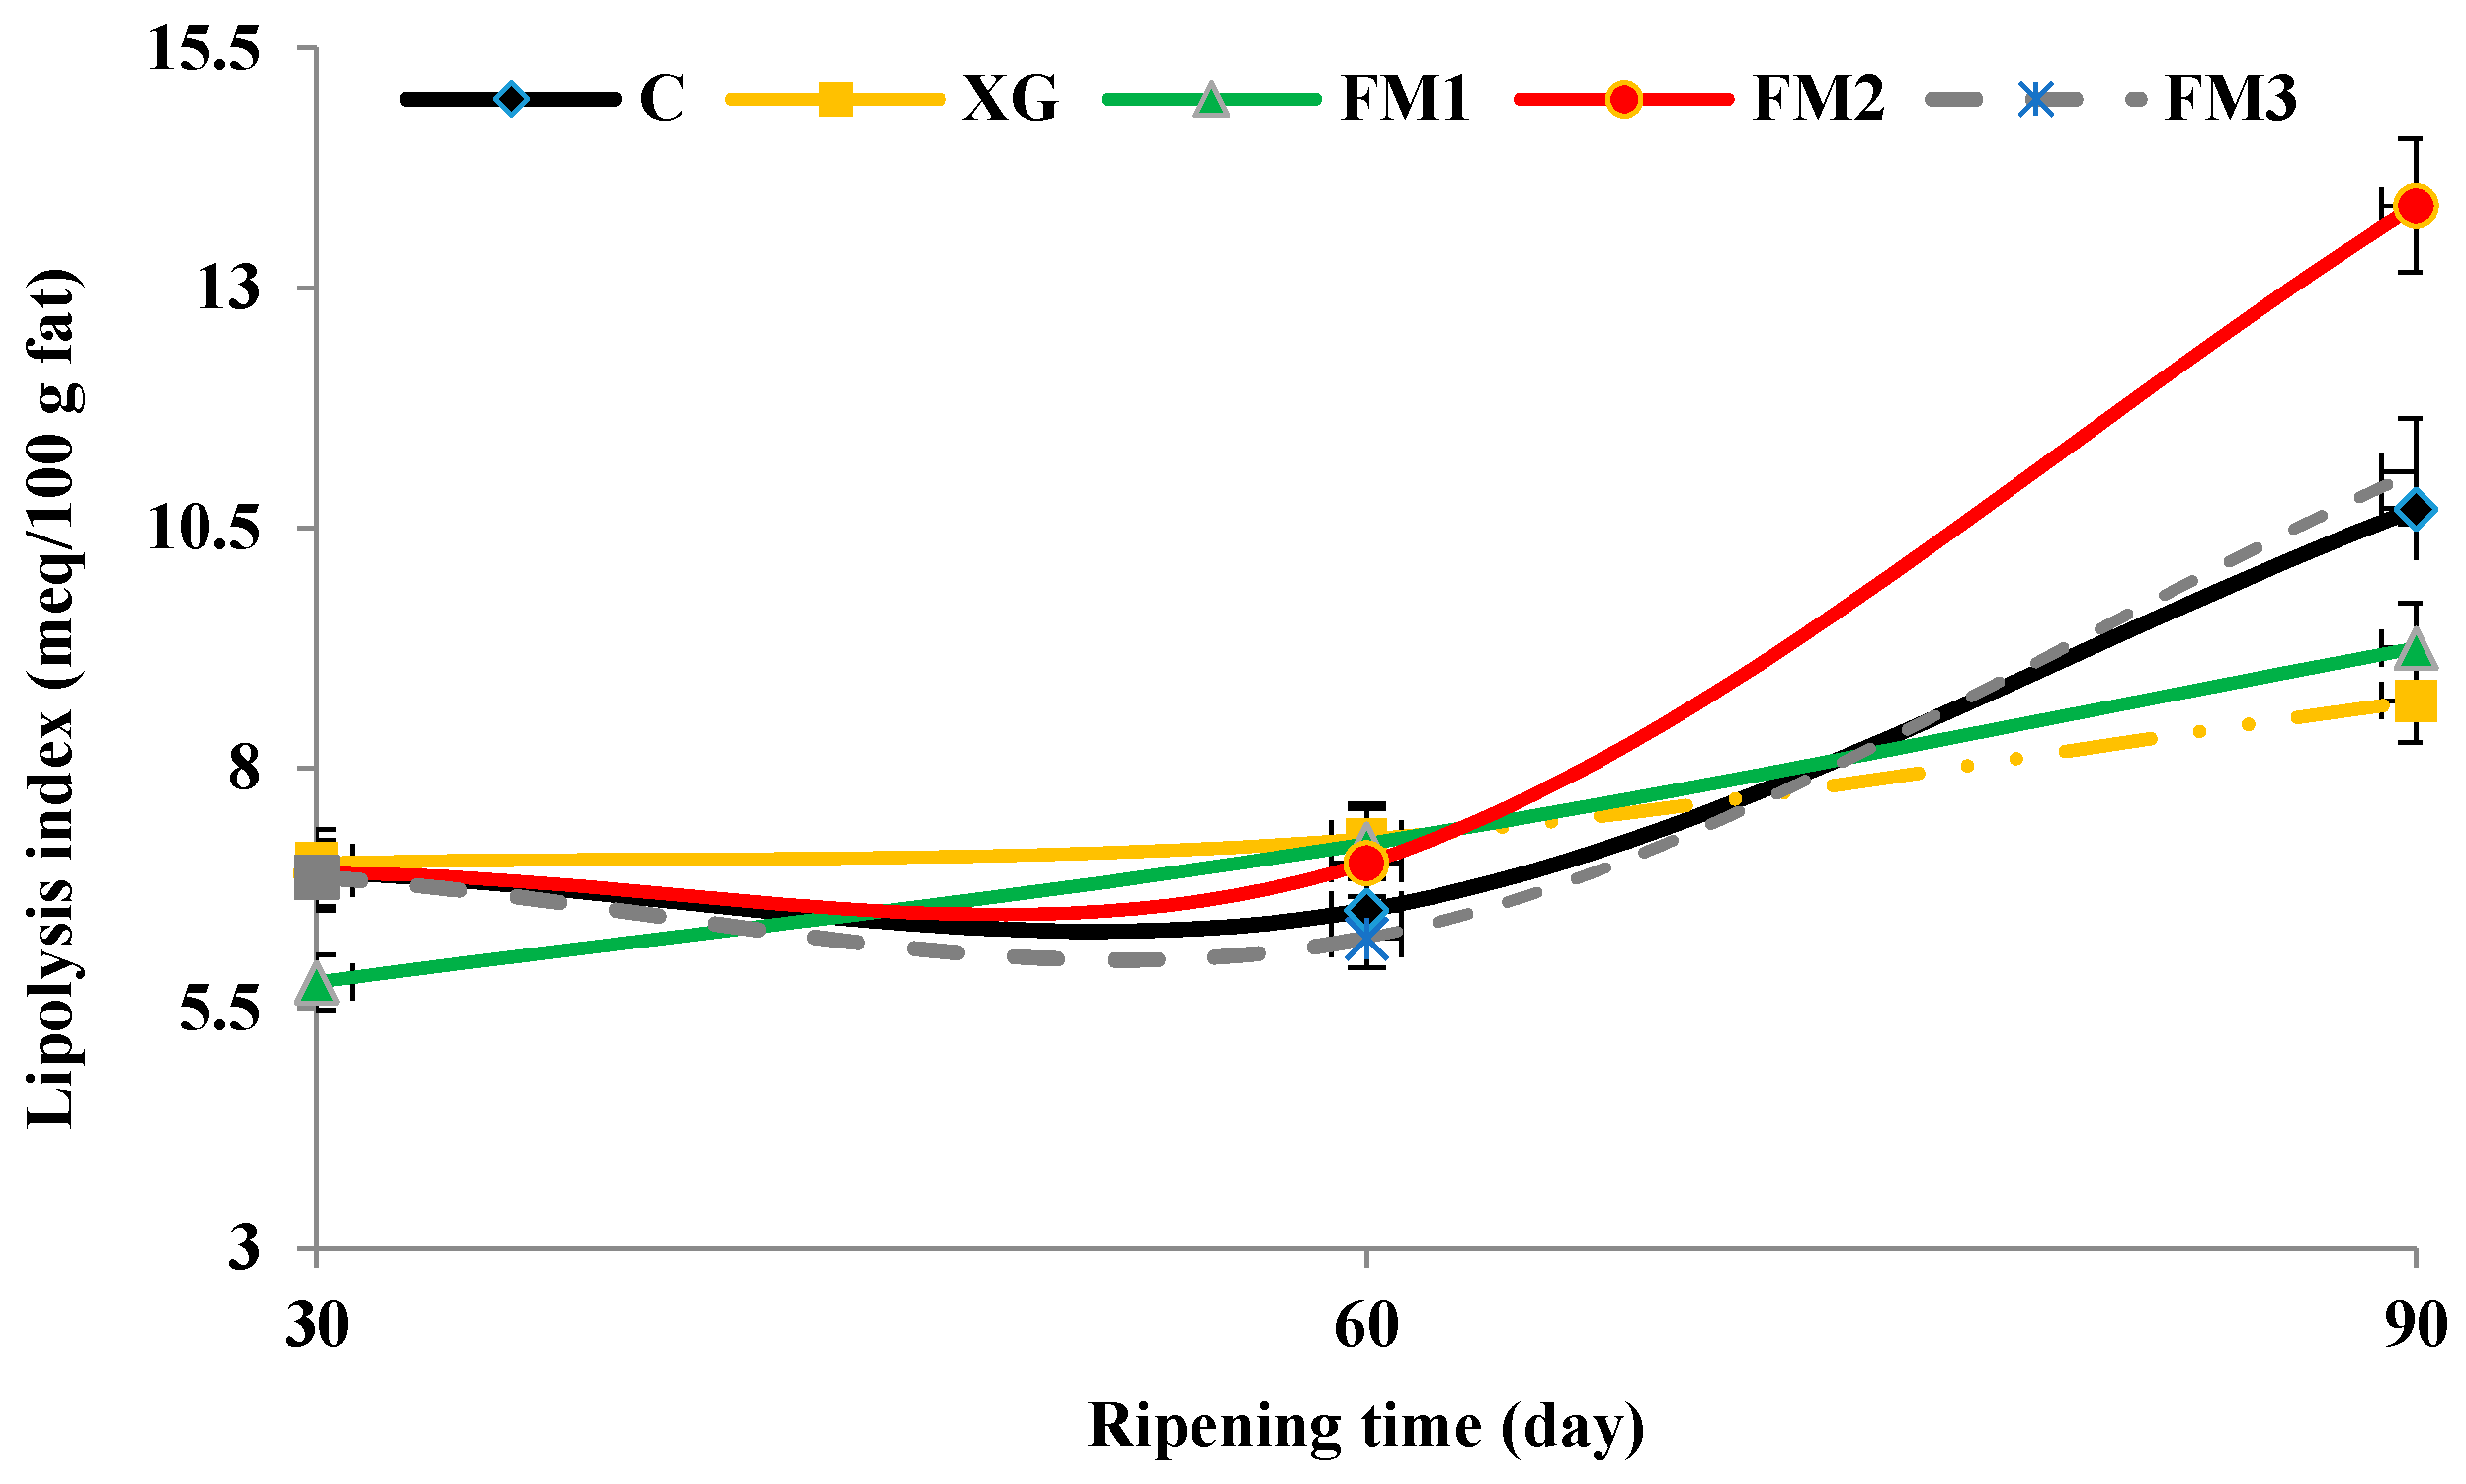
3.2. Lipolysis
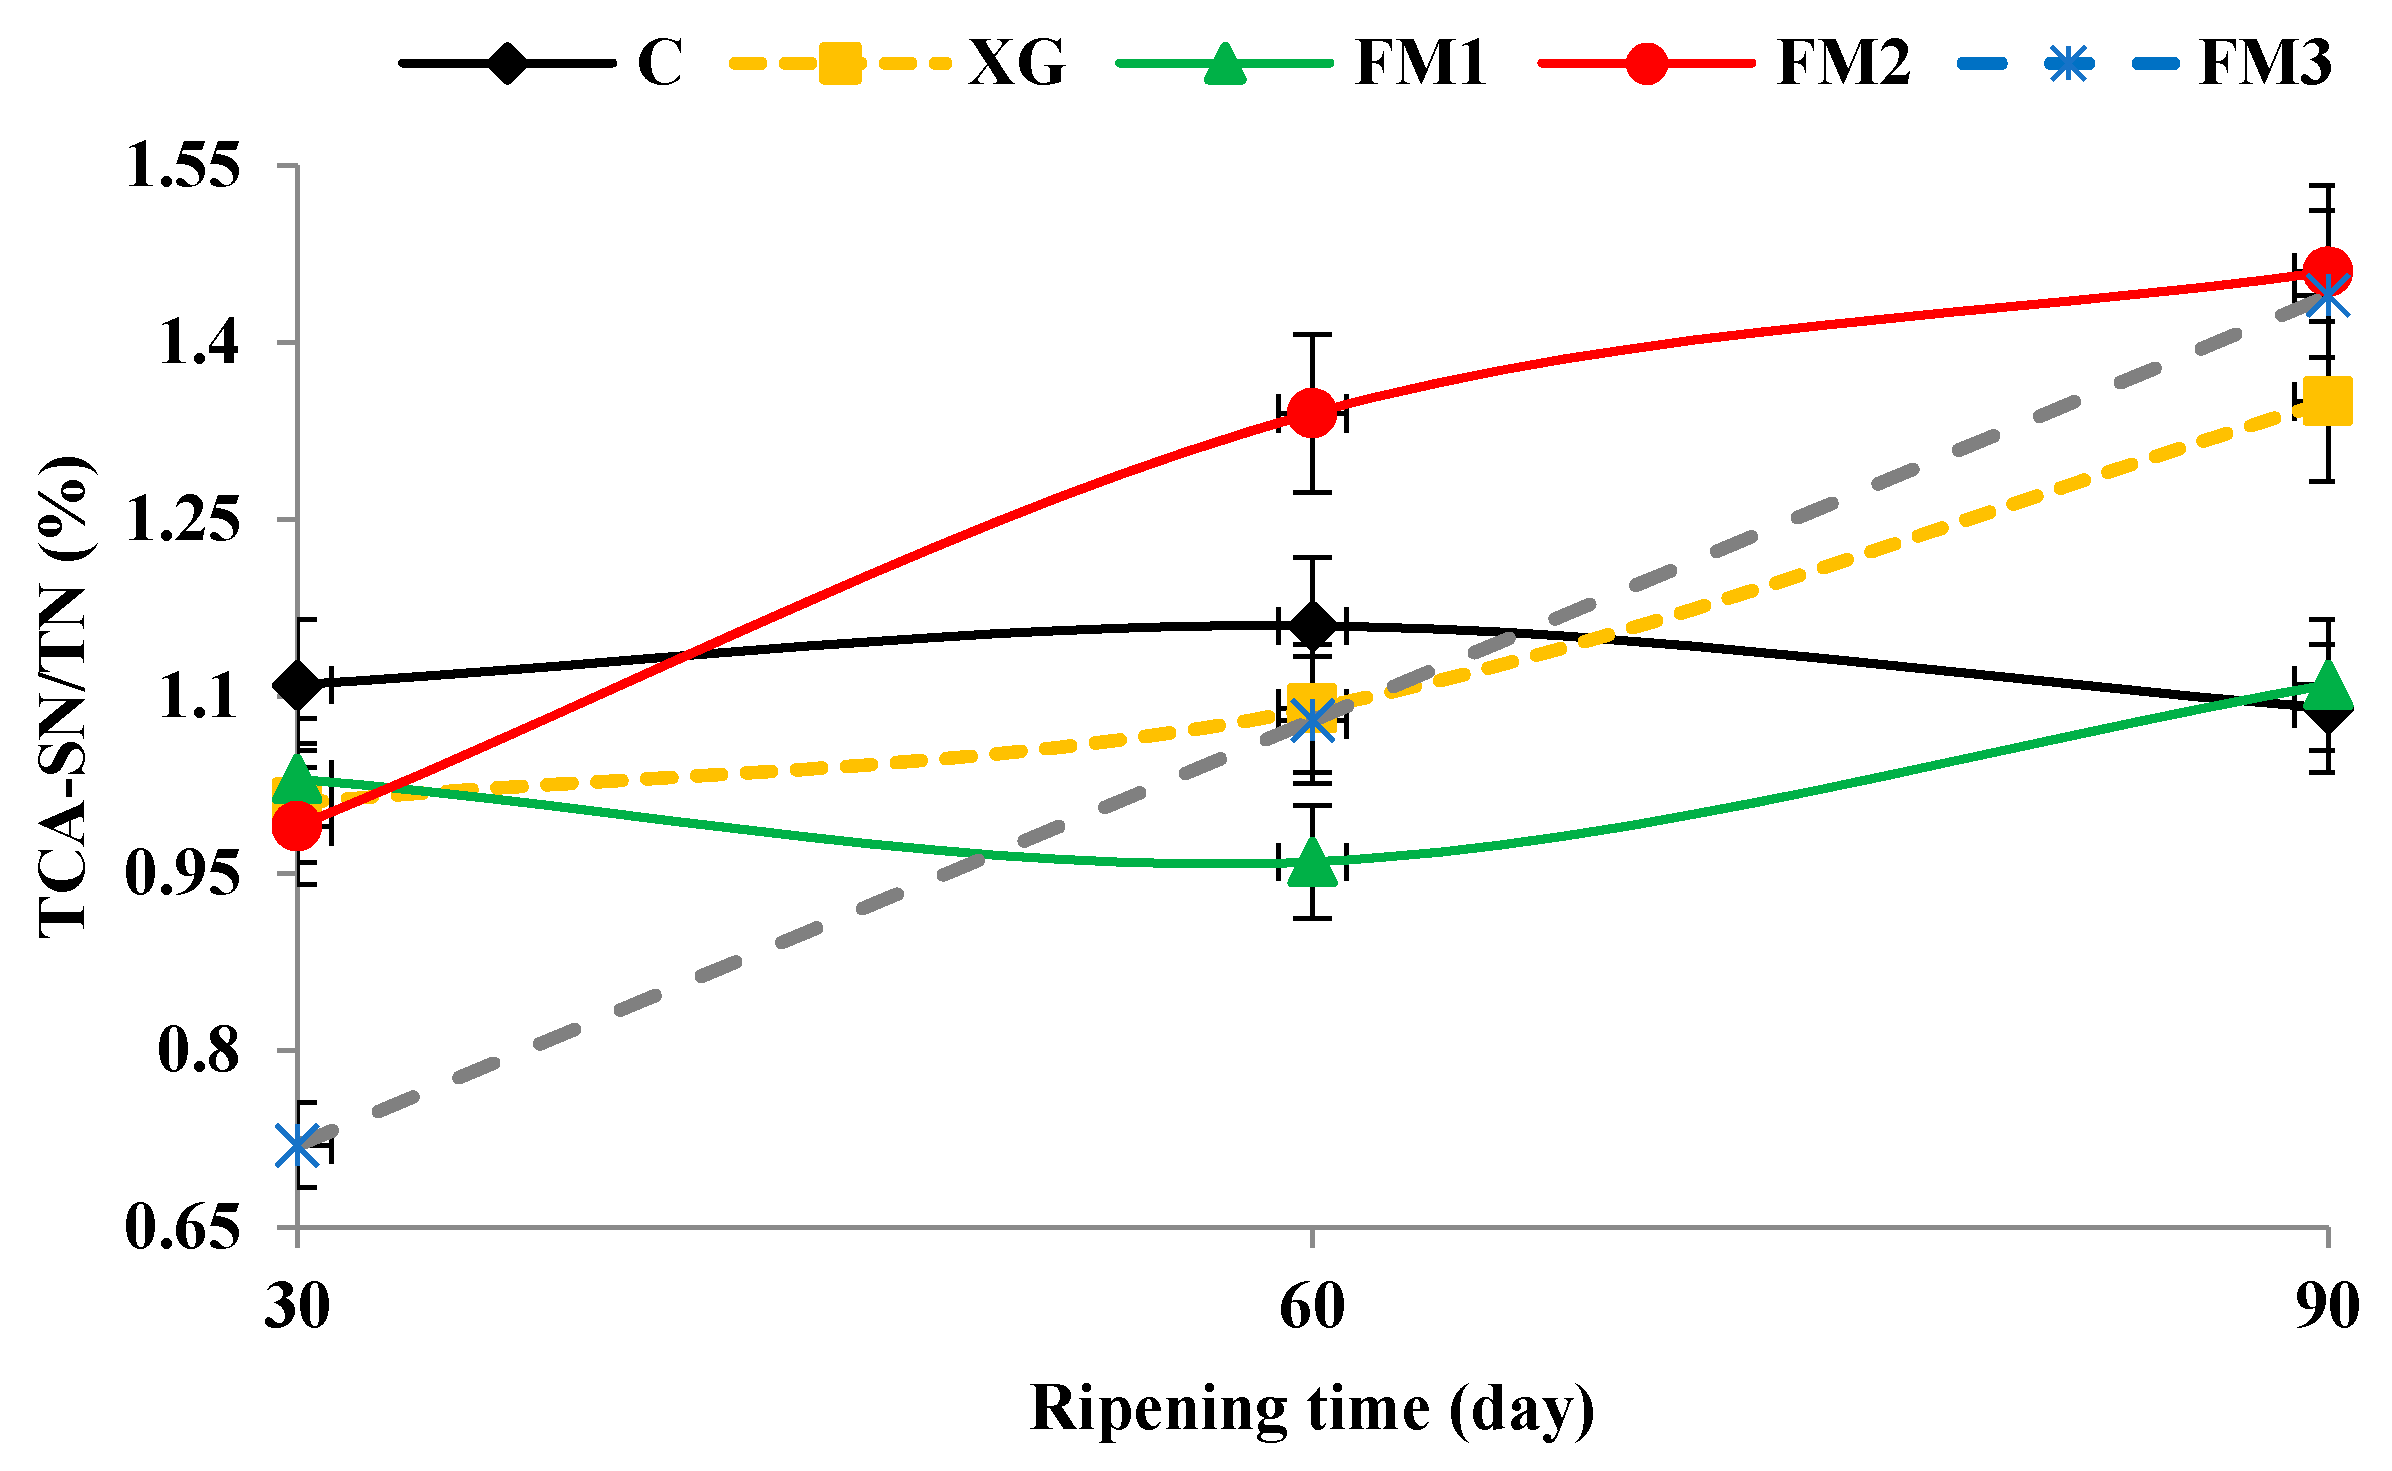
3.3. Proteolysis
3.4. Free Fatty Acid Composition
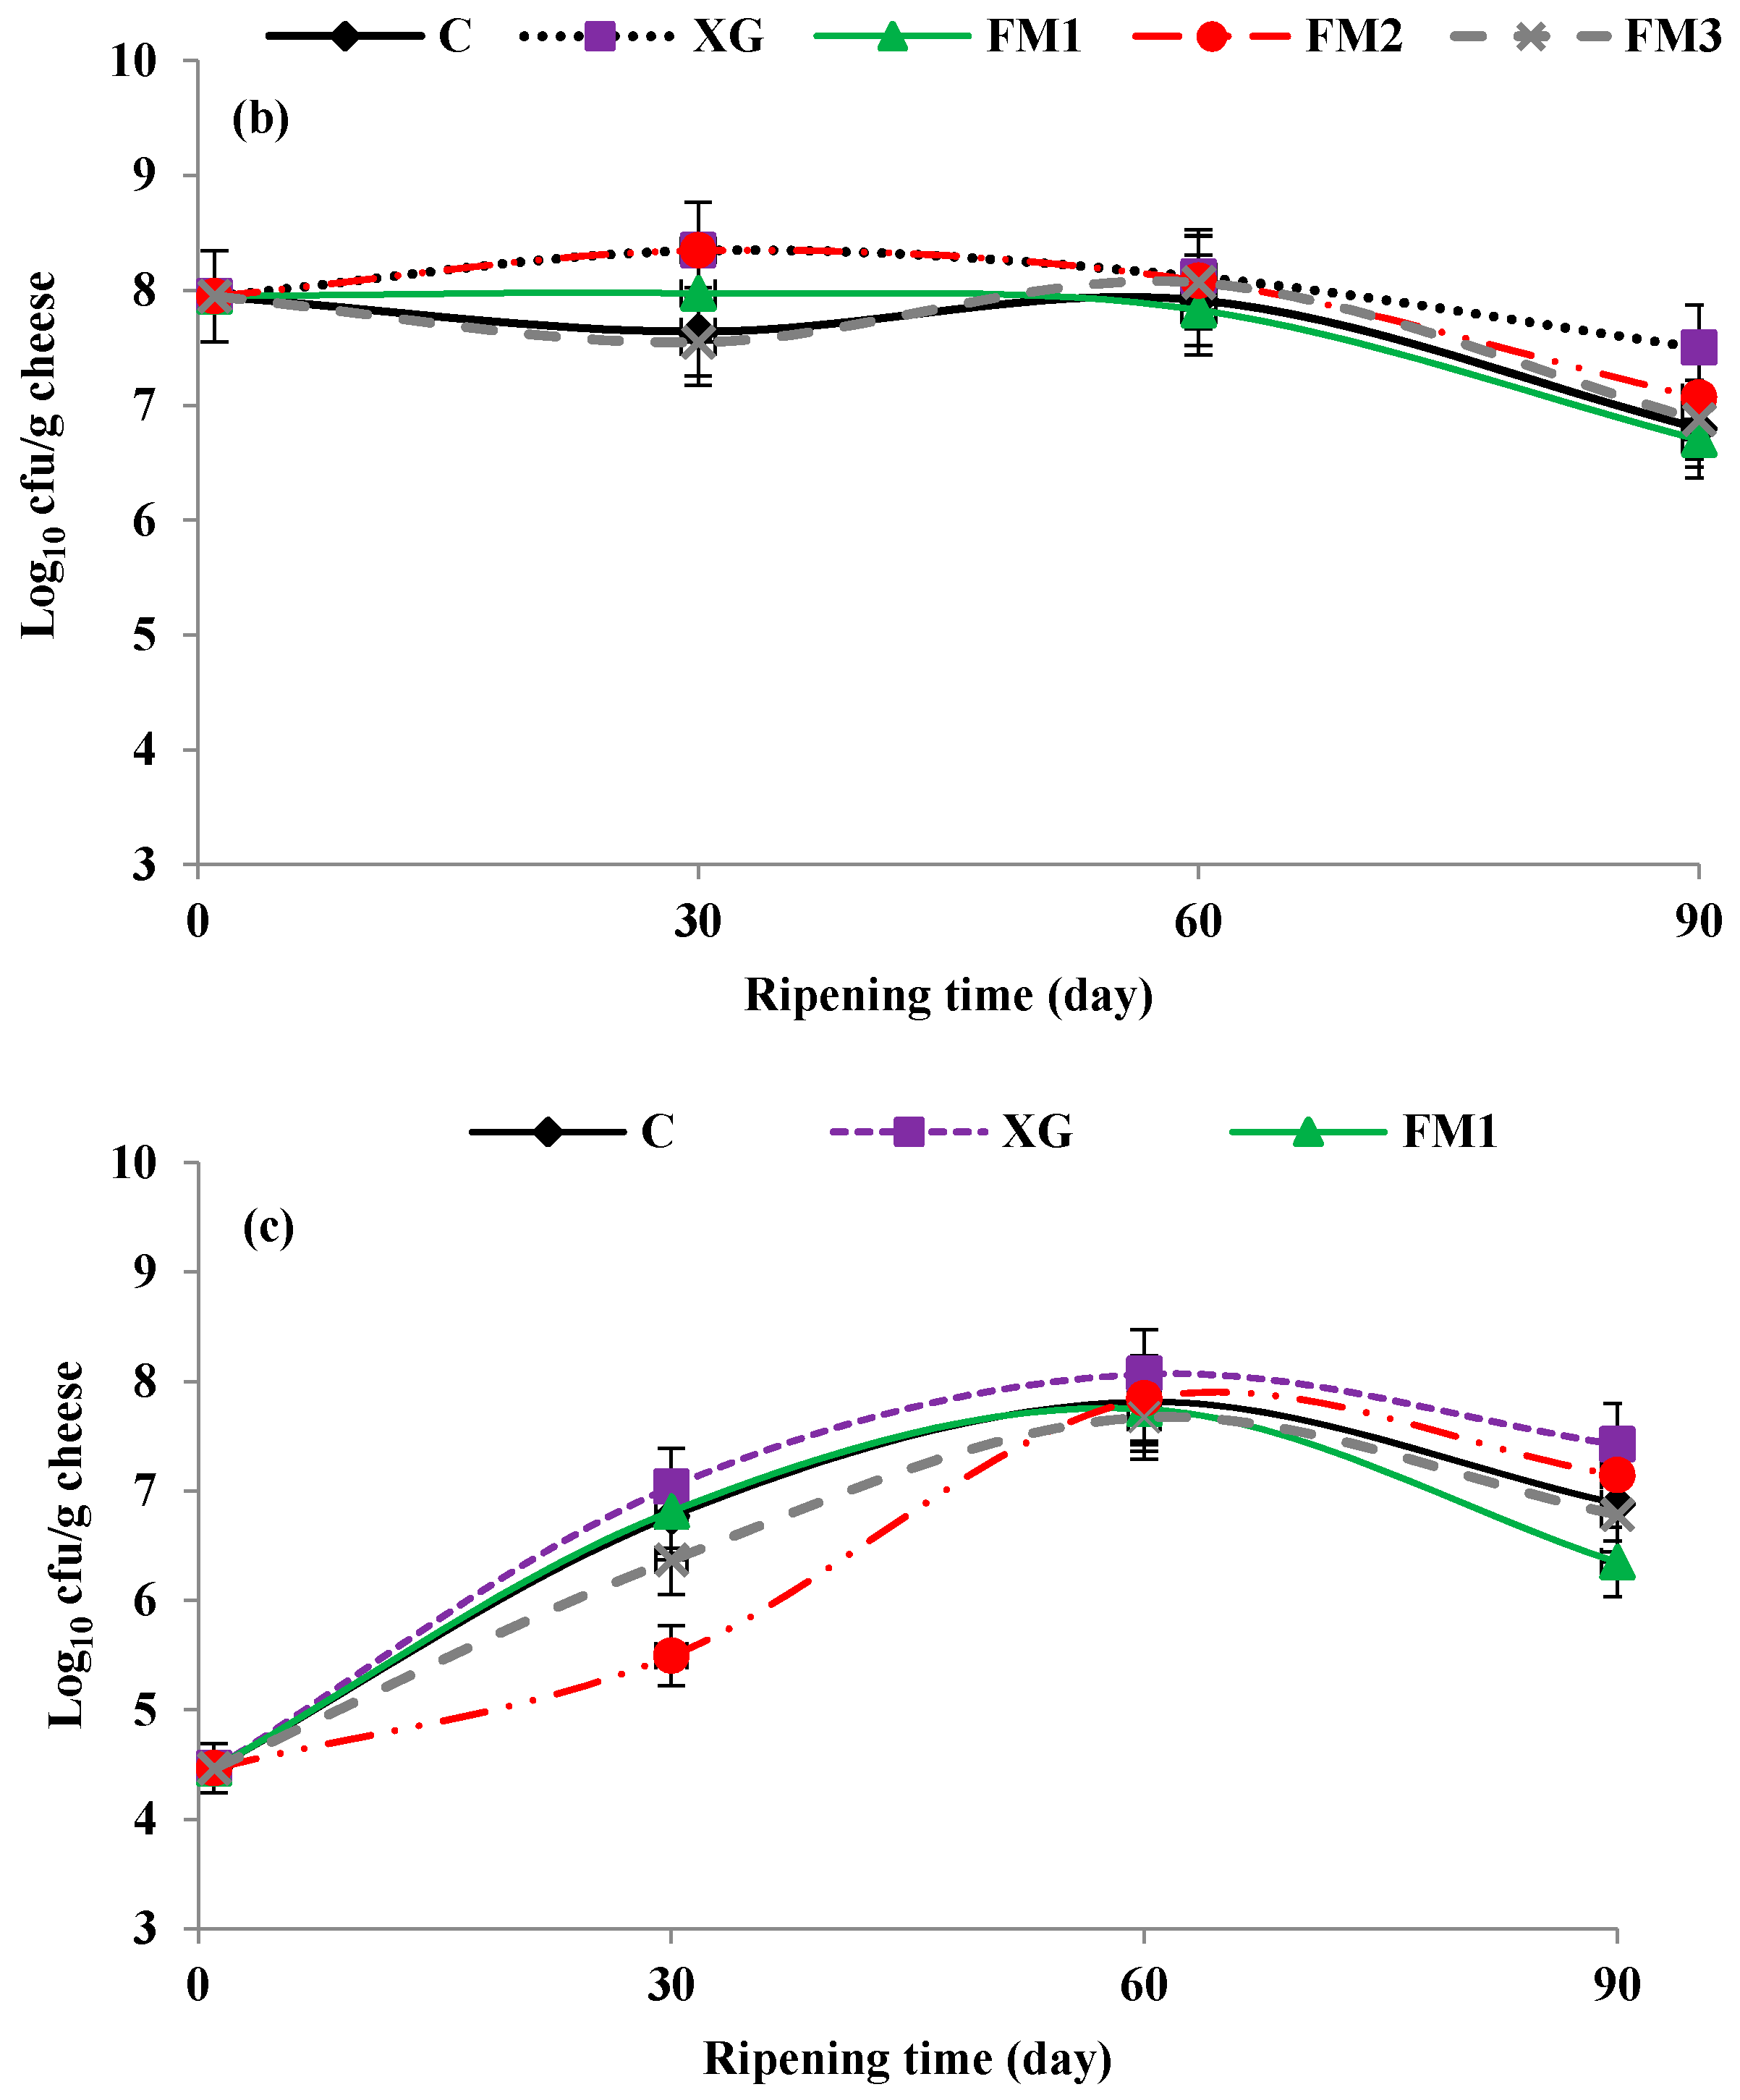
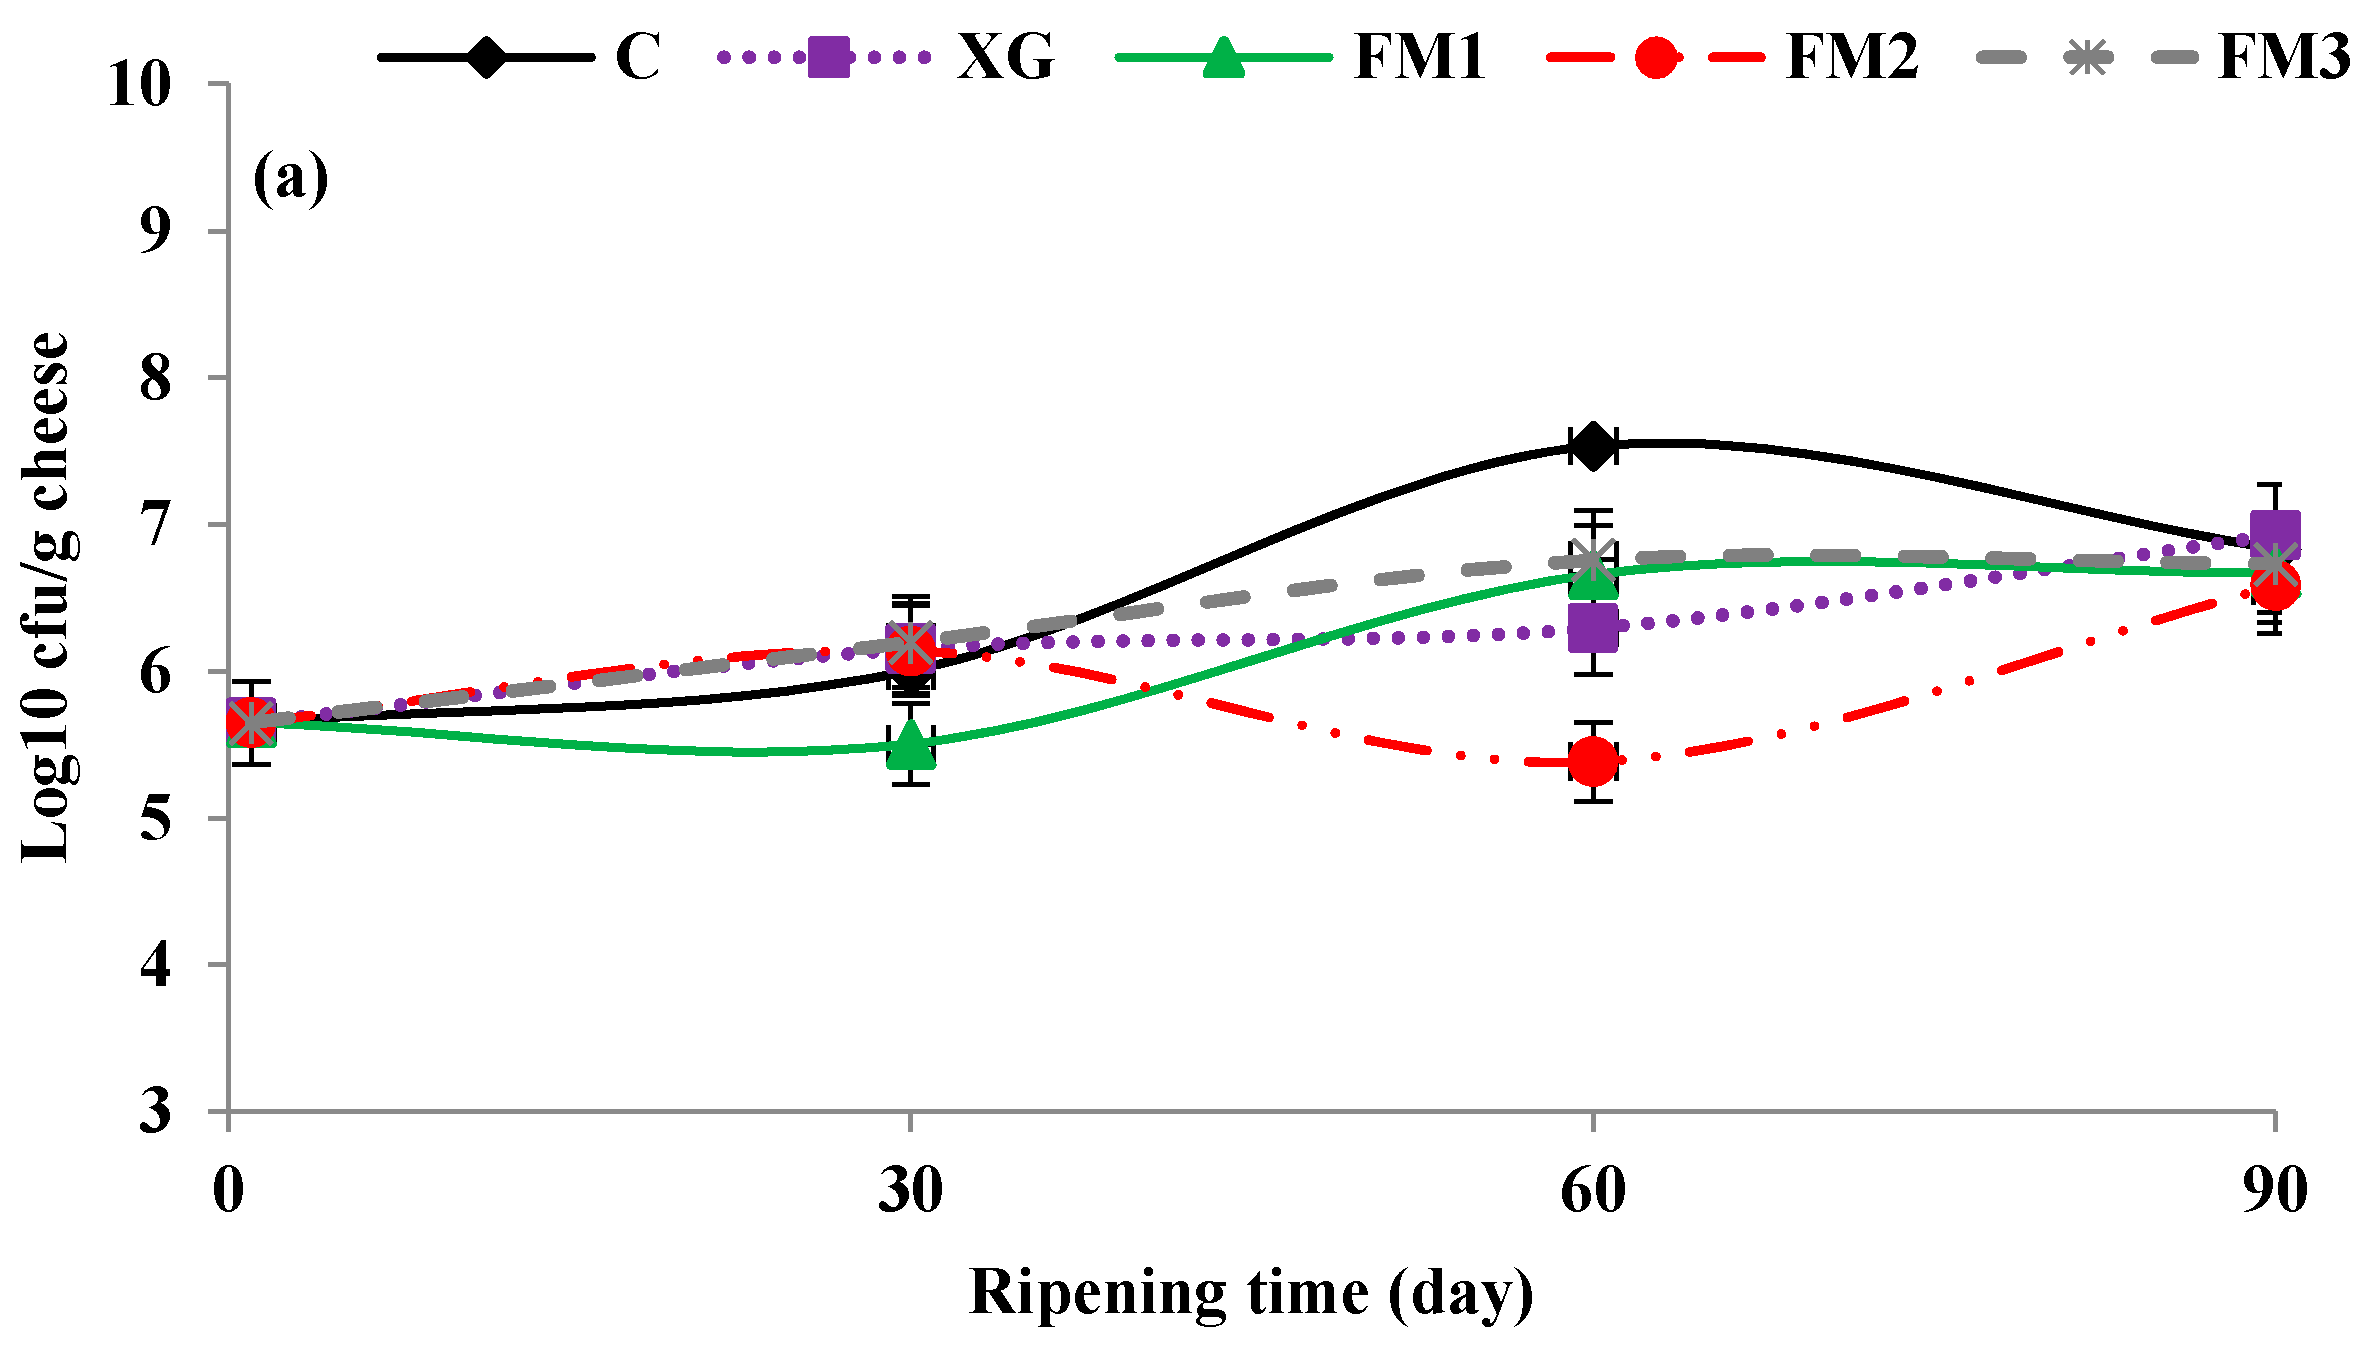
3.5. Microbial Analysis
3.6. Sensory Evaluation
4. Conclusions
Author Contributions
Conflicts of Interest
References
- Valdes, A.; Burgos, N.; Jimenez, A.; Garrigos, M.C. Natural pectin polysaccharides as edible coatings. Coatings 2015, 5, 865–886. [Google Scholar] [CrossRef] [Green Version]
- Sagnelli, D.; Hooshmand, K.; Kemmer, G.C.; Kirkensgaard, J.J.K.; Mortensen, K.; Giosafatto, C.V.L.; Holse, M.; Hebelstrup, K.H.; Bao, J.; Stelte, W.; et al. Cross-linked amylose bio-plastic: A transgenic-based compostable plastic alternative. Int. J. Mol. Sci. 2017, 18, 2075. [Google Scholar] [CrossRef] [PubMed]
- Espitia, P.J.P.; Du, W.; de Avena-Bustillos, R.J.; de Soares, N.F.F.; McHugh, T.H. Edible films from pectin: Physical-mechanical and antimicrobial properties: A review. Food Hydrocoll. 2014, 35, 287–296. [Google Scholar] [CrossRef]
- Valdes, A.; Ramos, M.; Beltran, A.; Jimenez, A.; Garrigos, M.C. State of the art antimicrobial edible coatings for food packaging applications. Coatings 2017, 7, 56. [Google Scholar] [CrossRef]
- Giosafatto, C.V.L.; DiPierro, P.; Gunning, P.; Mackie, A.; Porta, R.; Mariniello, L. Characterization of Citrus pectin edible films containing transglutaminase-modified phaseolin. Carbohydr. Polym. 2014, 106, 200–208. [Google Scholar] [CrossRef] [PubMed]
- Dhanapal, A.; Sasikala, P.; Rajamani, L.; Kavitha, V.; Yazhini, G.; Shakila Banu, M. Edible films from Polysaccharides. Food Sci. Qual. Manag. 2012, 3, 9–18. [Google Scholar]
- Ramos, M.; Valdes, A.; Beltran, A.; Garrigos, M.C. Gelatin-based films and coatings for food packaging application: A review. Coatings 2016, 6, 41. [Google Scholar] [CrossRef]
- Margaritis, A.; Zajic, J.E. Biotechnology review: Mixing mass transfer and scale-up of polysaccharide fermentations. Biotechnol. Bioeng. 1978, 20, 939–1001. [Google Scholar] [CrossRef]
- Sharma, S.; Rao, T.V. Xanthan gum based edible coating enriched with cinnamic acid prevents browning and extends the shelf-life of fresh-cut pears. Food Sci. Technol. 2015, 62, 791–800. [Google Scholar] [CrossRef]
- Garcia-Ochoa, F.; Santos, V.E.; Casas, J.A.; Gomez, A. Xanthan gum: Production, recovery, and properties. Biotechnol. Adv. 2000, 18, 549–579. [Google Scholar] [CrossRef]
- Cortez-Vega, W.R.; Piotrowicz, I.B.B.; Prentice, C.; Borges, C.D. Influence of different edible coatings in minimally processed pumpkin (Cucurbita moschata Duch). Int. Food Res. J. 2014, 21, 2017–2023. [Google Scholar]
- Cortez-Vega, W.R.; Piotrowicz, I.B.B.; Prentice, C.; Borges, C.D. Conservation of papaya minimally processed with the use of edible coating based on xanthan gum. Semina 2013, 34, 1753–1764. [Google Scholar]
- Zambrano-Zaragoza, M.L.; Mercado-Silva, E.; Del Real, L.A.; Guti_errez-Cortez, E.; Cornejo-Villegas, M.A.; Quintanar-Guerrero, D. The effect of nanocoatings with a-tocopherol and xanthan gum on shelf-life and browning index of fresh-cut Red Delicious apples. Innov. Food Sci. Emerg. Technol. 2014, 22, 188–196. [Google Scholar] [CrossRef]
- Tabibloghmany, F.; Hojjatoleslamy, M.; Farhadian, F.; Ehsandoost, E. Effect of Linseed (Linum usitatissimum L.) hydrocolloid as edible coating on decreasing oil absorption in potato chips during Deep-fat frying. Int. J. Agric. Crop Sci. 2013, 6, 63–69. [Google Scholar]
- Tee, Y.; Wong, J.; Ching Tan, M.; Talib, R.A. Development of edible film from flaxseed mucilage. Bioresources 2016, 11, 10286–10295. [Google Scholar] [CrossRef]
- Hernández, C.; Pérez-Cabrera, L.E.; González-Martínez, C. Development of linseed-mucilage edible coatings and its application to extend fresh-cut cucumber shelf-life. In Innovations in Food Science and Food Biotechnology in Developing Countries; AMECA Inc.: Queretaro, Mexico, 2010; pp. 321–334. [Google Scholar]
- Hernández Lozano, L.C.; Pérez-Cabrera, L.E.; González-Martínez, C. Development of a linseed-mucilage edible coating and its application to extend fresh-cut cucumber shelf-life, FSFB. In Proceedings of the 3rd International Congress, Queretaro, NM, USA, 14–17 October 2008. [Google Scholar]
- Yoon, Y.; Lee, S.; Choi, K.H. Microbial benefits and risks of raw milk cheese. Food Contr. 2016, 63, 201–215. [Google Scholar] [CrossRef]
- Pena-Serna, C.; Barretto Penna, A.L.; Filho, J.F.L. Zein-based blend coatings: Impact on the quality of a model cheese of short ripening period. J. Food Eng. 2016, 171, 208–213. [Google Scholar] [CrossRef]
- Terzaghi, B.E.; Sandine, W.E. Improved medium for lactic streptococci and their bacteriophages. Appl. Microbiol. 1975, 29, 807–813. [Google Scholar] [PubMed]
- Millet, M.; Le Tien, C.; Smoragiewicz, W.; Lacroix, M. Inhibition of Staphylococcus aureus on beef by nisin-containing modified alginate films and beads. Food Control. 2007, 18, 878–884. [Google Scholar] [CrossRef]
- Gripon, J.C.; Desmazeaud, M.J.; Le Bars, D.; Bergers, J.L. Etude du role des micro-organismes et des enzymes au coursed la maturation des fromages. II. Influence de la pressure commercial. Lait 1975, 55, 502–516. [Google Scholar] [CrossRef]
- Bergamini, C.V.; Hynes, E.; Zalazar, C.A. Influence of probiotic bacteria in the proteolysis profile of a semi-hard cheese. Int. Dairy J. 2006, 16, 856–866. [Google Scholar] [CrossRef]
- Khosrowshahi, A.; Madadlou, A.; Ebrahim zadeh Mousavi, M.; Emam-djomeh, Z. Monitoring the chemical and textural change during ripening of Iranian white cheese made with different concentrations of starter. J. Dairy Sci. 2006, 89, 3318–3325. [Google Scholar] [CrossRef]
- Nunez, M.; Garcia-Aser, C.; Rodriguez-Martin, M.A.; Medina, M.; Gaya, P. The effect of ripening and cooking temperature on proteolysis and lipolysis in manchego cheese. Food Chem. 1986, 21, 115–123. [Google Scholar] [CrossRef]
- Tarakci, Z.; Temiz, T.; Aykut, U.; Turhan, S. Influence of Wild Garlic on color, free fatty acids, and chemical and sensory properties of herby pickled cheese. Int. J. Food Prop. 2011, 14, 287–299. [Google Scholar] [CrossRef]
- Zeppa, G.; Giordano, M.; Gerbi, V.; Arlorio, M. Fatty acid composition of Piedmont “Ossolano” cheese. Lait 2003, 83, 167–173. [Google Scholar] [CrossRef]
- IDF. International IDF Standard 6B: 1989: Milkfat, Products and Butter. Determination of Fat Acidity; International Dairy Federation: Brussels, Belgium, 1989. [Google Scholar]
- Cunniff, P.; AOAC International. Official Methods of Analysis, 16th ed.; 3rd rev.; AOAC: Arlington, VA, USA, 1997. [Google Scholar]
- Post, L.M.; Mackia, D.A.; Butler, G.; Larmond, E. Laboratory Methods for Sensory Analysis of Food; Agriculture Canada Research Branch: Ottawa, ON, Canada, 1991; pp. 16–20. [Google Scholar]
- Fox, P.F.; Law, J.; McSweeny, P.L.H.; Wallace, J. Biochemistry of cheese ripening. In Cheese: Chemistry, Physics and Microbiology; Fox, P.F., Ed.; Aspen Publishers Inc.: Frederick, MD, USA, 1999. [Google Scholar]
- Di Pierro, P.; Sorrentino, A.; Mariniello, L.; Giosafatto, C.V.L.; Porta, R. Chitosan/whey protein film as active coating to extend Ricotta cheese shelf-life. LWT Food Sci. Technol. 2011, 44, 2324–2327. [Google Scholar] [CrossRef]
- Yilmaz, F.; Dagdemir, E. The effects of beeswax coating on quality of Kashar cheese during ripening. Int. J. Food Sci. Technol. 2012, 47, 2582–2589. [Google Scholar] [CrossRef]
- Soodam, K.; Ong, L.; Powell, I.B.; Kentish, S.E.; Gras, S.L. Effect of calcium chloride addition and draining pH on the microstructure and texture of full fat Cheddar cheese during ripening. Food Chem. 2015, 181, 111–118. [Google Scholar] [CrossRef] [PubMed]
- Buriti, F.C.A.; Rocha, J.S.; Assis, E.G.; Saad, S.M.I. Incorporation of Lactobacillus acidophilus in Minas fresh cheese and its implications for textural and sensorial properties during storage. Int. Dairy J. 2005, 15, 1279–1288. [Google Scholar] [CrossRef]
- Kasimoglu, A.; Goncuoglu, M.; Akgun, S. Probiotic white cheese with Lactobacillus acidophilus. Int. Dairy J. 2004, 14, 1067–1073. [Google Scholar] [CrossRef]
- Cook, D.R.; Khosrowshahi, A.; Mcsweeney, P.L.H. Effect of gum tragacanth on the rheological and functional properties of full-fat and half-fat Cheddar cheese. Dairy Sci. Technol. 2013, 93, 45–62. [Google Scholar] [CrossRef]
- Henriques, M.; Santos, G.; Rodrigues, A.; Gomes, D.; Pereira, C.; Gil, M. Replacement of conventional cheese coatings by natural whey protein edible coatings with antimicrobial activity. J. Hyg. Eng. Des. 2011, 3, 34–47. [Google Scholar]
- Sarantinopoulos, P.; Andrighetto, C.; Georgalaki, M.D.; Rea, M.C.; Lombardi, A.; Cogan, T.M.; Kalantzopoulos, G.; Tsakalidou, E. Bichemical properties of enterococci relevant to their technological performance. Int. Dairy J. 2001, 11, 621–647. [Google Scholar] [CrossRef]
- Woo, A.H.; knowledge, S.; Lindsay, R.S. Quantification of major free fatty acids in several cheese varieties. J. Dairy Sci. 1984, 67, 874–878. [Google Scholar] [CrossRef]
- Reddy, K.A.; Marth, E.H. Proteolysis in Cheddar cheese made with sodium chloride, potassium chloride or mixtures of sodium and potassium chloride. LWT Food Sci. Technol. 1993, 26, 434–442. [Google Scholar] [CrossRef]
- EL-sisi, A.S.; Mohamed Gapr, A.E.S.; Kamaly, K.M. Use of chitosan as an edible coating in RAS Cheese. Biolife 2015, 3, 564–570. [Google Scholar] [CrossRef]
- Fox, P.F. Cheese: An overview. Cheese: Chemistry, Physics and Microbiology; Fox, P.F., Ed.; Springer: Boston, MA, USA, 1993. [Google Scholar]
- Ong, L.; Henriksson, A.; Shah, N.P. Development of probiotic Cheddar cheese containing Lactobacillus acidophilus Lb. casei, Lb. paracaseie and Bifidobacterium spp. and the influence of these bacteria on proteolytic patterns a production of organic acid. Int. Dairy J. 2006, 16, 446–456. [Google Scholar] [CrossRef]
- Lawrence, R.C.; Gilles, J. The assessment of the potential quality of young cheddar cheese. N. Z. J. Dairy Sci. Technol. 1980, 15, 1–12. [Google Scholar]
- Georgala, A.; Moschopoulou, E.; Aktypis, A.; Massouras, T.; Zoidou, E.; Kandarakis, I.; Anifantakis, E. Evolution of lipolysis during the ripening of traditional Feta Cheese. Food Chem. 2005, 93, 73–80. [Google Scholar] [CrossRef]
- Collins, Y.F.; McSweeney, P.L.H.; Wilkinson, M.G. Lipolysis and free fatty acid catabolism cheese: A review of current knowledge. Int. Dairy J. 2003, 13, 841–866. [Google Scholar] [CrossRef]
- Poveda, J.M.; Perez-Coello, M.S.; Cabezas, L. Seasonal variations in the free fatty acid composition of Manchego cheese and changes during ripening. Eur. Food Res. Technol. 2000, 210, 314–317. [Google Scholar] [CrossRef]
- Katsiari, M.C.; Voutsinas, L.P.; Alichanidis, E.; Roussis, I.G. Lipolysis in reduced sodium Feta cheese made by partial substitution of NaCl by KCl. Int. Dairy J. 2000, 10, 369–373. [Google Scholar] [CrossRef]
- Urbach, G. The flavour of milk and dairy products. Int. J. Dairy Technol. 1997, 50, 79–89. [Google Scholar] [CrossRef]
- Boutoial, K.; Alcantara, Y.; Rovira, S.; Garcia, V.; Ferrandini, E.; Lopez, M.B. Influence of ripening on proteolysis and lipolysis of Murcia al Vino cheese. Int. J. Dairy Technol. 2013, 66, 366–372. [Google Scholar] [CrossRef]
- Voigt, D.D.; Chevalier, F.; Donaghy, J.A.; Patterson, M.F.; Qian, M.C.; Kelly, A.L. Effect of high-pressure treatment of milk for cheese manufacture on proteolysis, lipolysis, texture and functionality of Cheddar cheese during ripening. Innov. Food Sci. Emerg. Technol. 2012, 13, 23–30. [Google Scholar] [CrossRef]
- O’Mahony, J.A.; Auty, M.A.E.; McSweeney, P.L.H. The manufacture of miniature Cheddar-type cheeses from milks with different fat globule size distributions. J. Dairy Res. 2005, 72, 338–348. [Google Scholar] [CrossRef] [PubMed]
- Altieri, C.; Scrocco, C.; Sinigaglia, M.; Del Nobile, M.A. Use of chitosan to prolong Mozzarella cheese shelf life. J. Dairy Sci. 2005, 88, 2683–2688. [Google Scholar] [CrossRef]
- Cerqueira, M.A.; Sousa-Gallagher, M.J.; Macedo, I.; Rodriguez-Aguilera, R.; Souza, B.W.S.; Teixeira, J.A.; Vicente, A.A. Use of galactomannan edible coating application and storage temperature for prolonging shelf-life of “Regional” cheese. J. Food Eng. 2010, 97, 87–94. [Google Scholar] [CrossRef] [Green Version]
- Peterson, S.D.; Marshall, R.T. Nonstarter lactobacilliin Cheddar cheese: A review. J. Dairy Sci. 1990, 73, 1395–1410. [Google Scholar] [CrossRef]
- Sarioglu, T.; Oner, Z. Usage possibilities of an edible film for coating Kashar cheese and its effects on cheese quality. Food 2006, 31, 3–10. [Google Scholar]
- Cui, H.Y.; Wu, J.; Li, C.Z. Anti-listeria effects of chitosan-coated nisin-silica liposome on Cheddar cheese. J. Dairy Sci. 2016, 99, 8598–8606. [Google Scholar] [CrossRef] [PubMed]


| Properties | Treatment | Ripening (Day) | ||
|---|---|---|---|---|
| 30 | 60 | 90 | ||
| pH SEM = 0.01 | C | 5.50 b | 5.46 c | 5.21 e |
| XG | 5.51 b | 5.41 c | 5.29 d | |
| FM1 | 5.61 a | 5.58 a | 5.42 c | |
| FM2 | 5.49 bc | 5.47 c | 5.31 d | |
| FM3 | 5.52 b | 5.45 c | 5.31 d | |
| Acidity (%) SEM = 0.055 | C | 0.46 f | 0.97 cd | 1.30 b |
| XG | 0.68 dc | 1.00 c | 1.50 a | |
| FM1 | 0.45 f | 0.85 d | 1.05 c | |
| FM2 | 0.78 d | 1.11 bc | 1.21 b | |
| FM3 | 0.58 e | 0.98 cd | 1.27 b | |
| Moisture (%) SEM = 0.54 | C | 32.55 d | 33.20 c | 31.61 e |
| XG | 35.54 a | 33.22 c | 29.86 g | |
| FM1 | 34.20 b | 32.51 d | 28.93 gh | |
| FM2 | 34.70 ab | 31.69 e | 28.10 h | |
| FM3 | 34.22 b | 30.86 ef | 27.28 i | |
| FDM (%) (Fat in Dry Matter) SEM = 0.814 | C | 46.47 g | 52.39 ab | 53.75 a |
| XG | 49.45 cd | 49.04 d | 47.75 ef | |
| FM1 | 45.22 h | 44.74 gh | 46.43 g | |
| FM2 | 44.76 gh | 50.66 c | 48.68 de | |
| FM3 | 47.08 f | 48.10 e | 47.09 f | |
| Protein (%) SEM = 0.755 | C | 35.11 b | 34.59 bc | 35.35 ab |
| XG | 32.62 cd | 34.68 bc | 36.34 a | |
| FM1 | 32.46 cd | 35.07 b | 36.00 a | |
| FM2 | 34.77 bc | 34.89 bc | 36.38 a | |
| FM3 | 32.19 d | 35.09 b | 33.99 c | |
| Fatty Acid | Treatment | Ripening Time (Day) | |
|---|---|---|---|
| 1 | 90 | ||
| Butyric acid C4:0 SEM = 0.04 | C | 2.55 a | 2.35 b |
| XG | 2.55 a | 1.56 d | |
| FM1 | 2.55 a | 1.88 c | |
| FM2 | 2.55 a | 1.16 e | |
| FM3 | 2.55 a | 1.74 cd | |
| Caproic acid C6:0 SEM = 0.02 | C | 2.15 a | 1.94 b |
| XG | 2.15 a | 1.51 d | |
| FM1 | 2.15 a | 1.76 c | |
| FM2 | 2.15 a | 1.23 e | |
| FM3 | 2.15 a | 1.44 de | |
| Caprylic acid C8:0 SEM = 0.01 | C | 0.19 d | 0.51 c |
| XG | 0.19 d | 0.50 c | |
| FM1 | 0.19 d | 0.89 a | |
| FM2 | 0.19 d | 0.60 b | |
| FM3 | 0.19 d | 0.59 b | |
| Capric acid C10:0 * SEM = 0.07 | C | 3.30 a | 3.31 a |
| XG | 3.30 a | 3.18 ab | |
| FM1 | 3.30 a | 3.05 bc | |
| FM2 | 3.30 a | 2.83 d | |
| FM3 | 3.30 a | 2.87 d | |
| Lauric acid C12:0 SEM = 0.01 | C | 0.93 d | 3.70 a |
| XG | 0.93 d | 3.73 a | |
| FM1 | 0.93 d | 3.57 b | |
| FM2 | 0.93 d | 3.41 c | |
| FM3 | 0.93 d | 3.37 c | |
| Myristic acid C14:0 SEM = 0.01 | C | 35.55 a | 12.15 d |
| XG | 35.55 a | 12.35 b | |
| FM1 | 35.55 a | 12.25 c | |
| FM2 | 35.55 a | 11.38 f | |
| FM3 | 35.55 a | 11.82 e | |
| Myristoleic acid C14:1 SEM = 0.01 | C | 11.77 a | 1.37 d |
| XG | 11.77 a | 1.47 c | |
| FM1 | 11.77 a | 1.26 ef | |
| FM2 | 11.77 a | 1.30 de | |
| FM3 | 11.77 a | 1.55 b | |
| Palmitic acid C16:0 SEM = 0.01 | C | 3.65 d | 35.85 c |
| XG | 3.65 d | 36.32 b | |
| FM1 | 3.65 d | 36.35 b | |
| FM2 | 3.65 d | 36.65 a | |
| FM3 | 3.65 d | 36.64 a | |
| Palmitoleic acid C16:1 SEM = 0.01 | C | 1.15 d | 1.55 c |
| XG | 1.15 d | 1.67 b | |
| FM1 | 1.15 d | 1.67 b | |
| FM2 | 1.15 d | 1.72 a | |
| FM3 | 1.15 d | 1.66 b | |
| Stearic acid C18:0 SEM = 0.01 | C | 10.06 b | 9.74 c |
| XG | 10.06 b | 10.13 a | |
| FM1 | 10.06 b | 9.57 d | |
| FM2 | 10.06 b | 10.16 a | |
| FM3 | 10.06 b | 9.74 c | |
| Oleic acid C18:1 SEM = 6.471 | C | 21.04 a | 11.80 b |
| XG | 21.04 a | 11.80 b | |
| FM1 | 21.04 a | 11.87 b | |
| FM2 | 21.04 a | 12.73 b | |
| FM3 | 21.04 a | 12.34 b | |
| Linoleic acid C18:2 SEM = 1.03 | C | 2.97 a | 1.53 b |
| XG | 2.97 a | 1.48 b | |
| FM1 | 2.97 a | 1.56 b | |
| FM2 | 2.97 a | 1.59 b | |
| FM3 | 2.97 a | 1.53 b | |
| Arashidic acid C20:0 * SEM = 0.01 | C | 0.12 a | 0.07 b |
| XG | 0.12 a | 0.05 b | |
| FM1 | 0.12 a | 0.11 a | |
| FM2 | 0.12 a | 0.05 b | |
| FM3 | 0.12 a | 0.05 b | |
| Treatments | Flavor | Texture | Color | Cutting |
|---|---|---|---|---|
| C | 3.00 b | 3.33 a | 3.44 a | 3.44 a |
| X | 3.44 a | 3.44 a | 3.77 a | 3.66 a |
| F1 | 3.11 ab | 3.00 ab | 4.00 a | 2.88 ab |
| F2 | 3.44 a | 3.11 ab | 3.55 a | 3.11 a |
| F3 | 2.88 b | 3.00 ab | 3.22 a | 3.33 a |
| SEM | 1.04 | 1.04 | 0.83 | 1.22 |
© 2018 by the authors. Licensee MDPI, Basel, Switzerland. This article is an open access article distributed under the terms and conditions of the Creative Commons Attribution (CC BY) license (http://creativecommons.org/licenses/by/4.0/).
Share and Cite
Soleimani-Rambod, A.; Zomorodi, S.; Naghizadeh Raeisi, S.; Khosrowshahi Asl, A.; Shahidi, S.-A. The Effect of Xanthan Gum and Flaxseed Mucilage as Edible Coatings in Cheddar Cheese during Ripening. Coatings 2018, 8, 80. https://doi.org/10.3390/coatings8020080
Soleimani-Rambod A, Zomorodi S, Naghizadeh Raeisi S, Khosrowshahi Asl A, Shahidi S-A. The Effect of Xanthan Gum and Flaxseed Mucilage as Edible Coatings in Cheddar Cheese during Ripening. Coatings. 2018; 8(2):80. https://doi.org/10.3390/coatings8020080
Chicago/Turabian StyleSoleimani-Rambod, Afshin, Shahin Zomorodi, Shahram Naghizadeh Raeisi, Asghar Khosrowshahi Asl, and Seyed-Ahmad Shahidi. 2018. "The Effect of Xanthan Gum and Flaxseed Mucilage as Edible Coatings in Cheddar Cheese during Ripening" Coatings 8, no. 2: 80. https://doi.org/10.3390/coatings8020080