Evolution of the Three-Dimensional Structure and Growth Model of Plasma Electrolytic Oxidation Coatings on 1060 Aluminum Alloy


1
National Defense Key Discipline Laboratory of Light Alloy Processing Science and Technology, Nanchang Hangkong University, Nanchang 330063, China
2
Corrosion and Protection Center, University of Science and Technology Beijing, Beijing 100083, China
*
Authors to whom correspondence should be addressed.
Coatings 2018, 8(3), 105; https://doi.org/10.3390/coatings8030105
Submission received: 28 January 2018
/
Revised: 7 March 2018
/
Accepted: 13 March 2018
/
Published: 15 March 2018
(This article belongs to the Special Issue New Generation Coatings for Metals)
Abstract
:A deeper understanding of plasma electrolytic oxidation (PEO) can in turn shed light on the evolution of coating structures during such oxidation processes. Here, a three-dimensional (3D) structure of PEO coating was investigated based on the morphologies at different locations in a PEO coating and on the elemental distribution along certain sections. The coating surface was dominated by a crater- or pancake-like structure of alumina surrounded by Si-rich nodules. A barrier layer with a thickness of ~1 μm consisting of clustered cells was present at the aluminum/coating interface. As the coating thickened, the PEO coating gradually evolved into a distinct three-layer structure, which included a barrier layer, an internal structure with numerous closed holes, and an outer layer with a rough surface. During the PEO process, molten zones formed along with the plasma discharges. The volume and lifetime of the molten zones changed with oxidation time. The diversities of cooling rates around the molten zones resulted in structural differences along a certain section of the coating. A growth and discharge model of PEO coatings was established based on the 3D structure of the particular coating studied herein.
1. Introduction
Plasma electrolytic oxidation (PEO) is a surface-modification technique for producing ceramic coatings on light metals and their alloys (such as aluminum, magnesium, and titanium) [1,2]. PEO coating is considered to be amongst the most promising protective coatings for application in a wide range of industry sectors because of its high microhardness and its good wear and corrosion resistance [3,4]. However, the long-term protection performance of a PEO coating is limited by its high porosity. Researchers have different opinions on whether the pores in the coating extend to the substrate [5,6]. Hence, the three-dimensional (3D) structure and growth mechanism of PEO coatings need to be studied.
In general, most information about the structure of PEO coatings is obtained from the conventional surface and polished cross section. The coating surface is porous and coarse, consisting of pancake-like structures with a central hole [7]. PEO coatings are divided into three layers, i.e., an outer loose layer, an inner dense layer, and the barrier layer near the substrate [8,9]. A free-standing coating detached from the substrate can be used to obtain more information about the PEO coating structure, e.g., the structure of the coating/substrate interface. Some researchers have tried to use chemical solutions to detach the coating from the aluminum substrate. However, chemical dissolution in NaOH may dissolve alumina coating [10,11], and chemical dissolution in CuCl2 may lead to a copper cover at the coating surface [12]. Recently, free-standing coatings have been obtained via dissolving the coated aluminum with an electrochemical method [13,14]. Moreover, 3D information about the porosity of PEO coating structures has been obtained by X-ray computed tomography [6,15] and the resin replica method [16]. Additional information on the 3D structure of PEO coatings, especially the evolution of the 3D structure during the PEO process, is needed for a deeper understanding of the PEO mechanism.
For the growth of PEO coatings, the most commonly accepted mechanism is attributed to an outward–inward growth mechanism [17,18,19,20,21]. The presence of inward growth has been confirmed by 18O element labeling [22], which is regarded as a process of repetitive breakdown and passivation of the barrier layer at the coating/substrate interface [13]. Additionally, the outward growth of PEO coatings has been shown by analyzing the elemental distribution in PEO coatings prepared on a substrate of Ti covering Al [19]. The outward growth of coatings is usually considered a process of ejecting molten oxide [18,23,24]. Another theory is that the outward growth of PEO coatings occurs because the outer layer expands outwards under a squeezing effect owing to a thickening barrier layer [25]. Further studies of the PEO mechanism are limited by a lack of understanding of the coating structure.
In this work, PEO coatings were prepared on 1060 aluminum alloy in the silicate-phosphate electrolyte. The free-standing coating was obtained by the dissolution of substrate using an electrochemical method. The 3D structure of the PEO coating was analyzed using a field emission gun SEM (FE-SEM) and energy dispersive spectroscopy (EDS) by layer-by-layer thinning. The 3D structure of the coating, including the surface, the internal structure, the aluminum/coating interface, and the fracture cross-section structure, was studied in detail. Based on the above results, a growth model of PEO coatings is proposed.
2. Materials and Methods
2.1. Materials and PEO Treatment
The 1060 aluminum alloy (99.6% purity) was used as substrate in this experiment. Specimens with the dimension of 20 mm × 20 mm × 2 mm were polished using silicon-carbide abrasive paper up to 1000 grit and cleaned with acetone for 5 min.
The PEO process was performed using a direct-current pulsed power supply (WHD-20, Harbin Institute of Technology, Harbin, China) at a constant current density of 15 A/dm2, a frequency of 500 Hz, and a duty ratio of 60%. Electrolyte, mainly comprised of 8 g/L Na2SiO3·9H2O and 3 g/L Na5P3O10, was prepared by deionized water and high-purity chemicals. A water-cooling system was used to maintain an electrolyte temperature below 300 K. The specimens were subjected to PEO treatment for 5, 15, 45, and 60 min, cleaned ultrasonically in deionized water and dried in warm air.
2.2. Specimen Characterization
The 3D structure of PEO coating, including a surface, an internal structure, an aluminum/coating interface, and a fracture cross section, was obtained by an electrochemical dissolution method, a layer-by-layer thinning method, and a cross-cutting method. Among them, the internal structure was obtained by exfoliating the outer layer using a single scratch tester (WS-2005, Lanzhou Institute of Chemical Physics, CAS, Lanzhou, China). The scratch tests were made with a diamond indenter (120° cone with a tip with a radius of 200 μm) under a loading rate of 50 N/min, a loading range of 0–100 N, and a scratch length of 10 mm. The free-standing coating was obtained by removing the substrate using an electrochemical method [13,14]. The specific operation process is as follows: specimens with PEO coatings were firstly polished from one side to a ~0.5 mm thickness. The specimen was immersed partly into a 3.5 wt % NaCl solution as the anode and a stainless-steel cell as the cathode, which was connected with a direct-current power supply with an operating voltage of 15 V. The aluminum had been dissolved completely when the current decreased to zero. A free-standing coating was obtained, cleaned in deionized water, and left to dry naturally.
The surface, internal structure, coating/substrate interface, and fractured cross-sectional morphologies of the PEO coatings were observed by a field emission gun SEM (FE-SEM, Nova Nano SEM 450, Thermo Fisher Scientific, Hillsboro, OR, USA). Chemical compositions of the PEO coatings were analyzed by energy dispersive spectroscopy (EDS, INCA 250, Oxford Instruments, Oxford, UK) equipped on the FE-SEM system. The high voltage and spot size were set to 15 kV and 3.0, respectively. During EDS semi-quantitative analysis, five measurements were taken randomly, and the average value was taken. The standardless quantitative analysis and the XPP correction method were used for the atomic percent calculation of various elements during EDS analysis. For the elements investigated in this study (O, Al, Si, and P), the total relative uncertainty was estimated to be ±5%. The phase composition of the coatings was analyzed by X-ray diffraction (XRD, D8-Advance, Bruker, Karlsruhe, Germany) using Cu Kα radiation operated at 40 kV and 40 mA in a range from 10° to 80° with a step size of 0.02°. Before XRD analysis, free-standing coatings were obtained using the electrochemical method and then ground into powder samples using the mortar. The maximum height difference between the peaks and valleys of the coating was characterized by a 3D digital video microscope (KH-7700, Hirox Co., Ltd., Tokyo, Japan). The size of the 3D scanning region in this work was 295 μm × 220 μm. The 3D scanning resolution was 1 μm. The resolution of Z-axis step motor was 0.05 μm/pulse.
3. Results
3.1. Fracture Cross-Sectional Morphology and Chemical Composition of the PEO Coating
Free-standing coatings were obtained by electrochemically dissolving the aluminum substrate in the NaCl solution. Figure 1 shows the SEM images of the fracture cross-section of the free-standing PEO coatings and the corresponding EDS results at different treatment times. Figure 1a–d shows that all aluminum/coating interfaces had a wavy-jagged appearance, which may be a result of discontinuous oxidation of the aluminum substrate. A dense barrier layer with a relatively constant thickness of ~1 μm existed near the aluminum/coating interface.
In the initial stage (Figure 1a), the coating was compact with a thickness of ~1.2 μm. At 15 min (Figure 1b), the fracture cross-section displayed a clear longitudinal profile of the strip pores, which was thought to be the residue of the discharge channels in the PEO process. As shown in Figure 1c,d, the PEO coating with a three-layer structure was clearly revealed at 45–60 min, and large cavities were present in the coating. Discontinuous nodules were distributed over the outer surface. The internal structure was filled with a large number of micropores, and some cracks appeared to traverse the entire outer-layer thickness.
EDS analysis was conducted to achieve a better understanding of the cross-sectional structure. As shown in Figure 1e,f, the EDS point analysis (Point 4) revealed that the nodules were rich in Si. A small amount of Si was also detected at the edge of the cavity (Point 2). Very little P was detected at Point 2 (Figure 1d), since the oxides containing P were hard to deposit in the coatings [26]. It is noted that the PEO coatings contain a certain amount of Si and P in addition to aluminum, and these elements may also combine with oxygen, causing a higher O/Al ratio than expected. Electrolyte evaporation, condensation, decomposition, and deposition were caused by the heat of the plasma discharges, which resulted in the incorporation of the electrolyte composition into the PEO coating.
Figure 1g gives the typical EDS mappings corresponding to the cross section of the PEO coating (Figure 1d). It can be seen that Si was higher in nodules at the surface, suggesting that the silicate in the electrolyte was prone to be deposited to form Si-rich nodules at the surface of PEO coating. However, the P mostly distributed around the cavity, showing that the electrolyte had been penetrated into the cavity during the PEO process. The higher level of P in the inner coating might be related to the short-circuit transport of electrolyte components through the outer coating, which would be left inside the coating [27].
3.2. Surface Morphology and Chemical Composition of PEO Coating
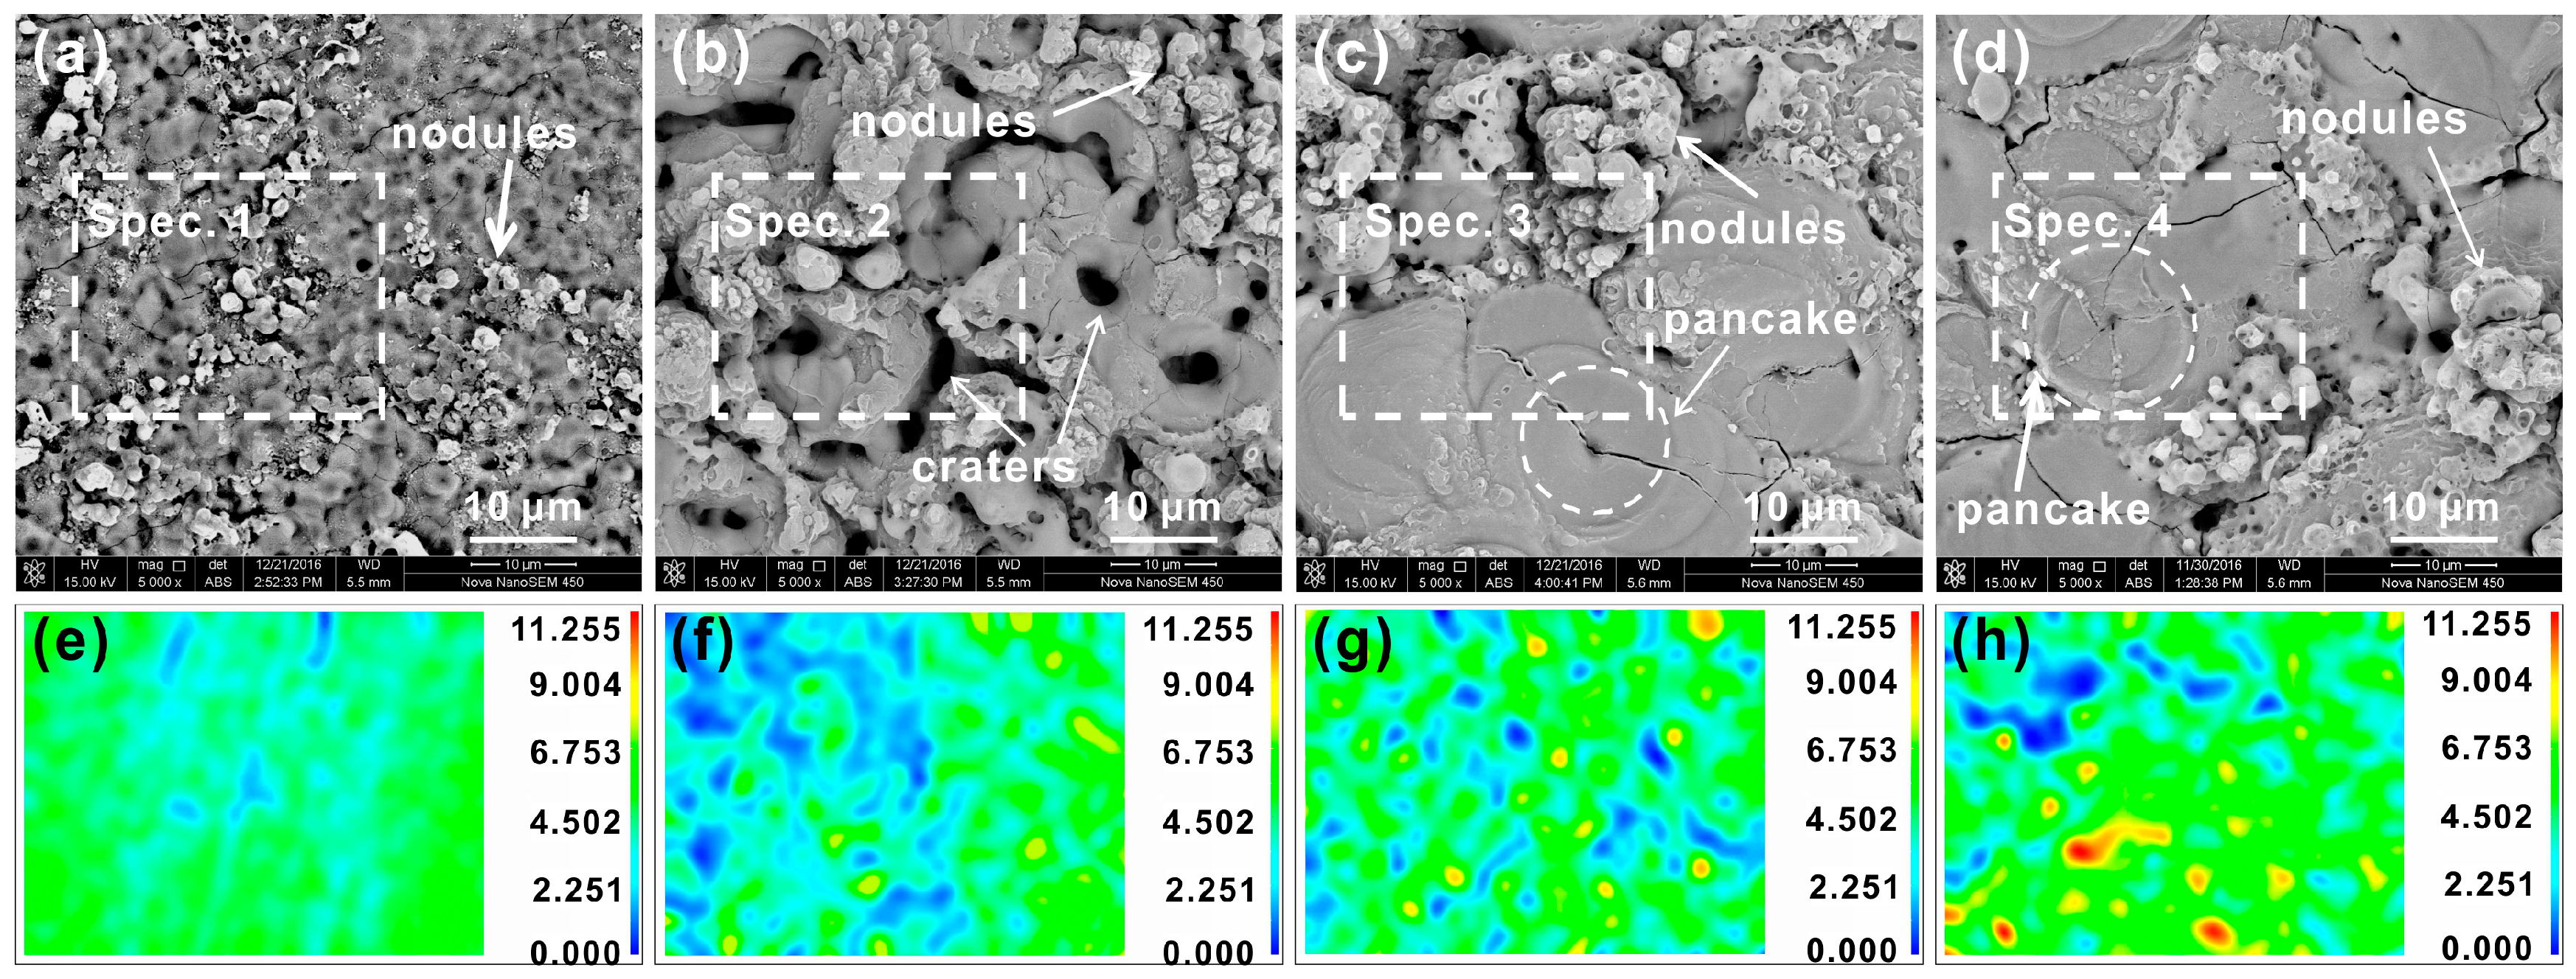
Figure 2 shows the SEM and 3D images at the surface of PEO coatings prepared at various oxidation times. As shown in Figure 2a–d, a large number of micropores and cracks were present at the surface of PEO coatings. Moreover, there were two categories for all coating surfaces. One is a loose nodule, and the other is a molten-shaped product with open or sealed micropores in the center. The morphology and size of the molten-shaped products changed with the increase in oxidation time. At 15 min, the molten-shaped products presented as craters with an open pore in the center. After 45 min, the molten-shaped products looked like pancakes with a sealed pore in the center. Additionally, 3D images displayed the evolution of the height difference at the coating surface (Figure 2e–h), indicating that nodules also enlarged during the PEO process.
In the initial stage (5 min), the PEO coating was compact and flat. As shown in Figure 2a,e, many fine nodules were present at the coating surface, but the molten-shaped product was not obvious. At 15 min, a large number of striped and sub-circular pores appeared at the PEO coating surface, and a group of nodules were present around these pores, as shown in Figure 2b. The 3D image (Figure 2f) also shows many obvious peaks and valleys. However, the surface morphology of the PEO coatings that formed at 45–60 min was obviously different from that of the thinner coatings. As shown in Figure 2c,d, pancake-like structures with a central pore were the main feature of these coatings, while larger nodules were also present. In addition, the height difference at the coating surface increased slightly as the oxidation increased from 45 to 60 min, which mainly resulted from the changes in nodules.
The elemental content of the PEO coatings were investigated by EDS analysis marked in Figure 2, as presented in Table 1. All coatings were composed of O, Al, and Si. Al in the coatings originated from the aluminum substrate, whereas Si was from the electrolyte. A small P peak was also detected (as shown in Figure S1), this phosphorus might result from the residual electrolyte. With the increase in oxidation time, the surface content of coatings had no obvious change. The EDS result was affected by the aluminum substrate, because the penetration depth of the X-ray was ~3 μm under the present conditions. Thus, the aluminum content in the thin coating formed in 5 min was unusually high.
Figure 3 shows the XRD patterns of PEO coatings prepared at different times. Both the powder sample and PEO coating sample with the substrate formed at 60 min were used for the XRD test. As shown in Figure 3d,e, the only difference between the two was that the diffraction peak of Al was present in the coating sample with the substrate. In order to reduce the effect of the aluminum substrate on the XRD results, free-standing coatings were ground to powders for the XRD tests. During the initial stages (5–15 min), the major crystalline phase in the coating was γ-Al2O3. The coatings formed over a longer period (45–60 min) showed a presence of γ-Al2O3, α-Al2O3, and σ-Al2O3.
In addition, the element distribution at the surface of the typical coating (60 min) are shown in Figure 4. As shown in Figure 4a, the surface of the PEO coating formed at 60 min was dominated by the compact pancake-like structures that were surrounded by loose nodules. EDS mappings show that Al and O were present in most regions of the coating, but the distribution of Al in the nodules was relatively low. Si and P were the main components of the nodules. EDS point analyses (Figure 4f) also revealed significant difference between the nodules and pancake-like structures.
Based on the above analysis, it can be deduced that the oxidation of aluminum and the deposition of electrolyte composition contributed to the growth of PEO coatings [28,29] in the silicate-phosphate electrolyte. The molten-shaped products resulted from the oxidation of aluminum, whereas the nodules were caused by the deposition of electrolyte compounds. Interestingly, the molten-shaped products were always surrounded by the nodules. Combined with the EDS and XRD results, the surface structure of PEO coating could be described as a molten-shaped structure of alumina surrounded by Si-rich nodules.
3.3. Internal Structure of PEO Coating
The internal structure of PEO coating was observed by exfoliating the outer layer using a single scratch tester. Figure 5 shows the plan images of the internal structure during different PEO stages. It can be seen in Figure 5 that the cohesion of the PEO coatings was poor and that spalling occurred on the edge of the scratch. The internal structure of the coatings was obvious different from the outer surface. Nodules and pancake-like structures were absent inside the coating. For the coating formed at 5 min (Figure 5a,e), the exposed internal structure was smooth. After 15 min, all the internal structure showed obvious cracks and submicron pores with the different sizes and shapes.
3.4. Aluminum/Coating Interface Morphology of PEO Coating
To understand the structure evolution of the coatings during the PEO process, the aluminum/coating interface structures were obtained after the coatings were detached from the samples. Figure 6 shows the 3D and SEM images of the aluminum/coating interface at different oxidation times. The structure of the aluminum/coating interface was greatly different from the outer surface and the internal structure of the PEO coating. The aluminum/coating interface was irregular and uneven, and appeared as “hill”-like features.
The 3D images (Figure 6a–d) displayed that the height difference at the aluminum/coating interface raised as the oxidation time increased. This transformation indicated that the “hills” had grown with the development of the PEO process. The sites of the hill-like protrusions reflected the depression locations in the aluminum substrate. Thus, the depth of oxidation of the aluminum substrate increased with the growth of the coating.
A similarly increasing trend could be observed in the corresponding SEM images shown in Figure 6e–h. With the increase in oxidation time, the volume of the concave and convex regions at the interface increased and the boundary became smoother. According to the magnification images in Figure 6i–l, the aluminum/coating interface structure was more compact than the surface and internal structure of the PEO coating. The aluminum/coating interface was formed by a high density of cells within the cluster, and almost no pores or cracks were present. Moreover, the diameter of the cells always maintained a constant size of ~1 μm with the increase in treatment time, although the volume of the “hill”-like projections increased.
It can be inferred that the inward growth of the PEO coating was carried out such that the aluminum transformed into oxide in many valley-shaped pools as oxidation time increased. Both Figure 1 and Figure 6 indicate that the aluminum/coating interface was a dense layer composed of many small cells within clusters embedded into the aluminum substrate.
4. Discussion
4.1. The Formation Process for 3D Structures of PEO Coating
The surface morphologies of the PEO coatings (Figure 2) demonstrate that numerous nodules surrounding the molten-shaped products were the main feature of the coating surface. The EDS results (Figure 1e,f and Figure 4) confirmed that nodules were Si-rich products of electrolyte deposits and that the molten-shaped products were mainly oxides of the substrate. The different morphologies and components at the surface were ascribed to various kinds of discharges in the integrated discharge model [30,31,32]. Additionally, a ~1 μm barrier layer that consists of dense cells was present at the aluminum/coating interface. Hill-like protrusions at the aluminum/coating interface enlarged over time. According to the surface and the aluminum/coating interface, it can be deduced that molten zones were present around the plasma discharge channels due to the high temperature (~16000 ± 3500 K [33]). The molten zone was considered to be the basic unit for the formation of the coating.
Figure 7 gives a schematic diagram of the discharge at the molten zone of local coating. When the discharge occurred, the aluminum was melted and reacted with oxygen.
The aluminum/coating interface was an important cooling region because of the extremely high thermal conductivity (~230 W·m−1·K−1 [34]) of the aluminum substrate. The region of the molten zone near the aluminum rapidly solidified and formed a hill-like protrusion, as shown in Figure 7a. A part of the molten products was ejected along the discharge channel to the coating surface. The coating/electrolyte interface acted as a vital cooling region, and the molten products rapidly solidified. A molten-shaped product structure formed at the coating surface.
At local high temperatures of the discharges, electrolyte will evaporate, concentrate, transform, and deposit at the coating surface to form nodules consisting of electrolyte constituents [8]. Thus, nodules rich in Si elements formed around the molten-shaped products.
In general, the following transformation process takes place.
This analysis is confirmed by Figure 2 and Figure 4, which show that most nodules were distributed around the molten zones and contained higher levels of Si.
Plasma discharges occurred repeatedly near the cooling region. The previously formed nodules would be broken again and incorporated into the molten products. Thus, a fresh molten-shaped product was formed after the molten zone cooling. A molten-shaped product structure of alumina surrounded by the nodules containing some electrolyte constituents was finally produced. The molten zone was generally considered to be a closed system during the cooling process. The escape of a large amount of gas was impeded, and numerous closed holes were enclosed inside the coating.
4.2. Growth Model of PEO Coating
In general, mechanisms such as “dielectric breakdown”, “discharge-in-pore”, and “contact glow discharge electrolysis” were the mainstream views about the plasma discharges during the PEO process [35]. Various growth models were proposed based on these mechanisms to describe the formation of the PEO coating [30,31,32,36]. These models illustrated the origins of plasma discharges and the relationship between discharges and coating structure. However, the aluminum/coating interface and the correlations between the growth mechanism and the 3D structure were not considered in these models. Many studies have shown that the discharges become more powerful and extend as the coating thickens [30,37]. Therefore, the molten zones caused by discharges will also enlarge and last longer as the coating thickens.
According to the surface and aluminum/coating interface morphologies (Figure 2 and Figure 6), the molten-shaped products, the nodules at the surface, and the hill-like structures at the aluminum/coating interface tended to decrease in number and increase in size as the coating thickened. Since the molten zones were the main routes by which a new coating was formed at local regions, continuous changes and overlaps of the molten zones would lead to the evolution of the coating structure. Based on the above results, a growth model is here proposed to explain the correlations between the molten zones and 3D structure evolution during the PEO process.
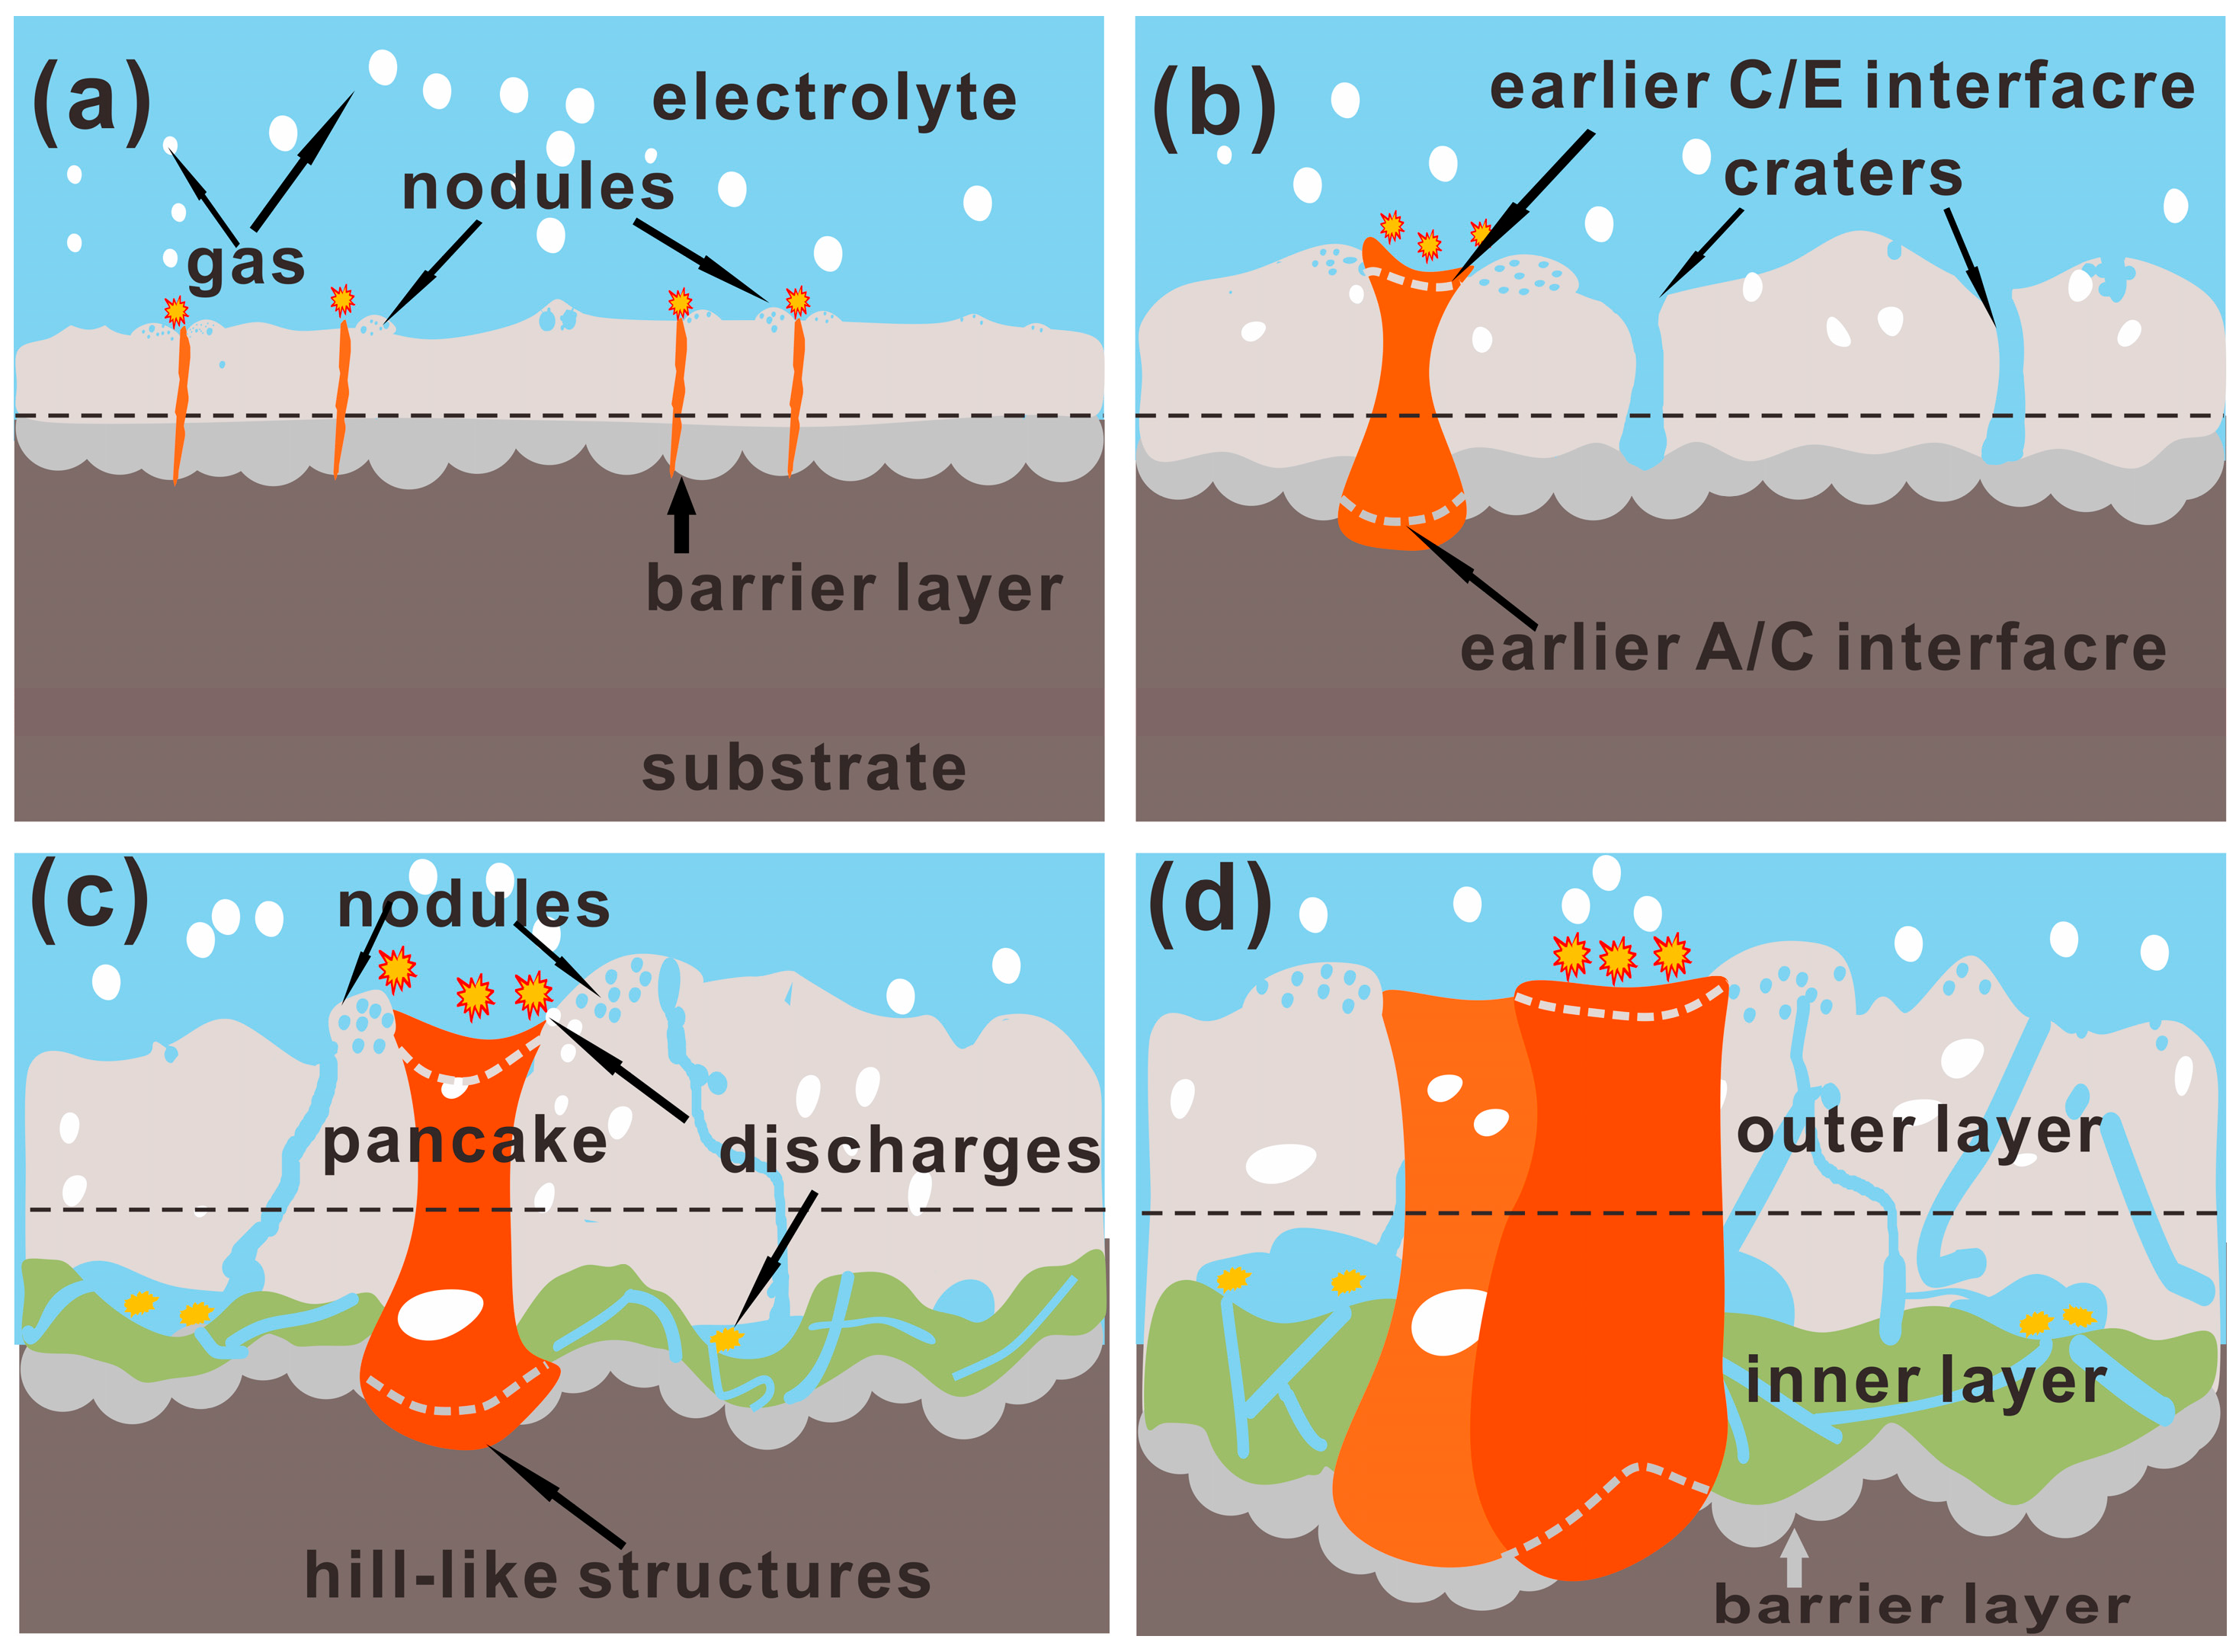
Figure 8 provides the growth model of the PEO coating. The formation of a dielectric film on the surface of the sample was a necessary condition for the plasma discharge. The dielectric film would be damaged once plasma discharge occurred.
In the early stage (5 min), as the discharges were weak, the previously formed anodic film had not been significantly damaged. The major crystalline phase in the coating was γ-Al2O3. The height difference of the aluminum/coating interface was lower, as demonstrated by the weak hill-like features. At this stage, obvious porosity defects were difficult to find, because the gas could easily escape from the molten zone, as shown in Figure 8a.
With the increase in oxidation time, a thin and dense barrier layer near the coating/substrate interface was clearly visible in the coating formed at 15 min (Figure 1b, Figure 6f, and Figure 7j). The higher height difference of the aluminum/coating interface (Figure 6b) suggested an increased depth of the oxidation of the aluminum substrate. The larger nodules at the surface (Figure 2b) indicated an increased area and a longer duration of the molten zone, which was caused by a stronger discharge. Additionally, as shown in Figure 1b and Figure 2b, trench-like open pores were present in the center of the molten-shaped products, which was very common and usually appeared in the thinner PEO coatings on Al [38], Mg [31], and Ti [6]. A reasonable explanation for the open pores was that the amount of molten products was insufficient to complement the plasma discharge channels in the cooling process. Now, the model of the PEO coating and discharge was shown in Figure 8b. At this stage, the molten-shaped product presented a “crater”-like morphology with an open pore in the center.
As the oxidation time increased, the dielectric breakdown of the thicker coating became difficult, and the discharge events appeared to be more powerful. Longer cooling periods might occur in this situation, and there is a strong tendency for discharges in the cascade [33]. It was reasonable to consider that the long-lasting molten zones were easier to form in the later stages. As oxidation time increased, the coating tended to form more high temperature phases of α-Al2O3 and σ-Al2O3. Consequently, the larger pancake-like structures with closed center pores formed on the coating over 45 min, and the hill-like protrusions at the aluminum/coating interface were further enlarged. Figure 8c,d illustrates the model of these coatings.
It has been proven that excessive gas is released during discharge [39] and that gas might be generated near the substrate/coating interface [9,15]. In this work, cracks or pores would form when high-pressure gases escaped from the molten zone. Many gas bubbles could not escape in time, which left the closed, spherical pores outside the coating. The volume shrinkage during the solidification of the molten regions and the gas expansion left large cavities near the substrate/coating interface. Different discharges occurred repeatedly at adjacent locations, which caused an overlap of molten zones, implying in turn that channels, cracks, and large cavities formed in the coating. Thus, a fine, interconnected porosity network structure was formed in the PEO coating. The porosity network caused the electrolyte to penetrate into the large cavities, and a secondary coating/electrolyte interface formed inside the coating. Further discharges were likely to initiate at the base of the cavities, so a thinner, finely porous inner-layer coating was formed, as shown in Figure 2c,d. As the coating grew, the thickness of the inner-layer continuously increased. It can be inferred that a series of reactions (evaporation, dehydration, and deposition) occurred in the large cavities. Thus, a higher proportion of electrolyte species was present at the edges of large cavities (Figure 1e,f).
5. Conclusions
The 3D structure of a PEO coating on aluminium, including the surface, the internal structure, the aluminum/coating interface, and the fracture cross-section morphology, was obtained. The PEO coating surface can be described as molten-shaped products of alumina surrounded by Si-rich nodules. A barrier layer consisting of clustered cells was present at the aluminum/coating interface. The PEO coating gradually evolved into a distinct three-layer structure as the coating thickened, including a barrier layer, an inner layer with enclosed pores, and an outer layer with a rough surface. Interestingly, obvious cavities appeared between the inner and outer layers in the thicker coatings.
PEO coatings were grown via the oxidation of aluminum and the deposition of electrolyte compounds. The oxidation of aluminum resulted in a crater- or pancake-like molten-shaped product, whereas the deposition of electrolyte compounds usually formed nodules at the coating surface.
During the PEO process, molten zones were formed around the plasma discharges. The thickening of the coating mainly depended on the forming, closing, and repeated movement of molten zones. The uneven cooling rates around the molten zones resulted in a distinction between the coating surface and the aluminum/coating interface structure. At different discharge periods, the intensity and duration of discharges determined the volume and lifetime of the molten zones, which resulted in various 3D microstructures of the PEO coating.
Supplementary Materials
The following are available online at https://www.mdpi.com/2079-6412/8/3/105/s1, Figure S1: the EDS spectrum of PEO coating formed at 60 min.
Acknowledgments
This work was supported by the National Natural Science Foundation of China (Grant No. 51361025) and the Natural Science Foundation of Jiangxi Province (Grant No. 20171BAB216006).
Author Contributions
Xiaohui Liu, Shuaixing Wang, and Xinyi Li performed the PEO treatments; Nan Du and Qing Zhao contributed reagents, materials, and analysis tools; Xiaohui Liu and Shuaixing Wang characterized the PEO coatings and wrote the paper.
Conflicts of Interest
The authors declare no conflict of interest.
References
- Hussein, R.O.; Northwood, D.O.; Nie, X. Coating growth behavior during the plasma electrolytic oxidation process. J. Vac. Sci. Technol. A 2010, 28, 766–773. [Google Scholar] [CrossRef]
- Sharifi, H.; Aliofkhazraei, M.; Darband, G.; Rouhaghdam, A.S. Characterization of PEO nanocomposite coatings on titanium formed in electrolyte containing atenolol. Surf. Coat. Technol. 2016, 304, 438–449. [Google Scholar] [CrossRef]
- Wang, S.; Zhao, Q.; Liu, D.; Du, N. Microstructure and elevated temperature tribological behavior of TiO2/Al2O3 composite ceramic coating formed by microarc oxidation of Ti6Al4V alloy. Surf. Coat. Technol. 2015, 272, 343–349. [Google Scholar] [CrossRef]
- Gowtham, S.; Hariprasad, S.; Arunnellaiappan, T.; Rameshbabu, N. An investigation on ZrO2 nano-particle incorporation, surface properties and electrochemical corrosion behaviour of PEO coating formed on Cp-Ti. Surf. Coat. Technol. 2017, 313, 263–273. [Google Scholar]
- Yang, J.; Lu, X.; Blawert, C.; Di, S.; Zheludkevich, M.L. Microstructure and corrosion behavior of Ca/P coatings prepared on magnesium by plasma electrolytic oxidation. Surf. Coat. Technol. 2017, 319, 359–369. [Google Scholar] [CrossRef]
- Zhang, X.; Aliasghari, S.; Němcová, A.; Burnett, T.; Kuběna, I.; Šmíd, M.; Thompson, G.; Skeldon, P.; Withers, P. X-ray computed tomographic investigation of the porosity and morphology of plasma electrolytic oxidation coatings. ACS Appl. Mater. Interfaces 2016, 8, 8801–8810. [Google Scholar] [CrossRef] [PubMed]
- Li, Q.; Liang, J.; Liu, B.; Peng, Z.; Wang, Q. Effects of cathodic voltages on structure and wear resistance of plasma electrolytic oxidation coatings formed on aluminium alloy. Appl. Surf. Sci. 2014, 297, 176–181. [Google Scholar] [CrossRef]
- Matykina, E.; Arrabal, R.; Skeldon, P.; Thompson, G.E. Incorporation of zirconia nanoparticles into coatings formed on aluminium by AC plasma electrolytic oxidation. J. Appl. Electrochem. 2008, 38, 1375–1383. [Google Scholar] [CrossRef]
- Tillous, K.; Toll-Duchanoy, T.; Bauer-Grosse, E.; Hericher, L.; Geandier, G. Microstructure and phase composition of microarc oxidation surface layers formed on aluminium and its alloys 2214-T6 and 7050-T74. Surf. Coat. Technol. 2009, 203, 2969–2973. [Google Scholar] [CrossRef]
- Curran, J.A.; Clyne, T.W. Porosity in plasma electrolytic oxide coatings. Acta Mater. 2006, 54, 1985–1993. [Google Scholar] [CrossRef]
- Curran, J.A.; Clyne, T.W. Thermo-physical properties of plasma electrolytic oxide coatings on aluminium. Surf. Coat. Technol. 2005, 199, 168–176. [Google Scholar] [CrossRef]
- Kasalica, B.; Radić-Perić, J.; Perić, M.; Petković-Benazzouz, M.; Belča, I.; Sarvan, M. Themechanism of evolution ofmicrodischarges at the beginning of the PEO process on aluminum. Surf. Coat. Technol. 2016, 298, 24–32. [Google Scholar] [CrossRef]
- Liu, C.; He, D.; Yan, Q.; Huang, Z.; Liu, P.; Li, D.; Jiang, G.; Ma, H.; Nash, P.; Shen, D. An investigation of the coating/substrate interface of plasma electrolytic oxidation coated aluminum. Surf. Coat. Technol. 2015, 280, 86–91. [Google Scholar] [CrossRef]
- Liu, C.; Liu, P.; Huang, Z.; Yan, Q.; Guo, R.; Li, D.; Jiang, G.; Shen, D. The correlation between the coating structure and the corrosion behavior of the plasma electrolytic oxidation coating on aluminum. Surf. Coat. Technol. 2016, 286, 223–230. [Google Scholar] [CrossRef]
- Tillous, E.K.; Toll-Duchanoy, T.; Bauer-Grosse, E. Microstructure and 3D microtomographic characterization of porosity of MAO surface layers formed on aluminium and 2214-T6 alloy. Surf. Coat. Technol. 2009, 203, 1850–1855. [Google Scholar] [CrossRef]
- Moon, S.; Arrabal, R.; Matykina, E. 3-Dimensional structures of open-pores in PEO films on AZ31 Mg alloy. Mater. Lett. 2015, 161, 439–441. [Google Scholar] [CrossRef]
- Yerokhin, A.L.; Lyubimov, V.V.; Ashitkov, R.V. Phase formation in ceramic coatings during plasma electrolytic oxidation of aluminium alloys. Ceram. Int. 1998, 24, 1–6. [Google Scholar] [CrossRef]
- Xue, W.; Deng, Z.; Chen, R.; Zhang, T. Growth regularity of ceramic coatings formed by microarc oxidation on Al–Cu–Mg alloy. Thin Solid Films 2000, 372, 114–117. [Google Scholar] [CrossRef]
- Liu, X.; Li, G.; Xia, Y. Investigation of the discharge mechanism of plasma electrolytic oxidation using Ti tracer. Surf. Coat. Technol. 2012, 206, 4462–4465. [Google Scholar] [CrossRef]
- Sundararajan, G.; Krishna, L.R. Mechanisms underlying the formation of thick alumina coatings through the MAO coating technology. Surf. Coat. Technol. 2003, 167, 269–277. [Google Scholar] [CrossRef]
- Li, J.; Cai, H.; Xue, X.; Jiang, B. The outward–inward growth behavior of microarc oxidation coatings in phosphate and silicate solution. Mater. Lett. 2010, 64, 2102–2104. [Google Scholar] [CrossRef]
- Matykina, E.; Arrabal, R.; Scurr, D.J.; Baron, A.; Skeldon, P.; Thompson, G.E. Investigation of the mechanism of plasma electrolytic oxidation of aluminium using 18O tracer. Corros. Sci. 2010, 52, 1070–1076. [Google Scholar] [CrossRef]
- Gu, W.; Lv, G.; Chen, H.; Chen, G.; Feng, W.; Yang, S. Characterisation of ceramic coatings produced by plasma electrolytic oxidation of aluminum alloy. Mater. Sci. Eng. A 2007, 447, 158–162. [Google Scholar] [CrossRef]
- Li, W.; Qian, Z.; Liu, X.; Zhu, L.; Liu, H. Investigation of micro-arc oxidation coating growth patterns of aluminum alloy by two-step oxidation method. Appl. Surf. Sci. 2015, 356, 581–586. [Google Scholar] [CrossRef]
- Zhu, L.; Guo, Z.; Zhang, Y.; Li, Z.; Sui, M. A mechanism for the growth of a plasma electrolytic oxide coating on Al. Electrochim. Acta 2016, 208, 296–303. [Google Scholar] [CrossRef]
- Li, Q.; Yang, W.; Liu, C.; Wang, D.; Liang, J. Correlations between the growth mechanism and properties of micro-arc oxidation coatings on titanium alloy: Effects of electrolytes. Surf. Coat. Technol. 2017, 316, 162–170. [Google Scholar] [CrossRef]
- Monfort, F.; Berkani, A.; Matykina, E.; Skeldon, P.; Thompson, G.E.; Habazaki, H.; Shimizu, K. A tracer study of oxide growth during spark anodizing of aluminum. J. Electrochem. Soc. 2005, 152, C382–C387. [Google Scholar] [CrossRef]
- Cheng, Y.; Wang, T.; Li, S.; Cheng, Y.; Cao, J.; Xie, H. The effects of anion deposition and negative pulse on the behaviours of plasma electrolytic oxidation (PEO)—A systematic study of the PEO of a Zirlo alloy in aluminate electrolytes. Electrochim. Acta 2017, 225, 47–68. [Google Scholar] [CrossRef]
- Li, Q.; Liu, C.; Yang, W.; Liang, J. Growth mechanism and adhesion of PEO coatings on 2024Al alloy. Surf. Eng. 2017, 33, 760–766. [Google Scholar] [CrossRef]
- Hussein, R.O.; Nie, X.; Northwood, D.O.; Yerokhin, A.; Matthews, A. Spectroscopic study of electrolytic plasma and discharging behaviour during the plasma electrolytic oxidation (PEO) process. J. Phys. D-Appl. Phys. 2010, 43, 105203–105215. [Google Scholar] [CrossRef]
- Hussein, R.O.; Nie, X.; Northwood, D.O. An investigation of ceramic coating growth mechanisms in plasma electrolytic oxidation (PEO) processing. Electrochim. Acta 2013, 112, 111–119. [Google Scholar] [CrossRef]
- Cheng, Y.L.; Xue, Z.G.; Wang, Q.; Wu, X.Q.; Matykina, E.; Skeldon, P.; Thompson, G.E. New findings on properties of plasma electrolytic oxidation coatings from study of an Al–Cu–Li alloy. Electrochim. Acta 2013, 107, 358–378. [Google Scholar] [CrossRef]
- Dunleavy, C.S.; Golosnoy, I.O.; Curran, J.A.; Clyne, T.W. Characterisation of discharge events during plasma electrolytic oxidation. Surf. Coat. Technol. 2009, 203, 3410–3419. [Google Scholar] [CrossRef]
- Lee, S.; Kwon, S.; Lee, J.-C.; Lee, S.-W. Thermophysical properties of aluminum 1060 fabricated by equal channel angular pressing. Int. J. Thermophys. 2012, 33, 540–551. [Google Scholar] [CrossRef]
- Yerokhin, A.L.; Snizhko, L.O.; Gurevina, N.L.; Leyland, A.; Pilkington, A.; Matthews, A. Discharge characterization in plasma electrolytic oxidation of aluminium. J. Phys. D-Appl. Phys. 2003, 36, 2110–2120. [Google Scholar] [CrossRef]
- Sobrinho, P.H.; Savguira, Y.; Ni, Q.; Thorpe, S.J. Statistical analysis of the voltage-time response produced during PEO coating of AZ31B magnesium alloy. Surf. Coat. Technol. 2017, 315, 530–545. [Google Scholar] [CrossRef]
- Nominé, A.; Troughton, S.C.; Nominé, A.V.; Henrion, G.; Clyne, T.W. High speed video evidence for localised discharge cascades during plasma electrolytic oxidation. Surf. Coat. Technol. 2015, 269, 125–130. [Google Scholar] [CrossRef]
- Dehnavi, V.; Luan, B.L.; Liu, X.Y.; Shoesmith, D.W.; Rohani, S. Correlation between plasma electrolytic oxidation treatment stages and coating microstructure on aluminum under unipolar pulsed DC mode. Surf. Coat. Technol. 2015, 269, 91–99. [Google Scholar] [CrossRef]
- Snizhko, L.O.; Yerokhin, A.L.; Gurevina, N.L.; Patalakha, V.A.; Matthews, A. Excessive oxygen evolution during plasma electrolytic oxidation of aluminium. Thin Solid Films 2007, 516, 460–464. [Google Scholar] [CrossRef]
Figure 1.
(a–d) SEM images of fracture cross section of PEO coatings formed at (a) 5 min, (b) 15 min, (c) 45 min, and (d) 60 min. (e,f) The corresponding EDS results to the coating of (c) and (d). (g) Typical EDS mappings of PEO coatings marked in Figure 1d.
Figure 1.
(a–d) SEM images of fracture cross section of PEO coatings formed at (a) 5 min, (b) 15 min, (c) 45 min, and (d) 60 min. (e,f) The corresponding EDS results to the coating of (c) and (d). (g) Typical EDS mappings of PEO coatings marked in Figure 1d.
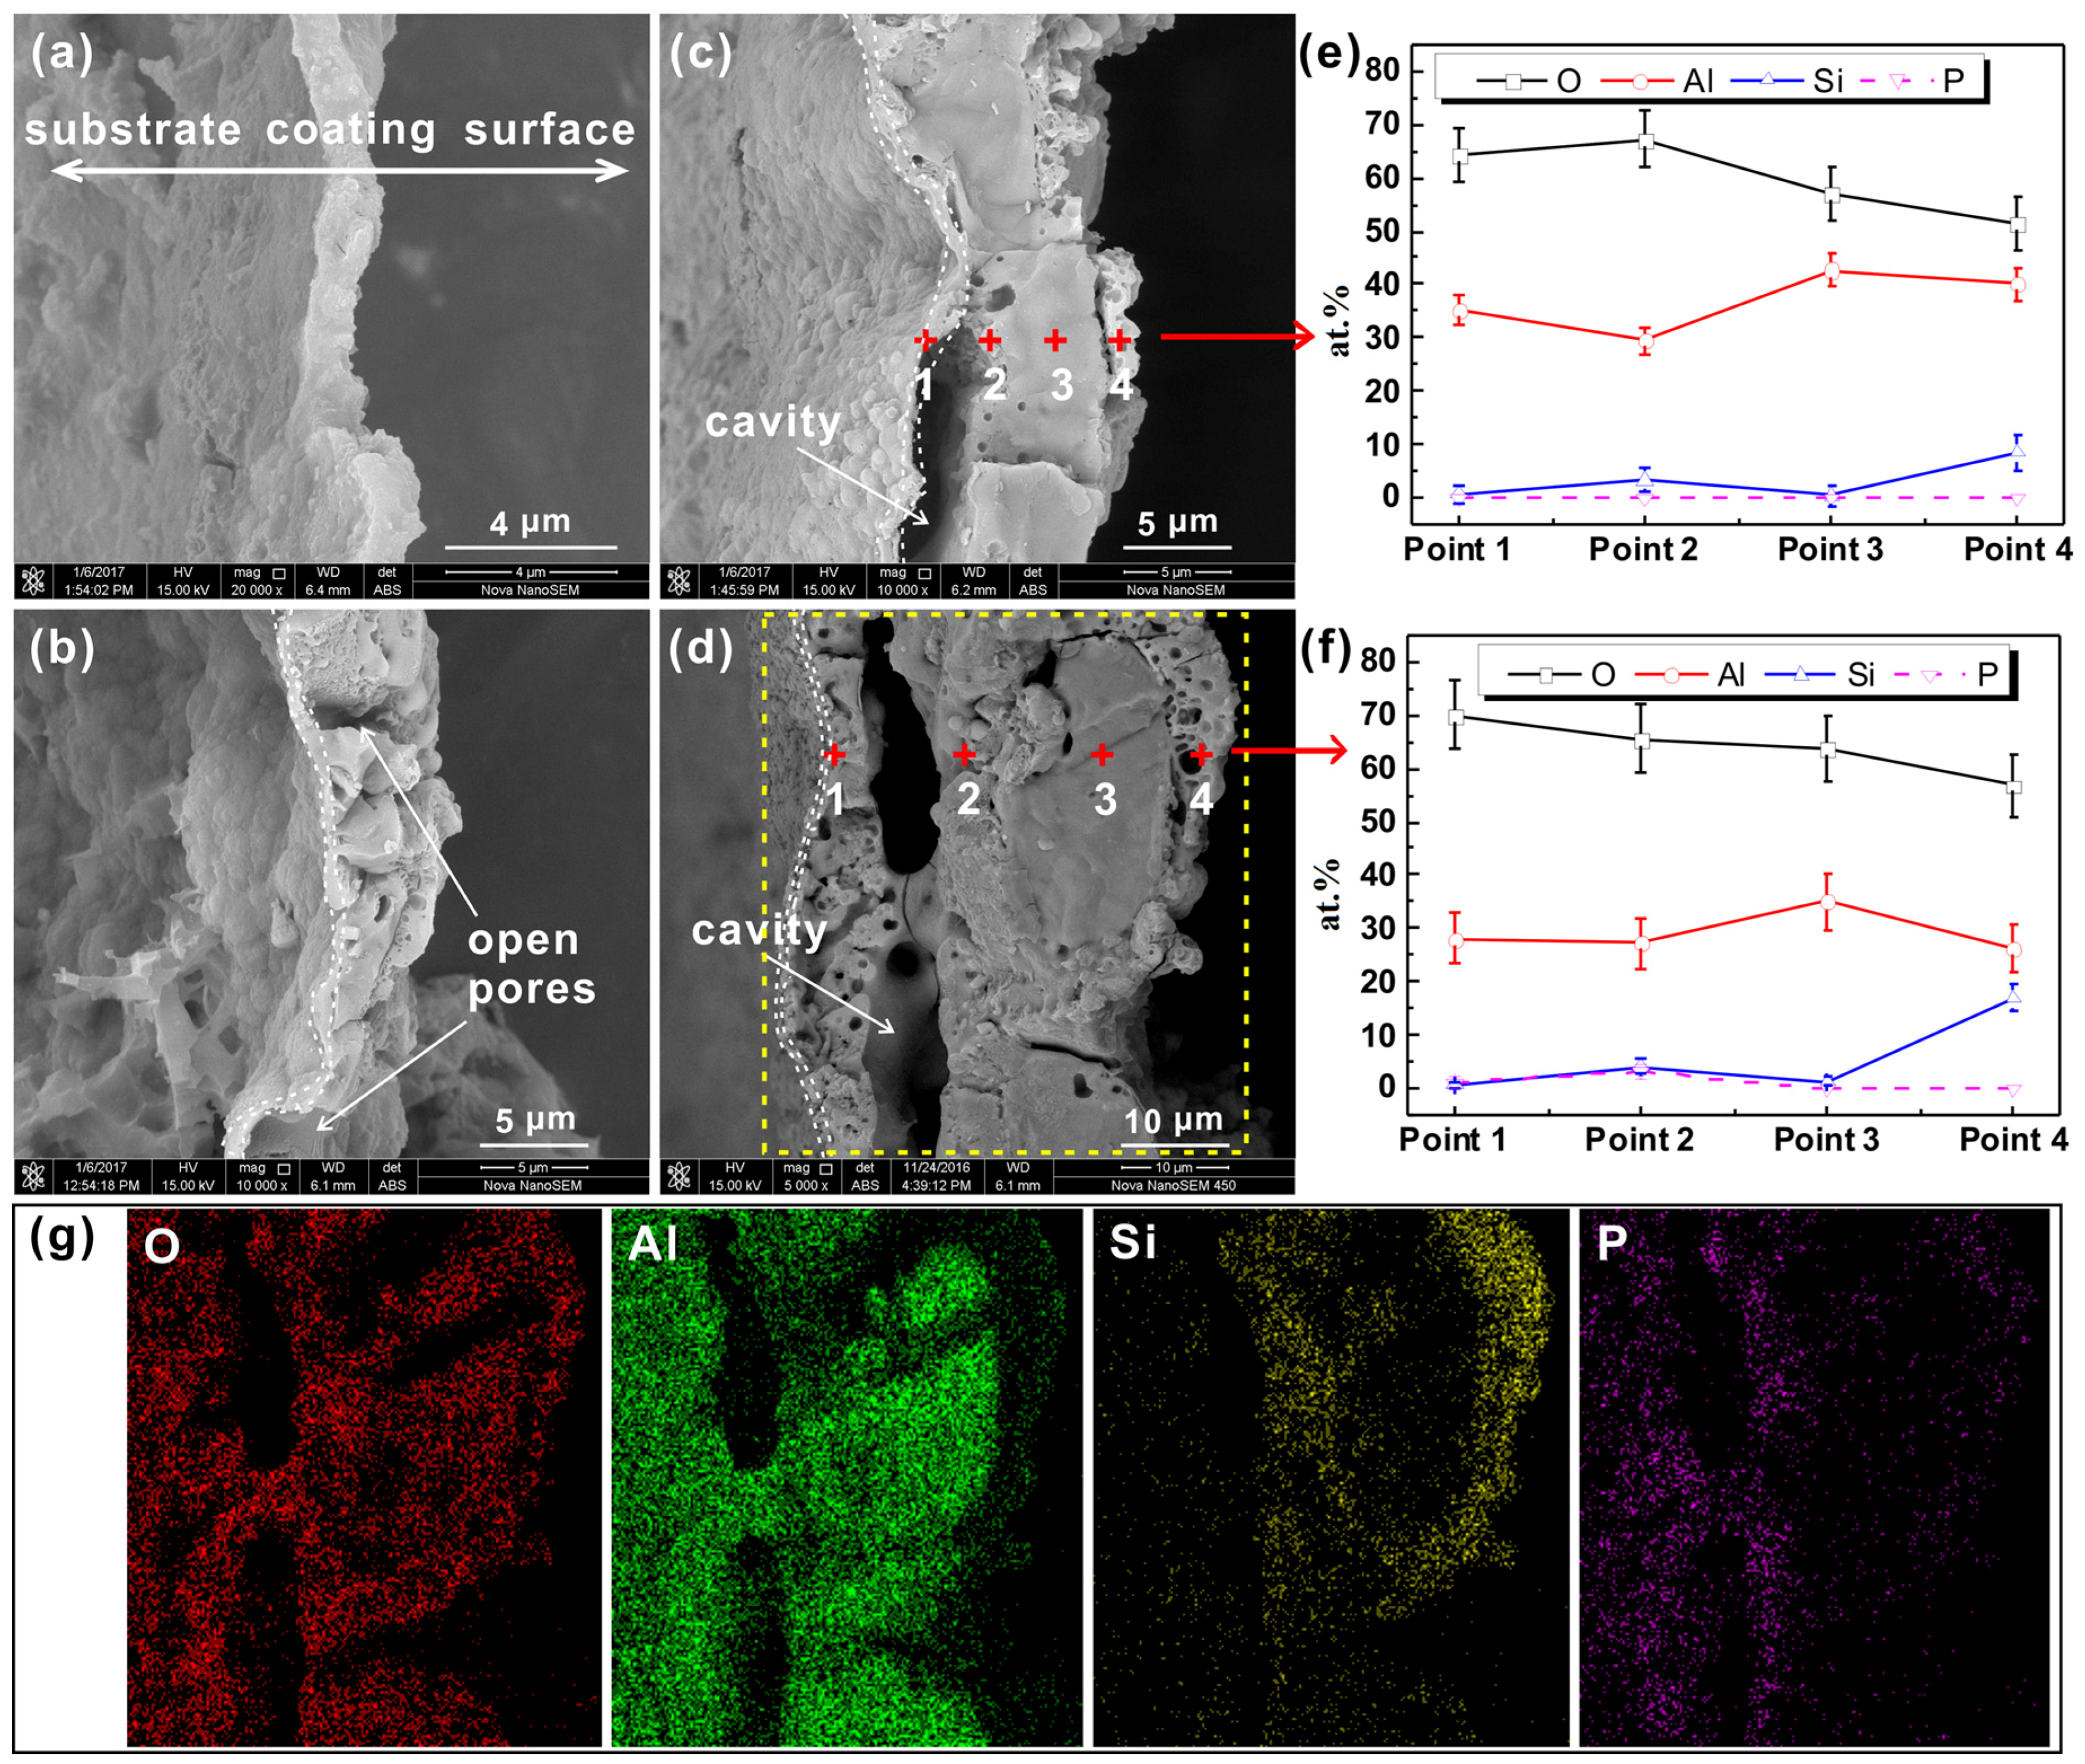
Figure 2.
(a–d) Surface SEM (back-scattered electron mode) and (e–h) 3D color maps of PEO coatings formed at (a,e) 5 min, (b,f) 15 min, (c,g) 45 min, and (d,h) 60 min.
Figure 2.
(a–d) Surface SEM (back-scattered electron mode) and (e–h) 3D color maps of PEO coatings formed at (a,e) 5 min, (b,f) 15 min, (c,g) 45 min, and (d,h) 60 min.

Figure 3.
XRD patterns of PEO coating powder samples formed at (a) 5 min, (b) 15 min, (c) 45 min, and (d) 60 min. (e) XRD pattern of the PEO coating sample with a substrate formed at 60 min.
Figure 3.
XRD patterns of PEO coating powder samples formed at (a) 5 min, (b) 15 min, (c) 45 min, and (d) 60 min. (e) XRD pattern of the PEO coating sample with a substrate formed at 60 min.
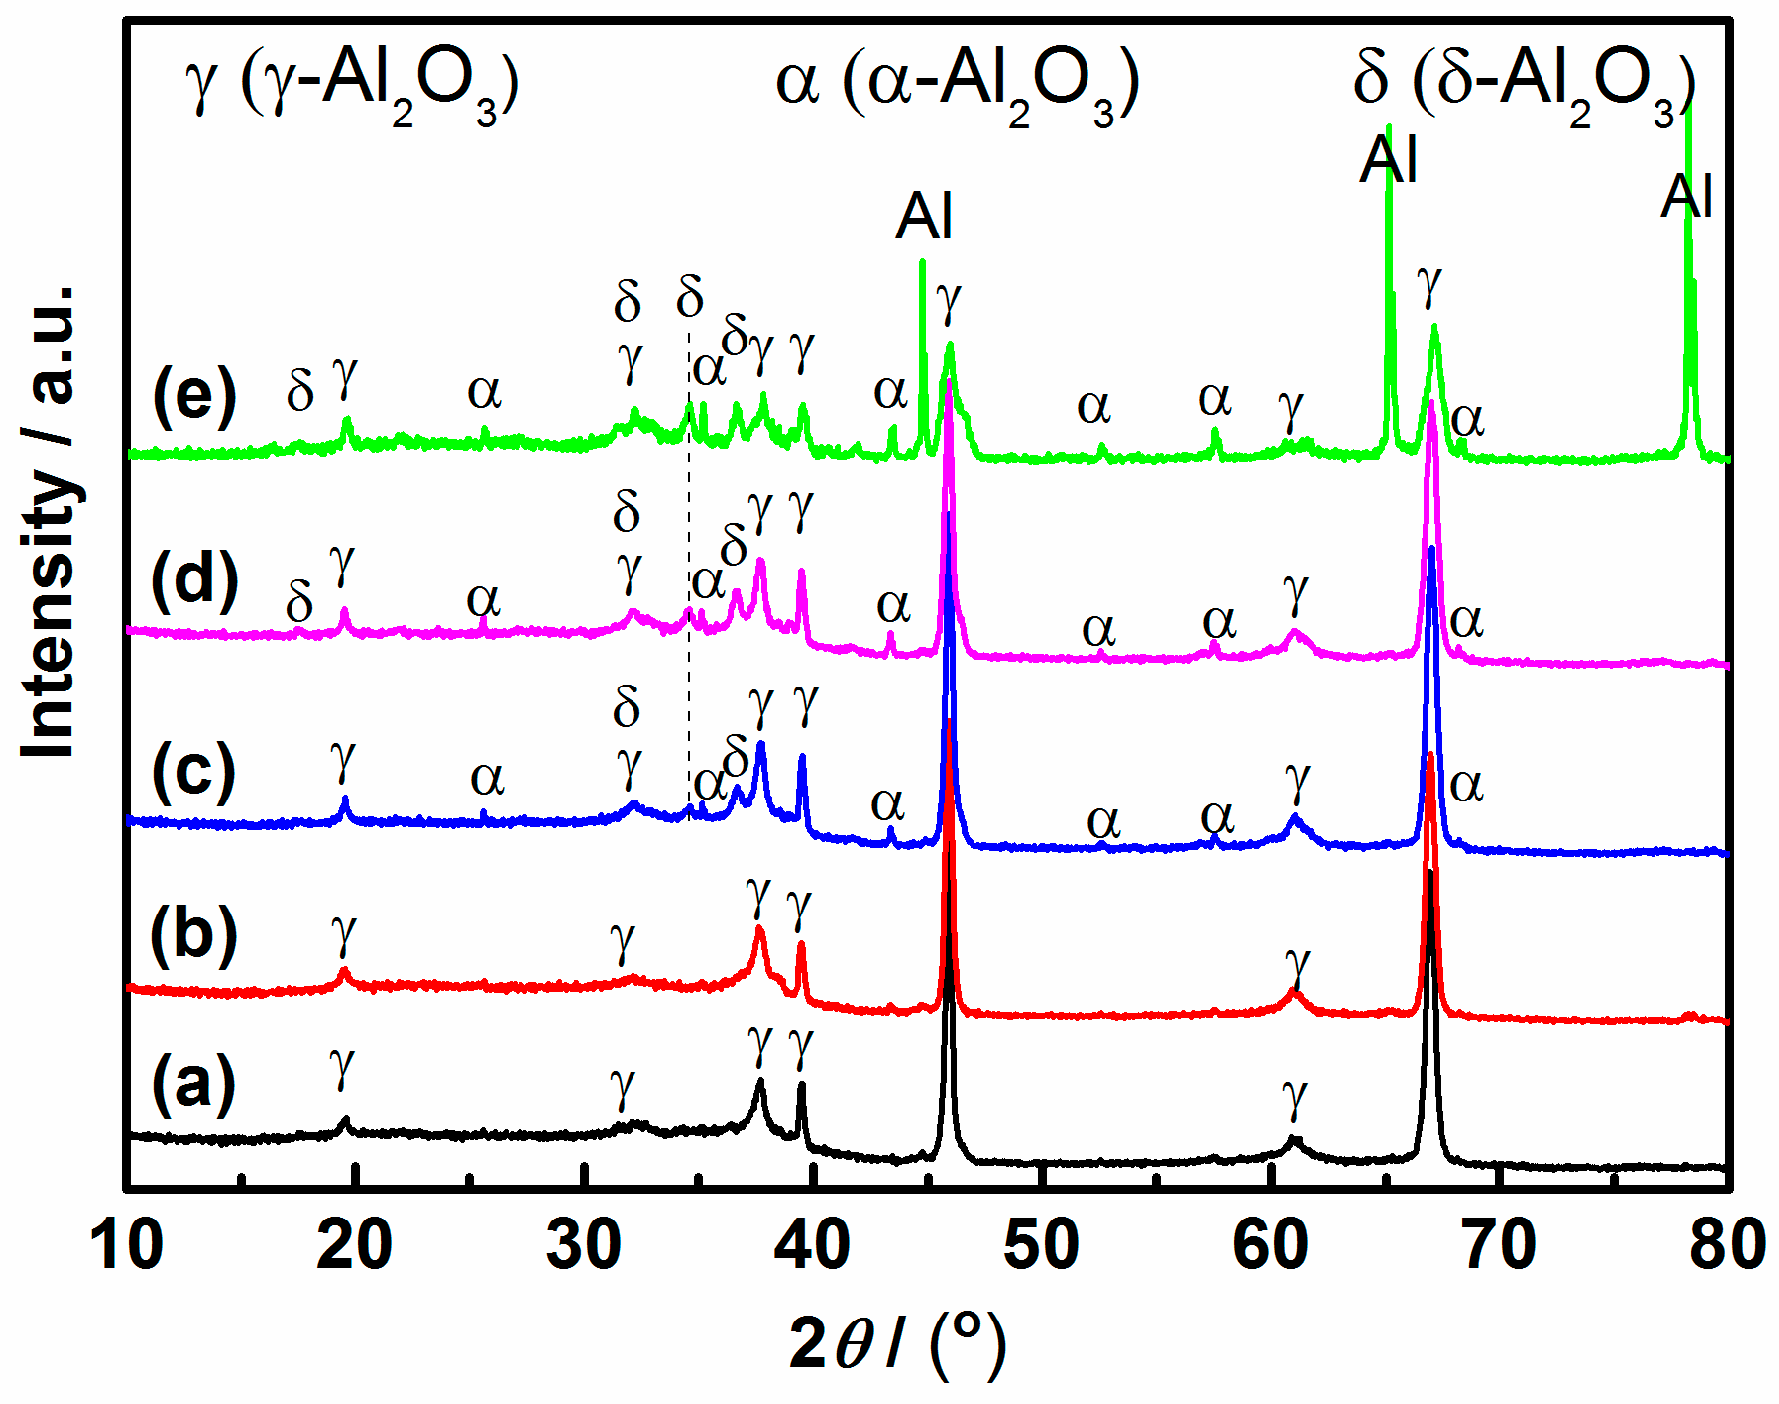
Figure 4.
(a) Surface SEM images (secondary electron mode) of the PEO coating formed at 60 min. EDS mappings of (b) O, (c) Al, (d) Si, and (e) P. (f) Semi-quantitative analysis of element content at different locations marked in Figure 4a.
Figure 4.
(a) Surface SEM images (secondary electron mode) of the PEO coating formed at 60 min. EDS mappings of (b) O, (c) Al, (d) Si, and (e) P. (f) Semi-quantitative analysis of element content at different locations marked in Figure 4a.
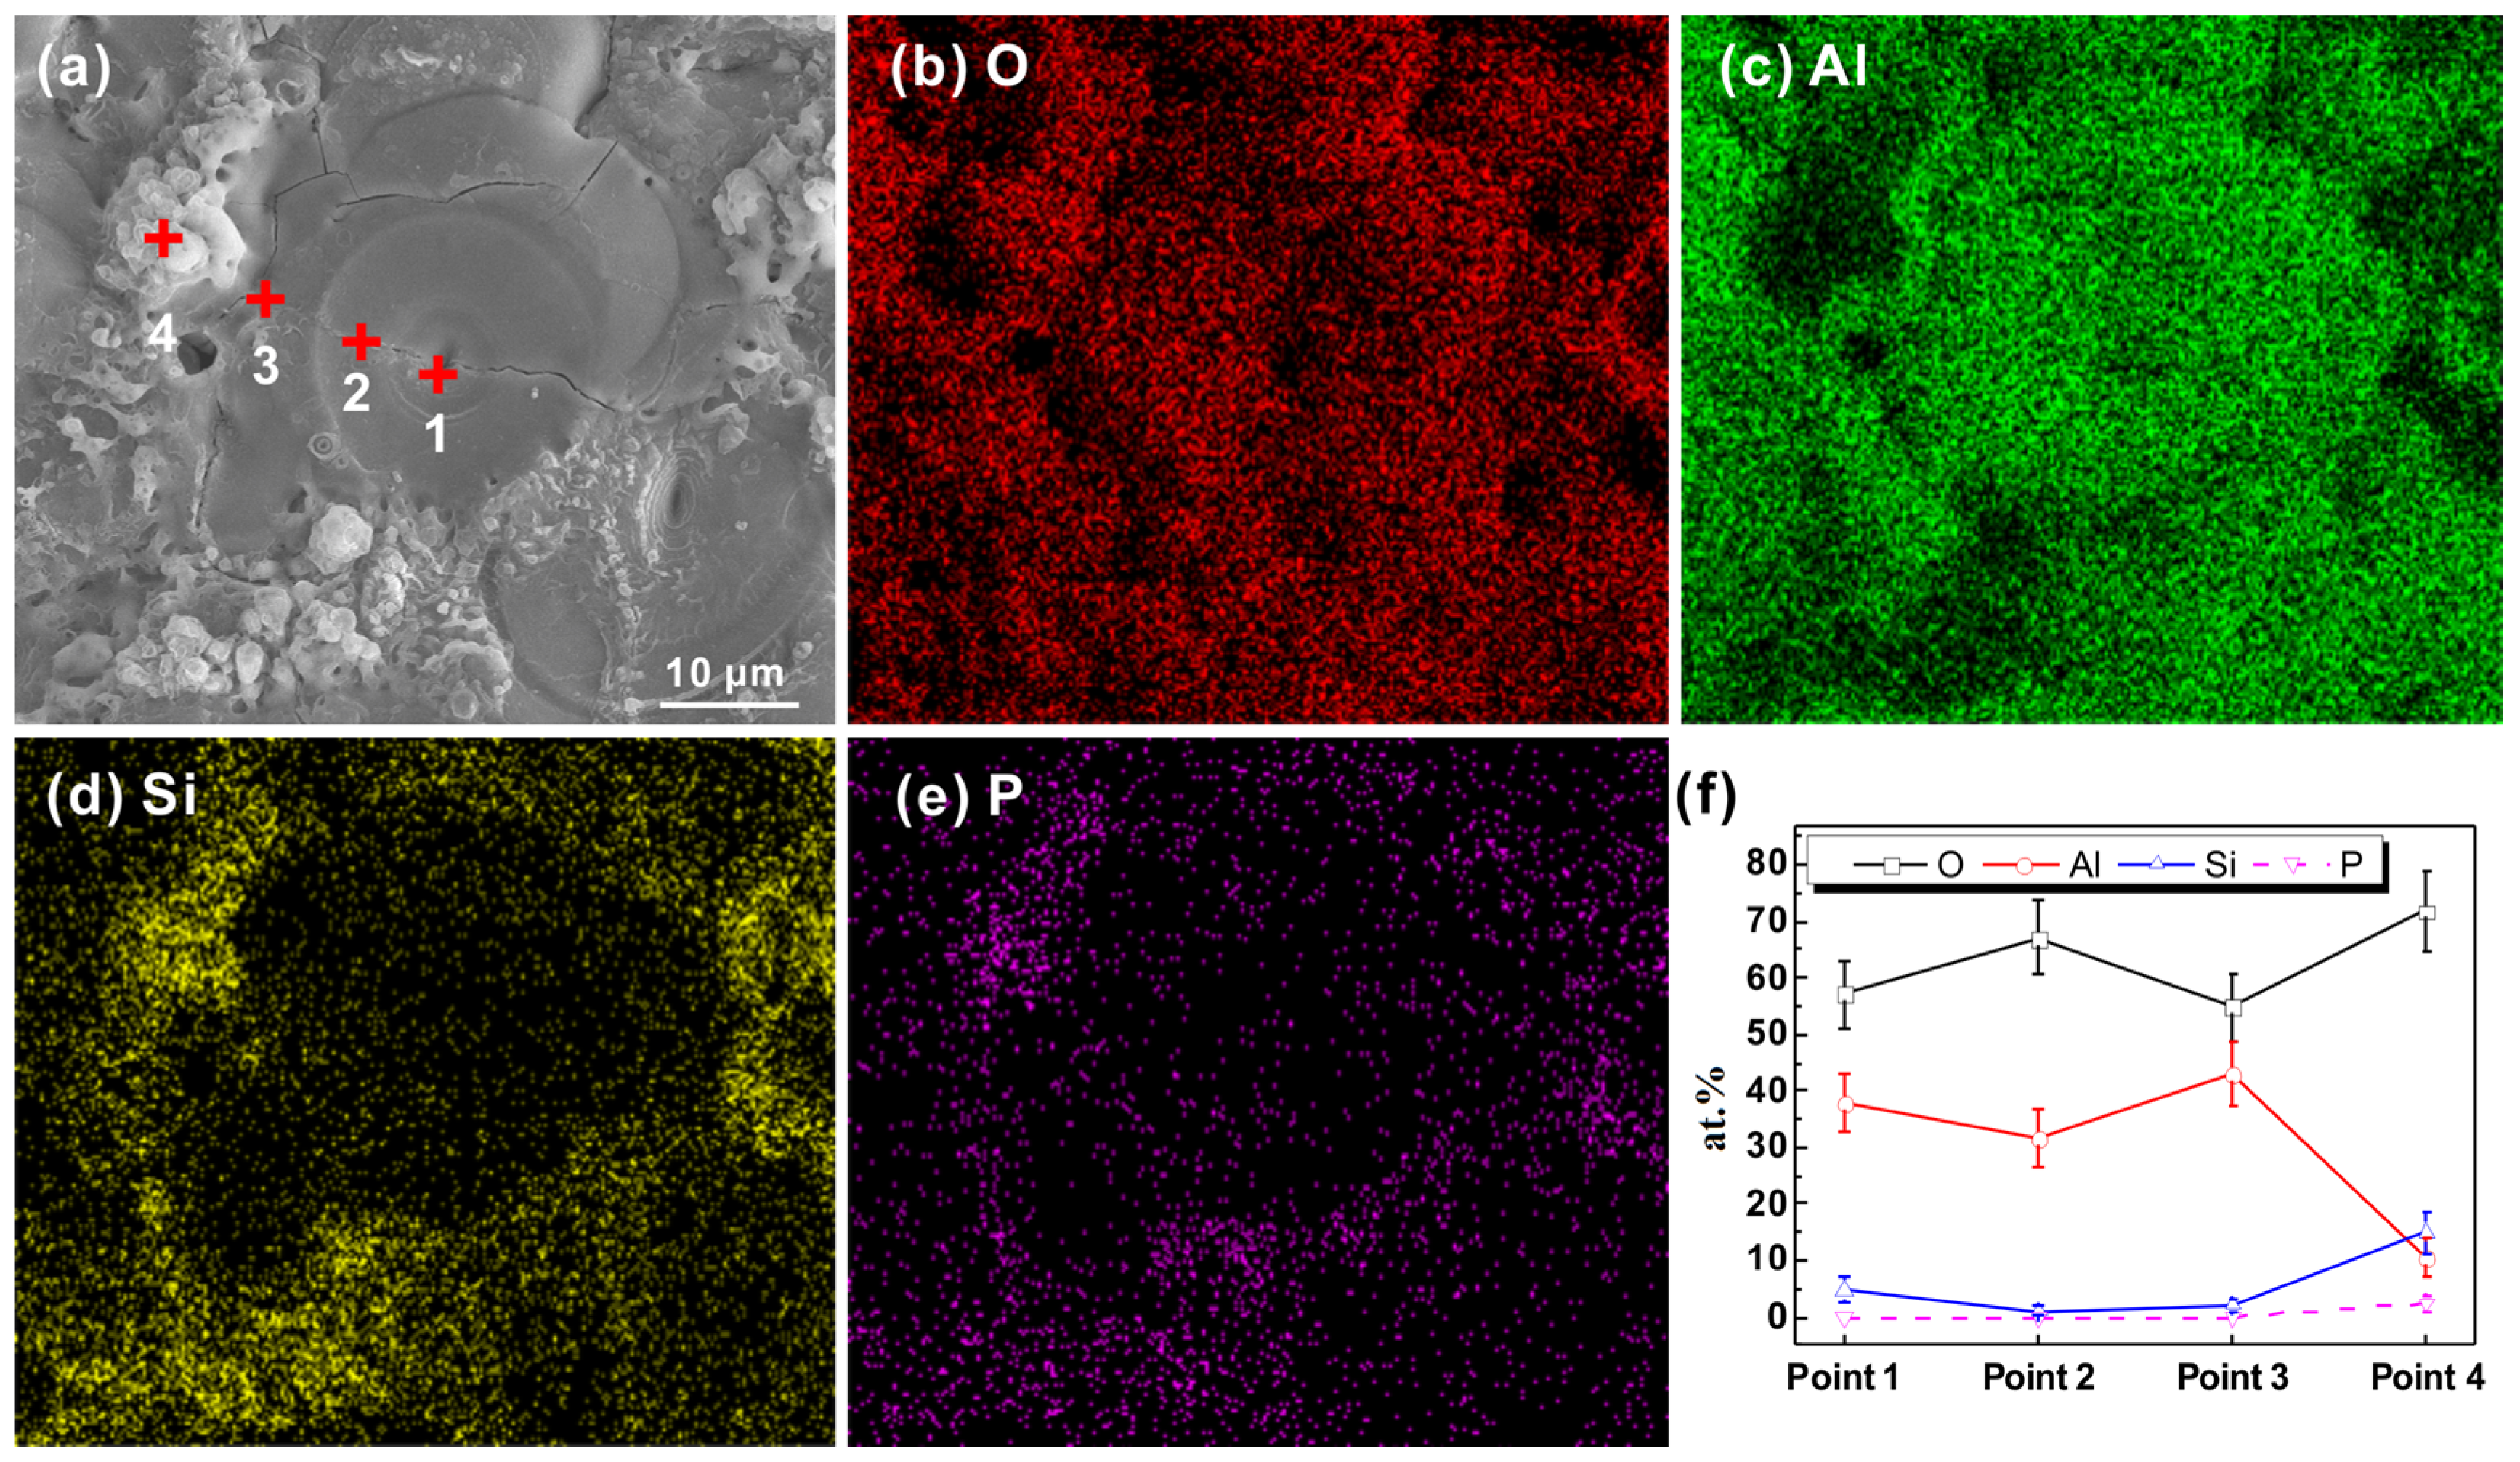
Figure 5.
(a–d) SEM images (back-scattered electron mode) and (e–h) magnified SEM images of the internal structure of PEO coatings formed at (a,e) 5 min, (b,f) 15 min, (c,g) 45 min, and (d,h) 60 min.
Figure 5.
(a–d) SEM images (back-scattered electron mode) and (e–h) magnified SEM images of the internal structure of PEO coatings formed at (a,e) 5 min, (b,f) 15 min, (c,g) 45 min, and (d,h) 60 min.
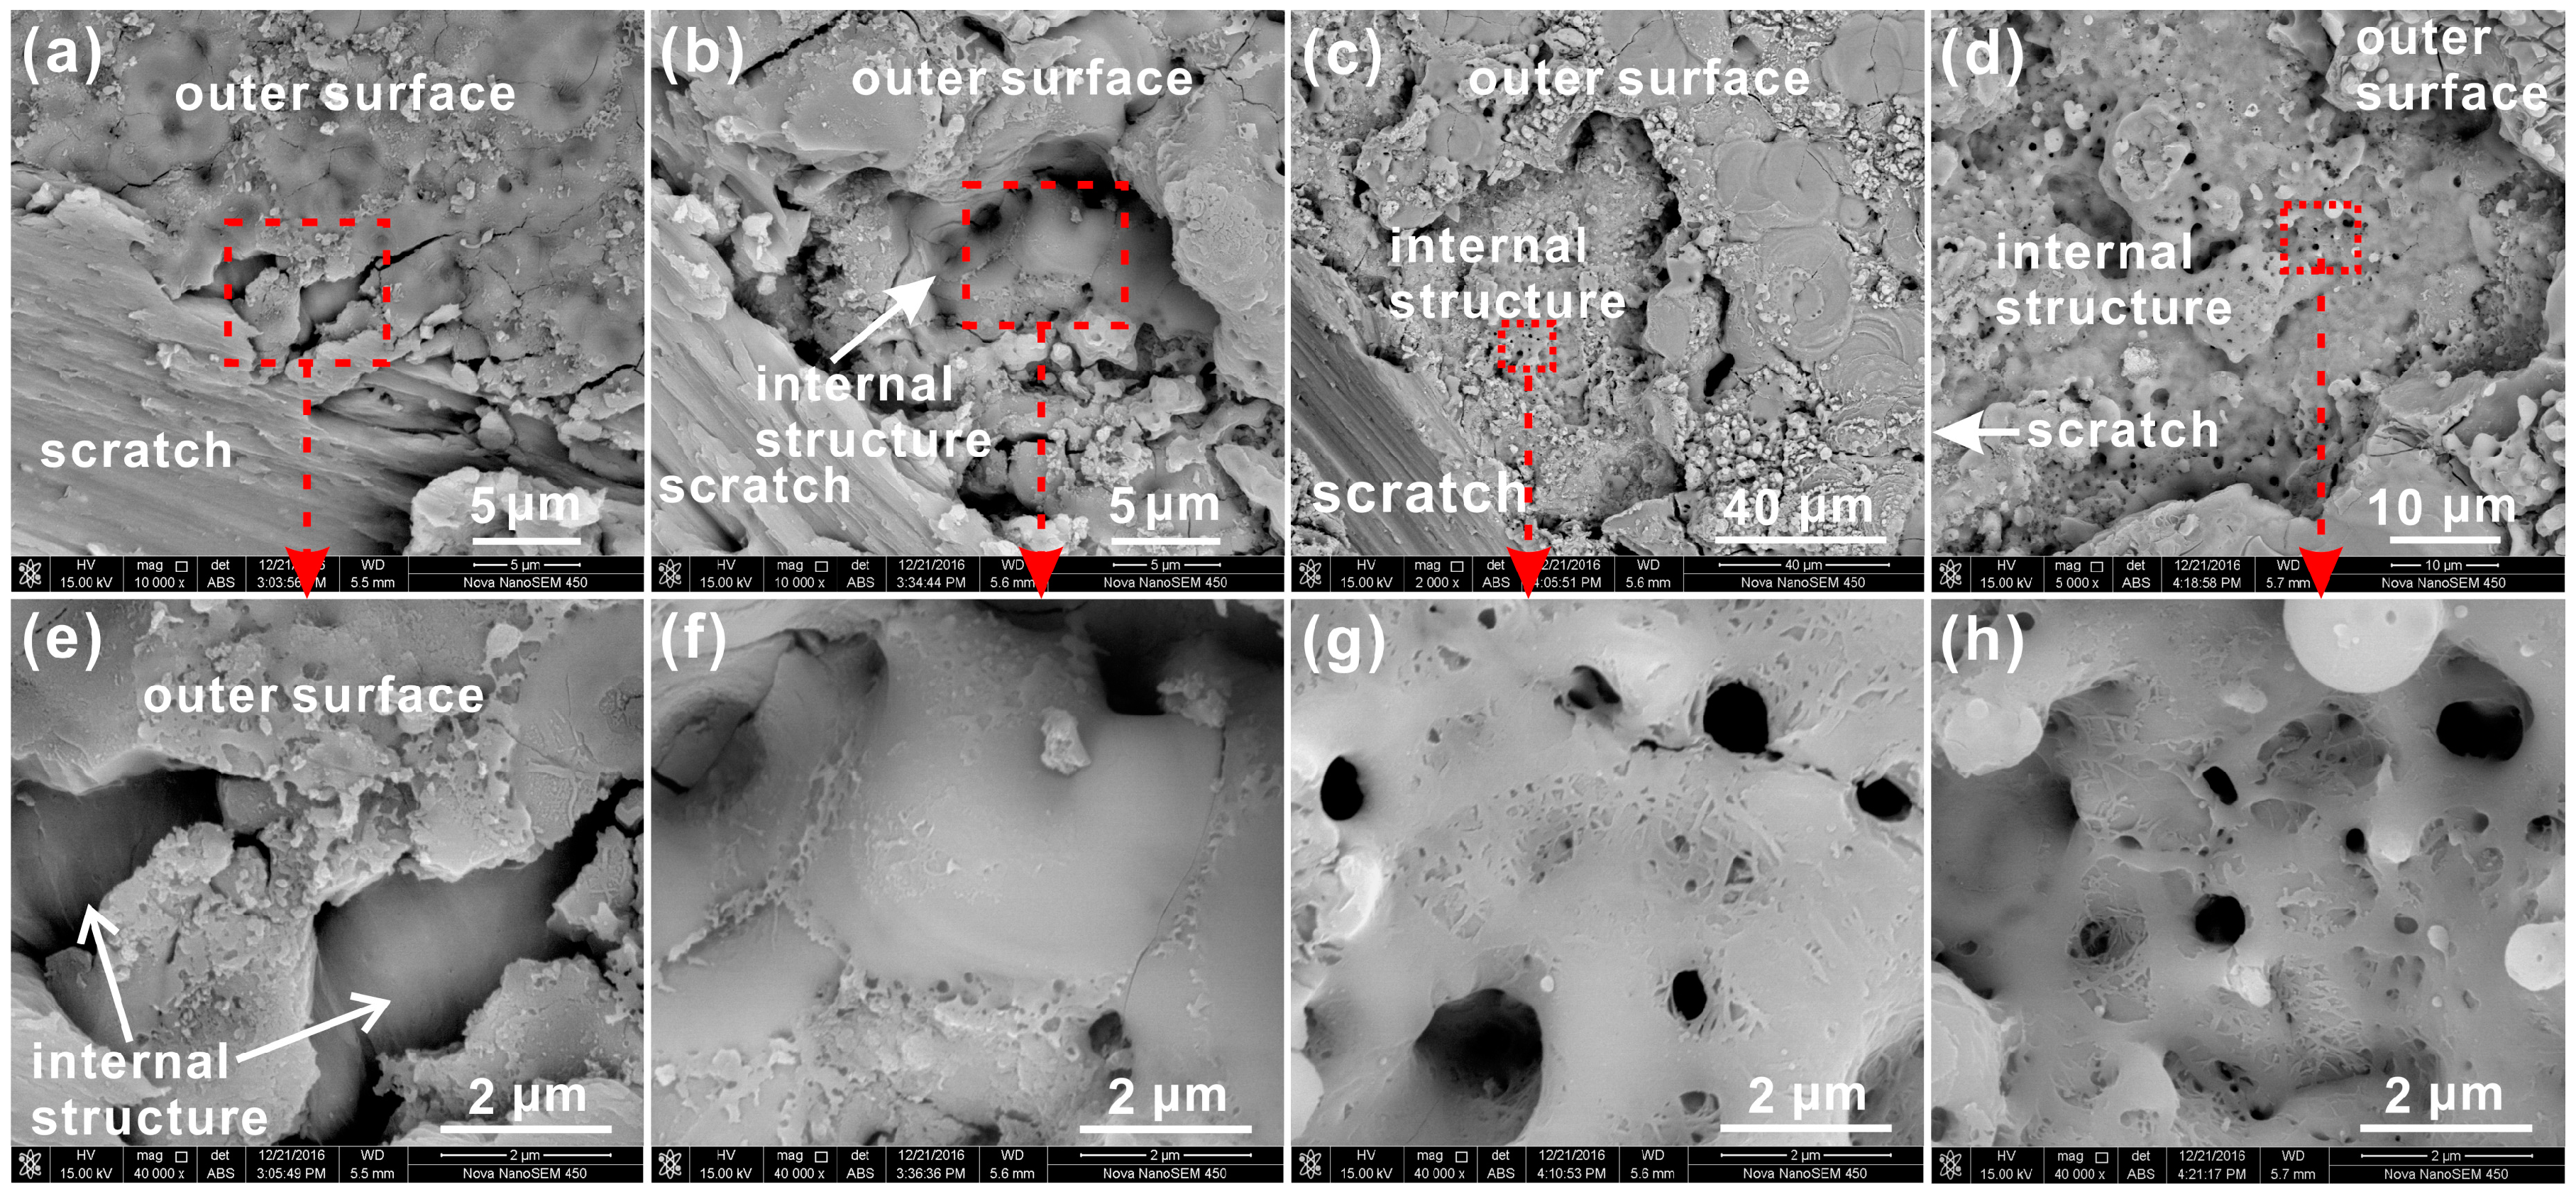
Figure 6.
(a–d) 3D color maps, (e–h) SEM image, and (i–l) magnified SEM images of aluminum/coating interface for PEO coatings formed at (a,e,i) 5 min, (b,f,j) 15 min, (c,g,k) 45 min, and (d,h,l) 60 min.
Figure 6.
(a–d) 3D color maps, (e–h) SEM image, and (i–l) magnified SEM images of aluminum/coating interface for PEO coatings formed at (a,e,i) 5 min, (b,f,j) 15 min, (c,g,k) 45 min, and (d,h,l) 60 min.
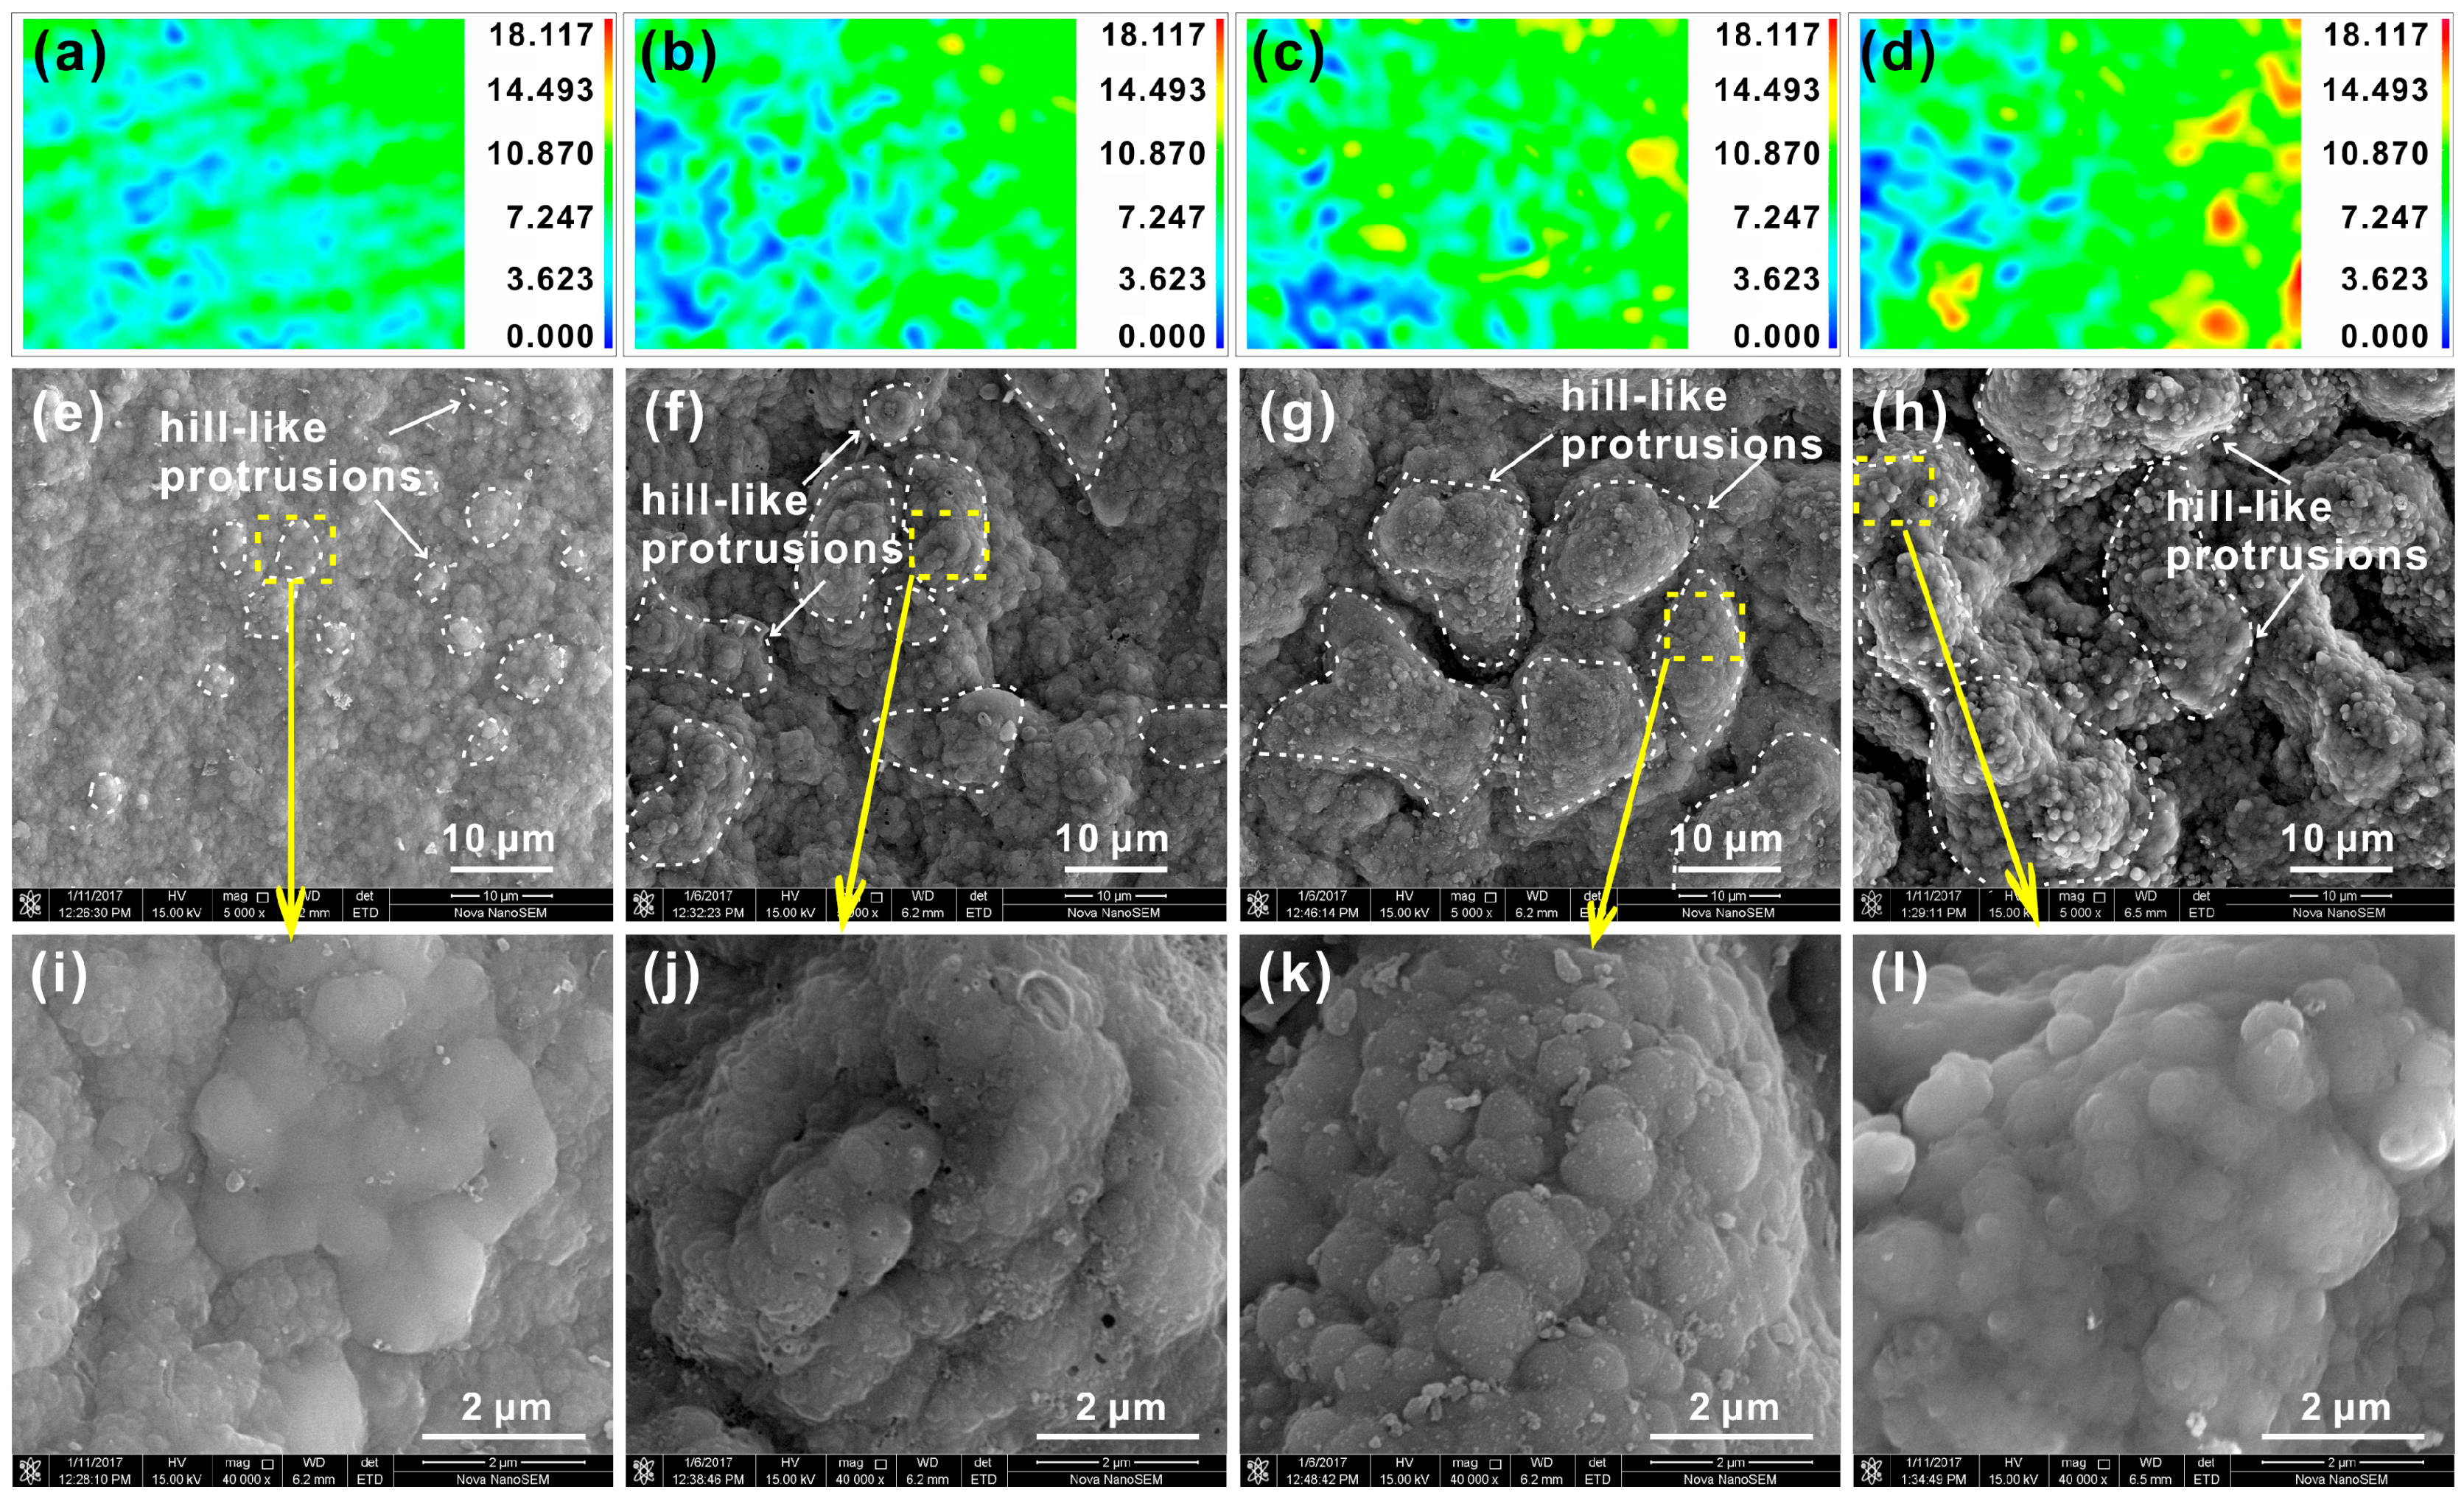
Figure 7.
A schematic diagram of the discharge at the molten zone of local coating: (a) molten zone; (b) 3D structure.
Figure 7.
A schematic diagram of the discharge at the molten zone of local coating: (a) molten zone; (b) 3D structure.
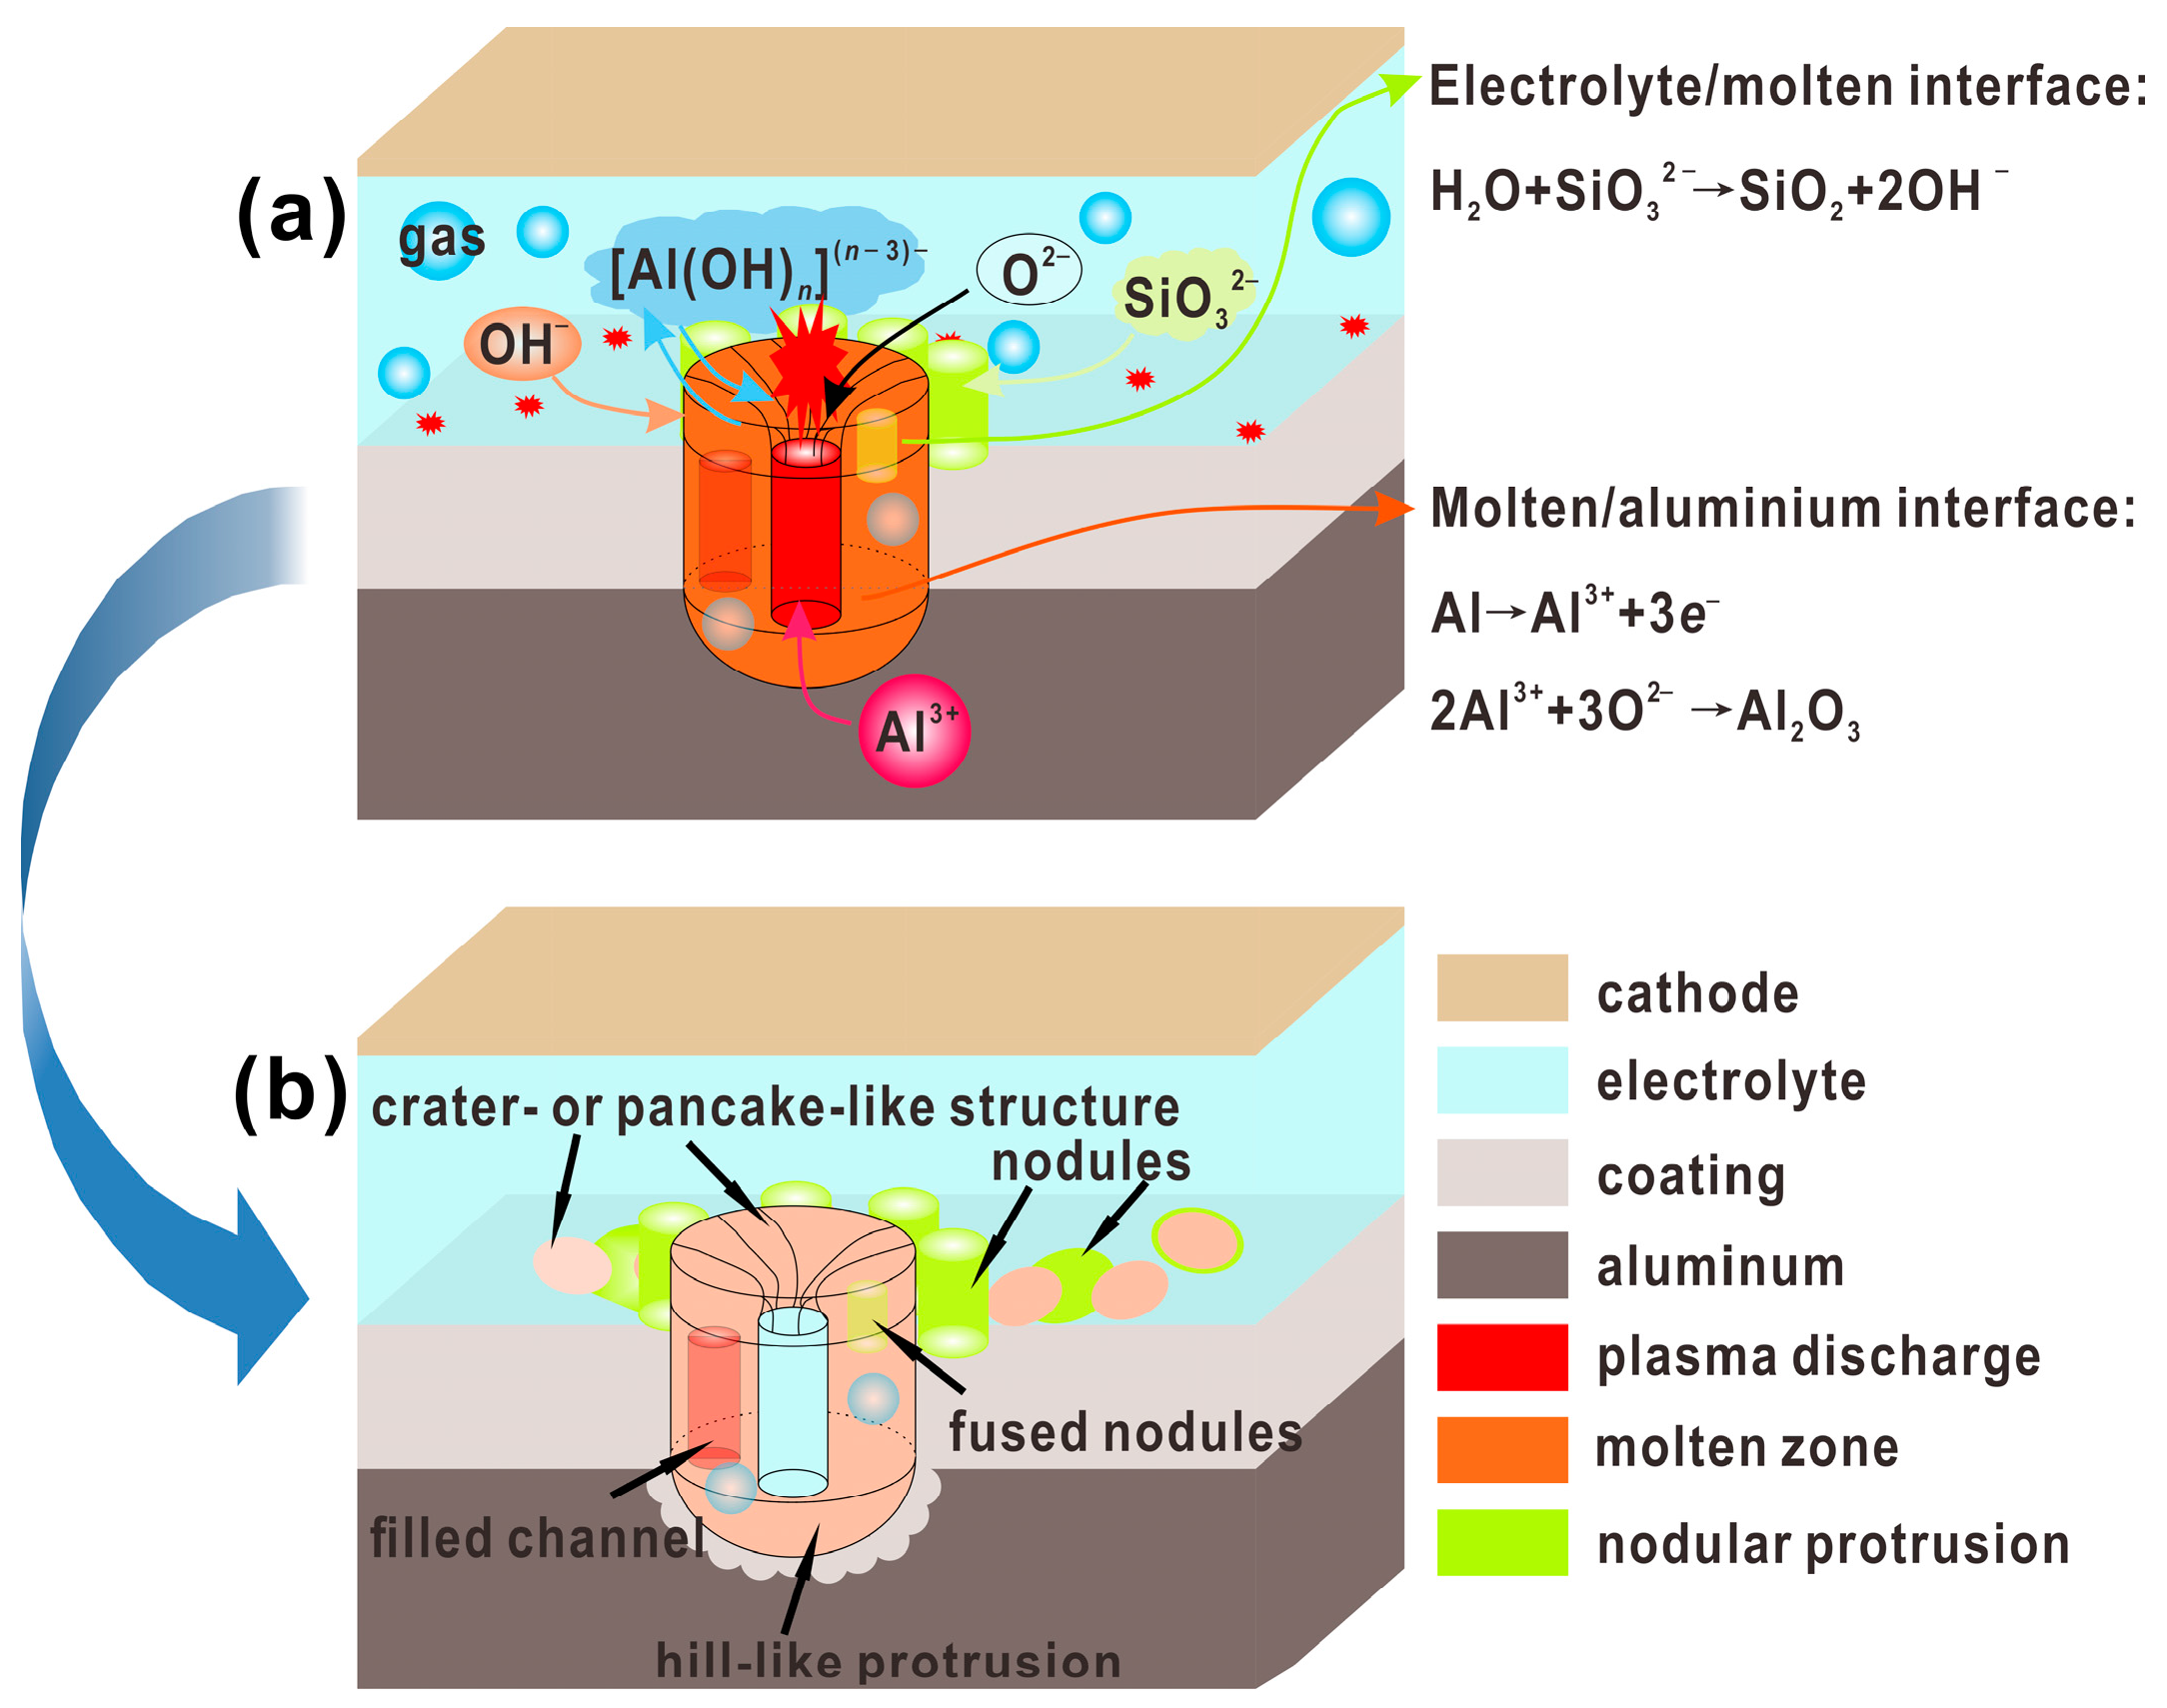
Figure 8.
A growth and 3D structure model of the PEO coating at different stages: (a) breakdown of dielectric film under plasma discharges; (b) formation of PEO coating with open pores; (c) initial formation of three-layer structure; and (d) further evolution of three-layer structure.
Figure 8.
A growth and 3D structure model of the PEO coating at different stages: (a) breakdown of dielectric film under plasma discharges; (b) formation of PEO coating with open pores; (c) initial formation of three-layer structure; and (d) further evolution of three-layer structure.


Table 1.
Surface EDS analysis of PEO coatings formed at different times marked in Figure 2 (at.%).
Table 1.
Surface EDS analysis of PEO coatings formed at different times marked in Figure 2 (at.%).
| Coating | Location | O | Al | Si | P | Si/Al | P/Al |
|---|---|---|---|---|---|---|---|
| 5 min | Spec. 1 | 55.6 | 43.2 | 1.2 | – | 0.03 | – |
| 15 min | Spec. 2 | 62.6 | 30.9 | 5.4 | 1.1 | 0.17 | 0.04 |
| 45 min | Spec. 3 | 61.8 | 28.9 | 8.5 | ≤1 | 0.30 | ≤0.03 |
| 60 min | Spec. 4 | 62.9 | 29.2 | 7.6 | ≤1 | 0.26 | ≤0.03 |
© 2018 by the authors. Licensee MDPI, Basel, Switzerland. This article is an open access article distributed under the terms and conditions of the Creative Commons Attribution (CC BY) license (http://creativecommons.org/licenses/by/4.0/).
Share and Cite
MDPI and ACS Style
Liu, X.; Wang, S.; Du, N.; Li, X.; Zhao, Q. Evolution of the Three-Dimensional Structure and Growth Model of Plasma Electrolytic Oxidation Coatings on 1060 Aluminum Alloy. Coatings 2018, 8, 105. https://doi.org/10.3390/coatings8030105
AMA Style
Liu X, Wang S, Du N, Li X, Zhao Q. Evolution of the Three-Dimensional Structure and Growth Model of Plasma Electrolytic Oxidation Coatings on 1060 Aluminum Alloy. Coatings. 2018; 8(3):105. https://doi.org/10.3390/coatings8030105
Chicago/Turabian StyleLiu, Xiaohui, Shuaixing Wang, Nan Du, Xinyi Li, and Qing Zhao. 2018. "Evolution of the Three-Dimensional Structure and Growth Model of Plasma Electrolytic Oxidation Coatings on 1060 Aluminum Alloy" Coatings 8, no. 3: 105. https://doi.org/10.3390/coatings8030105
Note that from the first issue of 2016, this journal uses article numbers instead of page numbers. See further details here.