Influence of Cu Content on the Structure, Mechanical, Friction and Wear Properties of VCN–Cu Films

1
School of Materials Science and Engineering, Jiangsu University of Science and Technology, Zhenjiang 212003, China
2
Department of Science and Technology, Tokyo Institute of Technology, Tokyo 152-8552, Japan
*
Author to whom correspondence should be addressed.
Coatings 2018, 8(3), 95; https://doi.org/10.3390/coatings8030095
Submission received: 21 January 2018
/
Revised: 25 February 2018
/
Accepted: 3 March 2018
/
Published: 7 March 2018
(This article belongs to the Special Issue Coatings Tribology)
Abstract
:VCN–Cu films with different Cu contents were deposited by reactive magnetron sputtering technique. The films were evaluated in terms of their microstructure, elemental composition, mechanical, and tribological properties by X-ray diffraction (XRD), energy-dispersive X-ray spectroscopy (EDS), high resolution transmission electron microscopy (HR-TEM), Raman spectrometry, nano-indentation, field emission scanning electron microscope (FE-SEM), Bruker three-dimensional (3D) profiler, and high-temperature ball on disc tribo-meter. The results showed that face-centered cubic (fcc) VCN, hexagonal close-packed (hcp) V2CN, fcc-Cu, amorphous graphite and CNx phases co-existed in VCN–Cu films. After doping with 0.6 at.% Cu, the hardness reached a maximum value of ~32 GPa. At room temperature (RT), the friction coefficient and wear rate increased with increasing Cu content. In the temperature range of 100–500 °C, the friction coefficient decreased, but the wear rate increased with the increase of Cu content.
1. Introduction
Transition metal nitride (TMN) nanocomposite films, exhibiting a good combination of mechanical, chemical, and wear resistance properties [1,2,3], have been widely used in many fields (molds, cutting tools, engine parts, etc.) for surface strengthening [4,5]. Vanadium nitride (VN) films are a good alternative for their more common TiN, ZrN, and CrN counterparts [6,7,8,9], due to enhanced selflubricating ability [10]. In our previous study [11], a series of VCN films with different carbon content were deposited onto a Si substrate using the reactive magnetron sputtering method. The mechanical and room temperature tribological properties of VN-based films can be improved greatly by doping with carbon. For example, the hardness of VCN films reached 33 GPa [12], being higher than that of binary VN (~20 GPa) and VC (20–22 GPa) films [13], the room-temperature tribological properties reached the lowest value of 0.22 [12], being lower than VN (~0.47) and VC (~0.35) films [13]. However, at medium temperature, the friction coefficients were still relatively high and this would limit its further application.
Recently, TMN nanocomposite films containing soft metals (such as copper and silver) have been a hot topic due to their potential applications in different fields, such as wear, friction, corrosion protection, medicine, optics, and so on. Much research focuses on the nitrides, carbides, and oxides of transition metals in copper doping, mainly studied their tribological properties [1,5,14]. Besides, some researchers also have conducted a thorough study on wear [15,16]. Although at room temperature, the available results regarding the effect of soft metal Cu on the friction properties and wear of thin films are rather contradictory [1,5,12]. The incorporation of Cu was shown to be an effective approach to reduce friction, especially for elevated temperature. For instance, Suszko et al. [5] deposited Mo2N–Cu nanocomposite films to study the effect of copper on the tribological properties in the range of 25–400 °C. They found that, after adding some Cu, the friction coefficient of Mo2N film was reduced obviously in the temperature range of 200–400 °C. Yu et al. [17] prepared W2N–Cu films and studied the effect of Cu content on the tribological properties in the temperature range of 25–600 °C. They found that the incorporation of Cu could improve the friction coefficient of W2N film in this temperature range. Therefore, the incorporation of soft phased Cu into VCN films is an effective method to improve the medium-temperature tribological properties.
To the best of our knowledge, VCN–Cu coatings were not investigated to date. Therefore, the present study aimed at preparing, characterizing, and investigating the tribological properties from 25 to 500 °C of VCN–Cu films. To understand processes that are involved into friction and wear of VCN–Cu films, the effect of Cu on the microstructure, Micro-hardness and residual stress of the prepared VCN films was thoroughly studied.
2. Experimental Details
2.1. Preparation of Films
VCN–Cu composite films with a thickness of about 2 μm were deposited on 304 stainless steels and Si (100) wafers using a multi-target magnetron sputtering system (JGP-450, SKY, Shenyang, China). Water-cooled 75-mm-diameter V (99.9%), C (graphite) (99.9%), and Cu (99.99%) targets were corresponding installed in three cathodes. Si (100) wafers were used as substrate materials for structural and mechanical investigations. Stainless steel 304 (15 mm × 15 mm × 2 mm) were used as substrate materials for dry sliding ball-on-disk tests. The 304 stainless steel were polished with sandpaper and soft cloth used to clean the surface to removed residual scratches. Before being placed on the substrate holder in the chamber, the substrates were cleaned with successive rinses in ultrasonic baths of acetone and alcohol, and blown dry with dry air. The base pressure was 6.0 × 10⁻⁴ Pa before deposition. Just prior to initiating deposition, 10 min sputter clean of the targets and 15 min deposition of V (target power, 200 W) were conducted in a pure Argon atmosphere as the transition layer to confirm a good adhesion force of the films. Then, VCN–Cu films with various Cu content were achieved by fixing the powers of V target at 200 W and C (graphite) target at 90 W and adjusting the power of Cu target from 0 to 25 W. The target-substrate distance was 78 mm with no substrate bias voltage, no substrate temperature and a constant working pressure (0.3 Pa) with the same ratio of Ar and N2 flow rates (10:7) in a radio-frequency magnetron sputtering system. Detailed preparation parameters in Table 1.
2.2. Characterization of the Films
The phases of VCN–Cu films were explored by X-ray diffraction (XRD, Shimazu-6000, Shimadzu, Kyoto, Japan) with a Cu Kα source, operated at 40 kV and 35 mA with a scanning speed was 4°/min. The average grain crystal size (Dc) of VCN–Cu was calculated by Debye-Scherer, as seen in equation [18]:
where λ is X-ray wavelength, B is full width at half maximum (FWHM) of diffraction peak and θ represents the diffraction angle. The diffraction profiles were corrected for the instrumental broadening using an alumina sample, which had large crystallites and were free from the defects. The cross-sections of the films were observed by a field emission scanning electron microscopy (FE-SEM, Merlin Compact-6170, ZEISS, Jena, Germany). A high-resolution transmission electron microscopy (HR-TEM, JEOL JEM-2010F, JEOL, Tokyo, Japan) that was operated at an accelerating voltage of 200 KV and energy dispersive spectroscopy (EDS) on an EDAX-DX-4 energy dispersive analyzer were used to characterize the crystallinity, microstructure, and elemental composition of the film. A micro-Raman spectrometer (inVia*, Renishaw, Gloucestershire, UK) having a 514.5 nm Ar+ laser as an excitation source with back scattering geometry was used in recording Raman spectra at room temperature.
Hardness of the films were determined by nano-indenter CPX + NHT2 + MST (CSM, Peseux, Switzerland) equipped with a diamond Berkovich indenter tip (3-side pyramid). In order to minimize the substrate’s influence on the hardness of the films, a maximum load of 3 mN was used to meet the d/h < 0.1 criterion (where d and h are the indenter penetration depth into the film and the film thickness, respectively) using an automatic indentation mode that was programmed to place indentations in a 3 × 3 array. Nine points were selected for each sample and averaged. An automatic indentation mode programmed to place indentations in a 3 × 3 array. Each sample was tested three times. Fused silica was used as a reference sample for the calibration before indents were made.
The tribological properties were conducted along a circular track (diameter: 8 mm) against Al2O3 counterpart (diameter: 9.38 mm) for 30 min. A constant speed of 50 rpm was maintained with a normal load of 3 N in an atmosphere with a relative humidity of about 25%–30%. The temperature was fixed at 25, 100, 200, 300, 400, and 500 °C, respectively. Friction tests were performed three times under the same conditions for the same batch of samples, and the accuracy of the experiment was confirmed based on the repeatability of the experimental results. Thereafter, a profilometer (Bruker DEKTAK-XT, Billerica, MA, USA) was used to determine wear volume loss of the films (V) through examining the worn tracks. In order to calculate the wear rates (W) of the as-deposited films, an Archard’s classical wear equation [19] was listed as follows:
here S represents the sliding distance, L is the loading force, and V is wear volume. After wear tests, the wear tracks were also detected by XRD (Shimazu-6000, Shimadzu, Kyoto, Japan). A spot size of 1.0 mm was fixed on the wear track, which was less than the wear track width, hence our ability to probe the wear track with the XRD.
The average stress σ in the films was determined by means of Stoney’s formula [20] (Equation 3).
where the subscript S refers to the substrate, ES and VS are Young’s modulus and Poisson’s ratio of silicon substrate, respectively, tf and ts are thicknesses of film and substrate, respectively, R and r are the substrate curvature radii of the original Si wafer and the coated Si wafer, which was determined by measuring the curvature of the silicon wafer before and after deposition by Bruker three-dimensional (3D) Profiler (Bruker DEKTAK-XT, Bruker, Billerica, MA, USA).
3. Results and Discussion
3.1. Composition and Phase Structure
The chemical composition of the VCN–Cu composite films with varying Cu target powers are summarized in Table 2. As listed, an increase in Cu target power from 0 to 25 W have a corresponding increase in Cu, while the relative content of V and C decreases but the content of N remains relatively uniform (~50 at.%.) irrespective of the Cu target power. The accuracy of the carbon and nitrogen content is limited by the EDS method.
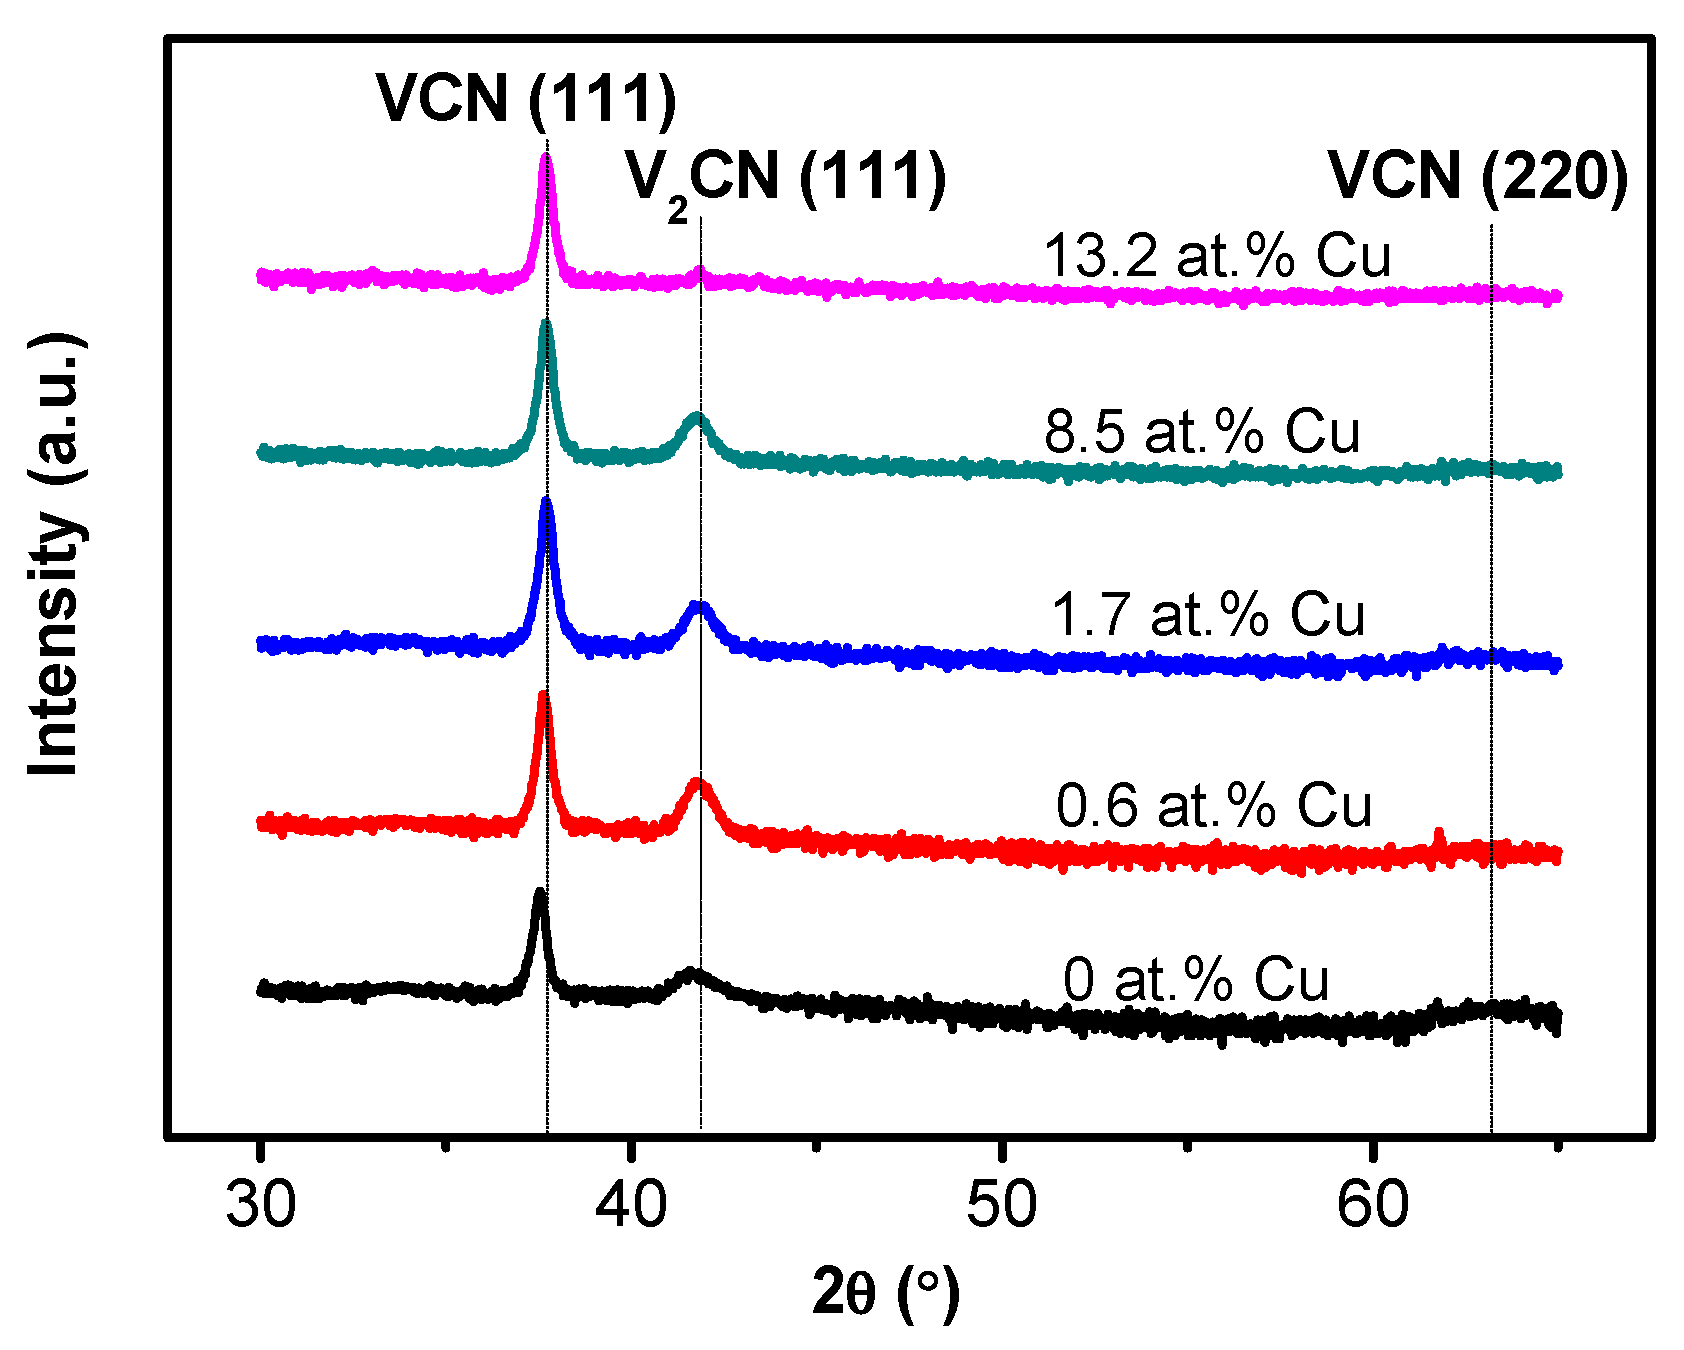
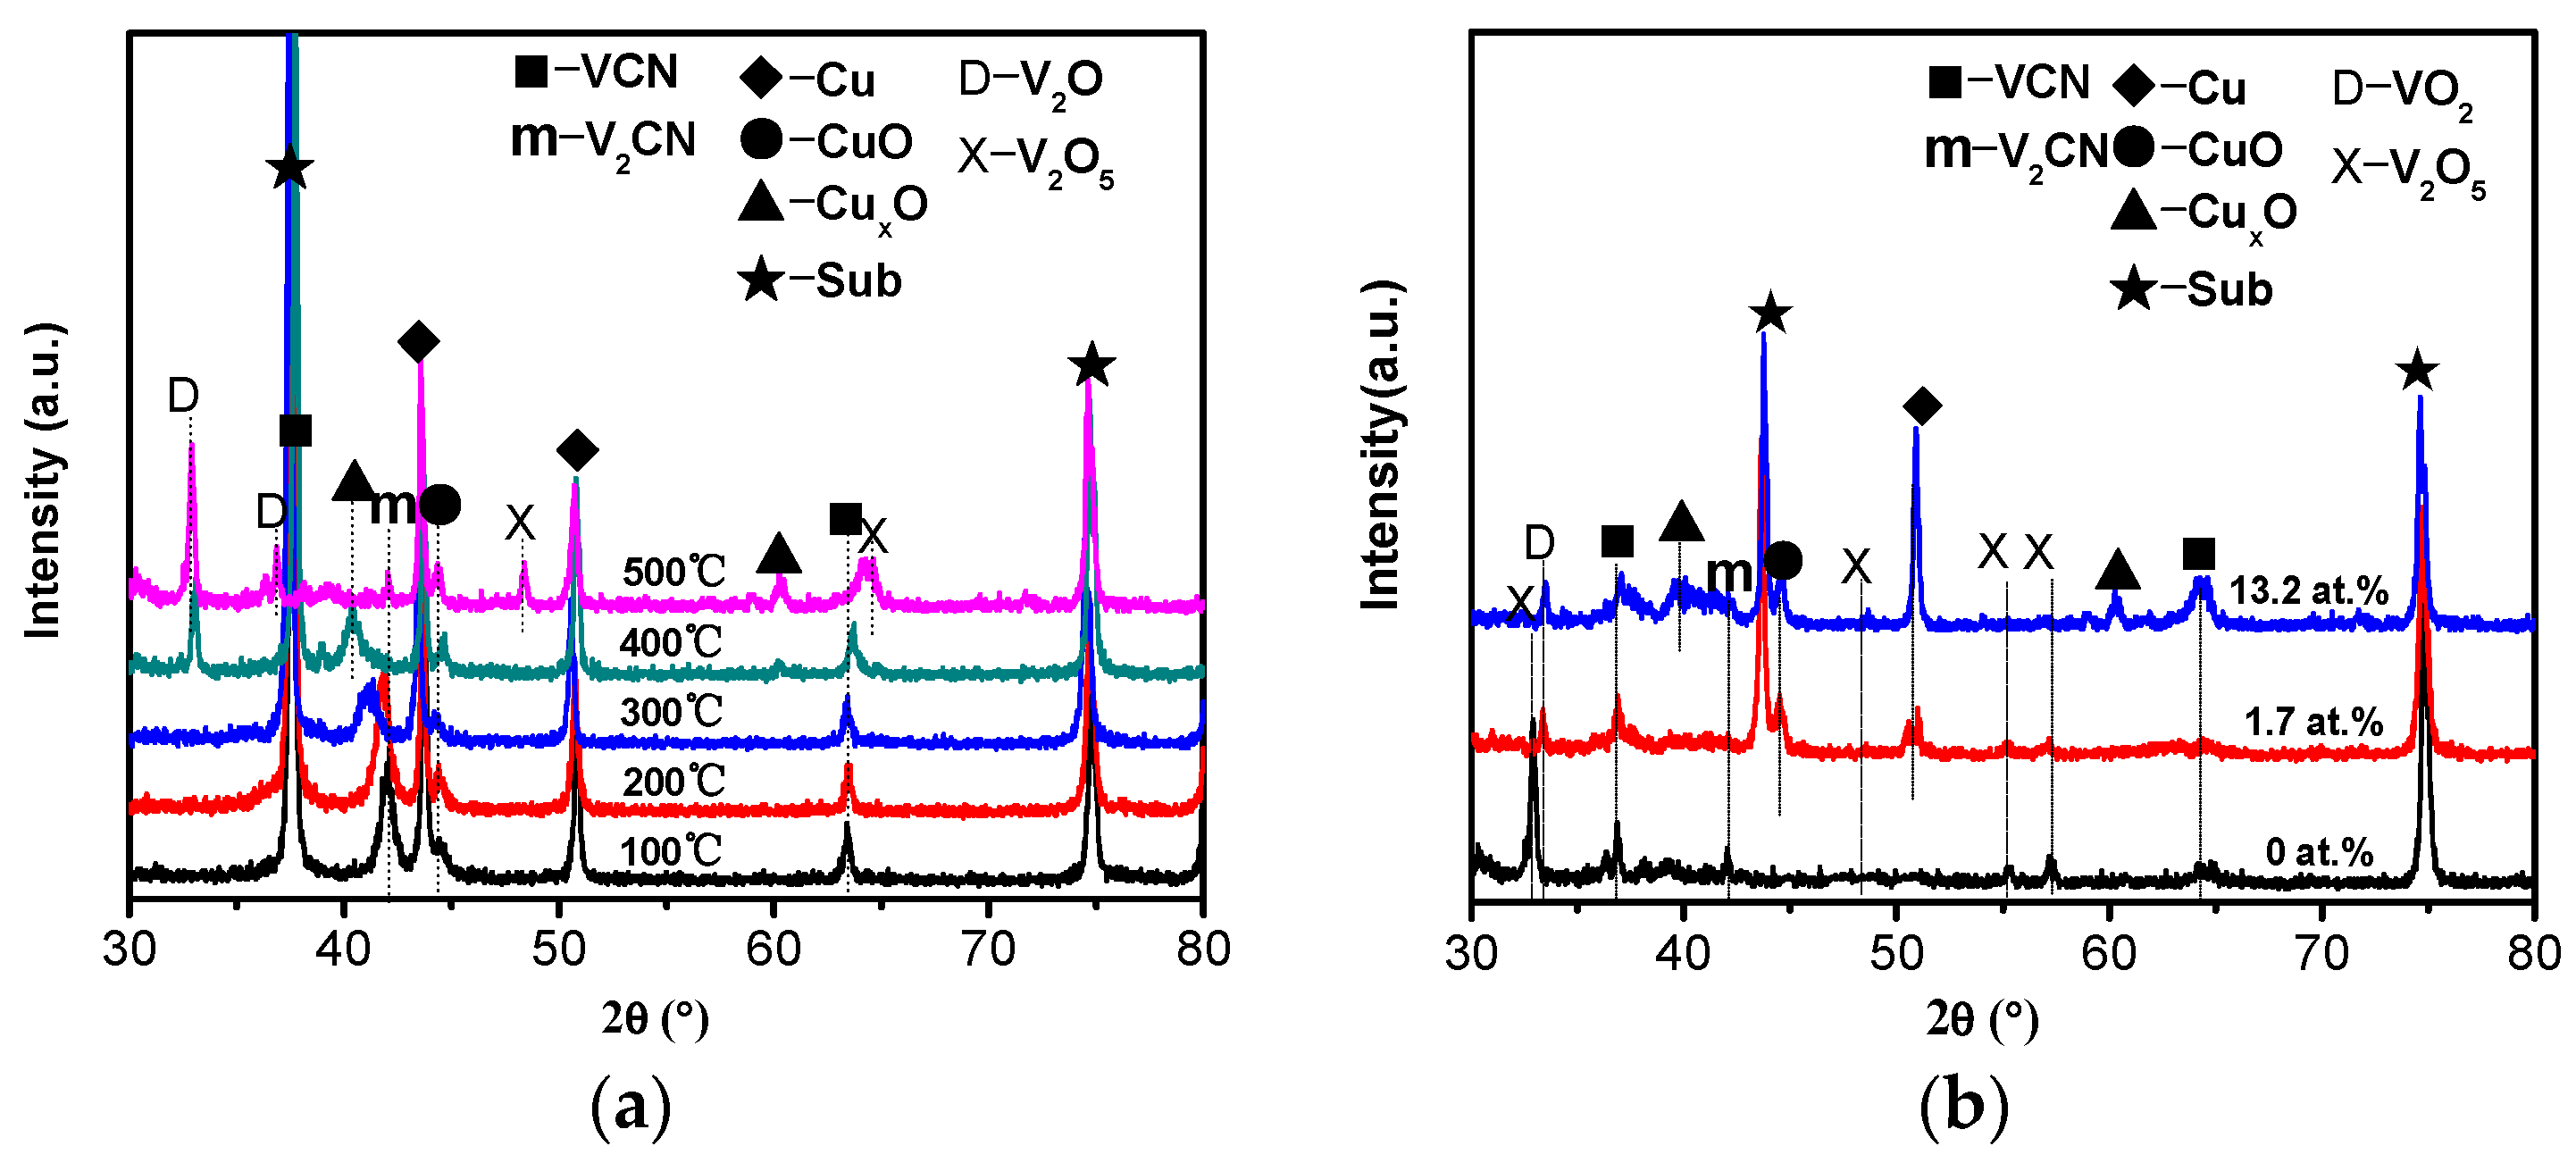
XRD patterns of VCN–Cu films with different Cu contents are presented in Figure 1. As shown, XRD patterns of VCN–Cu films with different Cu contents are presented in Figure 1. As shown, for VCN film, three peaks are detected, which are corresponding to the face-centered cubic (fcc) VN (111) (JCPDF 35-0768), hexagonal close-packed (hcp) V2N (111) (JCPDF 32-1413) and fcc-VN (220) (JCPDF 35-0768), where some N atoms in VN and V2N lattices are replaced by C atoms. The incorporation of Cu does not change the crystal structure. The preferred orientation of the films is (111). Moreover, no diffraction peaks corresponding to Cu and Cu compounds are detected. We utilized other characterization techniques to analyze the Cu phase in this paper later. A contribution to the shift of peaks, maybe due to the compressive stress in the VCN–Cu films [21].
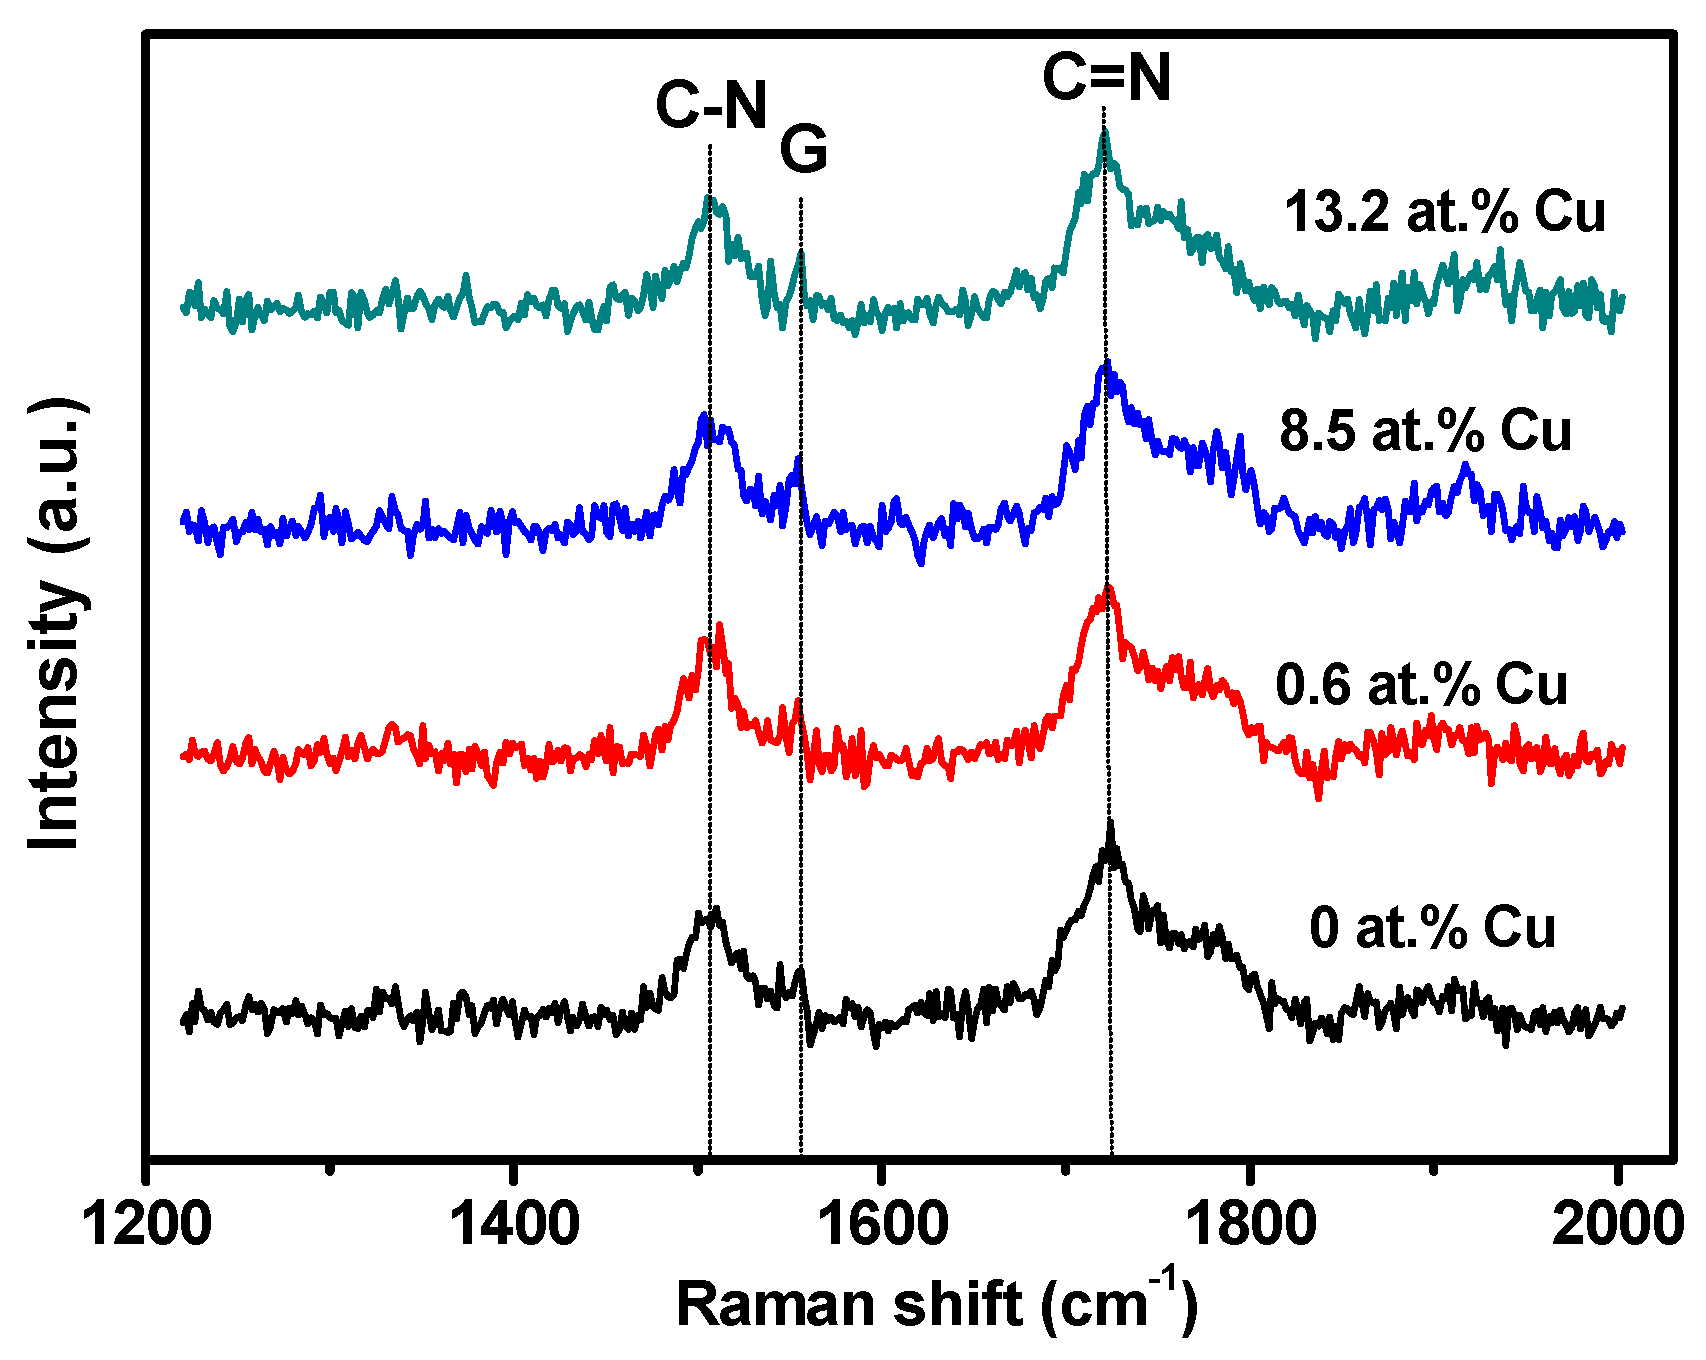
In order to obtain further information about the carbon containing phase, the Raman spectrum test of VCN–Cu films are conducted, and the results are shown in Figure 2. As shown, a resolved peak located at 1560 cm−1 can be ascribed to the G (graphitic) absorption band of carbon [22]. Two peaks are detected at 1506 cm−1 and 1720 cm−1, which are associated with C–N and C=N absorption bands of CNx [23]. The formation of amorphous will produce higher interface energy. When compared with amorphous graphite, VCN solid solution are more easily formed under the same conditions due to the minimum energy principle. After the solid solution are saturated, amorphous graphite phases begin to form. As shown in Table 2, the V:C ratio is always about 2:1, and the G (graphitic) absorption peak detected in Figure 2 represents that the VCN solid solution have already been saturated at 0 at.% Cu. Therefore, as the Cu content increases from 0 at.% to 13.21 at.%, the Raman peaks do not change significantly.
In order to further confirm the state of Cu in the VCN–Cu films, TEM, HR-TEM images and corresponding selected area electron diffraction (SAED) patterns of VCN–1.7 at.% Cu and VCN–13.2 at.% Cu films are shown in Figure 3 and Figure 4.
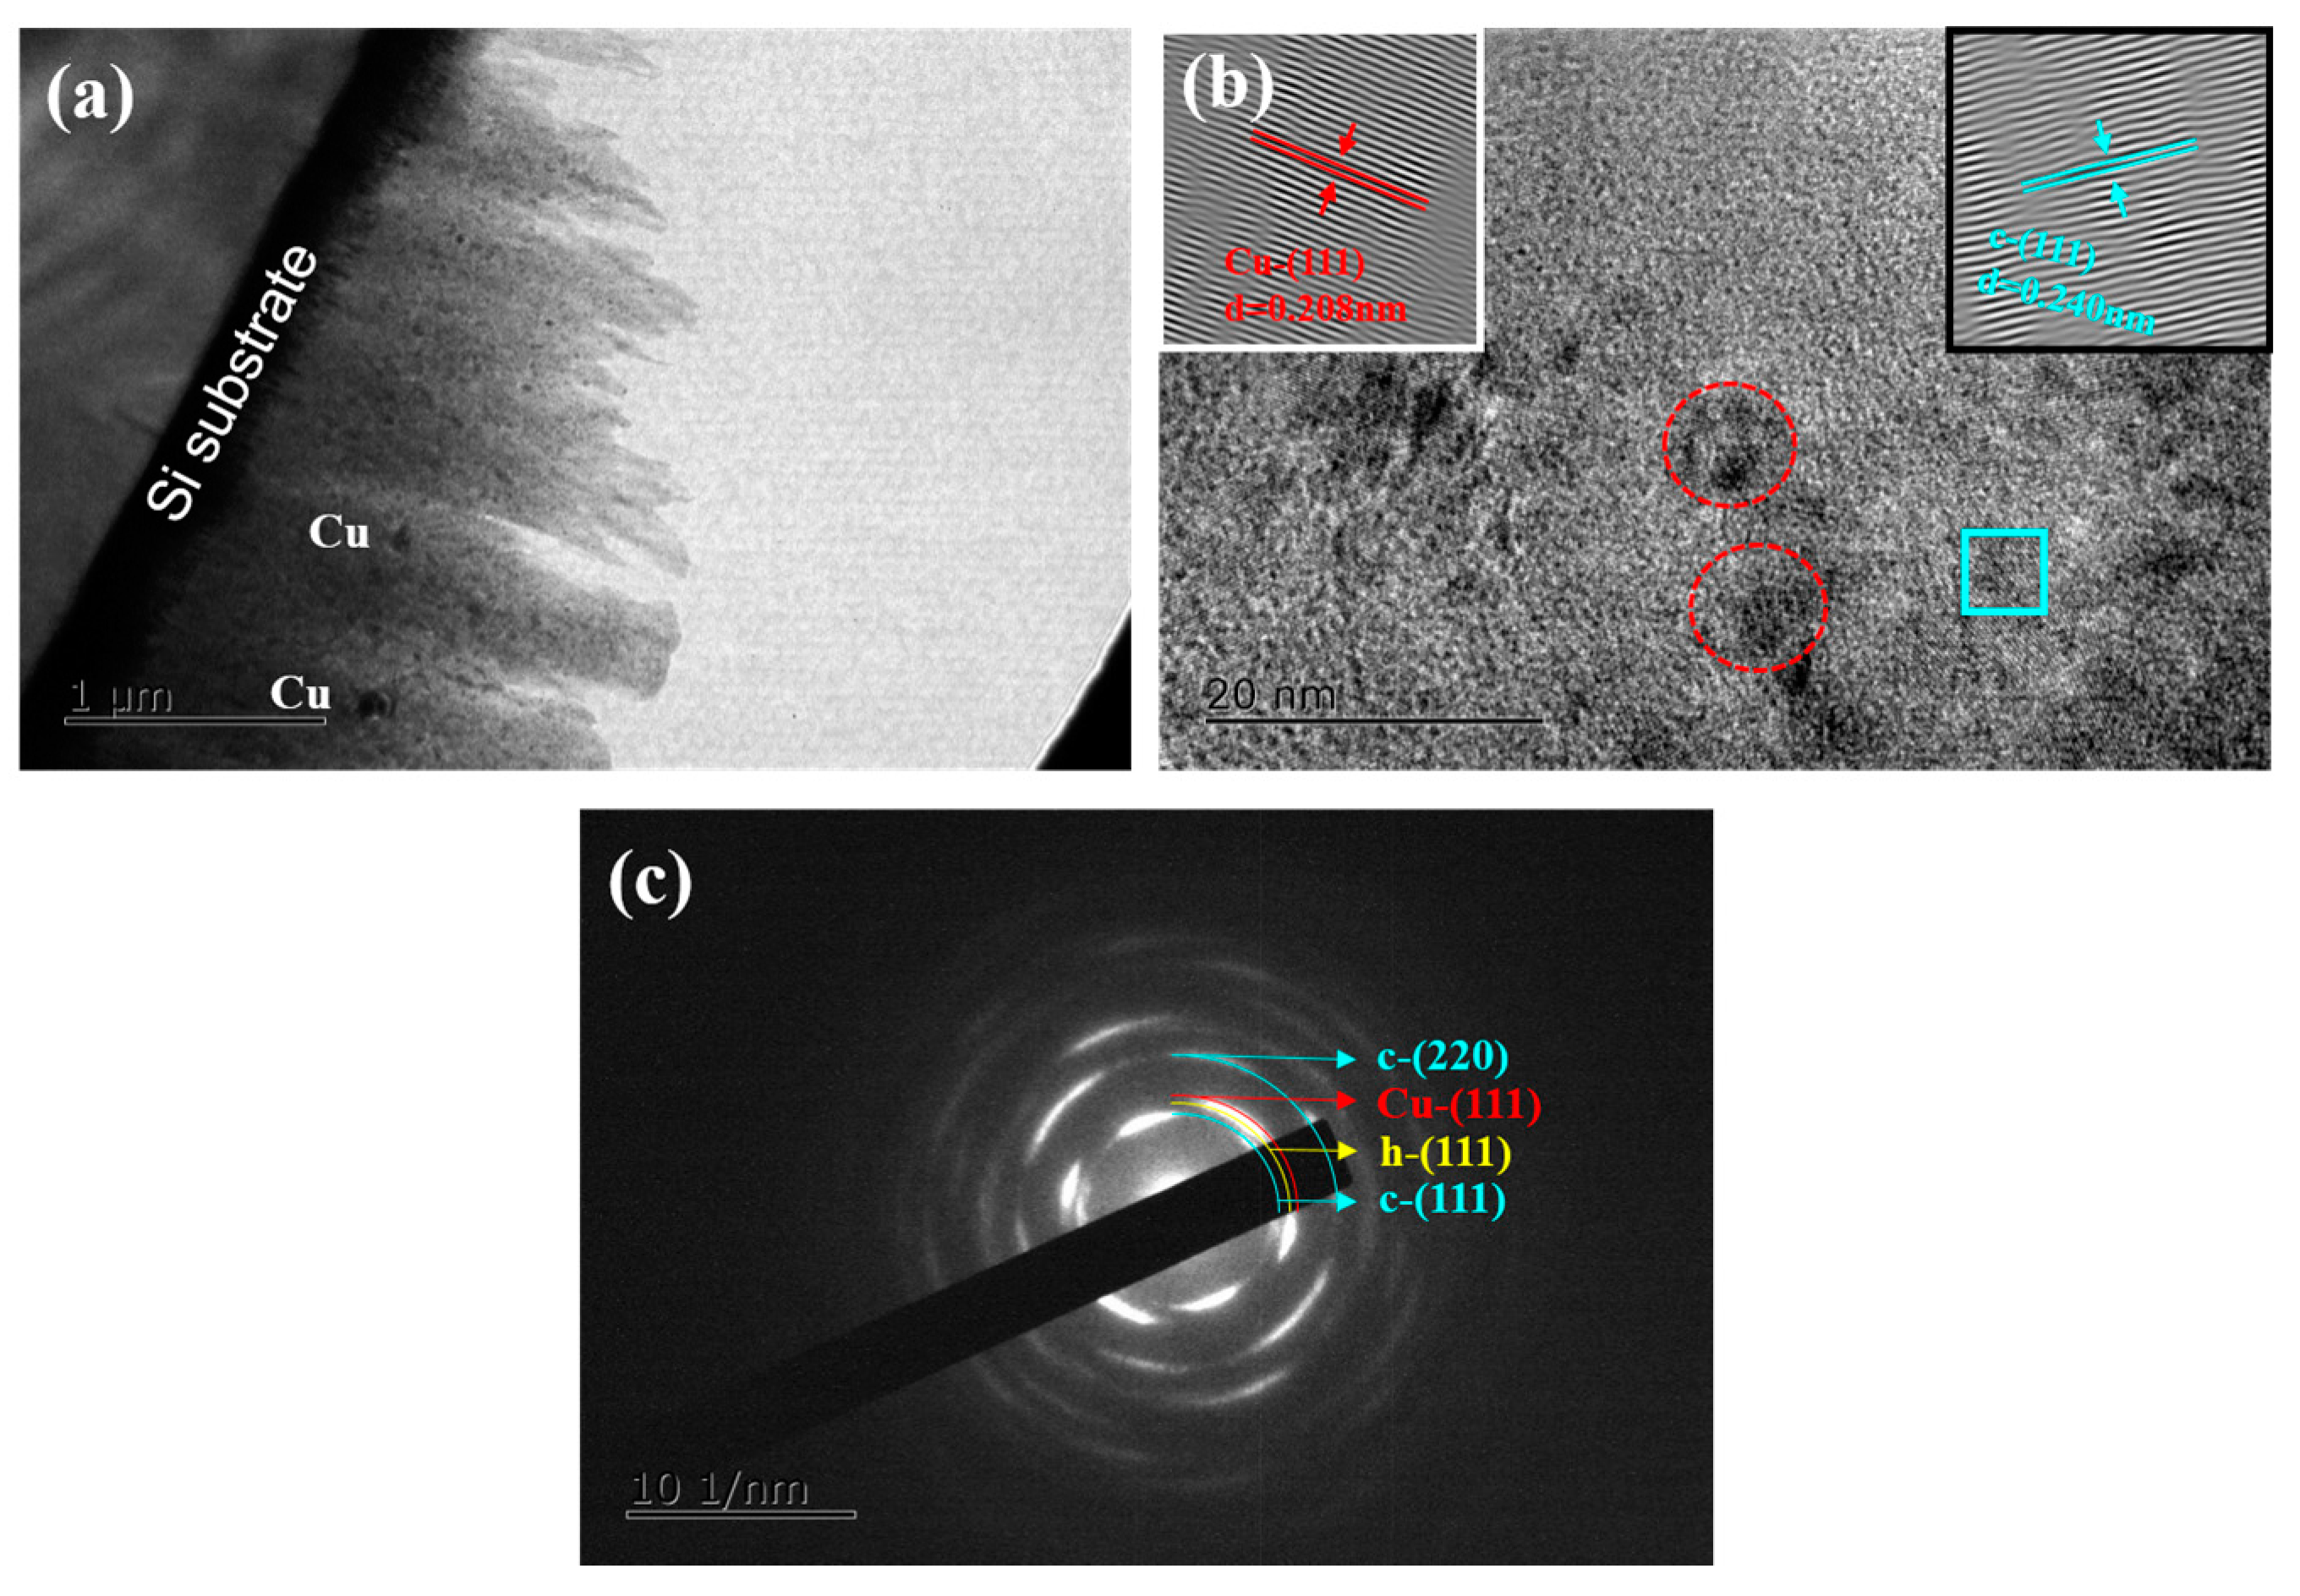
As shown in Figure 3a,b, three sets of lattice fringes with lattice spacing of about 0.240, 0.218 and 0.208 nm (standard value: d(fcc-VN (111)) = 0.238 nm; d(fcc-V₂N (111)) = 0.215 nm; d(fcc-Cu (111)) = 0.208) are observed, which is corresponding to fcc-VCN (111), hcp-V2CN (111), and fcc-Cu (111). Figure 3c is selected area electron diffraction (SAED) pattern of VCN–1.7 at.% Cu film, showing fcc-VCN (111), hcp-V2CN (111), fcc-Cu (111), and fcc-VCN (220) diffraction rings.
As shown in Figure 4a, the VCN–Cu film exhibits a columnar crystal texture, also showing that the adding Cu particles are well dispersed in the film. Fast Fourier Transform (FFT) are carried out on the film in Figure 4b. The lattice fringes with lattice spacing of 0.208 and 0.240 nm are detected, these value are almost the same as the calculated HR-TEM value for fcc-Cu (111) and fcc-VCN (111). Ezirmik et al. [24] prepared CrN–Cu composite films found that crystalline Cu distributed in the grain boundary of the CrN film.The corresponding SAED pattern in Figure 4c also show the diffraction rings of fcc-VCN, hcp-V2CN, and fcc-Cu. Thus, Cu probably distributed in the VCN grain boundaries in this study.
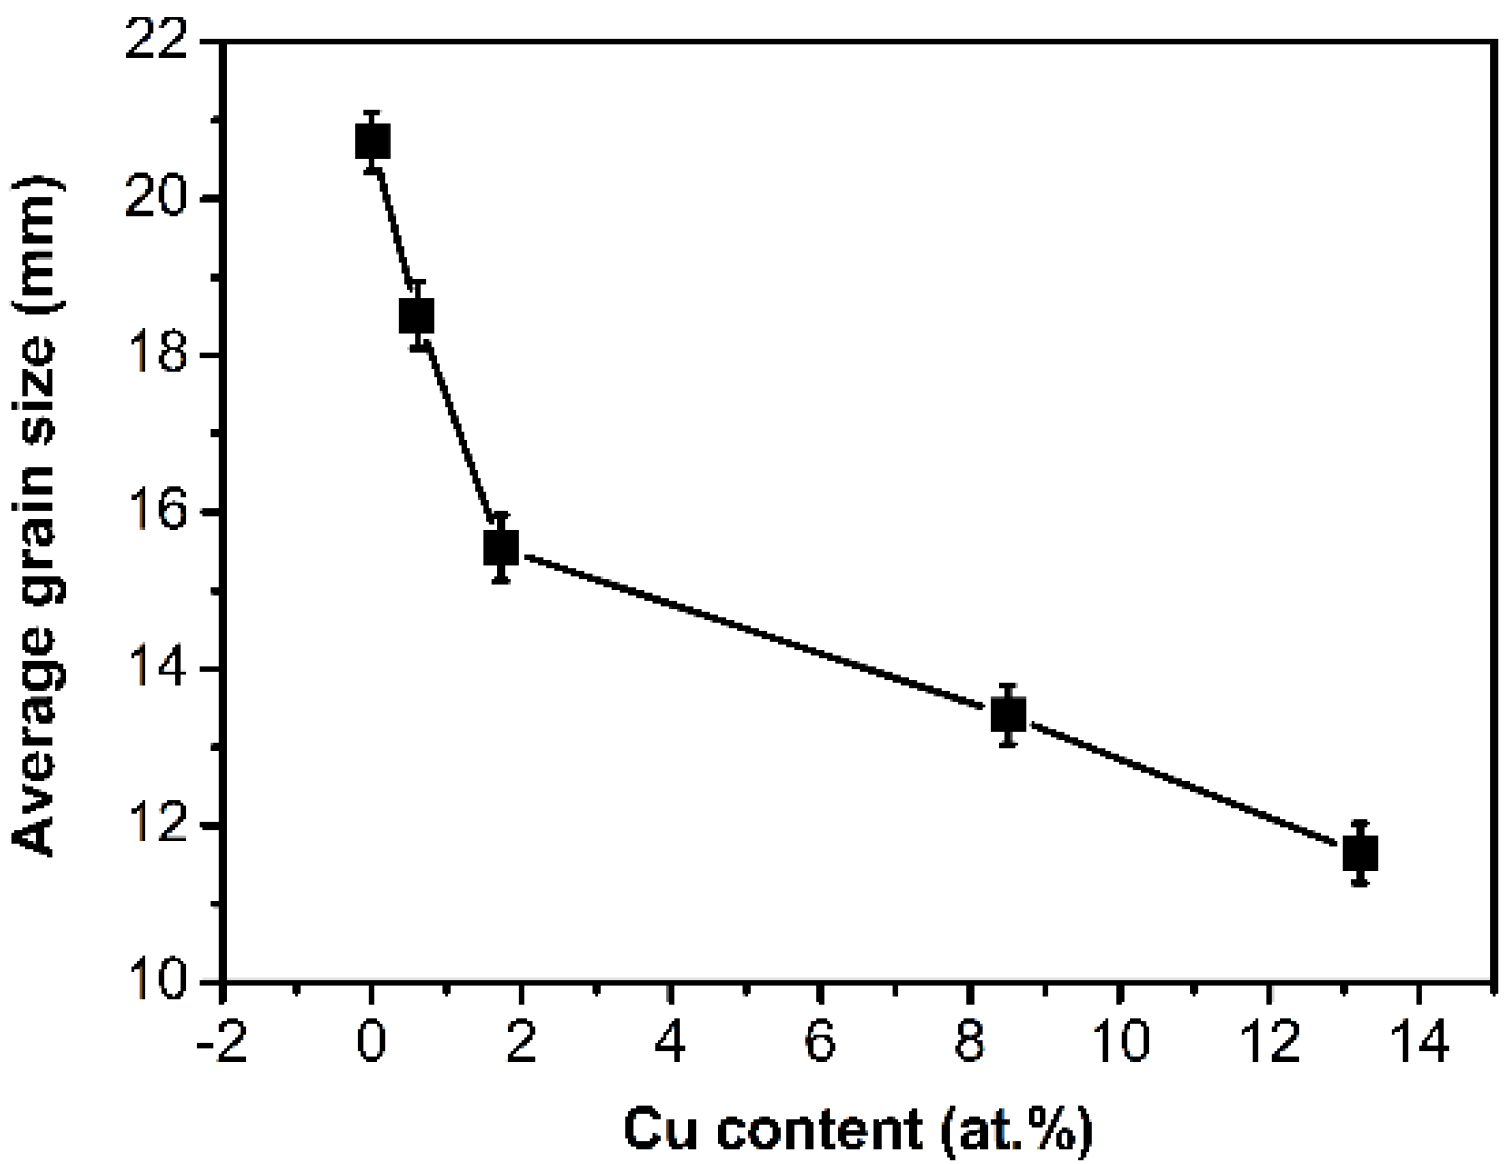
Based on the classical Debye-Scherer equation, the average grain sizes were calculated according to the values of λ and B listed in Table 3. Three measurements were made for each value. The results are shown in Figure 5, the grain size of VCN–Cu decreases gradually with the increase of Cu content, and reached a minimum value of 11.65 nm at 13.2 at.% Cu. This is due to VCN grains are forced to re-nucleate on the top of Cu and the presence of Cu in the grain boundaries could also inhibit the VCN grains growth [5,25]. In Figure 1, the Cu phase was not detected even at the highest Cu content of 13.2 at.% , which is due to the large number of small sizes of Cu grains dispersed in the film. For XRD, it is not enough to meet the crystallographic plane of the Bragg condition. But, in the Figure 3a, the diffraction ring of Cu can be detected even with 1.7 at.% Cu.
Based on the analysis of XRD, Raman, and HR-TEM, the VCN–Cu films consist of fcc-VCN, hcp-V2CN, fcc-Cu phase, and amorphous graphite and CNx phase. Besides, the Cu particles are disperse in the films.
3.2. Mechanical Properties
The hardness (H) and residual stress (σ) of VCN–Cu films with different Cu contents are shown in Figure 6. The H of ternary VCN film is 28.0 GPa. The hardness increases slightly then decreases with a maximum value of 32 GPa at 0.6 at.% Cu. Meanwhile, the residual stress increases then decreases with a maximum value of −1.94 GPa at 0.6 at.% Cu (the negative sign indicates that the residual stress is compressive).
According to the analysis of microstructure, VCN (HVN: ~21 GPa [26]), V2CN (HV₂N: 25 GPa [26]), Cu (3 GPa [5]), graphite C (2 GPa [4]), and CNx (15.8 GPa [27]) consist in VCN–Cu films. With the increase of Cu content, the Cu phase increases while other phases decrease per unit area.
There are several models that can probably affect the hardness: solid solution strengthening, “Hall-Patch” relationship (refined crystalline strengthening), stress intensification, dispersion strengthened, and so on. As the content of Cu was 0 at.%, the hardness of VCN in this study are higher than that of VN. The reason is that the solid solution leads to lattice distortion which formed the alternating stress field, thus bring a higher hardness. Since the C has reached saturation at 0 at.% Cu, the effect of solid solution strengthening on all types of VCN–Cu films is the same. As the content of Cu reaches 0.6 at.%, the hardness enhancement was mainly attributed to the effect of fine grain strengthening and residual stress [5,27]. At this point, the compressive stress reaches the maximum value of −1.94 GPa. As the content of Cu continue increase to 13.2 at.%, the decrease of hardness is mainly due to a drop of VCN and V2CN phases and compressive stress value, and a rise of low hardness soft Cu phase. All of these factors simultaneously resulted in a decline in the hardness of films. However, Cu particles are well disperse in the VCN matrix, but the movement of dislocations cannot be impeded due to softer Cu phase, thus the dispersion strengthened mechanism fail to apply in our paper [17,28].
3.3. Friction and Wear Properties
3.3.1. Friction and Wear Properties at Room Temperature
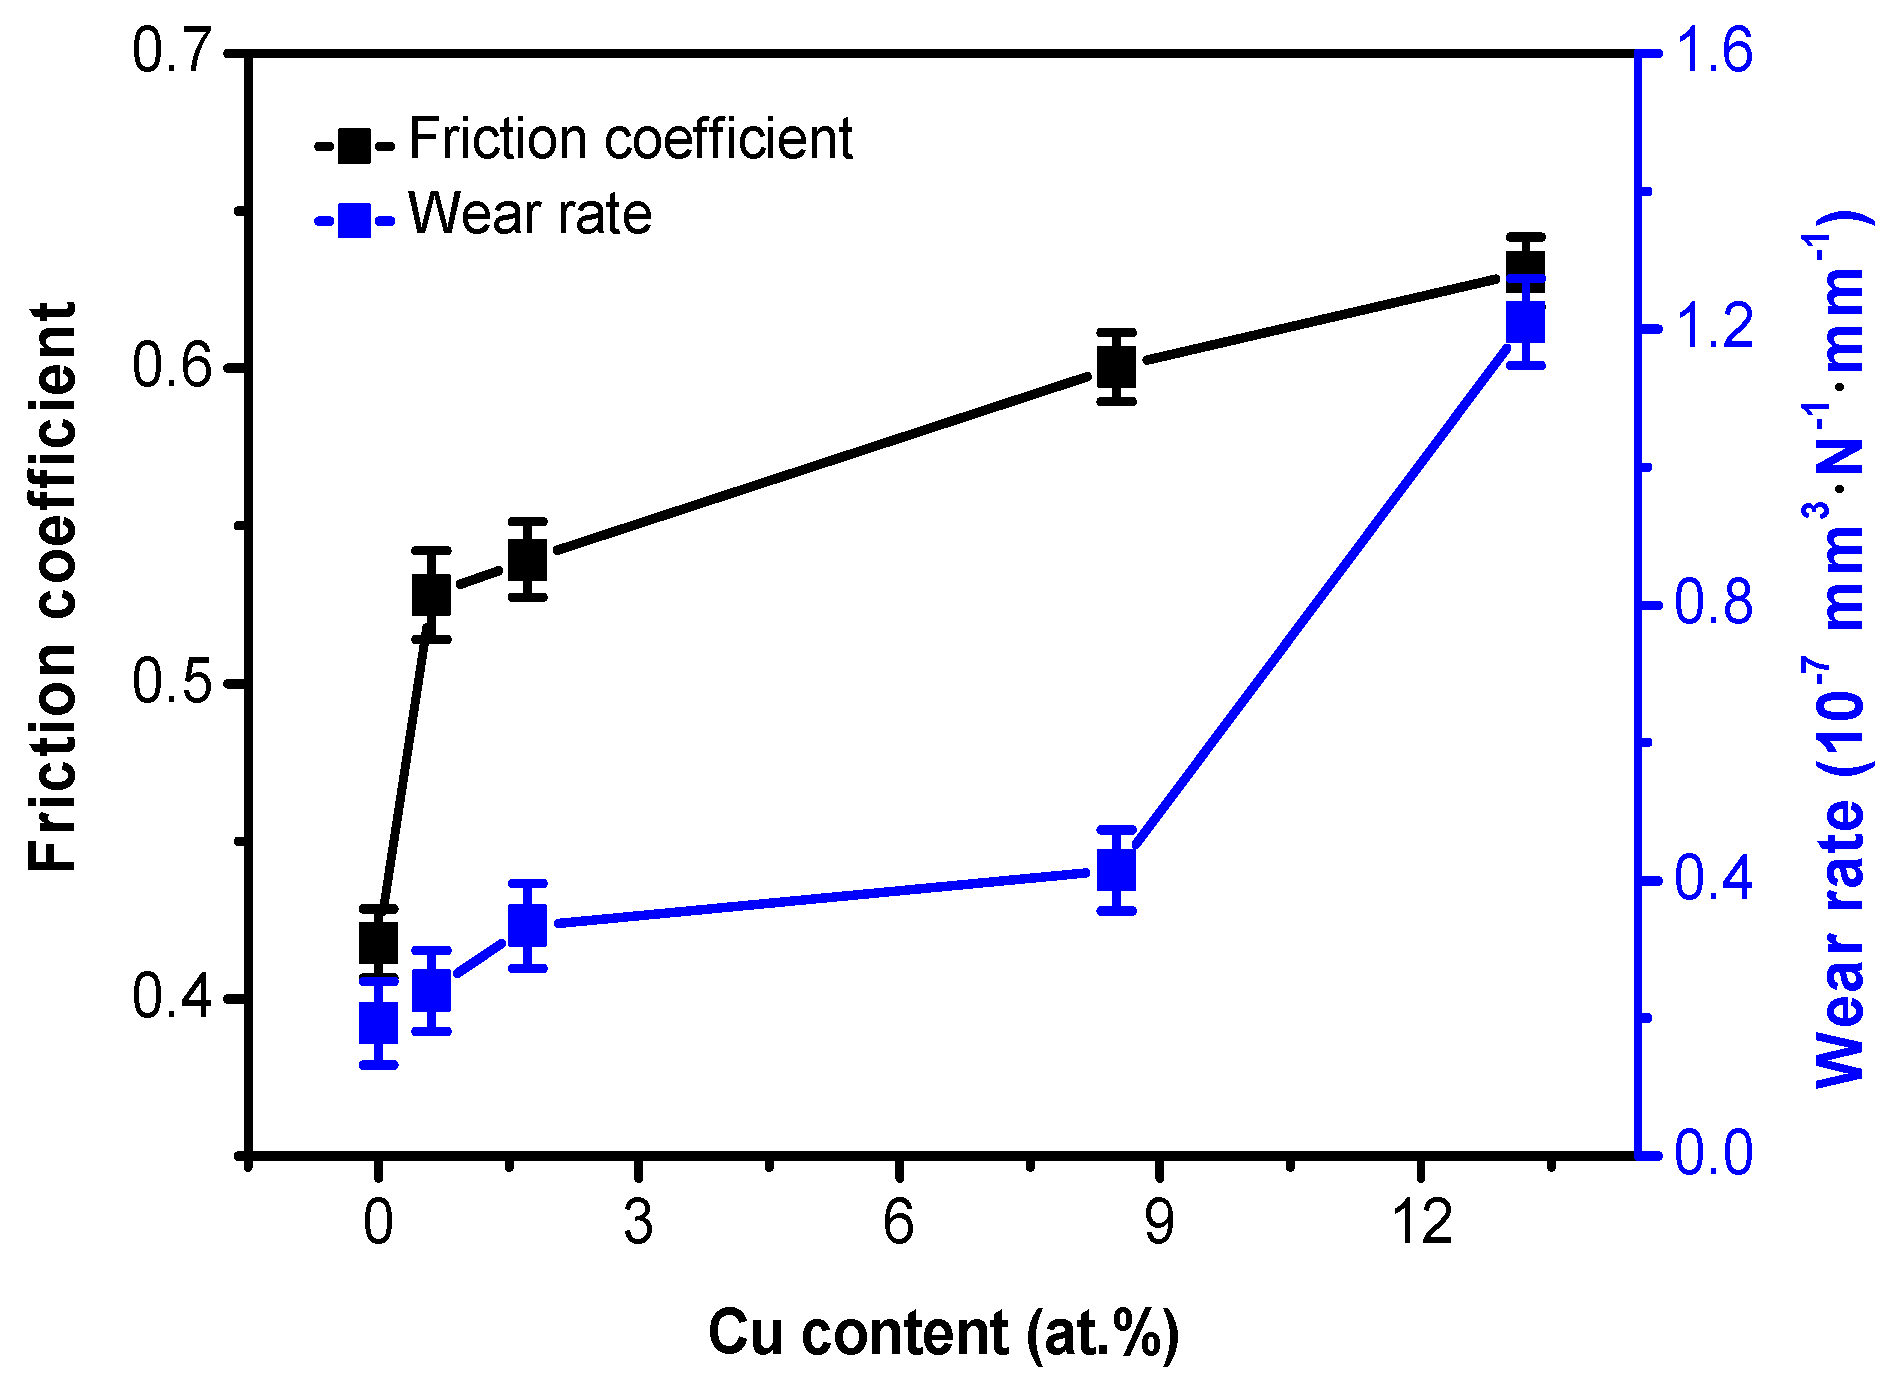
Figure 7 shows the average friction coefficients and wear rate of VCN–Cu films with different Cu contents at room temperature. As shown, the average friction coefficient and wear rate of VCN film are ~0.42 and 0.193 × 10⁻⁷ mm3·N−1·m−1. With the increase of Cu content, the average friction coefficient, and wear rate increase gradually. As the content of Cu is 13.2 at.%, the friction coefficient and wear rate reach the maximum values of 0.63 and 1.21 × 10⁻⁷ mm3·N−1·m−1, respectively.
At room temperature, the relatively high CoF of the Cu-doped VCN films can be explained by the decrease of V and C content, which provide the lubrication phase. The wear rate of the films are mainly affected by its mechanical properties [5,28]. The decrease of the hardness of the film would lead to the increase of the contact area between the film and the friction pair. This subsequently causes the deformation of the film and shearing to form wear debris. Then wear rate increase [29,30]. Besides, the addition of copper weakens the bonding strength between grains. Zhang et al. [31] had reported that the surface of the film tended to produce physical adsorption and leaded to the falling off of the other nanoparticles with the increase of Cu. The falling spherical particles roll on the friction surface to cause abrasive wear and increased the wear rate. The more Cu added, the easier it is to form abrasive wear.
3.3.2. Friction and Wear Properties at Elevated Temperature
The friction coefficients and wear rates of VCN, VCN–1.7 at.% Cu and VCN–13.2 at.% Cu films in the temperature range of 100–500 °C are presented in Figure 8. As shown, as the temperature is constant, the friction coefficient decreases, but the wear rate increases with the increase of Cu content. As Cu content is constant, the friction coefficient first increases and then decreases while the wear rate increases with the increase of the temperature.
The XRD patterns of the wear track after sliding at different temperatures are shown in Figure 9. As shown in Figure 9a, Cu and CuO are detected in all the test samples, but VO2 and CuxO are only detected at 400 °C. At 500 °C, V2O5 is also detected. As shown in Figure 9b, at 500 °C, V2O5 and VO2 are detected for VCN film. Besides, CuxO and Cu are also detected for VCN–Cu films. In addition, with the increase of Cu content, the peak intensities of the V2O5 and VO2 decrease, the peak intensities of CuxO and Cu increase. This suggests that the content of V2O5 and VO2 phases on the wear track decrease and the content of CuxO and Cu increase.
In order to study the effect of oxides on the tribological properties at different temperatures, the relative content of phases existed in the films are calculated by using “Adiabatic method” [17]. The results are shown in Figure 10. As shown in Figure 9a and Figure 10a, the content of (VCN + V2CN) decreased, while the content of Cu, CuO, VO2, CuxO, and V2O5 increase gradually with the increase of the temperature. As shown in Figure 9b and Figure 10b, the content of CuO and CuxO obviously increase, while the content of VO2 and V2O5 decrease gradually.
As the testing temperature increased, the water vapor in the environment disappeared, and C and CNx phase generated CO2 [32]. The increase in friction coefficient between 25 and 300 °C was mainly due to the sp2 structure of C been gradually destroyed leading to the disappearance of their role as solid lubricant, combined with the disappearance of the adsorption on the films surface [17,32]. Meanwhile the content of Magneli phase V2O5 is relatively low, hence, cannot effectively reduce the friction. Between 300 and 500 °C, the friction coefficient of VCN–Cu composite films decrease significantly. The content of Magneli phases V2O5 and VO2 [33] increase enough to reduce the friction coefficient. In addition, Erdemir et al. [34] pointed out that when the oxides were more than one in the high-temperature friction system, the larger difference in the ionization potential of the oxides, the better lubrication effect. The ionization potentials of CuO and V2O5 are 2.74 [29] and 8.4 [34]. The difference between CuO and V2O5 could decrease the friction coefficient of the films. The increase of wear rate is mainly due to the metal adhesive that was caused by copper on the surface [17,31], the increase of oxides (CuOx and VOx), which can be worn away easily by the counterpart during the wear test due to its low shear strength.
The SEM images of the wear track of VCN and VCN–13.2 at.% Cu films at 300 and 500 °C are presented in Figure 11. When compared with 300 °C, the wear scars of the films become wider and deeper after sliding at 500 °C. At high temperatures, oxidation of the film is intensified and some wear debris (particles) are found in the wear track. When compared with VCN, more furrows and deeper wear marks are observed for VCN–Cu film at the same temperature.
4. Conclusions
In summary, VCN–Cu film was deposited using reactive magnetron sputtering:
- VCN–Cu films were consisted of a mixture of fcc-VCN, hcp-V2CN, fcc-Cu, amorphous graphite and CNx phase.
- The hardness of VCN–Cu films first increased and then decreased with the increase of Cu content.
- At room temperature, the friction coefficient and wear rate increased with an increasing Cu content.
- In the temperature range of 100–500 °C, the friction coefficient of VCN–Cu film was lower than VCN film, while the wear rate showed the opposite trend. The incorporation of Cu improved the friction properties, but failed to improve the wear resistance.
Acknowledgments
Especially thanks to the financial support from National Natural Science Foundation of China (Grant No. 51374115 and 51574131).
Author Contributions
Lihua Yu conceived and designed the experiments; Lihua Yu and Fanjing Wu performed the experiments and analyzed the data; Hongbo Ju and Junhua Xu contributed to data analysis; Lihua Yu wrote the paper; all authors participated and discussed this work and contributed to the submitted and published manuscript.
Conflicts of Interest
The authors declare no conflict of interest.
References
- Pappacena, K.E.; Singh, D.; Ajayi, O.O.; Routbort, J.L.; Erilymaz, O.L.; Demas, N.G.; Chen, G. Residual stresses, interfacial adhesion and tribological properties of MoN/Cu composite coatings. Wear 2012, 278, 62–70. [Google Scholar] [CrossRef]
- Stone, D.S.; Migas, J.; Martini, A.; Smith, T.; Muratore, C.; Voevodin, A.A.; Aouadi, S.M. Adaptive NbN/Ag coatings for high temperature tribological applications. Surf. Coat. Technol. 2012, 206, 4316–4321. [Google Scholar] [CrossRef]
- Caicedo, J.C.; Zambrano, G.; Aperador, W.; Escobar–Alarcon, L.; Camps, E. Mechanical and electrochemical characterization of vanadium nitride (VN) thin films. Appl. Surf. Sci. 2011, 258, 312–320. [Google Scholar] [CrossRef]
- Wu, F.; Yu, L.; Ju, H.; Asempah, I.; Xu, J. Structural, mechanical and tribological properties of NbCN–Ag nanocomposite films deposited by reactive magnetron sputtering. Coatings 2018, 8, 50. [Google Scholar] [CrossRef]
- Suszko, T.; Gulbiński, W.; Jagielski, J. Mo2N/Cu thin films–the structure, mechanical and tribological properties. Surf. Coat. Technol. 2006, 200, 6288–6292. [Google Scholar] [CrossRef]
- Su, Y.; Yao, S.; Leu, Z.; Wei, C.; Wu, C. Comparison of tribological behavior of three films—TiN, TiCN and CrN—Grown by physical vapor deposition. Wear 1997, 213, 165–174. [Google Scholar] [CrossRef]
- Polcar, T.; Kubart, T.; Novák, R.; Kopecký, L.; Široký, P. Comparison of tribological behaviour of TiN, TiCN and CrN at elevated temperatures. Surf. Coat. Technol. 2005, 193, 192–199. [Google Scholar] [CrossRef]
- Auger, M.A.; Araiza, J.J.; Falcony, C.; Sánchez, O.; Albella, J.M. Hardness and tribology measurements on ZrN coatings deposited by reactive sputtering technique. Vacuum 2007, 81, 1462–1465. [Google Scholar] [CrossRef]
- Santecchia, E.; Hamouda, A.M.S.; Musharavati, F.; Zalnezhad, E.; Cabibbo, M.; Spigarelli, S. Wear resistance investigation of titanium nitride–based coatings. Ceram. Int. 2015, 41, 10349–10379. [Google Scholar] [CrossRef]
- Franz, R.; Mitterer, C. Vanadium containing self–adaptive low–friction hard coatings for high–temperature applications: A review. Surf. Coat. Technol. 2013, 228, 1–13. [Google Scholar] [CrossRef]
- Yu, L.; Li, Y.; Ju, H.; Xu, J. Microstructure, mechanical and tribological properties of magnetron sputtered VCN films. Surf. Eng. 2017, 33, 919–924. [Google Scholar] [CrossRef]
- Mu, Y.; Liu, M.; Zhao, Y. Carbon doping to improve the high temperature tribological properties of VN coating. Tribol. Int. 2016, 97, 327–336. [Google Scholar] [CrossRef]
- Mitterer, C.; Fateh, N.; Munnik, F. Microstructure–property relations of reactively magnetron sputtered VCxNy films. Surf. Coat. Technol. 2011, 205, 3805–3809. [Google Scholar] [CrossRef]
- Chao, M.; Rong, F. Formation and mechanism of the third body of copper under low and high friction speed. Sci. Technol. Eng. 2010, 15, 036. (In Chinese) [Google Scholar]
- Maruda, R.W.; Feldshtein, E.E.; Legutko, S.; Królczyk, G.M. Improving the efficiency of running-in for a bronze–stainless steel friction pair. J. Frict. Wear 2015, 36, 548–553. [Google Scholar] [CrossRef]
- Maruda, R.W.; Krolczyk, G.M.; Feldshtein, E.; Nieslony, P.; Tyliszczak, B.; Pusavec, F. Tool wear characterizations in finish turning of AISI 1045 carbon steel for MQCL conditions. Wear 2017, 372, 54–67. [Google Scholar] [CrossRef]
- Yu, L.; Zhao, H.; Ju, H.; Xu, J. Influence of Cu content on the structure, mechanical and tribological properties of W2N–Cu films. Thin Solid Films 2017, 624, 144–151. [Google Scholar] [CrossRef]
- Xu, J.; Chen, J.; Yu, L. Influence of Si content on the microstructure and mechanical properties of VSiN films deposited by reactive magnetron sputtering. Vacuum 2016, 131, 51–57. [Google Scholar] [CrossRef]
- Shi, J.; Muders, C.M.; Kumar, A.; Jiang, X.; Pei, Z.L.; Gong, J.; Sun, C. Study on nanocomposite Ti–Al–Si–Cu–N films with various Si contents deposited by cathodic vacuum arc ion plating. Appl. Surf. Sci. 2012, 258, 9642–9649. [Google Scholar] [CrossRef]
- Ye, F.; Zhao, H.; Tian, X. Influence of niobium addition on structure and mechanical properties of W–Nb–N coatings. Vacuum 2017, 144, 8–13. [Google Scholar] [CrossRef]
- Shtansky, D.V.; Bondarev, A.V.; Kiryukhantsev-Korneev, P.V.; Rojas, T.C.; Godinho, V.; Fernandez, A. Structure and tribological properties of MoCN–Ag coatings in the temperature range of 25–700° C. Appl. Surf. Sci. 2013, 273, 408–414. [Google Scholar] [CrossRef]
- Bondarev, A.V.; Golizadeh, M.; Shvyndina, N.V.; Shchetinin, I.V.; Shtansky, D.V. Microstructure, mechanical, and tribological properties of Ag-free and Ag-doped VCN coatings. Surf. Coat. Technol. 2017, 331, 77–84. [Google Scholar] [CrossRef]
- Carvalho, I.; Henriques, M.; Oliveira, J.C.; Alves, C.F.A.A.; Piedade, P.; Carvalho, S. Influence of surface features on the adhesion of Staphylococcus epidermidis to Ag–TiCN thin films. Sci. Technol. Adv. Mater. 2013, 14, 35009–35018. [Google Scholar] [CrossRef] [PubMed] [Green Version]
- Ezirmik, V.; Senel, E.; Kazmanli, K.; Erdemir, A.; Urgen, M. Effect of copper addition on the temperature dependent reciprocating wear behaviour of CrN coatings. Surf. Coat. Technol. 2007, 202, 866–870. [Google Scholar] [CrossRef]
- Tan, S.; Zhang, X.; Wu, X.; Fang, F.; Jiang, J. Comparison study on structure of Si and Cu doping CrN films by reactive sputtering. Appl. Surf. Sci. 2011, 257, 5595–5600. [Google Scholar] [CrossRef]
- Sanjinés, R.; Hones, P.; Lévy, F. Hexagonal nitride coatings: electronic and mechanical properties of V2N, Cr2N and δ-MoN. Thin Solid Films 1998, 332, 225–229. [Google Scholar] [CrossRef]
- Xu, X.; Zhuo, L.; Xia, D.; Wei, B.; Hao, X. Nanoindentation and friction/wear behaviors of magnetron sputtered CNx/SiC bilayer films on Titanium (TA2) substrate. Mocaxue Xuebao 2009, 29, 256–260. (In Chinese) [Google Scholar]
- Xu, J.; Ju, H.; Yu, L. Effects of Mo content on the microstructure and friction and wear properties of TiMoN films. Acta Metall. Sin. 2012, 48, 1132–1138. (In Chinese) [Google Scholar] [CrossRef]
- Yu, L.; Sun, C.; Xu, J. Cu Doping and improvement of mechanical and tribological properties of NbCN composite coating. Chin. J. Vac. Sci. Technol. 2016, 36, 377–384. (In Chinese) [Google Scholar]
- Wei, Y.; Gong, C. Effects of pulsed bias duty ratio on microstructure and mechanical properties of TiN/TiAlN multilayer coatings. Appl. Surf. Sci. 2011, 257, 7881–7886. [Google Scholar] [CrossRef]
- Zhang, Y.; Yan, J.; Sun, L.; Yang, G.; Zhang, Z.; Zhang, P. Friction reducing anti-wear and self-repairing properties of nano-Cu additive in lubricanting oil. J. Mech. Eng. 2010, 46, 74–79. (In Chinese) [Google Scholar] [CrossRef]
- Xu, J.; Cao, J.; Yu, L. Microstructures, mechannical properties and friction properties of TiVCN composite films. Acta Metall. Sin. 2012, 48, 555–560. (In Chinese) [Google Scholar] [CrossRef]
- Gassner, G.; Mayrhofer, P.H.; Kutschej, K.; Mitterer, C.; Kathrein, M. A new low friction concept for high temperatures: lubricious oxide formation on sputtered VN coatings. Tribol. Lett. 2004, 17, 751–756. [Google Scholar] [CrossRef]
- Erdemir, A. A crystal-chemical approach to lubrication by solid oxides. Tribol. Lett. 2000, 8, 97–102. [Google Scholar] [CrossRef]
Figure 1.
X-ray diffraction (XRD) patterns of VCN–Cu films with different Cu contents.

Figure 2.
Raman Patterns of VCN–Cu composited films with different Cu contents.

Figure 3.
(a) Selected area electron diffraction (SAED) pattern and (b,c) high resolution transmission electron microscopy (HR-TEM) observations of VCN–1.7 at.% Cu film.
Figure 3.
(a) Selected area electron diffraction (SAED) pattern and (b,c) high resolution transmission electron microscopy (HR-TEM) observations of VCN–1.7 at.% Cu film.
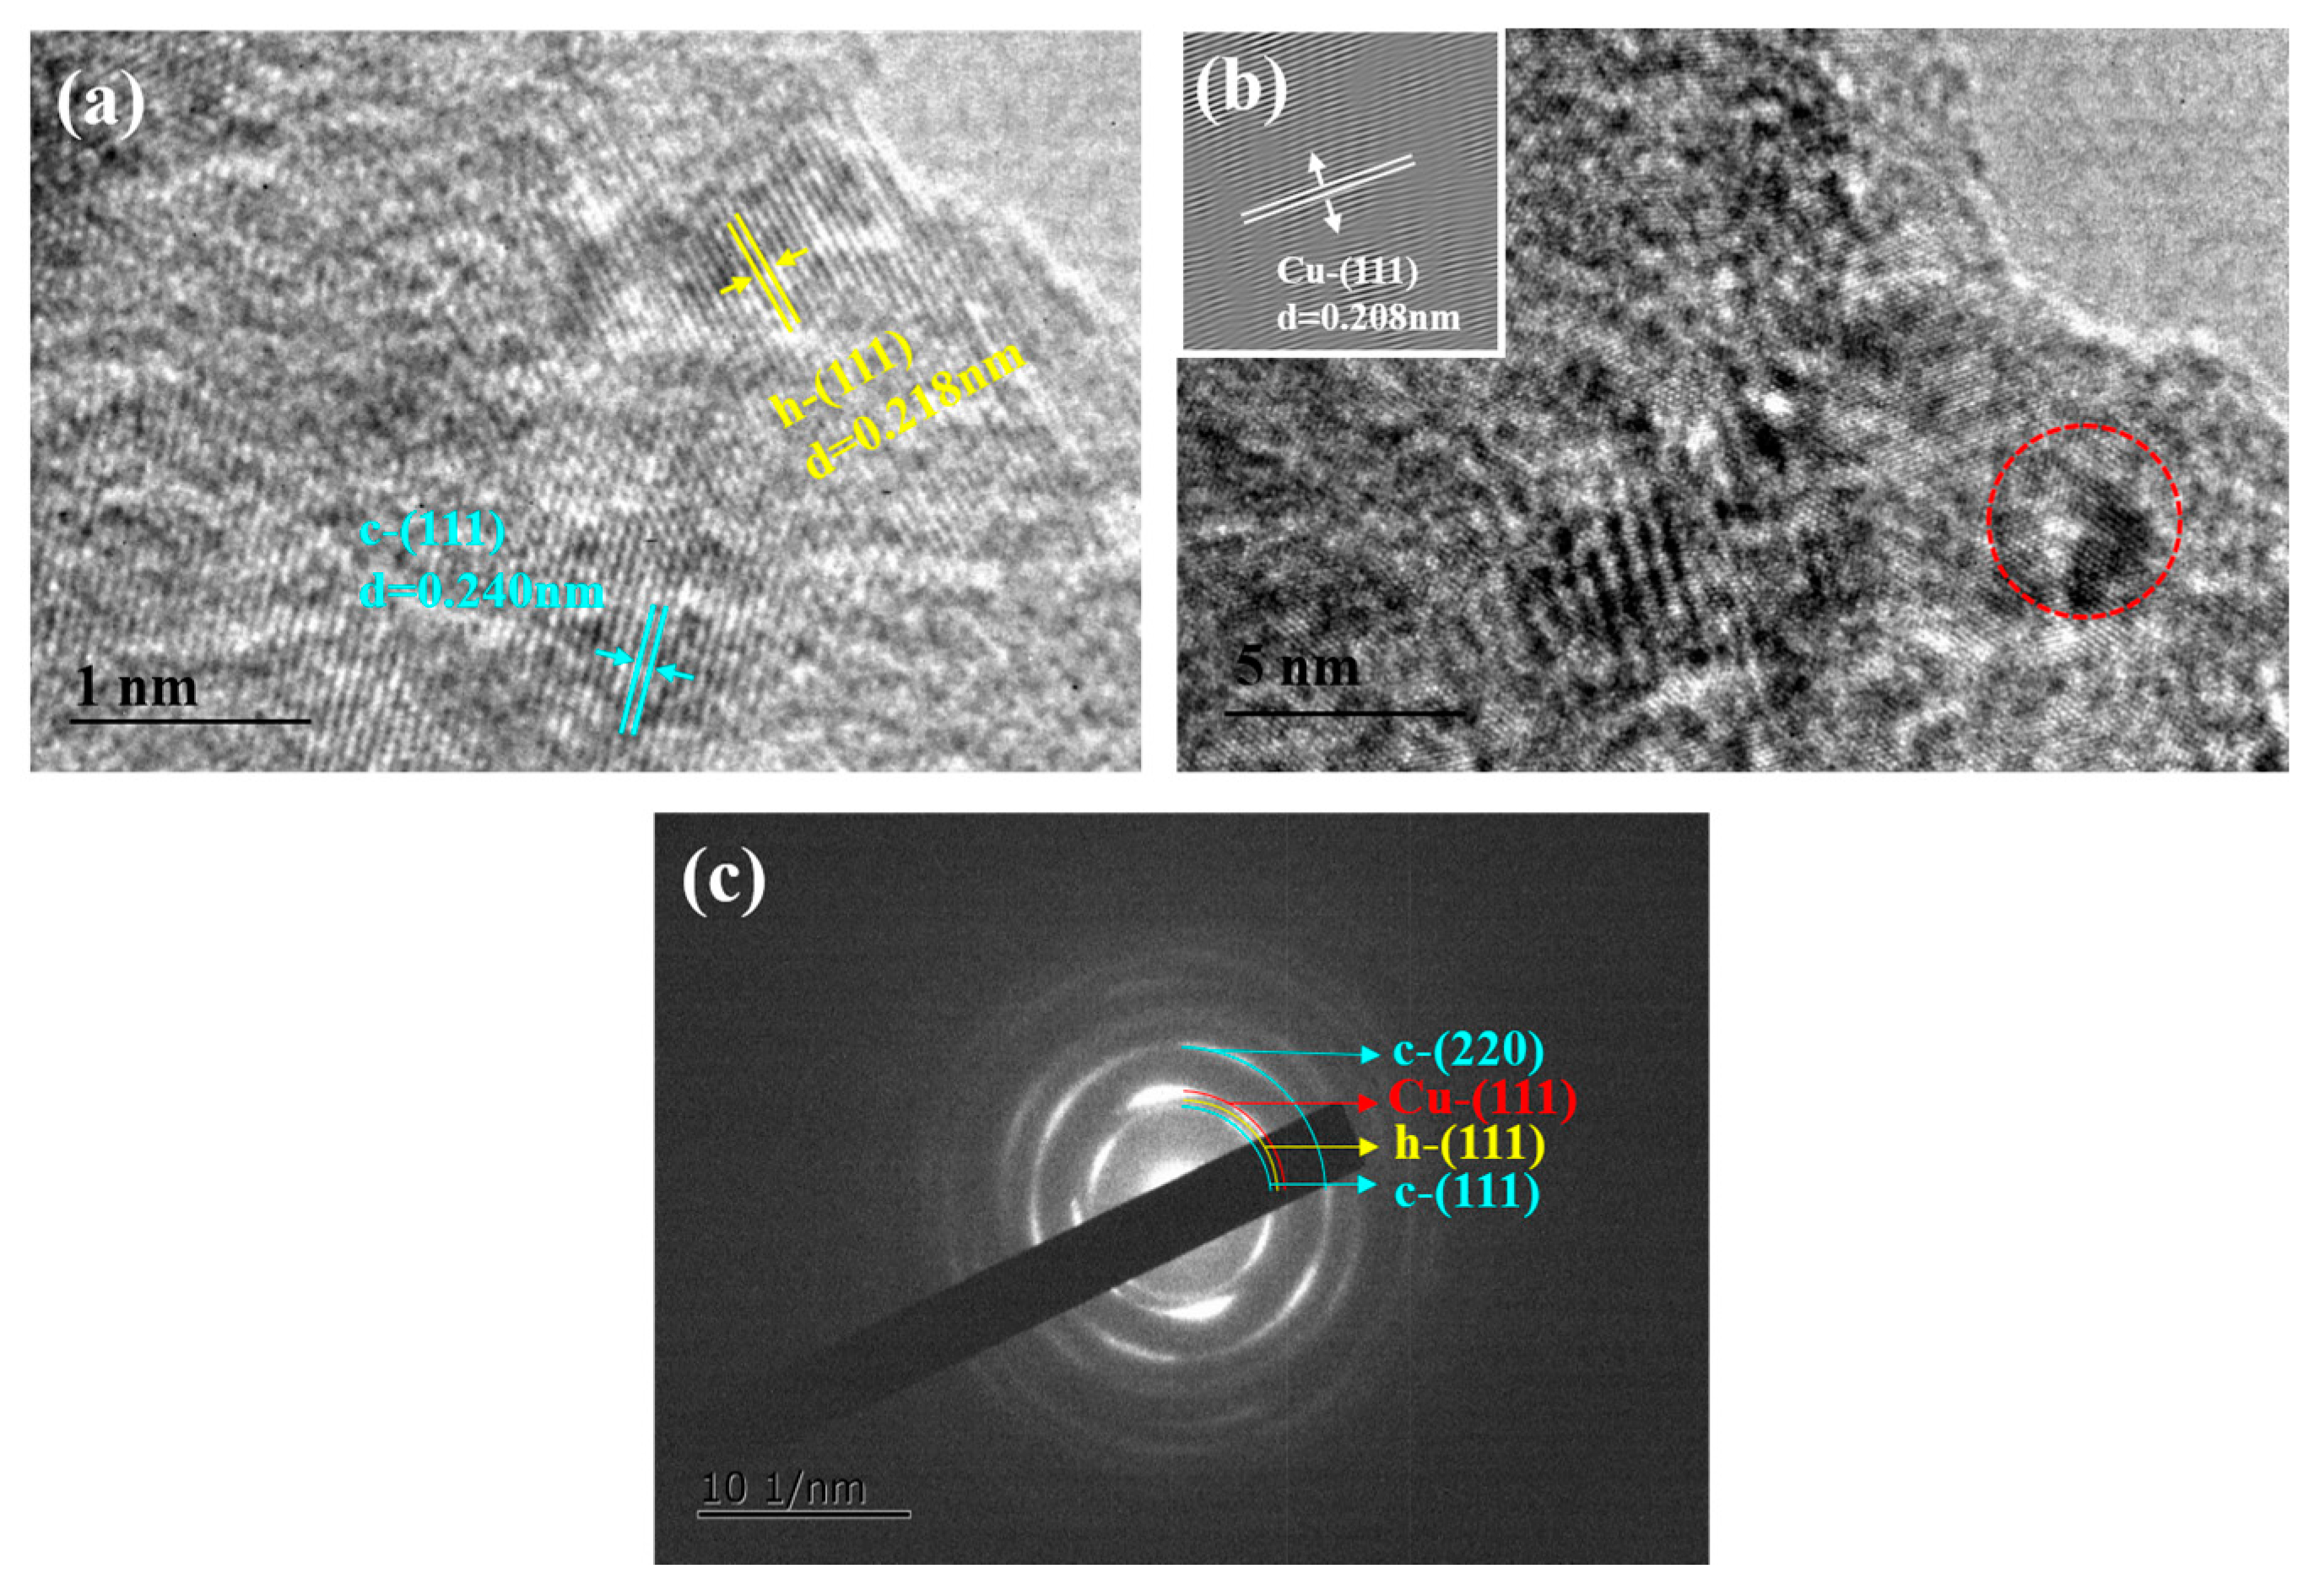
Figure 4.
(a) TEM, (b) SAED pattern, and (c) HR-TEM observations of VCN–13.2 at.% Cu film.

Figure 5.
Grain sizes of VCN–Cu composite films with different Cu contents.

Figure 6.
Micro-hardness and stress of VCN–Cu composite films with different Cu contents.
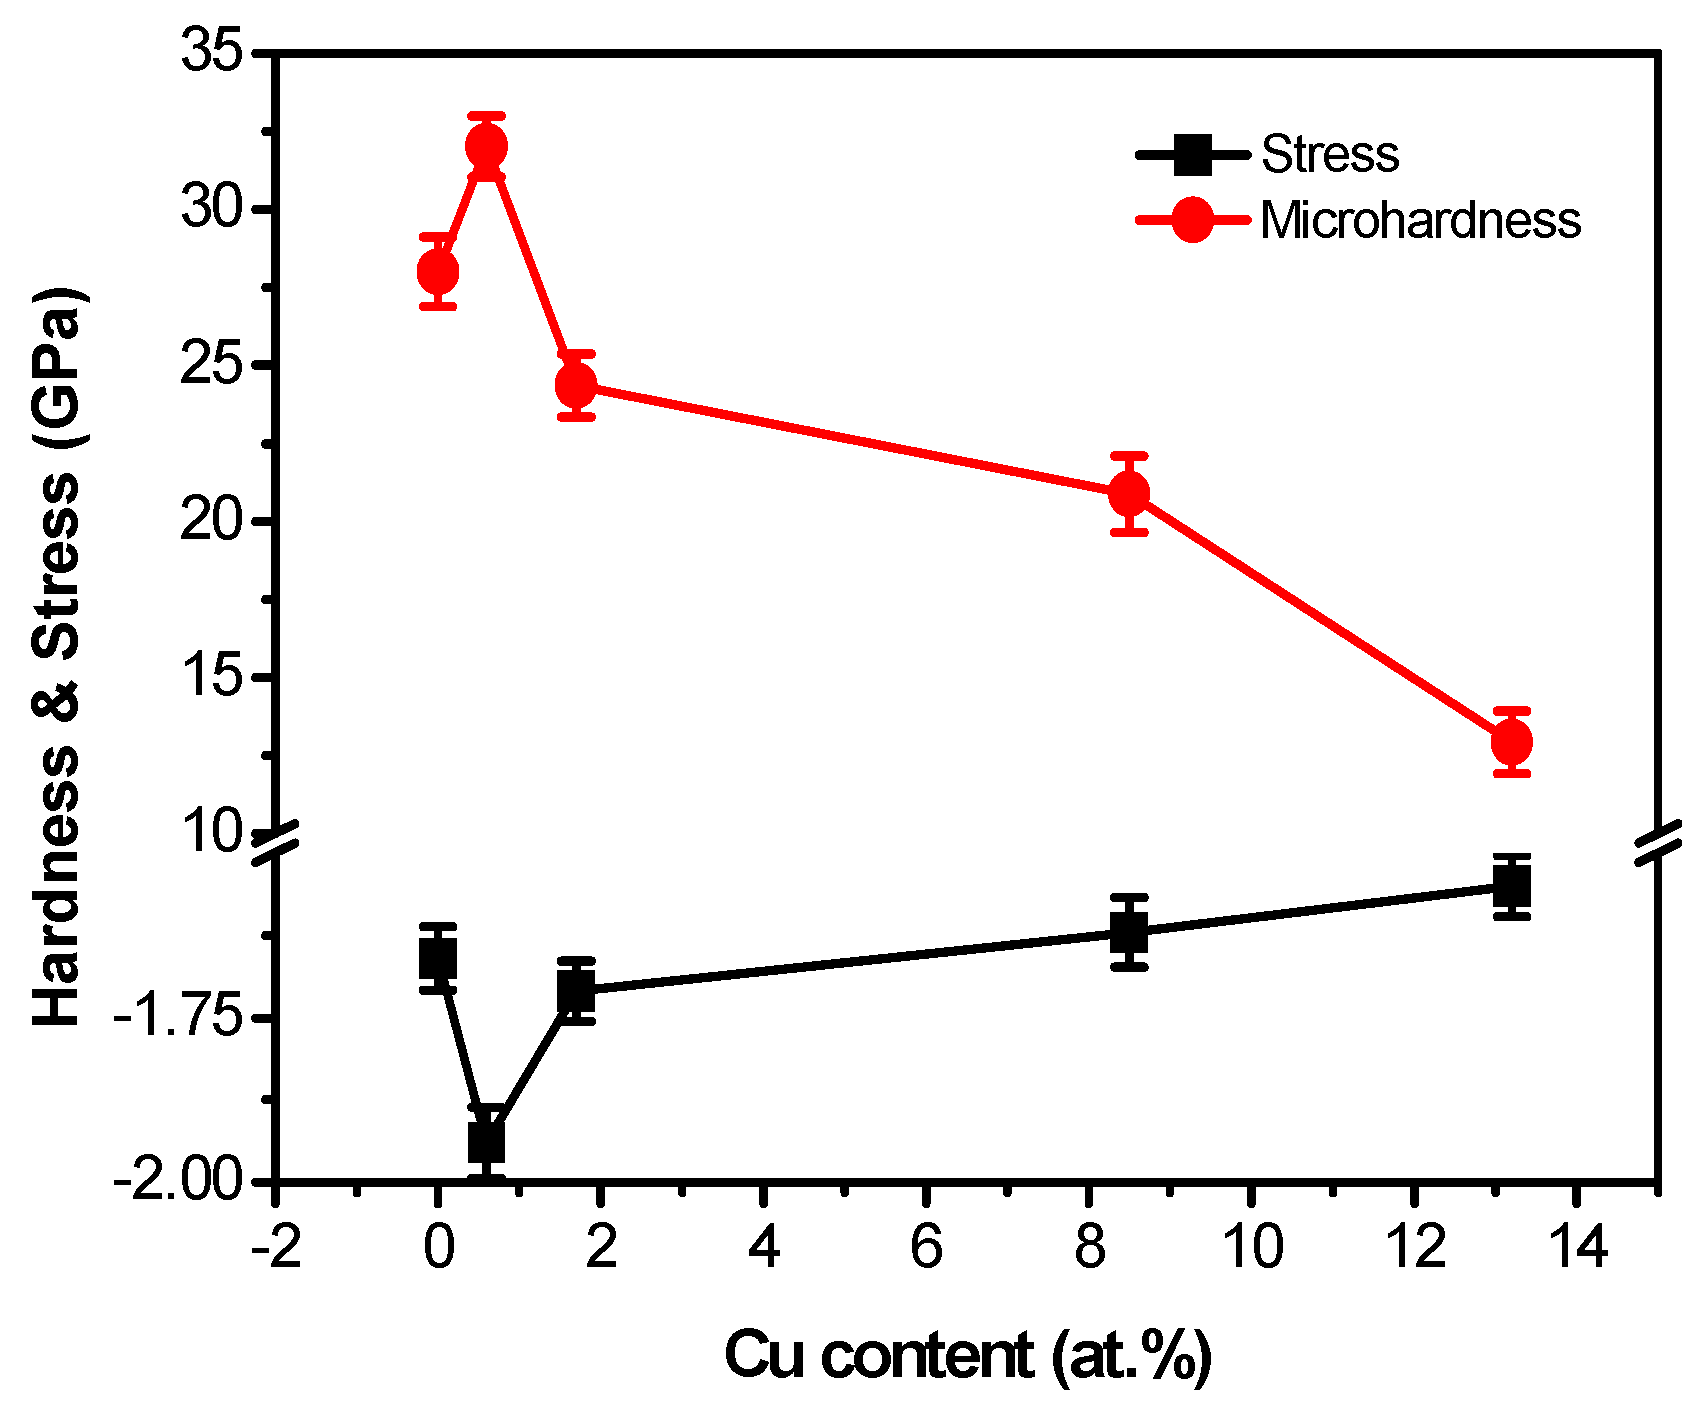
Figure 7.
Average coefficient curve and wear rate of VCN–Cu films with different Cu contents at RT.

Figure 8.
(a) Friction coefficient and (b) wear rate of VCN–Cu films at different temperatures.
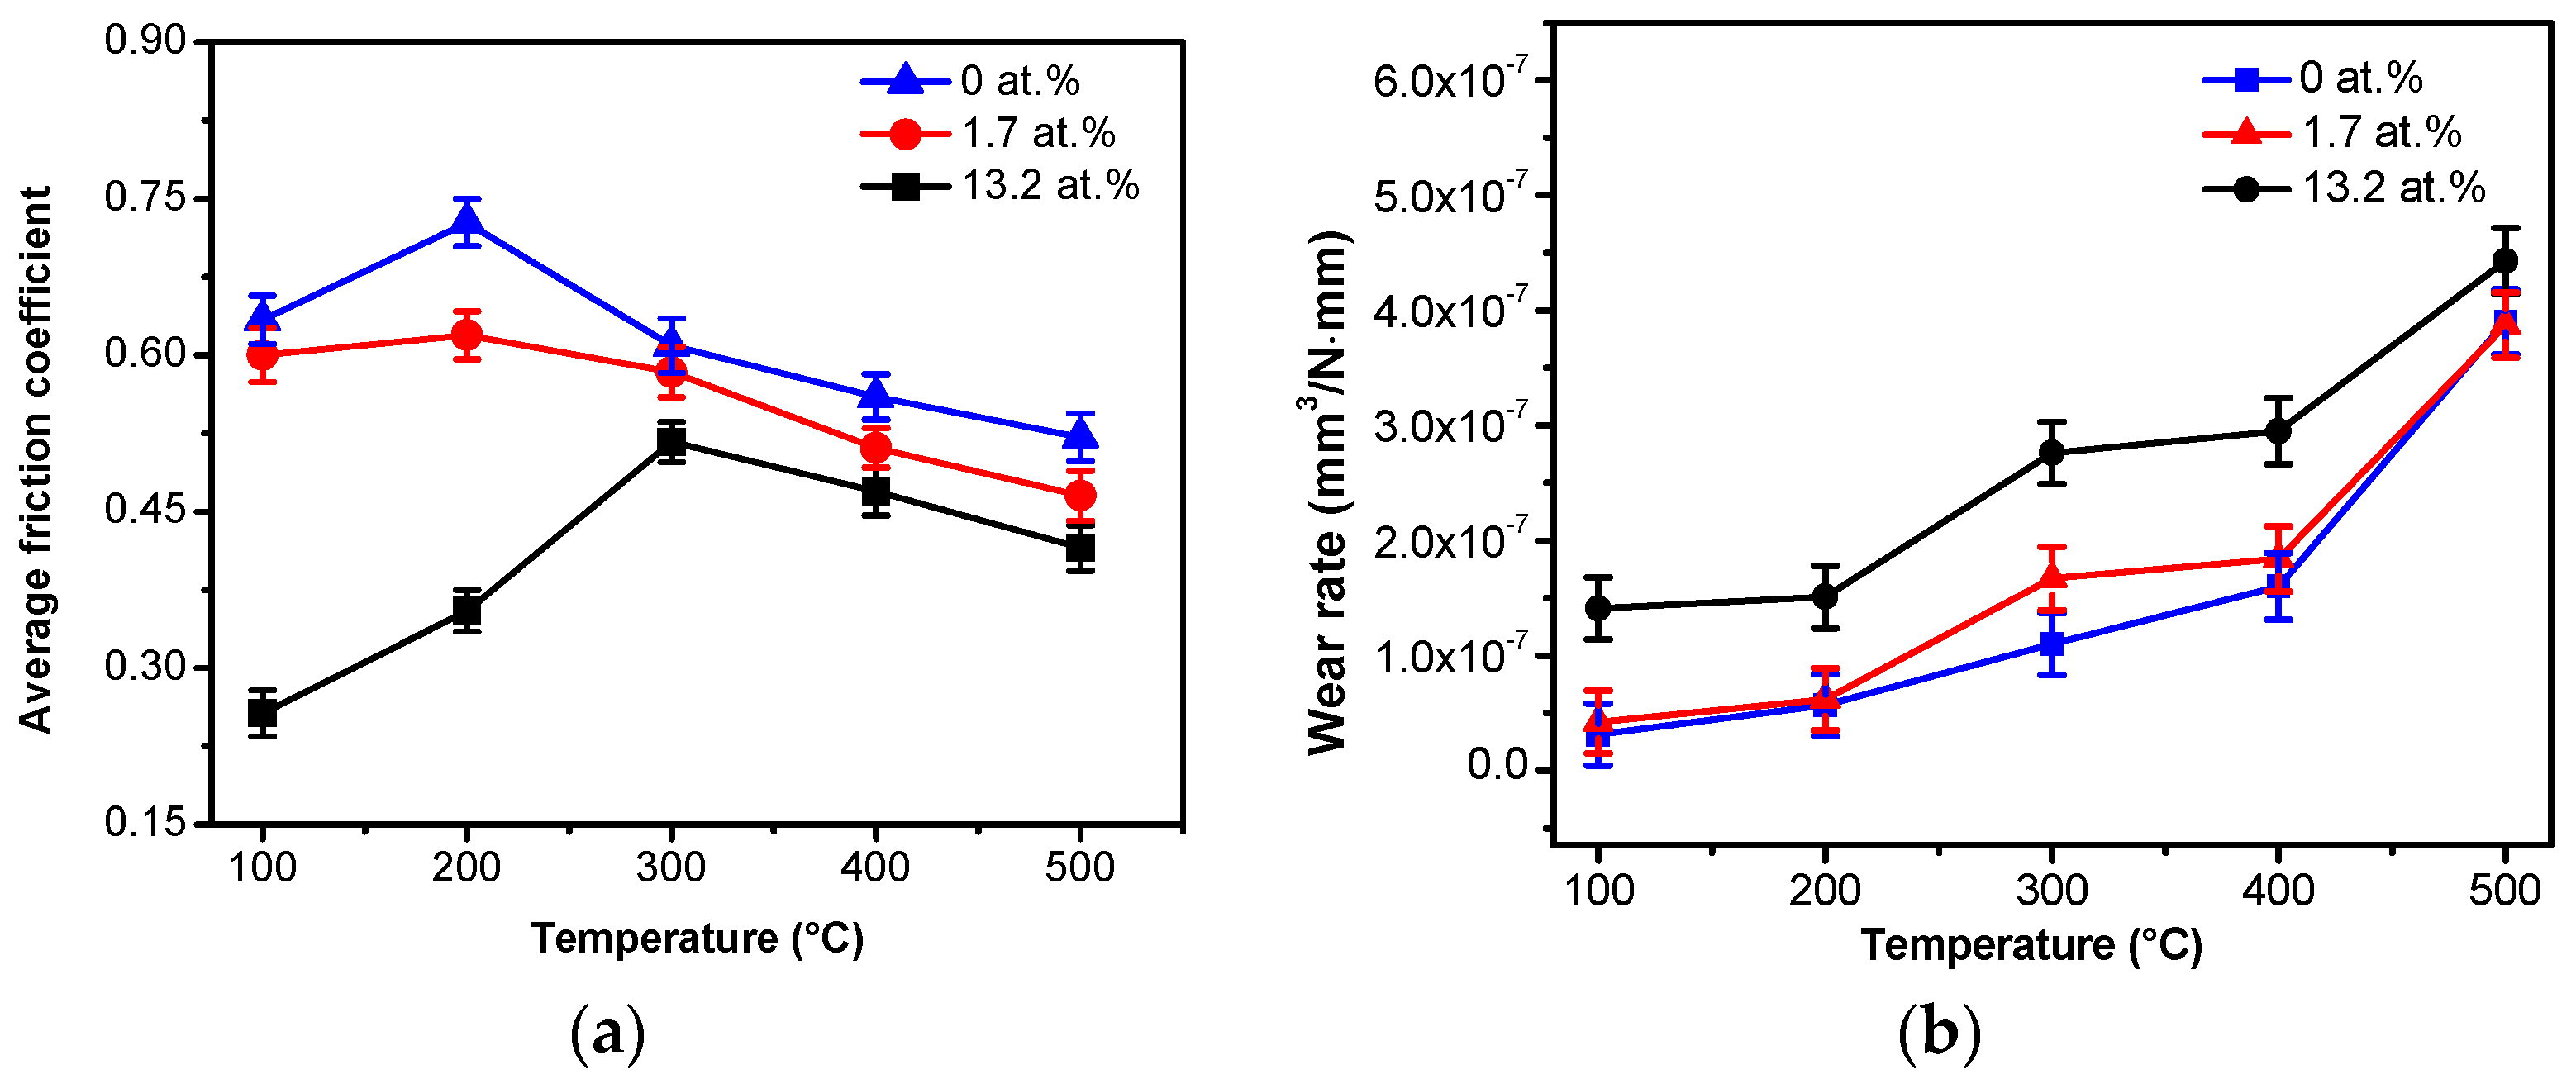
Figure 9.
XRD patterns of VCN–13.2 at.% Cu composite films after sliding (a) at different temperatures and (b) VCN–Cu composite films after sliding at 500 °C.
Figure 9.
XRD patterns of VCN–13.2 at.% Cu composite films after sliding (a) at different temperatures and (b) VCN–Cu composite films after sliding at 500 °C.

Figure 10.
Oxide-content of VCN–13.2 at.% Cu composite films after sliding (a) at different temperatures and (b) oxide-content of VCN–Cu composite films after sliding at 500 °C.
Figure 10.
Oxide-content of VCN–13.2 at.% Cu composite films after sliding (a) at different temperatures and (b) oxide-content of VCN–Cu composite films after sliding at 500 °C.
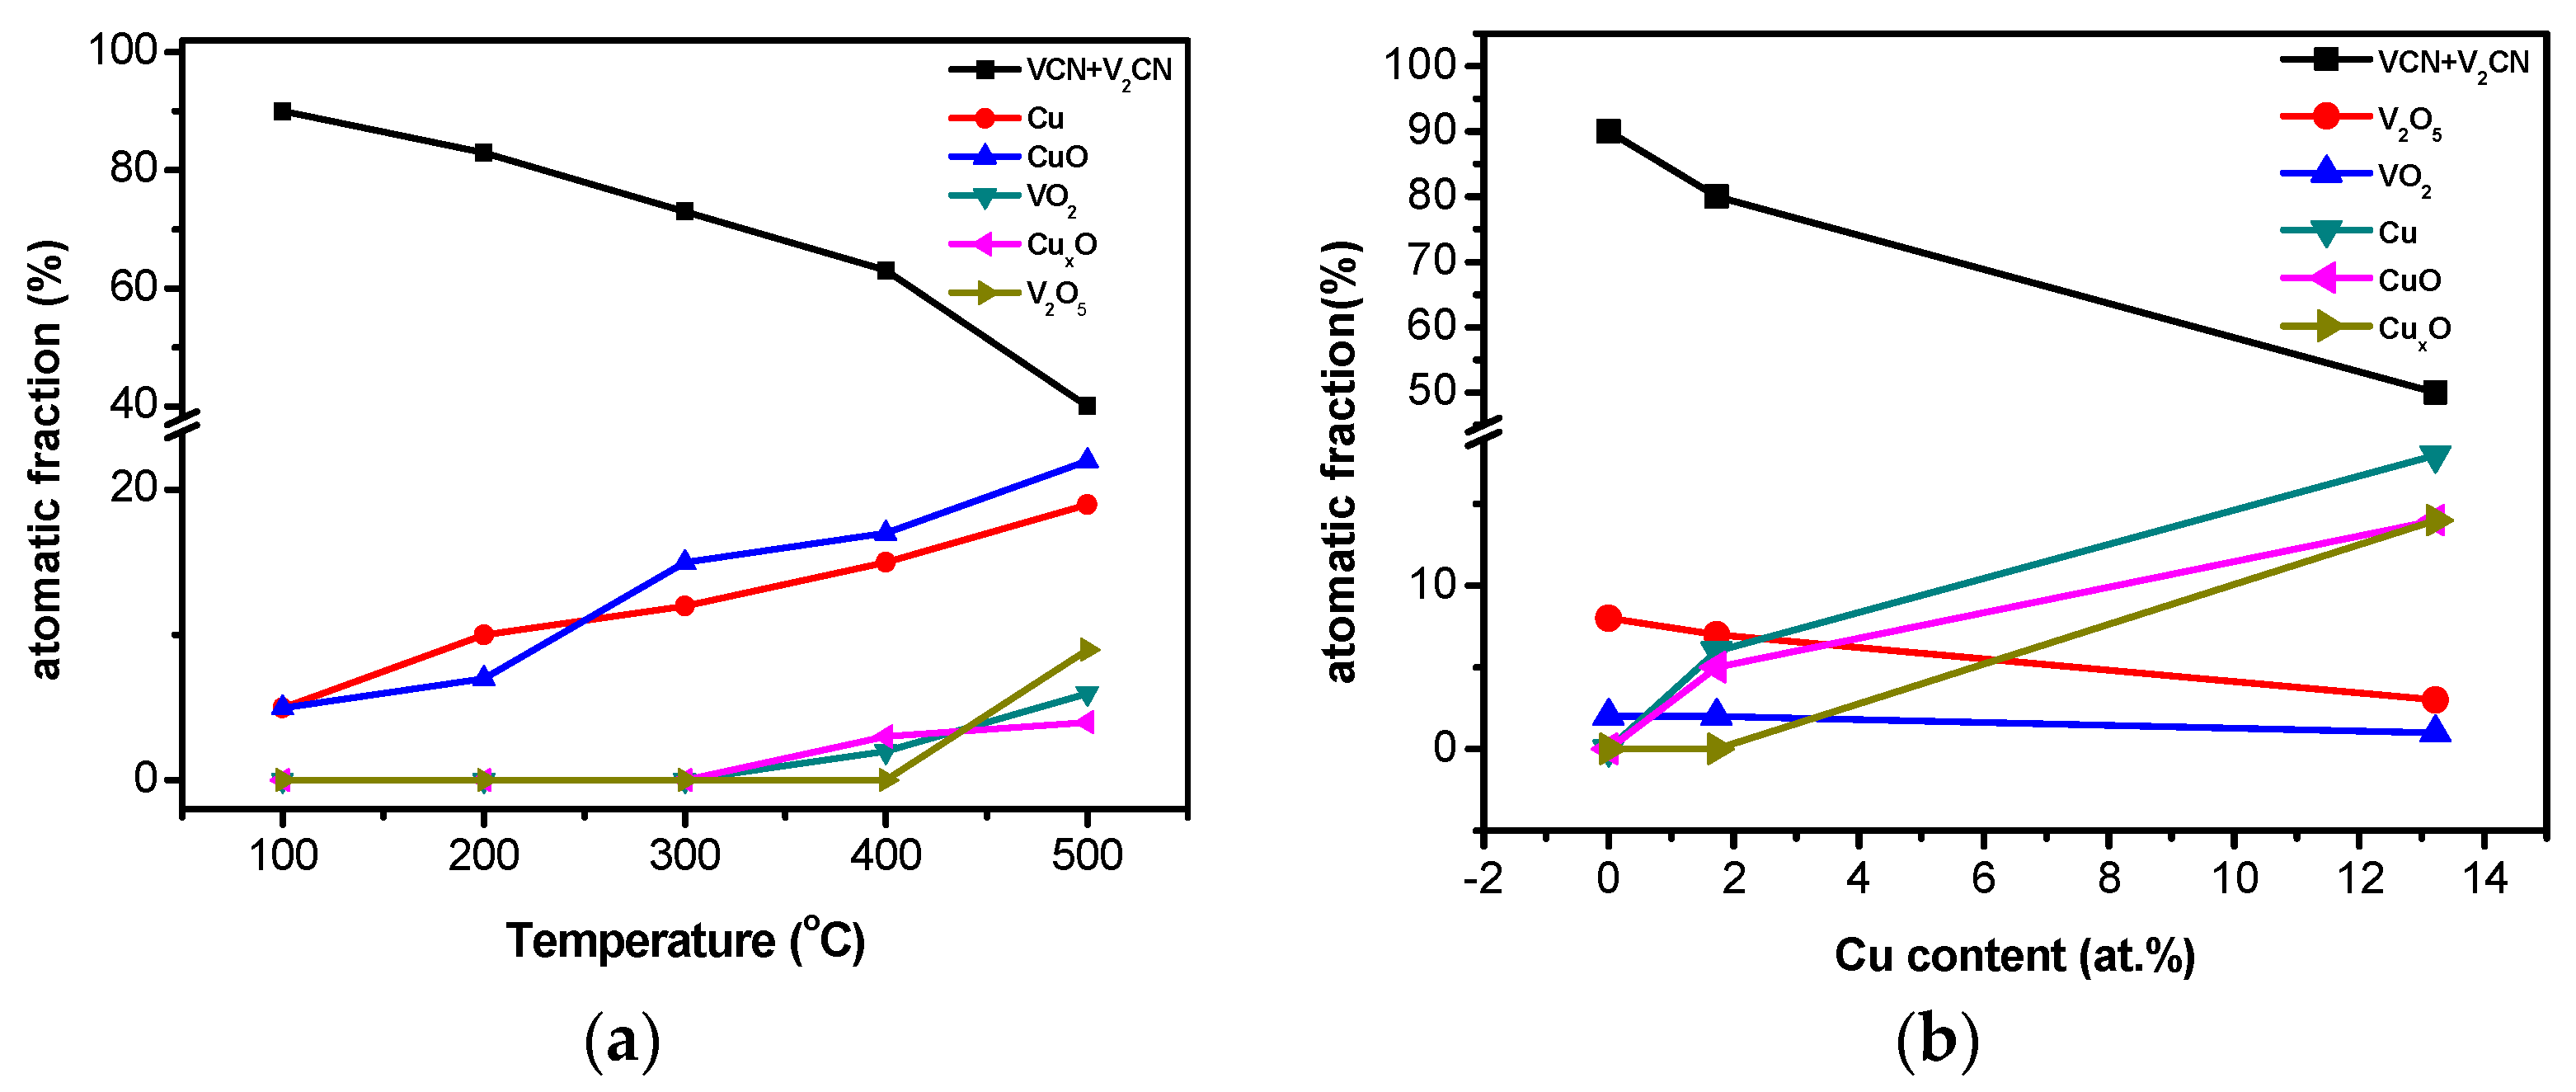
Figure 11.
SEM images of the wear tracks of VCN–13.2 at.% Cu and VCN films at different temperatures: (a) VCN–Cu, 300 °C; (b) VCN–Cu, 500 °C; (c) VCN, 300 °C; (d) VCN, 500 °C.
Figure 11.
SEM images of the wear tracks of VCN–13.2 at.% Cu and VCN films at different temperatures: (a) VCN–Cu, 300 °C; (b) VCN–Cu, 500 °C; (c) VCN, 300 °C; (d) VCN, 500 °C.


Table 1.
The preparation parameters of VCN–Cu composite films.
| VCN–Cu Composite Films | Experimental Parameters |
|---|---|
| Base pressure | <6.0 × 10⁻⁴ Pa |
| Total pressure | 0.3 Pa |
| Ar flow rate | 10 sccm |
| N2 flow rate | 7 sccm |
| Base rotation speed | 3 r/min |
| V target power | 200 W |
| C target power | 90 W |
| Cu target power | 0 W, 10 W, 15 W, 20 W, 25 W |
| Negative bias of the substrate | – |
| Deposition temperature | Room temperature |
| Deposition time | 2 h |
Table 2.
The composition of VCN–Cu films.
| Power of Copper Target (W) | Chemical Composition (at.%) | |||
|---|---|---|---|---|
| V | C | N | Cu | |
| 0 | 31.5 ± 2.2 | 16.9 ± 0.7 | 51.6 ± 2.8 | 0 |
| 10 | 31.2 ± 2.0 | 16.7 ± 0.7 | 51.5 ± 2.7 | 0.6 ± 0.1 |
| 15 | 30.6 ± 1.9 | 16.6 ± 0.6 | 51.1 ± 2.5 | 1.7 ± 0.2 |
| 20 | 26.9 ± 1.8 | 13.9 ± 0.5 | 50.7 ± 2.5 | 8.5 ± 0.3 |
| 25 | 24.3 ± 1.6 | 12.6 ± 0.4 | 49.9 ± 2.4 | 13.2 ± 0.4 |
Table 3.
The values of λ and B obtained from XRD patterns.
| Cu Content | λ (nm) | BVN (111) (°) |
|---|---|---|
| 0 at.% | 0.154 | 0.400 ± 0.002 |
| 0.6 at.% | 0.448 ± 0.003 | |
| 1.7 at.% | 0.534 ± 0.002 | |
| 8.5 at.% | 0.619 ± 0.001 | |
| 13.2 at.% | 0.713 ± 0.002 |
© 2018 by the authors. Licensee MDPI, Basel, Switzerland. This article is an open access article distributed under the terms and conditions of the Creative Commons Attribution (CC BY) license (http://creativecommons.org/licenses/by/4.0/).
Share and Cite
MDPI and ACS Style
Wu, F.; Yu, L.; Ju, H.; Xu, J.; Shi, J. Influence of Cu Content on the Structure, Mechanical, Friction and Wear Properties of VCN–Cu Films. Coatings 2018, 8, 95. https://doi.org/10.3390/coatings8030095
AMA Style
Wu F, Yu L, Ju H, Xu J, Shi J. Influence of Cu Content on the Structure, Mechanical, Friction and Wear Properties of VCN–Cu Films. Coatings. 2018; 8(3):95. https://doi.org/10.3390/coatings8030095
Chicago/Turabian StyleWu, Fanjing, Lihua Yu, Hongbo Ju, Junhua Xu, and Ji Shi. 2018. "Influence of Cu Content on the Structure, Mechanical, Friction and Wear Properties of VCN–Cu Films" Coatings 8, no. 3: 95. https://doi.org/10.3390/coatings8030095
Note that from the first issue of 2016, this journal uses article numbers instead of page numbers. See further details here.