Article

Comparative Study of Furnace and Flash Lamp Annealed Silicon Thin Films Grown by Plasma Enhanced Chemical Vapor Deposition

1
Department of Electrical and Computer Engineering, Michigan State University, East Lansing, MI 48824, USA
2
Department of Chemical Engineering and Materials Science, Michigan State University, East Lansing, MI 48824, USA
3
Department of Electrical Engineering & Computer Science, South Dakota State University, Brookings, SD 57007, USA
*
Author to whom correspondence should be addressed.
Coatings 2018, 8(3), 97; https://doi.org/10.3390/coatings8030097
Submission received: 29 November 2017 / Revised: 6 March 2018 / Accepted: 6 March 2018 / Published: 8 March 2018
(This article belongs to the Special Issue Plasma Etching and Deposition)

Abstract

:
Low-temperature growth of microcrystalline silicon (mc-Si) is attractive for many optoelectronic device applications. This paper reports a detailed comparison of optical properties, microstructure, and morphology of amorphous silicon (a-Si) thin films crystallized by furnace annealing and flash lamp annealing (FLA) at temperatures below the softening point of glass substrate. The initial a-Si films were grown by plasma enhanced chemical vapor deposition (PECVD). Reflectance measurement indicated characteristic peak in the UV region ~280 nm for the furnace annealed (>550 °C) and flash lamp annealed films, which provided evidence of crystallization. The film surface roughness increased with increasing the annealing temperature as well as after the flash lamp annealing. X-ray diffraction (XRD) measurement indicated that the as-deposited samples were purely amorphous and after furnace crystallization, the crystallites tended to align in one single direction (202) with uniform size that increased with the annealing temperature. On the other hand, the flash lamp crystalized films had randomly oriented crystallites with different sizes. Raman spectroscopy showed the crystalline volume fraction of 23.5%, 47.3%, and 61.3% for the samples annealed at 550 °C, 650 °C, and with flash lamp, respectively. The flash lamp annealed film was better crystallized with rougher surface compared to furnace annealed ones.

1. Introduction

Microcrystalline silicon (mc-Si) thin films have many promising applications in optoelectronic devices including thin film transistors, light emitting diode, and solar cells due to their high charge carrier mobility and high electrical conductivity compared to its counterpart amorphous silicon [1,2]. The conventional way to grow mc-Si requires high temperature (>600 °C) and is slow [3]. Therefore, mc-Si thin films are often formed by post crystallization of amorphous Si (a-Si) or nanocrystalline silicon; both are usually prepared by plasma enhanced chemical vapor deposition (PECVD) at temperatures below 300 °C [4]. High quality mc-Si has been achieved by furnace annealing of PECVD grown a-Si thin films. However, furnace annealing is not suitable for low melting substrates such as common glass or plastics and it requires long processing time (~16 h) [5]. On the other hand, metal induced annealing significantly reduces the crystallization temperature and time (roughly 3 h) [6]. However, metal migration leads to contamination and deteriorates the optoelectronic properties. Recently, laser annealing has been serving as a low-temperature alternative to furnace and metal induced annealing [7]; with a pulse duration of a few nanoseconds, no thermal damage occurs to the low-melting-temperature substrates. Nevertheless, laser annealing requires high equipment cost and is a slow process.
Flash lamp annealing is a promising approach to achieving rapid and low-temperature crystallization of a-Si thin films over large areas [2,8]. The degree of crystallization, grain size, band gap and roughness of the resulting silicon thin films can be tuned by adjusting the flash lamp parameters, such as the pulse width and pulse intensity. Flash lamp annealing (FLA) uses an array of Xe lamp with pulse in millisecond range [8,9] to crystallize a large area of samples without damaging the substrate [2,10]. The rapid crystallization, also referred to as explosive crystallization (EC) occurs during flash lamp annealing in amorphous Si thin films on glass substrates due to high power density of the flash lamp light. The EC starts from the edges of the amorphous Si films followed by the lateral crystallization with a velocity on the order of m/s. The formation of dense grains can be attributed to explosive solid-phase nucleation. Likewise, the formation of periodic microstructures contains several hundreds of nm-sized grains due to explosive liquid-phase epitaxy [11]. Several studies [10,11,12,13,14] have shown that FLA can form high quality and uniform micrometer order thick polycrystalline silicon thin films with high minority carrier lifetime to improve charge transport in optoelectronic devices. The optoelectronic properties such as reflectance, transmittance, optical band gap and dielectric constants determine the performance of poly-Si thin-film electronic devices. These properties are directly related to the crystallinity of the films such as size of crystallite and crystalline volume fraction. Understanding these properties can provide better control of the device quality of mc-Si thin films for optoelectronic applications. Although several research groups have reported flash lamp annealing of CVD grown a-Si thin films [8,10,11,12,13,14], there is a lack of side-by-side comparison of the microstructures and optoelectronic properties of the a-Si films crystalized by thermal and flash lamp annealing methods.
In this study, PECVD a-Si thin films were treated with flash lamp and furnace annealing. We subsequently characterized the optical properties, surface morphology, crystalline phase, and crystalline volume fraction of flash lamp annealed samples in comparison with furnace annealed ones. The goal was to elucidate the differences in the film microstructures and properties. We expect the results can be used for further optimization of the thermal annealing and flash lamp treatment.

2. Experimental Procedure

Amorphous Si thin films were deposited using an AKT Gen3 multi-chamber PECVD system (AKT, Santa Clara, CA, USA) on glass substrates of 0.5 mm thick with an area of 55 × 65 cm2. The glass substrate was Corning glass with softening temperature point of 900 °C. The deposition conditions are summarized in Table 1.
The thickness of the films was 180 nm and was uniform over the substrate. The samples were cut into 1 × 1 cm2 for crystallization and characterization. The as-deposited a-Si samples were thermally annealed at different temperatures ranging from 450 °C to 650 °C in a vacuum furnace of 9.2 × 10⁻⁷ mbar pressure. Samples were annealed for 6 h after ramping to the designated temperature at a rate of 2 °C/min and allowed to cool down to room temperature naturally after annealing. Deformation of glass substrate was not noticed after the annealing process.
On the other hand, de-hydrogenation was performed at ~500 °C for 30 min before FLA to remove hydrogen content in the a-Si:H. The flash lamp annealing was carried out using a NovaCentrix (Pulseforge 3300, Austin, TX, USA) multi-lamp system having three parallel xenon lamps, which could process a sample size of 10 × 5 cm2 uniformly. The light intensity was controlled by the driving voltage of the lamp and the duration of the pulse in order to optimize the crystallization process. Based on our previous studies, a set of typical flash light parameters were chosen to crystalize the a-Si films: single light pulse duration 1000 μs, duty cycle 0.5, driving voltage 550 V, and total energy of the light pulse 5577 mJ/cm2 [15]. Under these flash lamp annealing parameters, which were not necessarily the optimized ones, we noted that the a-Si films typical became crystallized without peeling off the glass substrates. On the other hand, a lower pulse power would lead to insufficiently crystallization; and a higher power would result in significant evaporation of the a-Si films as well as film delamination. The samples were preheated to 400 °C prior to flash lamp illumination.
The optical properties of the films were characterized by reflectance measurements on Filmetrics (F20-UVX, San Diego, CA, USA) thin film analyzer with Hamamatsu (L120290, Hamamatsu Photonics, Hamamatsu, Japan) light source having combination of halogen and deuterium lamps. Likewise, Bruker Dimension Icon atomic force microscope (AFM, Bruker, Billerica, MA, USA) having silicon nitride tip with radius of 2 nm was used to examine the surface topography of the films. The crystalline phase of the samples was characterized using Rigaku Smartlab X-ray diffractometer (XRD, Rigaku, Tokyo, Japan) with Cu source (λ-1.54 Å). The diffraction measurements were performed on medium resolution parallel beam/parallel slit analyzer (PB/PSA) mode. All the measurements were carried out for 2θ angle in the range of 20°–60° in a step of 0.01° and scanning rate of 0.1°/min. The crystalline volume fraction of the silicon thin films were analyzed using LabRam Horiba Scientific Raman spectroscope (Horiba, Kyoto, Japan) in the back reflection mode with green laser of 532 nm, objective lens of 100X, grating size of 1800/mm. The film optical thickness was evaluated by using a J.A. Woollam (M-2000X, Lincoln, NE, USA) spectroscopic ellipsometer (SE) at a fixed angle of 70° in a wavelength range of 250–1000 nm. The CompleteEASE 4.92 software was used to fit the experimental data.

3. Results and Discussion

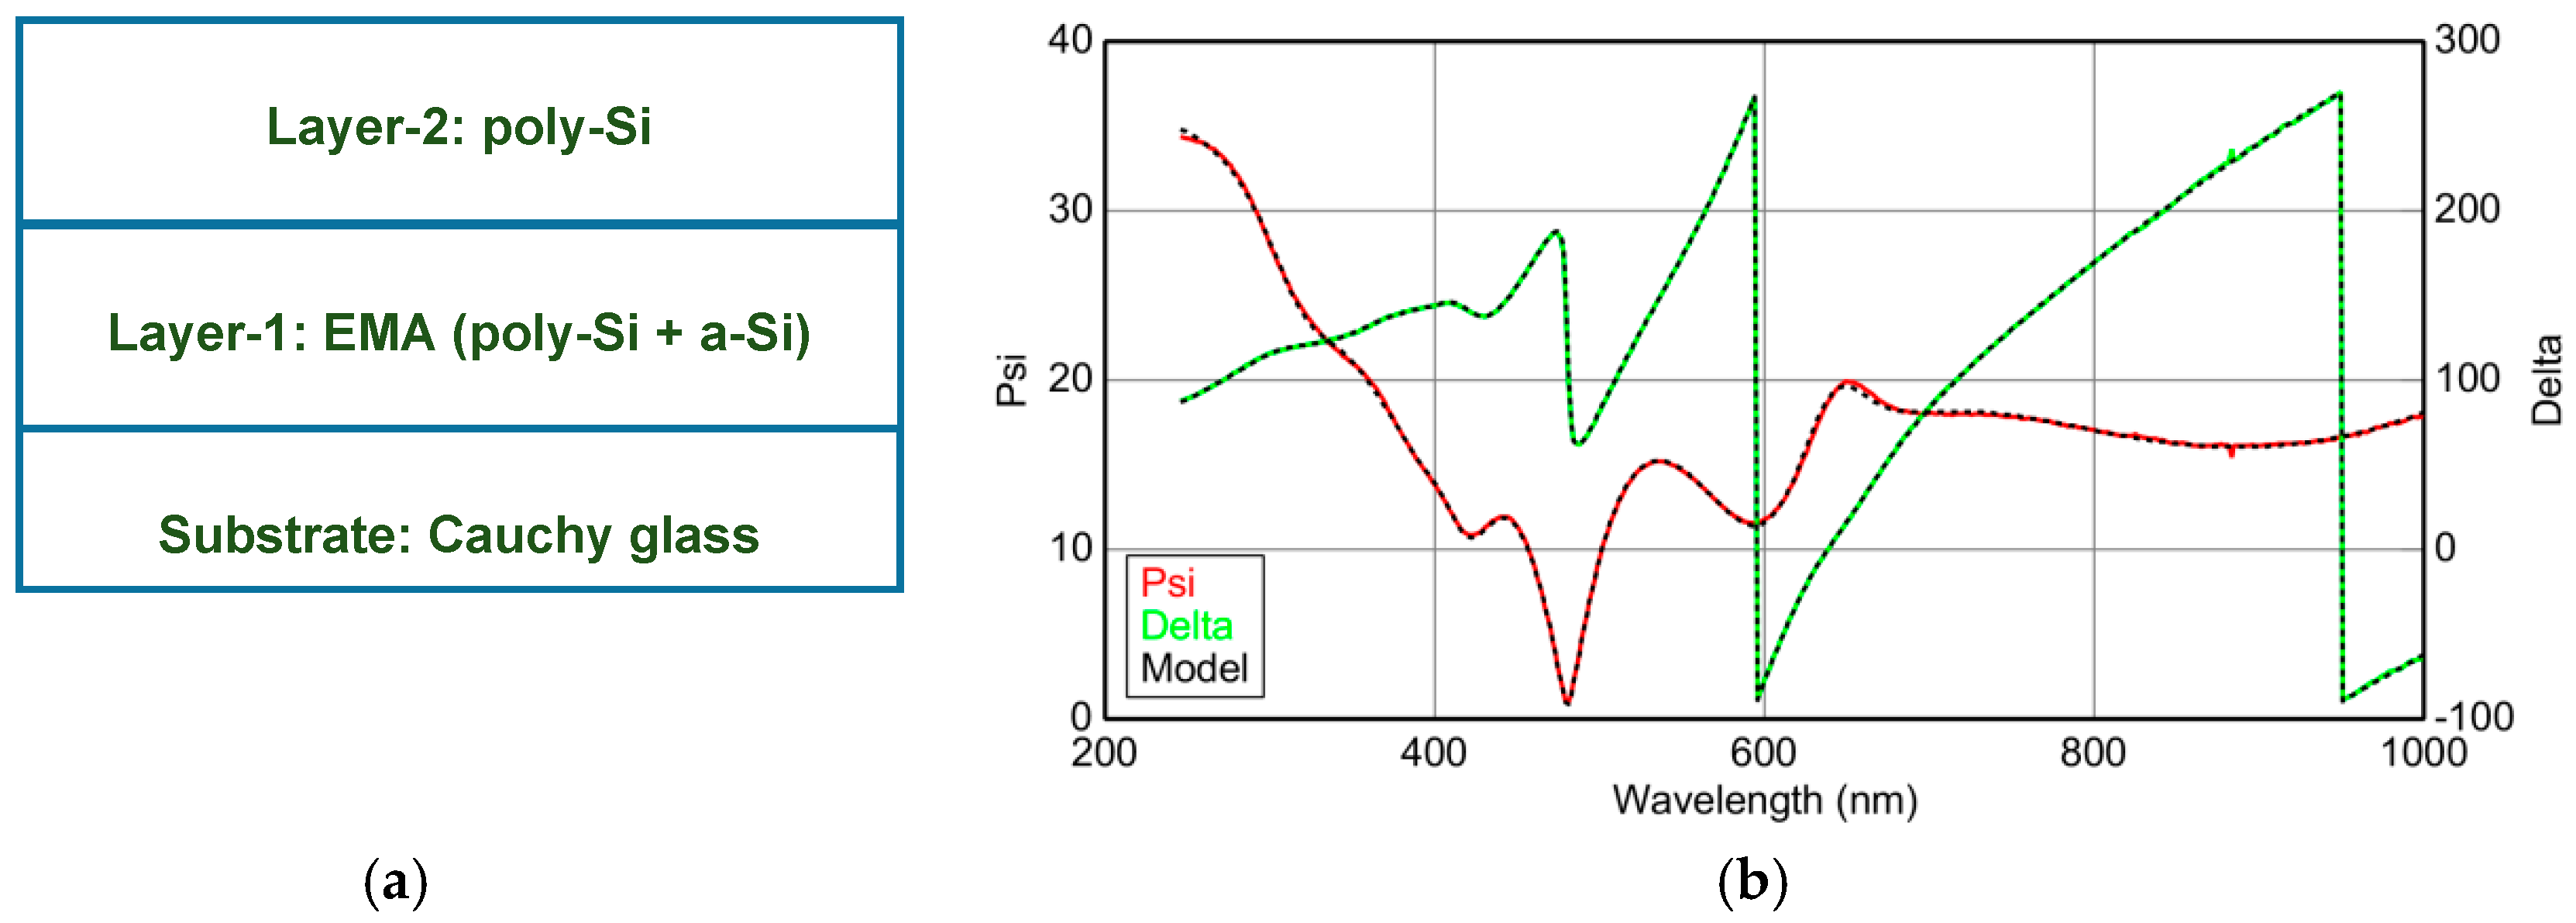
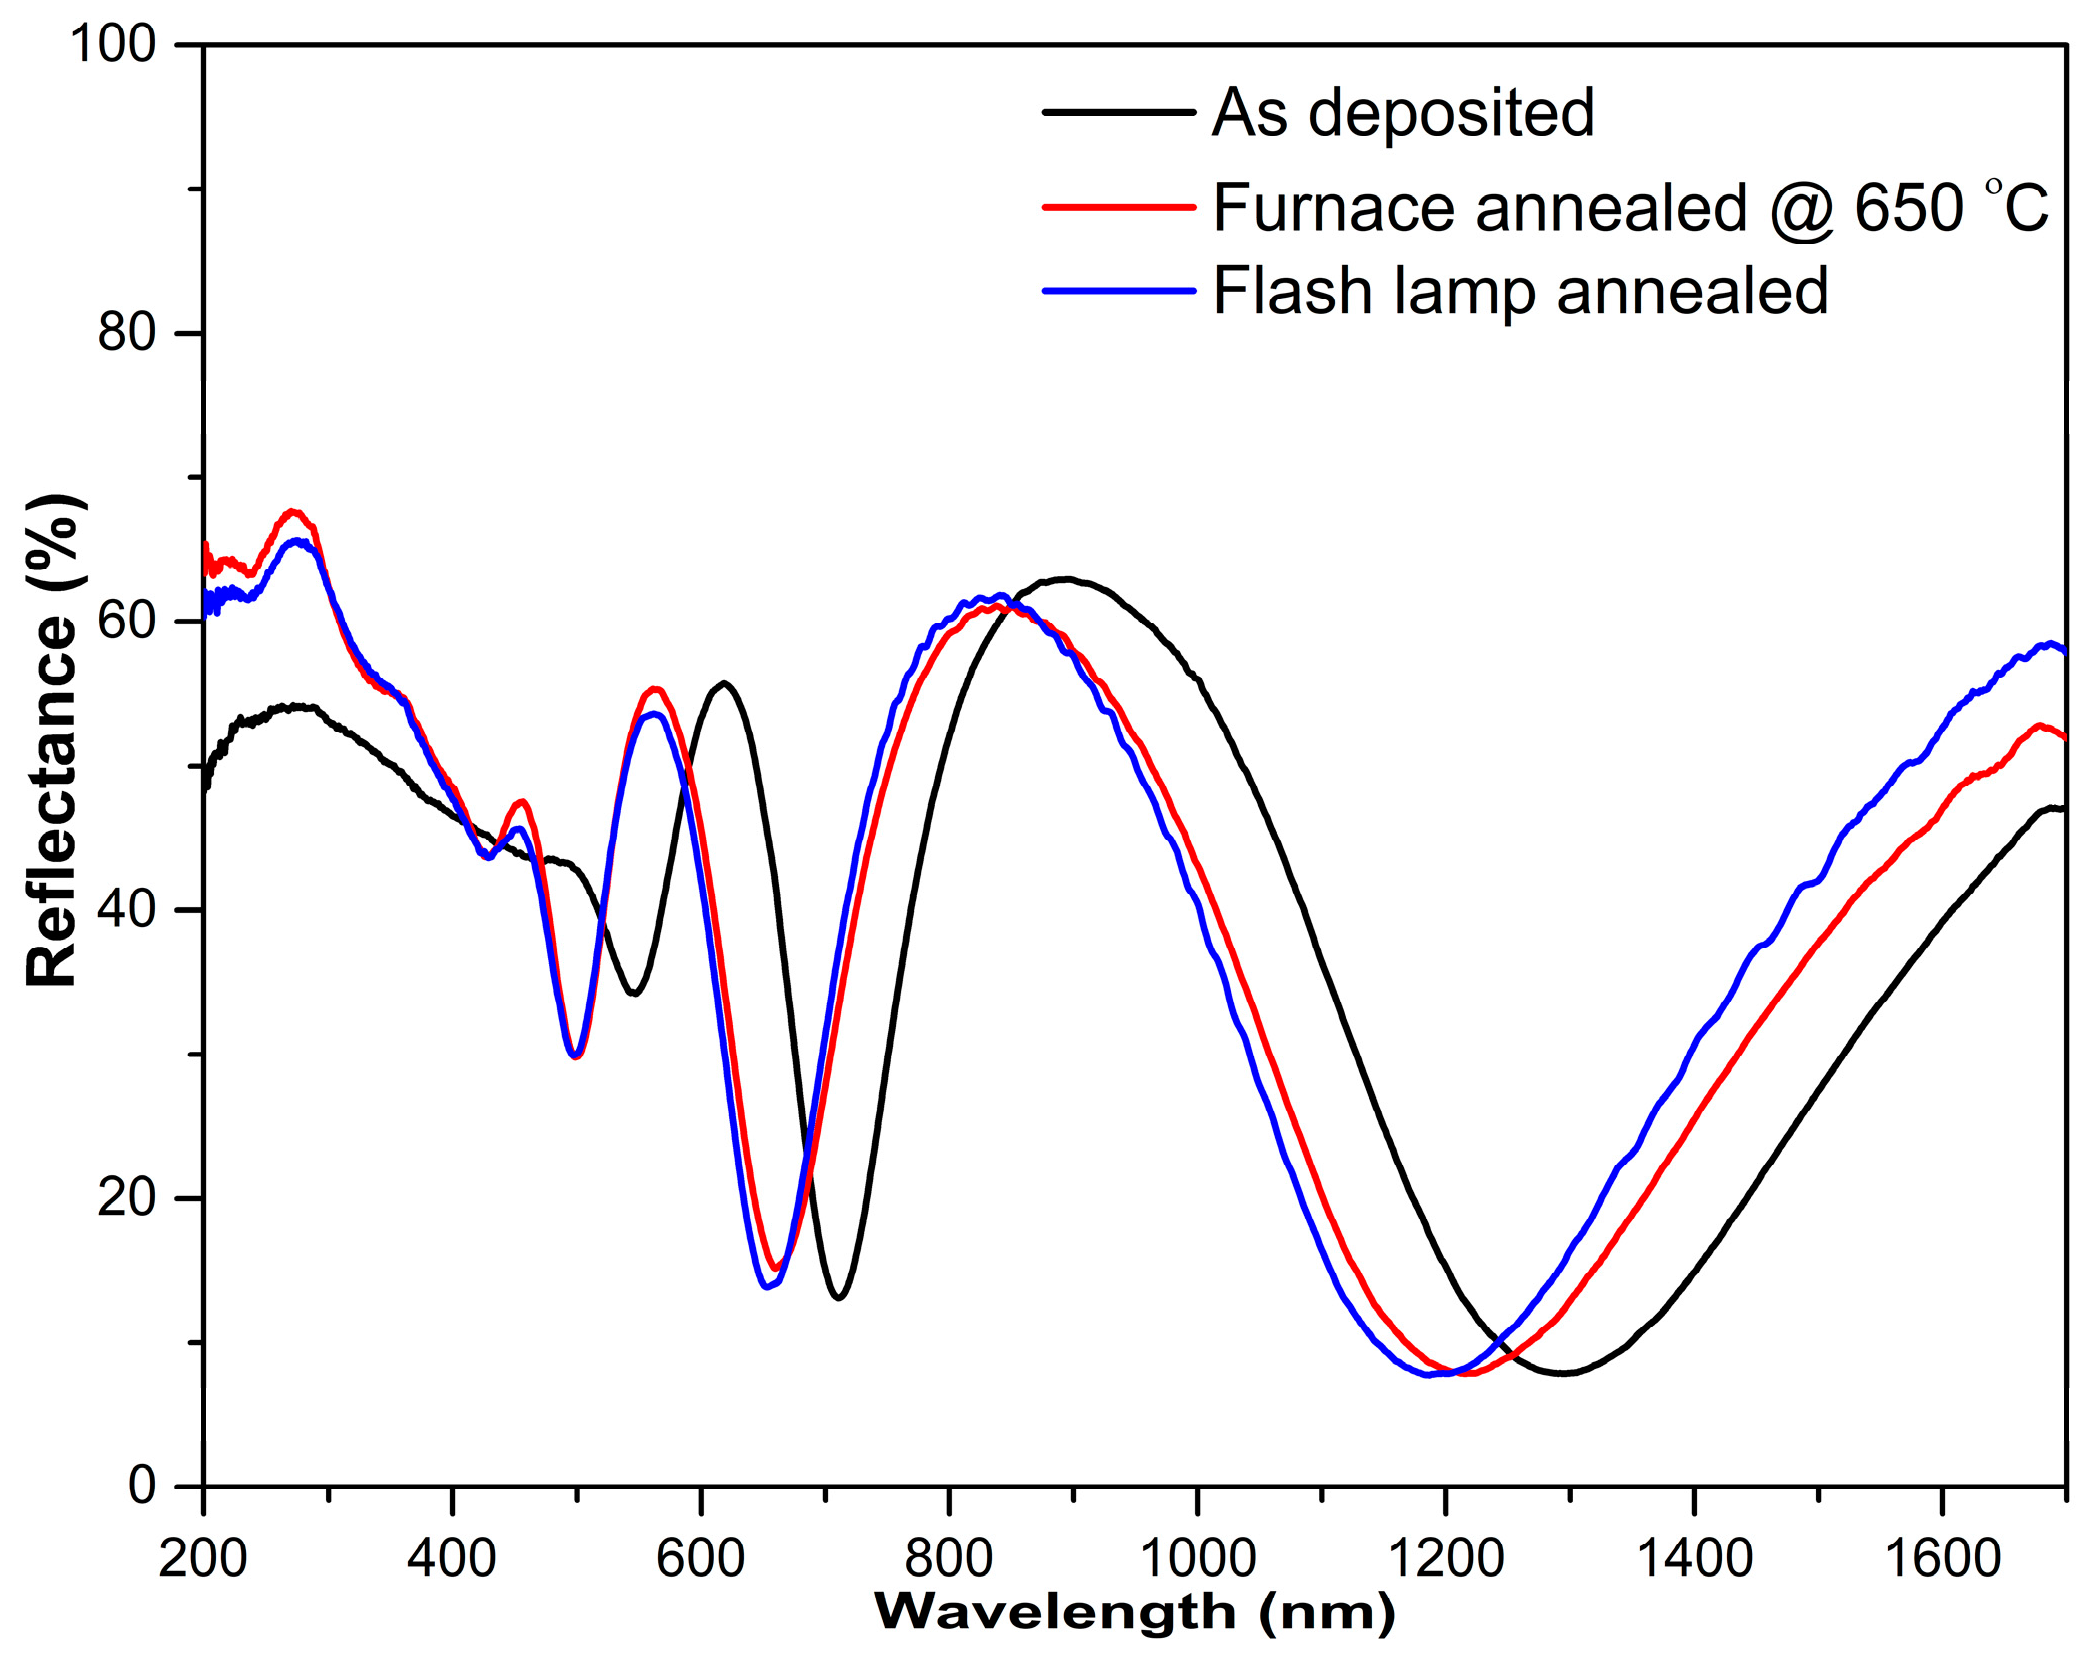
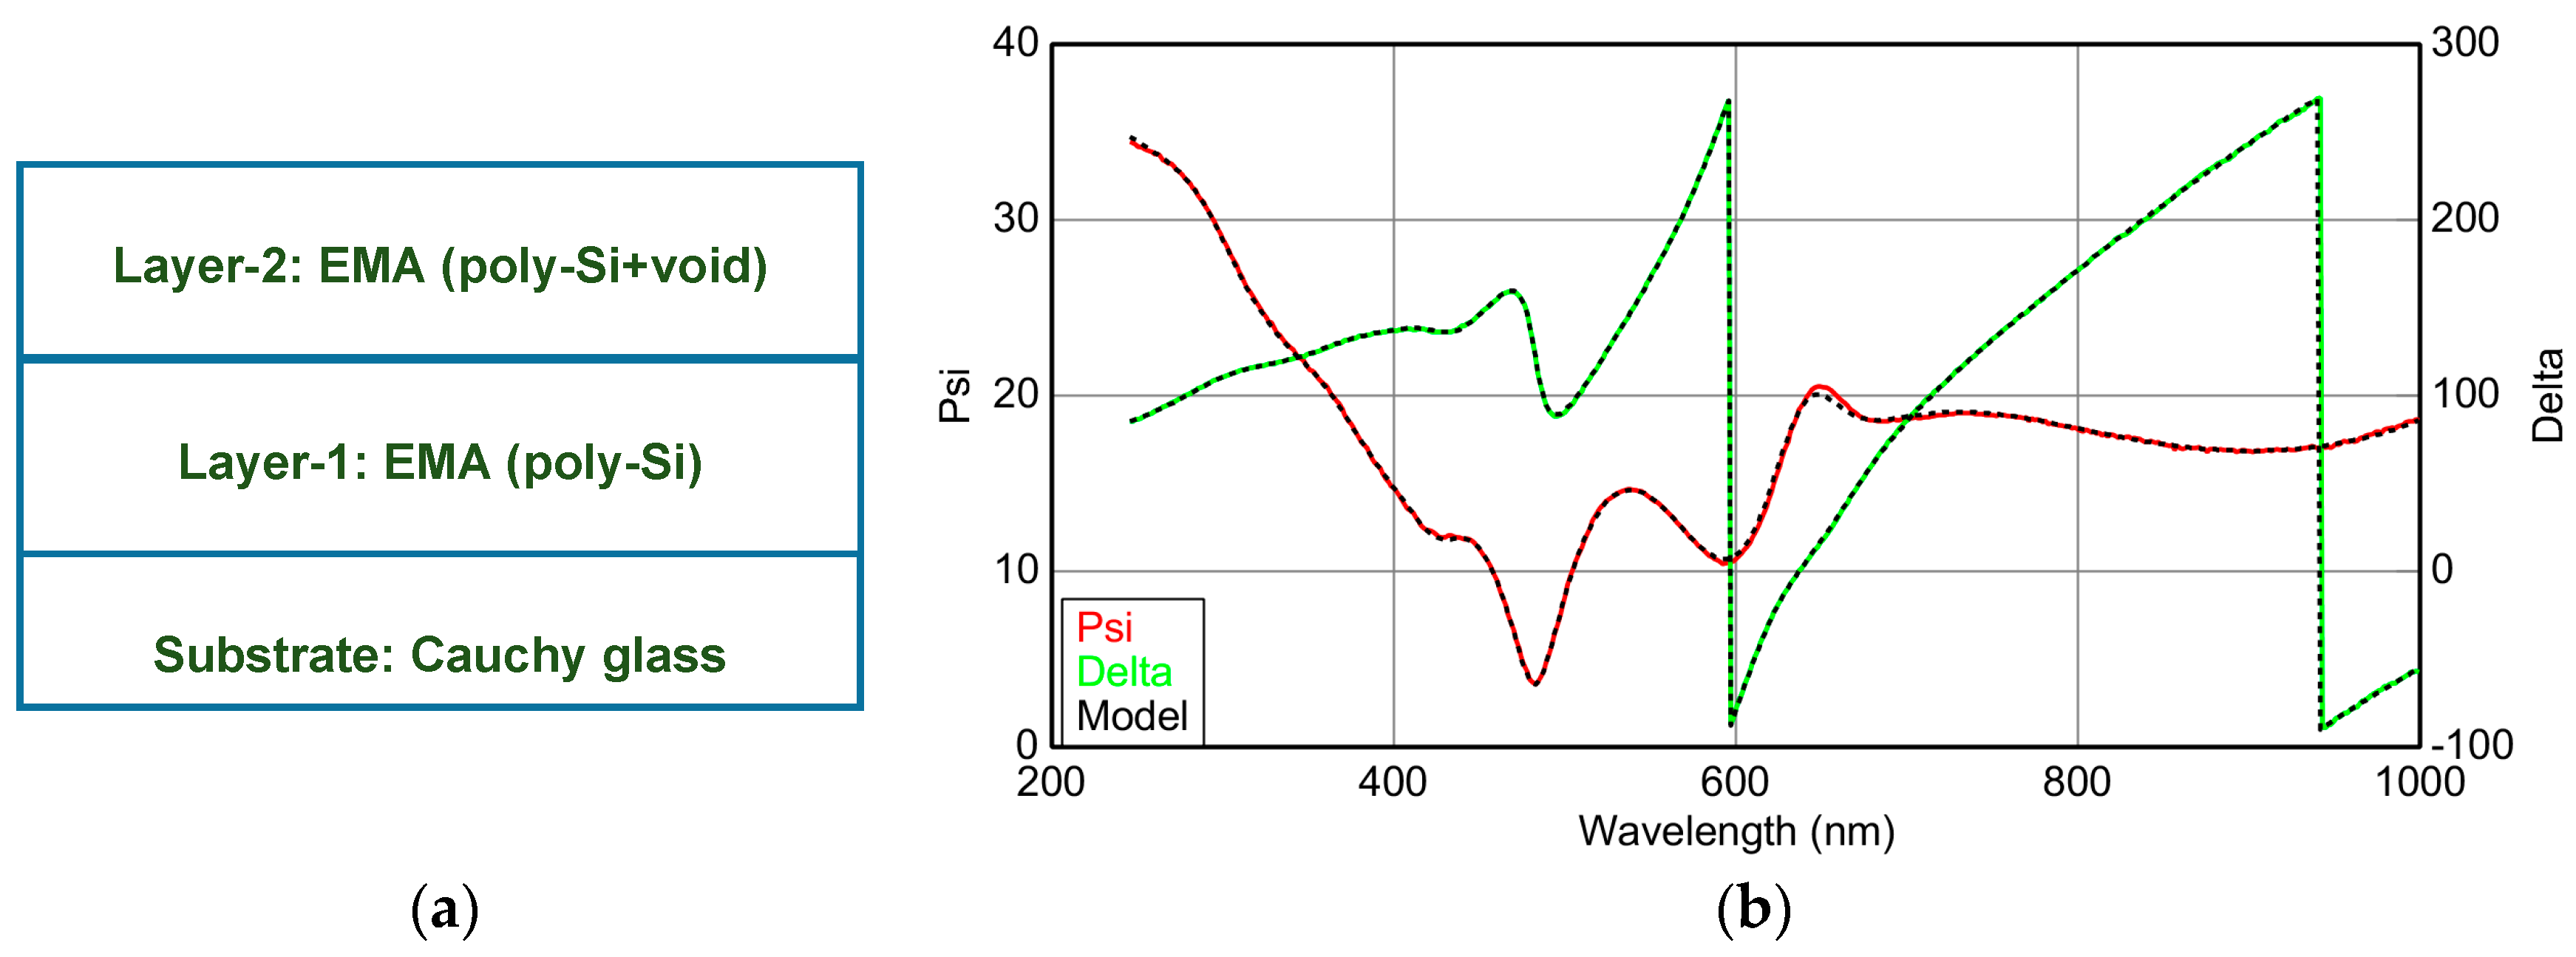
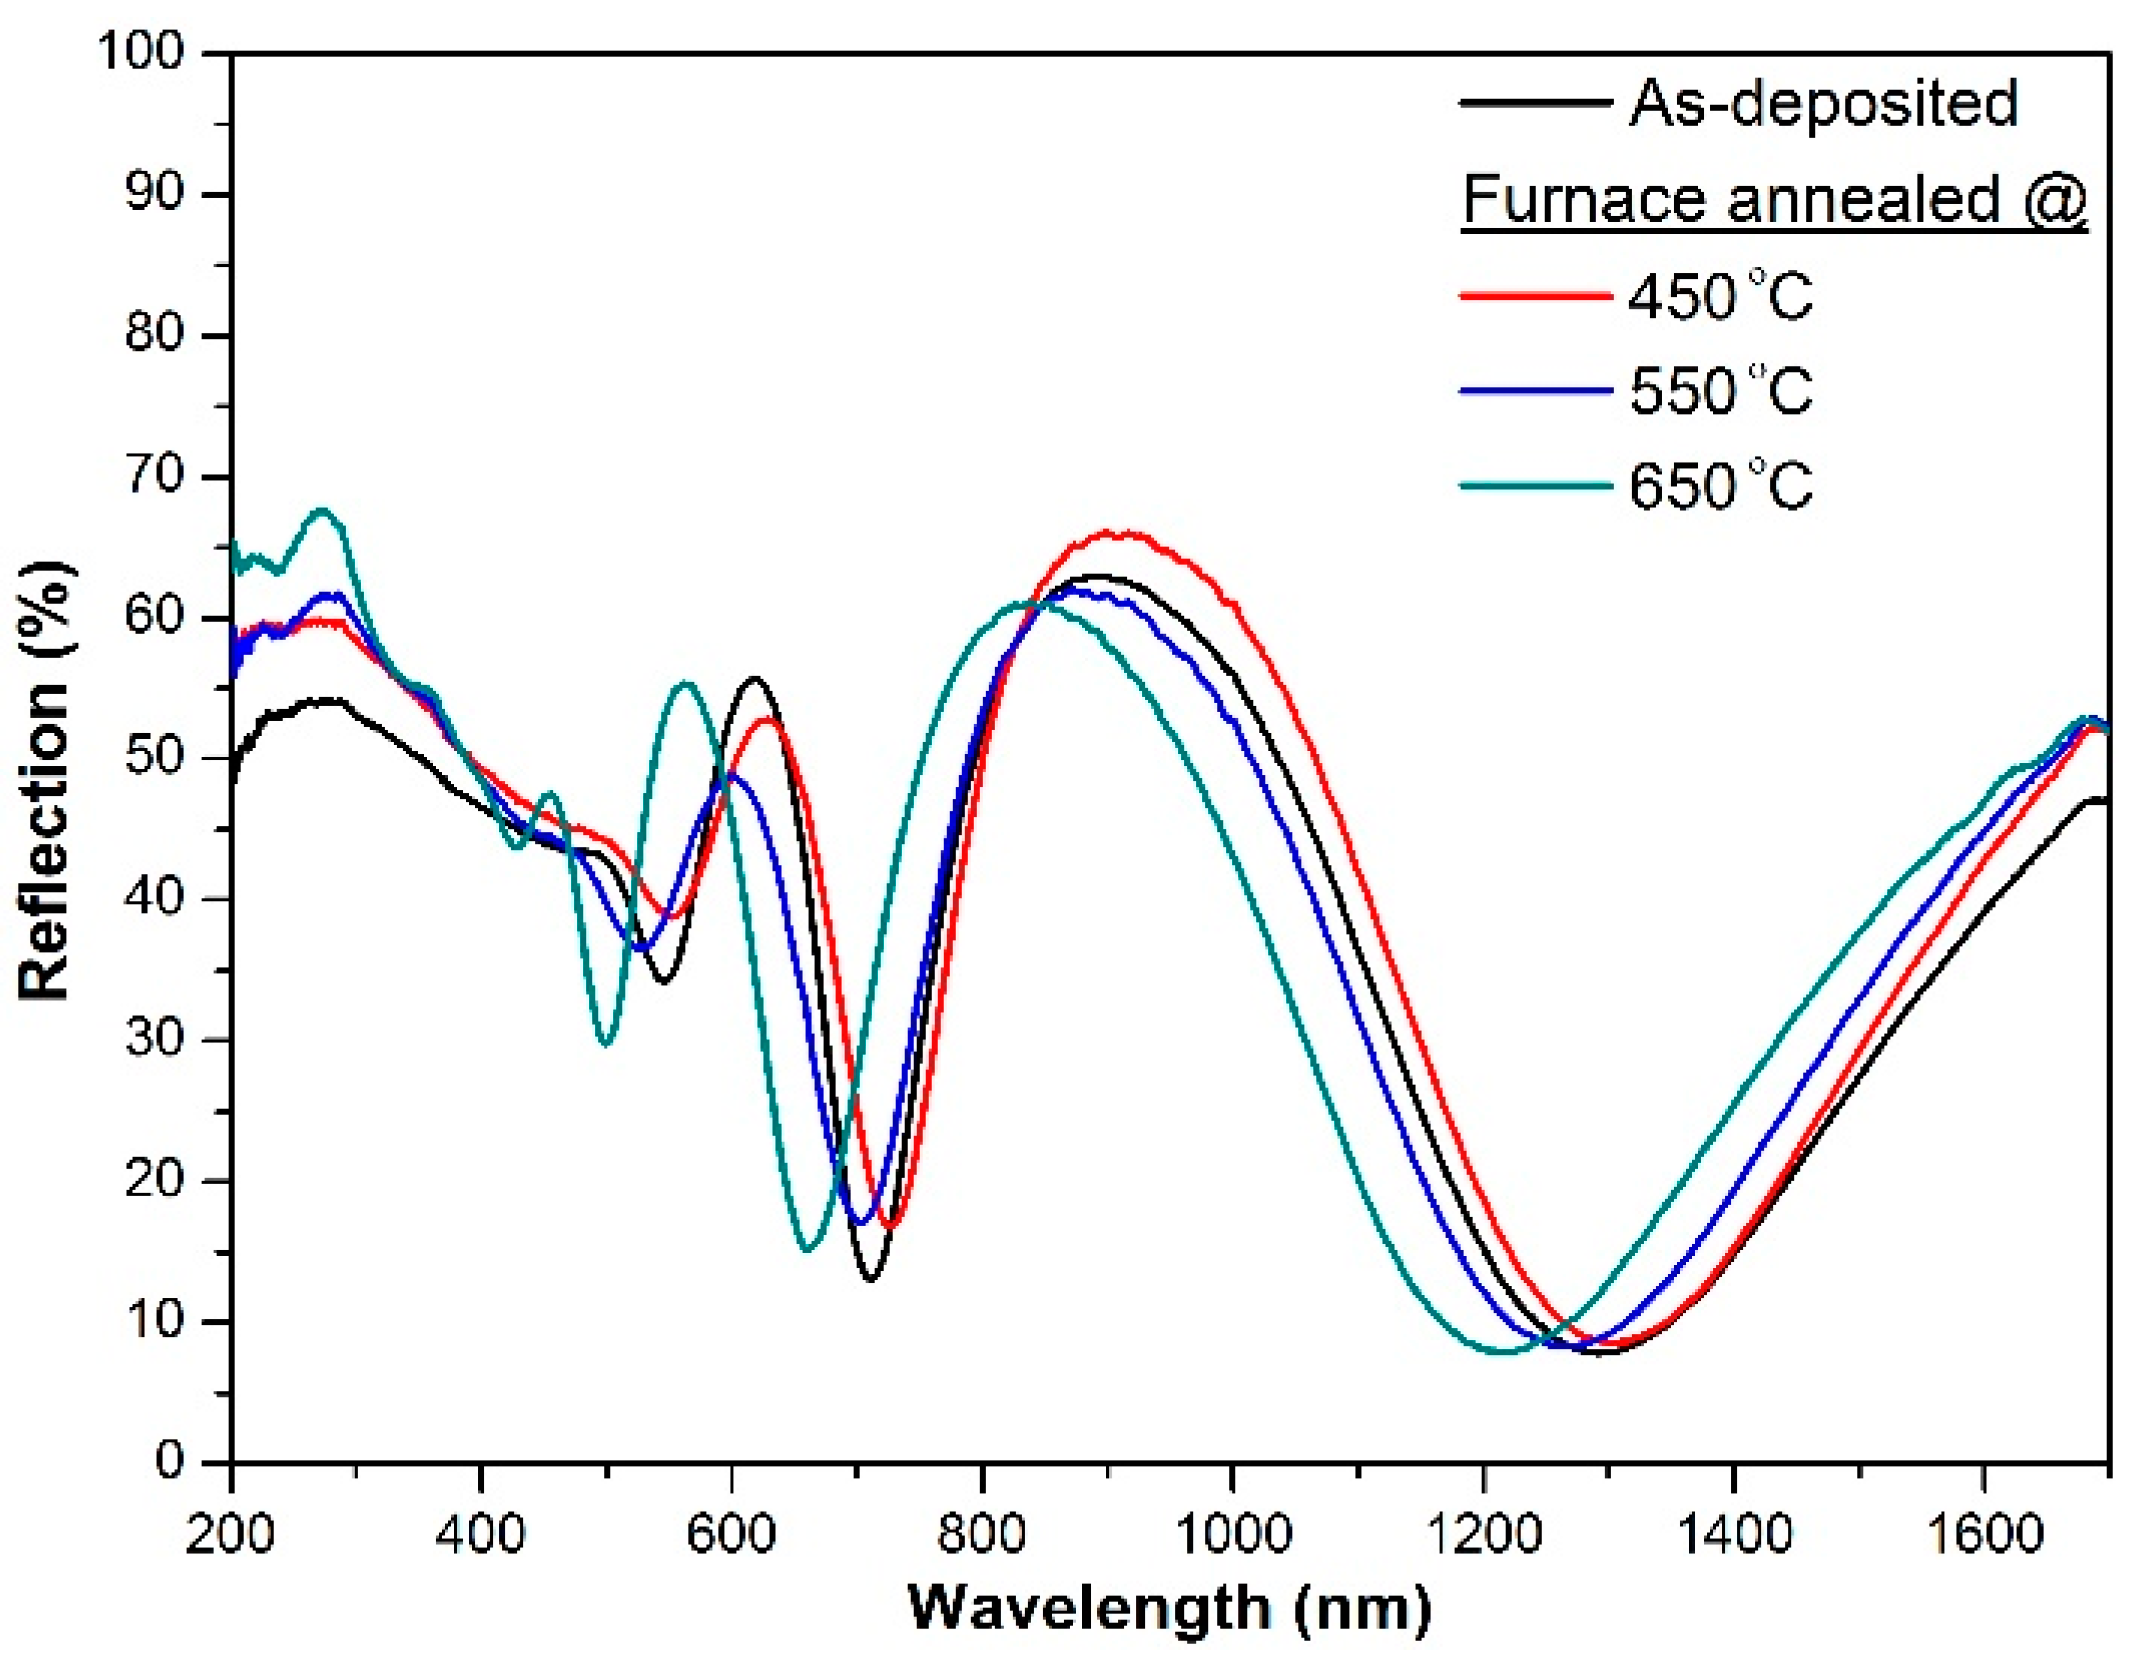
3.1. Optical Properties

Figure 1 shows the optical reflectance spectra of the films furnace annealed at different temperatures. The spectra show interference patterns at wavelength above 400 nm due to coherent multiple reflections between the film and substrate. The peak points of the interference fringe in the reflectance spectrum for the sample annealed at 650 °C shifted obviously towards shorter wavelength. This indicated that the optical thickness of the a-Si film changed after annealing at 650 °C. To verify the optical thickness, we performed spectroscopic ellipsometry (SE) on this sample. Figure 2a is the three-layered optical model used for simulation, where layer-1 was treated as mixture of polycrystalline silicon and amorphous silicon, layer-2 was pure polycrystalline silicon and the glass substrate was treated as Cauchy glass with backside reflection [15,16]. The fitting of layer-1 used Bruggman’s Effective Medium Approximation (EMA) model [17], where Tauc-Lorentz and Gaussian oscillators were used for poly-Si and Cody–Lorentz [18] and Gaussian oscillators for a-Si [19]. The fitting had very small mean squared error (MSE) ~2.5 to the experimental values of psi and delta. The model provided an excellent fit for the experimental data as can be seen from the psi and delta vs. wavelength plot in Figure 2b. The results obtained from the fitting model indicated ~62 nm thick layer of poly-Si and a-Si for layer-1, the volume fraction of the a-Si was 45.5%, whereas, a ~104 nm thick layer of poly-Si for layer-2. Therefore, total optical thickness of the sample was reduced to 166 nm from 180 nm after annealing at 650 °C.
The ellipsometry analysis clearly identified a transition layer between the substrate and the crystalized layer. This transition layer, generally undesired in optoelectronic devices, was possibly caused by the mutual diffusions and reactions at the a-Si/substrate interface. It is worth noting that, as will be shown later from the X-ray diffraction, the crystal sizes after the furnace annealing were less than 20 nm. Therefore, the spectroscopic ellipsometry was probing an equivalent phase for the “poly-Si” layer, which actually included a significant portion of grain boundaries that were amorphous in nature but not distinguished in the ellipsometry fitting.
A direct evidence of crystallization of the a-Si films was that a new characteristic peak around ~280 nm in the UV region of the reflectance spectra appeared for the films annealed at temperatures above 550 °C. The characteristic peak around ~280 nm represents reflection band, which can be explained by the optical transitions near the direct band gap [20]. This characteristic peak of crystalline silicon was a clear indication of the films being crystallized, which has been reported in previous works [21,22].
Figure 3 shows the reflectance spectra for the as-deposited, furnace annealed at 650 °C and flash lamp annealed samples, respectively. The reflectance spectra show similar interference fringes observed in the furnace annealed samples: new peaks at ~280 nm appeared after flash lamp annealing and the interference peaks shifted towards shorter wavelength. Therefore, the film crystalized after the flash lamp treatment.
Similarly, the spectroscopic ellipsometry measurements were carried out for the flash lamp annealed sample. A two-layered optical model as shown in Figure 4a was used to fit the experimental SE data. The layer-1 was assumed to be purely poly-Si and was fitted using Tauc–Lorentz and Gaussian oscillators. The top layer-2 was treated as a Bruggeman’s EMA for poly-Si and void mixture, where poly-Si was fitted using Tauc–Lorentz and Gasussian oscillators. The optical model resulted an excellent fit to the experimental psi and delta curve obtained from SE measurements as can be seen from Figure 4b. The results obtained from the model fitting indicated ~163 nm thick layer of pure poly-Si for layer-1, whereas, the layer-2 indicated very thin layer with thickness ~10 nm of a mixture of poly-Si and void taking into account the roughness of the film after annealing, the volume fraction of void was 8.4%. The presence of these voids could increase surface roughness of the film creating texture surface, which is supported by the AFM images in Figure 5.
An interesting feature of the flash lamp annealed a-Si films was that there was nearly no transition layer between the poly-Si and the substrate. This structural feature was most likely due to the rapid crystallization, during which the a-Si absorbed sufficient energy to crystalize but the diffusions at the film/substrate interface were suppressed. As will be shown later from the X-ray diffraction, the crystal sizes after the flash lamp annealing were less than 16 nm. Again, the spectroscopic ellipsometry was probing equivalent phases for the two “poly-Si” layers, which actually included a significant portion of grain boundaries that were not distinguished in the ellipsometry fitting.

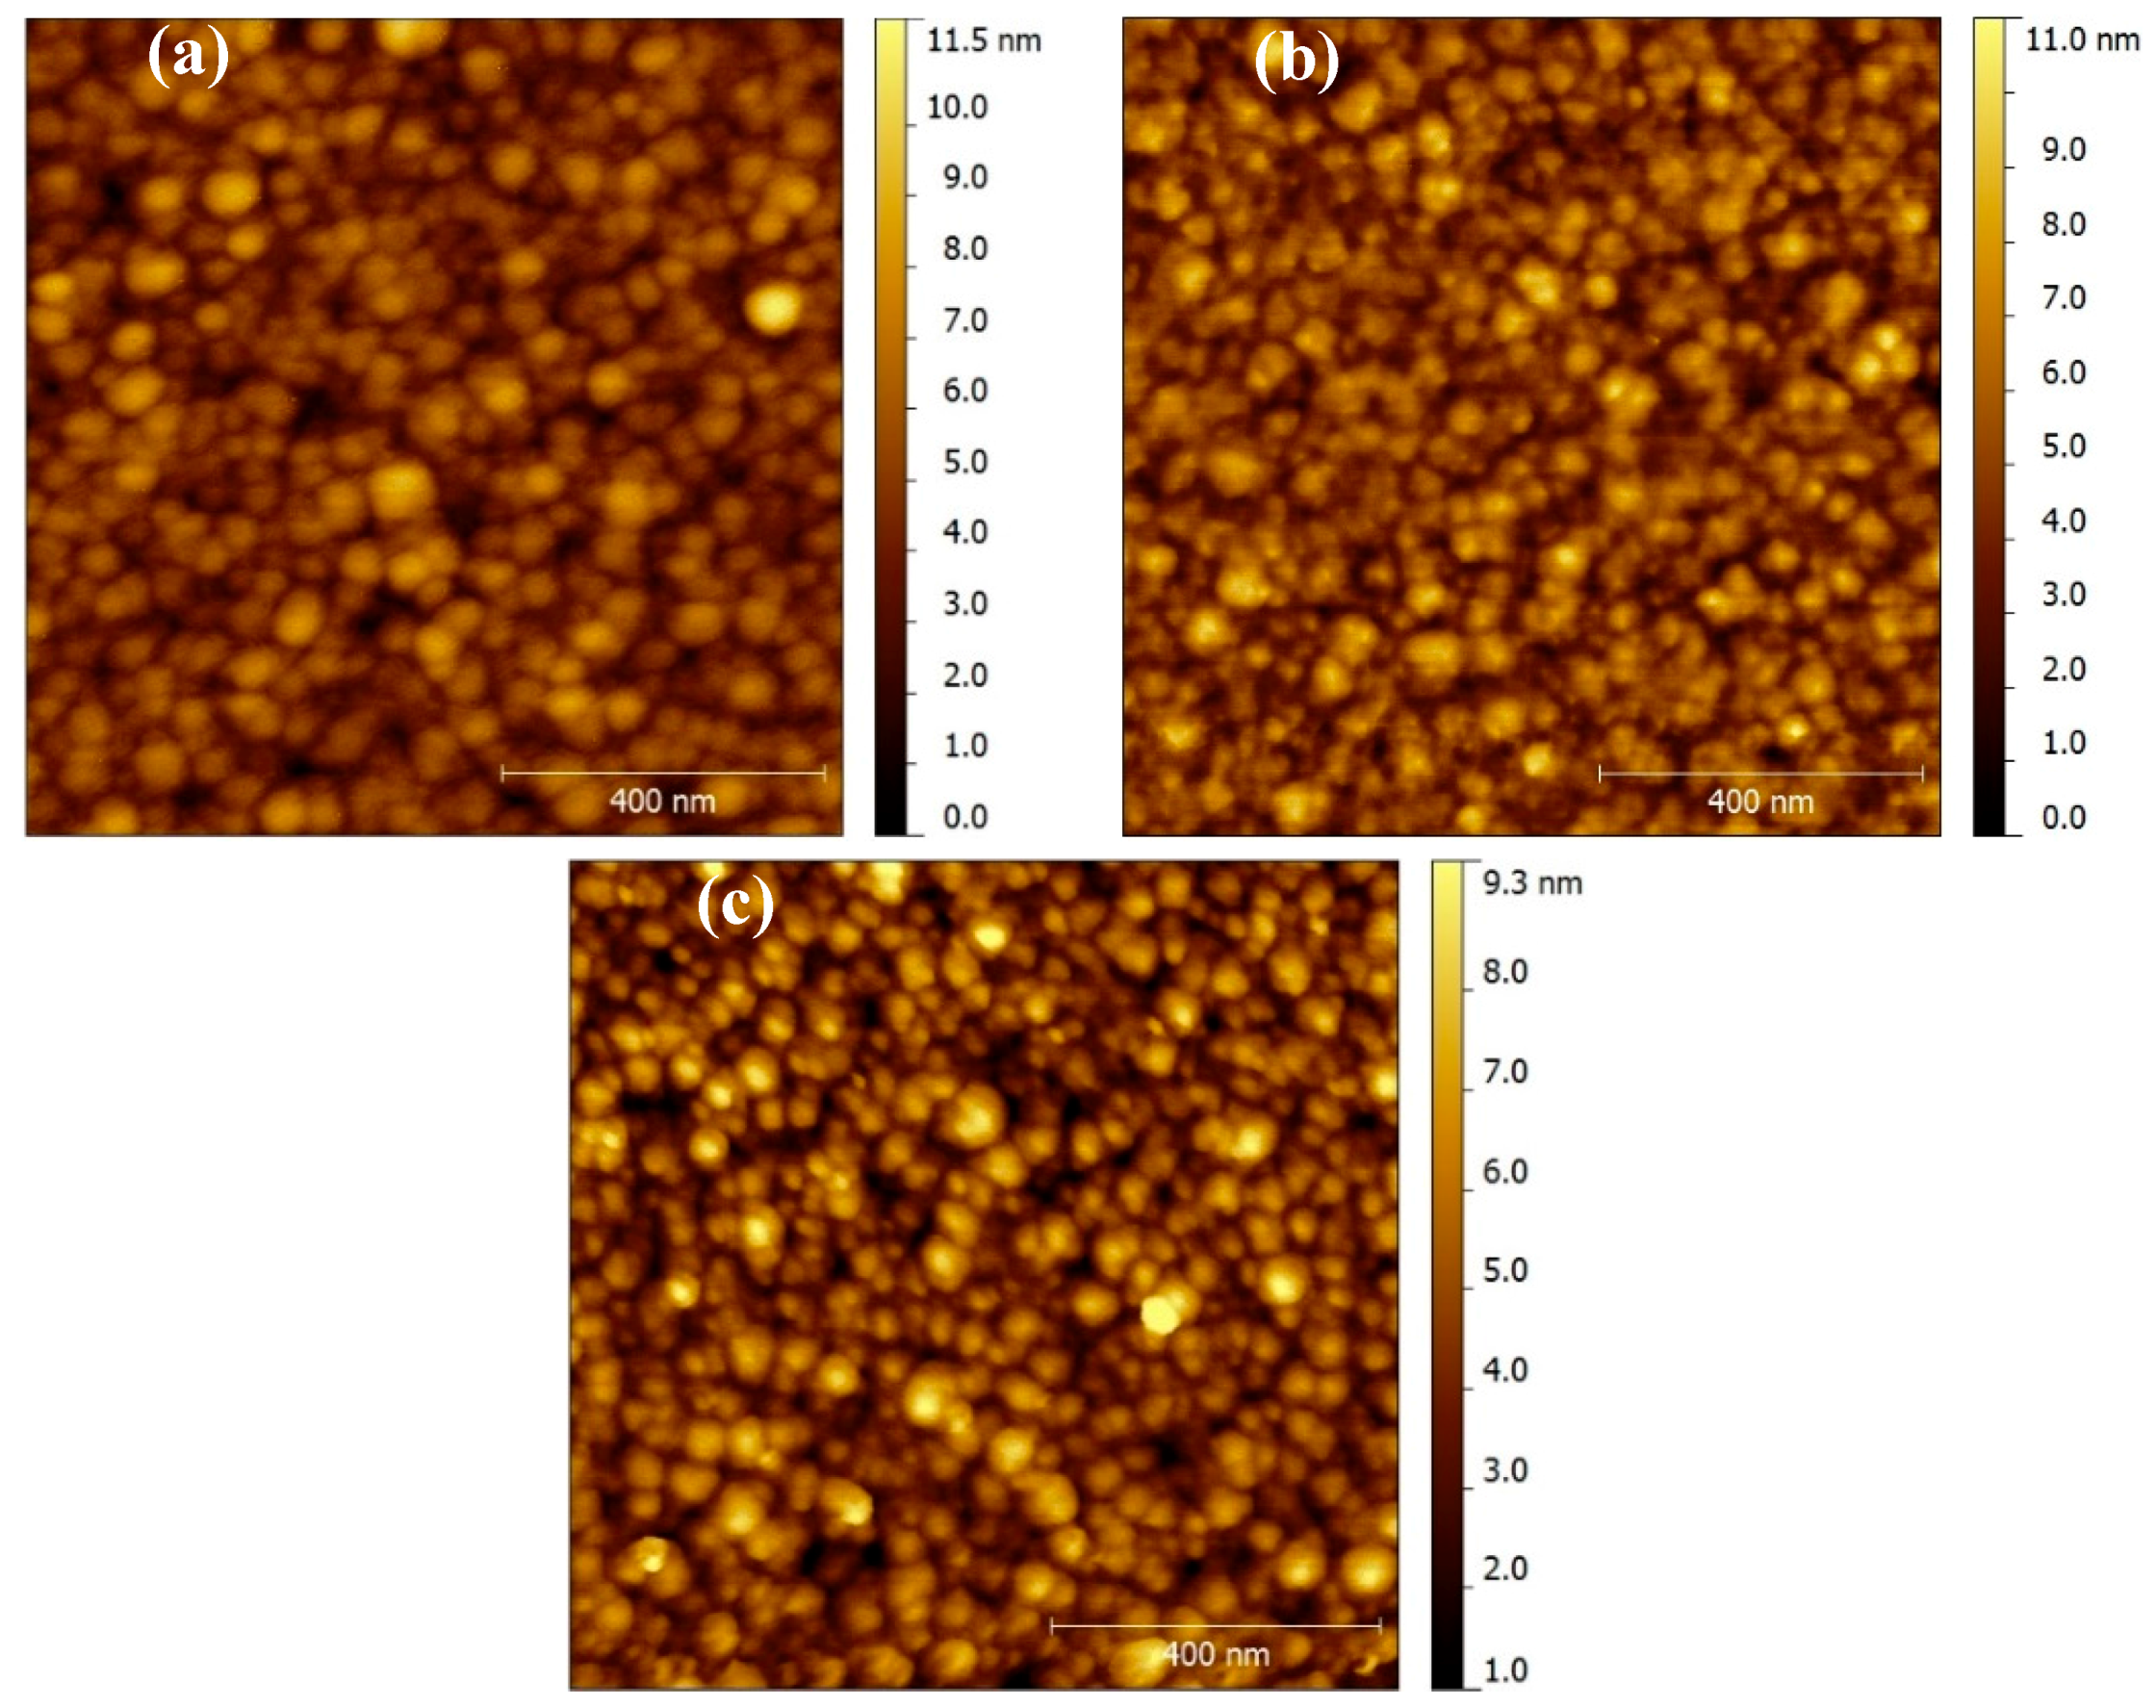
3.2. Surface Topography

Figure 5 shows the AFM surface topography images of as-deposited, furnace annealed and flash lamp annealed silicon thin films. The as-deposited film (Figure 5a) had a relatively smooth surface with high density of tiny clusters. When the films were furnace annealed, the spherical clusters distorted and their dimension increases slightly, as shown in Figure 5b. With increasing the annealing temperature, the clusters agglomerated and formed larger feature size that led to increased RMS roughness from 1.50 ± 0.2 nm to 1.73 ± 0.3 nm (450 °C), 1.85 ± 0.35 nm (550 °C), and 4.15 ± 0.52 nm (650 °C), respectively. When the film was flash lamp annealed as shown in Figure 5c, the size of the clusters became larger. The RMS roughness increased from 1.54 nm to ~4.2 nm. The rougher surface scatters more light and smooth surface acts more as a mirror, hence the flash lamp annealed sample showed lower reflectance as shown in Figure 3 as compared to the furnace annealed at 650 °C. The increased surface roughness may promote light scattering and absorption desired for solar cell applications [23].

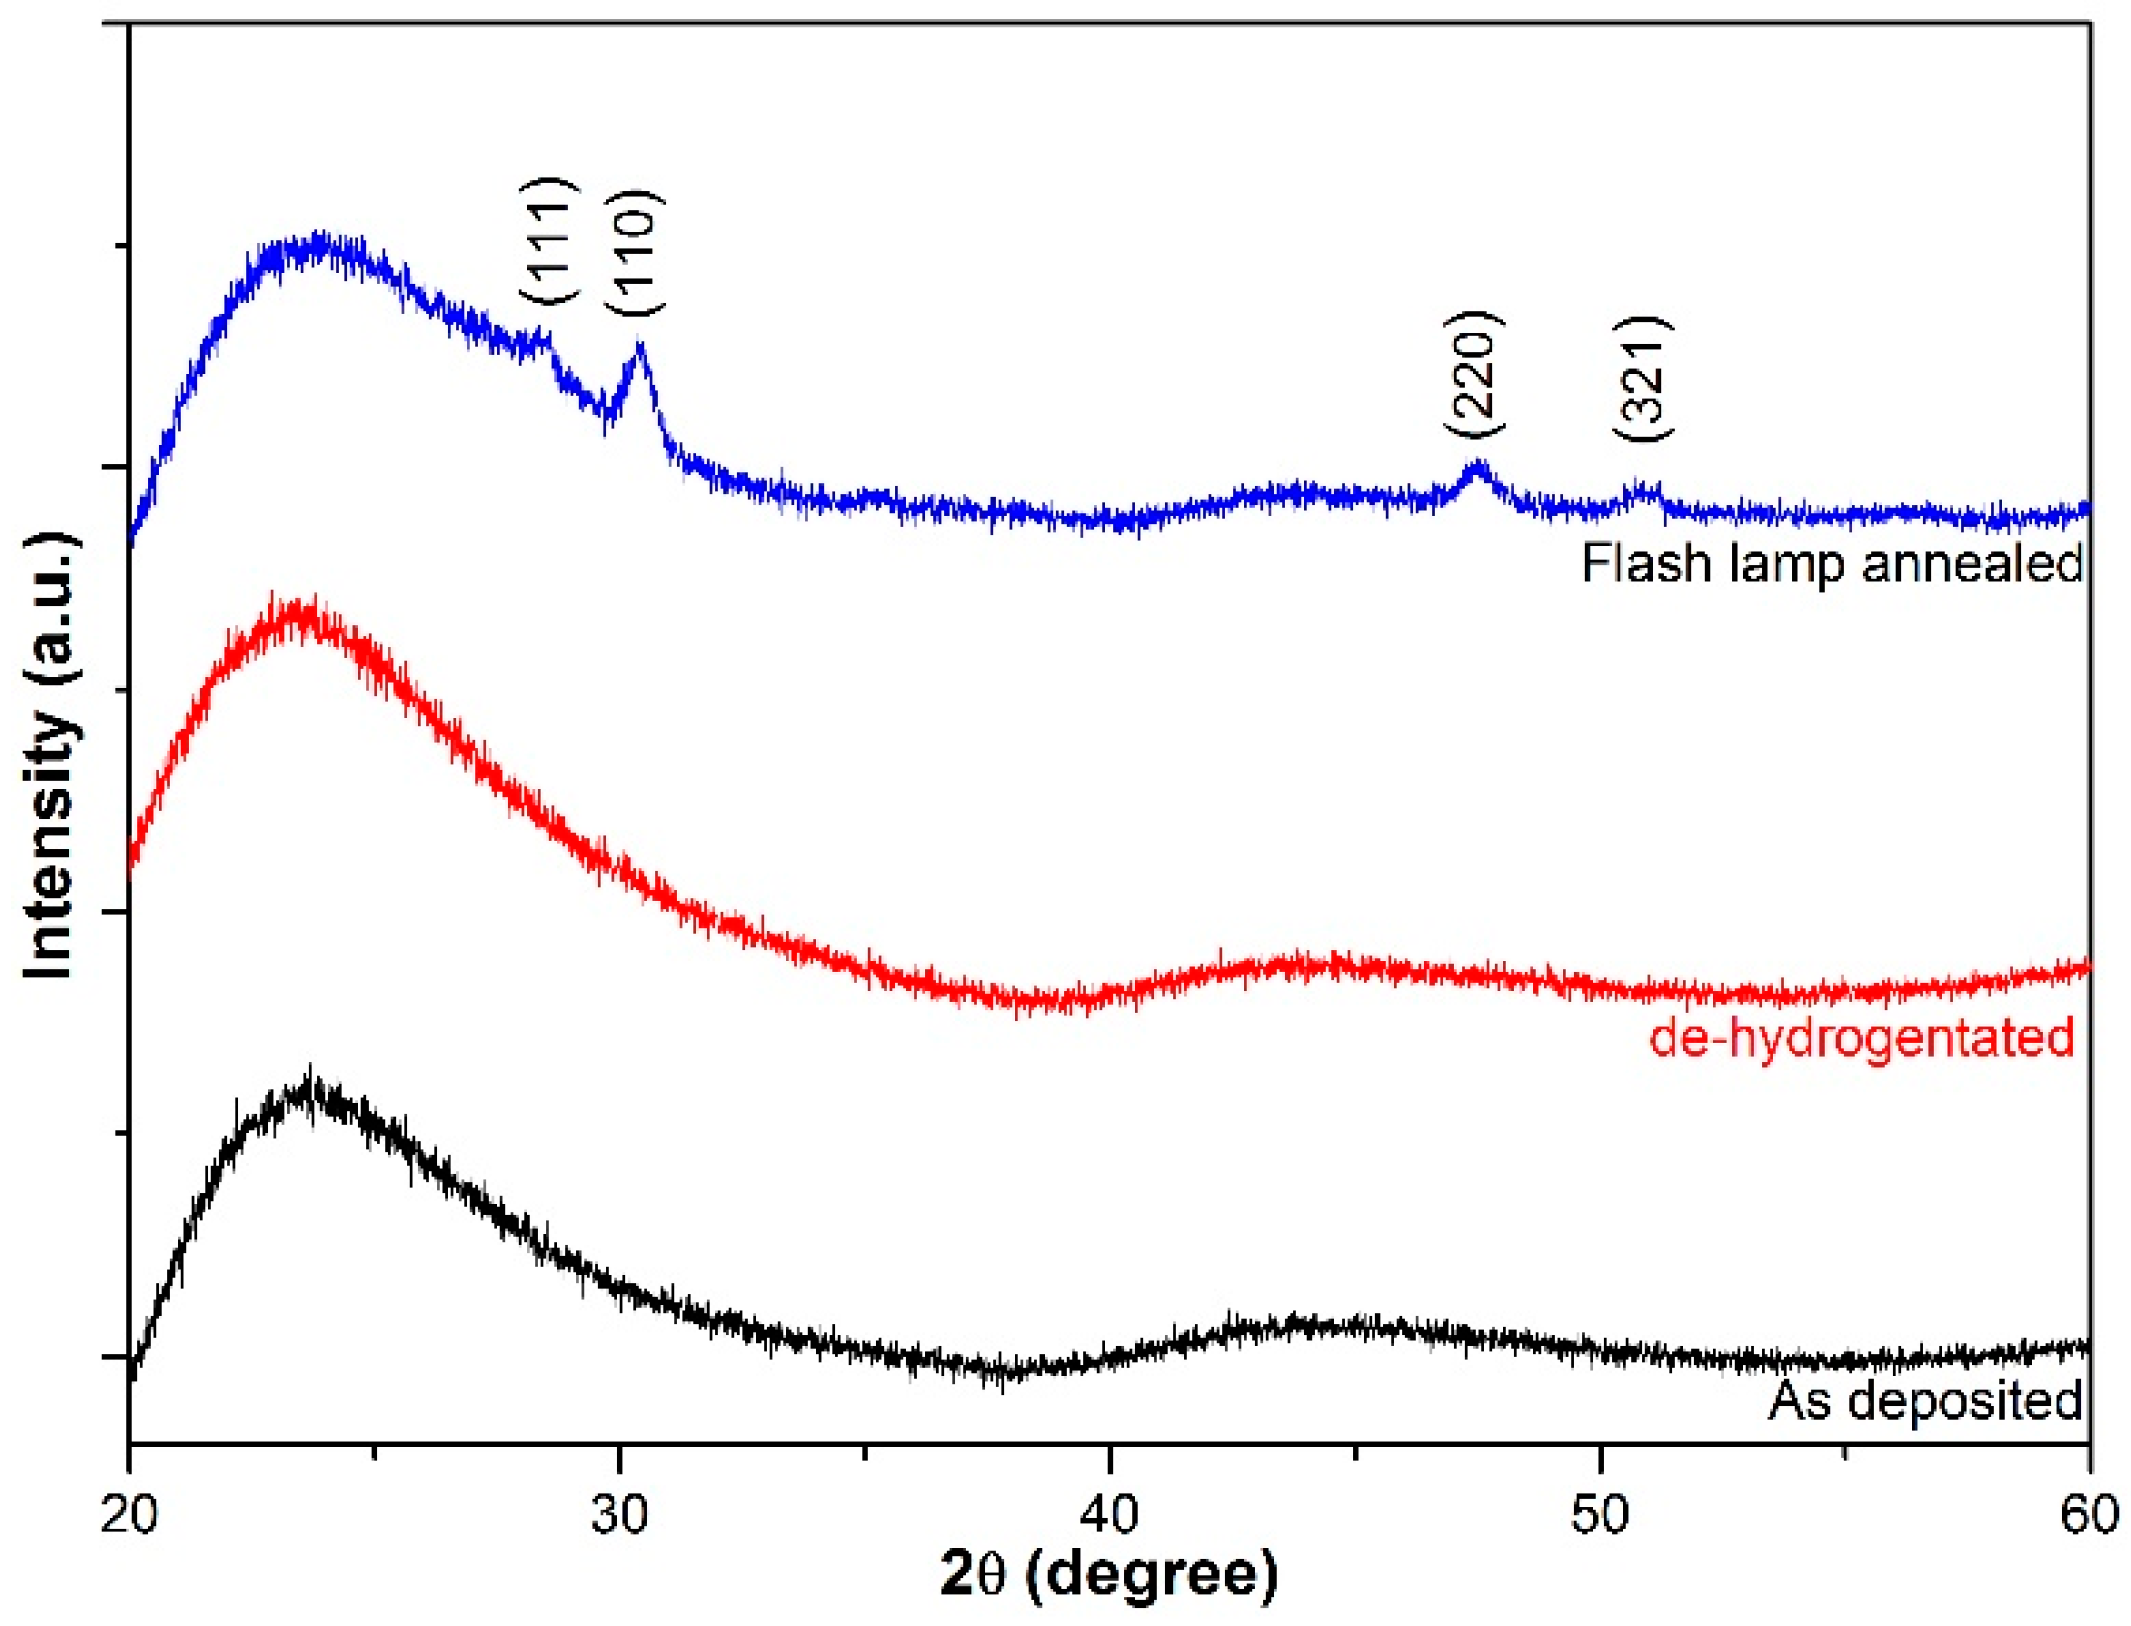
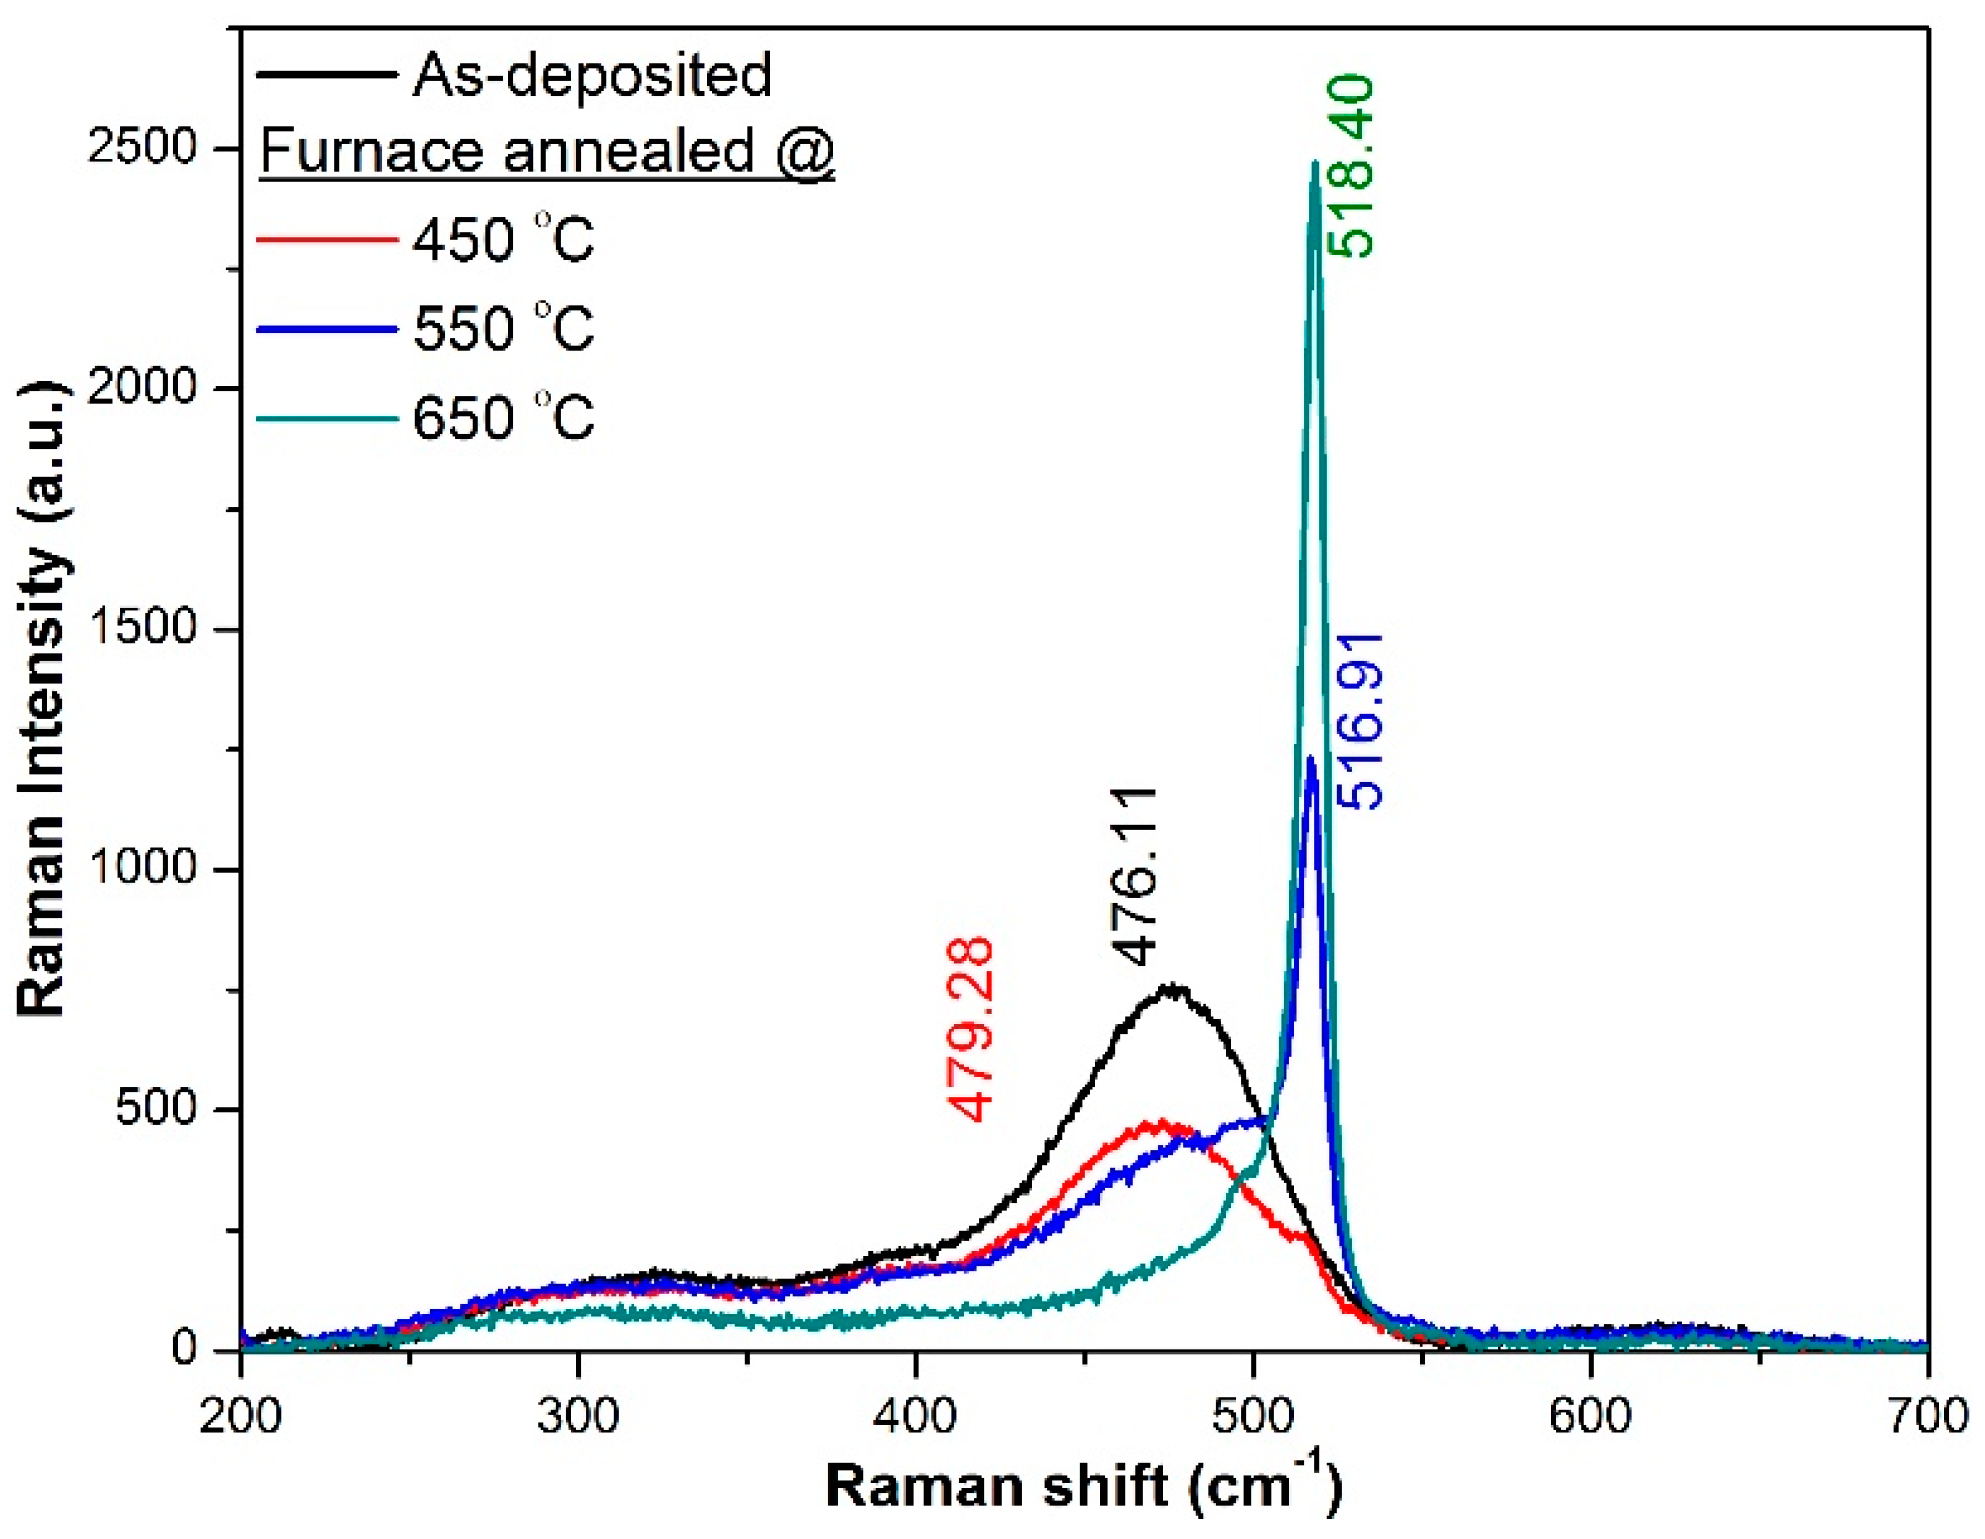
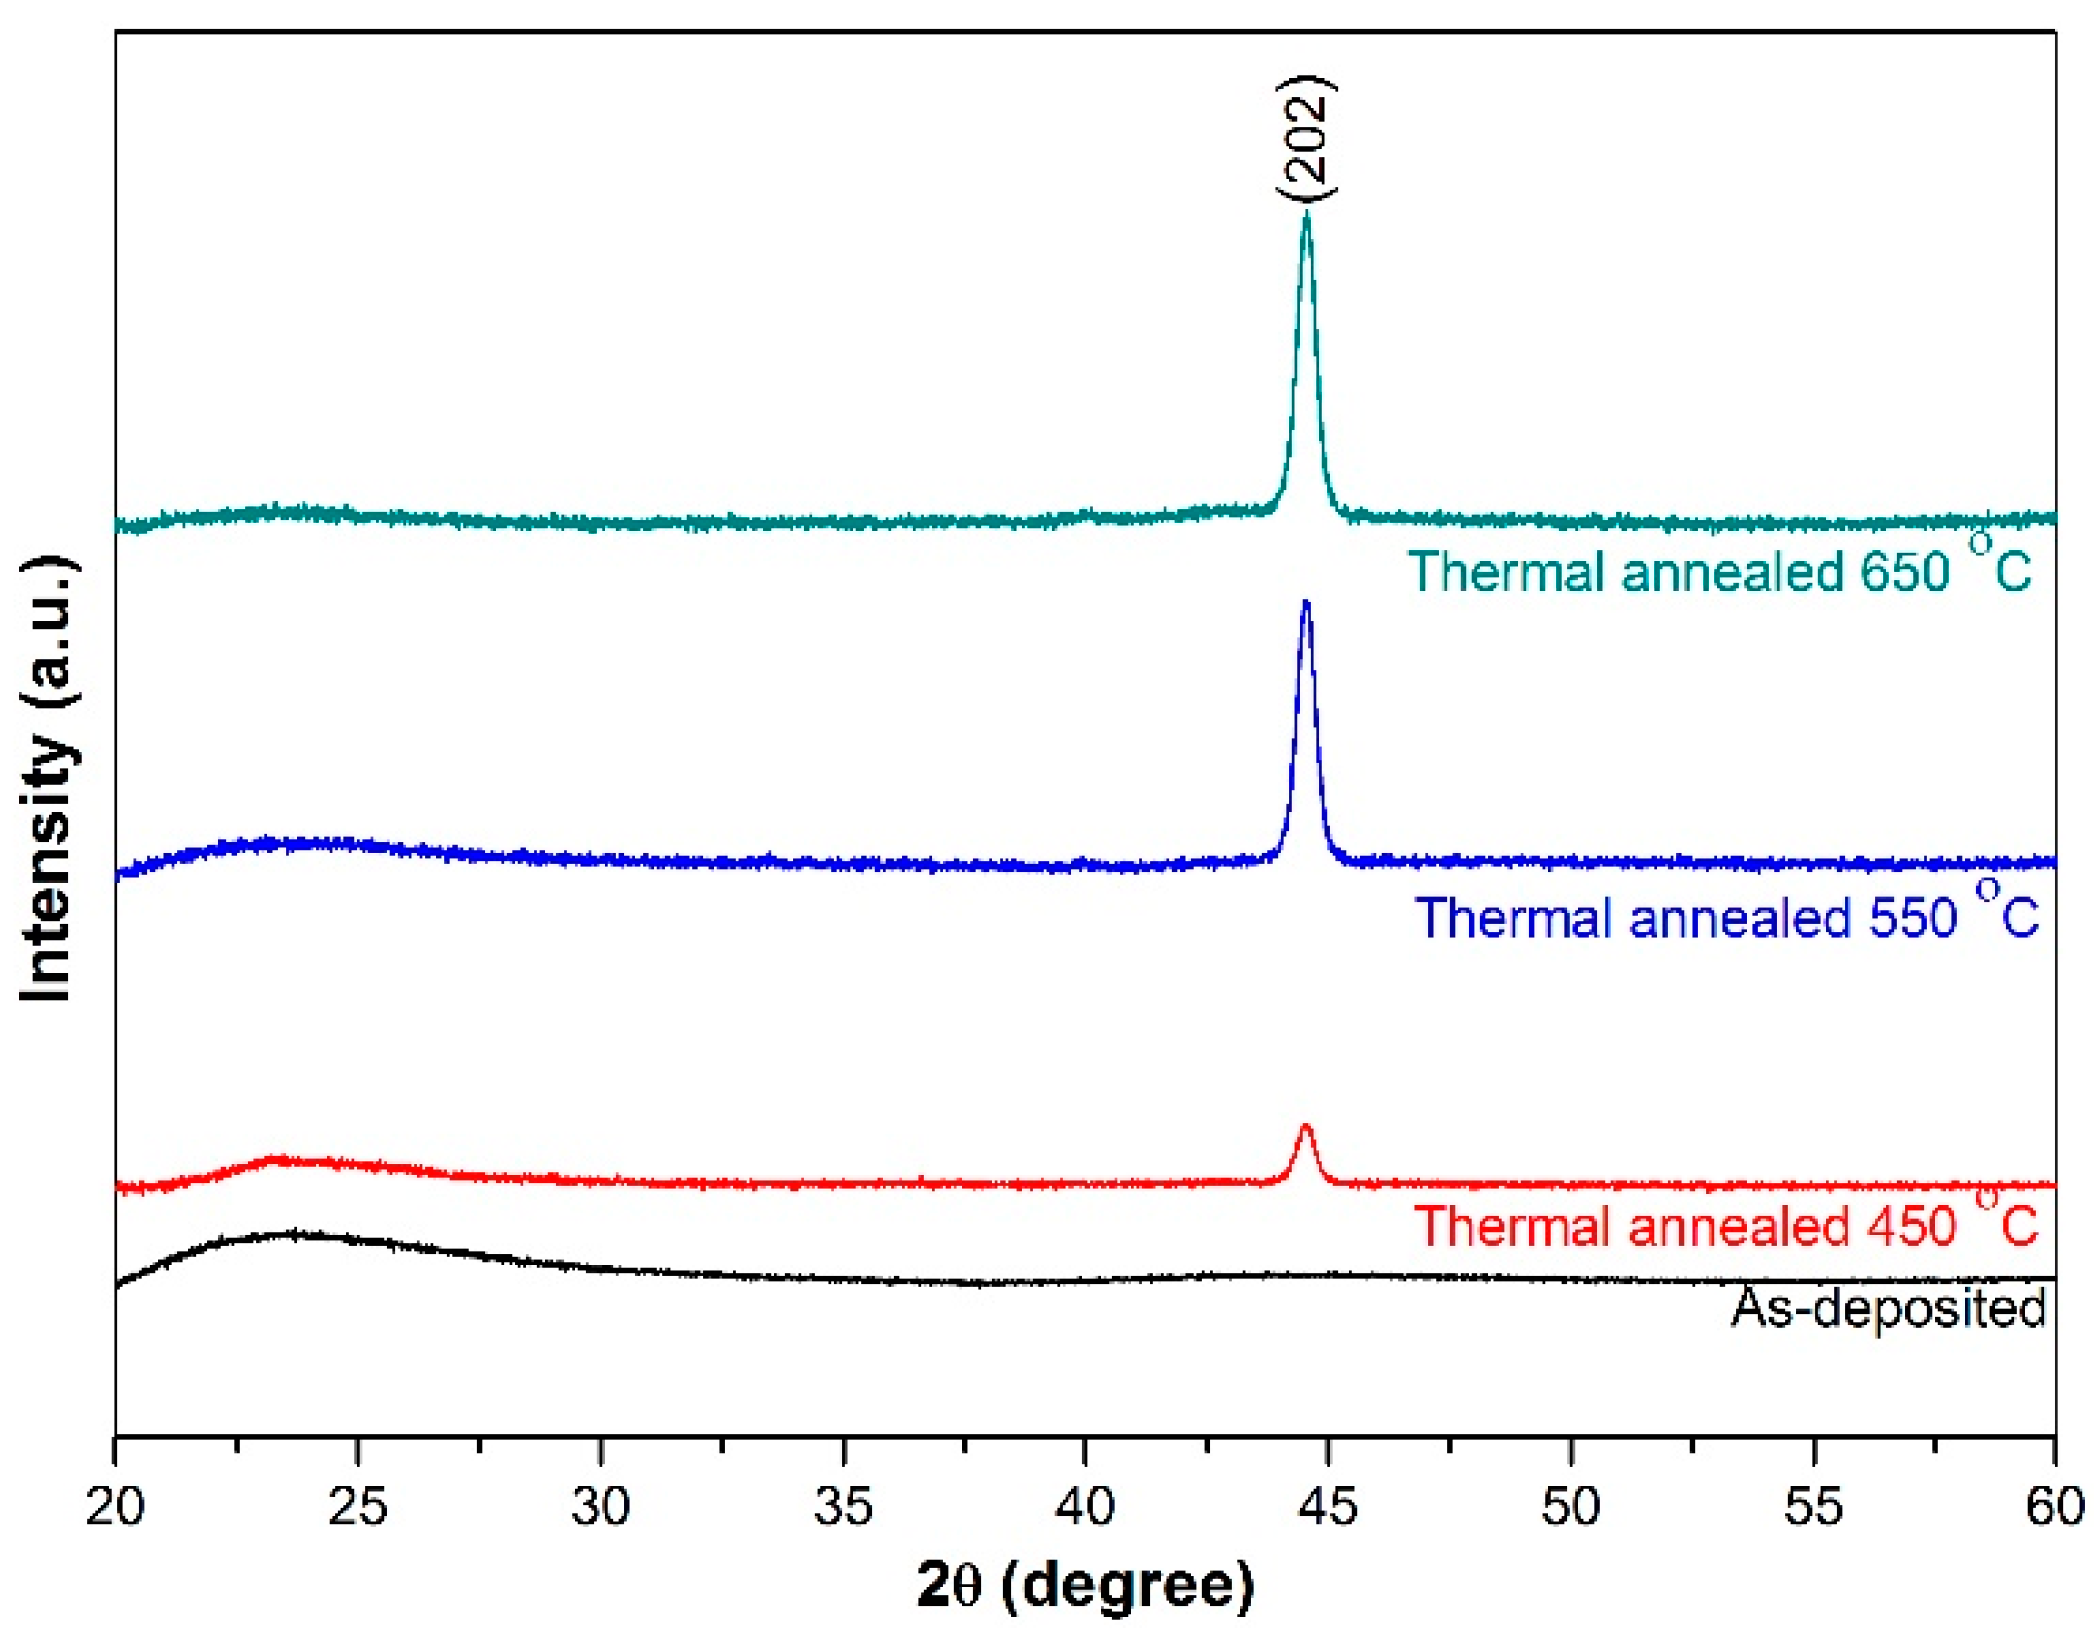
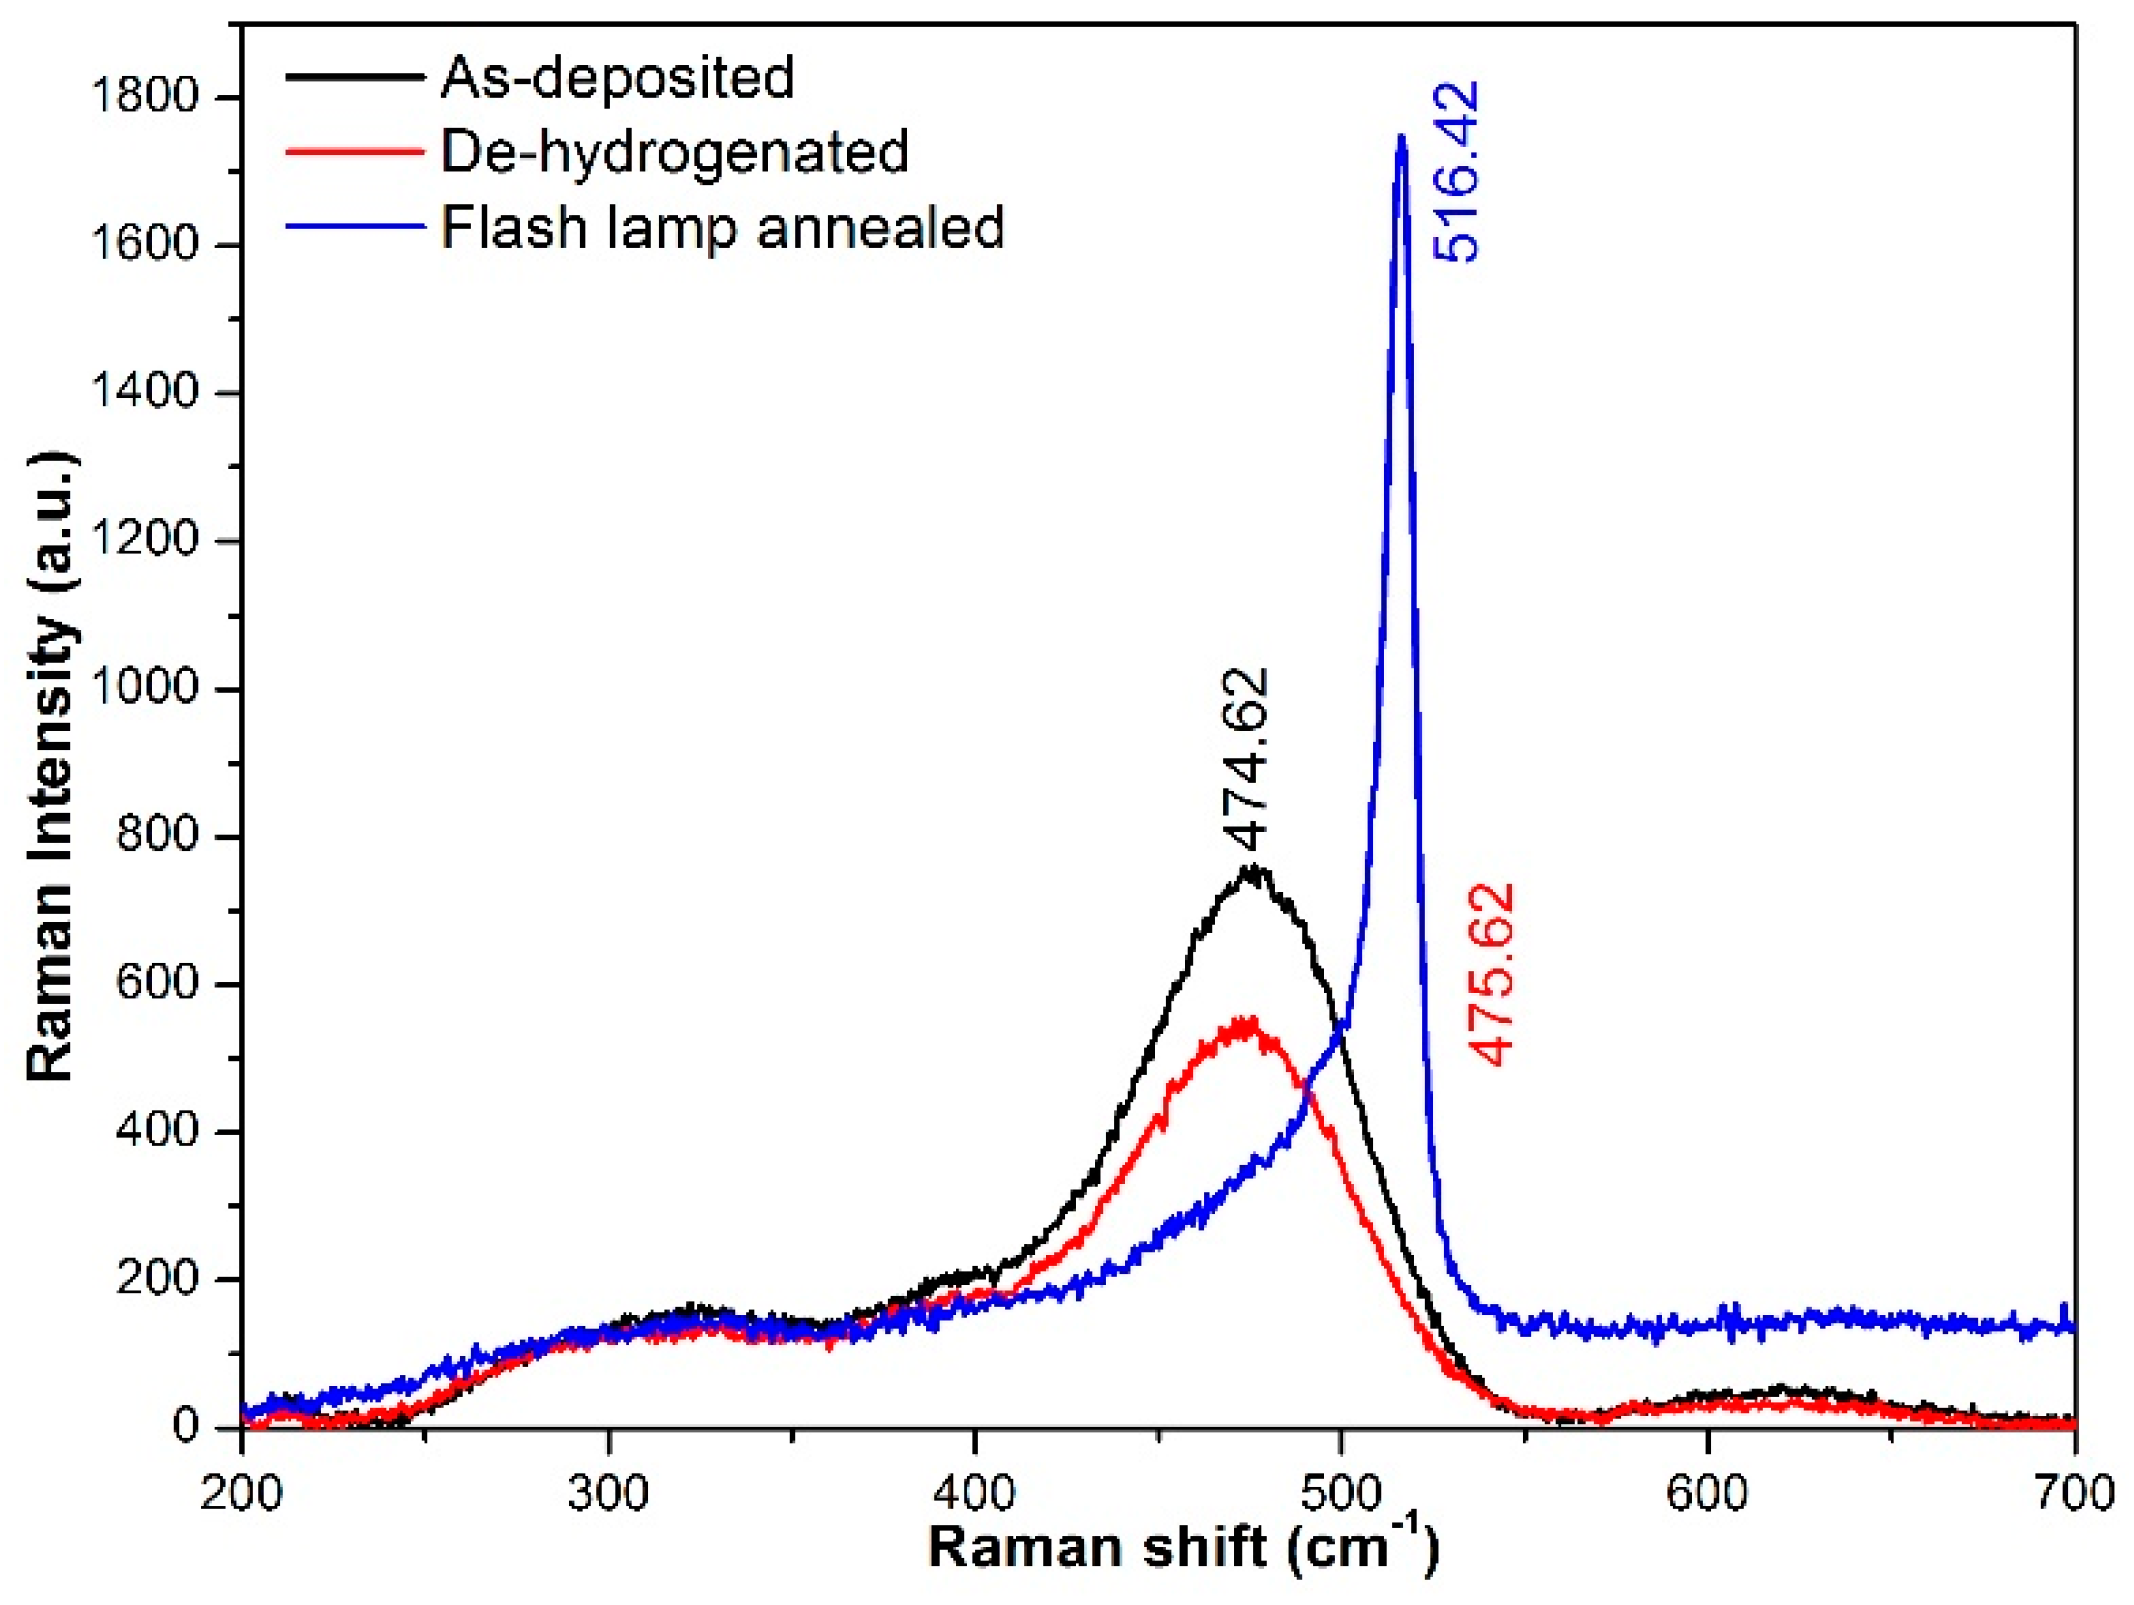
3.3. Crystalline Phase

To quantify the crystallization, XRD measurements were performed. The X-ray diffraction patterns of the as-deposited and furnace annealed films at different temperatures are shown in Figure 6. The as-deposited film did not show any characteristic XRD peak, which was an indication of the film being amorphous [24]. However, furnace annealed samples showed a clear transition from amorphous to crystalline structure, as evidenced by the sharp peak at 44.50°, corresponding to (202) plane. The crystallization increased with increasing the annealing temperature. The average crystallite size was calculated from the full width half maximum (FWHM) of the (202) peak using Scherrer’s equation [25]: τ = 0.9λ/βcosθ, where τ is the mean size of the ordered domains of the crystallites, λ is the incident X-ray wavelength, β is the line broadening at FWHM and θ is the angle of diffraction. The calculated average crystallite size of the furnace annealed samples at 450, 550 and 650 °C was 11.51 ± 1.2 nm, 15 ± 0.8 nm and 20 ± 1.3 nm, respectively. An interesting feature was that only a single (202) peak appeared. This implied that the crystallites tended to grow in one direction.
The X-ray diffraction patterns of the as-deposited and flash lamp annealed films along with de-hydrogenated silicon thin films are shown in Figure 7. The de-hydrogenated silicon thin film showed no sign of crystallization. Note that the de-hydrogenation temperature (500 °C) was slightly higher than the thermal annealing (450 °C), but the former was much shorter (30 min) than the later (6 h). This indicated that thermal annealing crystallization needed sufficient time. On the other hand, the flash lamp annealed samples had several peaks at 2θ of 28.44°, 30.34°, 47.45° and 50.84°, corresponding to (111), (110), (220) and (321) planes, respectively. The calculated average crystallite sizes were 1.6 ± 0.25 nm, 15.8 ± 1.25 nm, 8.0 ± 0.9 nm, and 1.3 ± 0.15 nm, respectively. These results implied that under the rapid crystallization the grains had random orientations.

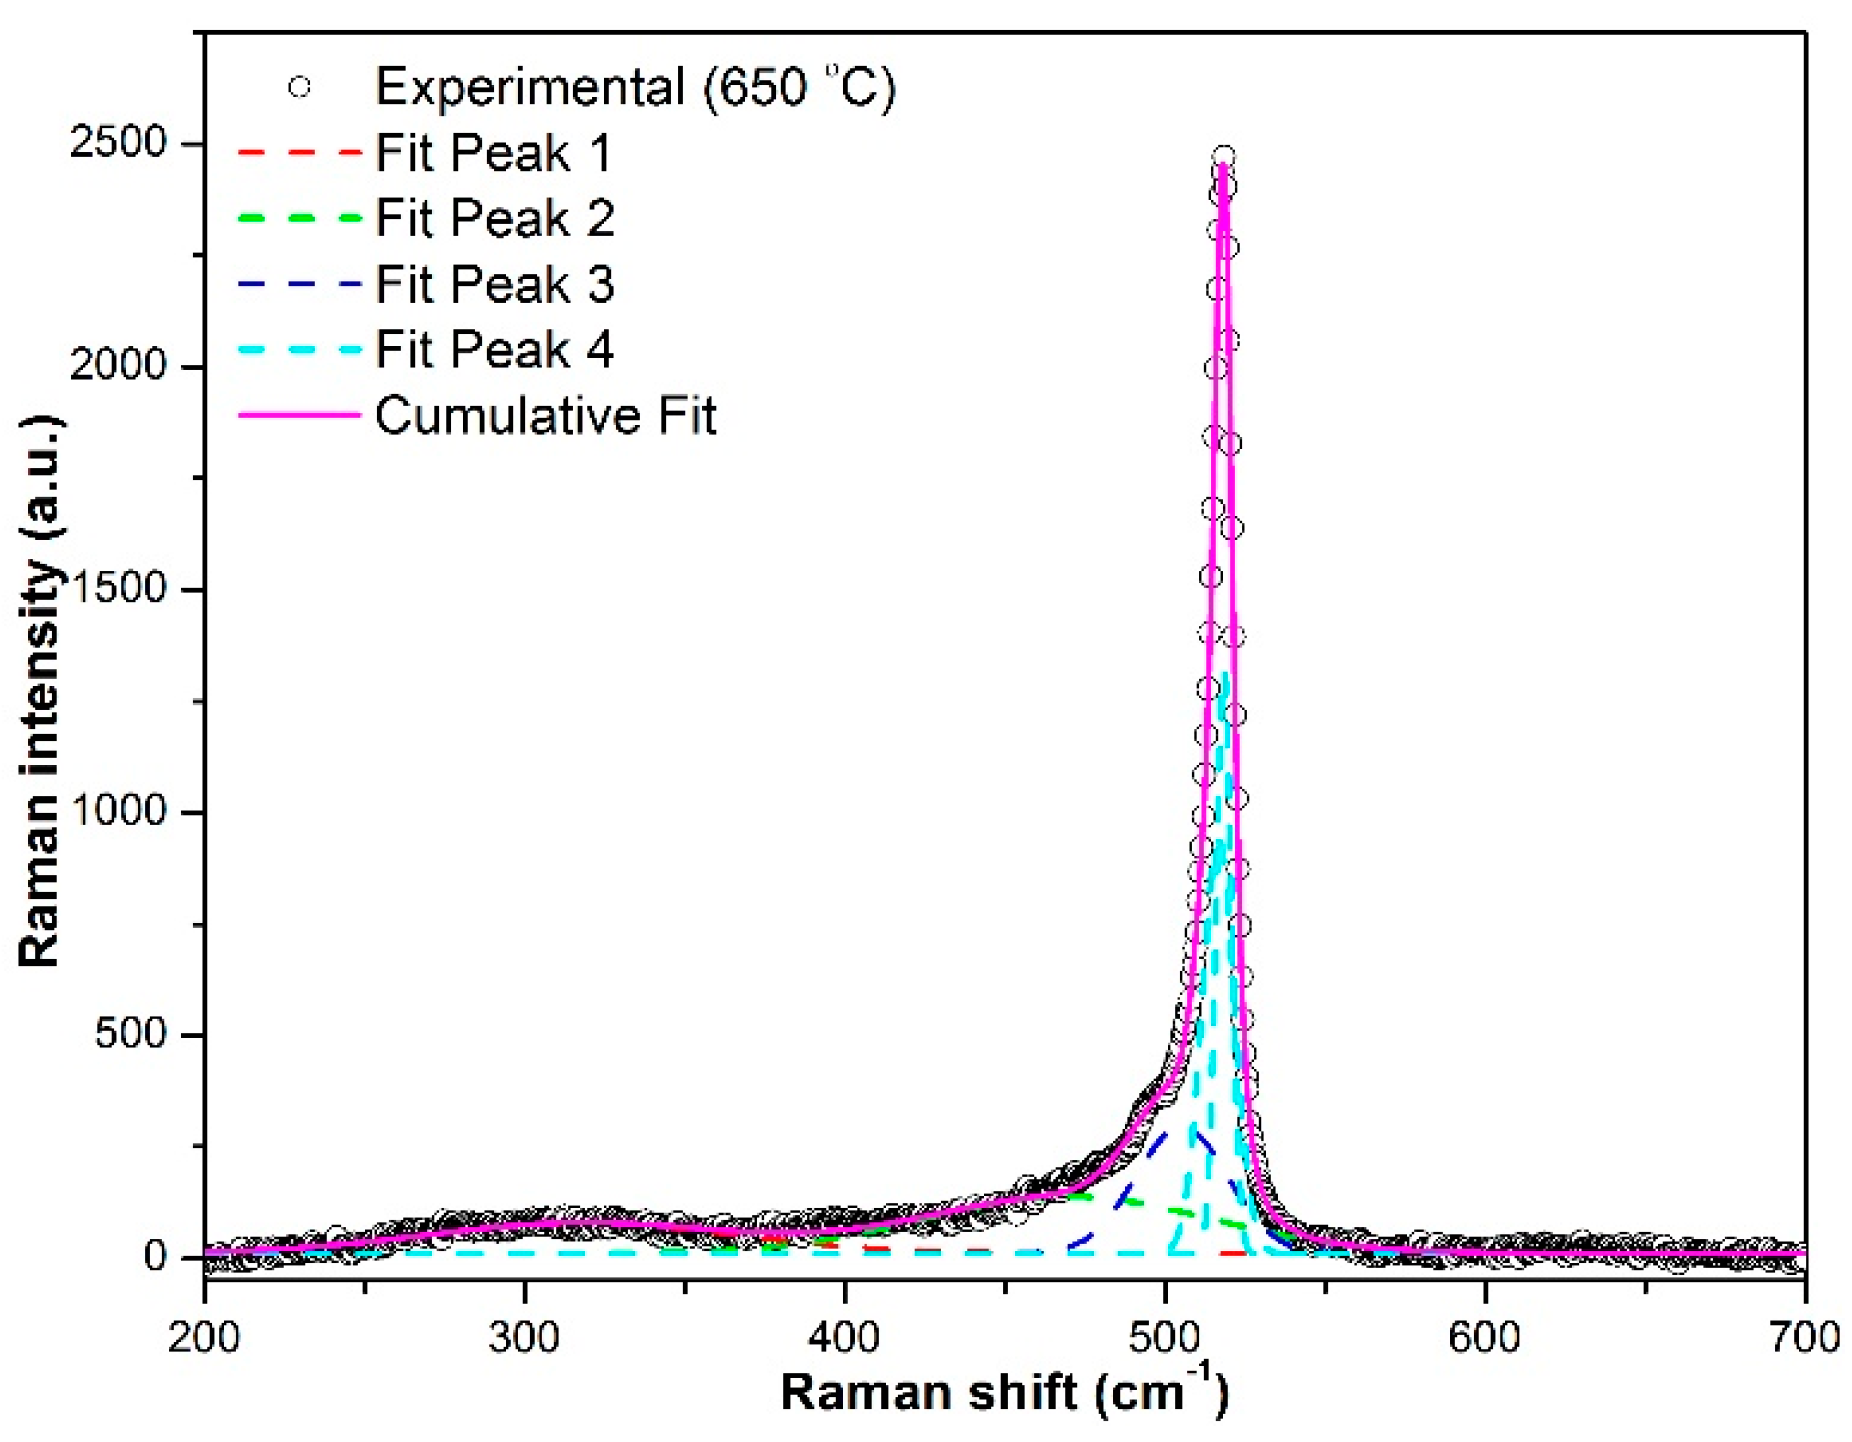
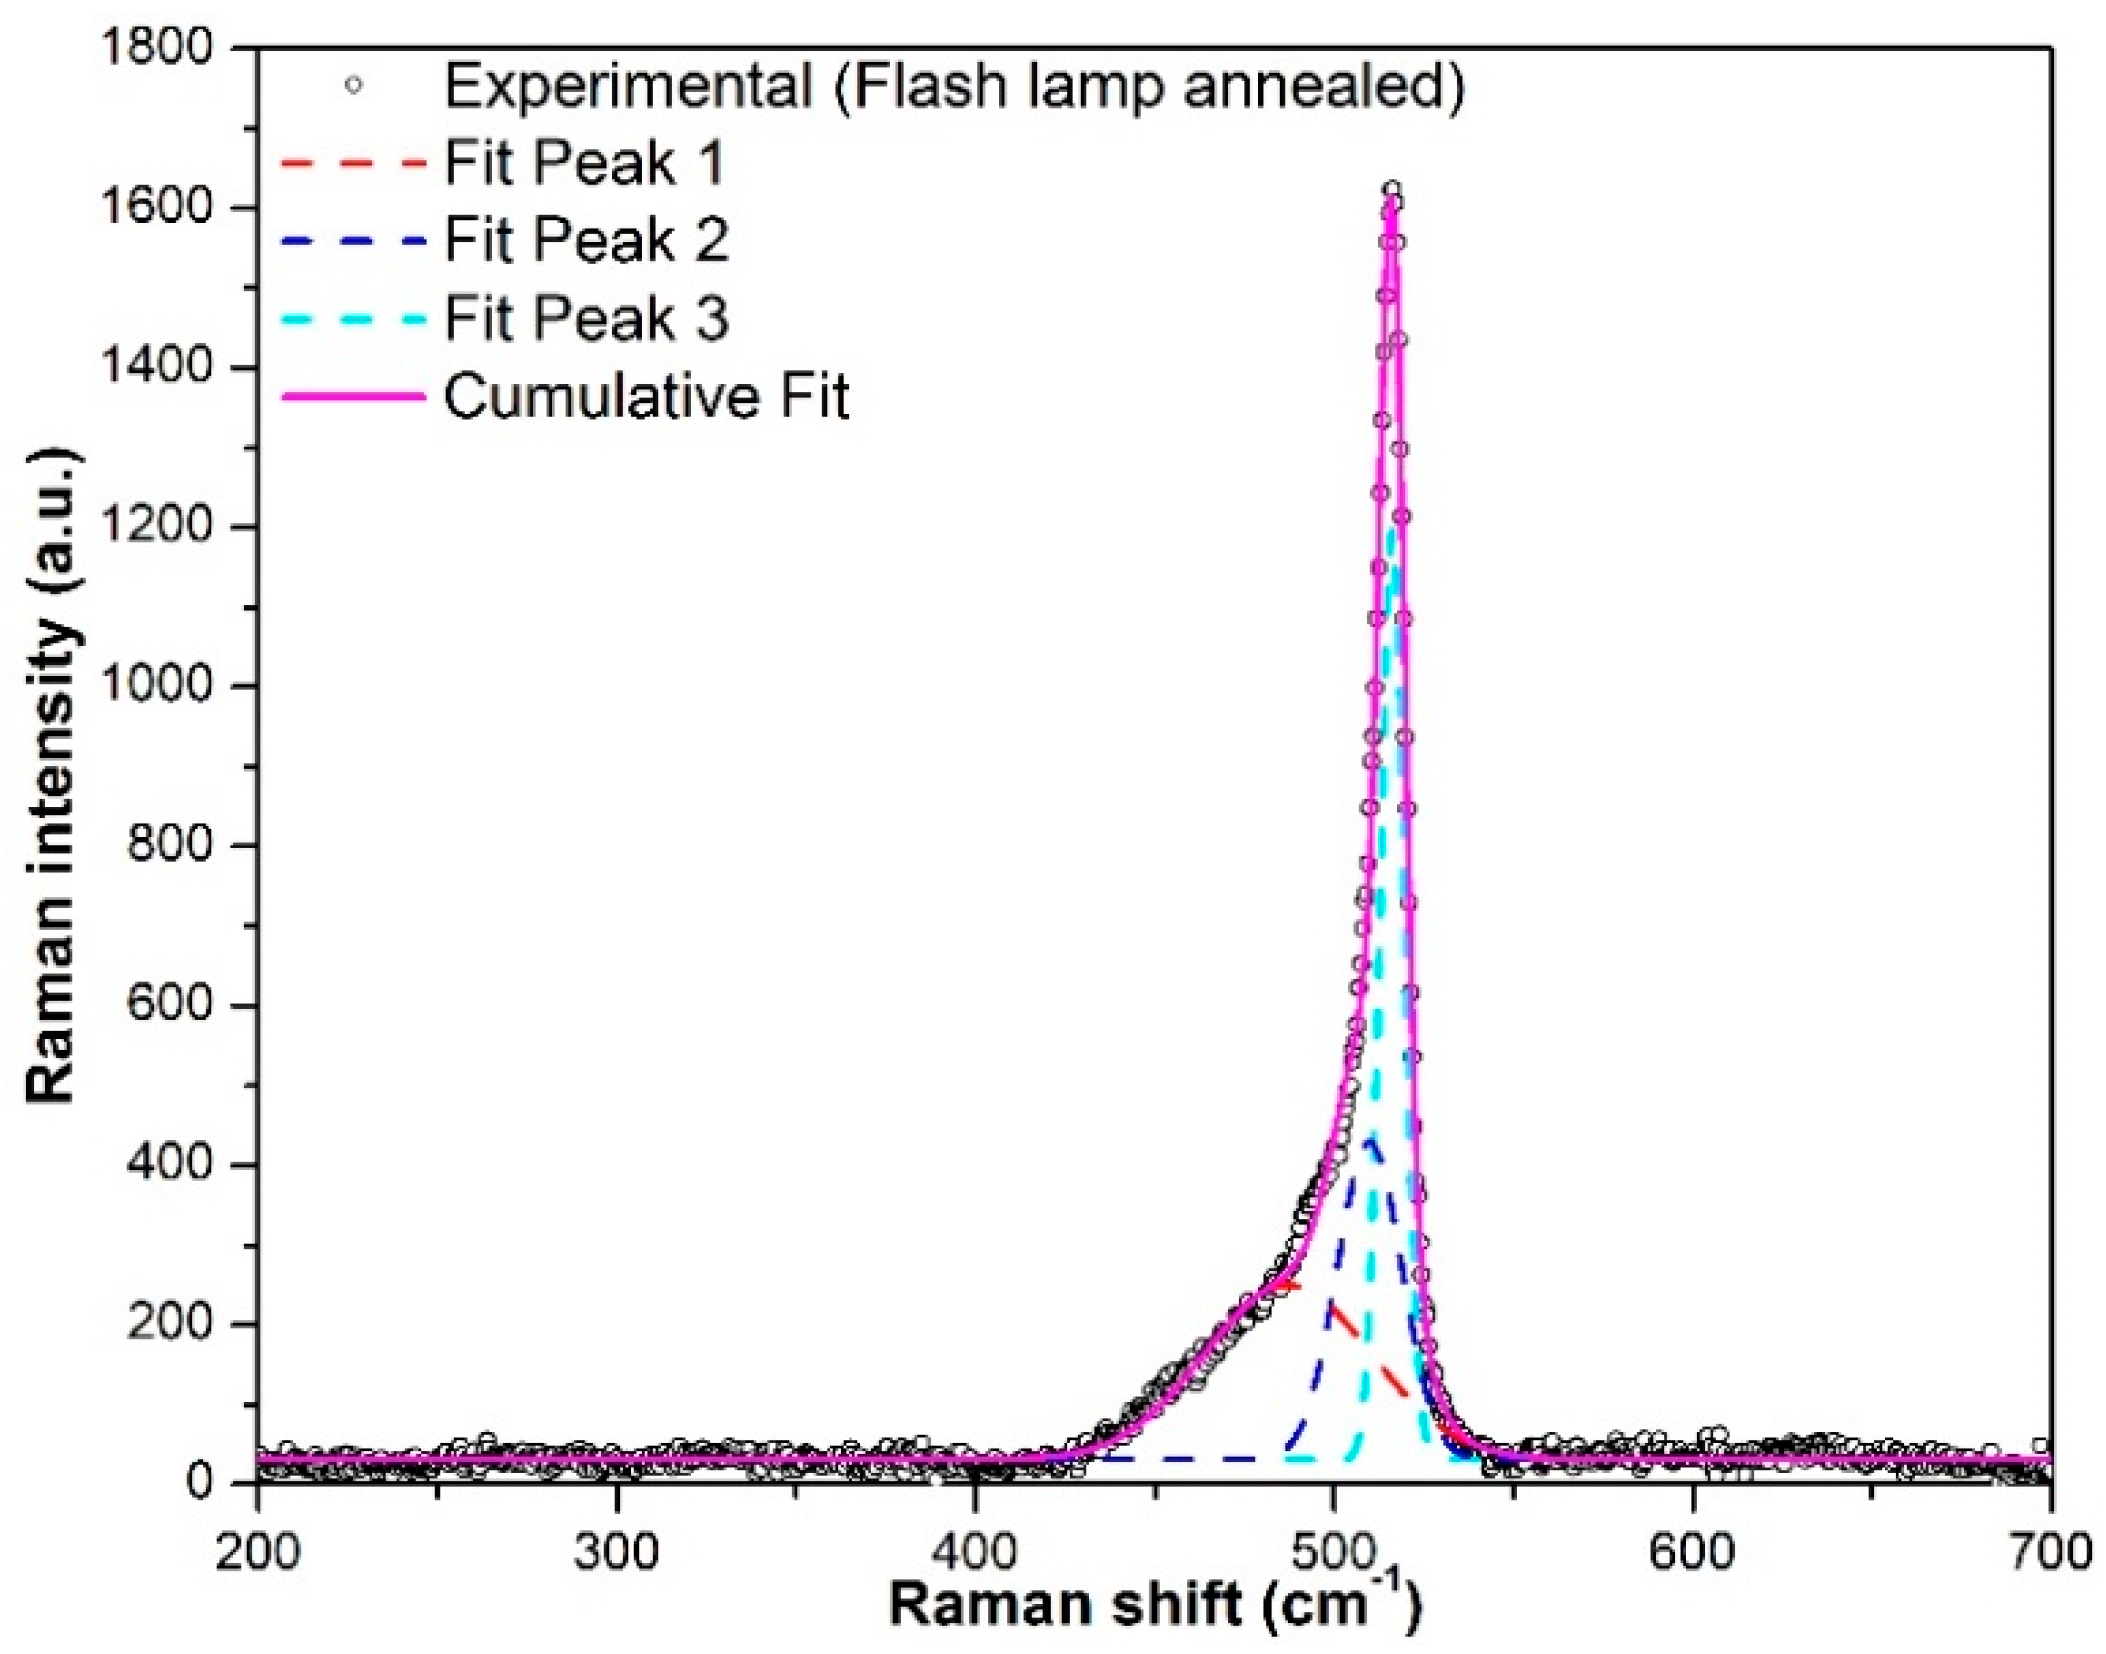
3.4. Crystalline Volume Fraction

To clarify the degree of crystallization, Raman spectroscopy study was performed. Figure 8 shows the Raman spectra of the furnace annealed samples. The as-deposited film had a broad peak around 476.11 cm−1, which corresponds to typical amorphous silicon material. Annealing at 450 °C could not crystallize the film and the Raman spectrum remained similar to the as-deposited film. However, the amorphous peak intensity was reduced as compared to the as-deposited film and there was a sign of additional peak at around 517 cm−1, which was an indication of onset of crystallization. On the other hand, the Raman spectra of the films annealed at 550 °C and 650 °C showed a narrowed peak around 516.91 cm−1 and 518.40 cm−1 respectively, indicating crystallization of the films. The film annealed at 650 °C exhibited typical features of nanocrystalline silicon with significantly high Raman intensity compared to the film annealed at 550 °C. However, the asymmetric shape of the spectra and their deconvolution using Gaussian fitting indicated the presence of disordered bonds and bond angles in the film, indicating amorphous characteristics.
The Raman spectrum of the sample annealed at 650 °C was de-convoluted into four Gaussians curves shown by dotted lines in Figure 9. The fitting was performed by Origin software. The LO-TO (definition) phonon peaks centered at 505.30 cm−1 and 518.31 cm−1 were attributed to nanocrystalline silicon and crystalline silicon phases, respectively, whereas, the peaks at 317.61 cm−1 and 469.76 cm−1 were attributed to amorphous silicon phases [26,27]. The percentage crystallinity of the films was calculated by using the following equation:
X C   =   I C I C   +   γ I A
where, IC and IA are the integral intensities of crystalline and amorphous silicon and γ is the correction factor. For this calculation, γ was taken 0.8 as reported by several others [28,29]. Therefore, the contributions from amorphous and crystalline phases were calculated using all four Gaussian’s integrated intensities as:
I A =   I A ( 317.61   cm 1 )   +   I A ( 469.76   cm 1 )
I C =   I C ( 505.30   cm 1 )   +   I C ( 518.31   cm 1 )
The calculation showed crystalline percentage of ~47.3% for the film annealed at 650 °C. As mentioned above, the crystal sizes in the annealed samples were very small (<20 nm). Therefore, the crystalized films contained a significant portion of grain boundaries. Since Raman spectroscopy detects strains, the lattice relaxation and defects at the boundaries could contribute to the amorphous phase in the Raman analysis. Hence, comparing with ellipsometry analysis, Raman spectroscopy would predict a higher concentration of amorphous phases, which is more likely true. However, Raman spectroscopy may not provide accurate information on the layered structures in the crystalized films as the ellipsometry does. Thus, these analysis techniques could provide complementary information on the film structures, but care must be taken to interpret the results.
Figure 10 shows Raman spectra of the de-hydrogenated and flash lamp annealed silicon thin films. The Raman spectrum of the de-hydrogenated film was similar to the as-deposited film and confirmed that the de-hydrogenation process did not crystallize the film. On the other hand, flash lamp annealed film showed a narrow peak around 516.42 cm−1, which indicated the presence of crystalline silicon. However, the asymmetric shape of the spectra and its deconvolution using Gaussian fitting indicated the presence of disordered bonds and bond angles in the film, which represented amorphous characteristics similar to furnace annealed samples.
The de-convoluted three Gaussians curves of the Raman spectrum for the flash lamp annealed sample is shown in Figure 11. Again, the LO-TO phonon peaks centered at 509.80 and 516.31 cm−1 were attributed to nanocrystalline silicon and crystalline silicon phases, respectively, whereas, a peak at 487.28 cm−1 was attributed to amorphous silicon phase. Therefore, the contributions from amorphous and crystalline phases were calculated using all three Gaussian’s integrated intensities as:
I A =   I A ( 487.28   cm 1 )  
I C =   I C ( 509.80   cm 1 )   +   I C ( 516.31   cm 1 )
The calculation showed crystalline percentage of ~61.3% for the flash lamp annealed film. The flash lamp annealed sample showed higher crystalline volume fraction compared to the furnace annealed samples. This result implied that, under the flash lamp annealing conditions, the a-Si film experienced a temperature much higher than the furnace annealing (650 °C). On the other hand, no deformation in the glass substrate was observed after the flash lamp treatment. Considering the spectroscopic ellipsometry results discussed in Section 3.1, we deduced that the energy transferred to the substrate was insignificant. It is worth noting the uncertainty in determining the crystalline fraction by fitting the Raman spectra as described above was generally rather high. The method would be appropriate for qualitative comparison. Complementary characterization techniques (e.g., ellipsometry and transmission electron microscopy) are needed for better understanding the films’ microstructures.

4. Conclusions

A comparative study of the furnace and flash lamp annealed amorphous silicon thin films was performed. The reflectance measurement of these samples indicated a new peak in the UV region ~280 nm of the reflectance spectra for the furnace annealed and flash lamp annealed films, which provided evidence of crystallization. The surface topography images captured by AFM indicated a relatively smooth surface for the as-deposited sample. The surface roughness increased with increasing the annealing temperature and after the flash lamp annealing. XRD measurement indicated that the as-deposited sample was purely amorphous. However, after furnace annealing, there was a distinct peak corresponding to preferential crystallographic orientation (202). The peak intensity increased and line-width decreased with increasing the annealing temperature. The size of the crystallites also increased with the annealing temperature. However, the flash lamp annealed film had random orientations with different sizes of crystallites. The flash lamp annealed film was better crystallized compared to furnace annealed ones. Raman spectroscopy showed the asymmetric shape of the spectra and de-convoluting the spectra using Gaussian fitting indicated the presence of disordered bonds and bond angles in the film. The crystalline volume fraction was estimated to be 23.5%, 47.3%, and 61.3% for the samples annealed at 550 °C, 650 °C, and with flash lamp, respectively. Spectroscopic ellipsometry measurement provided optical thickness of the samples, which were decreased after annealing. The improved crystallinity after flash lamp annealing was due to passivation of intra-grain defects and grain boundary defects as silicon atoms are allowed to find their lowest energy state.

Acknowledgments

The authors would like to thank David Stevenson and Baojie Yan from Wintek Electro-Optics Corp (Ann Arbor, MI, USA) for providing the samples. This material is also based upon work supported by the National Science Foundation Grant No. 1700785.

Author Contributions

Maheshwar Shrestha and Qi Hua Fan initiated the design of experiment. Keliang Wang did Raman Spectroscopy and AFM measurements. Bocong Zheng analyzed the ellipsometry data. Laura Mokrzycki performed vacuum furnace annealing experiments. Maheshwar Shrestha did the rest of the experiments, analyzed the data and scripted the paper while supervised by Qi Hua Fan.

Conflicts of Interest

The authors declare no conflict of interest. The founding sponsors had no role in the design of the study; in the collection, analyses, or interpretation of data; in the writing of the manuscript, and in the decision to publish the results.

References

  1. Endo, Y.; Fujiwara, T.; Ohdaira, K.; Nishizaki, S.; Nishioka, K.; Matsumura, H. Thin-film polycrystalline silicon solar cells formed by flash lamp annealing of a-Si films. Thin Solid Films 2010, 518, 5003–5006. [Google Scholar] [CrossRef]
  2. Ohdaira, K.; Endo, Y.; Fujiwara, T.; Nishizaki, S.; Matsumura, H. Formation of highly uniform micrometer-order-thick polycrystalline silicon films by flash lamp annealing of amorphous silicon on glass substrates. Jpn. J. Appl. Phys. 2007, 46, 7603. [Google Scholar] [CrossRef]
  3. Bergmann, R.B. Crystalline Si thin-film solar cells: A review. Appl. Phys. A 1999, 69, 187–194. [Google Scholar] [CrossRef]
  4. Tran, N.T.; Keyes, M.P. Polysilicon films prepared by plasma enhanced chemical vapor deposition: Effect of substrate temperatureand annealing temperature. Phys. Status Solidi (a) 1991, 126, K143–K148. [Google Scholar] [CrossRef]
  5. Yamauchi, N.; Reif, R. Polycrystalline silicon thin films processed with silicon ion implantation and subsequent solid-phase crystallization: Theory, experiments, and thin-film transistor applications. J. Appl. Phys. 1994, 75, 3235–3257. [Google Scholar] [CrossRef]
  6. Herd, S.R.; Chaudhari, P.; Brodsky, M.H. Metal contact induced crystallization in films of amorphous silicon and germanium. J. Non-Cryst. Solids 1972, 7, 309–327. [Google Scholar] [CrossRef]
  7. Boyce, J.B.; Mei, P.; Fulks, R.T.; Ho, J. Laser processing of polysilicon thin-film transistors: Grain growth and device fabrication. Phys. Status Solidi (a) 1998, 166, 729–741. [Google Scholar] [CrossRef]
  8. Pécz, B.; Dobos, L.; Panknin, D.; Skorupa, W.; Lioutas, C.; Vouroutzis, N. Crystallization of amorphous-Si films by flash lamp annealing. Appl. Surf. Sci. 2005, 242, 185–191. [Google Scholar] [CrossRef]
  9. Yan, B.; Dubey, M.; Shrestha, M.; Fan, Q.; Stevenson, D. Pulsed-lamp crystallization of nanocrystalline silicon thin films for solar cell application. In Proceedings of the 29th European Photovoltaic Solar Energy Conference and Exhibition, Amsterdam, The Netherlands, 22–26 September 2014; pp. 1921–1925. [Google Scholar]
  10. Ohdaira, K.; Nishizaki, S.; Endo, Y.; Fujiwara, T.; Usami, N.; Nakajima, K.; Matsumura, H. High-quality polycrystalline silicon films with minority carrier lifetimes over 5 µs formed by flash lamp annealing of precursor amorphous silicon films prepared by catalytic chemical vapor deposition. Jpn. J. Appl. Phys. 2007, 46, 7198. [Google Scholar] [CrossRef]
  11. Ohdaira, K.; Fujiwara, T.; Endo, Y.; Nishizaki, S.; Matsumura, H. Explosive crystallization of amorphous silicon films by flash lamp annealing. J. Appl. Phys. 2009, 106, 044907. [Google Scholar] [CrossRef]
  12. Ohdaira, K.; Fujiwara, T.; Endo, Y.; Nishizaki, S.; Matsumura, H. Formation of several-micrometer-thick polycrystalline silicon films on soda lime glass by flash lamp annealing. Jpn. J. Appl. Phys. 2008, 47, 8239. [Google Scholar] [CrossRef]
  13. Ohdaira, K.; Nishikawa, T.; Shiba, K.; Takemoto, H.; Matsumura, H. Drastic suppression of the optical reflection of flash-lamp-crystallized poly-Si films with spontaneously formed periodic microstructures. Thin Solid Films 2010, 518, 6061–6065. [Google Scholar] [CrossRef]
  14. Terai, F.; Matunaka, S.; Tauchi, A.; Ichimura, C.; Nagatomo, T.; Homma, T. Xenon flash lamp annealing of poly-Si thin films. J. Electrochem. Soc. 2006, 153, H147–H150. [Google Scholar] [CrossRef]
  15. Jellison, G.E.; Merkulov, V.I.; Puretzky, A.A.; Geohegan, D.B.; Eres, G.; Lowndes, D.H.; Caughman, J.B. Characterization of thin-film amorphous semiconductors using spectroscopic ellipsometry. Thin Solid Films 2000, 377, 68–73. [Google Scholar] [CrossRef]
  16. Jellison, G.E. Data analysis for spectroscopic ellipsometry. Thin Solid Films 1993, 234, 416–422. [Google Scholar] [CrossRef]
  17. Aspnes, D.E.; Theeten, J.B.; Hottier, F. Investigation of effective-medium models of microscopic surface roughness by spectroscopic ellipsometry. Phys. Rev. B 1979, 20, 3292. [Google Scholar] [CrossRef]
  18. Jellison, G.E., Jr. Spectroscopic ellipsometry data analysis: Measured versus calculated quantities. Thin Solid Films 1998, 313, 33–39. [Google Scholar] [CrossRef]
  19. Santjojo, D.J.; Aizawa, T.; Muraishi, S. Ellipsometric characterization on multi-layered thin film systems during hydrogenation. Mater. Trans. 2007, 48, 1380–1386. [Google Scholar] [CrossRef]
  20. Bisi, O.; Ossicini, S.; Pavesi, L. Porous silicon: A quantum sponge structure for silicon based optoelectronics. Surf. Sci. Rep. 2000, 38, 1–126. [Google Scholar] [CrossRef]
  21. Ben Slama, S.; Hajji, M.; Ezzaouia, H. Crystallization of amorphous silicon thin films deposited by pecvd on nickel-metalized porous silicon. Nanoscale Res. Lett. 2012, 7, 464. [Google Scholar] [CrossRef] [PubMed]
  22. Timoshenko, V.Y.E.; Gonchar, K.A.; Mirgorodskiy, I.V.; Maslova, N.E.E.; Nikulin, V.E.; Mussabek, G.K.; Taurbaev, Y.T.; Svanbayev, E.A.; Taurbaev, T.I. Efficient visible luminescence of nanocrystalline silicon prepared from amorphous silicon films by thermal annealing and stain etching. Nanoscale Res. Lett. 2011, 6, 349. [Google Scholar] [CrossRef] [PubMed]
  23. Garnett, E.; Yang, P. Light trapping in silicon nanowire solar cells. Nano Lett. 2010, 10, 1082–1087. [Google Scholar] [CrossRef] [PubMed]
  24. Laaziri, K.; Kycia, S.; Roorda, S.; Chicoine, M.; Robertson, J.L.; Wang, J.; Moss, S.C. High-energy X-ray diffraction study of pure amorphous silicon. Phys. Rev. B 1999, 60, 13520. [Google Scholar] [CrossRef]
  25. Vallat-Sauvain, E.; Kroll, U.; Meier, J.; Shah, A.; Pohl, J. Evolution of the microstructure in microcrystalline silicon prepared by very high frequency glow-discharge using hydrogen dilution. J. Appl. Phys. 2000, 87, 3137–3142. [Google Scholar] [CrossRef]
  26. Wei, W.; Xu, G.; Wang, J.; Wang, T. Raman spectra of intrinsic and doped hydrogenated nanocrystalline silicon films. Vacuum 2007, 81, 656–662. [Google Scholar] [CrossRef]
  27. Leitch, A.W.R.; Alex, V.; Weber, J. Raman spectroscopy of hydrogen molecules in crystalline silicon. Phys. Rev. Lett. 1998, 81, 421. [Google Scholar] [CrossRef]
  28. Voutsas, A.T.; Hatalis, M.K.; Boyce, J.; Chiang, A. Raman spectroscopy of amorphous and microcrystalline silicon films deposited by low-pressure chemical vapor deposition. J. Appl. Phys. 1995, 78, 6999–7006. [Google Scholar] [CrossRef]
  29. Tsu, R.; Gonzalez-Hernandez, J.; Chao, S.S.; Lee, S.C.; Tanaka, K. Critical volume fraction of crystallinity for conductivity percolation in phosphorus-doped Si:F:H alloys. Appl. Phys. Lett. 1982, 40, 534–535. [Google Scholar] [CrossRef]
Figure 1. Reflectance spectra of furnace annealed amorphous silicon thin films at different temperatures.
Coatings 08 00097 g001
Figure 2. Spectroscopic ellipsometer (SE) results for furnace annealed Si film at 650 °C: Optical model used for fitting SE data (a) and experimental (solid) and fitted (dotted) plot for psi (Ψ) and delta (Δ) vs. wavelength (b).
Coatings 08 00097 g002
Figure 3. Reflectance spectra of as-deposited, furnace annealed at 650 °C and flash lamp annealed Si thin films.
Coatings 08 00097 g003
Figure 4. SE results for flash lamp annealed Si film: Optical model used for fitting SE data (a) and experimental (solid) and fitted (dotted) plot for psi and delta vs. wavelength (b).
Coatings 08 00097 g004
Figure 5. Atomic force microscope (AFM) surface topography of plasma enhanced chemical vapor deposition (PECVD) silicon thin films: (a) as-deposited; (b) furnace annealed at 650 °C; and (c) flash lamp annealed.
Coatings 08 00097 g005
Figure 6. X-ray diffraction patterns of PECVD silicon thin films: as-deposited, furnace annealed at 450 °C, furnace annealed at 550 °C, and furnace annealed at 650 °C. Preferred crystallographic orientation was (202). The vertical axis was plotted with y-offset for comparison.
Coatings 08 00097 g006
Figure 7. X-ray diffraction patterns of PECVD silicon thin films: as-deposited, de-hydrogenated, and flash lamp annealed. The vertical axis was plotted with y-offset for comparison.
Coatings 08 00097 g007
Figure 8. Raman spectra of furnace annealed PECVD silicon thin films at different temperatures.
Coatings 08 00097 g008
Figure 9. Raman spectra of furnace annealed PECVD silicon thin film at 650 °C. The experimental data is shown with symbol (o), solid magenta color represents the cumulative Gaussian fit, and the remaining four dotted curves are deconvoluted Gaussian peaks.
Coatings 08 00097 g009
Figure 10. Raman spectra of as-deposited, de-hydrogenated, and flash lamp annealed PECVD silicon thin films.
Coatings 08 00097 g010
Figure 11. Raman spectra of flash lamp annealed PECVD silicon thin film. The expermental data is shown with symbol (o), solid magenta color represents cumulative Gaussian fit, and the remaining three dotted curves are deconvoluted Gaussian peaks.
Coatings 08 00097 g011
Table 1. a-Si:H deposition conditions, where d is the gap distance between the cathode and substrate.
RF Power (W)Press. (Torr)H2 (sccm)SiH4 (sccm)Ts (°C)d (mm)
15005.010,00010015012

