Corrosion Resistance of Pipeline Steel with Damaged Enamel Coating and Cathodic Protection

1
Department of Civil, Architectural, and Environmental Engineering, Missouri University of Science and Technology, Rolla, MO 65409-0030, USA
2
Roesch Inc., Belleville, IL 62226, USA
*
Author to whom correspondence should be addressed.
Coatings 2018, 8(5), 185; https://doi.org/10.3390/coatings8050185
Submission received: 20 February 2018
/
Revised: 12 April 2018
/
Accepted: 9 May 2018
/
Published: 14 May 2018
(This article belongs to the Special Issue Coatings for Harsh Environments)
Abstract
:This paper presents the first report on the corrosion resistance of pipeline steel with damaged enamel coating and cathodic protection in 3.5 wt % NaCl solution. In particular, dual cells are set up to separate the solution in contact with the damaged and intact enamel coating areas, to produce a local corrosion resistance measurement for the first time. Enamel-coated steel samples, with two levels of cathodic protection, are tested to investigate their impedance by electrochemical impedance spectroscopy (EIS) and their cathodic current demand by a potentiostatic test. Due to its glass transition temperature, the enamel-coated pipeline can be operated on at temperatures up to 400 °C. The electrochemical tests show that cathodic protection (CP) can decelerate the degradation process of intact coating and delay the electrochemical reactions at the enamel-steel interface. However, CP has little effect on the performance of coating once damaged and can prevent the exposed steel from corrosion around the damaged site, as verified by visual inspections. Scanning electron microscopy (SEM) indicated no delamination at the damaged enamel–steel interface due to their chemical bond.
1. Introduction
Organic coatings, such as epoxy, are widely used in combination with supplementary cathodic protection (CP) to prevent steel pipelines from corrosion. When a coating has defects or is damaged during pipeline installations and operations, its steel substrate is directly exposed to the surrounding environment. In this case, the exposed steel can still be prevented from corrosion through CP as a secondary defense system [1,2]. However, the effect of CP makes the exposed metal surface strongly alkaline because of water reduction. This causes organic coating delamination through the hydrolysis of coating or coating-substrate interface [2,3].
Porcelain enamel, as an inorganic material, is chemically bonded to its substrate metal by fusing glass frits at a temperature of 750–850 °C. It can not only be finished with a smooth and aesthetic surface, but it also provides good chemical stability, high corrosion resistance, and excellent resistance to abrasion in an extreme erosion environment [4]. When applied to pipeline lining, enamel coating does not only extend the service life of steel pipes but also increases the pipelines operating temperature to 400 °C, with a safety factor of approximately 1.25 [5].
Our previous studies on steel samples with intact enamel coating [6,7] indicated that enamel coating could protect steel from corrosion in NaCl solution by providing an effective barrier to electrolyte penetration. In real-world operating conditions, solids may flow with fluids in a pipeline and generate abrasive forces; this can impact on the internal enamel coating, resulting in small-scale chipping and coating erosion [8]. The exposed steel would have been further protected by the CP if present. However, the corrosion resistance of steel pipes with damaged enamel coating, and the effect of CP on the interface condition between the enamel coating and its steel substrate have never been investigated.
Electrochemical tests are widely used to study the degradation process of coatings, however, electrochemical responses are concentrated on the local areas where coatings are damaged. This is because their impedance is much lower than that of the surrounding areas with intact coating. In this study, a dual-cell test setup was used to separate the 3.5 wt % NaCl solution in contact with the damaged and intact coating areas, during response measurements [9,10], using potentiostatic and electrochemical impedance spectroscopy (EIS) tests, respectively. Therefore, the potential effect of the damaged coating area on the corrosion process of the intact coating area, as alluded by epoxy coating, can be investigated. To help interpret the effect of CP on the condition of coating–substrate interfaces, coating microstructures were examined with scanning electron microscopy (SEM).
2. Materials and Methods
2.1. Sample Preparation
An API 5L X65 steel pipe (MRC Global, Houston, TX, USA), with an outer diameter of 323.85 mm and a wall thickness of 9.53 mm, was selected as the substrate metal in this study. The chemical composition of the steel provided by the vendor is presented in Table 1. The steel pipe was cut into 9 25 mm × 50 mm coupon samples. The cut samples were steel blasted for 1 min, to remove mill scales and rusts, and then cleansed with acetone.
The steel coupons were coated with enamel slurry T-001 (Tomatec Product, Florence, KY, USA). The chemical compositions of T-001 glass frits were determined by X-ray Fluorescence (XRF, The Mineral Lab, Inc., Golden, CO, USA) as presented in Table 2. Prior to the coating of steel samples, the thermal properties of glass T-001, such as glass-transition temperature (Tg), softening temperature (Ts), and the coefficient of thermal expansion (CTE) were determined using the Orton automatic recording dilatometer (model 1500, Orton, Westerville, OH, USA).
The enamel slurry was prepared by first milling glass frits, clay and certain electrolytes together, and then mixing them with water until the mixture was in a stable suspension state. The water, glass frits, and clay were then mixed in a proportion of 1.00:2.40:0.17 by weight. The enamel slurry was manually sprayed on the surface of each coupon sample. All samples were heated at 150 °C for 10 min, to drive away moisture; fired at 815 °C for 10 min; and finally cooled to room temperature. An optic microscope Hirox (Tokyo, Japan) was used to measure the coating surface roughness, finding an average value of 1 µm. The PosiTest, following ASTM D4541-09 [11], was used to measure the bond strength between the coating and the steel substrate, finding an average value of 17 MPa. Due to the roughness of the steel surface, the thickness of the enamel coating varied slightly at different locations with a standard deviation of 19 µm.
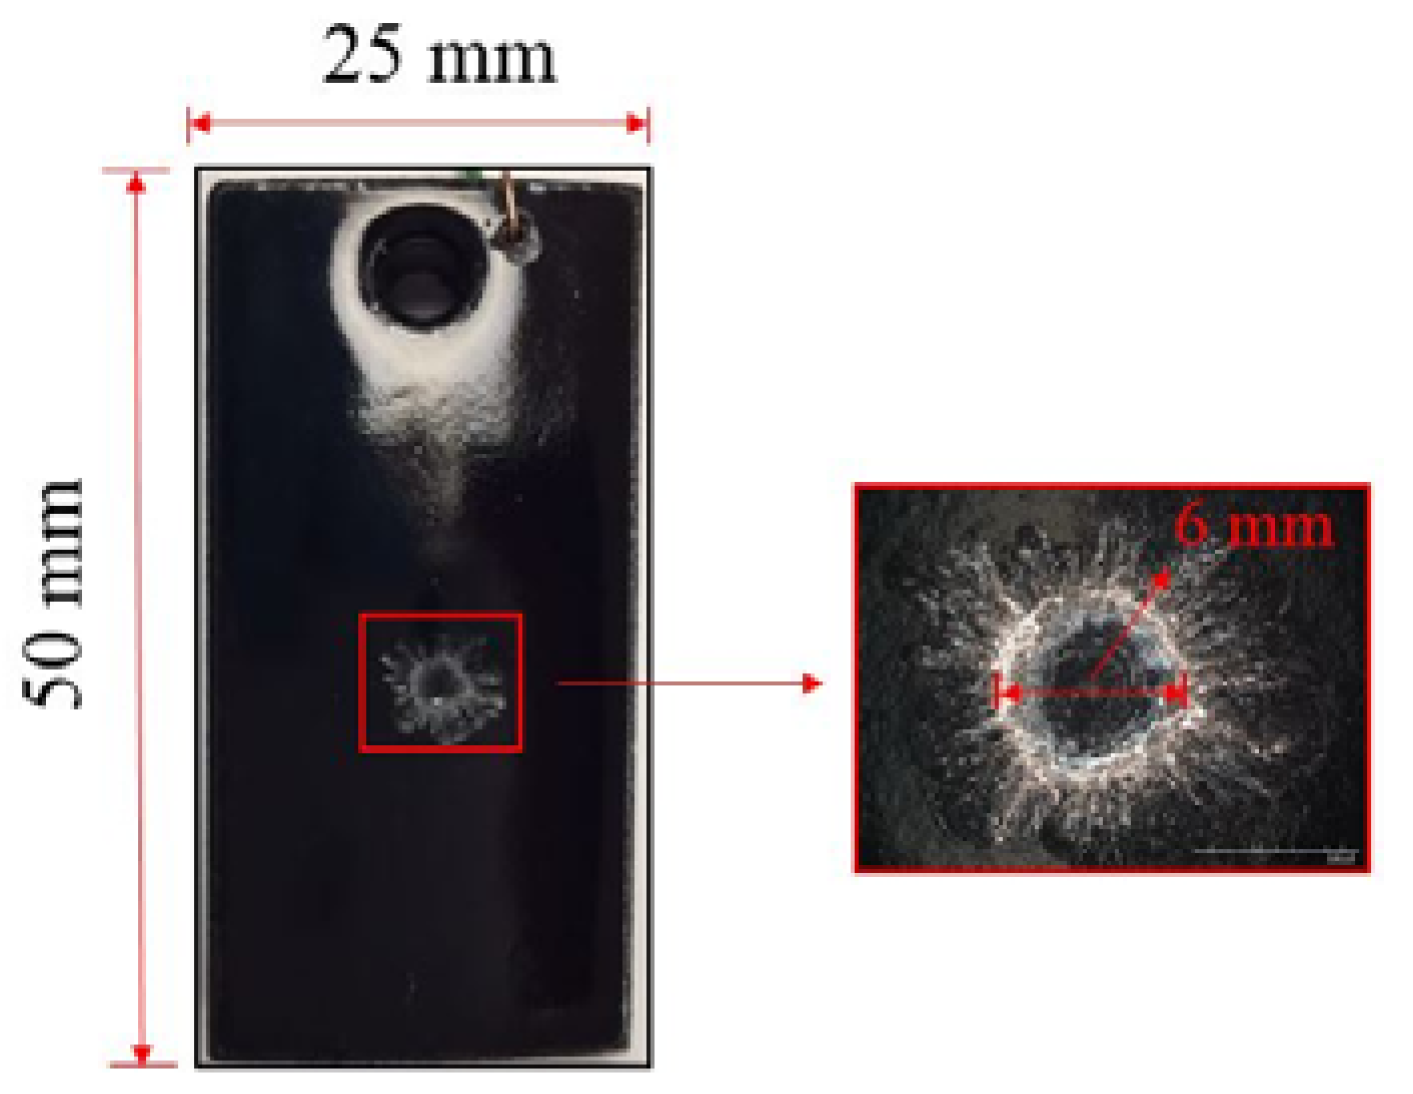
To study the effect that damage has on the corrosion resistance of enamel coating, one damage area, as shown in Figure 1, was created at the center of each enamel-coated sample using an impact test apparatus according to the ASTM Standard G14 [12]. The apparatus consists of a 0.91 kg steel rod with a hemispherical head and a vertical section of hollow aluminum tubing to guide the rod. The weight rod was dropped from a height of 84 cm to damage the coatings. A close-up view of Figure 1 shows the detail around the damaged area.
2.2. Characterization of Enamel Coatings
The coating microstructure was characterized with scanning electron microscopy (SEM, Hitachi S4700, Tokyo, Japan). As shown in Figure 1, each damaged enamel-coated sample was cold mounted in epoxy resin (EpoxyMount, Allied High Tech Products, Inc., Rancho Dominguez, CA, USA). A 10 mm-thick cross section was cut from the damaged coating area of the sample and abraded with carbide papers with grits of 80, 180, 320, 600, 800, and 1200. After abrading, all samples were cleansed with deionized water and dried at room temperature prior to SEM imaging.
2.3. Electrochemical Tests
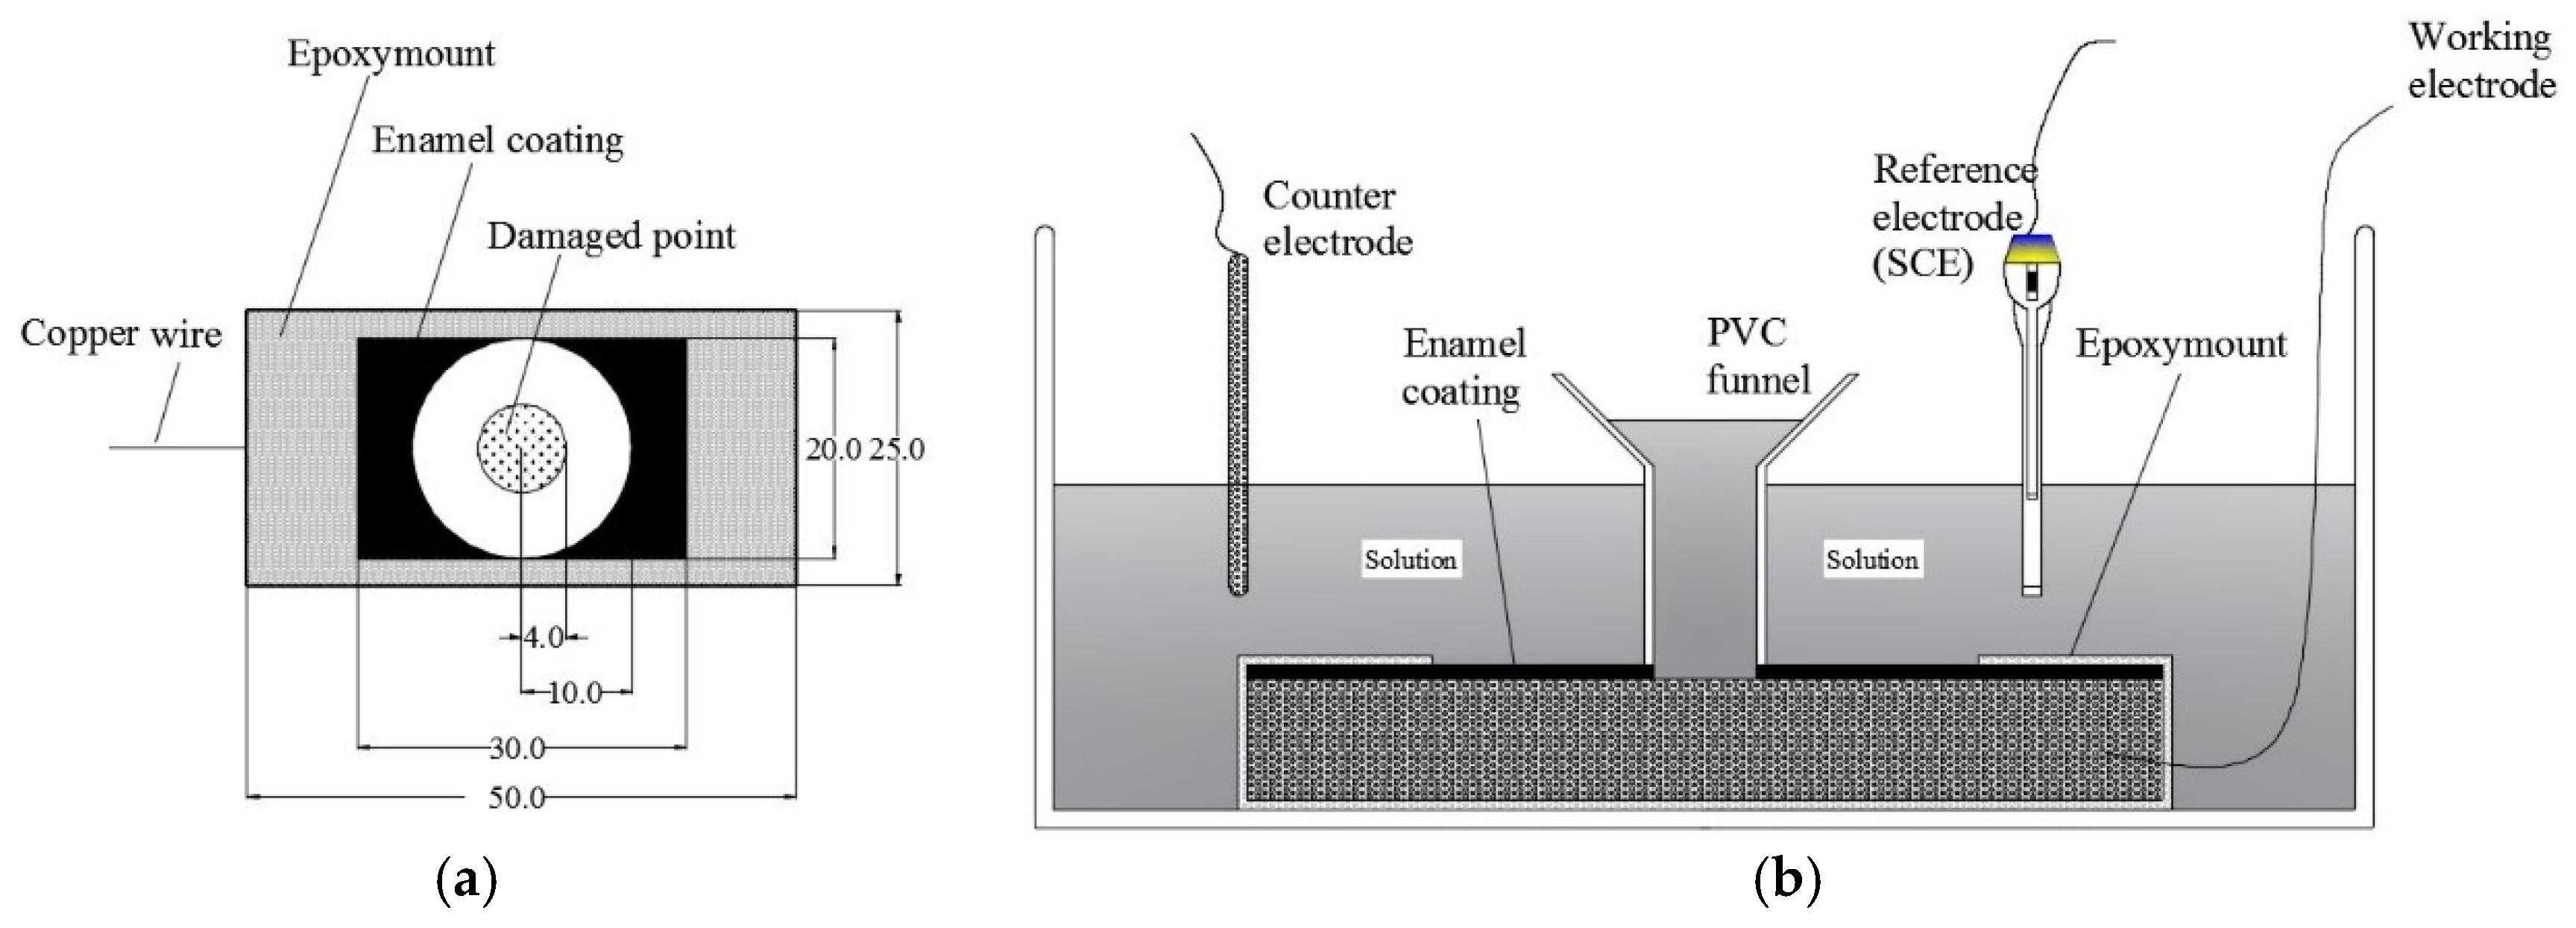
As shown in Figure 2a, except for the surface of the enamel coating, each coupon sample was embedded into the epoxymount to test corrosion performance. The epoxymount was over 2 mm thick to ensure that the surface of the enamel coating was the response site during the electrochemical tests. As shown in Figure 2b, a PVC funnel (1 cm in diameter) was attached onto the coating surface, covering the damaged area. The sample was placed in a large plastic container with the funnel faced up. The funnel and container were filled with 3.5 wt % NaCl solution to ensure that the funnel was completely submerged. The solution was prepared by adding purified sodium chloride (Fisher Scientific, Inc., Waltham, MA, USA) into distilled water. CP was introduced for the entire coated area.
During electrochemical tests, the 3.5 wt % NaCl solution around the damaged coating area was separated, by the funnel, from the solution around the remaining intact coating area. If it were otherwise, the electrochemical responses would have been concentrated on the damaged area since its impedance would be much lower than that of the other area. Thus, the measured responses would be representative to neither the damaged coating area nor the other intact coating area. For the same reason, the damaged and intact coating areas were tested up to 10 and 70 days, respectively.
The electrochemical tests were conducted at room temperature every 5 days in a classic three-electrode system with a saturated calomel electrode (SCE) as the reference electrode, a graphite rod as the counter electrode, and a coupon sample as the working electrode. The three electrodes were connected to an Interface1000E Potentiostat (Gamry Instrument, Warminster, PA, USA) for measurement. The SCE and graphite rods were immersed in the large container for the intact enamel coating area, as shown in Figure 2, and in the funnel for the damaged enamel coating area (not shown in Figure 2 for clarity). One sample was subjected to zero cathodic potential (under the open circuit potential or OCP condition), another one to a cathodic potential of −0.85 vs. SCE/V, and the third one to a cathodic potential of −1.15 vs. SCE/V. Potentiostatic tests were first conducted to measure currents for 1000 s at −0.85 vs. SCE/V or −1.15 vs. SCE/V. EIS tests were then conducted under a sinusoidal potential wave (10 mV in amplitude and a frequency range of 105–10−2 Hz) around a cathodic potential of zero, −0.85 vs. SCE/V and −1.15 vs. SCE/V. EIS test data was simulated with classical electrical equivalent circuits (EEC) and analyzed with the software ZSimpWin (Version 3.21).
3. Results and Discussion
3.1. Thermal Properties
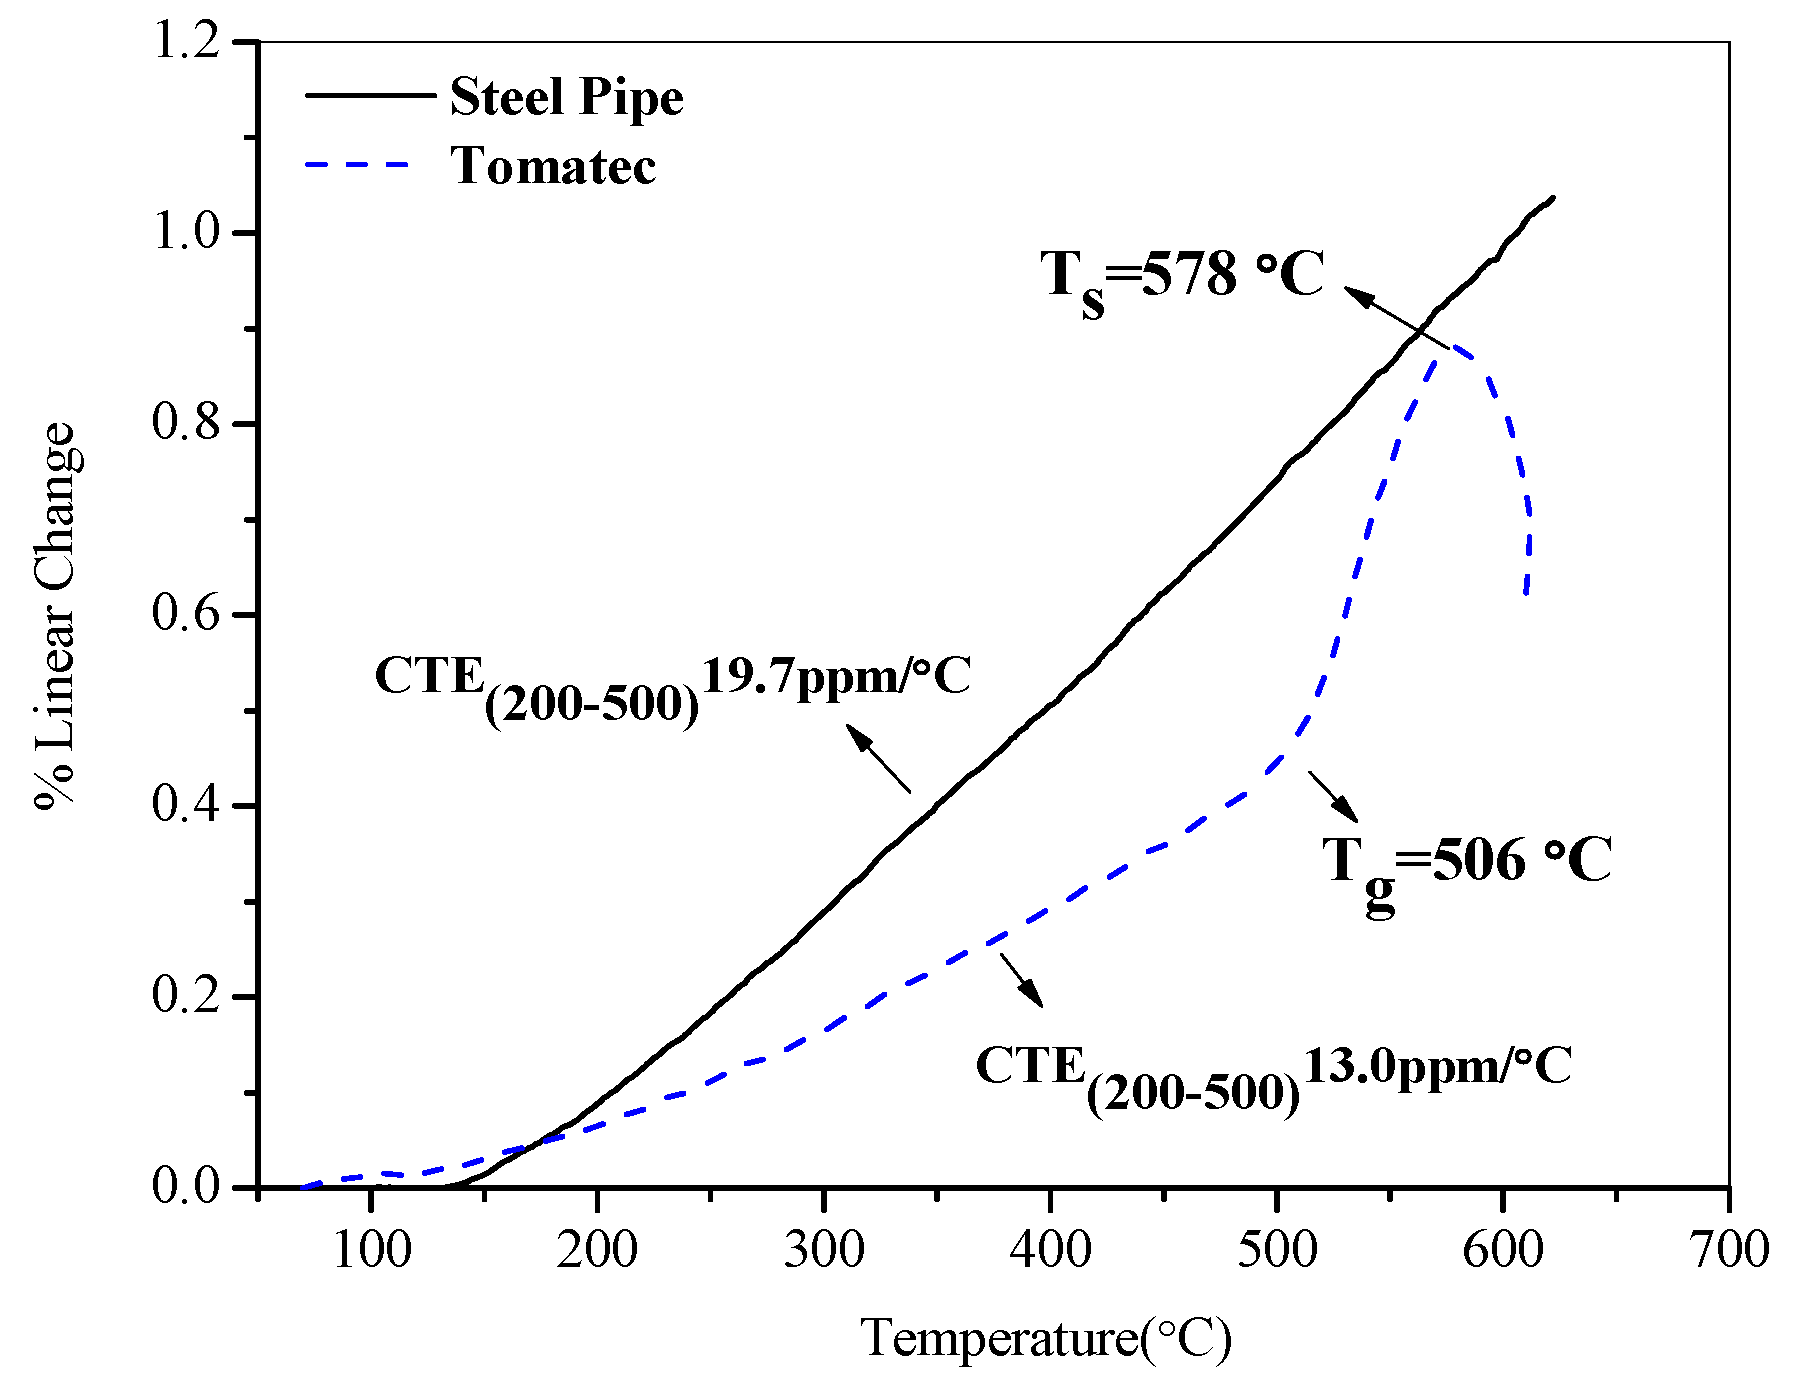
Figure 3 shows the thermal elongation of the enamel coating and pipe steel as a function of temperature. The steel has a measured CTE of 19.7 ppm/°C, while the enamel coating T-001 has a measured CTE of 13.0 ppm/°C. The CTE of the steel remained constant over a temperature range of 100–600 °C, while the CTE of the enamel coating was only constant over a range of 200–500 °C. The difference between the CTE of steel and enamel coating lead to an initial compressive stress on the coating during cooling; this can reduce cracking in enamel and is desirable in engineering applications. The glass transition temperature for enamel slurry T-001 is 506 °C, which allows the enamel-coated pipeline to operate at temperatures up to 400 °C, considering a safety factor of approximately 1.25.
3.2. Coating Microstructure
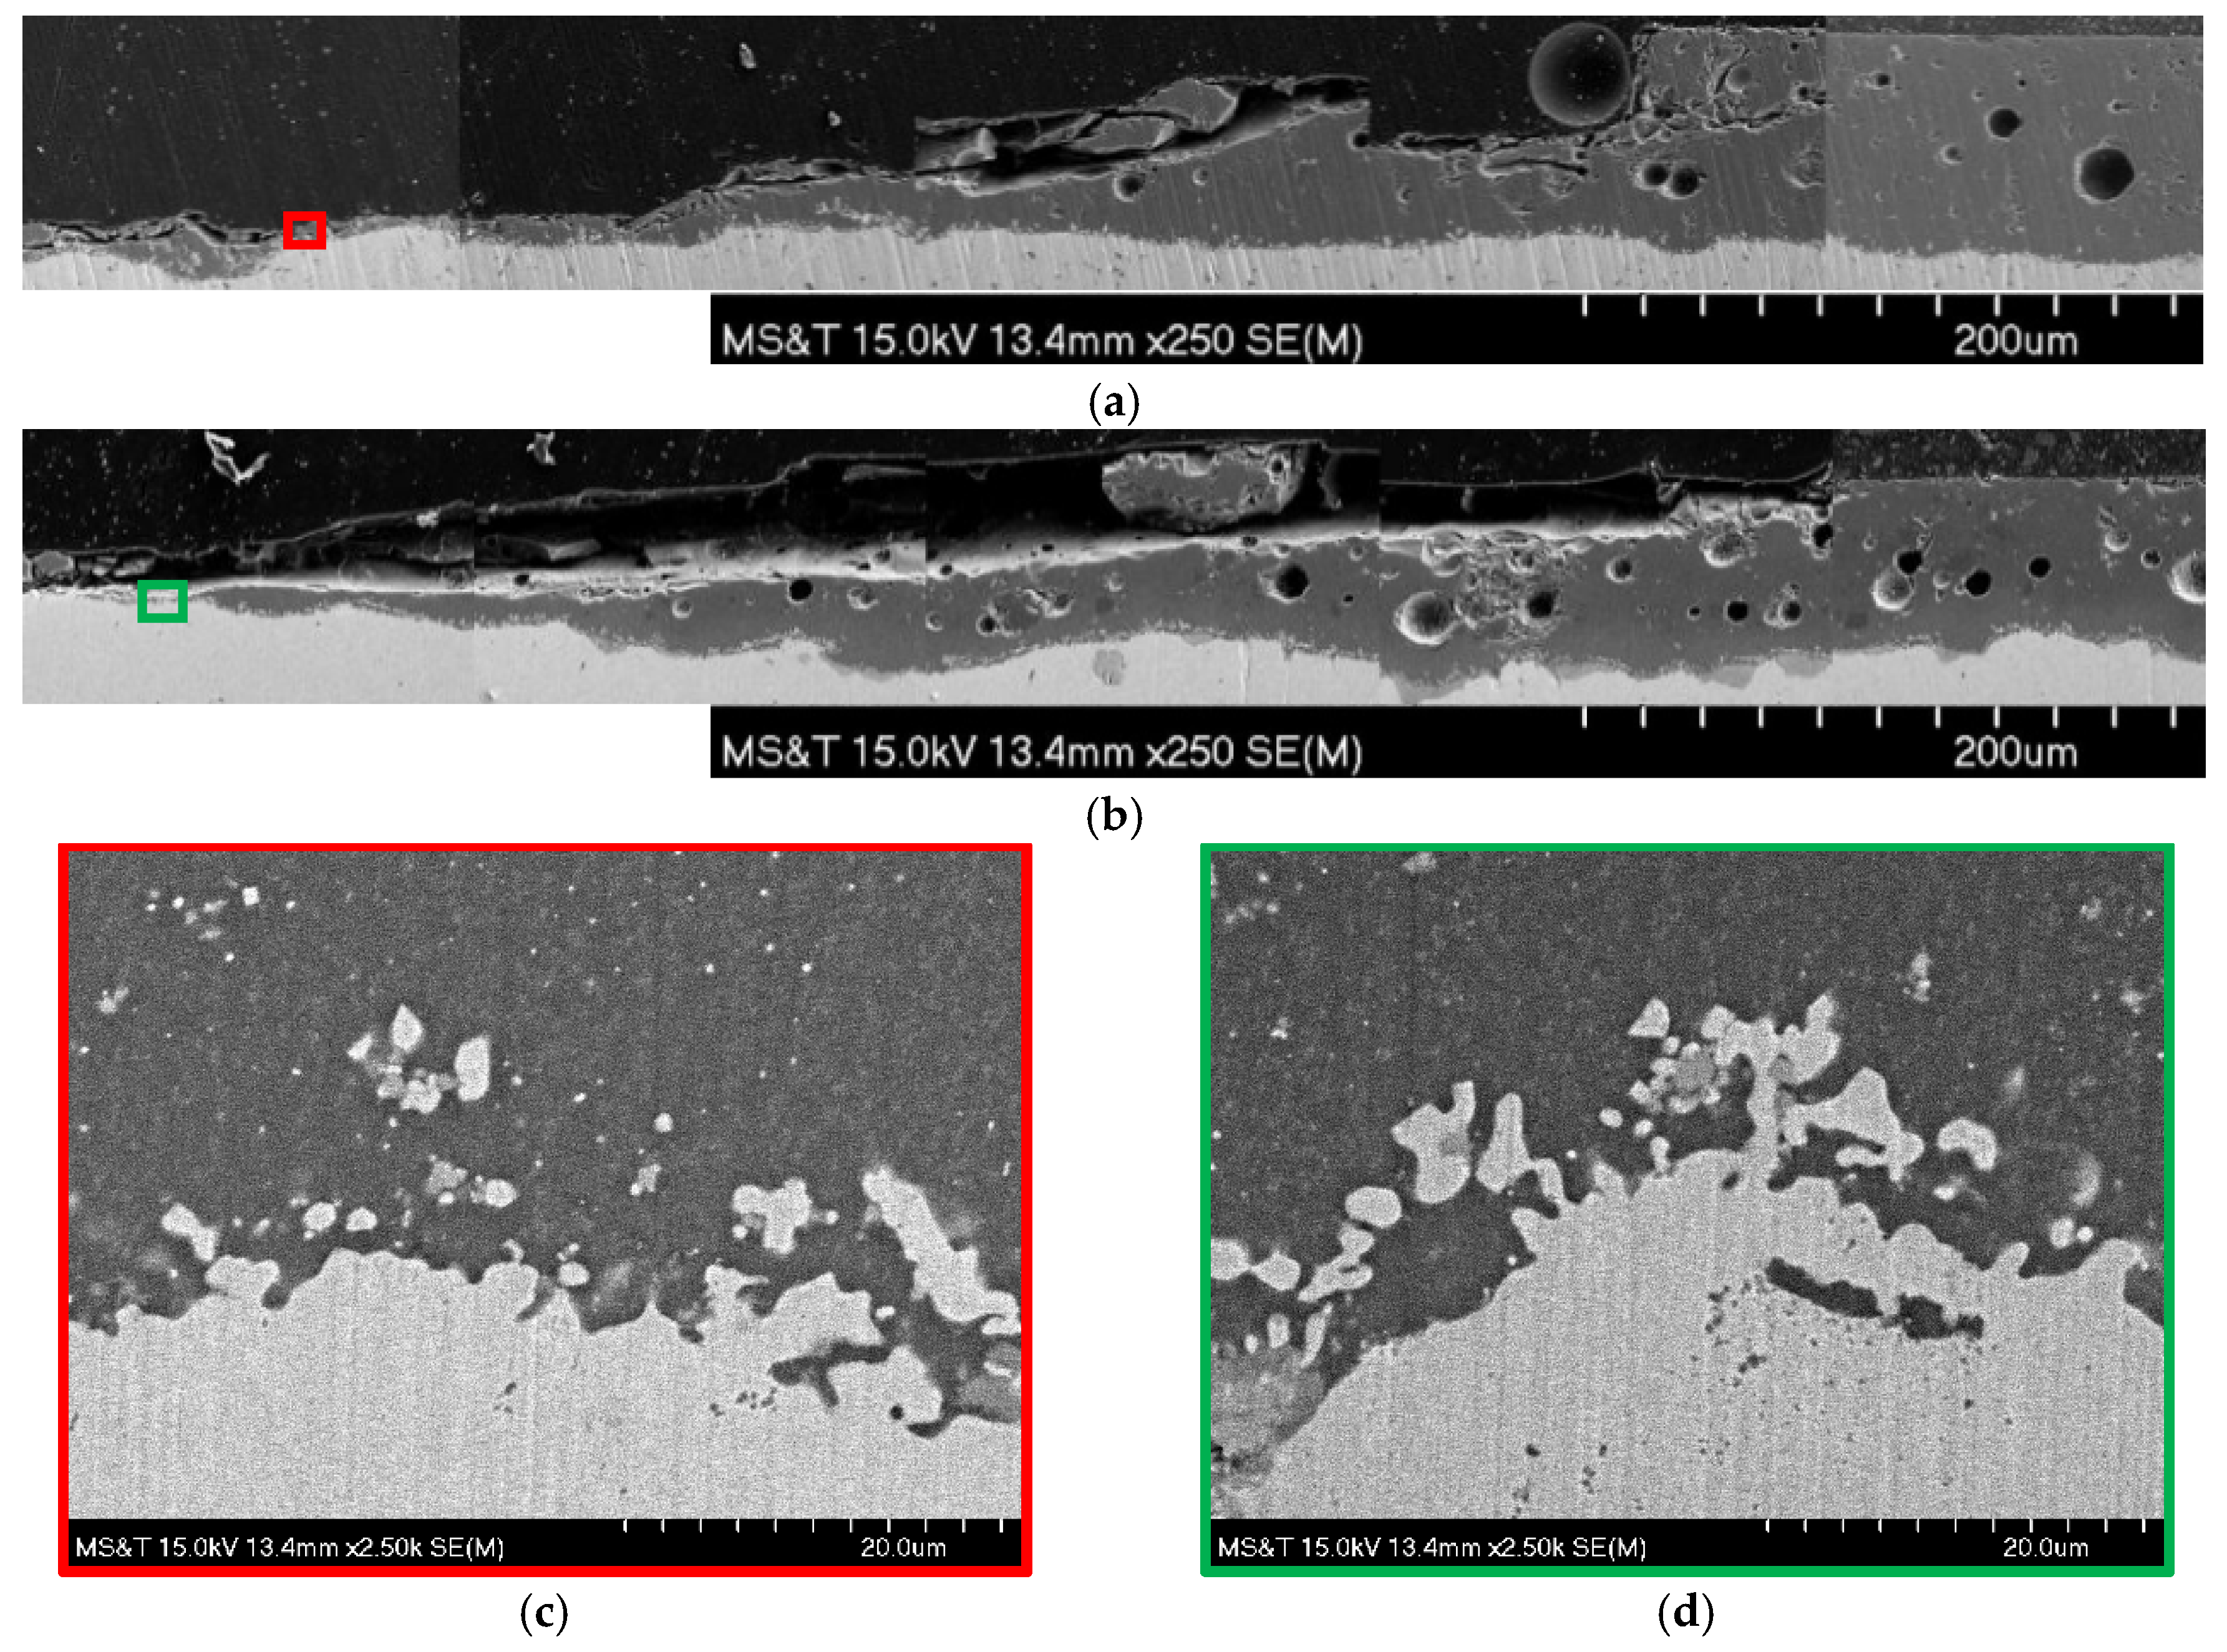
Cross-sectional SEM images of enamel-coated steel samples, tested under the OCP and CP (−1.15 V/SCE) conditions, are presented in Figure 4. In general, the enamel coatings have amorphous structures with isolated air bubbles. Gaseous CO, CO2, and H2 are generated during the firing process of enameling. When cooled down, these gases were trapped as a thick layer of enamel solidifies; this generated the isolated air bubbles [13,14]. Figure 4a,b represents the stitched images of five SEMs taken along a radial direction of the damaged coating, as shown in the detailed damaged zone in Figure 1. Due to chipped coating falling off after impact tests, the coating thickness decreased gradually from 244 to 4 µm for samples tested under the OCP, and from 190.48 to 4 µm for samples tested under −1.15 V/SCE. However, the substrate surface is still covered with a thin layer of enamel coating at the center of damaged area, as indicated in Figure 1.
Figure 4c,d shows magnified details of the enamel–steel interfaces from Figure 4a,b. They show the extensive formation of an island-like structure in the enamel coating, during the firing process. In essence, a durable steel enamel interface transition zone was formed [15]. The island-like structure is iron-alloys, formed as a result of the chemical reactions of metal oxides in the enamel and the carbon and iron in the steel. No delamination was found after the corrosion tests; thus, the CP did not affect the mechanical condition of the interface between the enamel coating and steel substrate.
3.3. EIS
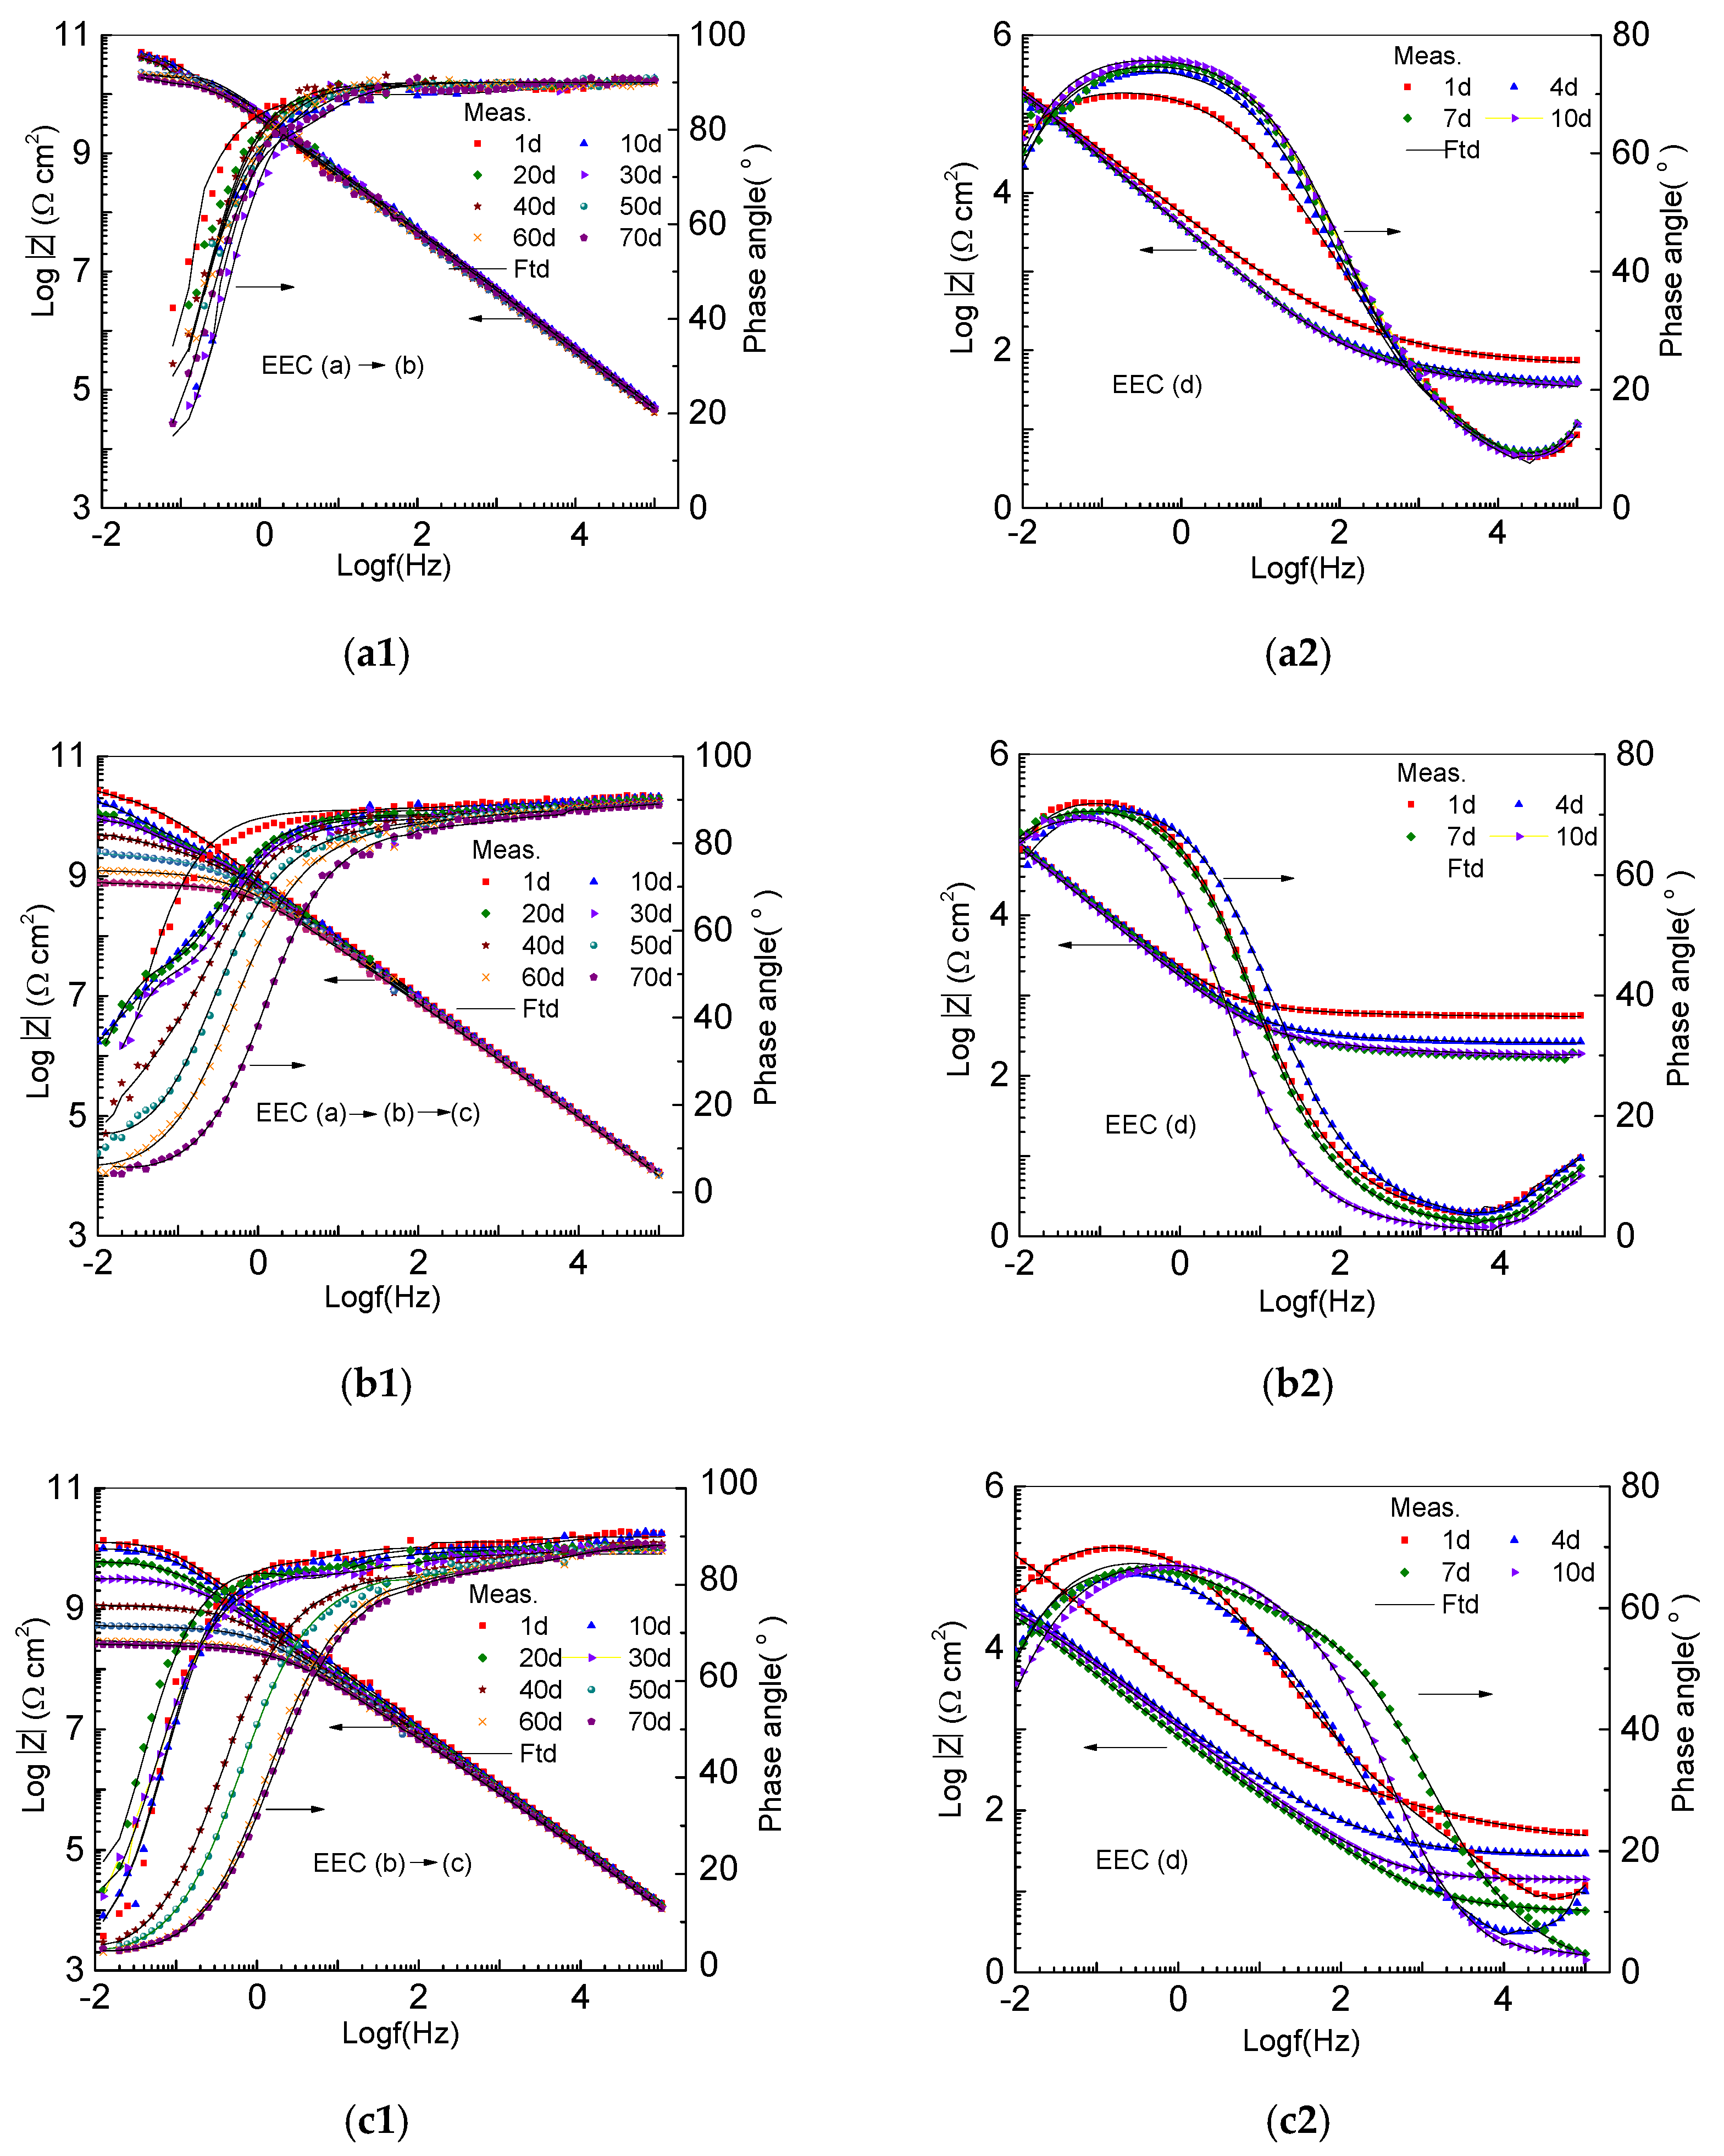
Figure 5 shows the EIS Bode diagrams of 3 representative samples tested under a cathodic potential of −1.15 V/SCE and −0.85 V/SCE, and an OCP, respectively in intact enamel coating (Figure 5(a1,b1,c1)) and damaged enamel coating (Figure 5(a2,b2,c2)). Both the measured (Meas.) data in various symbols and their fitted (Ftd.) curves are presented in Figure 4.
On a log–log scale, the impedance of the sample tested under −1.15 V/SCE in the first 40 days decreased linearly with the frequency; this relation was independent of the day of testing, as indicated in Figure 5(a1). Starting from the 50th day, the impedance experienced a gradual decrease at a low frequency but remained over 10 GΩ cm2 at a frequency of 0.02 Hz. The phase angles in the high and middle frequency ranges were close to 90° during the entire immersion time and increased with the frequency in the low frequency range.
For the sample tested under a cathodic potential of −0.85 V/SCE, as shown in Figure 5(b1), the impedance on a log-log scale decreased linearly in the first 10 days and then, over time, showed a gradually-expanding horizontal platform in the low to middle frequency range. The impedance at a frequency of 0.02 Hz decreased from 24 GΩ cm2 at the beginning to 0.76 GΩ cm2 at the end of the test. The phase angle increased with the frequency from the low to middle frequency range and remained 90° until 70 days of immersion time in the high frequency range. The phase–frequency curves in the low frequency range shifted towards the middle frequency range over the immersion time.
The impedance and phase angle of the sample tested under the OCP, as shown in Figure 5(c1), showed a similar trend to the sample tested under a cathodic potential of −0.85 V/SCE, particularly towards the end of the corrosion test. However, the horizontal platform was further extended to the middle frequency range and the impedance at a frequency of 0.02 Hz was 0.26 GΩ cm2 after 70 days of testing.
Figure 5(a2,b2,c2) shows the Bode diagrams of the samples tested in the damaged coating zone. Overall, the Bode diagrams of the samples tested under the CP and the OCP are similar, indicating comparable corrosion performances of all samples in the damaged zone. The impedance became stable after 4 days of immersion in the solution. Because of the damage made to the coating, the impedance at 0.02 Hz was approximately 0.1 MΩ cm2, which is 106 times smaller than that of the samples tested in the intact coating zone. On a log-log scale, the impedance linearly decreased in the low frequency range and gradually approached an asymptotic value in the high frequency range. The maximum phase angle, lower than 80°, appeared in the low frequency range, indicating that corrosion had already taken place in the steel substrate.
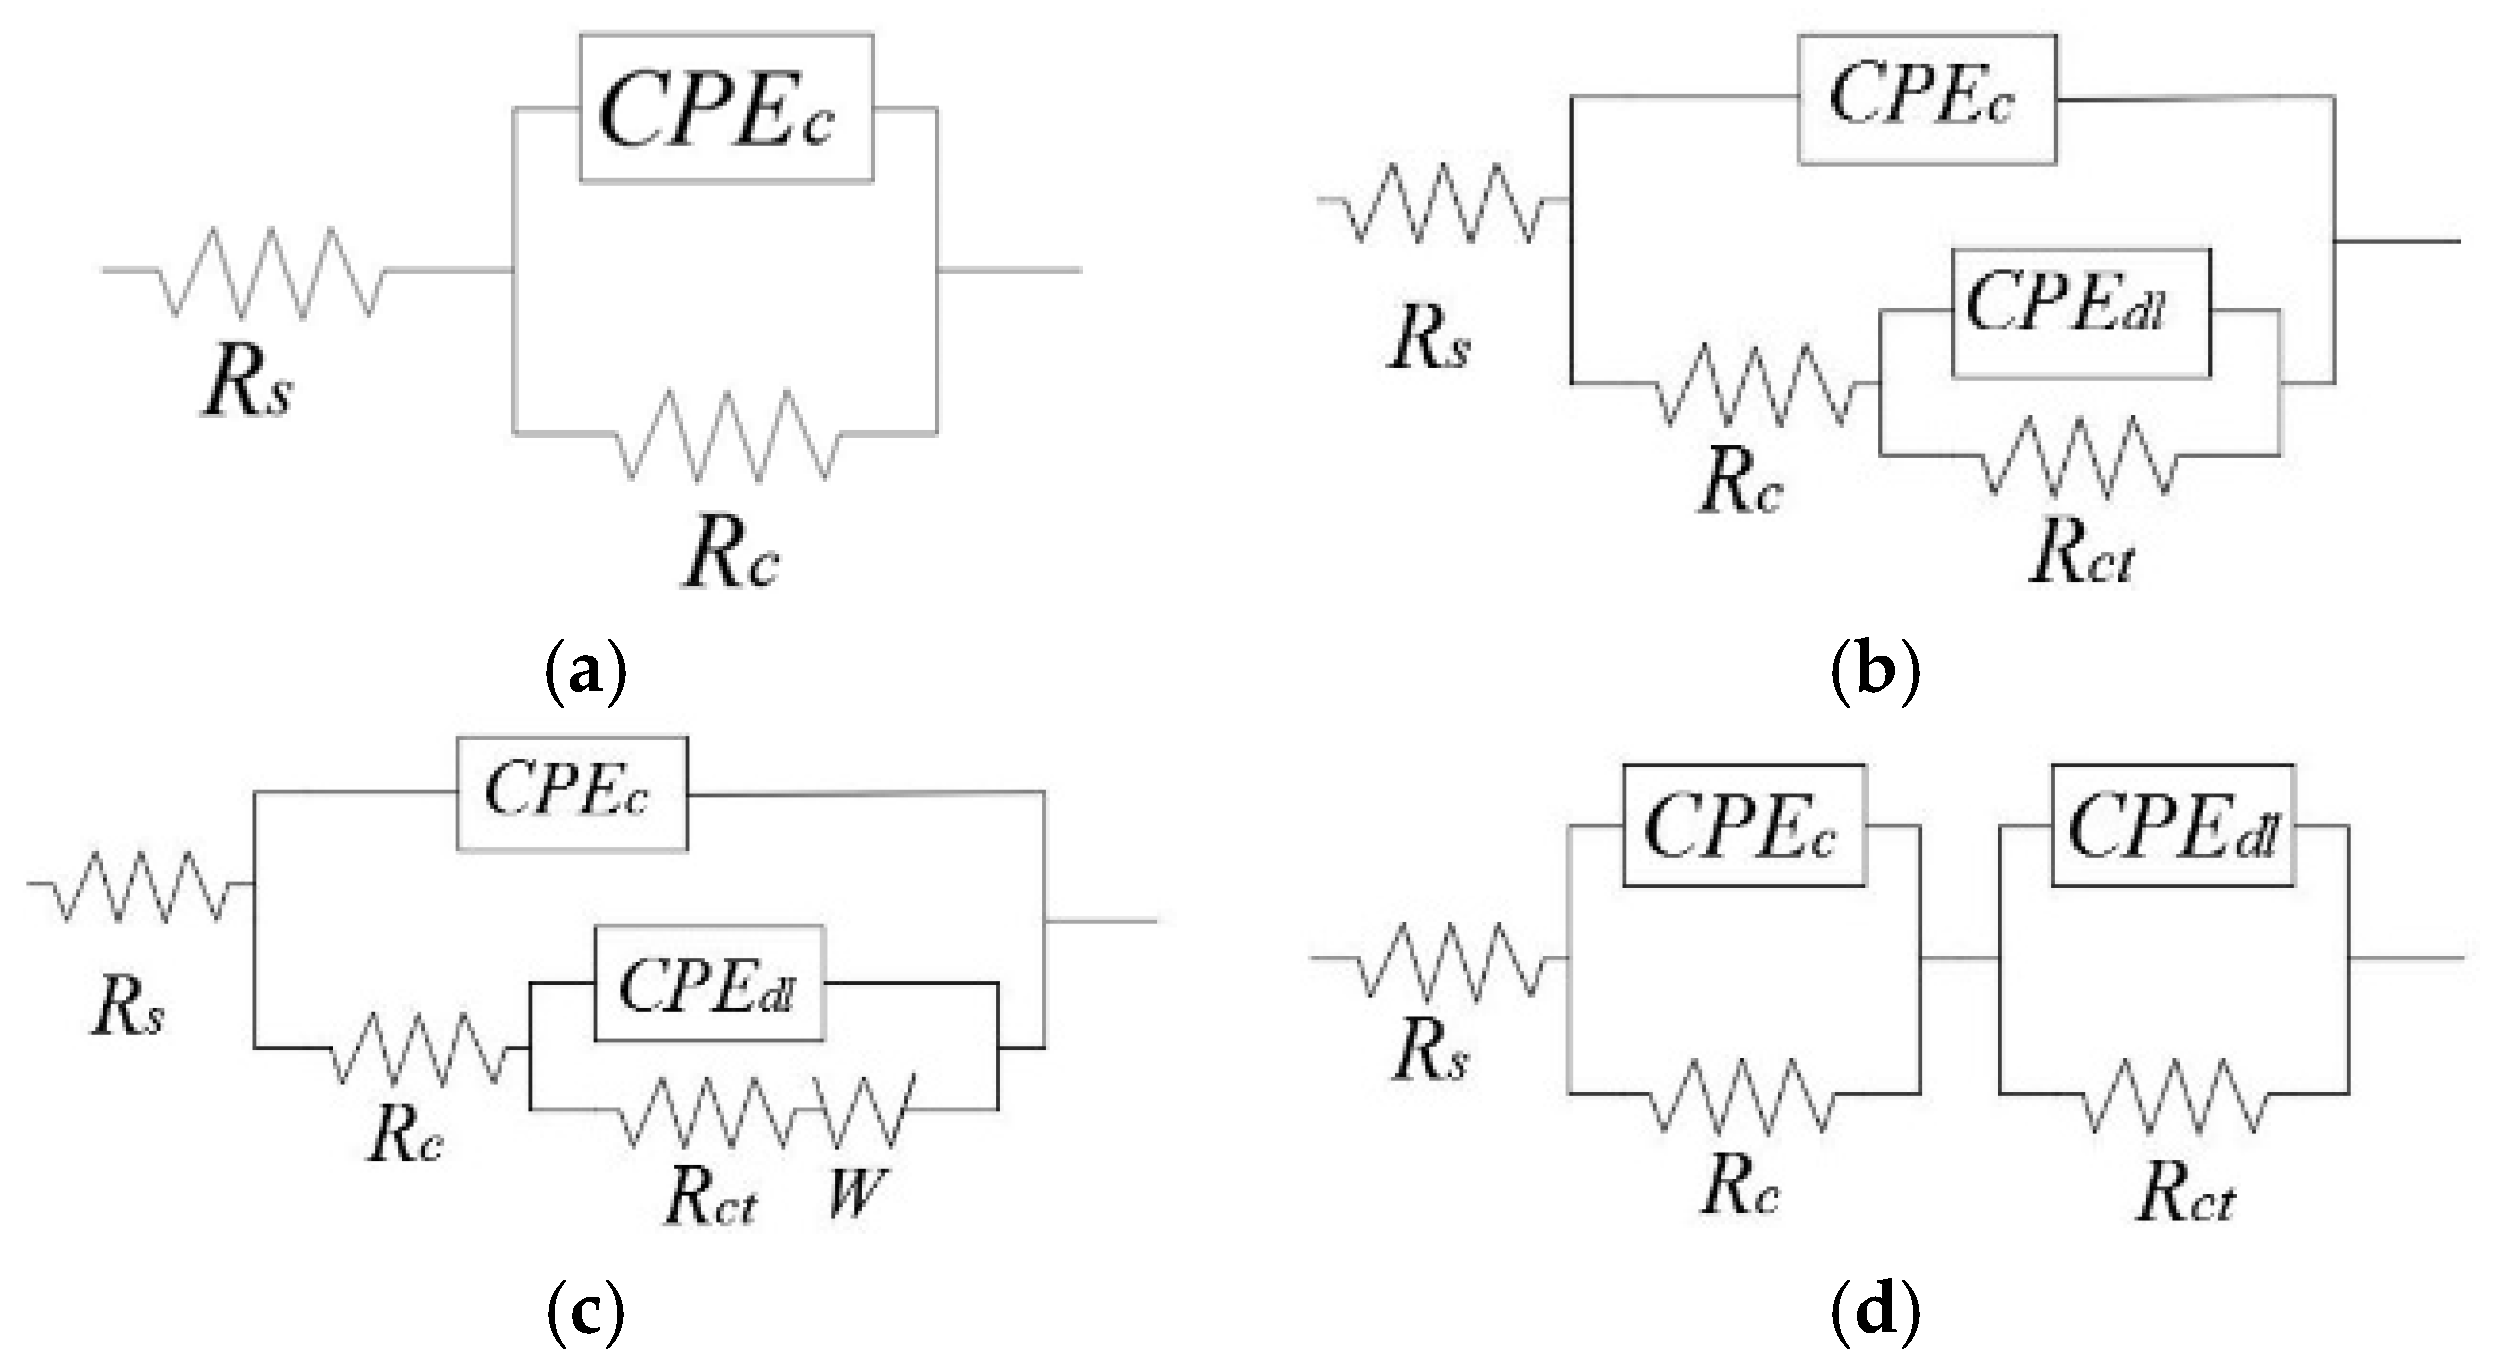
Figure 6 shows four equivalent electrical circuit (EEC) models used to fit the EIS test data taken from different samples under various test conditions. In this study, a constant phase element (CPE) was used instead of a pure capacitor due to non-homogeneity in coating thickness and roughness [16,17], or the electrochemical reactivity of the steel substrate [18]. A CPE is defined by two parameters, Y and n, and its impedance is represented by:
where is the imaginary unit, Y is a CPE constant, ω is the angular frequency, and n (0 ≤ n ≤ 1) is an index that represents the deviation of the CPE from a corresponding pure capacitor [2].
The EEC models used to fit into the EIS data from various tested samples are included in Figure 5. Model (a) [19,20] was used for the samples with intact coating tested under −1.15 V/SCE up to 40 days, taking into consideration the decrease in coating resistance and increase in coating capacitance as water begins to seep through the channels in enamel coating. Here, Rs represents the solution resistance, Rc and CPEc represent the pore resistance and capacitance of the coating, respectively. After 40 days of immersion, when water and oxygen molecules arrived at the substrate surface and reacted with the steel substrate, the EIS data was fitted with Model (b) till the end of the corrosion tests [19,20,21]. Here, Rct is the charge transfer resistance and CPEdl is the double layer capacitance at the steel-electrolyte interface. However, only one capacitive loop was observed in the phase-frequency diagram. This is likely because the time constant associated with the dielectric properties of enamel was difficult to distinguish from that of the electrochemical reaction at the steel-electrolyte interface [20,22].
For the intact enamel coating zone under −0.85 V/SCE, Model (a) was used in the first 10 days of immersion, Model (b) was applied from the 15th day to the 45th day, and Model (c) was used till the last day of the test. A Warburg impedance W in Model (c) was included to take into account the diffusion behavior, which was induced by the accumulation of corrosion products at the active corrosion sites. For the intact coating zone under the OCP, Model (b) was used for tests up to 40 days and Model (c) for the remaining tests.
For all the damaged coating zones, two time constants can clearly be observed in the phase-frequency diagram, and thus Model (d) was used to fit the test data [23]. While Model (b) was applicable for the intact coating zone when the solution had penetrated through the channel in the coating and was in contact with the steel substrate, Model (d) was more appropriate for the damaged-coating zone, since the coating layer became thinner and the solution could penetrate into the coating more easily. The electrochemical reactivity occurred uniformly on the damaged coating surface.
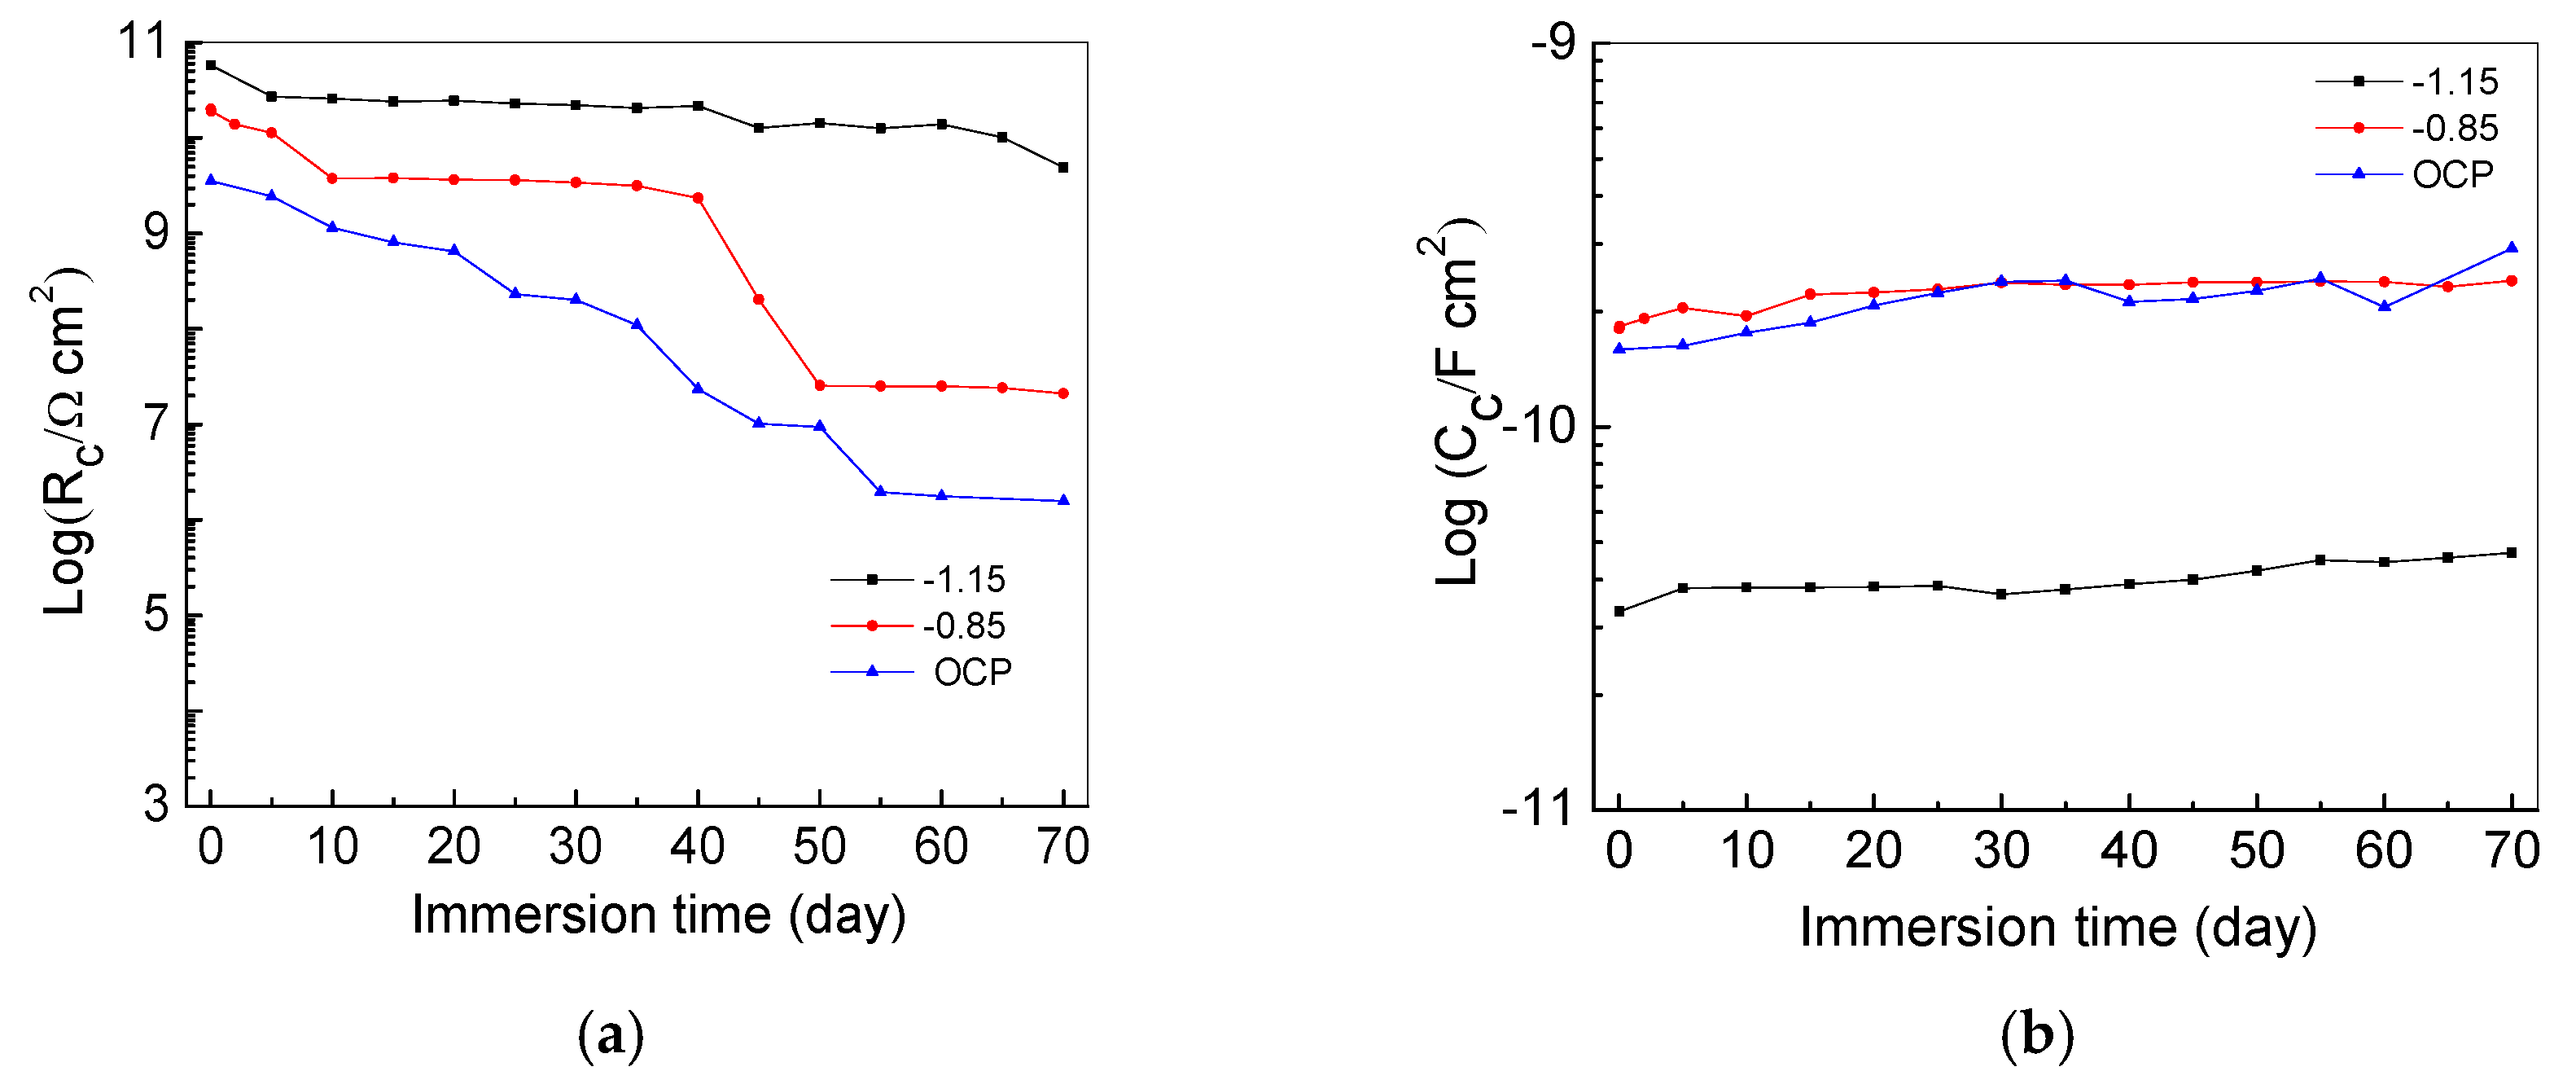
Figure 7 shows the change of pore resistance Rc and capacitance CPEc of the intact coatings. In general, pore resistance measures the ease of electrolyte penetration into the coating, which is related to the number and distribution of open pores and pinholes in the enamel coating. The coating capacitance indicates the extent of electrolyte diffusion into the coating, which is associated with the thickness and dielectric properties of the coating [24]. The Rc value of the samples tested under −1.15 V/SCE decreased from 57.6 to 4.92 GΩ cm2, while the Rc value of the samples tested under −0.85 V/SCE and the OCP decreased more rapidly from 20.9 to 1.57 MΩ cm2 over 70 days. The coating capacitance of all the samples increased with immersion time, since the electrolyte solution gradually penetrated into the coating, thus increasing the coating capacitance. All the samples tested under the CP have larger coating resistances than the samples under the OCP. Thus, the CP improved the coating performance [2]. The sample tested under −1.15 V/SCE had a larger coating resistance and a smaller coating capacitance than the respective values of the sample under −0.85 V/SCE. This result indicates that a higher cathodic potential used in tests does not adversely affect the coating properties; it can decelerate the degradation process of the coating.
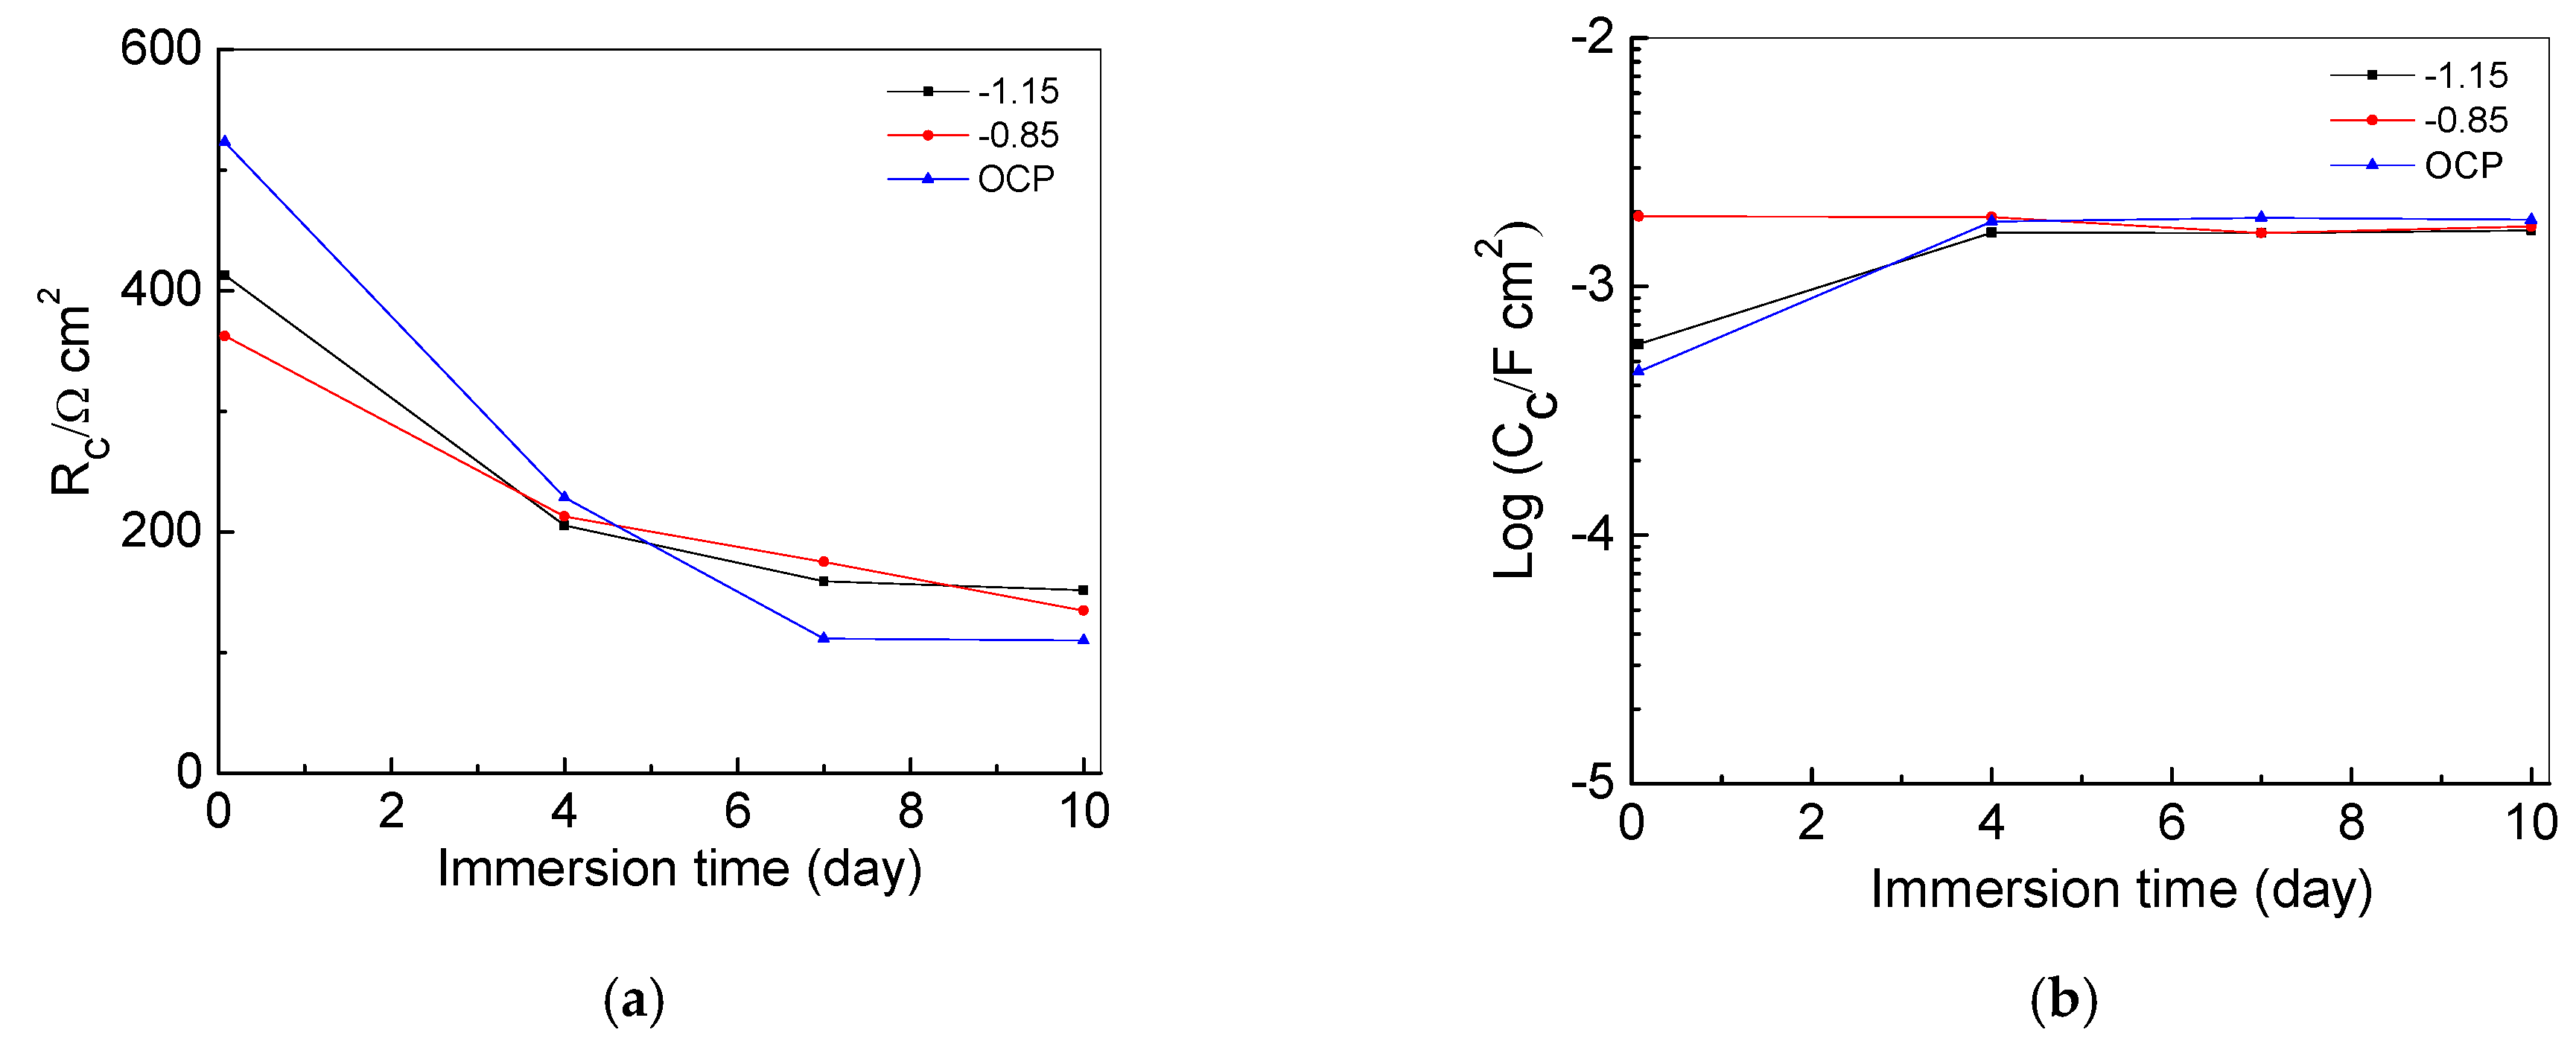
The Rc values of the damaged coating decreased rapidly over the immersion time as shown in Figure 8, which was measured in days (d). Specifically, the Rc value of the samples under the CP dropped from approximately 400 to 150 Ω cm2, while the Rc value of the samples under the OCP reduced more dramatically from 500 Ω cm2 in one day, to 110 Ω cm2 in 10 days; indicating the failure of coating in protecting the steel substrate. The CPEc values of all the tested samples reached nearly the same value of 2 mF·cm2 after 4 days of immersion. Therefore, after coating has been damaged, the CP has little effect on the coating performance.
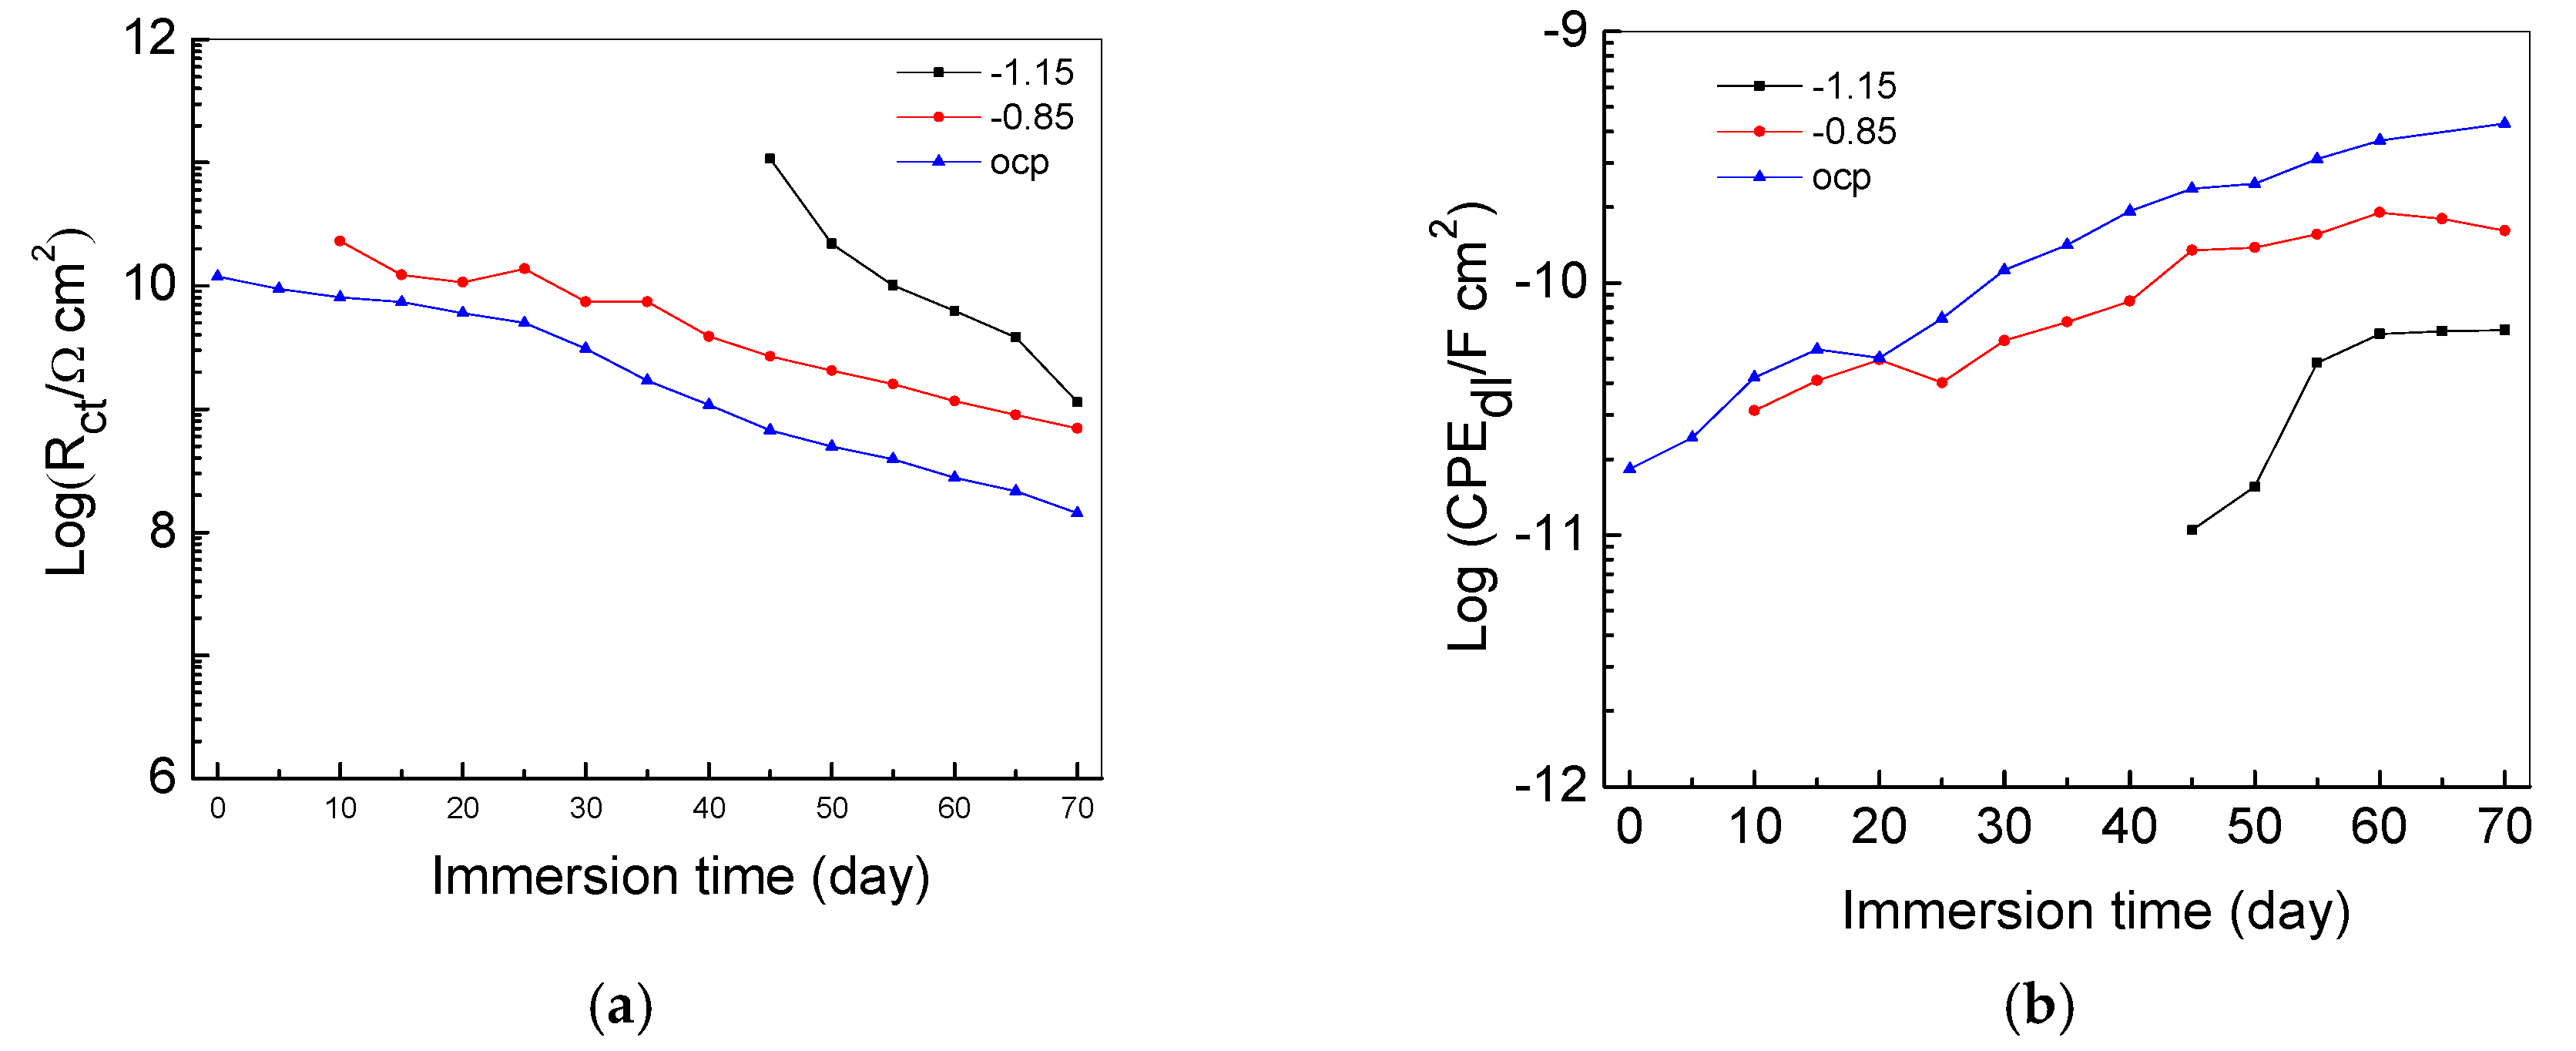
Figure 9 displays the properties of the steel-electrolyte interface under intact coating: charge transfer resistance Rct and double layer capacitance CPEdl. Charge transfer resistance is the resistance against electrons transferring across the steel surface, which is inversely proportional to the corrosion rate [24]. For the samples tested under −1.15 V/SCE, −0.85 V/SCE and the OCP, the charge transfer resistances were reduced to 1.13, 0.7, and 0.14 GΩ cm2, respectively, at the end of testing, after 70 days. This comparison indicated increasing electrochemical reactions on the steel-electrolyte interface over time, as the level of CP decreased. The double layer capacitance CPEdl is also a measure of the ease of charge transfer across a steel-electrolyte interface. The CPEdl of the samples tested under −1.15 V/SCE, −0.85 V/SCE and the OCP were increased to 6.523 × 10⁻¹¹, 1.613 × 10⁻¹⁰, and 4.314 × 10⁻¹⁰ F cm−2, respectively, at the end of testing, after 70 days. The sample tested under −1.15 V/SCE had the highest charge transfer resistance and the lowest double layer capacitance. Thus, the higher the cathodic potential, the more effectively the electrochemical reactions can be delayed at the steel-electrolyte interface [2].
After the enamel coating was damaged, the charge transfer resistance of the samples tested under −1.15 V/SCE, −0.85 V/SCE and the OCP slightly decreased to 4.96 × 10⁵, 3.78 × 10⁵, and 6.67 × 10⁴ Ω cm2, respectively, after 10 days of immersion as shown in Figure 10. This is about 104 times smaller than that of the intact coating tested after 70 days of immersion. The double layer capacitances of the samples tested under −1.15 V/SCE, −0.85 V/SCE and the OCP also changed slightly, they were 1.37 × 10⁻⁴, 6.08 × 10⁻⁴, and 5.48 × 10⁻⁴ F cm−2 after 10 days of immersion, respectively. They were approximately 106 times larger than those of the samples with intact enamel coating tested after 70 days of immersion.
3.4. Potentiostatic
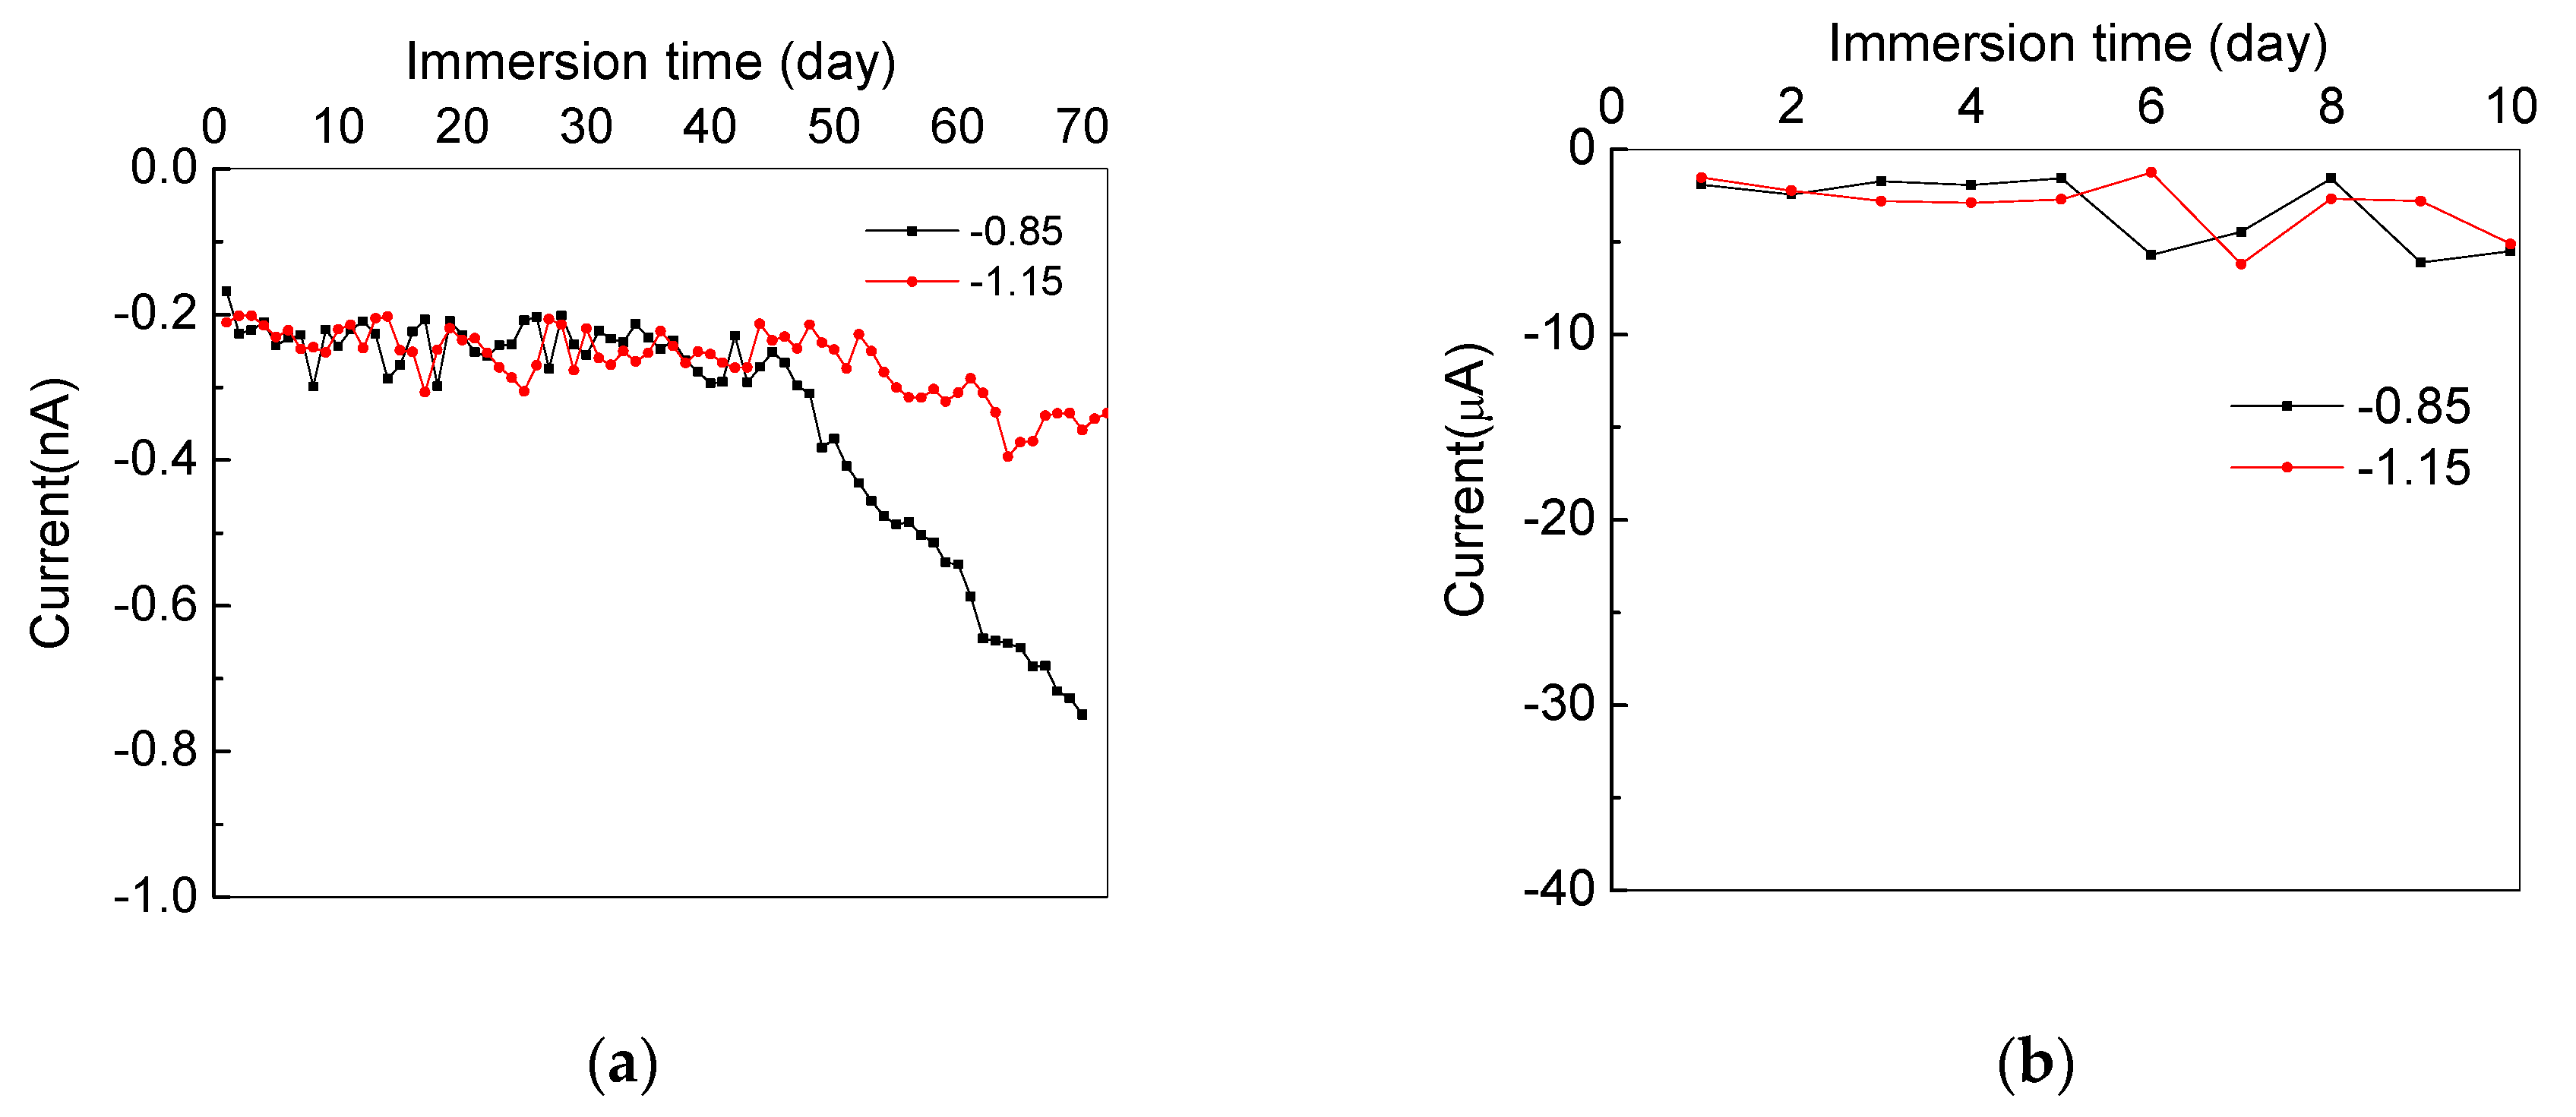
Figure 11a shows the variation of currents taken from the intact enamel coating zone under −0.85 vs. SCE/V and −1.15 vs. SCE/V. Each dot represents one measurement of data per day till the end of testing, after 70 days. For both samples the current fluctuated around −0.2 nA from the beginning to 45 days of immersion. Then, the sample tested under −1.15 V/SCE decreased slowly to approximately −0.3 nA at the end of testing, while the sample tested under −0.85 V/SCE decreased dramatically to approximately −0.8 nA at the end. Similarly, Figure 11b presents the variations of currents on the samples with damaged enamel coating. The currents of both samples eventually reached approximately −5 µA after 10 days of immersion, which are about 104 times larger than those of the respective test samples with the intact enamel coating. This is because more electrochemically reactive spots were generated. In all test cases, the measured current is always negative, implying that the CP current can flow through the coating along electrolyte pathways to reach the metal substrate and protect the steel from corrosion [25].
3.5. Visual Observations after Corrosion Tests
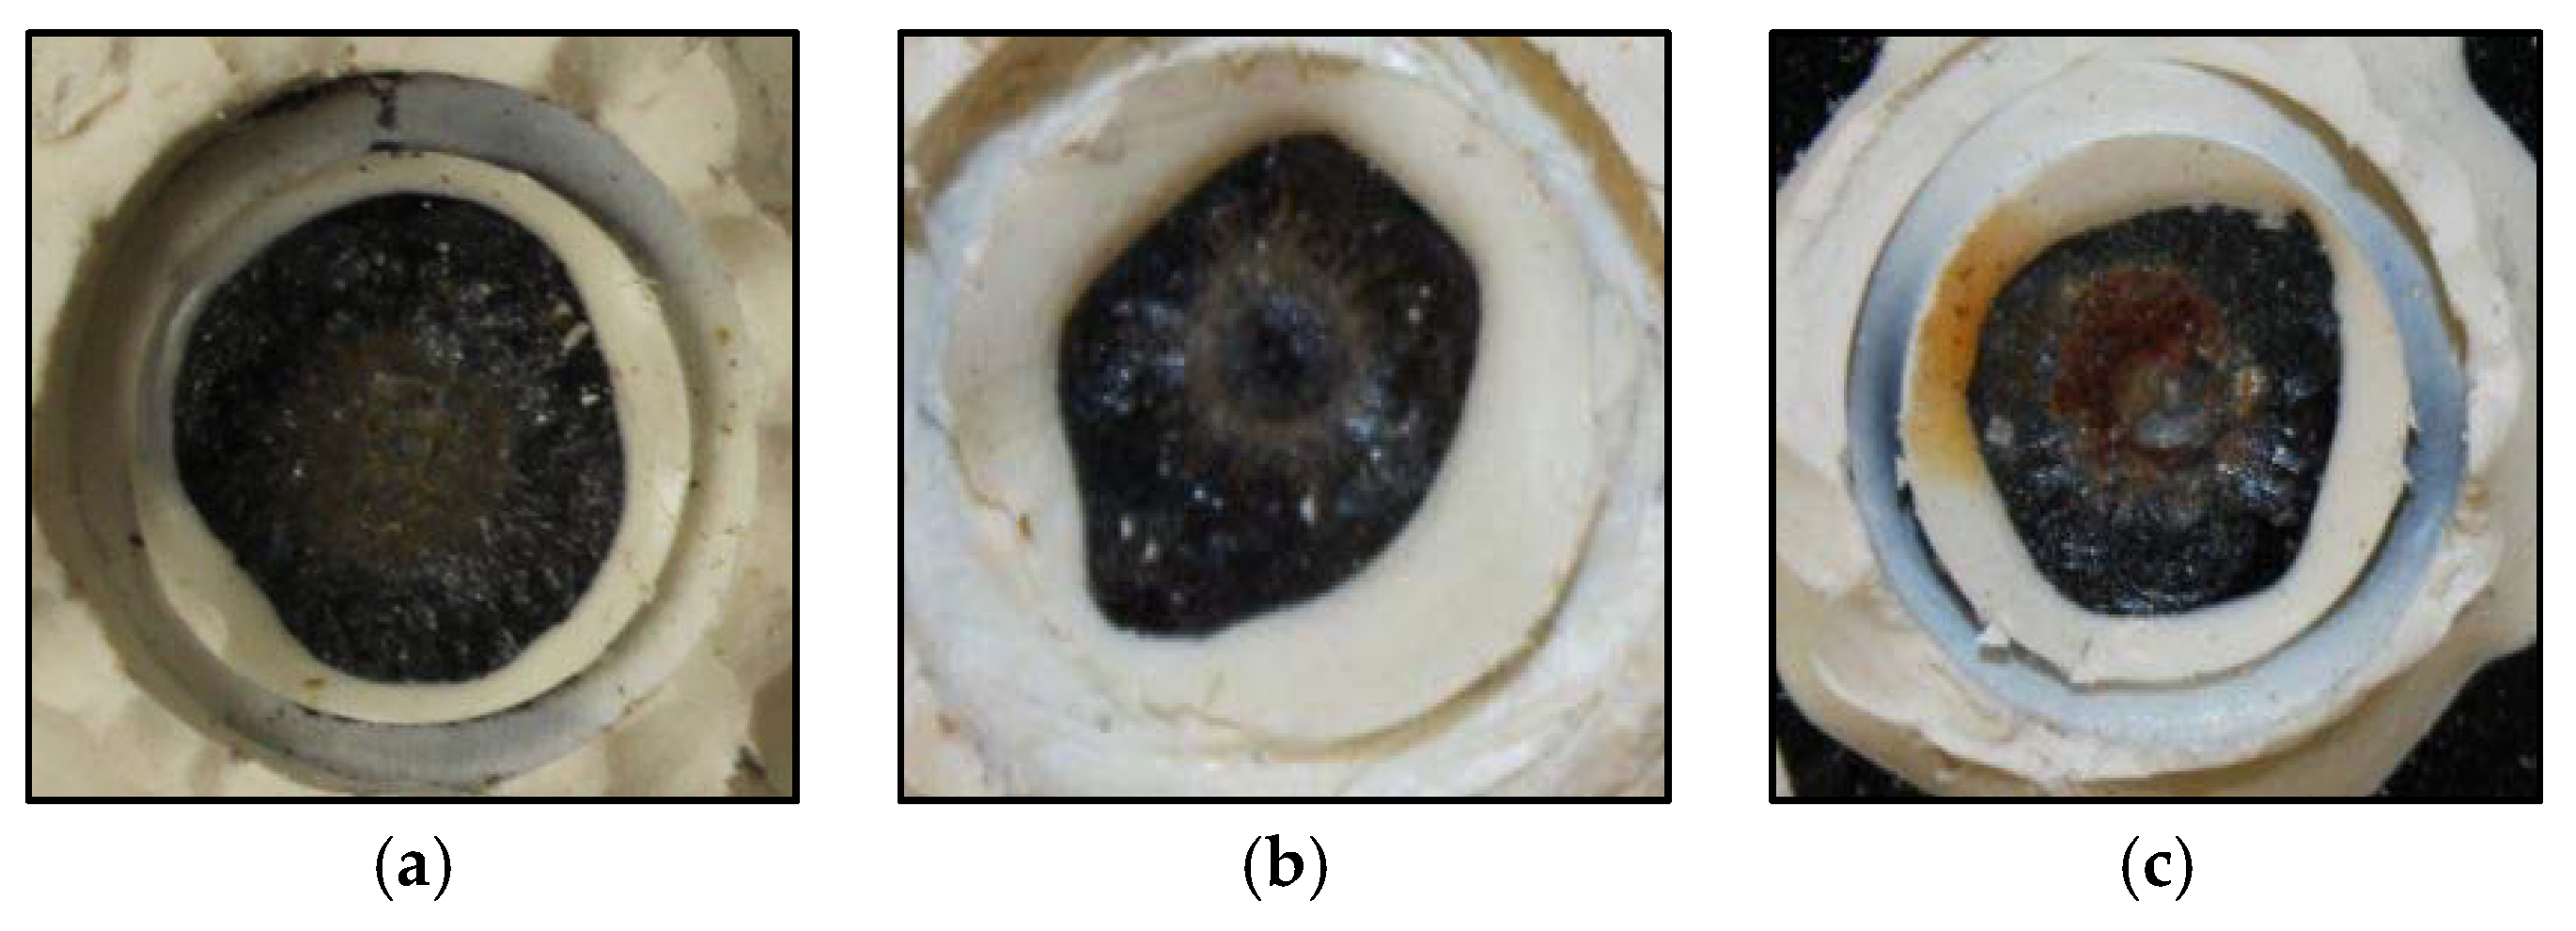
At the conclusion of the corrosion tests, the damaged spots of all tested samples were visually examined. No corrosion products were observed on the damaged surface under a cathodic potential of −1.15 V/SCE as shown in Figure 12. Brown corrosion products can be clearly seen on the damaged point of the sample tested under the OCP.
4. Conclusions
Based on the experimental results and analysis from one representative sample in each test condition, the following conclusions can be drawn:
- The enamel coating is subjected to initial compression due to its lower CTE than steel, thus it is less susceptible to tensile cracks. In comparison with epoxy coating, the enamel coating has a higher glass transition temperature, and thus allows an increase of pipeline operation temperature up to 400 °C, with a safety factor of approximately 1.25.
- Enamel residual remained between anchor points of the steel substrate after the enamel coating had been chipped off, this was due to impact loading. During all the corrosion tests, no further delamination was found, and the CP did not change the coating properties and the mechanical condition at the coating-substrate interface.
- At the intact coating areas, the higher the potential (up to −1.15 V/SCE) applied in CP, the higher the coating resistance and charge transfer resistance. The CP does not cause debonding between the coating and its steel substrate, it decelerates the degradation process of the coating and delays the electrochemical reactions at the steel-electrolyte interface.
- The resistances of all the damaged coatings were less than 1 kΩ cm2, indicating the loss of their barrier effect in protecting the steel substrate from corrosion. The introduction of CP does not improve the coating performance once damaged.
- The resistances against electrolyte penetration into the enamel coating and charge transfer through the steel-electrolyte interface in the intact and damaged enamel coating areas differed by at least 104 times after 70 days of testing. It is thus important to separate the electrochemical processes in the intact and damaged zones during corrosion tests.
Author Contributions
L.F. and G.C. conceived and designed the experiments; L.F. and S.T.R. performed the experiments; L.F. analyzed the data; M.L.K. contributed reagents and materials; L.F. prepared the manuscript.
Funding
The authors gratefully acknowledge the financial support provided by the U.S. Department of Transportation under Award No. DTPH5615HCAP10.
Conflicts of Interest
The authors declare no conflicts of interest.
References
- Love, C.T.; Xian, G.; Karbhari, V.M. Cathodic disbondment resistance with reactive ethylene terpolymer blends. Prog. Org. Coat. 2007, 60, 287–296. [Google Scholar] [CrossRef]
- Zhu, C.; Xie, R.; Xue, J.; Song, L. Studies of the impedance models and water transport behaviors of cathodically polarized coating. Electrochim. Acta 2011, 56, 5828–5835. [Google Scholar] [CrossRef]
- Martinez, S.; Žulj, L.V.; Kapor, F. Disbonding of underwater-cured epoxy coating caused by cathodic protection current. Corros. Sci. 2009, 51, 2253–2258. [Google Scholar] [CrossRef]
- Rossi, S.; Parziani, N.; Zanella, C. Abrasion resistance of vitreous enamel coatings in function of frit composition and particles presence. Wear 2015, 332, 702–709. [Google Scholar] [CrossRef]
- Lazutkina, O.R.; Kostenko, M.G.; Komarova, S.A.; Kazak, A.K. Highly reliable energy-efficient glass coatings for pipes transporting energy carriers, liquids, and gases. Glass Ceram. 2007, 64, 93–95. [Google Scholar] [CrossRef]
- Fan, L.; Tang, F.; Reis, S.T.; Chen, G.; Koenigstein, M.L. Corrosion resistance of transmission pipeline steel coated with five types of enamels. Acta Metall. Sin. (Engl. Lett.) 2017, 30, 390–398. [Google Scholar] [CrossRef]
- Fan, L.; Tang, F.; Reis, S.T.; Chen, G.; Koenigstein, M.L. Corrosion resistances of steel pipes internally coated with enamel. Corrosion 2017, 73, 1335–1345. [Google Scholar] [CrossRef]
- Lauer, R.S. Advancements in the abrasion resistance of internal plastic coatings. Mater. Perform. 2014, 53, 52–55. [Google Scholar]
- Deflorian, F.; Rossi, S. An EIS study of ion diffusion through organic coatings. Electrochim. Acta 2006, 51, 1736–1744. [Google Scholar] [CrossRef]
- Le Thu, Q.; Takenouti, H.; Touzain, S. EIS characterization of thick flawed organic coatings aged under cathodic protection in seawater. Electrochim. Acta 2006, 51, 2491–2502. [Google Scholar] [CrossRef]
- ASTM D4541–09(2009) Standard Test Method for Pull-Off Strength of Coatings Using Portable Adhesion Testers; ASTM Standards: West Conshohocken, PA, USA, 2009.
- ASTM G14-04(2010)e1 Standard Test Method for Impact Resistance of Pipeline Coatings (Falling Weight Test); ASTM Standards: West Conshohocken, PA, USA, 2010.
- Yang, X.; Jha, A.; Brydson, R.; Cochrane, R.C. An analysis of the microstructure and interfacial chemistry of steel–enamel interface. Thin Solid Films 2003, 443, 33–45. [Google Scholar] [CrossRef]
- Samiee, L.; Sarpoolaky, H.; Mirhabibi, A. Microstructure and adherence of cobalt containing and cobalt free enamels to low carbon steel. Mater. Sci. Eng. A 2007, 458, 88–95. [Google Scholar] [CrossRef]
- Liu, H.H.; Shueh, Y.; Yang, F.S.; Shen, P. Microstructure of the enamel-steel interface: Cross-sectional TEM and metallographic studies. Mater. Sci. Eng. A 1992, 149, 217–224. [Google Scholar] [CrossRef]
- Presa, M.R.; Tucceri, R.I.; Florit, M.I.; Posadas, D. Constant phase element behavior in the poly(o-toluidine) impedance response. J. Electroanal. Chem. 2001, 502, 82–90. [Google Scholar] [CrossRef]
- Yao, Z.P.; Jiang, Z.H.; Wang, F.P. Study on corrosion resistance and roughness of micro-plasma oxidation ceramic coatings on Ti alloy by EIS technique. Electrochim. Acta 2007, 52, 4539–4546. [Google Scholar] [CrossRef]
- Orazem, M.E.; Tribollet, B. Equivalent circuit analogs. In Electrochemical Impedance Spectroscopy, 1st ed.; John Wiley & Sons: Hoboken, NJ, USA, 2008; p. 233. ISBN 978-0-470-04140-6. [Google Scholar]
- Zhang, J.T.; Hu, J.M.; Zhang, J.Q.; Cao, C.N. Studies of water transport behavior and impedance models of epoxy-coated metals in NaCl solution by EIS. Prog. Org. Coat. 2004, 51, 145–151. [Google Scholar] [CrossRef]
- Zhang, J.T.; Hu, J.M.; Zhang, J.Q.; Cao, C.N. Studies of impedance models and water transport behaviors of polypropylene coated metals in NaCl solution. Prog. Org. Coat. 2004, 49, 293–301. [Google Scholar] [CrossRef]
- Hu, J.M.; Zhang, J.Q.; Cao, C.N. Determination of water uptake and diffusion of Cl− ion in epoxy primer on aluminum alloys in NaCl solution by electrochemical impedance spectroscopy. Prog. Org. Coat. 2003, 46, 273–279. [Google Scholar] [CrossRef]
- Walter, G.W. A review of impedance plot methods used for corrosion performance analysis of painted metals. Corros. Sci. 1986, 26, 681–703. [Google Scholar] [CrossRef]
- Tang, F.J.; Chen, G.; Brow, R.K.; Volz, J.S.; Koenigstein, M.L. Corrosion resistance and mechanism of steel rebar coated with three types of enamel. Corros. Sci. 2012, 59, 157–168. [Google Scholar] [CrossRef]
- Tang, F.J.; Cheng, X.M.; Chen, G.; Brow, R.K.; Volz, J.S.; Koenigstein, M.L. Electrochemical behavior of enamel-coated carbon steel in simulated concrete pore water solution with various chloride concentrations. Electrochim. Acta 2013, 92, 36–46. [Google Scholar] [CrossRef]
- Ranade, S.; Forsyth, M.; Tan, M.Y.J. In situ measurement of pipeline coating integrity and corrosion resistance losses under simulated mechanical strains and cathodic protection. Prog. Org. Coat. 2016, 101, 111–121. [Google Scholar] [CrossRef]
Figure 1.
Impact-induced coating damage.

Figure 2.
Schematic representation of the double electrochemical cell (unit: mm): (a) planar view of the sample with damaged coating and attached funnel; (b) side view of the electrochemical cell immersed in the bulk solution.
Figure 2.
Schematic representation of the double electrochemical cell (unit: mm): (a) planar view of the sample with damaged coating and attached funnel; (b) side view of the electrochemical cell immersed in the bulk solution.

Figure 3.
Thermal properties of enamel coating and pipe steel.

Figure 4.
Cross-sectional SEM images of enamel-coated samples under the OCP (a,c) and −1.15 V/SCE (b,d) with a magnification of 250× (a,b) and 2500× (c,d).
Figure 4.
Cross-sectional SEM images of enamel-coated samples under the OCP (a,c) and −1.15 V/SCE (b,d) with a magnification of 250× (a,b) and 2500× (c,d).

Figure 5.
Bode diagrams of enamel-coated samples immersed in 3.5 wt % NaCl solution up to 70 days at (1) intact coating zone, and up to 10 days at (2) damaged coating zone under a cathodic potential of (a) −1.15 vs. SCE/V, (b) −0.85 vs. SCE/V, and (c) the OCP. d: day.
Figure 5.
Bode diagrams of enamel-coated samples immersed in 3.5 wt % NaCl solution up to 70 days at (1) intact coating zone, and up to 10 days at (2) damaged coating zone under a cathodic potential of (a) −1.15 vs. SCE/V, (b) −0.85 vs. SCE/V, and (c) the OCP. d: day.

Figure 6.
Equivalent electrical circuit (EEC) models for the samples tested (a) in the first 45 days under a cathodic potential of −1.15 V/SCE and in the first 10 days under a cathodic potential of −0.85 V/SCE on the intact coating zone; (b) from the 45th day to the end of test under a cathodic potential of −1.15 V/SCE and from the 15th day to the 45th day under a cathodic potential of −0.85 V/SCE on the intact coating zone; (c) from the 45th day to the end of test under a cathodic potential of −0.85 V/SCE on the intact zone; (d) on the damaged coating zone.

Figure 7.
Properties of intact coating under various CP levels: (a) pore resistance Rc and (b) capacitance CPEc.
Figure 7.
Properties of intact coating under various CP levels: (a) pore resistance Rc and (b) capacitance CPEc.

Figure 8.
Damaged coating properties: (a) pore resistance Rc and (b) capacitance CPEc.

Figure 9.
Properties of the steel-electrolyte interface under intact enamel coating: (a) charge transfer resistance Rct and (b) double layer capacitance CPEdl.
Figure 9.
Properties of the steel-electrolyte interface under intact enamel coating: (a) charge transfer resistance Rct and (b) double layer capacitance CPEdl.

Figure 10.
Properties of the steel-electrolyte interface under damaged enamel coating: (a) charge transfer resistance Rct and (b) double layer capacitance CPEdl.
Figure 10.
Properties of the steel-electrolyte interface under damaged enamel coating: (a) charge transfer resistance Rct and (b) double layer capacitance CPEdl.

Figure 11.
Variations of currents applied to various samples under −0.85 vs. SCE/V and −1.15 vs. SCE/V: (a) intact coating zone and (b) damaged coating zone.
Figure 11.
Variations of currents applied to various samples under −0.85 vs. SCE/V and −1.15 vs. SCE/V: (a) intact coating zone and (b) damaged coating zone.

Figure 12.
Damaged surface conditions of the samples tested under (a) −1.15 vs. SCE/V, (b) −0.85 vs. SCE/V and (c) the OCP after corrosion tests.
Figure 12.
Damaged surface conditions of the samples tested under (a) −1.15 vs. SCE/V, (b) −0.85 vs. SCE/V and (c) the OCP after corrosion tests.


Table 1.
Chemical composition of steel pipe.
| Element | C | Mn | P | S | Si | Cu | Ni | Cr | Mo | Al | V | Fe | Others |
|---|---|---|---|---|---|---|---|---|---|---|---|---|---|
| wt % | 0.17 | 1.15 | 0.07 | 0.02 | 0.26 | 0.10 | 0.04 | 0.07 | 0.07 | 0.024 | 0.02 | 98 | 0.006 |
Table 2.
Chemical compositions of T-001 glass frits (wt %).
| Elements | SiO2 | B2O3 | Na2O | CaO | MnO2 | Al2O3 | TiO2 | K2O | Fe2O3 | MgO | BaO | Others |
|---|---|---|---|---|---|---|---|---|---|---|---|---|
| T-001 | 60.3 | 12.84 | 7.20 | 2.37 | 5.37 | 4.49 | 0.14 | 2.12 | 3.48 | 0.17 | 1.47 | 0.05 |
© 2018 by the authors. Licensee MDPI, Basel, Switzerland. This article is an open access article distributed under the terms and conditions of the Creative Commons Attribution (CC BY) license (http://creativecommons.org/licenses/by/4.0/).
Share and Cite
MDPI and ACS Style
Fan, L.; Reis, S.T.; Chen, G.; Koenigstein, M.L. Corrosion Resistance of Pipeline Steel with Damaged Enamel Coating and Cathodic Protection. Coatings 2018, 8, 185. https://doi.org/10.3390/coatings8050185
AMA Style
Fan L, Reis ST, Chen G, Koenigstein ML. Corrosion Resistance of Pipeline Steel with Damaged Enamel Coating and Cathodic Protection. Coatings. 2018; 8(5):185. https://doi.org/10.3390/coatings8050185
Chicago/Turabian StyleFan, Liang, Signo T. Reis, Genda Chen, and Michael L. Koenigstein. 2018. "Corrosion Resistance of Pipeline Steel with Damaged Enamel Coating and Cathodic Protection" Coatings 8, no. 5: 185. https://doi.org/10.3390/coatings8050185
Note that from the first issue of 2016, this journal uses article numbers instead of page numbers. See further details here.