The Potential of Tribological Application of DLC/MoS2 Coated Sealing Materials
by
 ,
,
Chao Wang
1,* ,
,
Andreas Hausberger
1,
Philipp Nothdurft
2,
Jürgen Markus Lackner
3 and
Thomas Schwarz
4 1
Polymer Competence Center Leoben GmbH, Roseggerstraße 12, 8700 Leoben, Austria
2
Chair of Chemistry of Polymeric Materials, Montanuniversität Leoben, 8700 Leoben, Austria
3
Institute of Surface Technologies and Photonics, Joanneum Research Forschungsgesellschaft mbH, 8712 Niklasdorf, Austria
4
SKF Sealing Solutions Austria GmbH, 8750 Judenburg, Austria
*
Author to whom correspondence should be addressed.
Coatings 2018, 8(8), 267; https://doi.org/10.3390/coatings8080267
Submission received: 13 June 2018
/
Revised: 19 July 2018
/
Accepted: 29 July 2018
/
Published: 31 July 2018
(This article belongs to the Special Issue Coatings Tribology)
Abstract
:The potential of the combination of hard and soft coating on elastomers was investigated. Diamond-like carbon (DLC), molybdenum disulfide (MoS2) and composite coatings of these two materials with various DLC/MoS2 ratios were deposited on four elastomeric substrates by means of the magnetron sputtering method. The microstructures, surface energy of the coatings, and substrates were characterized by scanning electron microscopy (SEM) and contact angle, respectively. The chemical composition was identified by X-ray Photoelectron Spectroscopy (XPS). A ball on disc configuration was used as the model test, which was performed under dry and lubricated conditions. Based on the results from the model tests, the best coating was selected for each substrate and subsequently verified in component-like test. There is not one coating that is optimal for all substrates. Many factors can affect the coatings performance. The topography and the rigidity of the substrates are the key factors. However, the adhesion between coatings and substrates, and also the coating processes, can impact significantly on the coatings performance.
1. Introduction
Coating is one of the approaches that can improve the tribological properties economically. In recent years, the development of the coating methods has opened up new possibilities to enhance the surface properties. Coatings can be generally divided into “soft coatings” and “hard coatings” [1]. Soft coatings, including soft metal (e.g., lead, indium) and lamellar solids (e.g., graphite and molybdenum disulfide (MoS2)), provide good shearing characteristics and thus result in a reduction of friction. Hard coatings (e.g., diamond-like carbon (DLC), titanium nitride (TiN)) can improve protection against wear and present low wear rates.
The unique properties of elastomers, such as low modulus of elasticity, high Poisson’s ratio, and high degree of resilience with low hysteresis, make elastomers very suitable for the application as seals. However, high and erratic friction under dry and starved lubrication conditions could increase the friction and wear rates. As a consequence of surface damage, the lifetime of seals can be shortened greatly [2]. An approach to reduce the friction under dry and starved lubrication conditions is to deposit DLC on rubber. A lot of studies, from deposition techniques to DLC composition on various rubber materials, such as nitrile butadiene rubber (NBR), hydrogenated nitrile butadiene rubber (HNBR), fluoroelastomer (FKM), and ethylene propylene diene monomer rubber (EPDM), has been done by a Japanese group of Nakahigashi [3,4], Takikawa et al. [5,6,7], a Dutch group of Pei and Bui et al. [8,9,10,11,12], and other researchers [13,14]. MoS2 as a solid lubricant is mostly employed with hard surfaces (e.g., metals, ceramics) [15,16,17]. As to the combination of the two coatings, Wang et al. [18] has deposited MoS2 on Steels with a supporting DLC film and it showed the MoS2/DLC compound film reduced the friction force in humid environment. Recently, Zhao et al. [19] has deposited the MoS2/DLC multilayer coatings on Si wafer and steel in high humidity for aerospace industries and it showed a moderate improvement of the tribological properties. The influence of space irradiation on MoS2/DLC composite film on Si and steel was investigated by Wu et al. [20]. It showed a reduction of the wear rate after irradiation, which could be related to the increase of hardness. Noshiro et al. [21] has studied the friction properties of sulfide/DLC coating with a nanocomposite or –layered structure on Si wafer, which shows better tribological properties than DLC film. Previous work has focused only on either the composite MoS2/DLC coating on metals or DLC and MoS2 separately as coating on elastomers. Therefore, more work is needed to investigate the potential of application of composite coatings on elastomers.
In this research, the tribological properties of DLC, MoS2, and combined coatings of MoS2 and DLC were investigated on four elastomers. Coated elastomers were tested in model tests and after that the results were verified in component-like tests. The influence factors of tribological behaviors are discussed. The aim of this study is to investigate the potential of tribological application of composite coatings of MoS2 and DLC on elastomeric substrates for industrial seals, especially under starved lubrication conditions. In addition, the study provides a guideline to evaluate the coatings.
2. Experimental Details
2.1. Test Materials and Coatings
Four classical sealing materials were tested; i.e., fluoroelastomer (FKM), nitrile butadiene rubber (NBR), hydrogenated nitrile butadiene rubber (HNBR), and thermoplastic polyurethane (TPU). Among these four elastomers, FKM is the softest material, having a shore—a hardness of 84; followed by NBR (85) and HNBR (86). Due to its special chemical composition, TPU is the hardest material with a shore—A hardness of 95. For ball on disc tests, the samples were 20 mm × 20 mm square rubber sheets with a thickness of 2 mm, which were produced by the compression molding process. However, slight differences could be found on the surface under the microscope among TPU, HNBR, and FKM. For TPU a totally different molding die was used and the surface was polished. This is explained in more detail in Section 3.1.1 (microscopic analysis). For ring on disc tests, special samples were used, which are structurally similar to seals [22]. In order to remove contamination on the substrate and also inside the rubber (e.g., plasticizers [23]), all of the samples were cleaned using the standard cleaning procedures [9]. The difference between set and actual values can be explained with sputtering duration (Table 1). As a result of about three times longer sputtering duration time of the DLC 300 nm than the DLC 150 nm, the actual thickness of the DLC 300 nm is over three times thicker. The thickness of MoS2 coating is proportional to the sputtering time. The thickness varied due to the influence of different sputtering parameters.
Table 2 shows the material and thickness of the investigated coatings. Five different materials (i.e., DLC, MoS2, and three hybrid combinations of DLC and MoS2 with various proportions) were deposited as coatings on the substrates. These two materials were not combined as multilayers, but rather in a composite. The proportion of MoS2 in the composite increases from Hybrid_A to Hybrid_C. Based on our previous work, the set value of 300 nm was selected as the standard thickness for the coatings and the set values of the thickness were defined based on the deposition rate [24]. In order to investigate the influence of the thickness on the tribological properties, 150 nm thick coatings were also obtained through controlling the deposition process time. In order to measure the thickness, several samples were partially covered with tapes during the coating process. After removing the tapes, the thickness was measured with a contact stylus profilometry (Dektak 150 surface profiler, Veeco, Plainview, NY, USA).
In order to improve the adhesion of the coatings, prior to deposition a pre-treatment process was carried out by using a high vacuum experimentation bell jar system (Leybold Univex 450, Leybold Vacuum GmbH, Cologne, Germany) [25,26]. Substrates were fixed on the rotary table (ϕ = 560 mm) with a distance of 12 mm to the target.
The cylindrical pulsed laser deposition (PLD) evaporator was used as a target. The pre-treatment was performed at 3 kV DC acceleration voltage with 15 sccm Ar and 5 sccm O2 gas flow. The chamber pressure was around 8.8 × 10⁻⁴ mbar. After pre-treatment, the coatings were deposited by means of the pulsed DC magnetron sputtering method. A graphite target (electrographite, 99.5% purity) was used as a sputtering source for DLC coatings. For MoS2 its purity is 99.5%. Both targets were purchased from Sindlhauser Material GmbH (Kempten, Germany).
The parameters of the pre-treatment and deposition process are shown in Table 1. For pure DLC film, the ratio of C2H2/Ar was 0.19, due to the existence of C2H2, a-c: H film was generated [27,28]. For the hybrid coatings, only Ar was used as a source gas [28]. For the hybrid coatings, graphite and MoS2 were ejected individually from two sputtering sources. Different hybrid variants were generated by varying sputter power. Remarkably, differences of the micro-structures can be observed on the coating when the substrates were deposited at different temperatures [29]. To avoid the thermal influences on substrates and coating processes, the pre-treatment and deposition processes were performed under constant ambient temperature (23 °C). However, due to plasma flow the temperature of the sample surface can increase up to 40 °C. After the deposition process, the samples were stored in Petri dishes in a box.
An optical microscope (Stereo Microscope SZX 12, Olympus, Tokyo, Japan) was employed to analyze the wear scars of the counterparts. The surface roughness was measured in three different regions of each sample with a three-dimensional focus variation microscope (InfiniteFocus, Alicona, Graz, Austria). The surface morphology and wear tracks of coated rubber were characterized with a scanning electron microscope (SEM, VEGA-II, TESCAN, Brno, Czech Republic).
In order to characterize the chemical composition of the coatings, X-ray photoelectron spectroscopy (XPS) analysis were carried out using a Thermo Scientific spectrometer with a micro-focused monochromatic Al Kα source (1486.6 eV, Thermo Fisher Scientific Inc., Waltham, MA, USA). All measurements were conducted with the radiation source operated at 12 kV and a beam current of 1.16 mA in a high vacuum below 10−7 mbar. A hemispherical analyzer was applied to detect the accelerated electrons. The electrons were collected from a spot area of 300 µm, which is vertical to the analyzer. To prevent charging and electron charge compensation of the samples, a flood gun was used.
Survey scans were acquired within an energy range of 0–1350 eV using a pass energy of 200 eV, a step size of 1.0 eV, a dwell time of 50 ms, and 2 scans. High resolution scans were obtained using a 50 eV pass energy, 0.1 eV step size, a dwell time of 50 ms, and 8 scans. For C 1s, Mo 3d and S 2p, binding energy ranges and total number of energy steps are as follows: 279–298 eV, 181 steps; 222–240 eV, 181 steps; 157–170 eV, 181 steps; respectively.
The spectra were referenced to the alkyl C 1s photoelectron peak at 284.8 eV, characteristic of the alkyl moieties (C–C/C–H). Peak positions for qualitative analysis are consistent with the corresponding assignment positions found in literature [30].
Spectra were analyzed using the Thermo Avantage software (Version 5932). The ratio of Lorentzian/Gaussian is 0.3. A standard Shirley background is used for the reference samples spectra. The spectra were fitted with Powell algorithm with a convergence of 10−6. The maximum error for peak energy and full width at half maxima (FWHM) is ±0.1 eV. The sensitivity factors (SF) used for calculation are provided by the equipment supplier.
The determination of surface energy was carried out in a self-developed contact angle device. Distilled water and diiodomethane were applied as liquids to determine the polar and dispersive part of the surface energy, respectively. For each measurement, a drop of 2.5 µL volume was used. Each measurement was repeated three times. Owens et al. [31], Rabel [32] and Kaelble [33] method was applied for calculating the surface energy.
2.2. Test Procedures
The tribological properties were investigated by means of model tests and component-like tests. The model tests were performed on a micro tribometer with a ball on disc configuration (UMT-2, Bruker, Billerica, MA, USA). The development of the sample geometry for the component-like test was reported by Hausberger [22]. The tests were performed on a precision rotary tribometer (TE-93, Phoenix Tribology Ltd., Kingsclere, UK). Each test was repeated three times. All of the tests were conducted at room temperature (22 °C) with a relative humidity of 50% ± 10%. About one month after the coating process, the tribological tests were performed.
2.2.1. Ball on Disc Tests
Commercial 100Cr6 stainless steel balls of 6 mm diameter (HRC 60–62) were used as counterparts. The counter body slid on the elastomer at 100 mm/s with 1 N normal load. The radii of the run tracks were 5 mm and 7.5 mm. The total length of the tracks was 3.143 × 10⁵ m. In order to obtain a better understanding of the function of the coatings, the tests were performed under dry and lubricated conditions. For the lubricated tests, approximately 7 mg Mobil SHC Grease 460WT (Viscosity of Oil, ASTM D 445 [31] cSt @ 40 °C = 460) was smeared equally over the whole surface [32]. The average thickness of the grease can be calculated. Its amount was chosen so that the thickness of the grease layer was approximately 0.02 mm.
2.2.2. Ring on Disc Tests
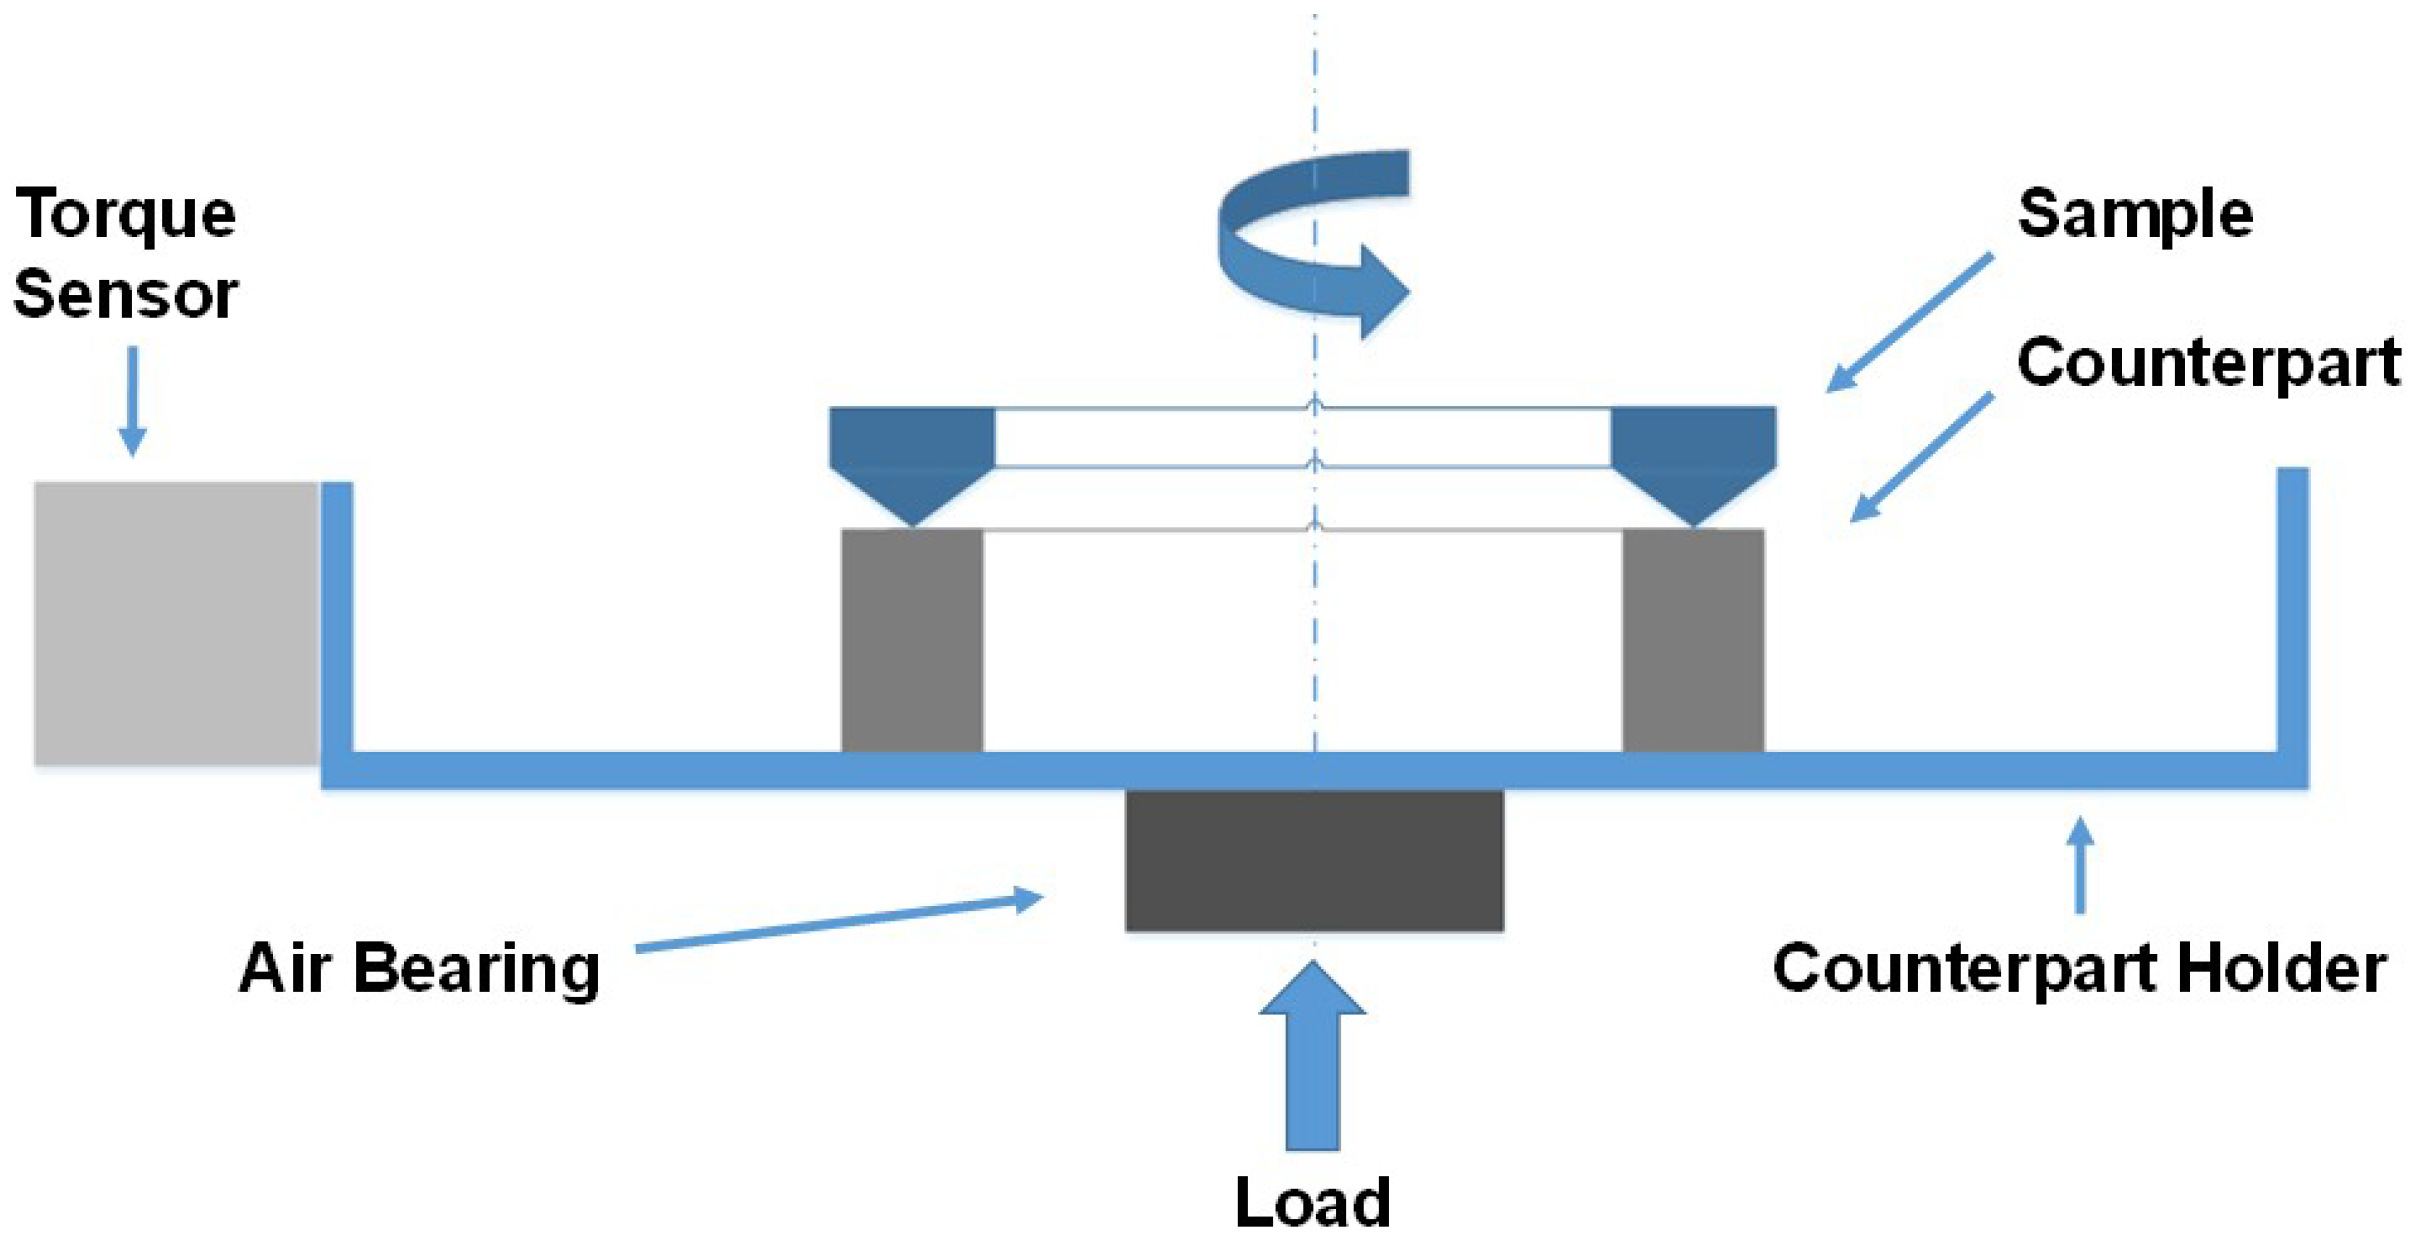
Ring-shaped counterparts of 34CrNiMo6 were used in the ring on disc test. They possessed an average roughness (Ra) of 0.035 µm. The ring-like sample was so constructed that there was only a line contact between the sample and counterpart [22]. The tests were conducted with 50 N normal load at room temperature (23 °C) and the speed of revolution was 118 rpm. The aim of this research is to improve the tribological properties of seals under starved lubricated conditions. In order to simulate starved lubrication condition in component-like tests, approximately 2 mg Mobil SHC Grease 460WT was smeared on the contact edge of the samples. For uncoated samples the tests lasted 168 h. For the coated samples, the tests were stopped automatically when the abort condition was reached. The abort condition was set according to the coefficient of friction of the uncoated samples. The principle of the ring on disc test is illustrated in Figure 1.
The counterpart was fixed on the counterpart holder. The load, which was produced by a pneumatic pump, acted on the sample through the thrust bearing and counterpart. An electric motor was mounted on the top of the machine and drove the sample against the counterpart in a rotational movement. The torque, which was generated through friction, was measured by a torque sensor. Furthermore, the temperature near the contact area and in the middle of the counterpart was also measured during the test.
3. Results and Discussion
3.1. Characteristics of Coatings
After deposition the thickness of coatings was measured. The chemical composition was investigated with XPS measurements. The microstructures of the surfaces were analyzed with roughness and compared among different substrates. Furthermore, the surface energy of the substrates and coatings were identified.
3.1.1. Thickness of the Coatings
For each coating, the thickness was measured at six different positions of the two samples. Table 2 shows the set and actual average thickness. The difference between set and actual values can be explained with sputtering duration (Table 1). As a result of about three times longer sputtering duration time of the DLC 300 nm than the DLC 150 nm, the actual thickness of the DLC 300 nm is over three times thicker. The thickness of the MoS2 coating is proportional to the sputtering time. The thickness varied due to the influence of different sputtering parameters.
As reported in [7], the application of C2H2 accelerates the deposition rate, which leads to a higher thickness than the set value.
3.1.2. Chemical Composition
The chemical composition, the assigned peak energies, full width at half maxima (FWHM), and sensitivity factor (SF) of each peak are given in Table 3 and were obtained with XPS analysis.
In Table 4, the chemical composition of each coating is listed. In order to avoid the influence of the different elastomeric substrates, coatings were deposited on silicon for the XPS analysis.
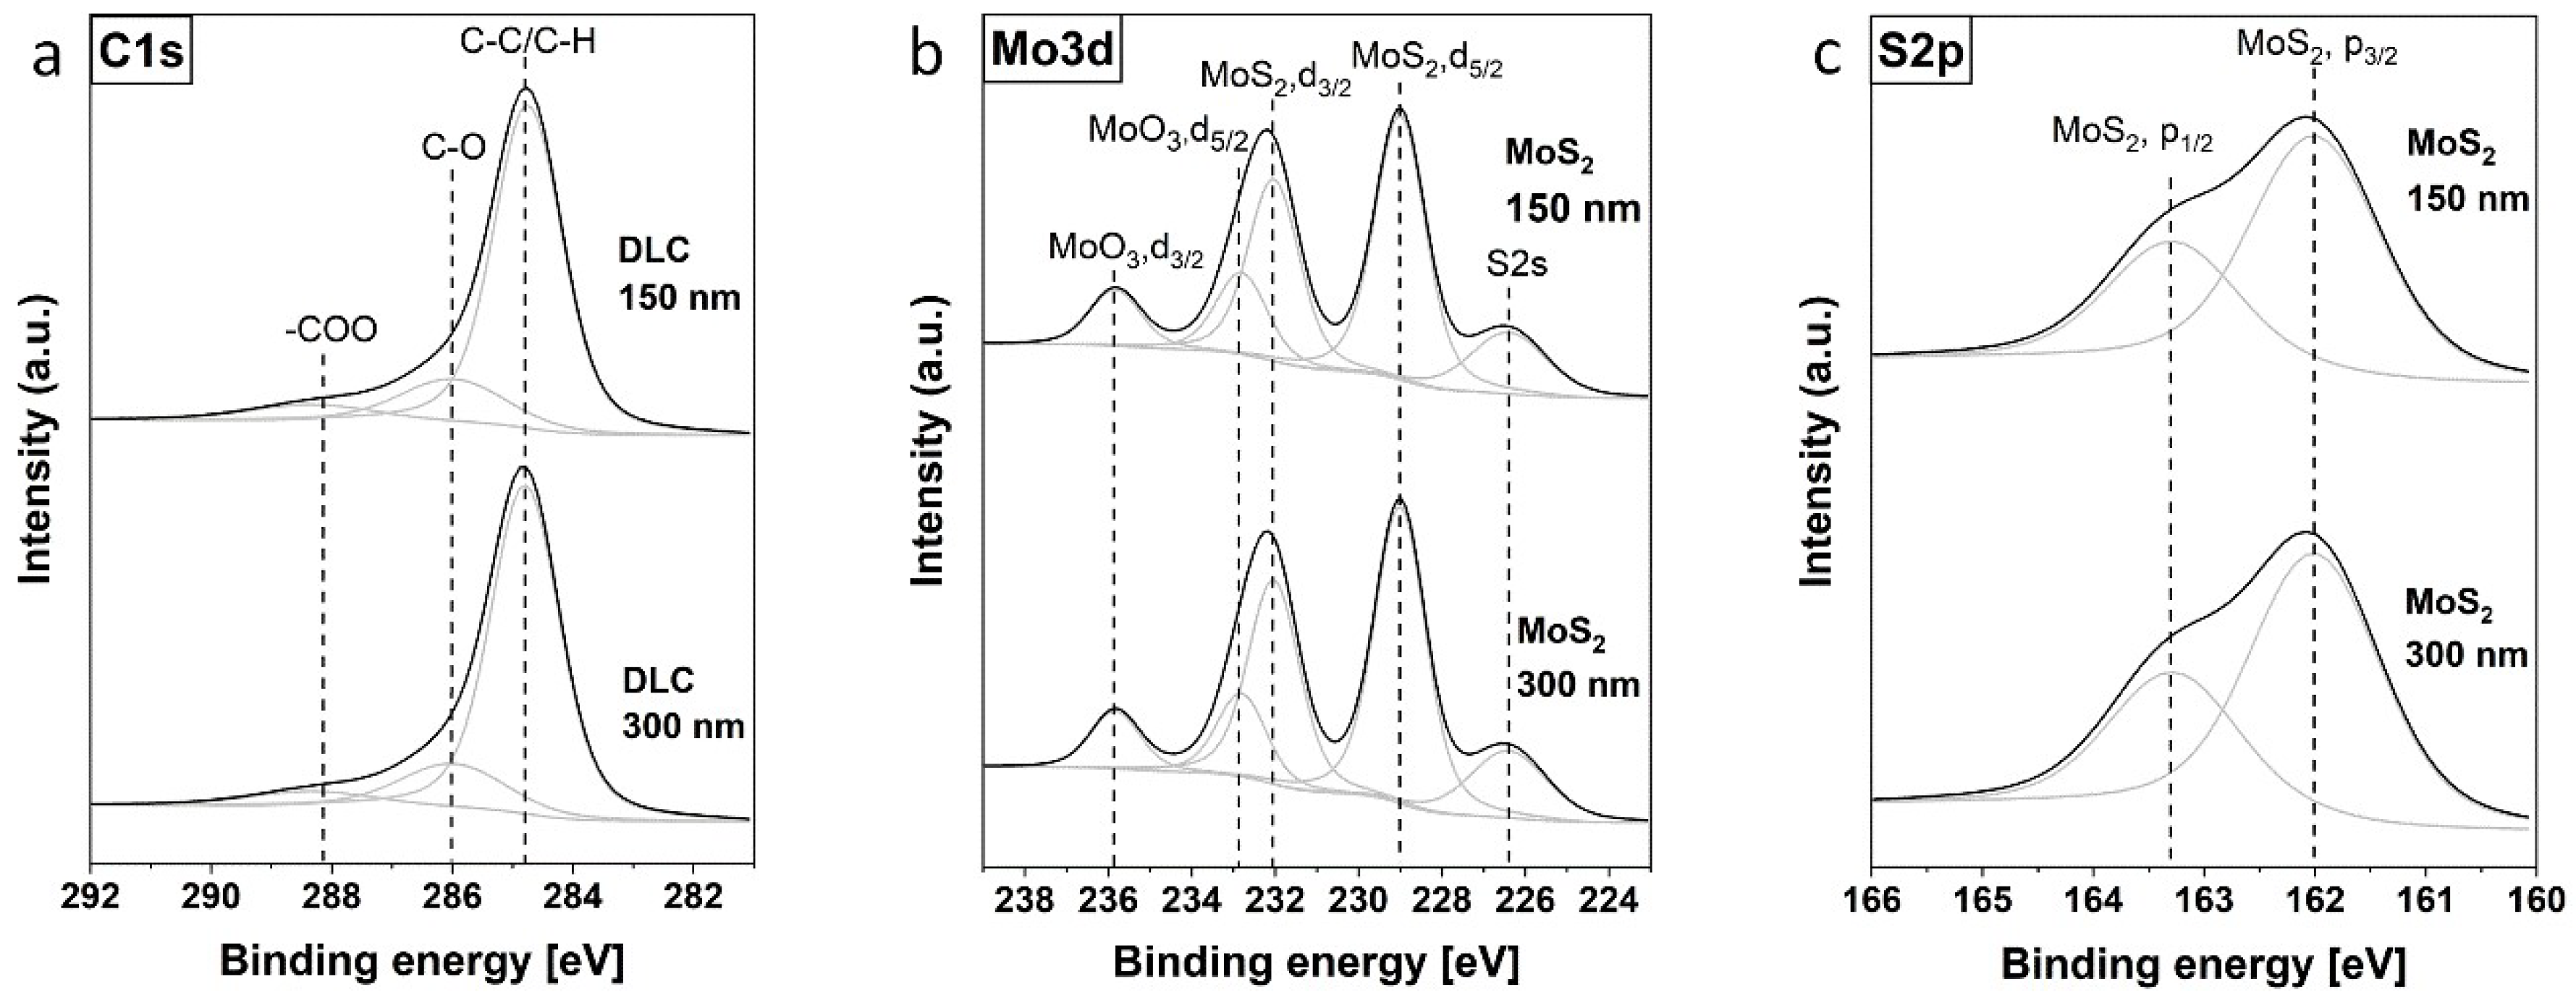
In both DLC coatings, the portion of C 1s is about 90% with no detectable silicon signal corresponding to a homogeneous carbon layer formation. The dominating carbon species are C–C/C–H bonds at 284.8 eV (Figure 2a) which are unambiguous assigned to the atomic structure of the used DLCs. The beneficial properties of DLC in tribology depend mainly on the similar hardness and Young’s modulus as diamonds [28,40]. Besides, C–O and –COO signals were also found and are attributed to the surface oxidation during the coating process and storage [41] and is in good agreement with the results obtained in [42].
In pure MoS2 coatings, the high nitrogen and carbon amounts are attributed to atmospheric contaminations (CO2, hydrocarbons, N2, etc.) during sample transport or storage or manufacturing of the samples. However, the S 2p doublet at 162.0 eV (ΔeV = 1.18) in combination with the doublet at 229.0 eV and 232.1 eV is unambiguous assigned to MoS2 (Figure 1c,d). A second doublet in the Mo 3d spectra is attributed to Mo with environment as in MoO3 [43]. On the subject of oxidation of molybdenum disulfide to molybdenum (VI) oxide, different reports were found [15,44]. In general, the oxidation rate is extremely low at ambient temperature and in the absence of a high concentration of moisture [15]. The oxidized layer at the outmost surface appears to protect the bulk material from further oxidation. However, different oxidation rates at ambient condition were investigated, and it was found the crystallite orientation plays an important role in the oxidation process [45]. Oxidation leads to a higher friction coefficient, enhanced wear rate, and hence a shorter wear life [36,46]. The ratio of MoS2/MoO3 in the reference coatings indicates that oxidation had occurred but the major portion is still MoS2. For the hybrid samples (Figure 2d–f), the amount of MoS2 is increased from Hybrid_A to Hybrid_C. As a result, the ratio of total S/Mo decreases from Hybrid_A (1.3) to Hybrid_C (1.0). The higher the concentration of MoS2, the higher the oxidation rate and as a result the lower the MoS2/MoO3 ratio. It is suggested that the increase of MoS2 amount in the coatings accelerates the oxidation rate and is highest for the Hybrid_C sample.
The S 2p spectrum appears as two overlapping doublets. This means, different types of sulfur ligands, such as bridging terminal S22−, and bridging S2− species exist in the coating [37]. In addition, our results were in agreement with Benoist et al. observations as a higher oxygen content lead to a decrease in the S2− sulphur component whereas the S22− pair increase [43].
3.1.3. Microscopic Analysis
The uncoated substrates, except HNBR, were analyzed with a microscope and presented in a previous work [24]. Generally, on a macroscopic level the uncoated HNBR, NBR, and FKM possess similar parallel, strip-like structures, whereas TPU presents completely different structures. Due to the different physical properties of elastomers, especially elasticity and viscosity, which can have an effect on the flow properties in the molding process, they behaved differently during the processing [47]. Although uncoated HNBR and FKM show similar macrostructures, on the microscopic level utterly different microstructures can be observed. The surface of uncoated HNBR is relatively smooth but with some small debris. However, the surface of uncoated FKM is much rougher and with dense particles. This can also be explained with Ra and Rz. In spite of the very similar Ra value of uncoated HNBR and FKM, the Rz value of uncoated FKM is more than 30% higher than that of uncoated HNBR (Table 5).
The surface of uncoated TPU was full of small strips. However, the strips were not as neatly arranged as those of HNBR and FKM. Also, compared to HNBR and FKM, the strips on TPU were much narrower and shallower. Another difference, which must be mentioned, is that, except for the strips, there were almost no small debris or particles on uncoated TPU.
In this section, for each substrate two coatings have been chosen and discussed. The two coatings were so chosen that, regarding the substrate, one of them showed the best tribological performance and the other showed the worst in the dry and lubricated ball on disc tests. In addition, one thin coating for HNBR was chosen to analyze the influence of the thickness.
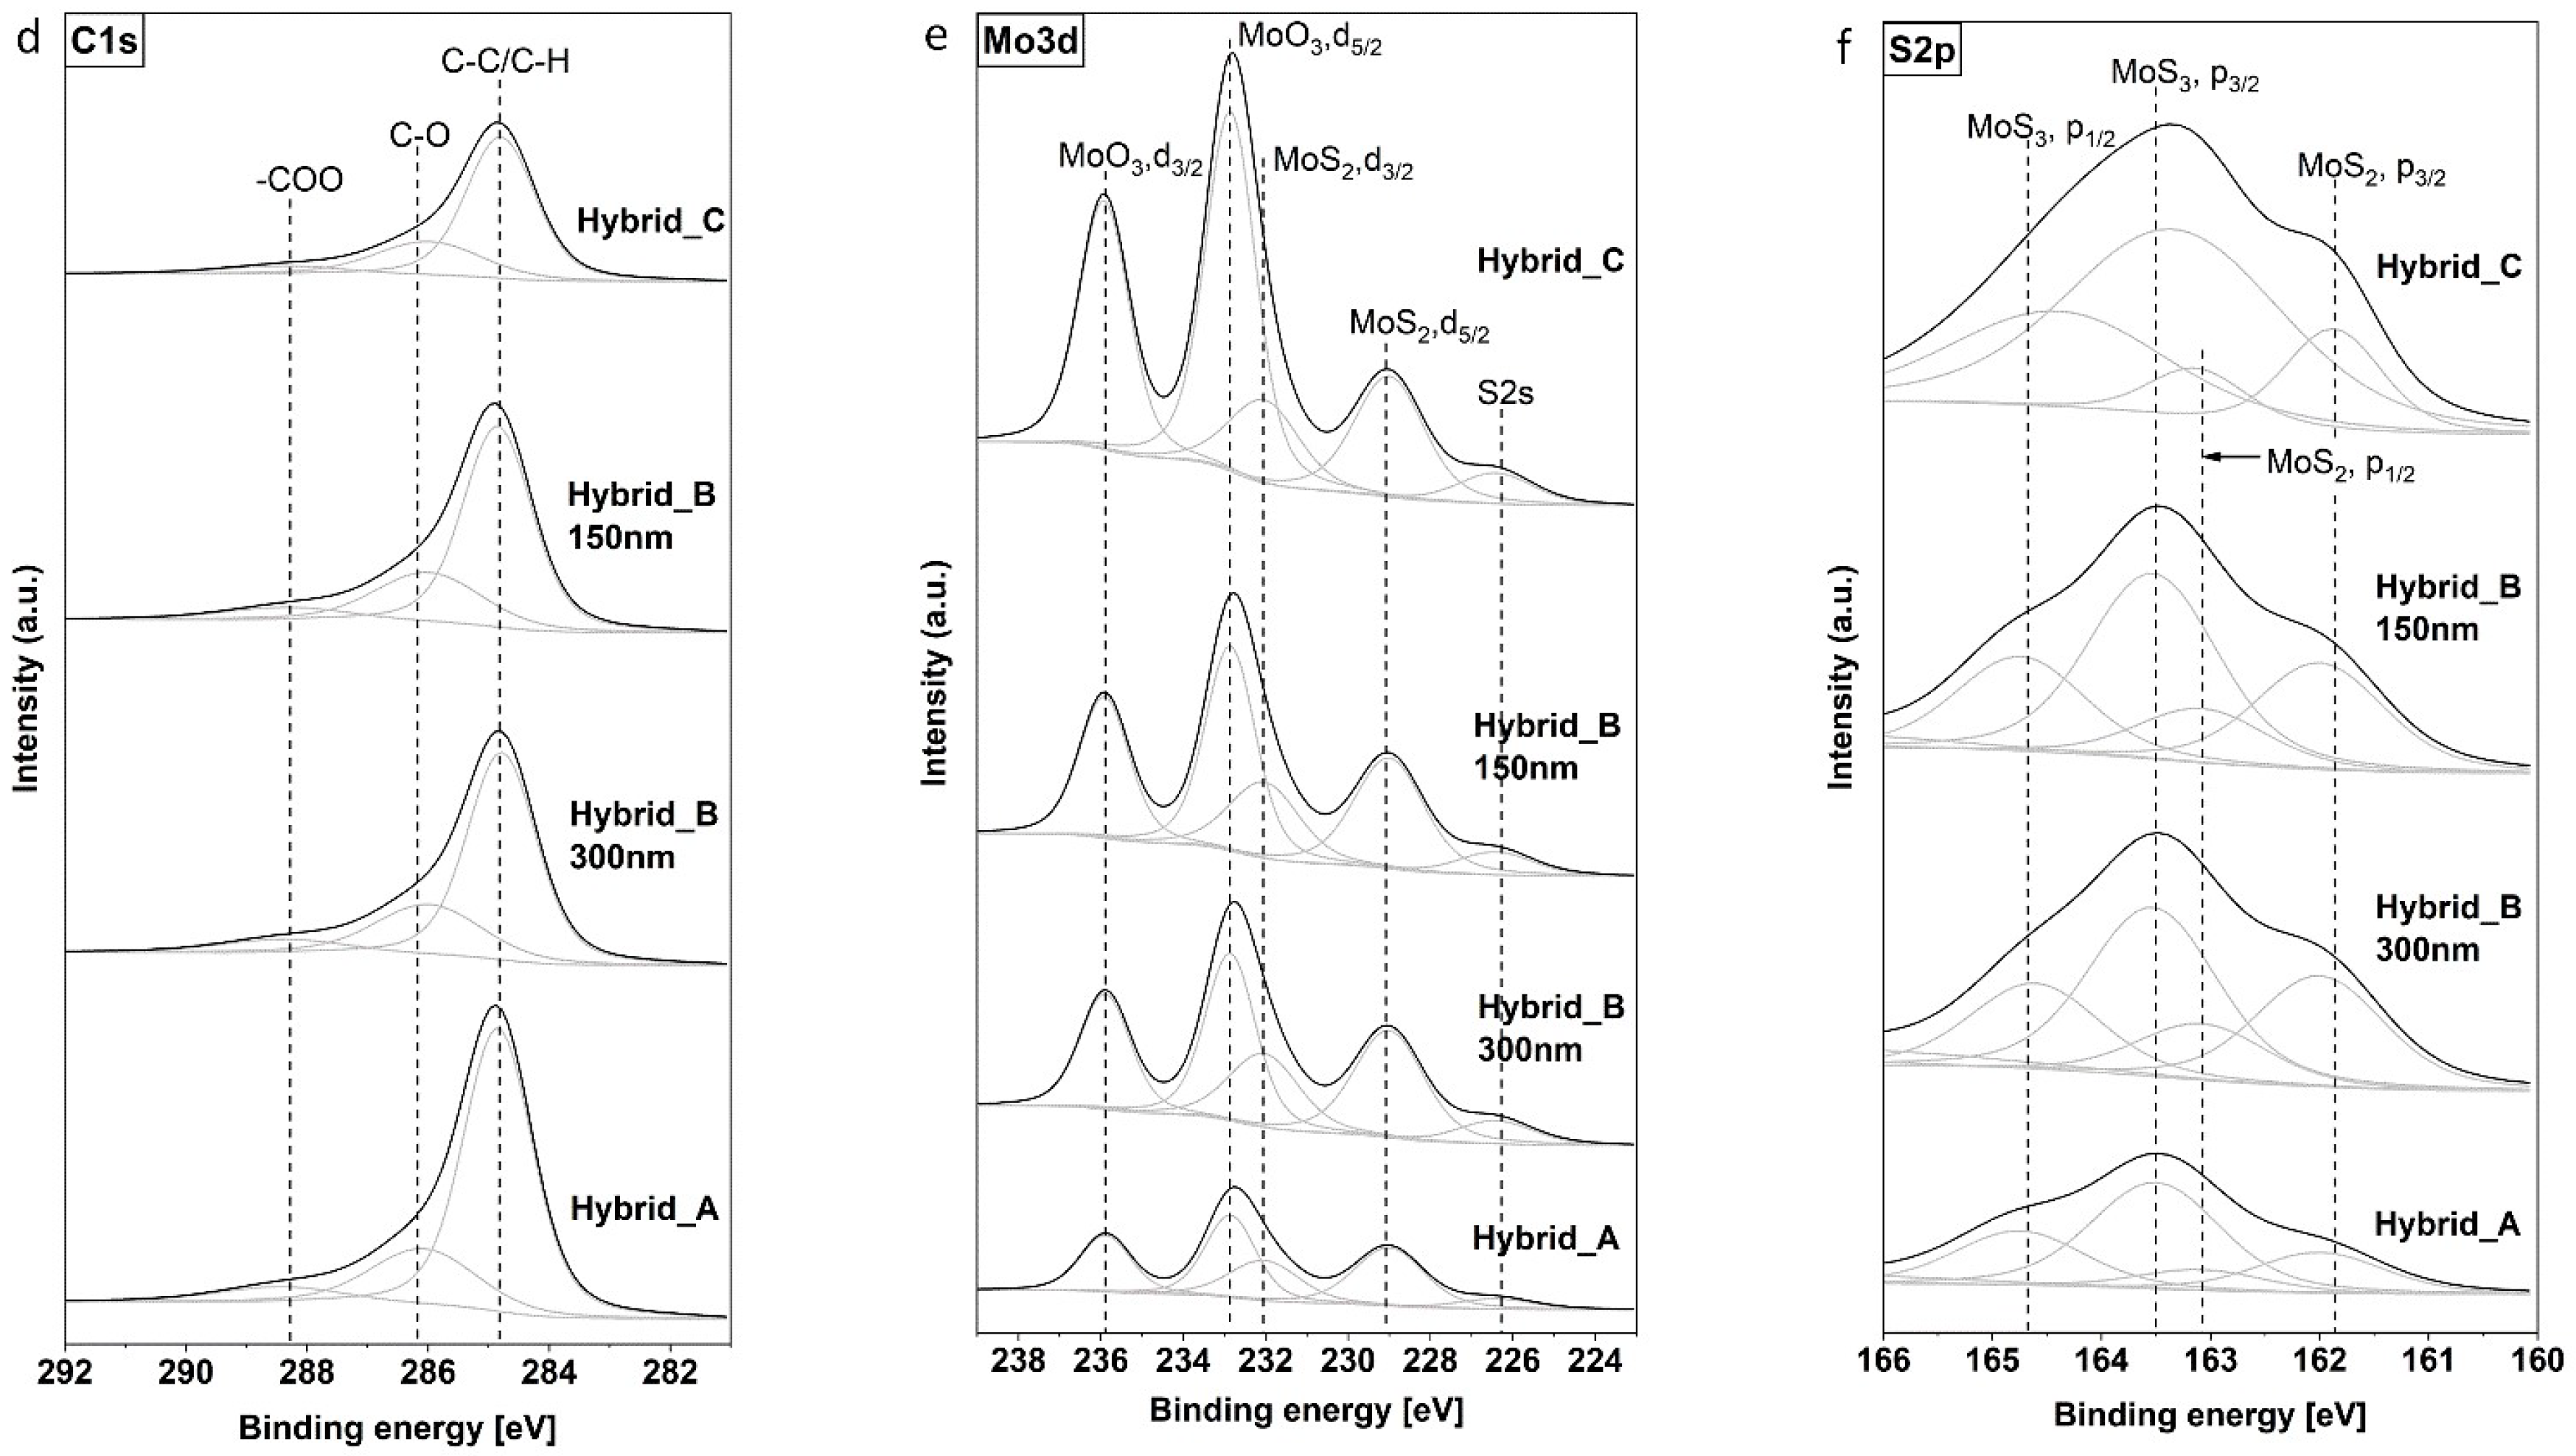
The strip-like structures on the surface, which can be observed in Figure 3a, were produced because of the compression molding process. Not only can these structures be found in HNBR, but also in FKM and NBR. Figure 3c shows one other position from the same sample as Figure 3a. Not like the rough surface in Figure 3b, flake-like structures with small debris can be observed in Figure 3d. Moreover, cracks can be observed on the surface. As reported by Takikawa and Pei, cracks are typical surface structures of DLC coated rubber [5,12,29].
Compared with the 300 nm DLC coating, the 150 nm DLC coating looks smoother on the whole. However, small particulates can be observed on the surface (Figure 3f). Figure 3g shows the microstructures of 300 nm Hybrid_A on HNBR. Scaly microstructures were observed and they look similar to the DLC coating to some degree (Figure 3b). As previously mentioned, Hybrid_A is a composite coating, which possesses the least MoS2 among the three hybrid coatings. However, a small amount of MoS2 changed the microstructures considerably. The gaps between each piece of debris are smaller and the coating is noticeably smoother. This can be attributed to the much lower hardness of MoS2 compared to DLC [15,48]. It seems that MoS2 lowered the average hardness. Therefore, the coating can be better suited to the substrates roughness.
Comparing Figure 3h,j shows that the coating roughness was influenced to some extent by the substrate properties. Moreover, under high magnification, small holes can be identified on FKM with a 300 nm Hybrid_A coating (Figure 3j). That means the coating did not totally adhere to the substrate. This can be caused by the lower wettability of FKM compared to HNBR (details in Section 3.1.5). Small holes can also be observed on MoS2 coated FKM (Figure 3k). However, the coating from MoS2 looks much finer and smoother than the hybrid coating.
Generally, the surfaces of coated NBR are smoother compared to coated HNBR. Also, it should be emphasized that almost no debris could be found on the surface after coating. Moreover, as can be observed in Figure 3o, cracks which were caused by the removal of the sample from the deposition chamber, are rather neatly arranged on the surface, either parallel or perpendicular to the original microstructure of the substrate.
For TPU samples, they do not have the strip-like, neatly arranged microstructures like other substrates (Figure 3q,s). Because of its shallower and sparser microstructures, the roughness of the TPU substrate is correspondingly lower. Like the previous comparison, MoS2 coated TPU is also finer and smoother than the DLC coated TPU (Figure 3s).
From the above comparisons, several influence factors that contribute to the coating microstructures were found and discussed. Firstly, the substrate topography is one of the most important influence factors for the coating microstructure. That is because of the smaller thickness (150–300 nm) compared to the roughness of the substrate (Table 5). Secondly, the composition of the coating plays an important role as well. Generally, on DLC or DLC-included coating small debris can be observed. In comparison with DLC, the MoS2 coating is finer and smoother. Thirdly, the coating microstructures can be influenced by the material properties of the substrates in several ways. Coatings on a substrate like FKM, which has a lower wettability, show a higher possibility that the coating becomes porous and loose. Thermal properties (e.g., thermal expansion coefficient and thermal conductivity), are also influence factors. As shown in Table 6, FKM expands the most among the four materials, when the temperature increases by a given degree. This can lead to the scaly coating, which can be observed in Figure 3i,k.
However, the importance of these factors depends to a large extent on the ambient conditions of the coating process. In addition, the microstructure of the coatings is also affected by the deposition condition. For DLC coating, a-c: H was produced by using a plasma of Ar and C2H2, while for other coatings, only Ar was used. Generally, the coatings prepared with C2H2 look smoother than those without C2H2. This is in good agreement with the results in [7].
3.1.4. Surface Roughness
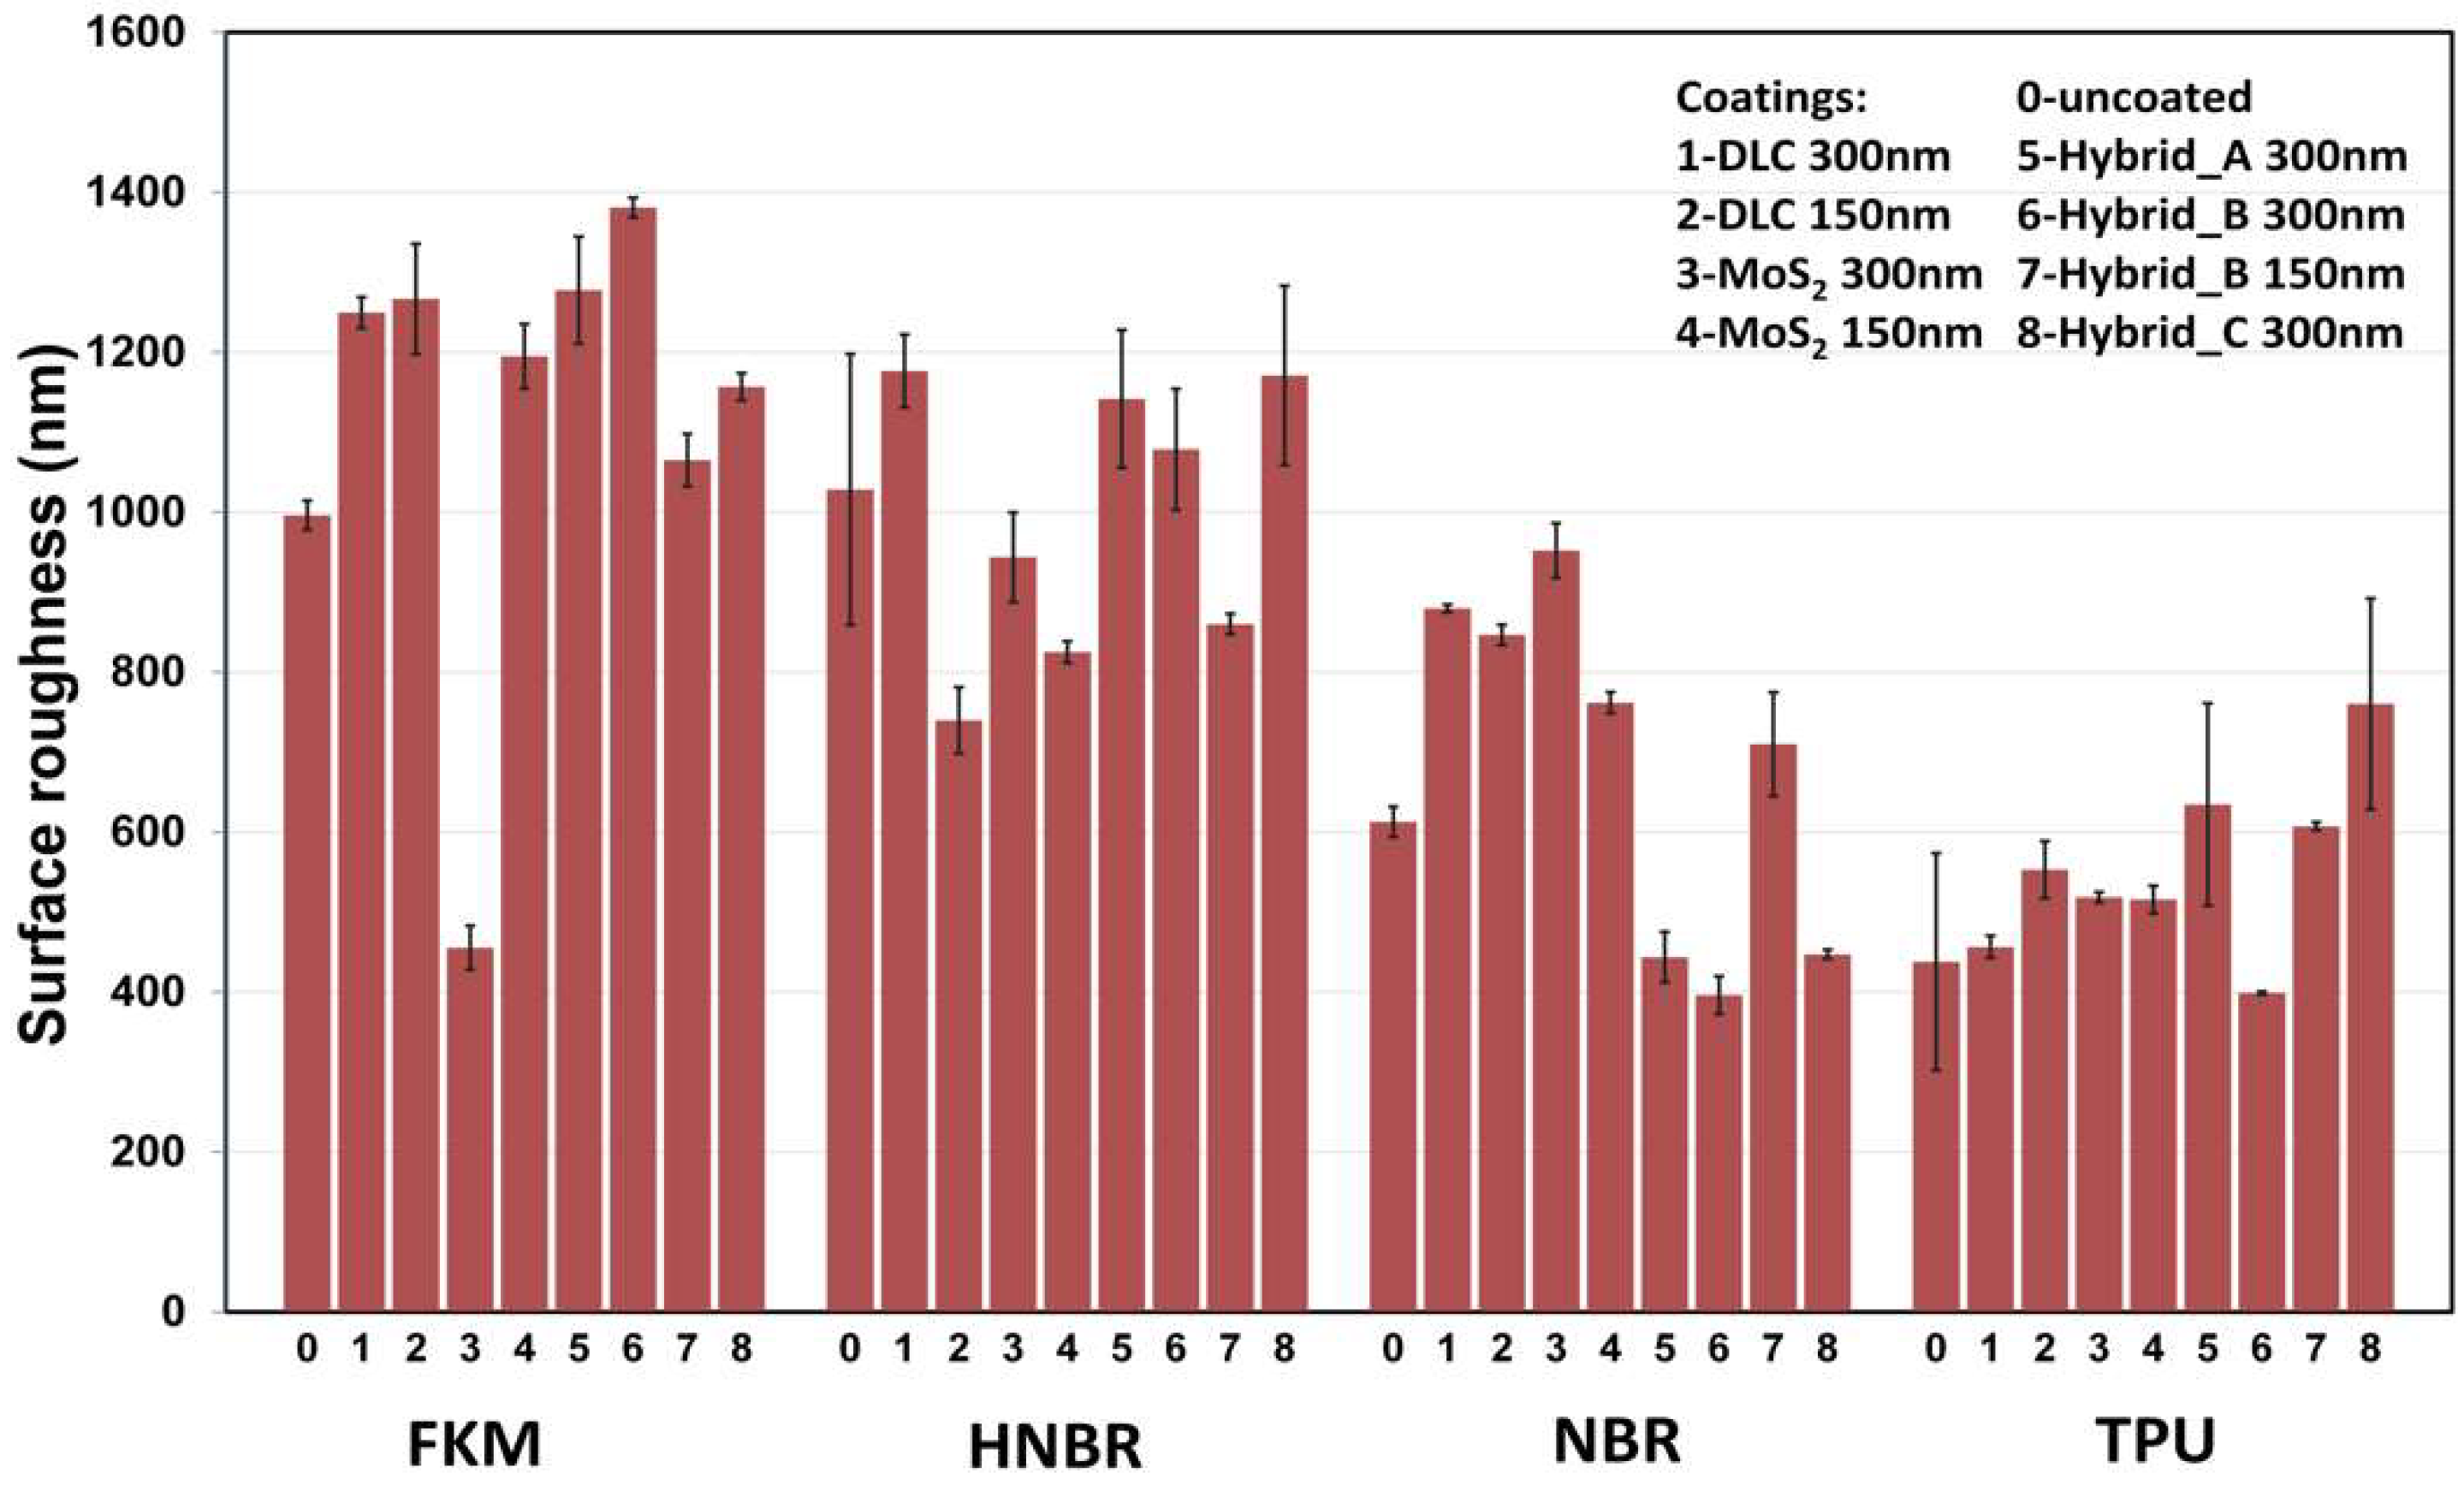
The surface roughness of the coated samples was affected by the substrate surface and also the microstructures of coatings, which can be changed by removing the samples from the deposition chamber (Figure 3o). In addition, the surface microstructure can also affect the adherence of the coating [49]. Generally, a rougher surface can have a better adhesion with coating because more bonding connections can be created. However, the scale of dimensions of the surface microstructures must be less than the film thickness [50]. As can be seen from Figure 4, uncoated substrates have different degrees of roughness. FKM and HNBR possess a similar roughness (Ra ≈ 1.0 µm), while TPU and NBR have an appreciably lower roughness value. As mentioned previously, two different molding dies were used to produce samples, one for FKM, NBR, and HNBR, the other one for TPU. Moreover, the surface microstructure can be affected by additives, which could come up on the surface.
As can be seen from Figure 3a,e, the HNBR with 150 nm DLC is smoother than that with 300 nm DLC. However, for the other three materials with DLC coating, the thickness does not play an important role in the surface roughness. Compared to the uncoated FKM, the roughness of 300 nm MoS2 coated FKM was reduced drastically, whereas the roughness of DLC-containing coatings on FKM was increased to varying degrees. This could be attributed to the larger difference between DLC and substrates in hardness and brittleness [48]. The DLC coatings with a very low thickness could be broken into fractures easily, when the coated samples are removed from the deposition chamber with a small deformation. However, this phenomenon was not found on other materials. For hard material TPU, no obvious differences could be identified in roughness. On the one hand, due to its different processing, its surface is smoother than other materials. On the other hand, higher hardness prevents its deformation by removal.
3.1.5. Surface Energy
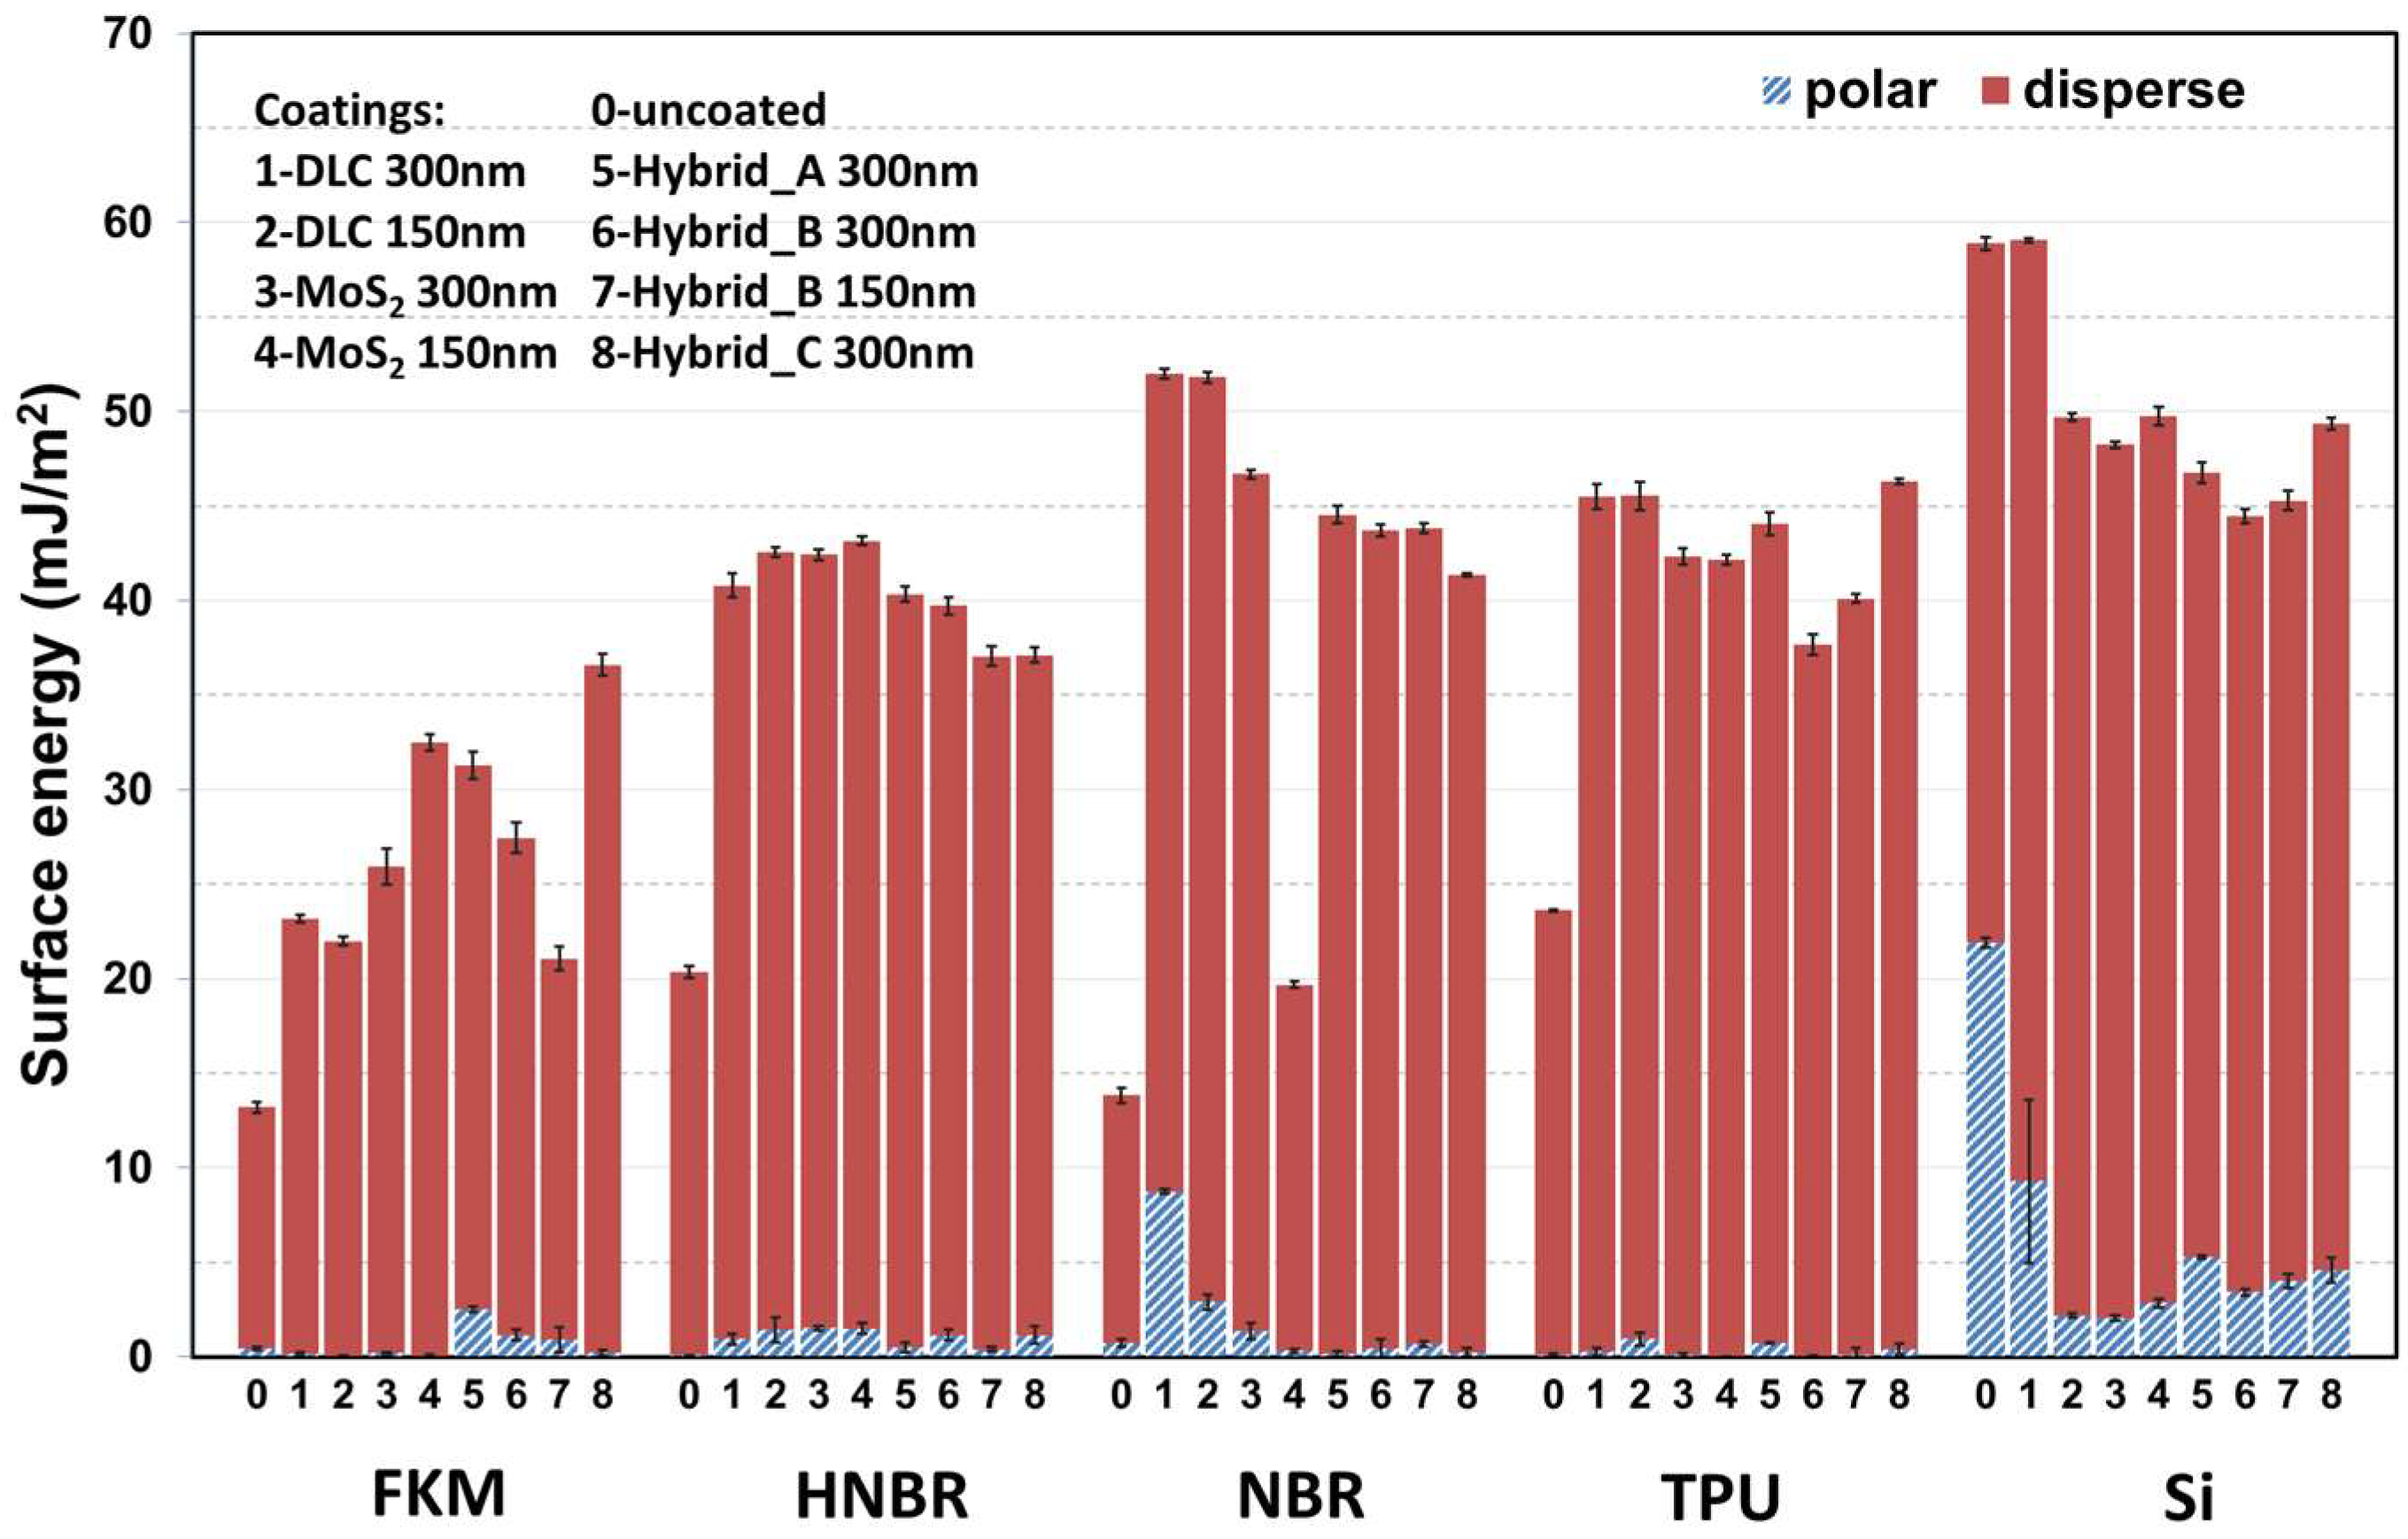
One of the conditions for good wetting is that the surface tension of the substrate is higher than that of the still liquid coating material [51]. To eliminate the influences of substrates, coatings were also deposited on silicon. As shown in Figure 5, uncoated Si and coated Si possess higher surface energies than the other four substrates. Surface roughness plays an important role for the surface energy [52]. For four elastomeric substrates, surface energies were increased to varying degrees after coating. On the one hand, through comparison of the microstructures before and after deposition, it can be found that it changed significantly. Although the mean roughness (Ra) of the substrates had not been changed in a very large way, the microstructures were totally modified after the coating process. This leads to a modification of the surface energy. On the other hand, from the perspective of the material, the surface energy of elastomer substrates [53], DLC and MoS2 are also different. These two factors together affect the difference of the surface energy after coating.
Compared with an uncoated elastomer, silicon shows a much higher surface energy in both polar and dispersed parts. After coating silicon shows a similar surface energy to the elastomers. Generally, FKM has almost the lowest surface energy in all coatings. Except for the influence of its chemical structure, the surface microstructure of uncoated FKM is different from HNBR and NBR. Comparing to HNBR, which has a similar mean roughness (Ra), FKM is much rougher and dense particles can be seen on the surface [24]. The film thickness has only a limited effect on surface energy.
3.2. Tribological Tests
In order to study the potential of DLC/MoS2 coatings on elastomers for tribological applications, the coatings were firstly tested in the model test under dry and lubricated conditions, so that the coatings could be evaluated comprehensively. Subsequently, the best and worst coatings were selected and investigated under starved lubrication condition in component-like tests.
3.2.1. Coefficient of Friction
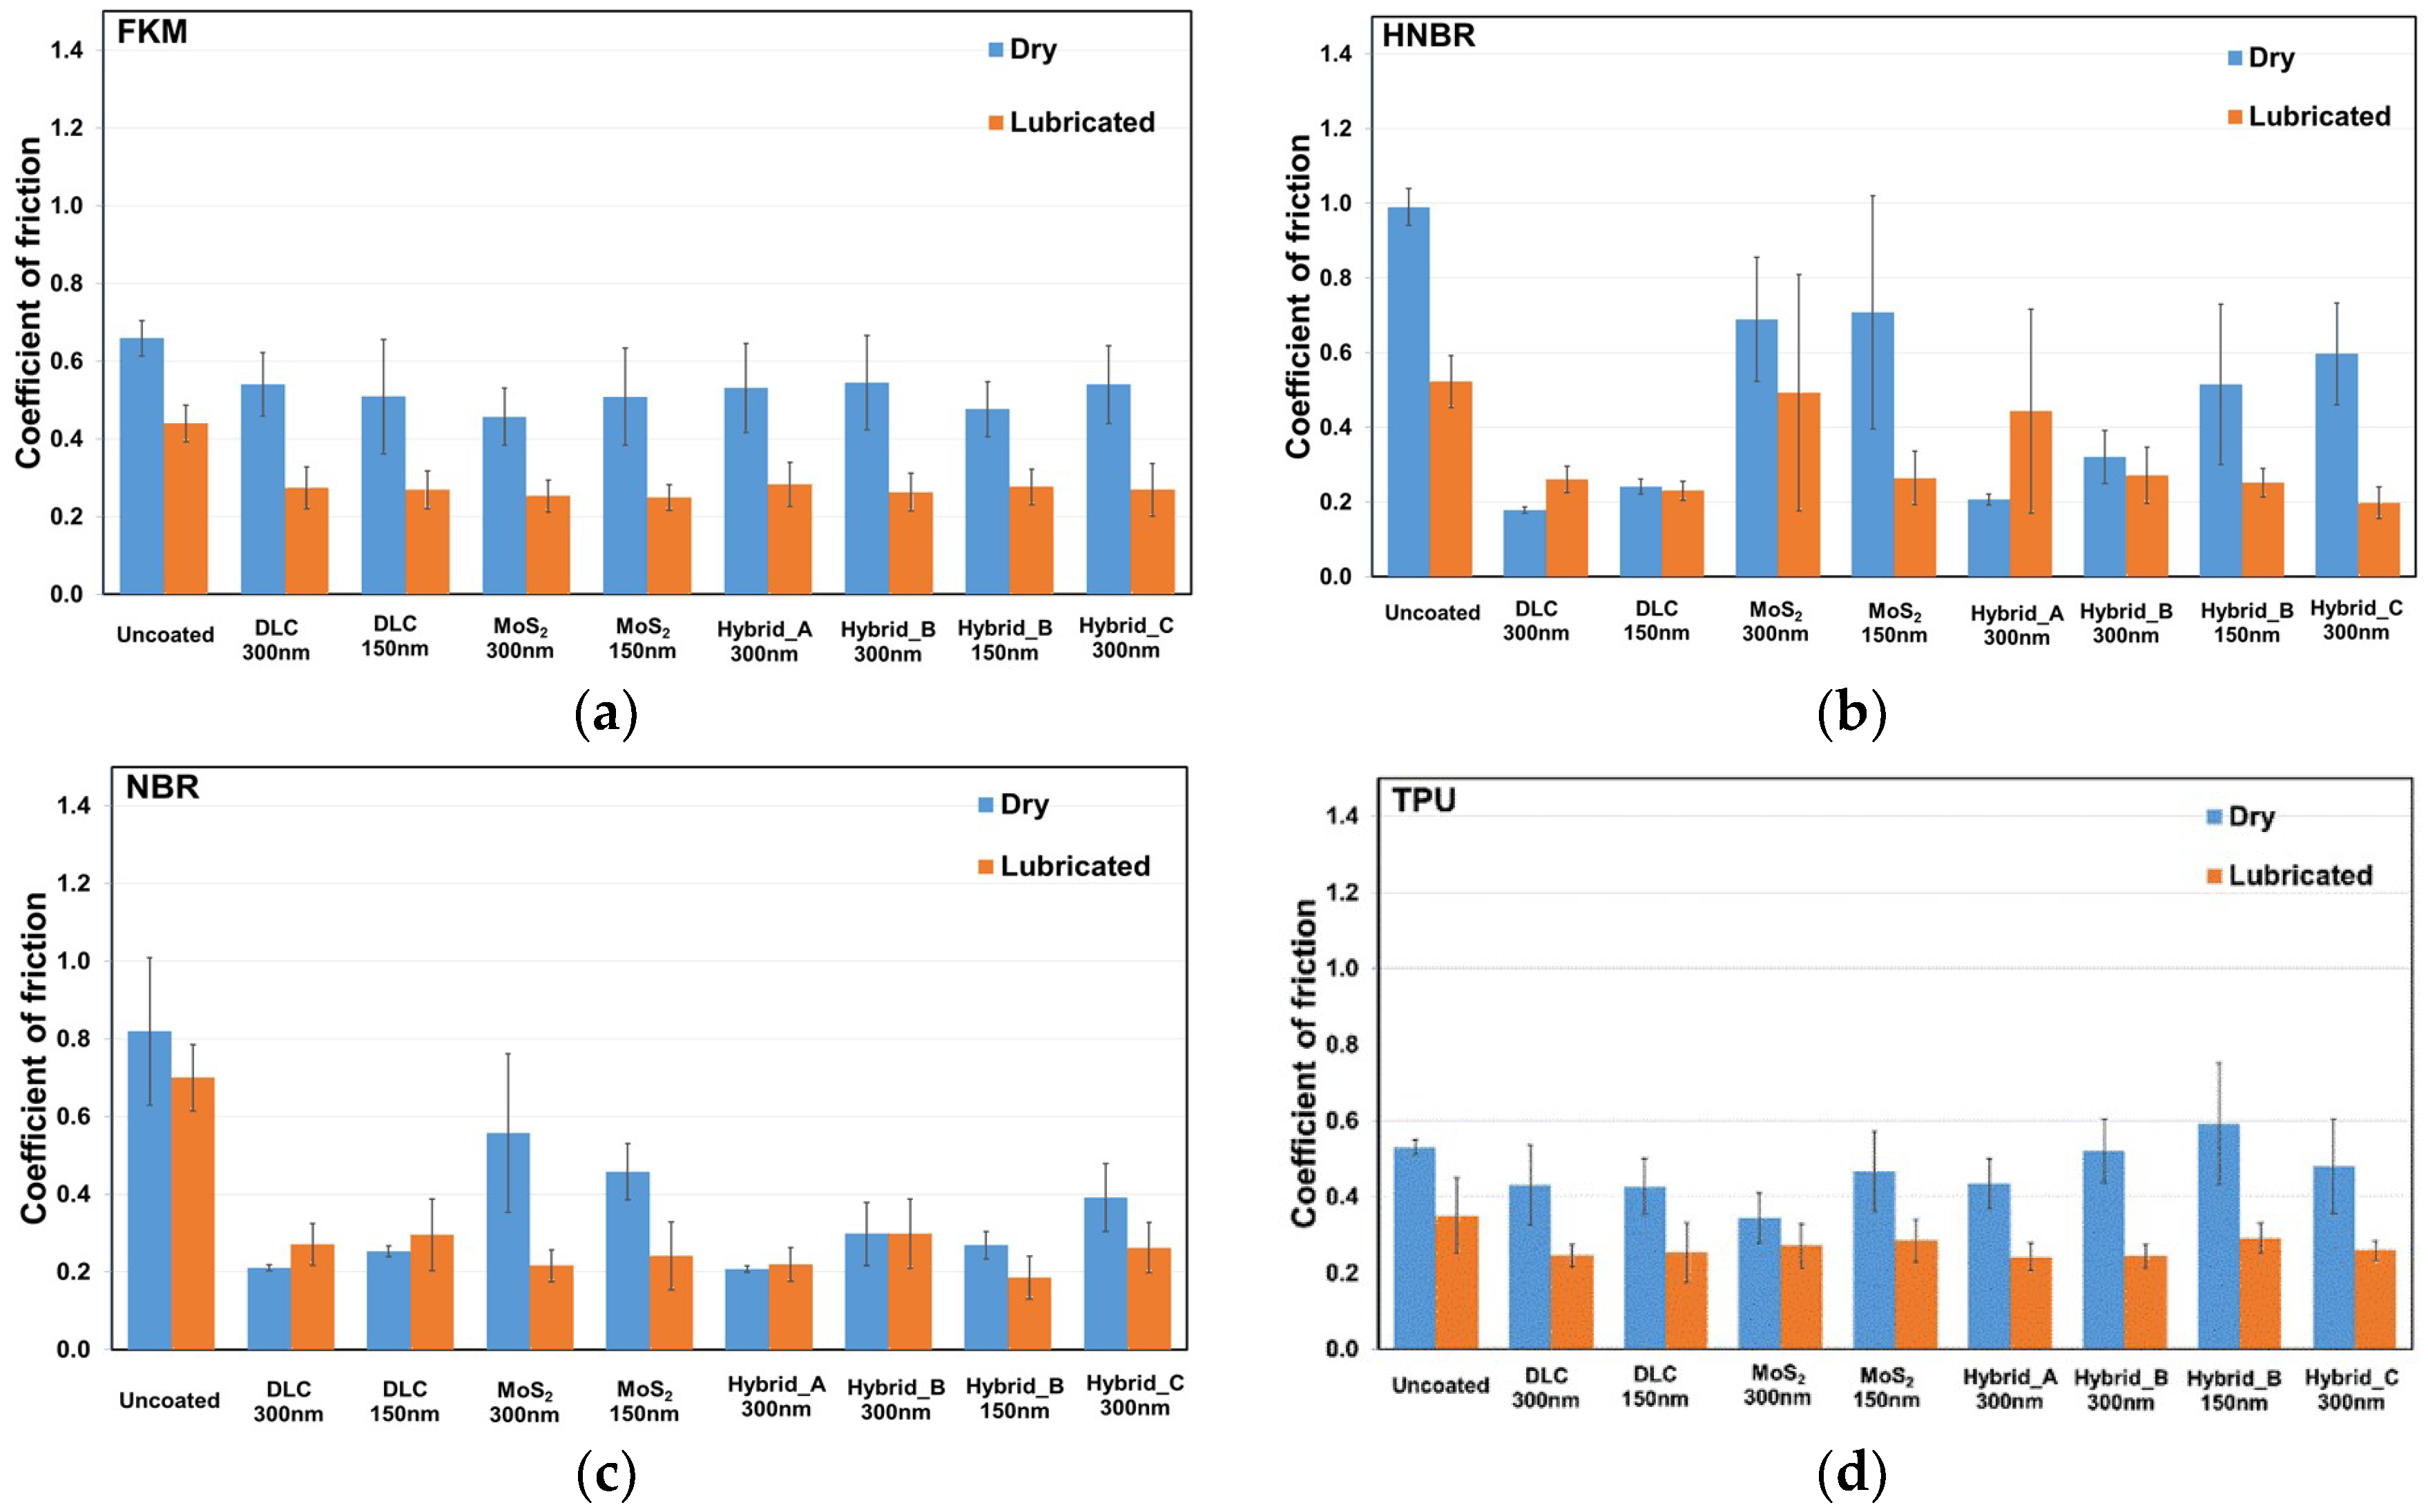
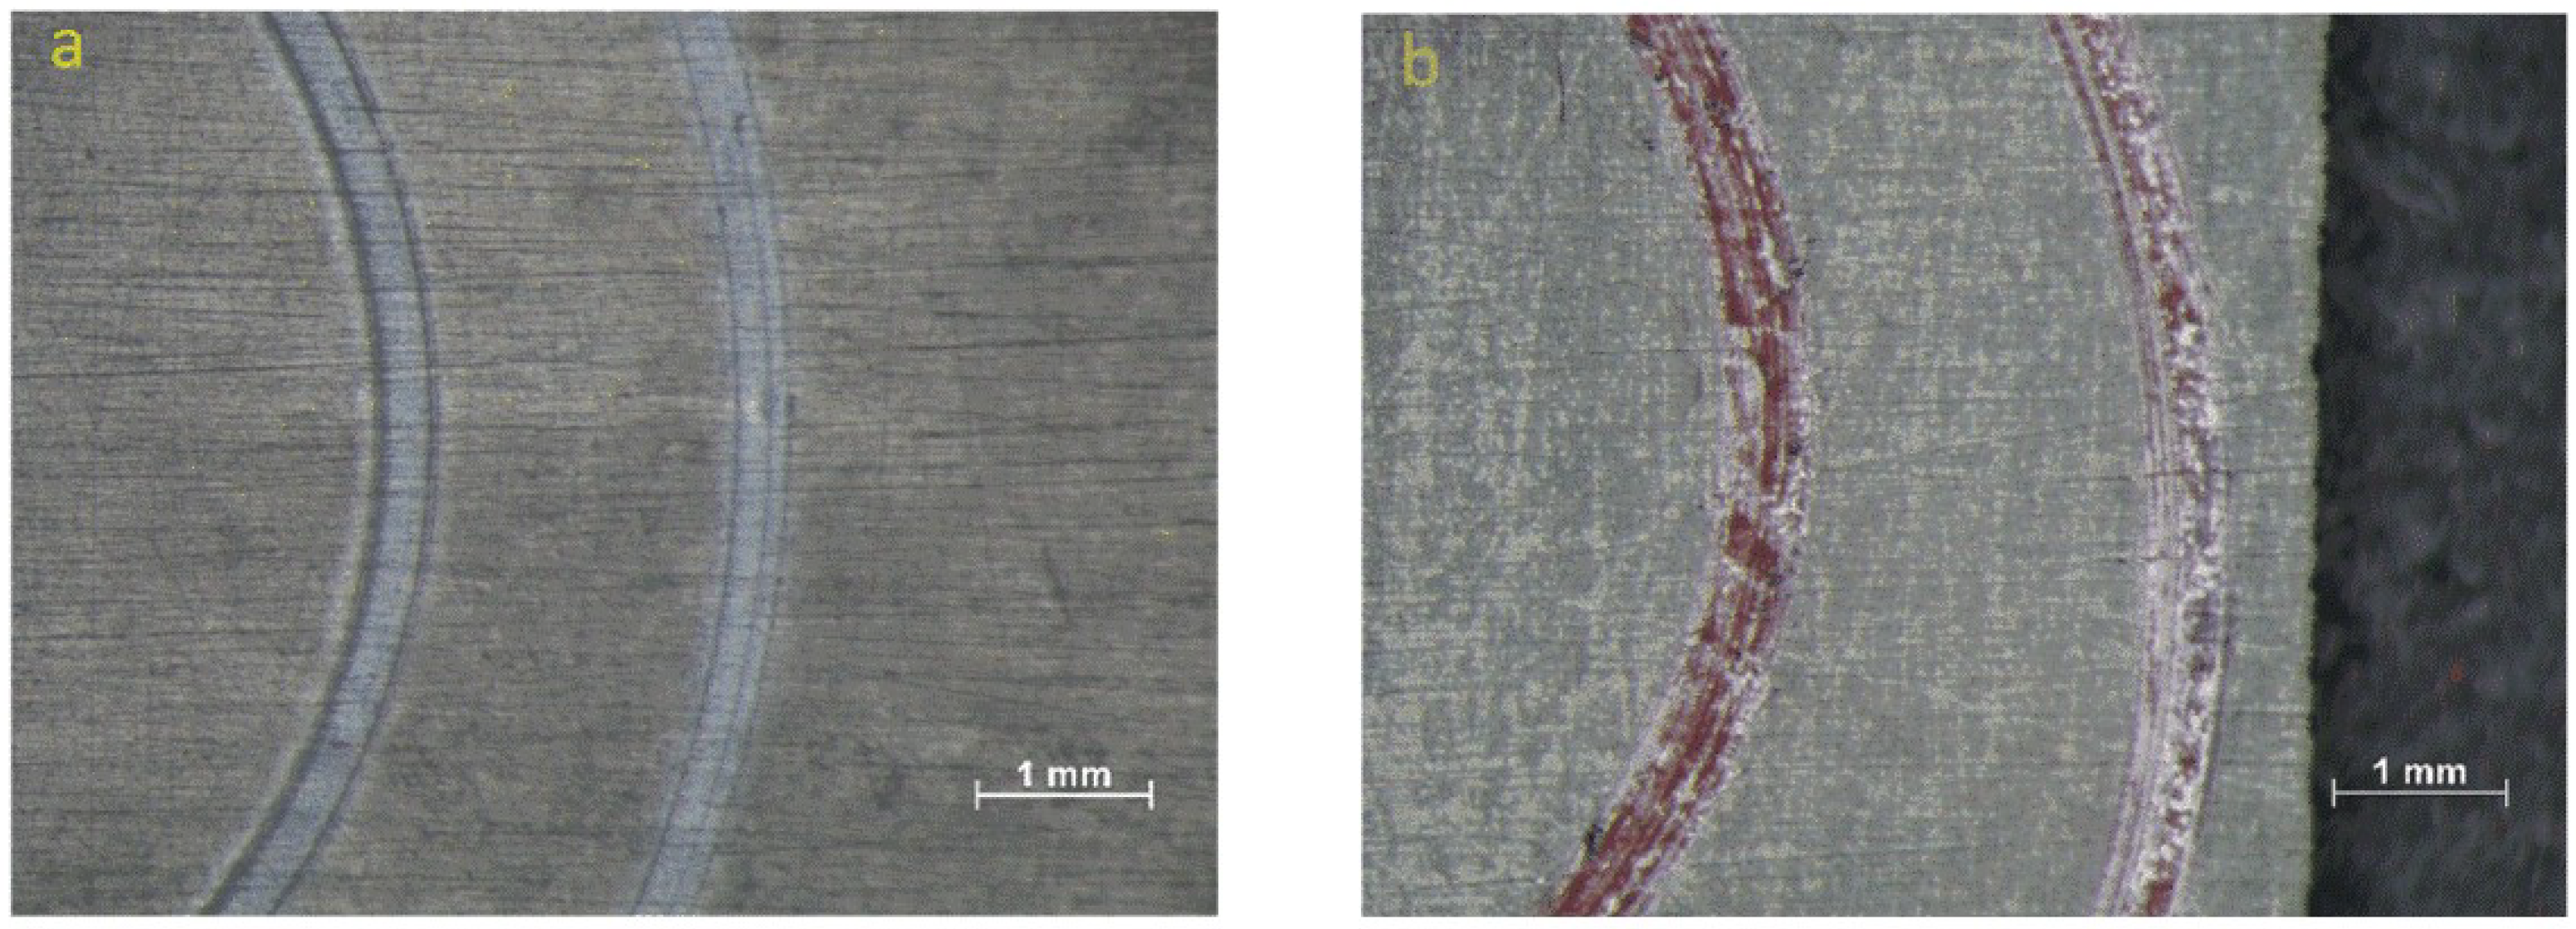
The coefficients of friction (COF) for uncoated and coated elastomers in dry and lubricated ball on disc sliding tests are shown in Figure 6. Under dry sliding ambient conditions, almost all of the coatings bring an advantage to the tribological properties. In particular for HNBR, with 300 nm DLC coating, the COF was reduced from 0.99 to 0.18 by 82%. For NBR the frictional reduction, which the 300 nm DLC or Hybrid_A coating brought, was also significant; approximately 74%. For FKM and TPU, the decrease was not so appreciable. What was interesting was that for TPU the COF was slightly brought down by 300 nm Hybrid_B coating. The values of these measurements are in good agreement with the values reported in the literature [3,12,54]. However, when the thickness of the coating was reduced to 150 nm, the COF increased by 11%, compared to the uncoated TPU. This can be explained by microscopic analysis. As can be observed in Figure 7, the 150 nm coating was already severely damaged (Figure 7b) and the elastomeric substrate had direct contact with the counterpart during the test, while the thick variant was still intact (Figure 7a). That means for this coating, the thickness plays an essential role with respect to the tribological properties. However, the thickness cannot bring a significant difference in every case. That depends on several factors, for example, the hardness of the substrate, the coating material, and the adherence of coating material on the counterpart, the microstructures of the surface, the adherence between coating and substrate, lubrication conditions and so on. Adhesion and deformation are the two most important mechanisms that are responsible for the frictional behaviors of elastomers [55,56]. The high friction of uncoated HNBR and NBR under dry conditions show that not only deformation, which can be related to the relatively low hardness, but also adhesion, which can be seen as a dissipative stick-slip process on molecular level, are influential factors for the dry frictional behaviors [57,58,59,60]. This is in good agreement with Rabinowicz’s studies, which indicated that low ratios of surface energy/hardness are associated with better surface interactions and also less adhesion [61,62]. Moreover, because of the high friction more dynamic energy would be expected to be transformed into heat, which could lead to an increase of temperature. Based on this conjecture the material’s hardness will reduce with a higher temperature so that it could experience a higher wear rate [63].
Under lubricated conditions, the differences of COF among various coatings were not as evident as in dry tests. The lubricant has no significant impact on the COF. One reason for this is that lubricants facilitate the stick-slip process on the molecular level to some extent. Therefore, the adhesion part for friction can be decreased [64]. As to the deformation part, it was assumed to stay on a similar level as under dry conditions in two aspects. One aspect is that the lubricant film is very thin on the contact area hence the stiffness of the film is negligible. The other aspect is that the COF of various coatings is similar.
It should be noted that in some cases the lubricant even brought a slight, negative impact on the tribological properties for DLC coated HNBR and NBR. This can be explained with two main reasons. One important aspect is that because of the high viscosity of the grease used, more energy would be needed to overcome the fluid friction [64,65]. The COF under dry conditions was extremely low. In this case, the benefit of the lubricant was less than its disadvantage. That means more energy was needed to overcome the resistance, which was brought by the lubricant.
Based on the results of the ball on disc tests under dry and lubricated conditions, the best coatings were chosen and verified in the component-like test (ring on disc). For FKM with Hybrid_A coating, its dry COF is slightly lower (2.5%) than Hybrid_B 300 nm. However, its lubricated COF is about 13% higher than Hybrid_B 300 nm. For HNBR with Hybrid_A coating, it is clear that MoS2 brings a negative effect for the tribological performance. In the dry tests, the coatings with pure MoS2 or high content of MoS2 (Hybrid_B and Hybrid_C) were broken after the tests. Therefore, these coatings were not taken into consideration for the selection. In addition, as references, uncoated substrate and the worst coatings were also tested. The best and worst coatings are presented in Table 7. As can be seen from this table, the soft coating MoS2 provides the best tribological properties for the softest material FKM, whereas the hard coating DLC is the best choice for the hardest material HNBR, only among FKM, NBR, and HNBR. For NBR, which has a middle hardness, a hybrid coating is better than other coatings. Because of its totally different surface structures, TPU was not comparable with the other elastomers.
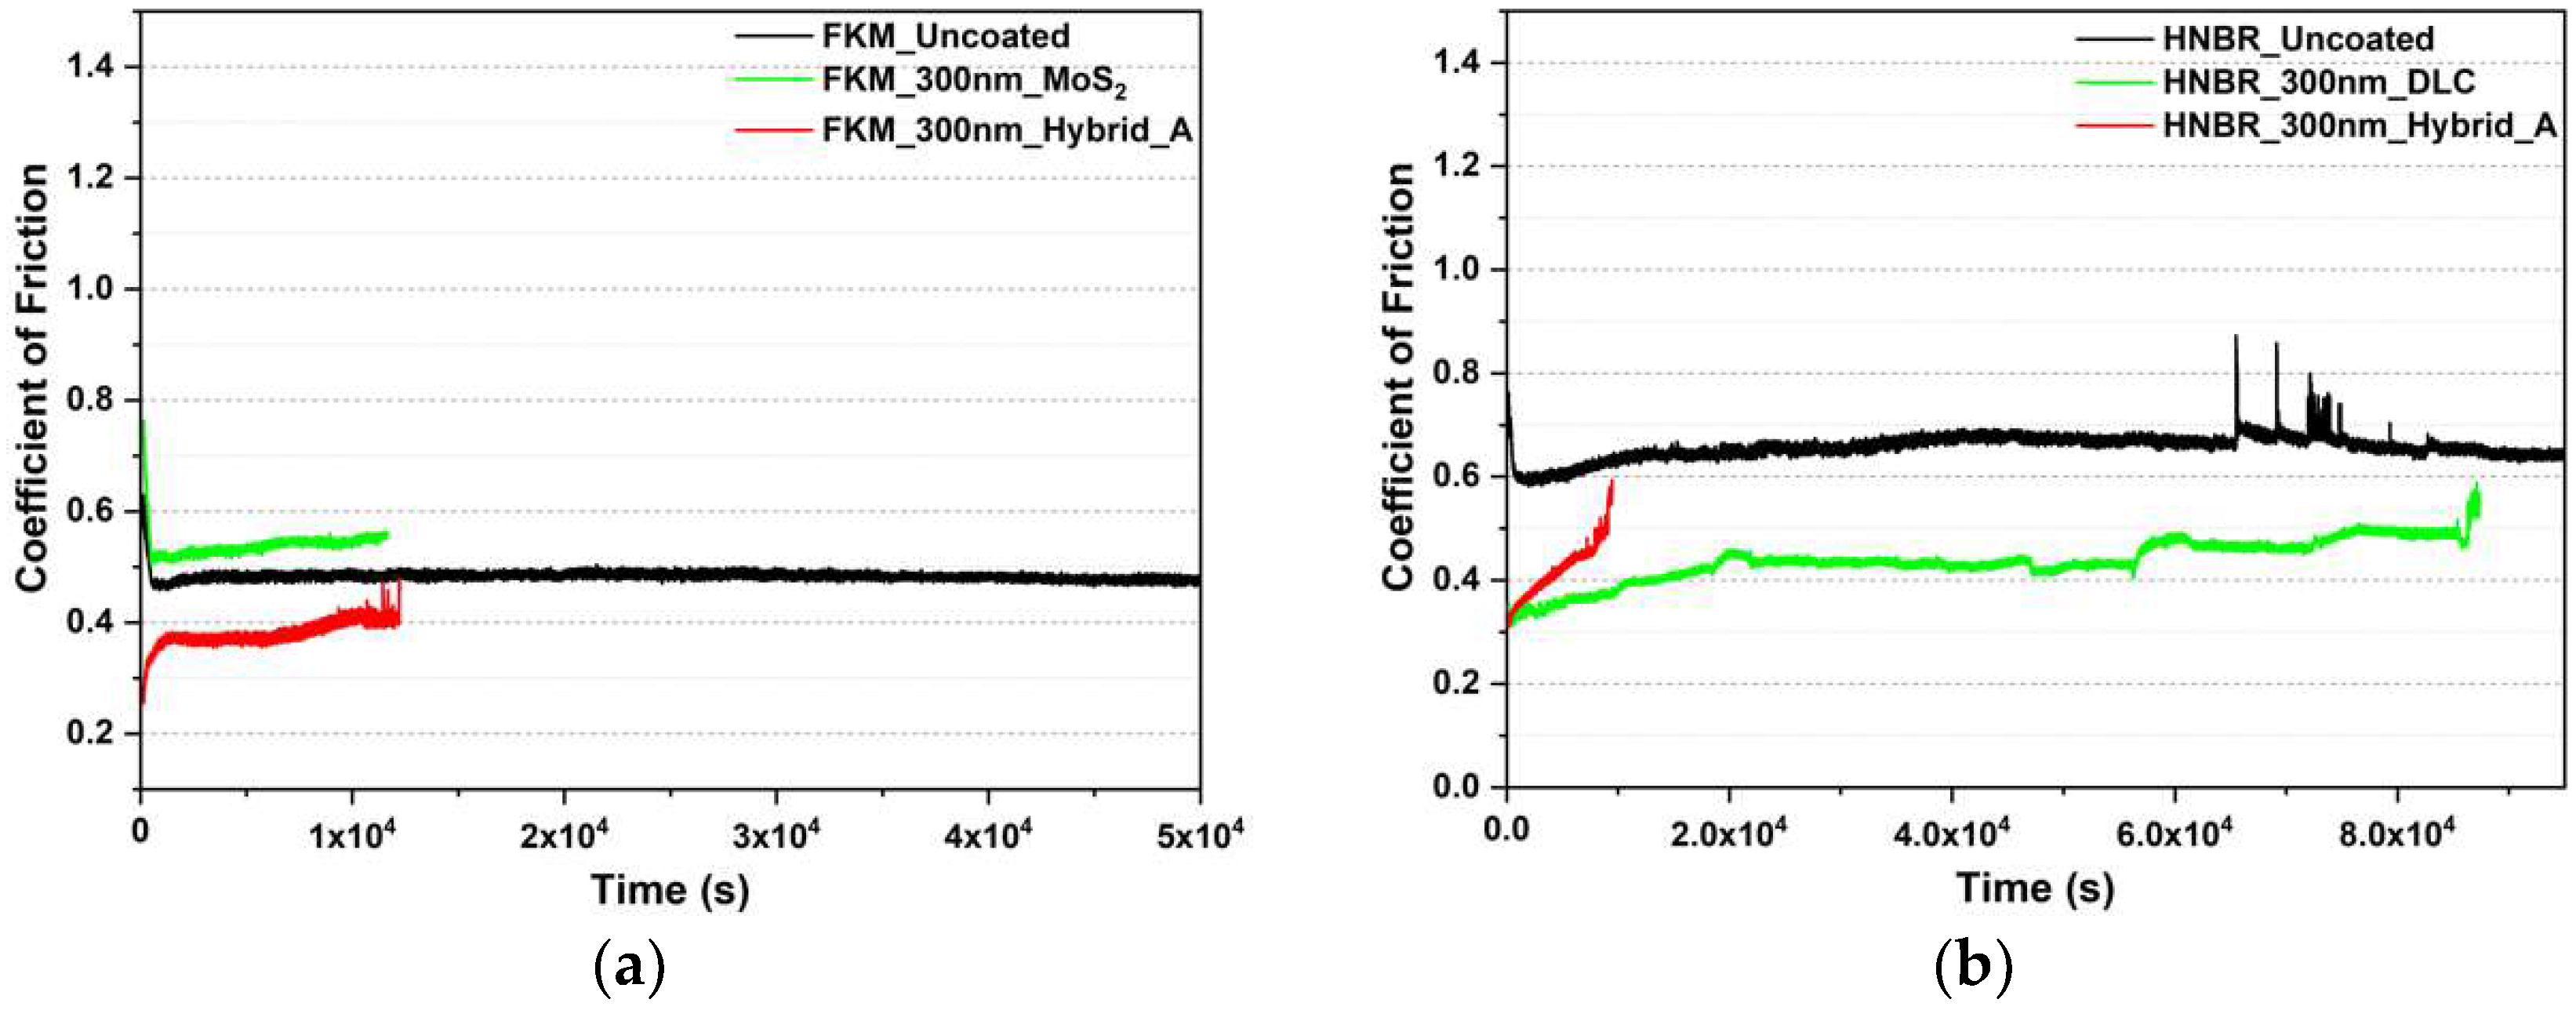
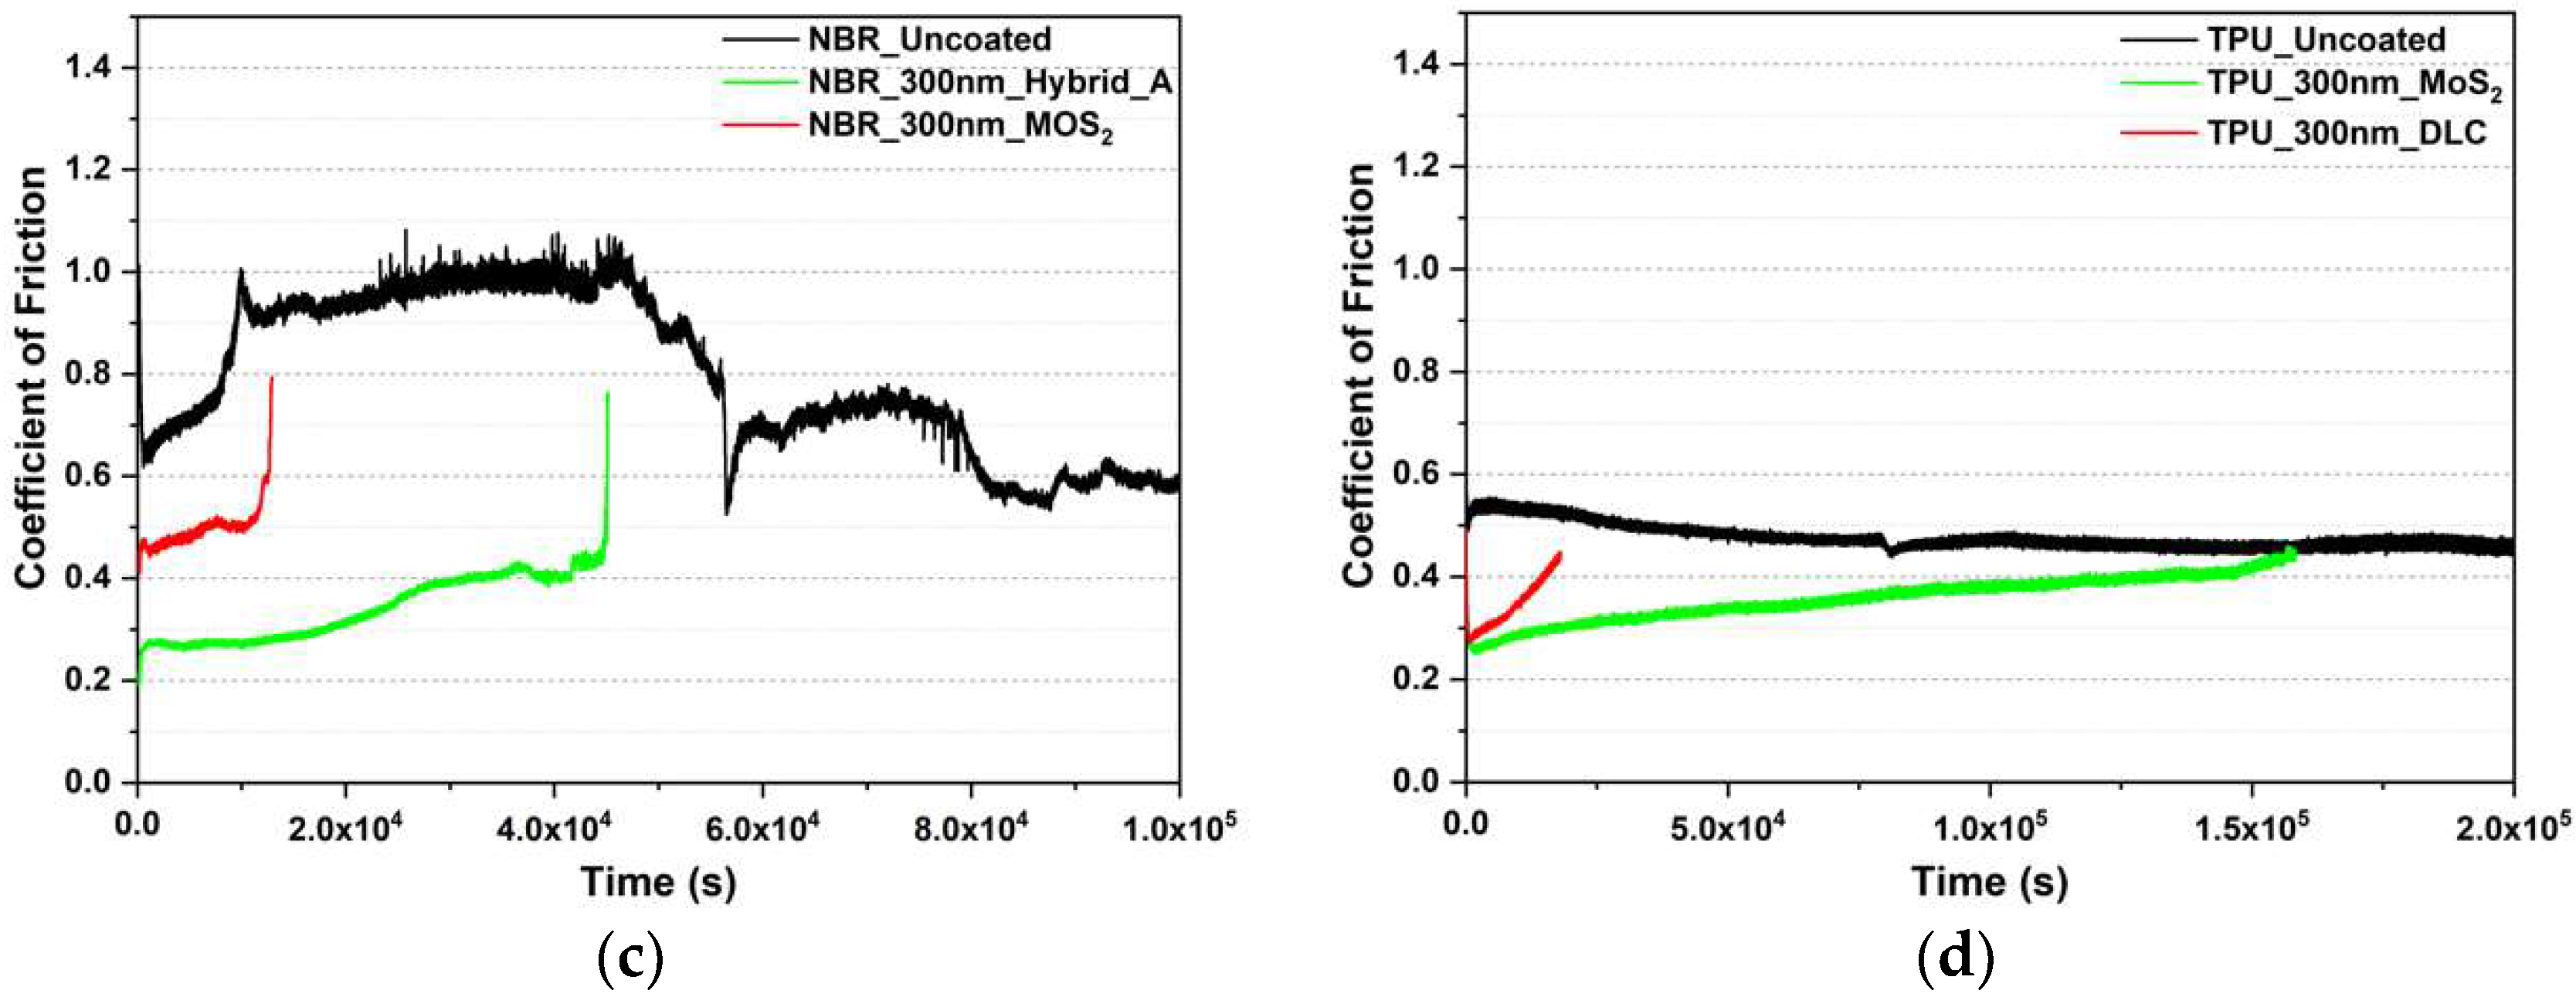
For the ring on disc tests an abort condition was set up so that when the coating was worn or damaged, the test would be stopped immediately. As abort condition, an average COF of the uncoated substrate under stable running conditions was employed. As shown in Figure 8, at the beginning of the tests, for HNBR and TPU the COF of the best and worst coatings were almost at the same level. However, the COF of the uncoated substrate kept at a constant level after the running-in phase with a higher value, while the COF of the worst coating started to increase gradually. After just several hours, the friction was raised to the same level as the uncoated substrate. Compared to the worst coating, the best variant lasted significantly longer until the COF reached the abort condition. This means that the coating failed with increasing test time. Therefore, for HNBR, NBR, and TPU the trends of validation show a good correspondence with the results from the ball on disc tests. However, for FKM with the best coating, after the loading phase, its COF was already slightly over the abort condition, which represents the COF of uncoated FKM. It was found that the coating was already damaged. This implies that the combination of soft coatings like MoS2 and soft substrate like FKM is inappropriate for this line contact. Because of its low hardness, FKM showed a strong local deformation under line contact. According to Archard’s wear law for adhesive wear [66], wear volume is inversely proportional to the hardness of a substrate. By this situation, in which the contact area is relatively small, the soft coating on a soft substrate could be worn quickly.
3.2.2. Wear
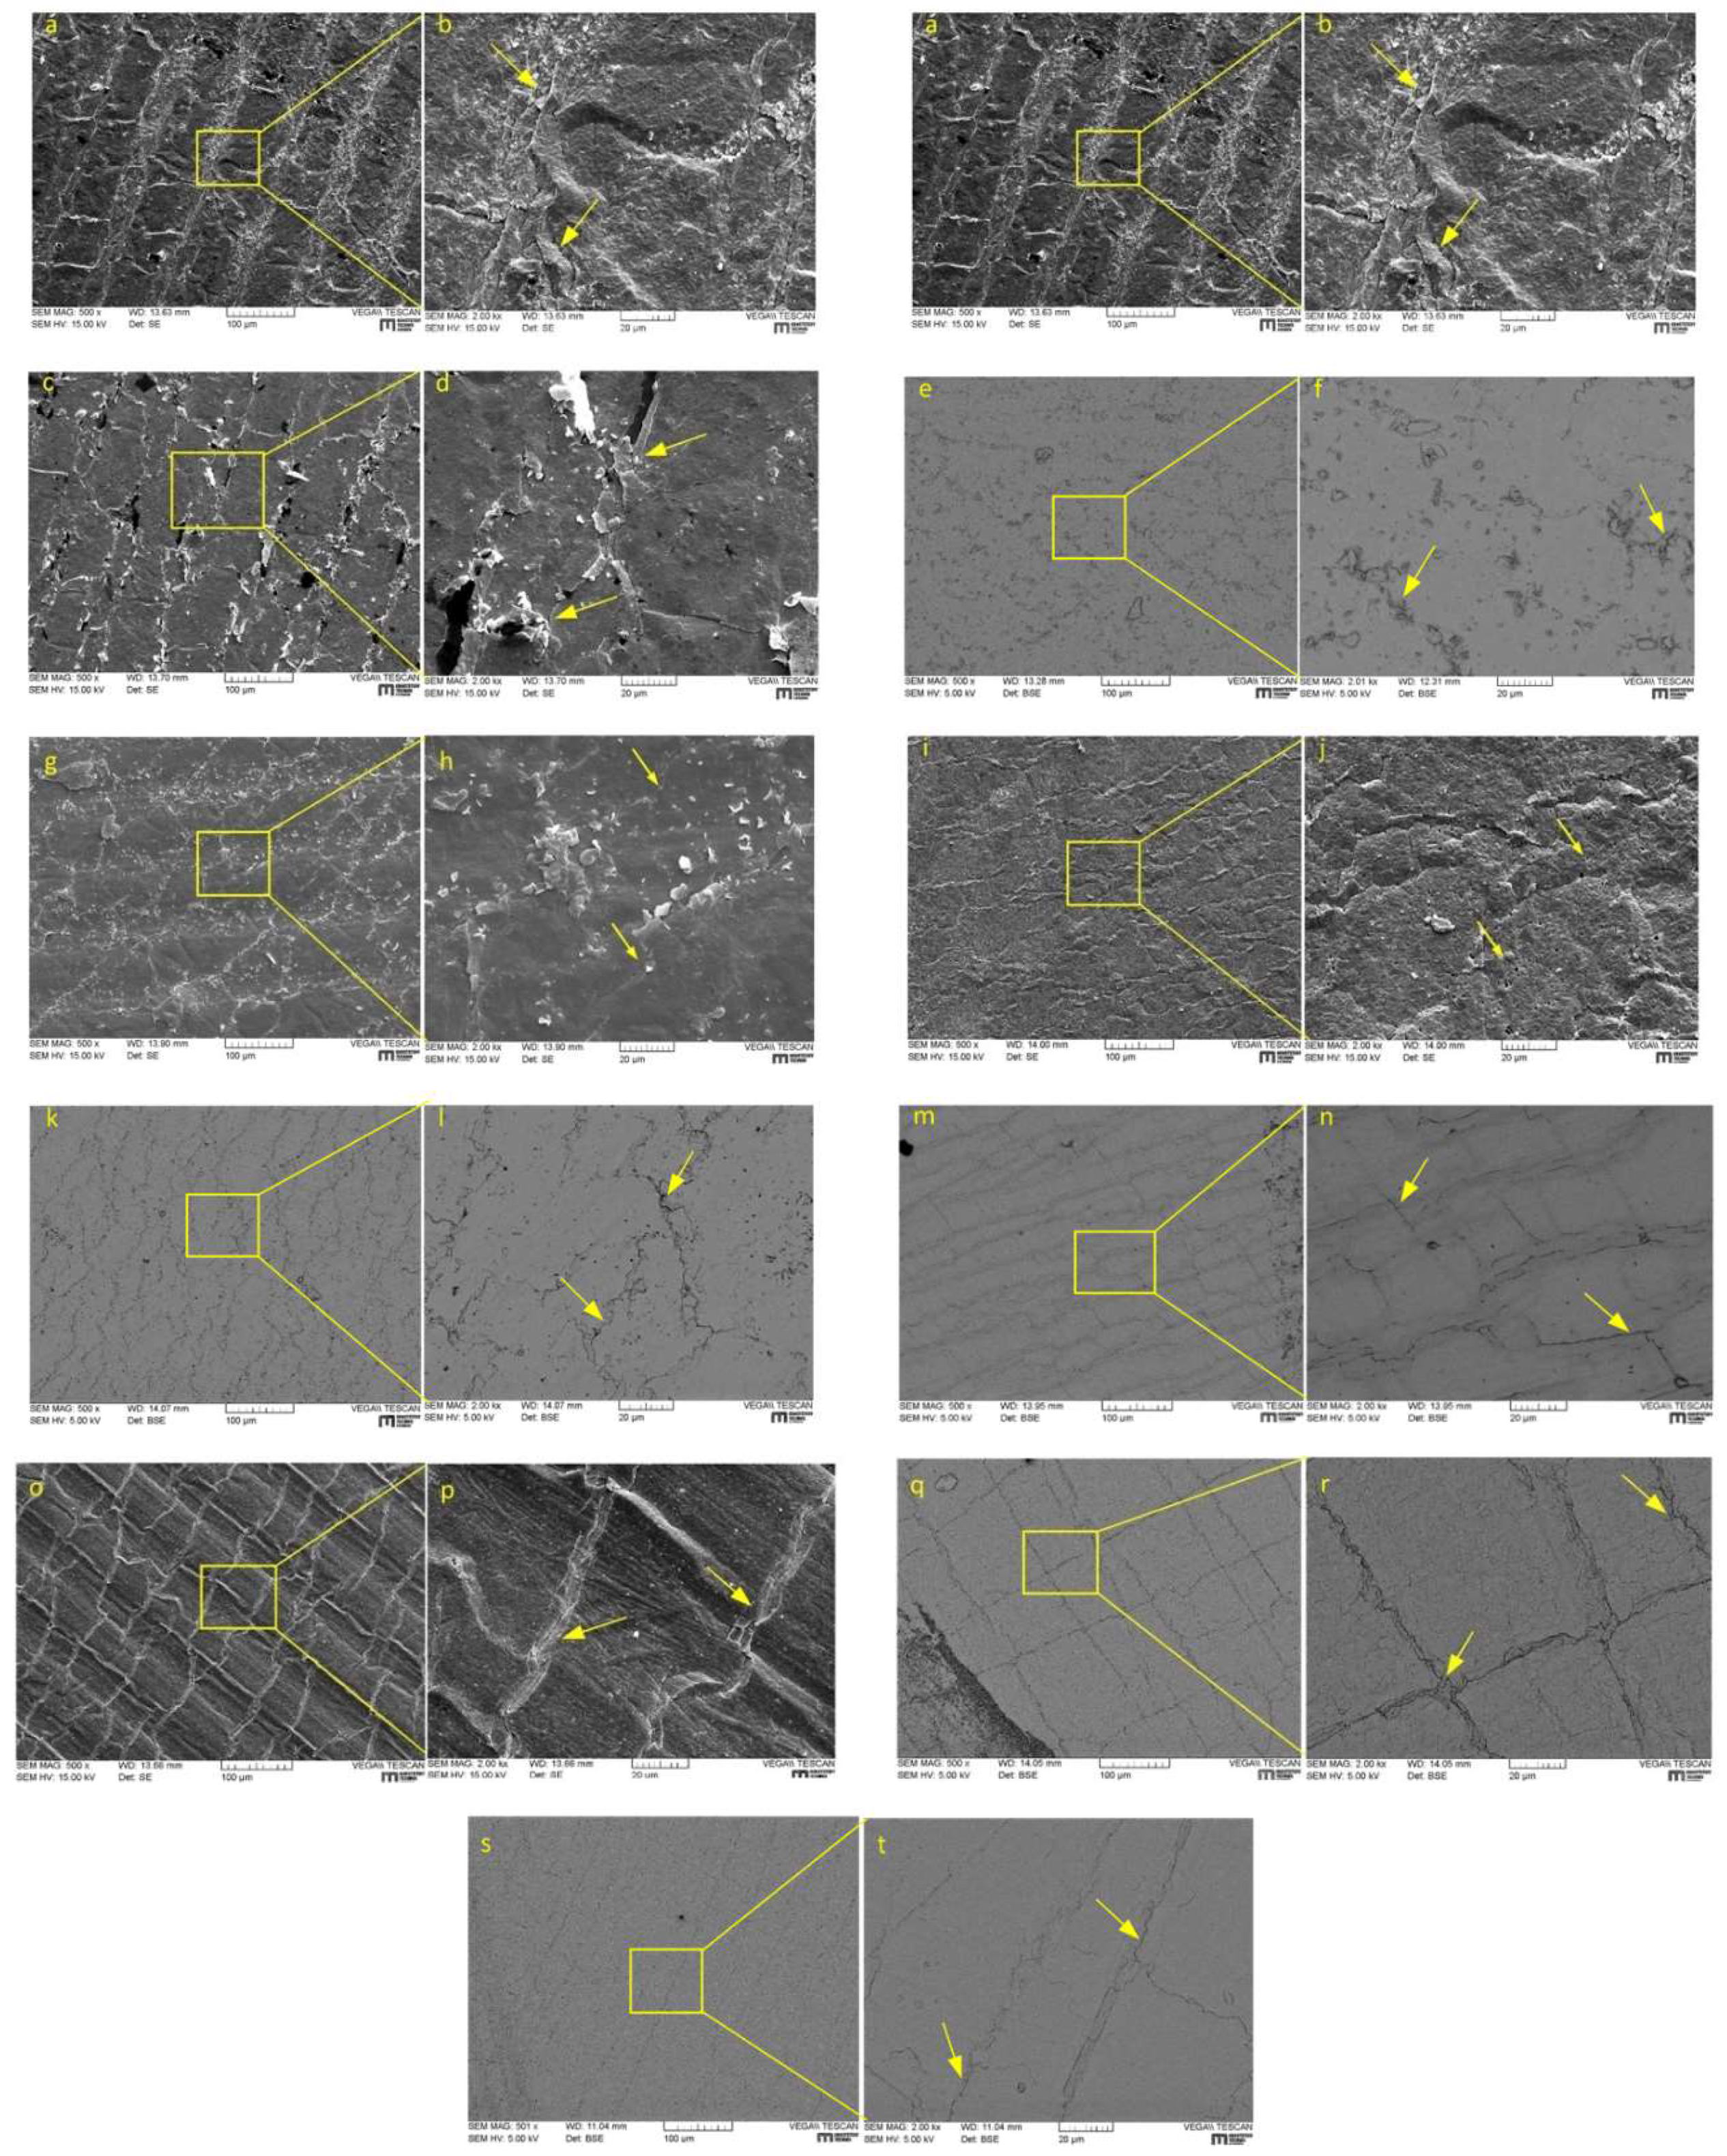
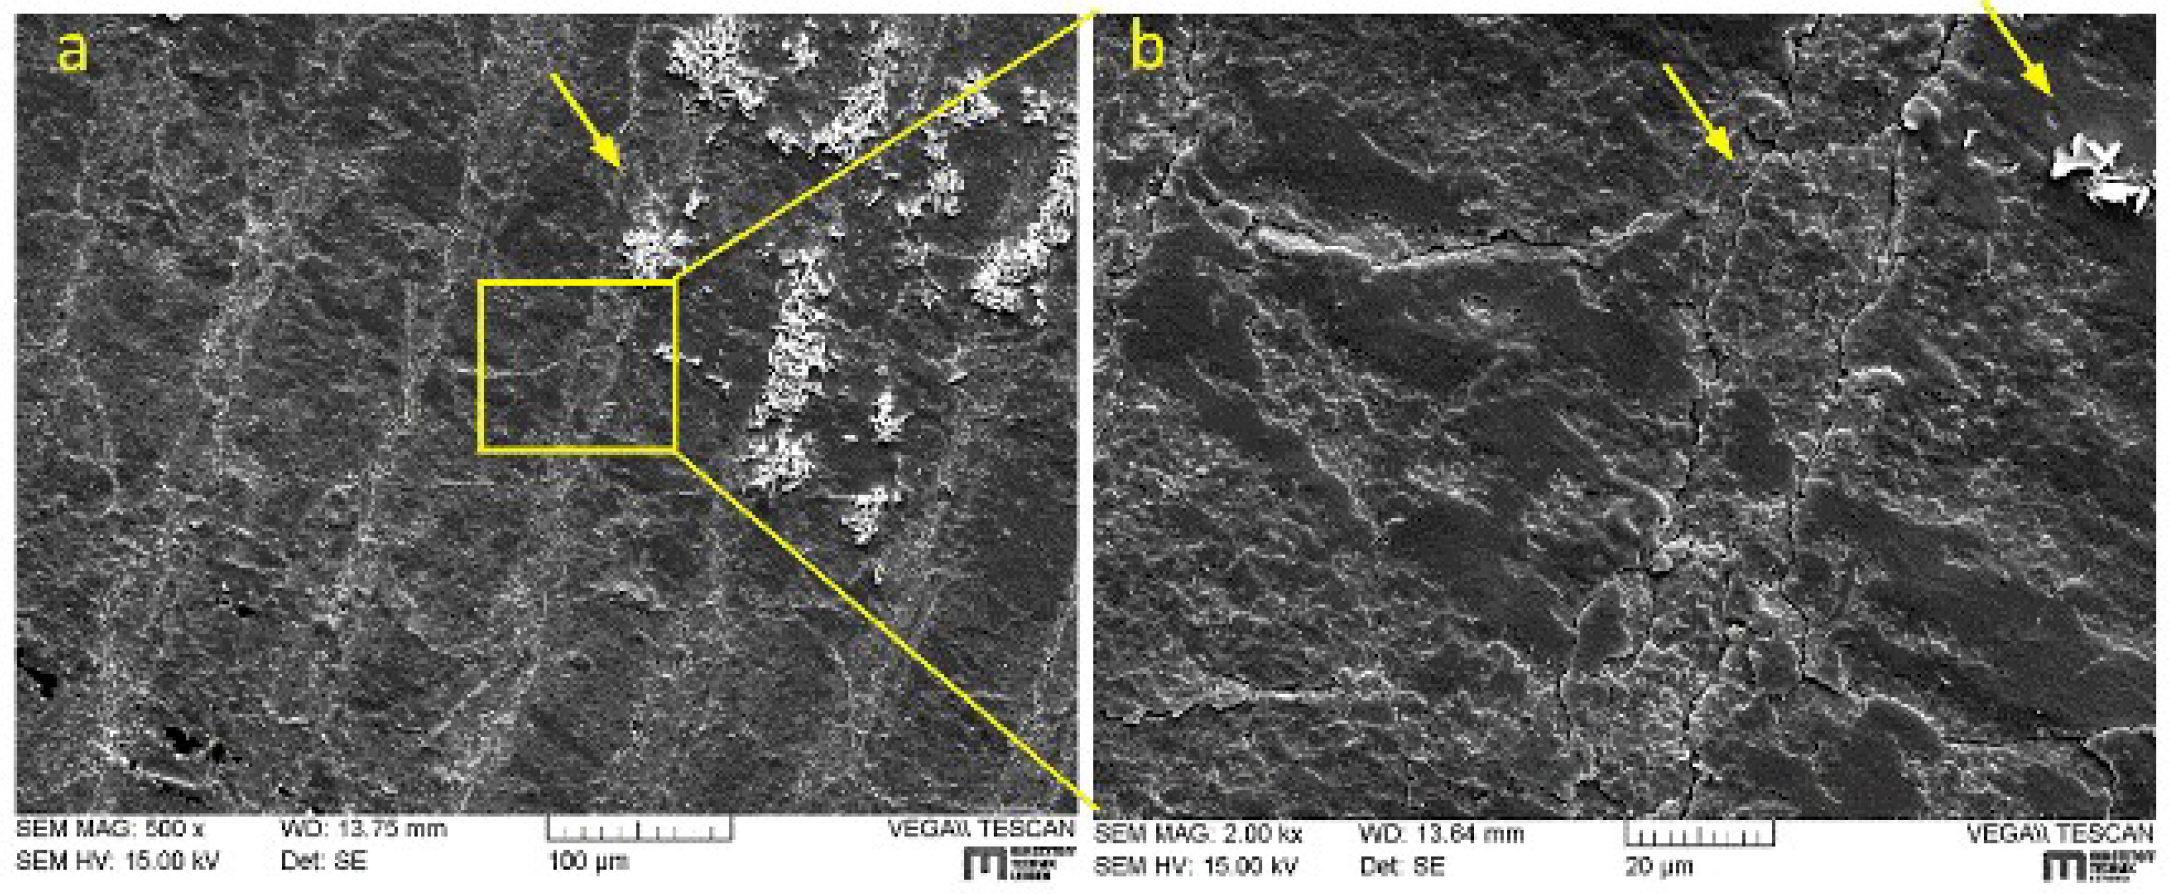
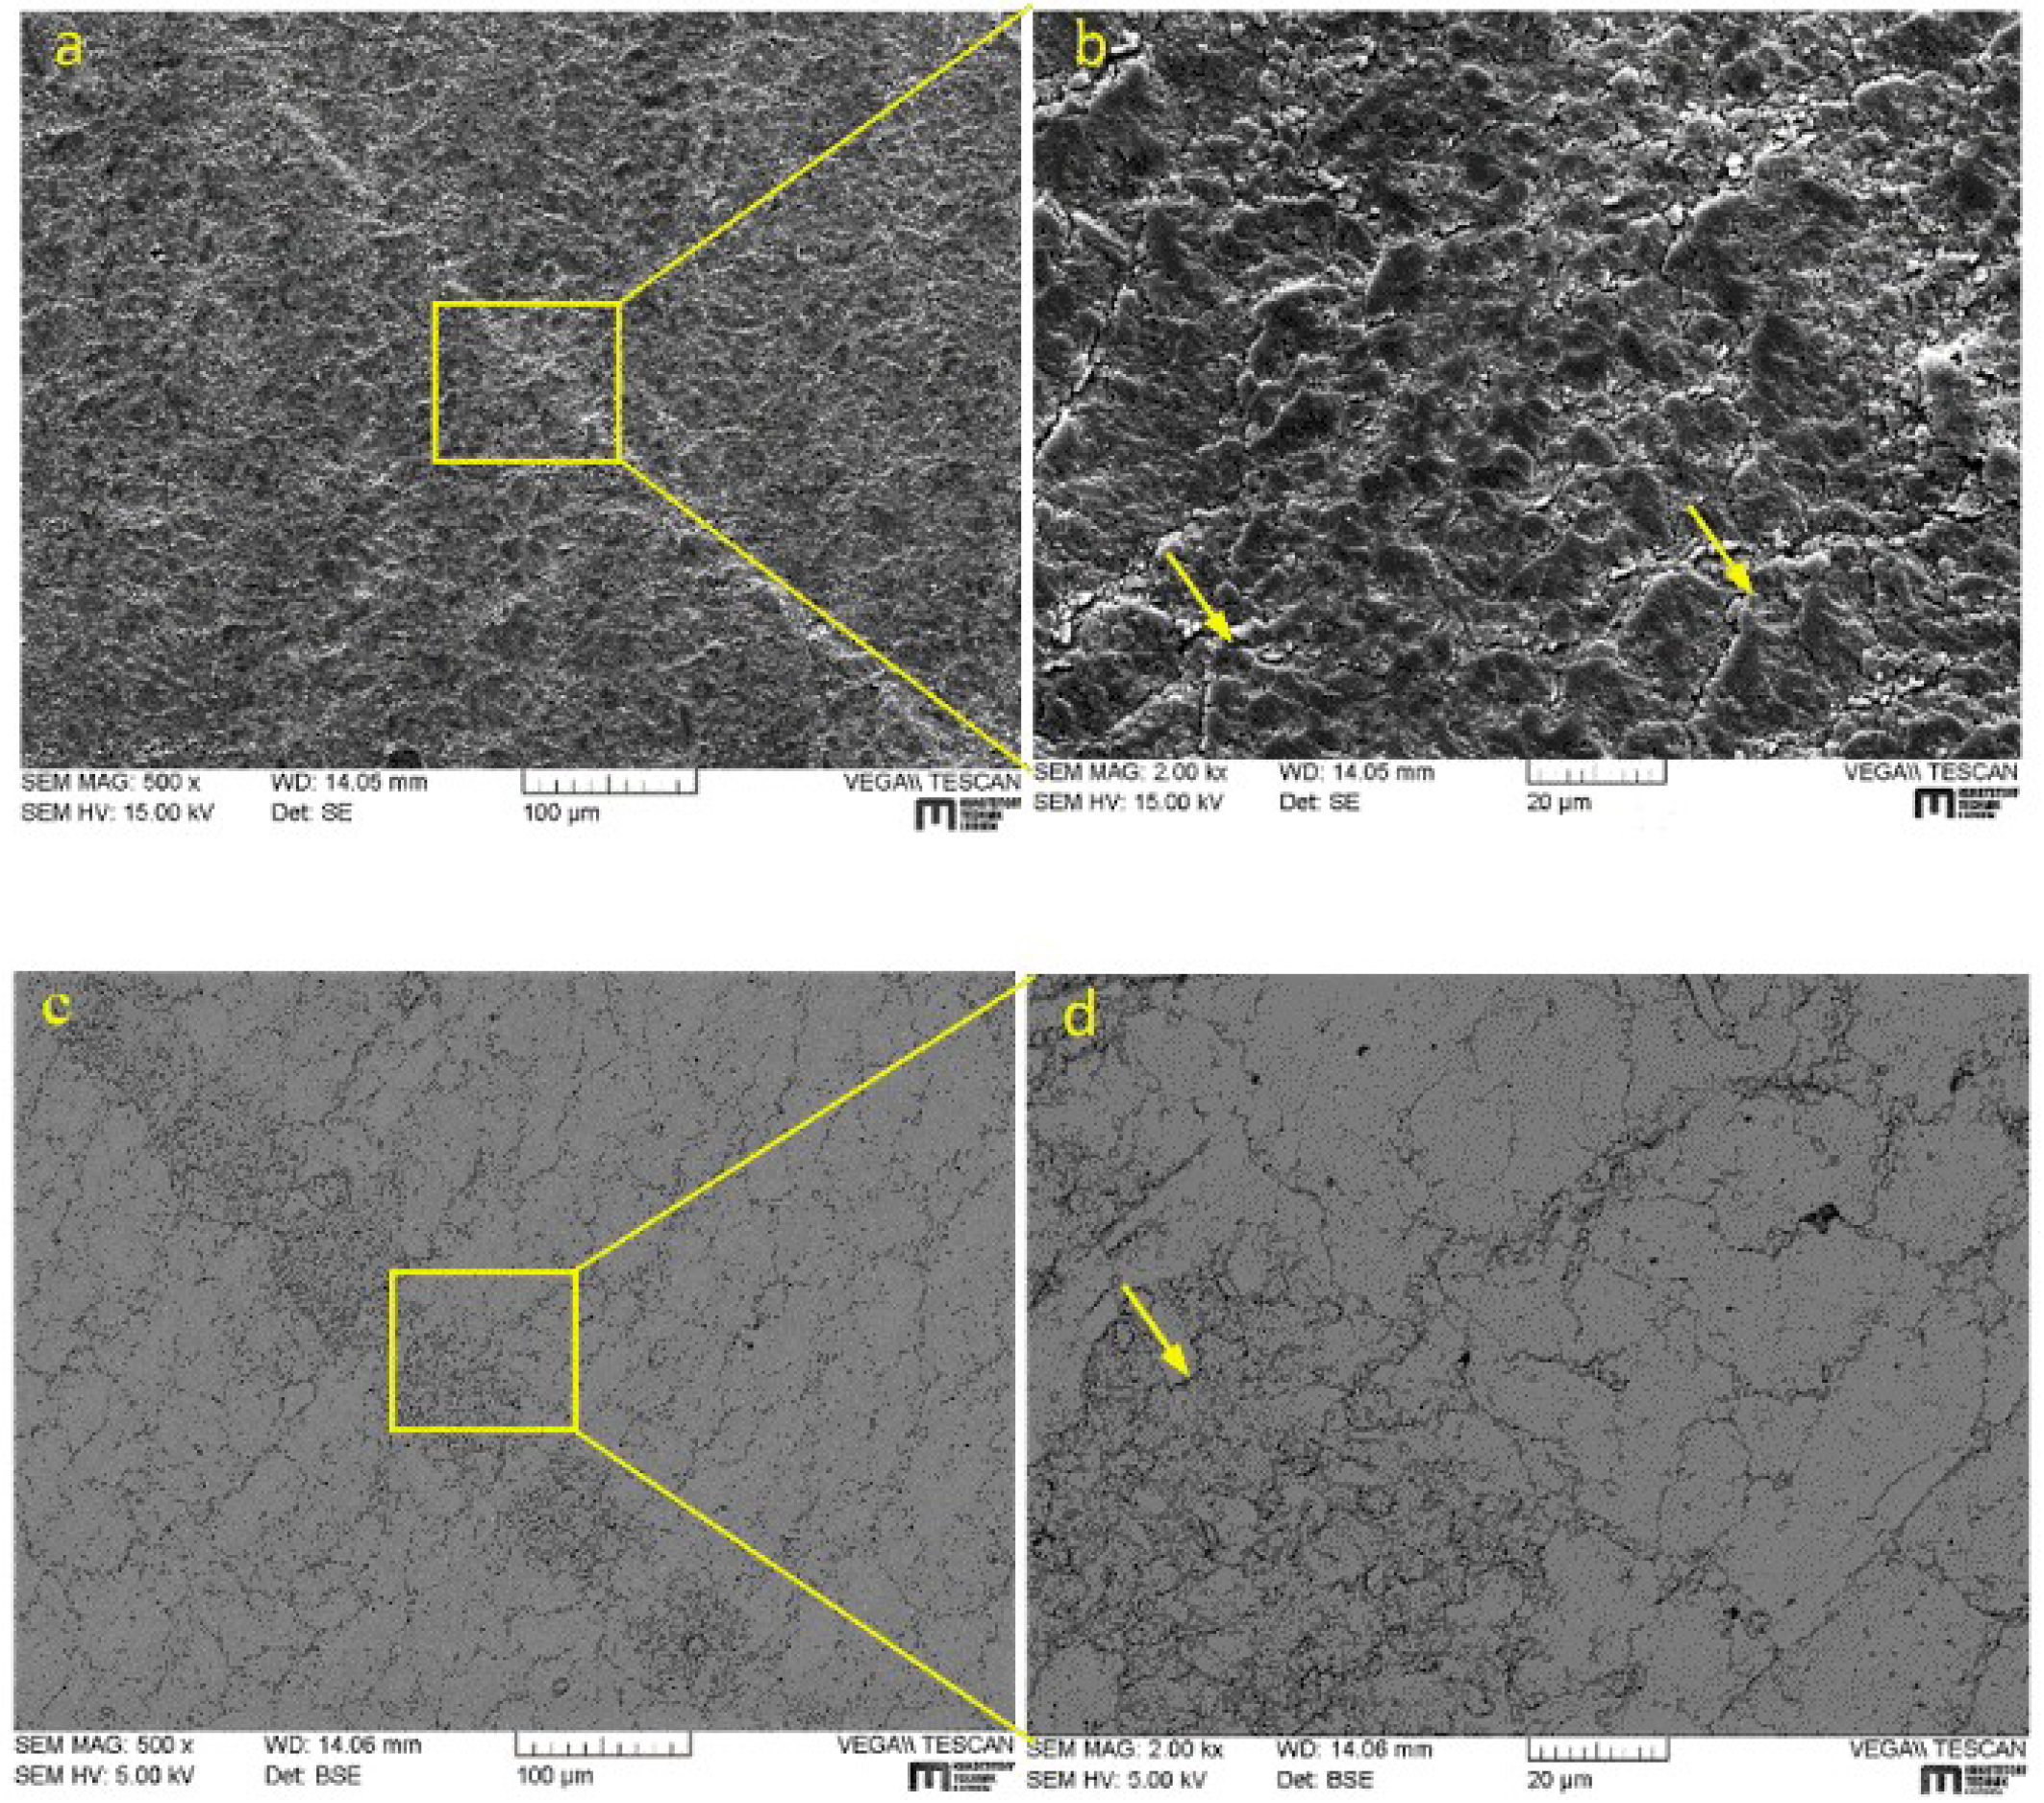
The SEM images (Figure 9) show the wear track of the 300 nm DLC coated HNBR after a dry ball on disc test. It is evident that in the majority of the run area, the surface got smoother. The DLC coating was slightly pressed down due to the normal load and the microstructures were plastically deformed because of the tangential traction, which was generated by the sliding motion. Some piles of small crystal-like fragments can be found on the run track (Figure 10g). DLC is a very hard material and the thickness of the coating is just 300 nm. That means that when the counter body slid over the surface, both the elastomeric substrate and the coating experienced a deformation. The difference is that the substrate deformed viscoelastically and the coating showed a plastic deformation. Meanwhile, the cracks of the coating can also be ascribed to the enormous difference in hardness between the two materials.
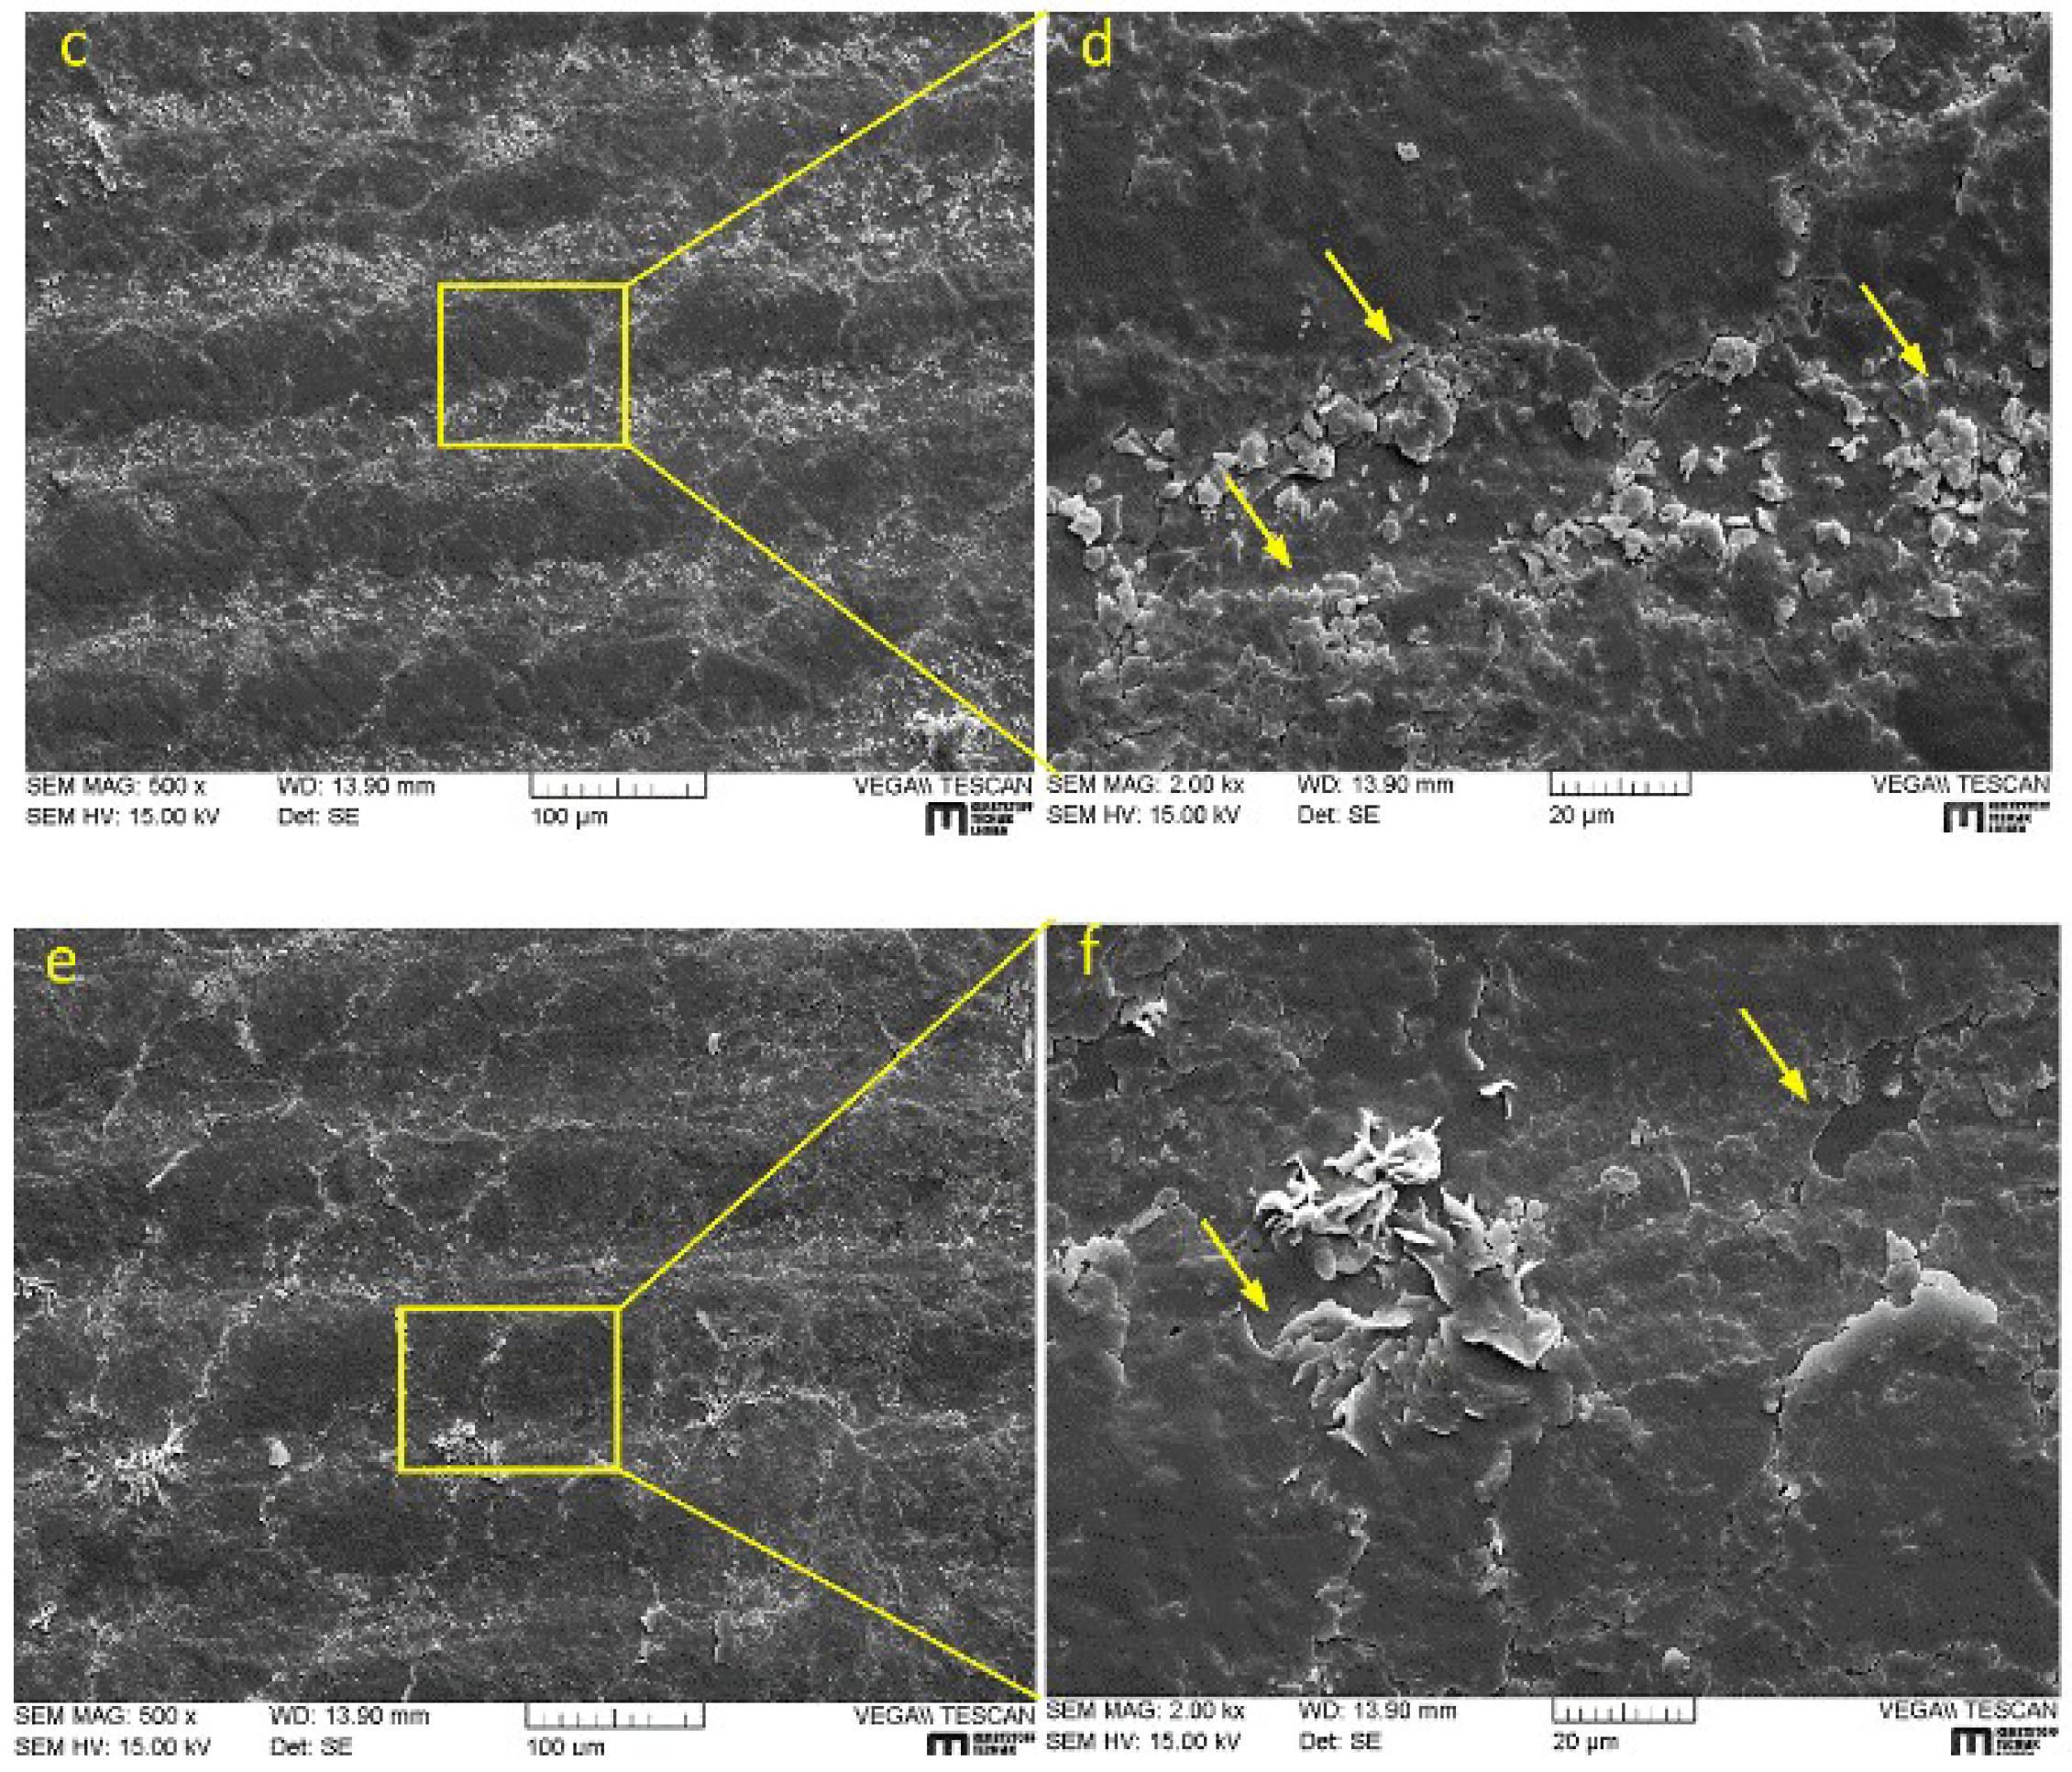
Two positions of the wear track of 300 nm Hybrid_A coated HNBR were shown in Figure 9c,e. Particles can be observed in the troughs, which were located between every two peaks. White particles (Figure 3a,f) can be MoO3, the oxidation product of MoS2, which has a negative effect on the performance [15,36]. As shown in Table 4, in hybrid coatings, MoO3 possesses larger portion than MoS2. According to [67], when less than 30% of the MoS2 converted to MoO3, wear performance is still good. However, when it is greater than 50%, the wear behavior gets poor. As can be seen from Figure 3a,g, a part of the particles were generated during the coating process. Particles were also generated through dynamic motion in crack area. All of these particles were collected during the test in the trough. As can be observed in Figure 9d, some of the particles were pressed on the surface when the ball slid over.
From the same coating and substrate, sheet-like wear particles are visible in Figure 9e,f. This phenomenon can be attributed to surface fatigue [68]. Due to the repeated plastic deformation, sheet-like particles were gradually generated and separated from the coating.
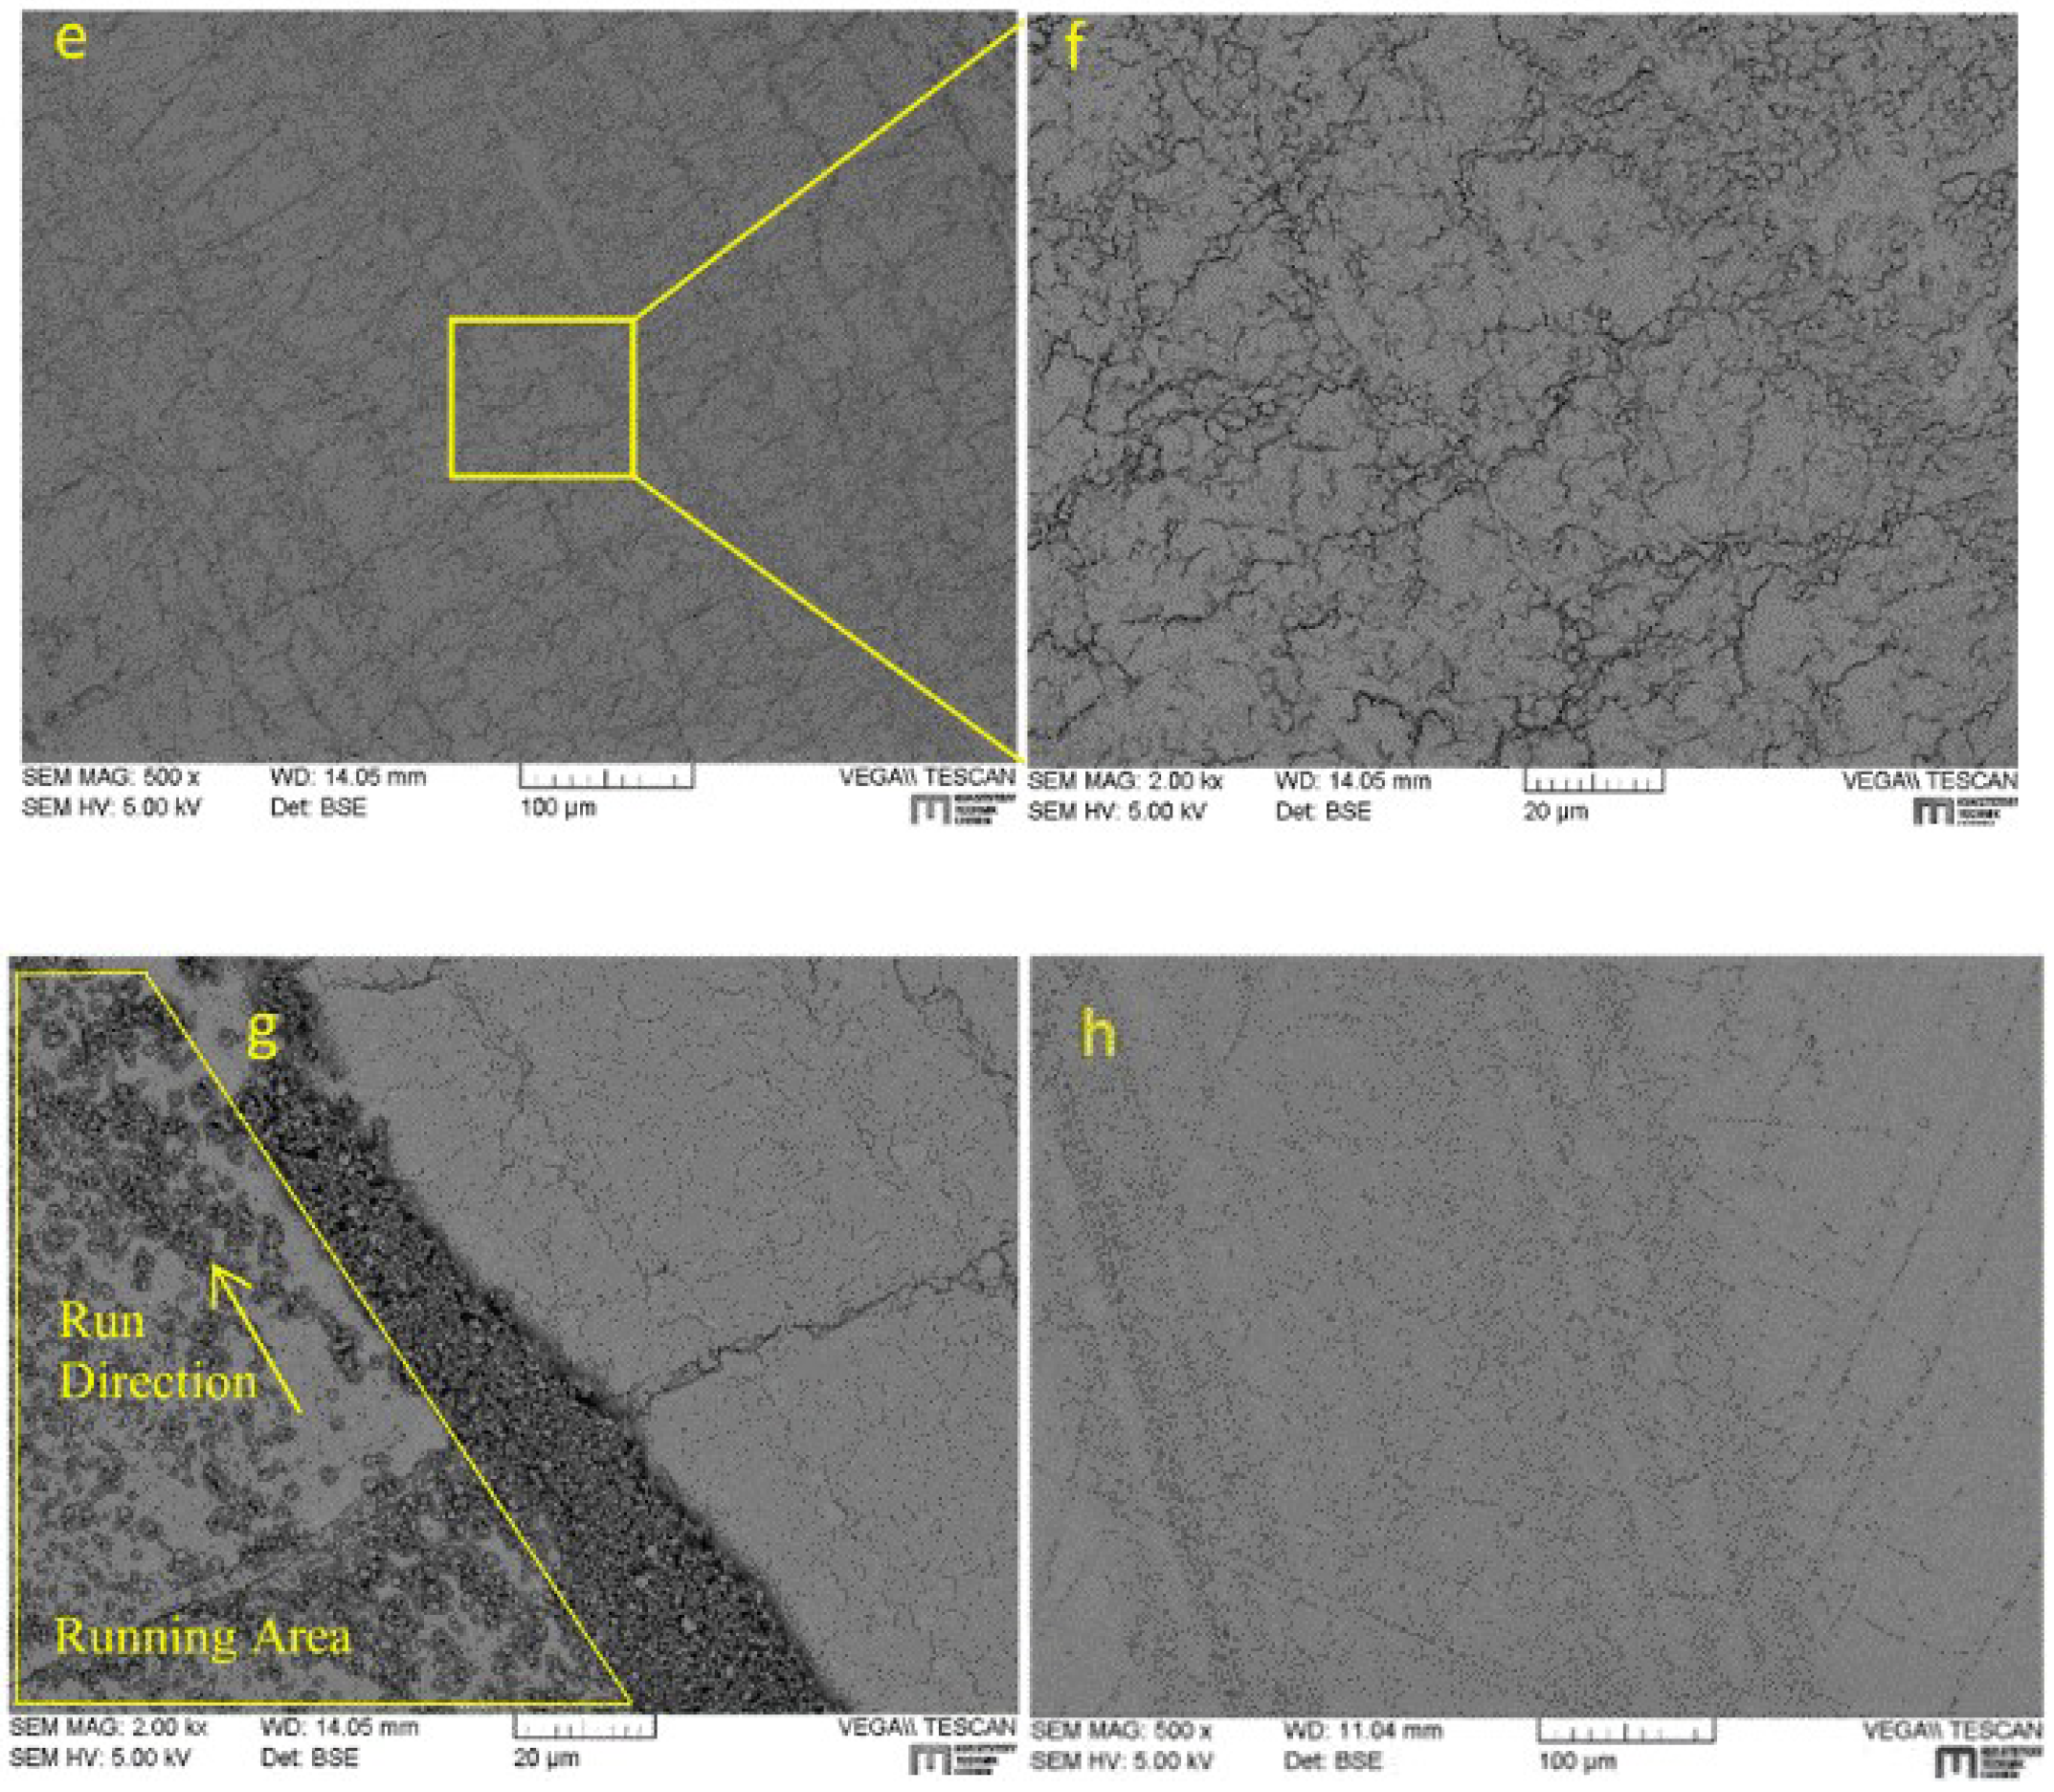
Compared to the 300 nm Hybrid_A coating on FKM before (Figure 3i) and after (Figure 10a) the test, a great number of cracks was generated during the test. This can be related to the dense particle-like microstructures of uncoated FKM. When the porous and loose coating was pressed by the counter body, it deformed more heavily and easily than other coatings. Besides, due to its lowest hardness among the four elastomers, the deformation of FKM is the largest. These two reasons could explain this phenomenon.
Not like the 300 nm Hybrid_A coating, no obvious alteration could be found on the 300 nm MoS2 coating after 10,000 cycles. Only the contact area was pressed and subsequently crushed into small pieces (Figure 10c). This can be attributed to the S–Mo–S sandwich structure of MoS2, which facilitates the sliding motion on its surface [15].
The wear track of 300 nm DLC coated TPU (Figure 10e,f) presented very similar microstructures as MoS2 coated FKM. That means only the DLC coating in the contact area was pressed into small pieces. However, plenty of wear particles, which are around 1 µm, were found close to the edge of the run track (Figure 10g). In some areas, they were piled up together. At the beginning of the test, the DLC coating was pressed into small pieces. However, some of the small particles that were detached from the substrate, rolled down from the sides to the middle of the groove. More and more particles were gathered on the lane with more cycles. At this moment, the particles were pushed out of the lane when the counter body slid over. Still quite a number of particles were found on the track after the test. Apparently, the dynamic movement of these small particles has influenced the tribological behavior to some extent. This can explain why DLC is the best coating for TPU under lubricated conditions but presented worse tribological properties than MoS2 in dry tests. There is a strong possibility that under lubricated conditions the wear particles can be carried out of the track by grease. This is also one of the main functions of a lubricant [69].
Because of its low hardness and good shear characteristics no obvious particles were found on the MoS2 coated TPU. Slight abrasive wear can be observed on the surface (Figure 10h). This is also one of the major wear processes on polymers [70]. Due to its special properties and good adherence on TPU, 300 nm MoS2 shows the best tribological properties in dry tests.
4. Conclusions
The concept of the combination of hard and soft coatings on elastomers has been investigated. In this research, DLC was taken as an example of a hard coating and MoS2 as a soft coating. It was proven that this concept can be used to improve the tribological properties of elastomers, especially under starved lubrication condition. There is not one coating that is optimal for all substrates. For different rubber substrates, the coating should be chosen individually, based on the substrate, coating properties, and their interaction. For a rubber substrate with low rigidity like FKM, soft coatings like MoS2 present better tribological properties than hard coatings like DLC. This is attributed to the good shear characteristics and good deformation properties of MoS2. Meanwhile, for a substrate with a higher rigidity like HNBR, a hard coating like DLC is a better option. For NBR, whose rigidity is between FKM and HNBR, a hybrid coating is the best choice. It possesses both advantages of hard and soft coatings. For TPU, due to its totally different microstructures, a different wear mechanism was discussed. For a hard substrate with a smooth surface, MoS2 presented a better performance than a hard coating because the small particles of the hard coating can bring disadvantages during sliding motions.
Through the observation of microstructures on uncoated and coated surfaces the influence of the surface roughness and surface energy on tribological properties was investigated. The low surface energy of substrate leads to a porous and loose coating. As a consequence, the tribological properties could be adversely influenced.
The concept of the combination of hard and soft coatings will open new fields for the use of coatings in tribological applications on elastomers. Our data rule out the possibility that the application of DLC/MoS2 as a coating can improve the tribological properties of elastomeric seals, especially under dry or insufficiently lubricated conditions. This finding is promising and should be explored with different combinations of even more than two coatings.
Author Contributions
Conceptualization, A.H., J.M.L., and T.S.; Methodology, A.H., J.M.L., and C.W.; Validation, C.W.; Formal Analysis, C.W., A.H., P.N., T.S.; Investigation, C.W.; Data Curation, C.W.; Writing–Original Draft Preparation, C.W., P.N.; Writing–Review & Editing, A.H., J.M.L., T.S.; Visualization, C.W.; Data Supervisor, A.H., T.S.; Resources, T.S., J.M.L.; Project Administration, A.H., J.M.L., T.S.; Funding Acquisition, T.S.
Funding
This research was funded by the project of “Bionics4Efficiency”, which is one project of the “Bridge Program” (84037) of the Austrian Research Promotion Agency (FFG).
Acknowledgments
The authors gratefully thank M. Mitterhuber, W. Waldhauser and H. Parizek for their technical and scientific support and useful discussions.
Conflicts of Interest
The authors declare no conflict of interest.
References
- Holmberg, K.; Matthews, A. Coatings Tribology. Properties, Mechanisms, Techniques and Applications in Surface Engineering, 2nd ed.; Elsevier Science: Amsterdam, The Netherlands, 2009. [Google Scholar]
- Gawliński, M. Friction and wear of elastomer seals. Arch. Civ. Mech. Eng. 2007, 7, 57–67. [Google Scholar] [CrossRef]
- Nakahigashi, T.; Tanaka, Y.; Miyake, K.; Oohara, H. Properties of flexible DLC film deposited by amplitude-modulated RF P-CVD. Tribol. Int. 2004, 37, 907–912. [Google Scholar] [CrossRef]
- Nakahigashi, T.; Miyake, K.; Murkami, Y. Application of DLC coating to rubber and polymer materials. J. Jpn. Soc. Tribol. 2002, 47, 833–839. [Google Scholar]
- Takikawa, H.; Miyakawa, N.; Minamisawa, S.; Sakakibara, T. Fabrication of diamond-like carbon film on rubber by T-shape filtered-arc-deposition under the influence of various ambient gases. Thin Solid Films 2004, 457, 143–150. [Google Scholar] [CrossRef]
- Takikawa, H.; Miyakawa, N.; Toshifuji, J.; Minamisawa, S.; Matsushita, T.; Takemura, K.; Sakakibara, T. Preparation of elastic DLC film on rubber by T-shape filtered arc deposition. IEEJ Trans. Fundam. Mater. 2003, 123, 738–743. [Google Scholar] [CrossRef]
- Miyakawa, N.; Minamisawa, S.; Takikawa, H.; Sakakibara, T. Physical–chemical hybrid deposition of DLC film on rubber by T-shape filtered-arc-deposition. Vacuum 2004, 73, 611–617. [Google Scholar] [CrossRef]
- Bui, X.; Pei, Y.; de Hosson, J.T.M. Magnetron reactively sputtered Ti-DLC coatings on HNBR rubber: The influence of substrate bias. Surf. Coat. Technol. 2008, 202, 4939–4944. [Google Scholar] [CrossRef] [Green Version]
- Bui, X.L.; Pei, Y.T.; Mulder, E.D.G.; de Hosson, J.T.M. Adhesion improvement of hydrogenated diamond-like carbon thin films by pre-deposition plasma treatment of rubber substrate. Surf. Coat. Technol. 2009, 203, 1964–1970. [Google Scholar] [CrossRef] [Green Version]
- Pei, Y.; Bui, X.; de Hosson, J.T.M. Deposition and characterization of hydrogenated diamond-like carbon thin films on rubber seals. Thin Solid Films 2010, 518, S42–S45. [Google Scholar] [CrossRef]
- Pei, Y.; Martinez-Martinez, D.; van der Pal, J.P.; Bui, X.; Zhou, X.; de Hosson, J.T.M. Flexible diamond-like carbon films on rubber: Friction and the effect of viscoelastic deformation of rubber substrates. Acta Mater. 2012, 60, 7216–7225. [Google Scholar] [CrossRef]
- Pei, Y.; Bui, X.; Zhou, X.; de Hosson, J.T.M. Tribological behavior of W-DLC coated rubber seals. Surf. Coat. Technol. 2008, 202, 1869–1875. [Google Scholar] [CrossRef]
- Lackner, J.M.; Major, R.; Major, L.; Schöberl, T.; Waldhauser, W. RF deposition of soft hydrogenated amorphous carbon coatings for adhesive interfaces on highly elastic polymer materials. Surf. Coat. Technol. 2009, 203, 2243–2248. [Google Scholar] [CrossRef]
- Kahn, M.; Menegazzo, N.; Mizaikoff, B.; Berghauser, R.; Lackner, J.M.; Hufnagel, D.; Waldhauser, W. Properties of DLC and Nitrogen-Doped DLC Films Deposited by DC Magnetron Sputtering. Plasma Process. Polym. 2007, 4, S200–S204. [Google Scholar] [CrossRef]
- Lansdown, A.R. Molybdenum Disulphide Lubrication, 1st ed.; Elsevier Science: Amsterdam, The Netherlands, 1999. [Google Scholar]
- Bellido-González, V.; Jones, A.H.S.; Hampshire, J.; Allen, T.J.; Witts, J.; Teer, D.G.; Ma, K.J.; Upton, D. Tribological behaviour of high performance MoS2 coatings produced by magnetron sputtering. Surf. Coat. Technol. 1997, 97, 687–693. [Google Scholar] [CrossRef]
- Donnet, C.; Martin, J.M.; Le Mogne, T.; Belin, M. Super-low friction of MoS2 coatings in various environments. Tribol. Int. 1996, 29, 123–128. [Google Scholar] [CrossRef]
- Wang, D.; Chang, C.; Ho, W. Microstructure analysis of MoS2 deposited on diamond-like carbon films for wear improvement. Surf. Coat. Technol. 1999, 111, 123–127. [Google Scholar] [CrossRef]
- Zhao, X.; Lu, Z.; Wu, G.; Zhang, G.; Wang, L.; Xue, Q. Preparation and properties of DLC/MoS2 multilayer coatings for high humidity tribology. Mater. Res. Express 2016, 3, 066401. [Google Scholar] [CrossRef]
- Wu, Y.; Liu, Y.; Yu, S.; Zhou, B.; Tang, B.; Li, H.; Chen, J. Influences of space irradiations on the structure and properties of MoS2/DLC lubricant film. Tribol. Lett. 2016, 64, 24. [Google Scholar] [CrossRef]
- Noshiro, J.; Watanabe, S.; Sakurai, T.; Miyake, S. Friction properties of co-sputtered sulfide/DLC solid lubricating films. Surf. Coat. Technol. 2006, 200, 5849–5854. [Google Scholar] [CrossRef]
- Hausberger, A.; Godor, V.; Grün, F.; Pinter, G.; Schwarz, T. Development of ring on disc tests for elastomeric sealing materials. In Proceedings of the International Tribology Conference, Tokyo, Japan, 16–20 September 2015. [Google Scholar]
- Rodgers, B.; Waddell, W. The science of rubber compounding. In Science and Technology of Rubber, 4th ed.; Mark, J.E., Erman, B., Roland, C.M., Eds.; Academic Press: Cambridge, MA, USA, 2013; pp. 417–471. [Google Scholar]
- Thirumalai, S.; Hausberger, A.; Lackner, J.M.; Waldhauser, W.; Schwarz, T. Effect of the type of elastomeric substrate on the microstructural, surface and tribological characteristics of diamond-like carbon (DLC) coatings. Surf. Coat. Technol. 2016, 302, 244–254. [Google Scholar] [CrossRef]
- Lackner, J.M.; Waldhauser, W.; Schwarz, M.; Mahoney, L.; Major, L.; Major, B. Polymer pre-treatment by linear anode layer source plasma for adhesion improvement of sputtered TiN coatings. Vacuum 2008, 83, 302–307. [Google Scholar] [CrossRef]
- Assender, H.; Bliznyuk, V.; Porfyrakis, K. How surface topography relates to materials’ properties. Science 2002, 297, 973–976. [Google Scholar] [CrossRef] [PubMed]
- Cho, N.-H.; Krishnan, K.M.; Veirs, D.K.; Rubin, M.D.; Hopper, C.B.; Bhushan, B.; Bogy, D.B. Chemical structure and physical properties of diamond-like amorphous carbon films prepared by magnetron sputtering. J. Mater. Res. 1990, 5, 2543–2554. [Google Scholar] [CrossRef] [Green Version]
- Robertson, J. Diamond-like amorphous carbon. Mater. Sci. Eng. R Rep. 2002, 37, 129–281. [Google Scholar] [CrossRef] [Green Version]
- Martinez-Martinez, D.; de Hosson, J.T.M. On the deposition and properties of DLC protective coatings on elastomers: A critical review. Surf. Coat. Technol. 2014, 258, 677–690. [Google Scholar] [CrossRef]
- Moulder, J.F. Handbook of X-ray Photoelectron Spectroscopy. A Reference Book of Standard Spectra for Identification and Interpretation of XPS Data; Perkin-Elmer: Eden Prairie, MN, USA, 1992. [Google Scholar]
- ASTM D445-17a Test Method for Kinematic Viscosity of Transparent and Opaque Liquids (and Calculation of Dynamic Viscosity); ASTM International: West Conshohocken, PA, USA, 2017.
- Data Sheet of Mobil SHC™ Grease 460 WT; Exxon Mobil Corporation: Irving, TX, USA, 2016.
- NIST X-ray Photoelectron Spectroscopy Database; Version 4.1; National Institute of Standards and Technology: Gaithersburg, MD, USA. Available online: https://srdata.nist.gov/xps/Default.aspx (accessed on 13 June 2018).
- Scofield, J.H. Hartree-slater subshell photoionization cross-sections at 1254 and 1487 eV. J. Electron Spectrosc. Relat. Phenom. 1976, 8, 129–137. [Google Scholar] [CrossRef]
- Xu, Y.; Zheng, C.; Wang, S.; Hou, Y. 3D arrays of molybdenum sulphide nanosheets on Mo meshes: Efficient electrocatalysts for hydrogen evolution reaction. Electrochim. Acta 2015, 174, 653–659. [Google Scholar] [CrossRef]
- Fleischauer, P.D.; Lince, J.R. A comparison of oxidation and oxygen substitution in MoS2 solid film lubricants. Tribol. Int. 1999, 32, 627–636. [Google Scholar] [CrossRef]
- Weber, T.; Muijsers, J.C.; Niemantsverdriet, J.W. Structure of Amorphous MoS3. J. Phys. Chem. 1995, 99, 9194–9200. [Google Scholar] [CrossRef]
- Baker, M.A.; Gilmore, R.; Lenardi, C.; Gissler, W. XPS investigation of preferential sputtering of S from MoS2 and determination of MoSx stoichiometry from Mo and S peak positions. Appl. Surf. Sci. 1999, 150, 255–262. [Google Scholar] [CrossRef]
- Qiu, L.; Xu, G. Peak overlaps and corresponding solutions in the X-ray photoelectron spectroscopic study of hydrodesulfurization catalysts. Appl. Surf. Sci. 2010, 256, 3413–3417. [Google Scholar] [CrossRef]
- Robertson, J. Classification of diamond-like carbons. In Tribology of Diamond-Like Carbon Films: Fundamentals and Applications; Donnet, C., Ed.; Springer: Boston, MA, USA, 2008; pp. 13–24. [Google Scholar]
- Paik, N. Raman and XPS studies of DLC films prepared by a magnetron sputter-type negative ion source. Surf. Coat. Technol. 2005, 200, 2170–2174. [Google Scholar] [CrossRef]
- Leung, T.Y.; Man, W.F.; Lim, P.K.; Chan, W.C.; Gaspari, F.; Zukotynski, S. Determination of the sp3/sp2 ratio of a-C: H by XPS and XAES. J. Non-Cryst. Solids 1999, 254, 156–160. [Google Scholar] [CrossRef]
- Benoist, L.; Gonbeau, D.; Pfister-Guillouzo, G.; Schmidt, E.; Meunier, G.; Levasseur, A. XPS analysis of lithium intercalation in thin films of molybdenum oxysulphides. Surf. Interface Anal. 1994, 22, 206–210. [Google Scholar] [CrossRef]
- Martincová, J.; Otyepka, M.; Lazar, P. Is single layer MoS2 stable in the air? Chemistry 2017, 23, 13233–13239. [Google Scholar] [CrossRef] [PubMed]
- Fleischauer, P.D. Effects of crystallite orientation on environmental stability and lubrication properties of sputtered MoS2 thin films. ASLE Trans. 2008, 27, 82–88. [Google Scholar] [CrossRef]
- Fleischauer, P.D.; Bauer, R. Chemical and structural effects on the lubrication properties of sputtered MoS2 films. Tribol. Trans. 1988, 31, 239–250. [Google Scholar] [CrossRef]
- Theilade, U.A.; Hansen, H.N. Surface microstructure replication in injection molding. Int. J. Adv. Manuf. Technol. 2007, 33, 157–166. [Google Scholar] [CrossRef]
- Donnet, C.; Erdemir, A. Tribology of Diamond-Like Carbon Films. Fundamentals and Applications; Springer: Boston, MA, USA, 2008. [Google Scholar]
- Neuville, S.; Matthews, A. A perspective on the optimisation of hard carbon and related coatings for engineering applications. Thin Solid Films 2007, 515, 6619–6653. [Google Scholar] [CrossRef]
- Baglin, J.E.E. Interface design for thin film adhesion. In Fundamentals of Adhesion; Lee, L.-H., Ed.; Springer: Boston, MA, USA, 2014; pp. 363–382. [Google Scholar]
- Goldschmidt, A.; Streitberger, H.-J. BASF Handbook on Basics of Coating Technology, 2nd ed.; Vincentz Network: Hannover, Germany, 2007. [Google Scholar]
- Quéré, D. Wetting and Roughness. Annu. Rev. Mater. Res. 2008, 38, 71–99. [Google Scholar] [CrossRef]
- Martínez, L.; Nevshupa, R.; Álvarez, L.; Huttel, Y.; Méndez, J.; Román, E.; Mozas, E.; Valdés, J.R.; Jimenez, M.A.; Gachon, Y.; et al. Application of diamond-like carbon coatings to elastomers frictional surfaces. Tribol. Int. 2009, 42, 584–590. [Google Scholar] [CrossRef]
- Van der Pal, J.P.; Martinez-Martinez, D.; Pei, Y.T.; Rudolf, P.; de Hosson, J.T.M. Microstructure and tribological performance of diamond-like carbon films deposited on hydrogenated rubber. Thin Solid Films 2012, 524, 218–223. [Google Scholar] [CrossRef]
- Grosch, K.A. The relation between the friction and visco-elastic properties of rubber. Proc. R. Soc. A Math. Phys. Eng. Sci. 1963, 274, 21–39. [Google Scholar] [CrossRef]
- Zhang, S.-W. Tribology of Elastomers, 1st ed.; Elsevier: Amsterdam, The Netherlands, 2004. [Google Scholar]
- Fuller, K.N.G.; Tabor, D. The effect of surface roughness on the adhesion of elastic solids. Proc. R. Soc. A 1975, 345, 327–342. [Google Scholar] [CrossRef]
- Persson, B.N.J. On the theory of rubber friction. Surf. Sci. 1998, 401, 445–454. [Google Scholar] [CrossRef]
- Mofidi, M.; Prakash, B. Influence of counterface topography on sliding friction and wear of some elastomers under dry sliding conditions. Proc. Inst. Mech. Eng. Part J J. Eng. Tribol. 2008, 222, 667–673. [Google Scholar] [CrossRef]
- Glaeser, W.A.; Brundle, C.R.; Evans, C.A. Characterization of Tribological Materials, 2nd ed.; Momentum Press: New York, NY, USA, 2012. [Google Scholar]
- Rabinowicz, E. Influence of surface energy on friction and wear phenomena. J. Appl. Phys. 1961, 32, 1440–1444. [Google Scholar] [CrossRef]
- Rabinowicz, E. Friction and Wear of Materials, 2nd ed.; Wiley: New York, NY, USA, 1995. [Google Scholar]
- Friedrich, K. Friction and Wear of Polymer Composites; North Holland Publishing Co.: Amsterdam, The Netherlands, 1986. [Google Scholar]
- Bowden, F.P.; Tabor, D. The Friction and Lubrication of Solids; Oxford University Press: London, UK, 1963. [Google Scholar]
- Okrent, E.H. The effect of lubricant viscosity and composition on engine friction and bearing wear. ASLE Trans. 1961, 4, 97–108. [Google Scholar] [CrossRef]
- Archard, J.F. Contact and rubbing of flat surfaces. J. Appl. Phys. 1953, 24, 981–988. [Google Scholar] [CrossRef]
- Lince, J.R.; Frantz, P.P. Anisotropic oxidation of MoS2 crystallites studied by angle-resolved X-ray photoelectron spectroscopy. Tribol. Lett. 2001, 9, 211–218. [Google Scholar] [CrossRef]
- Booser, E.R. CRC Handbook of Lubrication. (Theory and Practice of Tribology). Theory and Design; CRC Press: Boca Raton, FL, USA, 1983. [Google Scholar]
- Pirro, D.M.; Daschner, E. Lubrication Fundamentals, 3rd ed.; Wessol, A.A., Ed.; CRC Press: Boca Raton, FL, USA, 2016. [Google Scholar]
- Zum Gahr, K.-H. Microstructure and Wear of Materials; North Holland Publishing Co.: Amsterdam, The Netherlands, 1987. [Google Scholar]
Figure 1.
Principle of ring on disc test on TE-93.

Figure 2.
X-ray photoelectron spectroscopy (XPS) spectra: C 1s of diamond-like carbon (DLC) coatings (a) and hybrid coatings (d); Mo 3d of MoS2 coatings (b) and hybrid coatings (e); S 2p of MoS2 coatings (c) and hybrid coatings (f).
Figure 2.
X-ray photoelectron spectroscopy (XPS) spectra: C 1s of diamond-like carbon (DLC) coatings (a) and hybrid coatings (d); Mo 3d of MoS2 coatings (b) and hybrid coatings (e); S 2p of MoS2 coatings (c) and hybrid coatings (f).


Figure 3.
With 300 nm (a,c) and 150 nm DLC (e) coated hydrogenated nitrile butadiene rubber (HNBR); with 300 nm Hybrid_A coated HNBR (g), fluoroelastomer (FKM), (i) and nitrile butadiene rubber (NBR) (o); with 300 nm MoS2 coated FKM (k), NBR (m) and thermoplastic polyurethane (TPU) (s); with 300 nm DLC coated TPU (q). High magnification (b,d,f,h,j,n,p,r,s,t) are shown to the right side of the respective low magnification (500×).

Figure 4.
Surface roughness (Ra) of uncoated and coated substrates.

Figure 5.
Surface energy of uncoated and coated substrates.

Figure 6.
Coefficient of friction of uncoated and coated elastomers in dry and lubricated ball on disc sliding tests: (a) FKM; (b) HNBR; (c) NBR; (d) TPU.
Figure 6.
Coefficient of friction of uncoated and coated elastomers in dry and lubricated ball on disc sliding tests: (a) FKM; (b) HNBR; (c) NBR; (d) TPU.

Figure 7.
Microscopic images of wear tracks: (a) 300 nm Hybrid_B coated TPU; (b) 150 nm Hybrid_B coated TPU.
Figure 7.
Microscopic images of wear tracks: (a) 300 nm Hybrid_B coated TPU; (b) 150 nm Hybrid_B coated TPU.

Figure 8.
Comparison of the COF: uncoated and coated in Ring on disc test. (a) FKM; (b) HNBR; (c) NBR; (d) TPU.
Figure 8.
Comparison of the COF: uncoated and coated in Ring on disc test. (a) FKM; (b) HNBR; (c) NBR; (d) TPU.


Figure 9.
SEM micrographs: wear track of 300 nm DLC coated HNBR (a) and 300 nm Hybrid_A coated HNBR (c,e). Related areas are marked and shown with high magnification (b,d,f).
Figure 9.
SEM micrographs: wear track of 300 nm DLC coated HNBR (a) and 300 nm Hybrid_A coated HNBR (c,e). Related areas are marked and shown with high magnification (b,d,f).


Figure 10.
Scanning electron microscope (SEM) micrographs: wear track of 300 nm Hybrid_A coated FKM (a), 300 nm MoS2 coated FKM (c), 300 nm DLC coated TPU (e,g), and 300 nm MoS2 coated TPU (h). Related areas are marked and shown with high magnification (b,d,f).
Figure 10.
Scanning electron microscope (SEM) micrographs: wear track of 300 nm Hybrid_A coated FKM (a), 300 nm MoS2 coated FKM (c), 300 nm DLC coated TPU (e,g), and 300 nm MoS2 coated TPU (h). Related areas are marked and shown with high magnification (b,d,f).


Table 1.
Parameters of pre-treatment and deposition process.
| Coating | Thickness (nm) | Pre-treatment | Deposition | |||||||||
|---|---|---|---|---|---|---|---|---|---|---|---|---|
| Voltage (V) | Gas flow (sccm) | Sputtering source | Power (W) | Voltage (V) | Current (A) | Gas flow (sccm) | Pressure (mbar) | Rotation (rpm) | Duration (min) | Frequency (kHz) | ||
| DLC | 300 | 3000 | 15 Ar + 5 O2 for 5 min, 20 Ar for 25 min | Graphite | 3000 | 577–578 | 5.21–5.22 | 42 Ar + 8 C2H2 | 2.3 × 10⁻³ | 5.00 | 68 | 80 |
| 150 | 579–582 | 5.22–5.19 | 23 | |||||||||
| MoS2 | 300 | MoS2 | 500 | 462–455 | 1.10–1.15 | 50 Ar | 2.6 × 10⁻³ | 60 | ||||
| 150 | 468–461 | 1.10–1.13 | 30 | |||||||||
| Hybrid_A | 300 | Graphite + MoS2 | C: 3000 MoS2: 54 | C: 602–601 MoS2: 270–258 | C: 4.95–4.93 MoS2: 0.20–0.19 | 50 Ar | 2.6 × 10⁻³ | 65 | ||||
| Hybrid_B | 300 | C: 3000 MoS2: 255 | C: 604–600 MoS2: 402–403 | C: 4.98–5.01 MoS2: 0.64–0.66 | 54 | |||||||
| 150 | C: 602–610 MoS2: 405–404 | C: 5.01–4.96 MoS2: 0.65–0.67 | 27 | |||||||||
| Hybrid_C | 300 | C: 3000 MoS2: 440 | C: 611–606 MoS2: 467–446 | C: 4.95–4.92 MoS2: 0.98–1.04 | 36 | |||||||
Table 2.
Material and thickness of the coatings.
| Material | Thickness (nm) | ||
|---|---|---|---|
| Set Value | Actual Value | Difference | |
| DLC | 300 | 405.0 ± 18.2 | 35.1% |
| DLC | 150 | 113.3 ± 5.8 | −24.1% |
| MoS2 | 300 | 257.8 ± 19.2 | −13.9% |
| MoS2 | 150 | 131.8 ± 7.5 | −12.2% |
| Hybrid_A | 300 | 269.8 ± 14.0 | −9.7% |
| Hybrid_B | 300 | 300.2 ± 8.4 | 0.4% |
| 150 | 116.8 ± 6.0 | −22.5% | |
| Hybrid_C | 300 | 246.3 ± 9.5 | −17.8% |
Table 3.
Spectral fitting parameters.
| Elements | Bonds | Peak Energy (eV) | FWHM (eV) | SF Al [34] | Ref. |
|---|---|---|---|---|---|
| C 1s | C–C/C–H | 284.8 | 1.4 | 1.0 | [33] |
| C–O | 286.0 | 2.1 | [33] | ||
| –COO | 288.4 | 2.5 | [33] | ||
| Mo 3d | MoS2 | 229.0 | 2.0 | 5.6 | [33,35] |
| MoO3 | 232.8 | 1.5 | [33,35] | ||
| S 2p | S2− | 162.0 | 1.4 | 1.1 | [33,36] |
| S22− | 163.6 | 1.4 | [37,38] | ||
| S 2s | – | 226.4 | 2.2 | 1.4 | [38,39] |
Table 4.
Chemical compositions (C, O, Mo, S, and N) of the coatings.
| Sample | Composition (%) | |||||||
|---|---|---|---|---|---|---|---|---|
| C | O | Mo | S | N | MoS2/MoO3 | S/Mo | ||
| MoS2 | MoO3 | |||||||
| 300 nm DLC | 90.1 | 9.9 | – | – | – | – | – | – |
| 150 nm DLC | 89.5 | 10.5 | – | – | – | – | – | – |
| 300 nm MoS2 | 22.4 | 13.6 | 13.0 | 3.5 | 26.5 | 21.1 | 3.7 | 1.6 |
| 150 nm MoS2 | 27.4 | 15.3 | 12.1 | 3.7 | 24.5 | 17.0 | 3.2 | 1.6 |
| 300 nm Hybrid_A | 75.2 | 13.4 | 1.3 | 1.3 | 3.5 | 5.3 | 1.0 | 1.3 |
| 300 nm Hybrid_B | 60.3 | 16.5 | 2.5 | 2.8 | 6.7 | 11.3 | 0.9 | 1.3 |
| 150 nm Hybrid_B | 56.1 | 17.0 | 2.5 | 3.3 | 6.7 | 14.5 | 0.7 | 1.2 |
| 300 nm Hybrid_C | 38.4 | 21.6 | 2.6 | 5.7 | 8.2 | 23.5 | 0.5 | 1.0 |
Table 5.
The average roughness (Ra), mean roughness depth (Rz) of uncoated samples.
| Parameter | FKM | HNBR | NBR | TPU |
|---|---|---|---|---|
| Ra (µm) | 1.00 | 1.03 | 0.61 | 0.44 |
| Rz (µm) | 6.74 | 5.59 | 3.69 | 3.98 |
Table 6.
Thermal parameters of used materials.
| Parameter | FKM | HNBR | NBR | TPU |
|---|---|---|---|---|
| Coefficient of thermal expansion (10−6/K) | 191 | 166 | 165 | 160 |
| Thermal conductivity (W/(m·K)) | 0.24 | 0.15 | 0.26 | 0.06 |
Table 7.
The best and worst coating for each material from ball on disc tests.
| Material | Best Coating | Worst Coating |
|---|---|---|
| FKM | 300 nm MoS2 | 300 nm Hybrid_A |
| NBR | 300 nm Hybrid_A | 300 nm MoS2 |
| HNBR | 300 nm DLC | 300 nm Hybrid_A |
| TPU | 300 nm MoS2 | 300 nm DLC |
© 2018 by the authors. Licensee MDPI, Basel, Switzerland. This article is an open access article distributed under the terms and conditions of the Creative Commons Attribution (CC BY) license (http://creativecommons.org/licenses/by/4.0/).
Share and Cite
MDPI and ACS Style
Wang, C.; Hausberger, A.; Nothdurft, P.; Lackner, J.M.; Schwarz, T. The Potential of Tribological Application of DLC/MoS2 Coated Sealing Materials. Coatings 2018, 8, 267. https://doi.org/10.3390/coatings8080267
AMA Style
Wang C, Hausberger A, Nothdurft P, Lackner JM, Schwarz T. The Potential of Tribological Application of DLC/MoS2 Coated Sealing Materials. Coatings. 2018; 8(8):267. https://doi.org/10.3390/coatings8080267
Chicago/Turabian StyleWang, Chao, Andreas Hausberger, Philipp Nothdurft, Jürgen Markus Lackner, and Thomas Schwarz. 2018. "The Potential of Tribological Application of DLC/MoS2 Coated Sealing Materials" Coatings 8, no. 8: 267. https://doi.org/10.3390/coatings8080267
Note that from the first issue of 2016, this journal uses article numbers instead of page numbers. See further details here.