IRI Sensitivity to the Influence of Surface Distress on Flexible Pavements


Department of Civil Engineering, Ondokuz Mayis University, Samsun 55139, Turkey
Coatings 2018, 8(8), 271; https://doi.org/10.3390/coatings8080271
Submission received: 23 June 2018
/
Revised: 19 July 2018
/
Accepted: 28 July 2018
/
Published: 2 August 2018
Abstract
:Today, authorities responsible for the operation of highways aim to provide comfort to road users as well as safety while driving. While driving, the most important component that determines comfort for road users is the pavement. The relative effects of various surface distress types in bituminous, hot mixed asphalt pavements on the International Roughness Index (IRI) component—used to evaluate the present performance, and hence the comfort, of pavements—are determined in this study. The presence of only one type of surface distress is very difficult to achieve in practice, especially in regards to pavements where a high degree of deterioration is observed. The presence of different types of surface distress in road pavements, due to similar problems in very close positions and even in nested forms, makes it difficult to assess this issue. The relationships between surface distress and IRI have been modelled to overcome this challenge. To this end, the Multivariate Adaptive Regression Splines (MARS) modelling approach, which is very successful in investigating the relationships between a large number of independent variables and dependent variables, has been used. The sensitivities of the surface distress inputs are evaluated singularly by means of a model with 29 input variables calibrated using the pavement distress data collected in 3295 highway pavement sections. As a result of this analysis, the sensitivity of surface distress inputs collected, as an area, has been determined to have an effect on the increase in IRI. The results are interpreted with the help of figures and tables.
1. Introduction
Highway pavements are constantly deteriorating under the combined impacts of traffic loads and climate. The concept of pavement performance, which is used to express the current situation and amount of deterioration, is defined as the ability to explain the effects of deterioration on caused by traffic and climate during the design life [1]. Pavement distress (cracks, permanent deformations, water-induced distress, etc.) is a very important group of parameters for assessing existing service levels. Regionally, knowledge of the relationship between surface distress and roughness seen in pavements provides very useful information, both for the efficient operation of pavement management systems (PMS), and in the accurate construction of required pavement design analyses.
In the literature, relationships between roughness (expressed as a value in the international roughness index, IRI) and pavement deterioration parameters are investigated using statistic-based modelling techniques, such as linear and nonlinear regression analyses, frequently. It is used to evaluate distress in dozens of different types of pavements and the severity of the distress identification guidelines used for the evaluation of pavements. Therefore, to express a dependent variable within a large number of independent variables, this traditional method is not able to capture relationships with the desired precision. Nowadays, there are also different modelling techniques that can provide meaningful results for the extreme values (high or low) of independent variables and provide complex relationships between data stacks, which also provides practical convenience in modelling with a large number of independent variables. Examples of these are the Artificial Neural Networks (ANN) method, which does not require any assumption of functional distribution similarity of calibration data, and the Multivariate Adaptive Regression Splines (MARS) method, which is similar to the partial regression method.
The studies that model the relationship between surface distress and roughness are observed when the literature is examined. Hozayen and Alrukaibi developed regression relationships based on logical and statistical criteria based on the relationship between roughness, the pavement condition ratio (PCR), cracks, rutting, and raveling [2]. Researchers have considered only three distress patterns in response to the pavement performance indicators IRI and PCR. Al-Omari and Darter examined the regression equations between IRI and the pavement serviceability ratio (PSR), which are performance indicators in their studies [3]. Additionally, they investigated the relationships between IRI and rutting, deformations, patches, and cracks (four types of distress) by their regression analysis. Therefore, they determined that a linear relationship is formed between IRI and rutting by combining data (making homogenized sections). Aguiar–Moya et al. [4] developed a mechanistic-empirical regression model with IRI, longitudinal and transverse cracking, block cracking, fatigue cracking, and rutting, as well as an independent variable for pavement age, precipitation rate, and the mix design parameters. Five surface distress types were taken into consideration. Mactutis et al. [5] developed a linear regression model between IRI and the mean rut depth and the crack percentage seen on an evaluated surface. To determine the performance change in the model, the measured IRI values were used as input variables. Sandra and Sarkar, in their study, created a linear regression model between IRI and five types of distress, such as cracking, potholes, raveling, patching, and rutting [6]. Dependent variable estimations were made in addition to a total of fifteen independent variables, which takes into consideration the three different severities of the mentioned types of distress, low, medium, and high. Therefore, it ensured that the model was able to evaluate with sensitivity, regarding the pavement surface evaluation principles described in the distress identification manuals, while also considering the severity levels of distress. The MARS technique, which can be used in combination with repetitive partial fitting and curve fitting techniques from modelling techniques, is also used to investigate the relationship between pavement performance data and surface distress data. Attoh–Okkine et al. [7], to estimate the IRI dependent variable, developed a prediction model using six independent variables, four of which being surface distress data, such as cracks, environmental factors, age, standard deviation of mean rut depth, and patching.
Moreover, from recent studies, Chandrakasu and Rajiah [8] determined the relationship between cracks and pothole distress, and IRI in roads with a low traffic volume. The linear regression technique was used in the modelling studies and the calibration of the model, with a very high regression coefficient (0.814), was completed. Chadra et al. developed models using regression and ANN approaches between IRI and five types of surface distress, including rutting, cracks, potholes, patching, and raveling [9]. Different severity levels of surface distress types are ignored. Through comparing the estimation capabilities of the models created in the study, it was concluded that the most appropriate method is ANN. Mahmood et al. [10] developed a model that can estimate the pavement condition index (PCI) using long-term pavement performance data (LTPP). Cracking length, cracking area, overlay thickness, age, and the equivalent single axle load (ESAL) data were used as independent variables in the study. During the analysis, the relationships between dependent variables and independent variables were investigated using deterministic and probabilistic modelling techniques. Zhou et al., in their study [11], made evaluations using the analytic hierarchy processes (AHP) between 14 different types of surface distress and PCI. As a result of the study, three new evaluation indexes were proposed, which can be used in practice, including the Transverse Cracking Evaluation Index (TCEI), the Pavement Patching Condition Index (PPCI), and the Pavement Surface Distress Condition Index.
Studies using the approach of ANN in the investigation of the relationship between surface distress and performance are also striking. Lin et al. developed a model, using the ANN technique, capable of IRI estimation with fourteen surface distress inputs, including the road level, left rutting, right rutting, alligator cracking, cracking, digging/patching, potholes (mild and severe), patching, bleeding, corrugation, stripping, and man-holes (mild and severe) [12]. The study is one of the rare studies that used a large amount of data as input. Additionally, researchers have examined the sensitivity of changes between IRI and each surface distress.
Moreover, regarding the development of prediction models, there are studies that take into consideration many different parameters other than the surface distress affecting the performance of pavement. During these studies, it was observed that artificial intelligence techniques are frequently preferred due to the large number of independent variables and the fact that some variables cannot be expressed with numerical values. It was seen that the ANN [13,14,15,16] and the fuzzy logic [17,18,19] approaches, which are quite good for the convenient evaluation of numerical and verbal data, and the Adaptive Neuro Fuzzy Inference System (ANFIS) [20] approach, which uses both methods together with fuzzy logic and ANN approaches, are very frequently preferred by researchers.
While the surface condition of the pavement gives a lot of information about its current level of performance, obtaining the data requires rather difficult field studies. Innovative approaches applied to simplify field studies are also noteworthy in the literature. Kırbaş and Karaşahin [21] developed prediction models that can determine the pavement condition index (PCI), which is a performance indicator calculated with the help of the pavement surface distress data, through the vibrations that occur in the vehicle. Lantier et al. [22] developed a method that can measure the longitudinal and transverse direction slope, evenness, and the depth of water on the pavement surface, with a mobile laser scanning technique. Suanpaga and Yoshikazu [23] designed a method, with the help of Phase Array type L-band Synthetic Aperture Radar (PALSAR) images, to help determine the IRI values of pavements. It is emphasized that field studies can be completed entirely with the development of this method. Conversely, there are methods developed to determine the types, quantities, and locations of pavement distress by means of vibration meters, laser scanners, and road surface display devices that can be placed on vehicles [24,25,26,27]. Dondi et al., in their study [28], proposed a semi-automatic method which can evaluate the surface data obtained by laser scanning and video imaging methods together.
As can be found in studies related to the subject, many different mathematical modelling methods are used in the modelling of the relationship between IRI and surface distress, and a significant mathematical relationship can be obtained between them. However, studies that can expose the sensitivity of the effects of surface distress on the IRI and their changes are very limited.
Mathematical relations between pavement surface distress types and surface roughness are investigated, in the current study, by using the MARS approach in bituminous, hot mixed asphalt (HMA) pavement. Regarding the model developed, ten surface distress types, including alligator cracking, bleeding, block cracking, corrugation, depression, longitudinal and transverse cracking, patching, potholes, rutting, and raveling, as well as a total of twenty-nine individual variables, with differing severity levels of distress, are taken into consideration. Pavement distress and IRI data collected in 3295 highway sections used as rural principal intercity arterial routes are used. As a result of the study, the impacts of the various types of surface distress and the different severities, which are the inputs of the developed model, are evaluated through synthetic input values. Consequently, the increases in sensitivity levels on the IRI according to the distress type, evaluated by area (unit of measure), are determined.
2. Materials and Methods
Surface distress and International Roughness Index (IRI) measurement data of 3295 evaluation sections (totaling about a 330 km length of pavement section) for ten different highways, in the class of rural principal intercity arterial function, with bituminous hot mixture coating, were used. The 2009 model profile instrument, belonging to the Turkish Republic of General Directorate of Highways (KGM), which is responsible for the operation of the roads, was used in the measurements. Using the profilometer in the measurements, IRI, ride number (RN), rut depth, macro surface texture and road geometry (IMS), and global position (DGPS), data according to the ASTM E 950 standard was collected [29]. However, since the relationship between pavement surface distress and IRI was examined in the study, the other data recorded by the profilometer was not taken into consideration.
2.1. International Roughness Index (IRI)
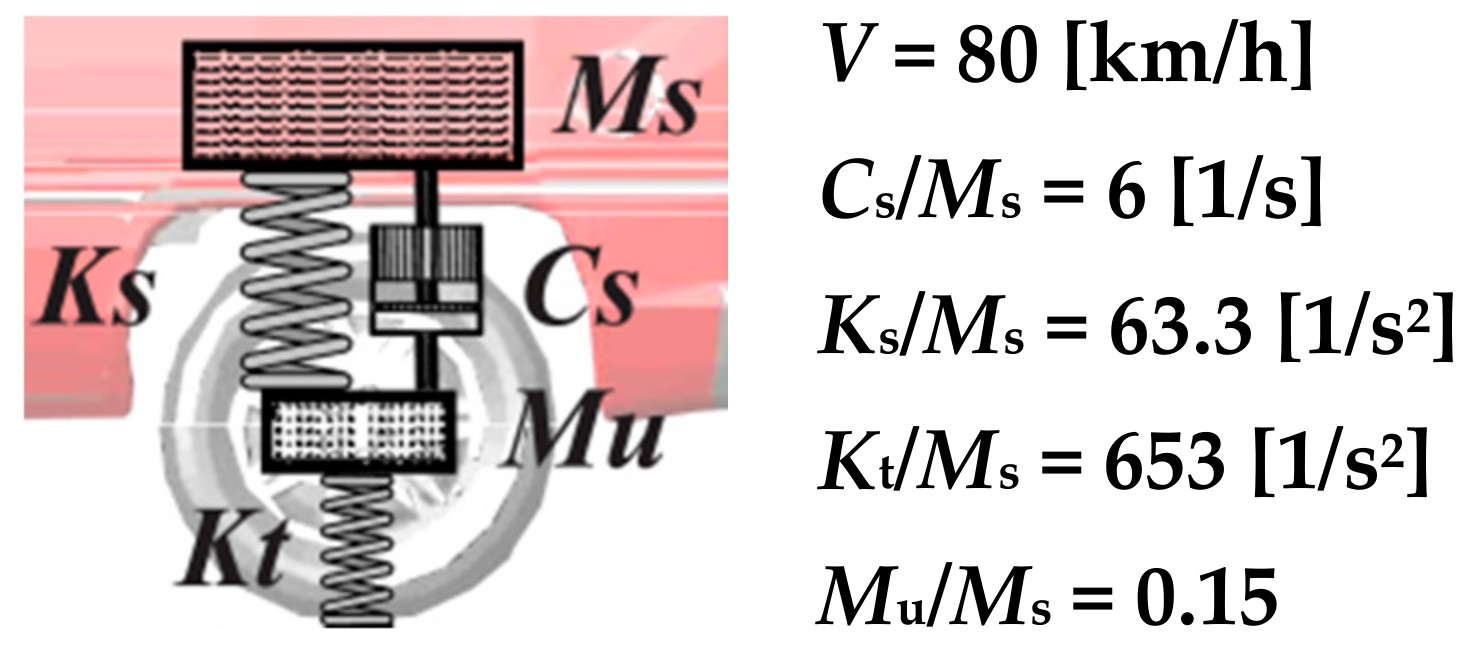
The unevenness of a pavement surface is generally referred to as “roughness”, and is defined as the variation of the distances of the reference points on the surface from an ideal reference plane [30]. Roughness can be measured using different methods, such as, with portable slope meters, response-type road roughness meters, and various other profile measuring instruments. Today, the profile measurement method is widely used by means of remote sensors (laser or ultrasonic sensors). Using this method, the distance between the road surface and the measuring bar, and the relative displacements of an inertia reference system are measured by means of bar-mounted accelerometers and are evaluated [31,32]. All these measurements can be made with sensors mounted on a platform with a vehicle traveling at a relatively high speed. Generally, the vertical profile of the pavement is measured along two lines per lane, corresponding to each wheel trace of a vehicle [32]. The International Roughness Index (IRI) was established by the World Bank in 1986, and was developed to evaluate the roughness of the pavement and therefore its driving comfort [20]. The IRI value is determined by appropriately measuring the profile of the pavement, followed by the processing of roughness inputs through an algorithm that simulates the sum of the displacements of a reference vehicles suspension [33]. The response characteristics of the suspension of the reference vehicle are simulated using a simple dynamic model known as a quarter-car model and is characterized by five constants. Taken from these constants, Cs represents the suspension damping rate, Ks the suspension spring rate, Kt the tire spring rate, Ms the sprung mass, and Mu the un-sprung mass [34]. Figure 1 shows the graphical representation and model constants of the quarter-car model.
The dynamic characteristics of suspensions were determined by the standard of the quarter-car model, which is widely used for IRI interpretation. Hence, associating a real vehicle with the suspension reactions does not give the correct results. The principles of measuring the profile used to calculate the IRI expressed in a slope unit are described in the ASTM E950 standard [29]. Furthermore, the calculation of the IRI value can be performed with the aid of a simplified algorithm proposed in ASTM E1926-98 [35]. PROVAL package software was used in the evaluation of the measurements in the study.
2.2. Field Studies
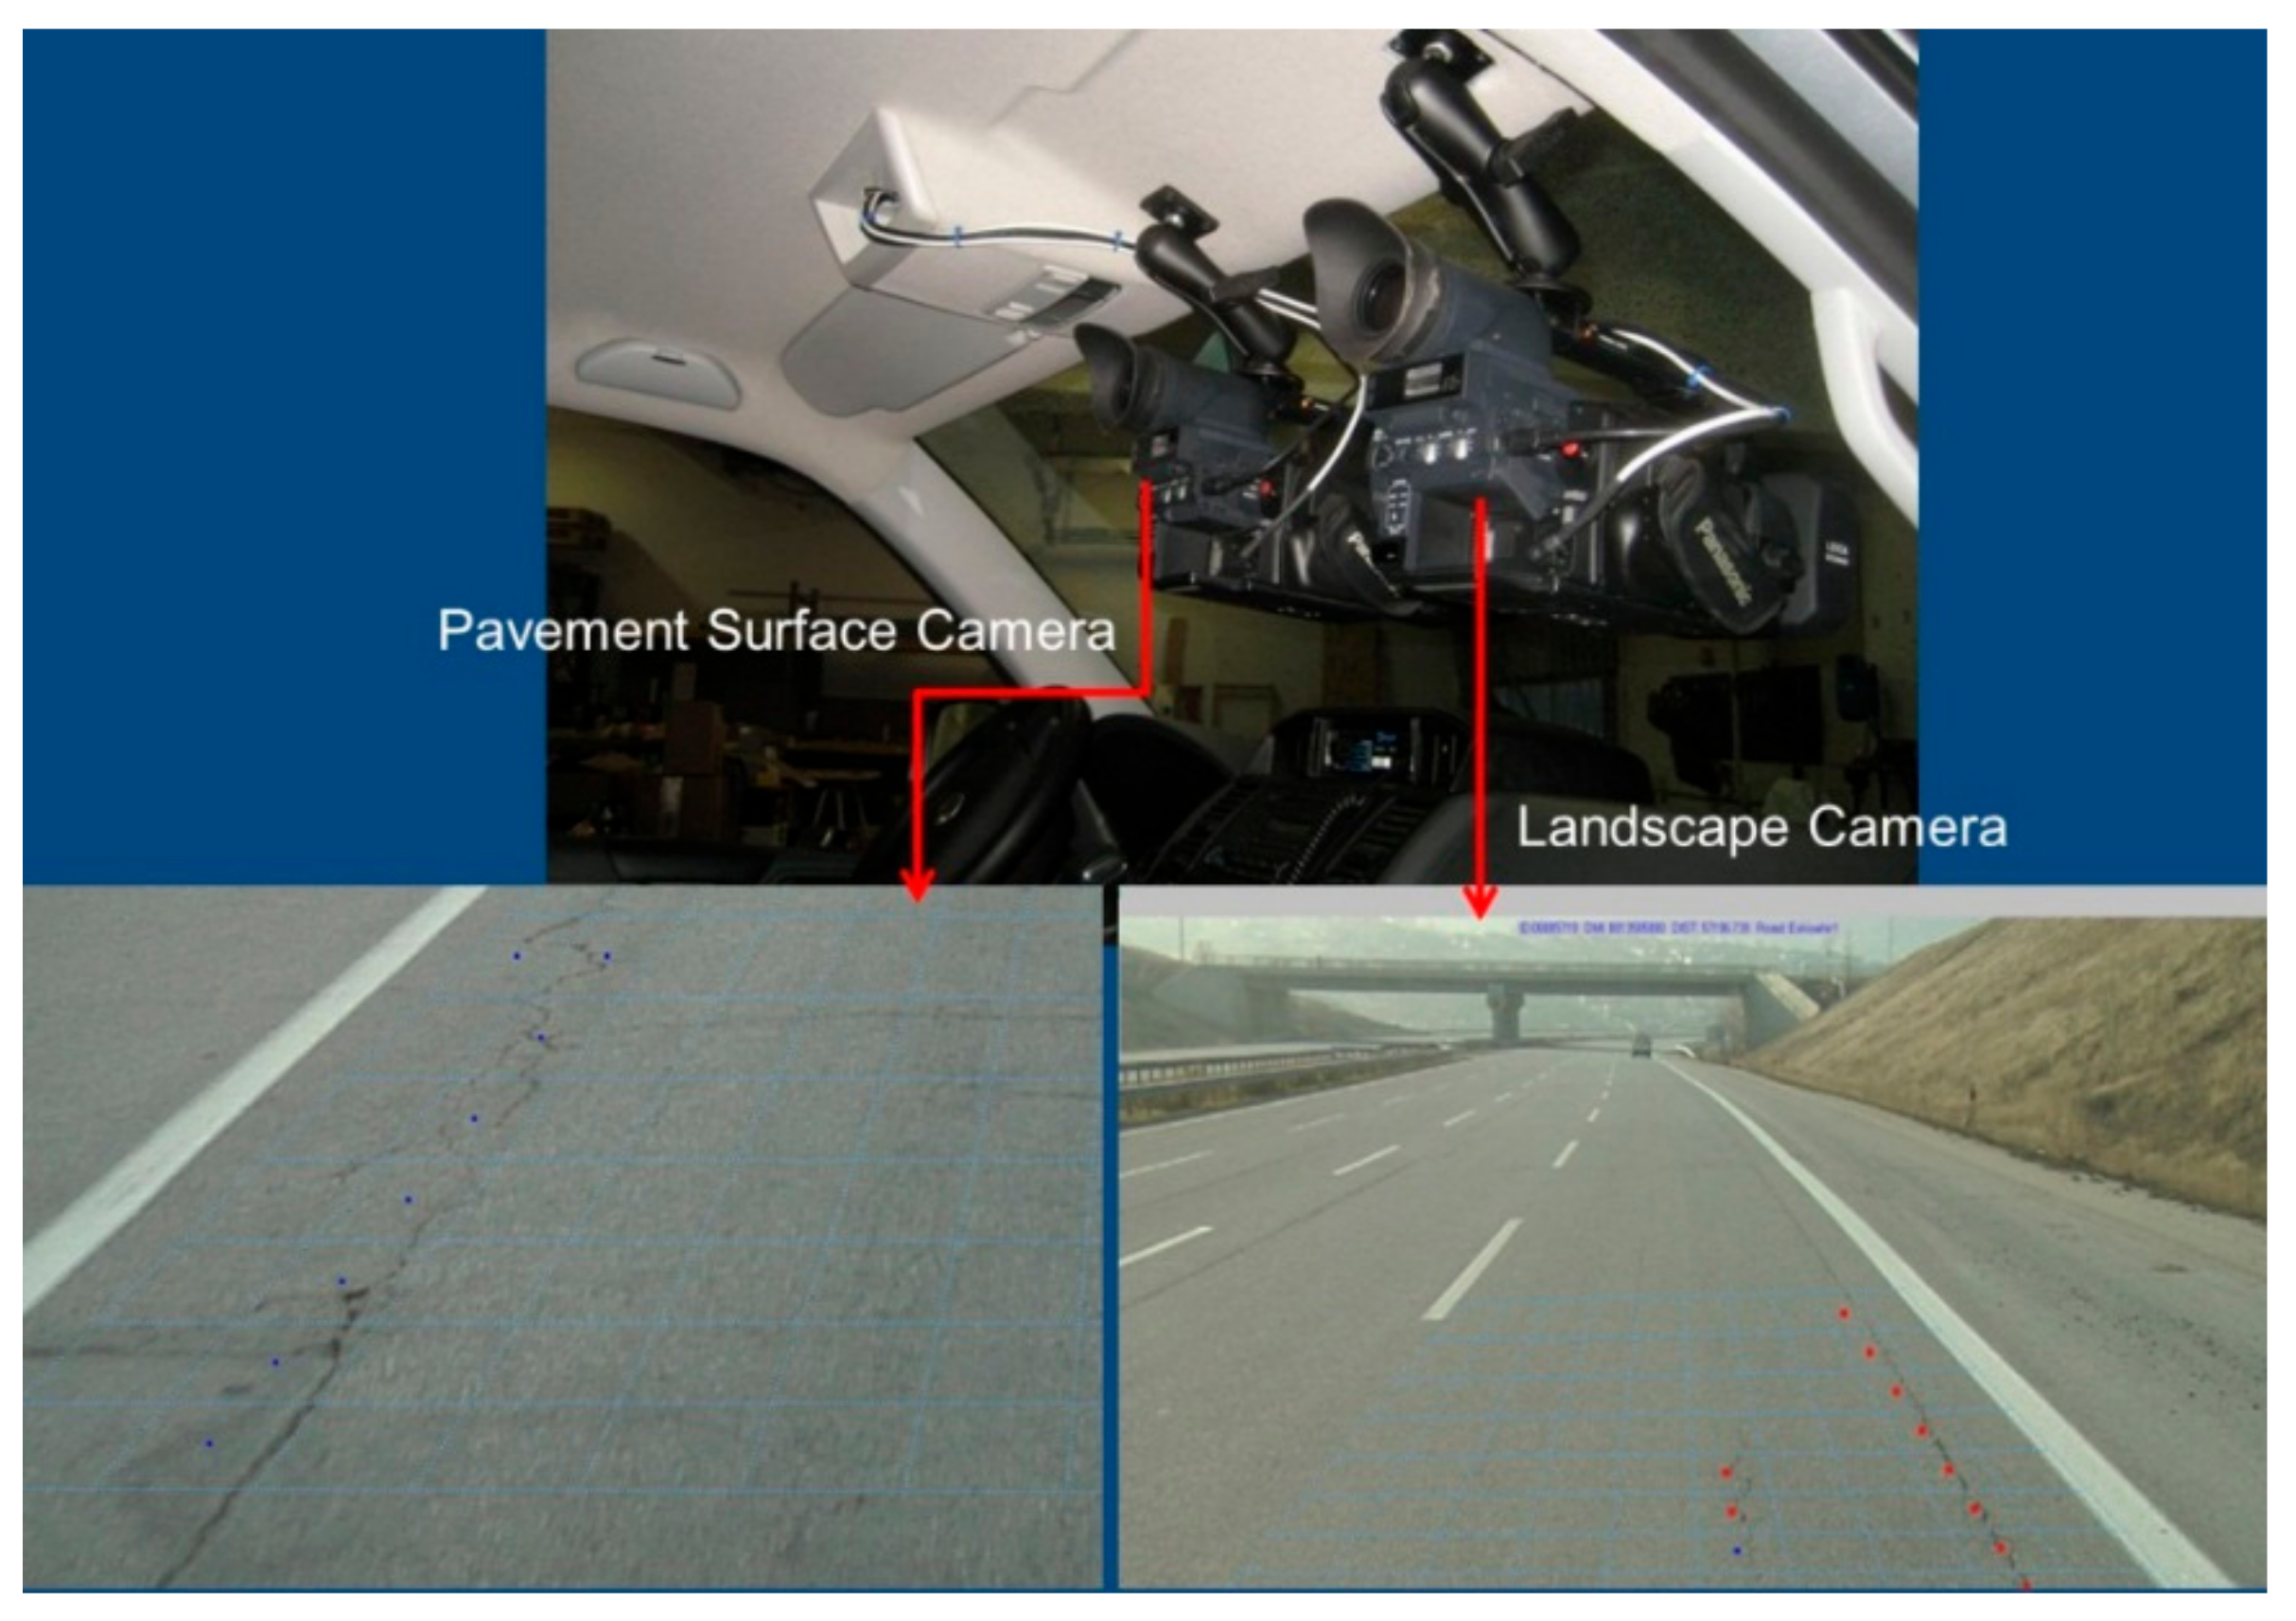
Simultaneous surface distress data was obtained with International Roughness Index (IRI) data by analyzing the surface image data of the pavements with three high-resolution (HD) cameras installed in the vehicle. The information received by the three cameras installed in the vehicle was recorded simultaneously by the data processing systems. One of the two cameras (13× convergence, F1.6 (f = 4.2 mm–55 mm)), which was placed on the vehicle's front window, was a detail video camera optimized to ensure that all surface distress seen on the pavement surface could be viewed with a 2 mm crack width sensitivity. Road surface images (photos) were recorded at intervals of 20 m, in consideration of the optimum camera vision range in order to obtain 2 mm crack width sensitivity. The second camera was the landscape camera and was set to display the road’s environment interaction information in real-time and at a wider viewing angle. The third camera was at a lower resolution than the other two and was used to record the instantaneous state of the profilometer vehicle and the short information of the operators during the measurement. The determination of surface distress was achieved by the technical personnel of KGM by using image processing software of 20 m detail images recorded by cameras and by measuring the markings of distress on the computer environment. The cameras used and the measurement method is shown in Figure 2.
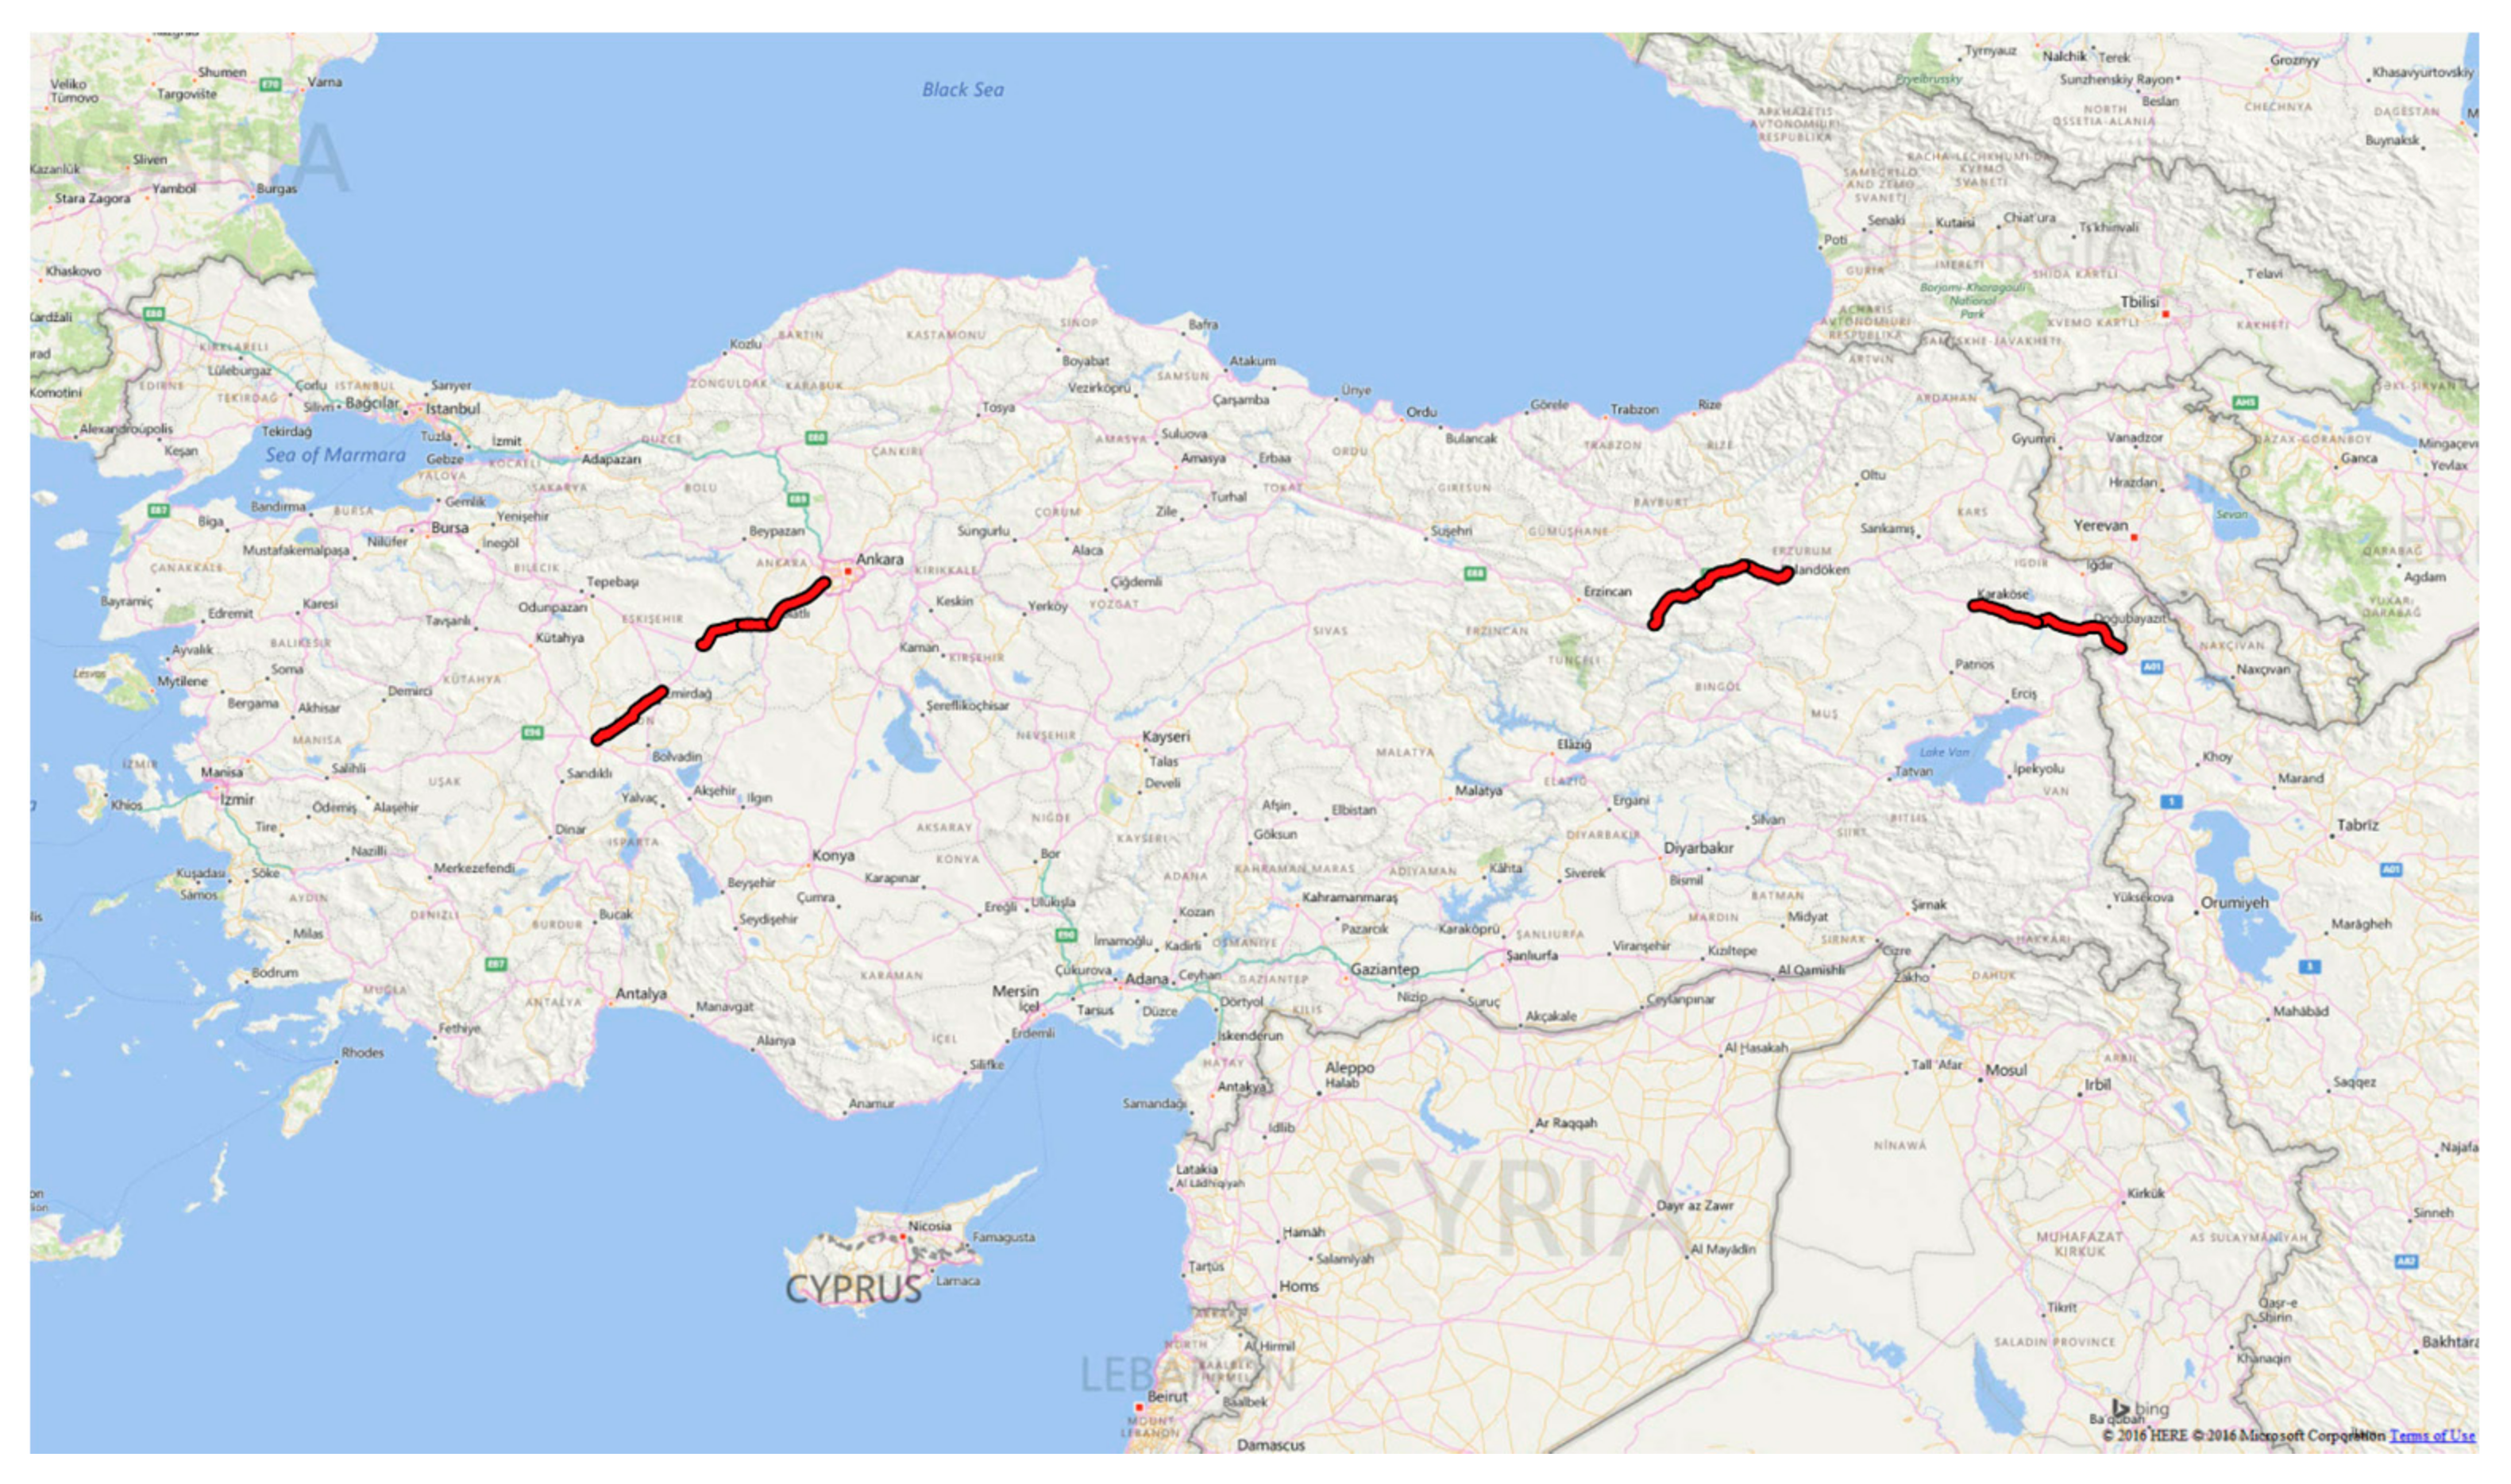
During the evaluation of pavement surface distress data, the surface evaluation criteria prescribed by the PAVER system were taken into consideration [36]. Surface distress and IRI measurements were made in the right traffic lane, which was considered to represent the overall traffic lanes on the platform, by accepting a 3 m lane width. Regarding this assumption, 100 m long road sections with a width of 3 m were considered to be sample areas and 300 m2 surface areas were formed as the sample unit of the PAVER system. Approximately 330 km of Hot Mixed Asphalt (HMA) coated highway section were evaluated, in other words, pavement surface distress evaluations and IRI measurements were carried out in 330 different pavement sections (3295 different sample units) defined according to the PAVER system. The geometries of road sections, which were evaluated as pavements within the scope of this study, are shown in Figure 3.
Table 1 shows the highest annual average daily traffic (AADT) data, the heavy vehicle percentage in traffic, and the highest and lowest temperature data observed in order to explain the climate in which the evaluated road sections were located during the years when the measurements were made.
2.3. Evaluation of Pavement Distress
The PAVER distress identification system, which is considered as a criterion for evaluating pavement distress, is based on the principle of evaluating surface distress data collected in the area of 225 ± 90 m2 (sample unit) on the pavement surface—as defined in the ASTM D 6433-11 coded standard (for hot mixed asphalt coated pavements) [36]. Using the distress identification guidelines adopted by the system, 20 different types of distress, each expressed by a different code value, are categorized at low (L), medium (M), and high (H) severity levels for HMA pavements [37]. The distress types described by the standard ASTM D 6433-11 are shown in Table 2.
Table 2 shows that the formation of surface distress in the PAVER system can be reduced to three basic reasons: Load, climate, and other reasons. It is known that load-induced distress is caused by dynamic loads transmitted from vehicle wheels, while climate-induced distress is caused by environmental effects such as rainfall, frost, and temperature fluctuations during certain periods of time. Construction errors that occur during the construction of pavements and not noticed during inspections, design errors that cannot be detected during the design of pavement, damage by solvents and equipment used in anti-icing techniques, the effect of assets from environmental organic origin (tree leaves, sap, etc.), and damage caused by vehicle operation (fire, leaks, etc.) can be regarded as other causes of distress [37]. When the types of distress summarized in Table 2 were examined in detail, it was seen that 18 types of distress were evaluated at three different severity levels (L, M, and H), one type of distress at two different severity levels (M and H), and one type of distress at one severity level. Added to this, 14 types of distress were collected as area data, five types of distress as length data, and one type of distress as number data.
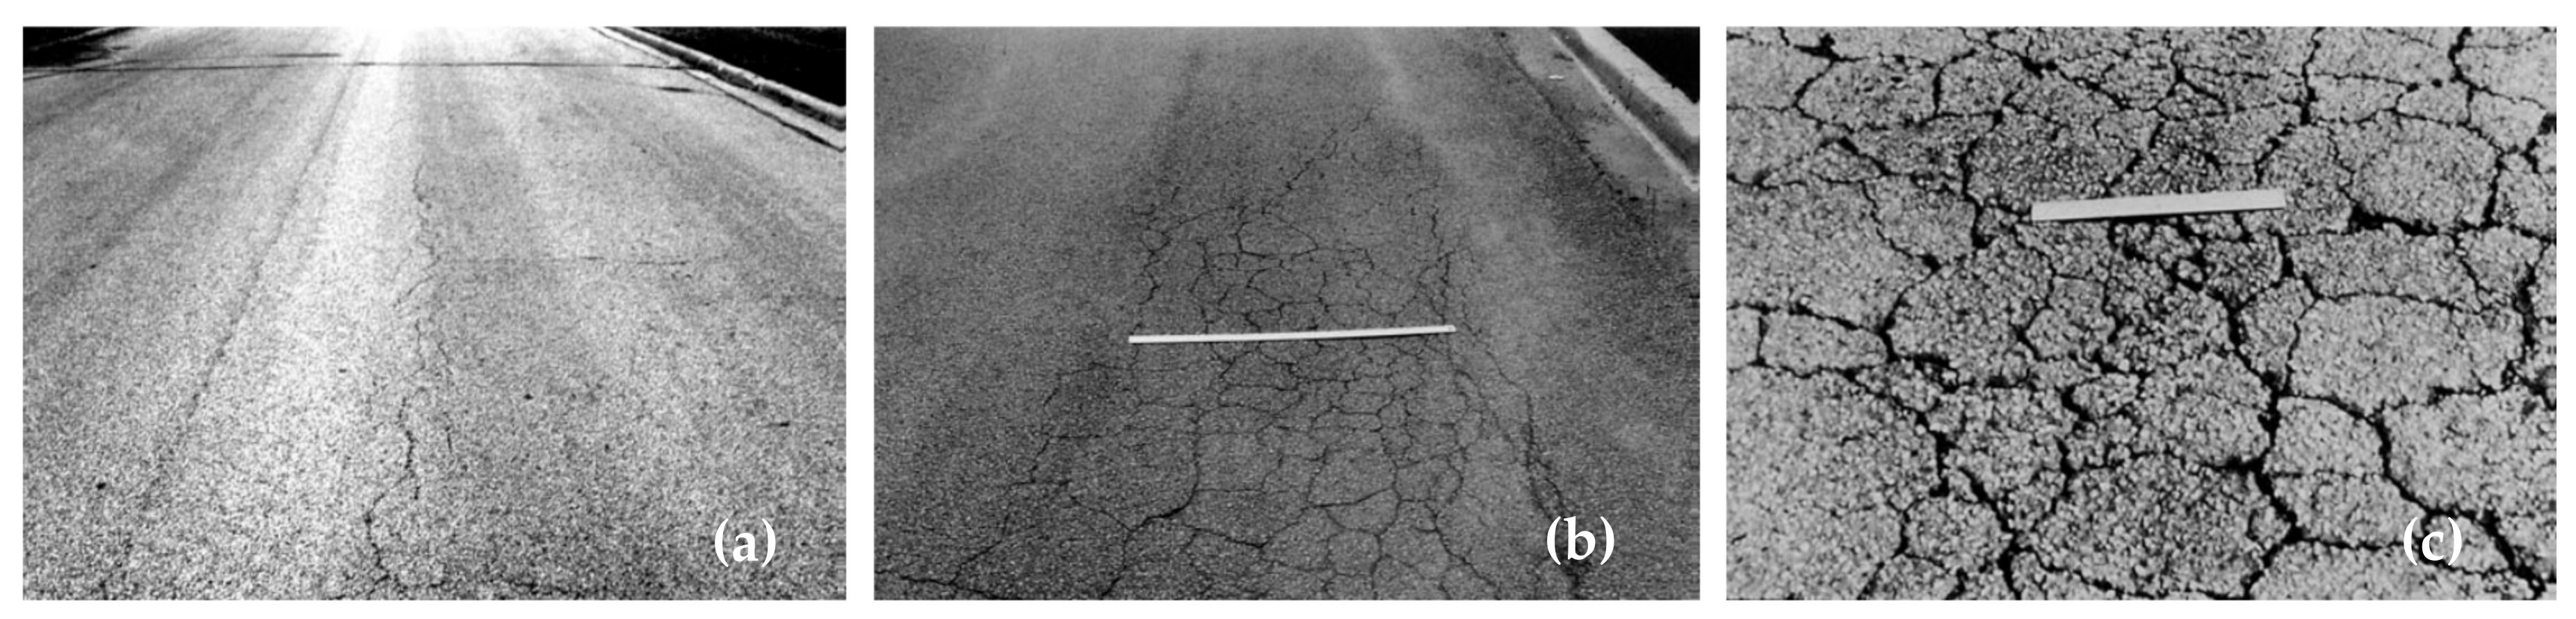
Each type and severity level of distress is explained with brief technical information, such as crack widths, depression depths, and bump heights, in the standard. Additionally, comparative verbal expressions and photographic descriptions to help identify the differences between the distresses are shown separately for each type and severity level. To illustrate this, the photographs used in defining the alligator cracking for each severity level are shown in Figure 4. Emphasis is placed on how to measure the degree and type of impairment.
Pavement surface distress measurements were completed using the measurement units defined by the standard. Independent variables were standardized to increase the estimation ability of the model since there were three different measurement units, namely, the recommended area, length, and number in the standard, as well as relatively large differences in the measured values. As foreseen by the system, the standardized quantity of distress (SQD) values were obtained by dividing a surface distress data by the size of the sample unit and enlarging the result by 100 times. This notion is expressed as Equation (1):
During the surface evaluations, ten different pavement surface distress type data, including alligator cracking, bleeding, block cracking, corrugation, depression, longitudinal and transverse cracking, patching, potholes, rutting, and raveling, as defined by the standard, were found in the evaluated highway sections. During the study, when the severity levels of distress were taken into consideration, data from a total of 29 different surface distresses were collected in the surveyed road sections. The differences between each independent variable and the dependent variable were examined statistically before the modelling analysis, since many variables were used. The t-test was used to compare the mean of two groups and to determine whether the difference was statistically significant or incidental. Table 3 shows the significant differences between surface distress and IRI values.
Considering the 95% confidence level, all evaluated distress data had a statistically significant relationship with IRI.
2.4. Multivariate Adaptive Regression Splines (MARS) Approach
The Multivariate Adaptive Regression Splines (MARS) technique is a modified method that can take advantage of the positive aspects of both repetitive fractional regression and curve fitting methods. This technique allows for the development of robust predictive models by reducing the negative features of both methods. This purpose is achieved by a certain trade-off between the two methods [38]. The MARS technique has been successfully applied in many different fields in recent years. The MARS algorithm is based on the principle of truncated linear partial function expansion. This situation is summarized in Equation (2):
where, represents the expression “max (0, q)” and τ represents a single variable knot [39]. The MARS algorithm explores interactions between all variables and knot (node) locations for all possible partial linear representations. The approach is very similar to curve fitting algorithms. The general form of the MARS method can be seen in Equation (3):
where P is the independent variable and B is the basic function. The basic functions max (0, x − H) and the max (0, H − x) are expressed by these two univariate equations and, if the β coefficients are 0, only one equality is sufficient. The H values are called “knot” or “node” [40]. This method, which separates the data stacks by regions via knots, can deactivate the independent variables in required cases and at certain limits—as opposed to the regression analysis. As a consequence of this, if the independent variables that have extreme values are used as the model inputs, it is possible to prevent the occurrence of meaningless result (estimation) values. This is considered to be one of the major advantages of the MARS method.
The MARS algorithm eliminates the basic functions that reduce the predictive accuracy of the model by a stepwise regression process, while investigating the model constants for the basic functions with a stepwise progression process in the determination of knots. Based on the generalized cross validation criterion (GCV), the adjustment measure of the knots is determined. The GCV criterion is determined by the multiplication of the mean residual error by a penalty adjusted for the variability associated with the prediction of more parameters in the model [7]. It is similar to the learning stage of a multi-layered Artificial Neural Network (ANN) [41], in terms of a training principle. However, unlike ANN, it does not generalize the data, and protects itself against over-fitting during stepwise regression, during which, new components entering the model are regulated [42].
2.5. Modelling of Relationships between Surface Distress and International Roughness Index
Mathematical relations were investigated between 29 types surface distresses, which had statistically significant relationships, and the International Roughness Index (IRI) using the Multivariate Adaptive Regression Splines (MARS) modelling approach. A prediction model was established between pavement surface distress data and IRI. The mathematical model is in Equation (4). The basic functions (BF), represented by the variables in the model, are shown in Table 4.
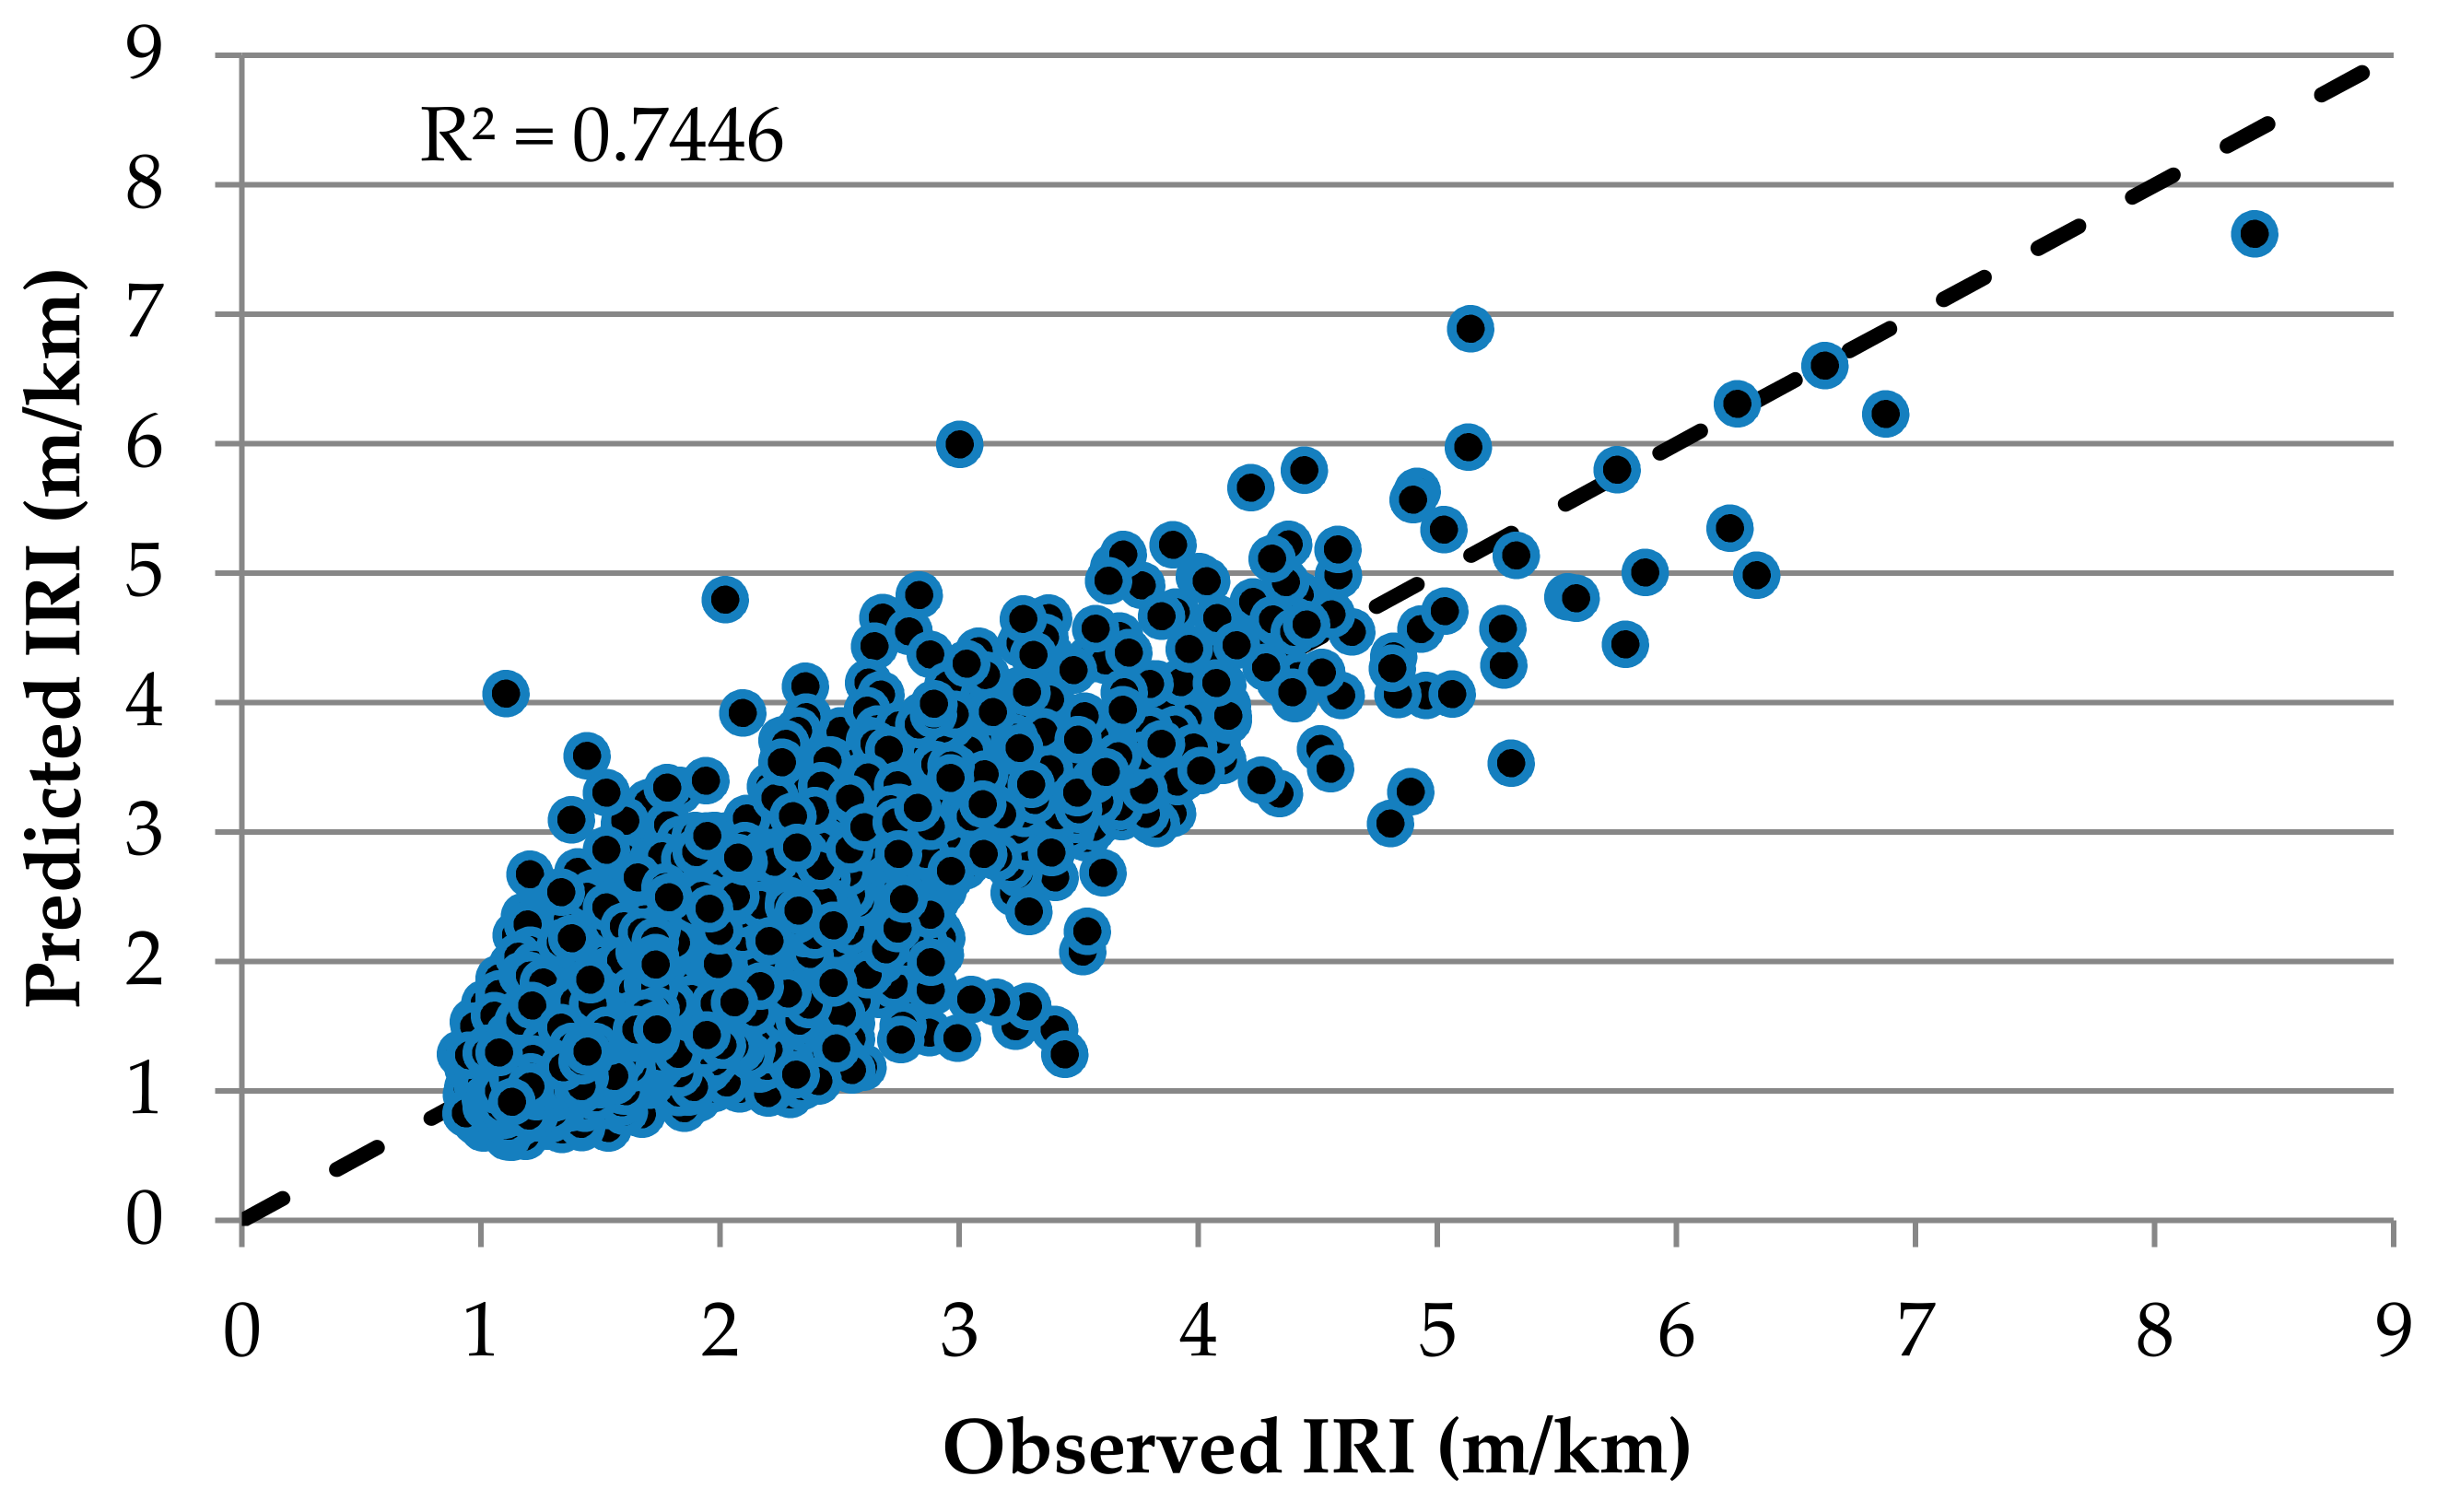
The mathematical model is comprised of 67 basic functions, with 29 independent variables and one dependent variable. An analysis of the model was completed with a 0.227875 GCV error using a 0.0005 threshold value. The regression coefficient (R2) value of the model, which is assumed to show the accuracy of estimation, was found to be 0.7446. It is clear that this mathematical modelling technique, which optimizes the distribution of the data in a curve fitting form by determining knots at the most appropriate points, can determine the IRI values. The regressions statistical values of the developed model are shown in Table 5.
When the coefficients of the mathematical model were examined, similar to the regression model, it was observed that the relative 5L, 10L, and 15M distress types had a higher number of basic functions than the others; in other words, these distress types were more impactful on the IRI. The analysis of variance (ANOVA) decomposition of each independent variable for this prediction model is shown in Table 6.
IRI values observed and predicted by model are comparatively shown in Figure 5.
3. Results
The introduction section of the study emphasized that there are various mathematical approaches to modelling the relationships between the International Roughness Index (IRI) and surface distress. Found in similar studies, IRI prediction models were developed with various quantities of pavement distress being used as input components, and the studies were terminated. Adding to similar studies, in this study, the sensitivity of pavement distress inputs to changes in IRI values were determined with the help of the model developed using the Multivariate Adaptive Regression Splines (MARS) method. The increased rates of IRI value in the current study were determined by changing only one input variable (surface distress data) and keeping the others constant in the model developed. The results were visualized and interpreted using graphics.
The surface distress data was collected according to the distress identification procedure of the PAVER system. Distress input data were standardized using a standardized quantity of distress (SQD) to eliminate the different sample unit size parameters examined according to this system. Hence, in the system, pavement distress types were collected in three different dimensions, including the area, length, and number. It is clear that it would not be right to compare the effects of the types of distress collected in different dimensions (such as length versus area) to the IRI increase, since all distress inputs were standardized by the same mathematical expression. Therefore, pavement distress with only area measurement units, such as: (1) alligator cracking; (2) bleeding; (3) block cracking; (5) corrugation; (6) depression; (11) patching; (15) rutting; and, (19) raveling, were evaluated.
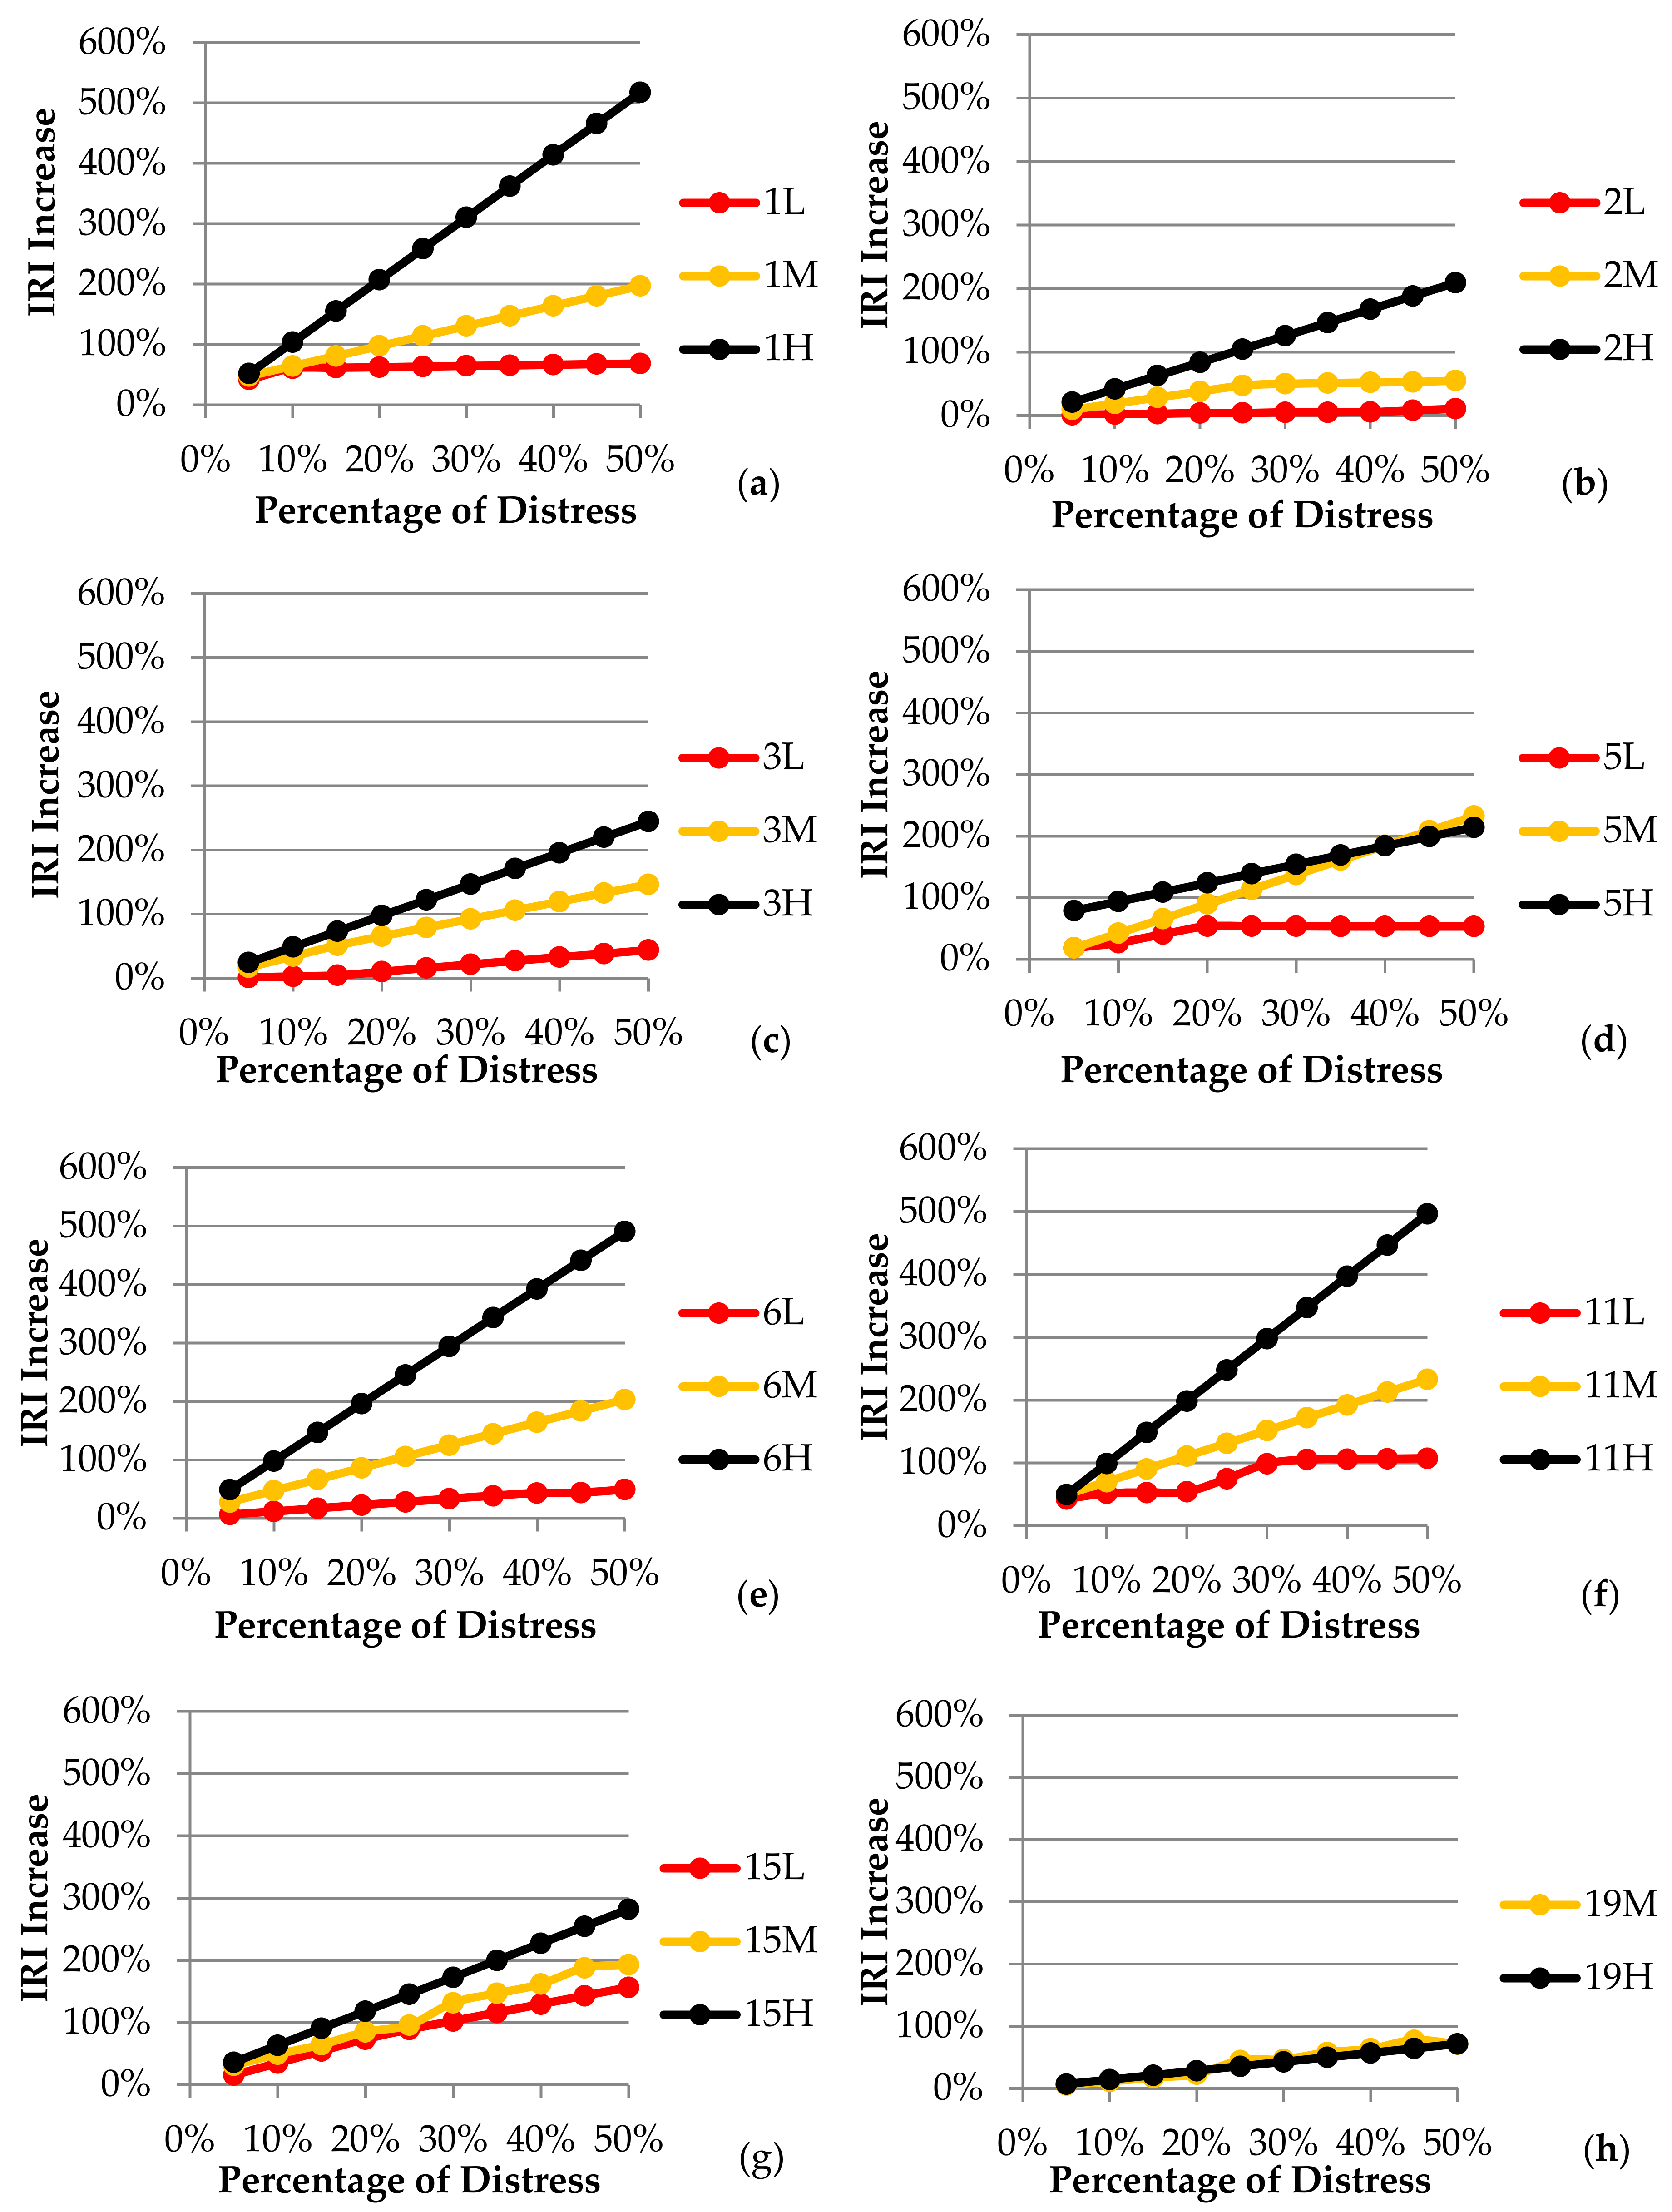
The co-occurrence of different types of distress, severities, and quantities is actually quite common. This is particularly noticeable in sections where the quantity of distress is excessive. It is not expected to encounter the same type and severity of distress in the entire sample unit of an examined pavement. Therefore, the likelihood that the distress evaluated in the eight different types of area measurement units mentioned would occur between a ratio of 5% and 50% on the surface of the pavement—this was taken into consideration. Concerning each of the different severity measures of the distress examined, the effect on the IRI increase versus the various occurrence rates of distress on the pavement surface is shown in Figure 6.
Figure 6 shows the vertical axes of figures that were adjusted to show the same values in order to compare the effects of pavement distress on IRI increases in terms of different types of distress. It is seen, from all the types of distress examined, that the highest increase in IRI was caused by high severity, followed by medium, and then low severe distress types. It is noteworthy that, for all types of distress, if there was a small quantity of distress in the surface area evaluated (including at different levels of severity), the IRI increases were very low and similar to each other. Nevertheless, in the evaluated surface area, the highest-severity alligator cracking, depression, and patching-type distress were seen to cause an increase in the IRI. It is noted that this increase was up to 500% in the IRI, since the distress occurred in about half of the evaluated area. The assessments for each type of distress are listed below:
- (Figure 6a) The alligator cracking caused a 50% increase in IRI in all severities of distress, if the distress occurred at 5% of the evaluated area. However, if the distress was seen in 50% of the area, it caused an increase in value of about 70% in low severity, 200% in medium severity, and 500% in high severity.
- (Figure 6b) During cases of bleeding-type distress, an increase in low severity by 1%, moderate severity by 9%, and high severity by 21% occurred in IRI when 5% of the distress was seen in the evaluated area. However, if it was observed in 50% of the evaluated area, low severity caused an increase in IRI by 11%, moderate severity by 55%, and high severity by 209%. It is remarkable that there was about 20 times the difference between low-severity distress and high-severity distress in the IRI increase.
- (Figure 6c) IRI was relatively less affected by block cracking-type distress, which was the result of combined states of longitudinal and transverse cracks. When observed at 5% of the evaluated area, low severity caused an increase in IRI by 1%, moderate severity by 17%, and high severity by 24%. Conversely, if it was seen in 50% of the surface area, it caused an increase in the IRI by 44% in low severity, 146% in medium severity, and 244% in high severity. Moderate and high severity distress led to a much greater increase in the IRI than low severity distress.
- (Figure 6d) It is known that the corrugation-type distress, such as a signal waves, result in a disturbance in the transverse direction of the highway pavement. When the distress was observed in 5% of the evaluated area, it was understood that there was an increase in IRI by 18% from low severity, 18% from moderate severity, and 79% from high severity. It is noteworthy that high severity distress resulted in a significant increase in IRI, while low and moderate distress caused a very insignificant increase, according to the model's conclusions. When the distress was observed in 50% of the evaluated area, an increase in IRI value was seen in low intensity by 53%, moderate intensity by 232%, and high intensity by 214%. The difference in the IRI increase that occurred when the distress was seen in the small area shrunk considerably in comparison to the large area. Moreover, the increase in IRI was very close to each other for moderate and high severity distress. The fact that the medium severity IRI increase rate was higher than the high severity IRI increase rate was thought to be due to insufficient data for the calibration of this type of distress used to create the model. This should be considered to be a problem in detecting the sensitivity of the input parameters of the models created from a large number of inputs and it should be kept in mind that the effects of high severity corrugation-type distress on the IRI increase in subsequent studies needs to be verified.
- (Figure 6e) Surface distress of the depression-type affected the increase in IRI negatively in a significant way. When the distress was observed in 5% of the evaluated area, it was understood that it caused an increase in IRI by 7% in low severity, 28% in medium severity, and 49% in high severity. However, if the distress was seen in 50% of the area, it led to an increase in the IRI by 50% in low severity, 203% in medium severity, and 491% in high severity.
- (Figure 6f) Considering the case of 5% of the evaluated area, the patching-type distress caused an increase in IRI by 43% in the low severity, and 50% in the medium and high severity. When observed in 50% of the area, low severity caused an increase in IRI by 107%, moderate severity by 233%, and high severity by 496%. The patching was a type of distress that provided a significant increase in the IRI, especially in the case of a large quantity of evaluated area.
- (Figure 6g) It was seen that the increase in the IRI value of rutting-type distress in the same quantity, low, medium, and high severities, did not make much difference compared to the other types of distress. When the distress was observed in 5% of the evaluated area, it was observed that it caused an increase in IRI by 16% in low severity, 31% in medium severity, and 36% in high severity. If the distress was observed in 50% of the area, it caused an increase of 157% in low severity, 193% in moderate severity, and 282% in high severity.
- (Figure 6h) Finally, raveling-type distress was evaluated in a similar way. As stated in the distress identification standard, raveling-type distress was evaluated at two levels of severity, moderate and high. It was understood that this type of distress led to an increase of IRI by 6%–7% if observed in 5% of the evaluated area and 71%–72% if observed in 50% of the evaluated area for two different severities of distress. Since the raveling-type distress did not change much of the macro roughness seen on the pavement surface, it was determined that the increase in the IRI value in the model was the least impactful type of distress.
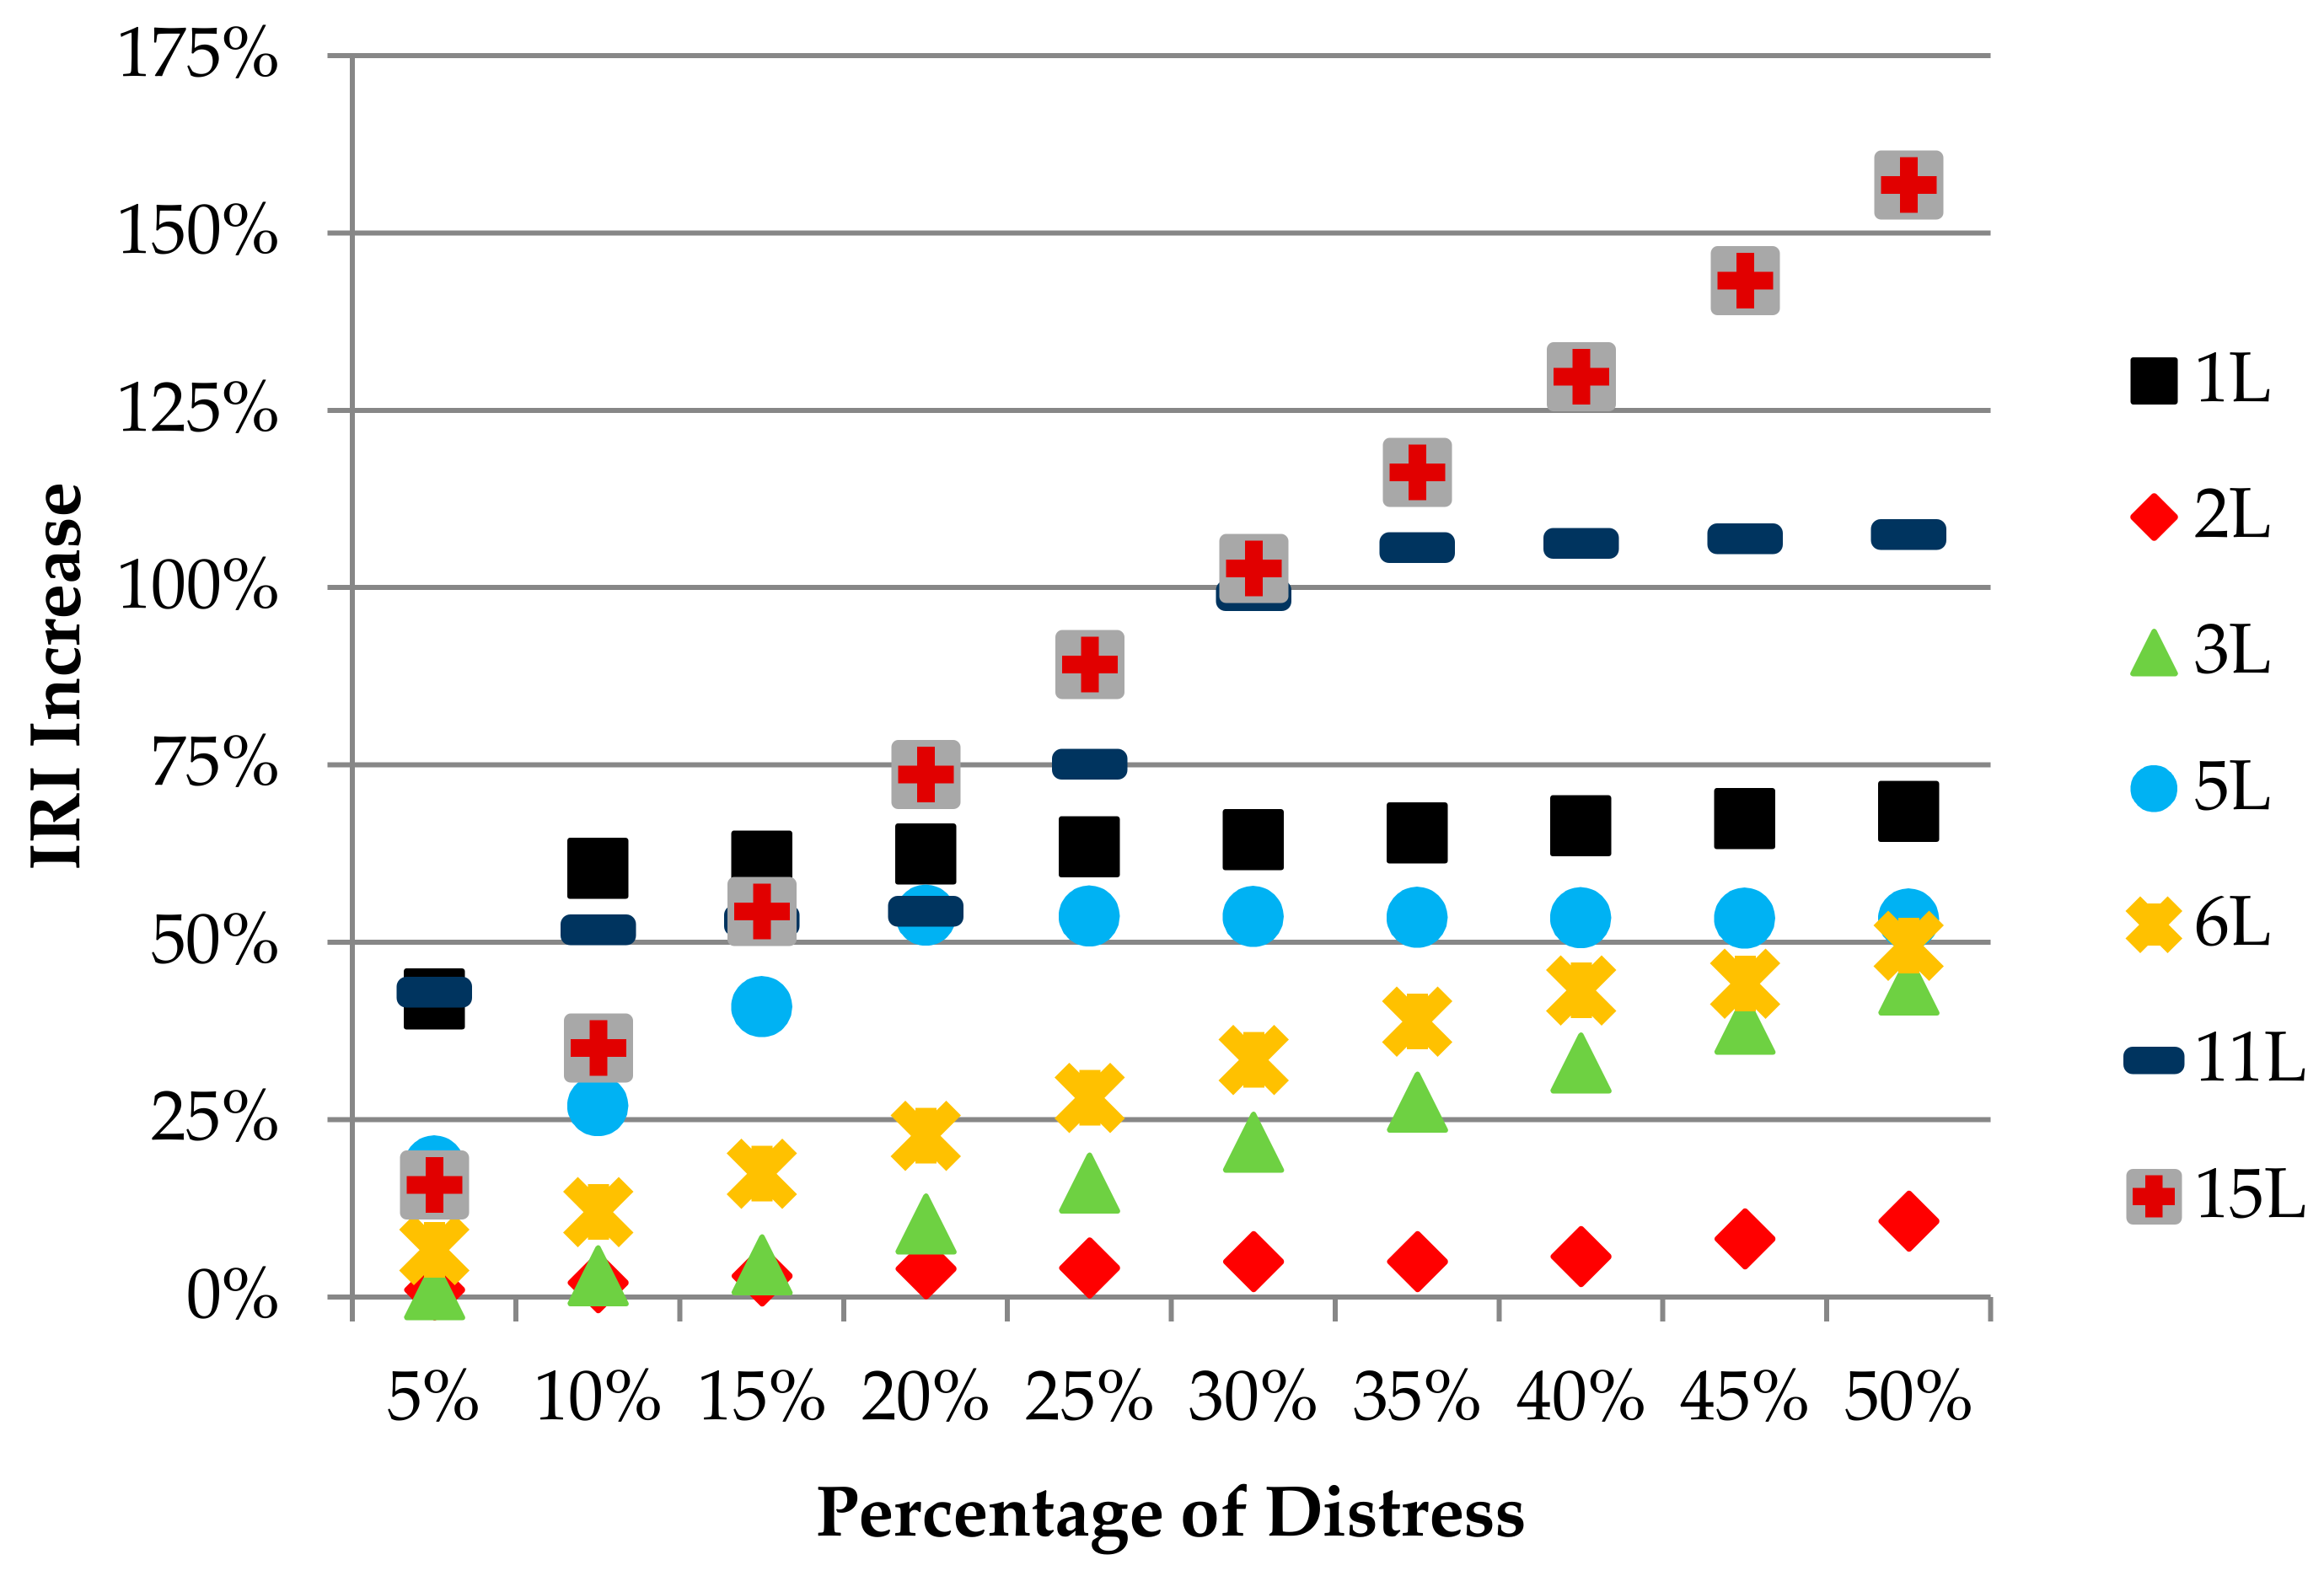
Another assessment was made by comparing the effects of distress types on the IRI increase according to each level of severity. When low-severity distress was examined, it was noteworthy that many of the distress types contributed to the IRI increase in similar proportions (between 1% and 40%) when the evaluated area had a small quantity of distress. However, in cases where the quantity of distress was large, rutting and patching-type distress were more likely to cause an increase in IRI than the other types of distress studied. Alligator cracking, depression, corrugation, and block cracking-type distress were seen to have a mean effect on the IRI increase between 40% and 80%. Low severity bleeding, however, seemed to have little or no effect on the increase of IRI. These evaluations are shown graphically in Figure 7.
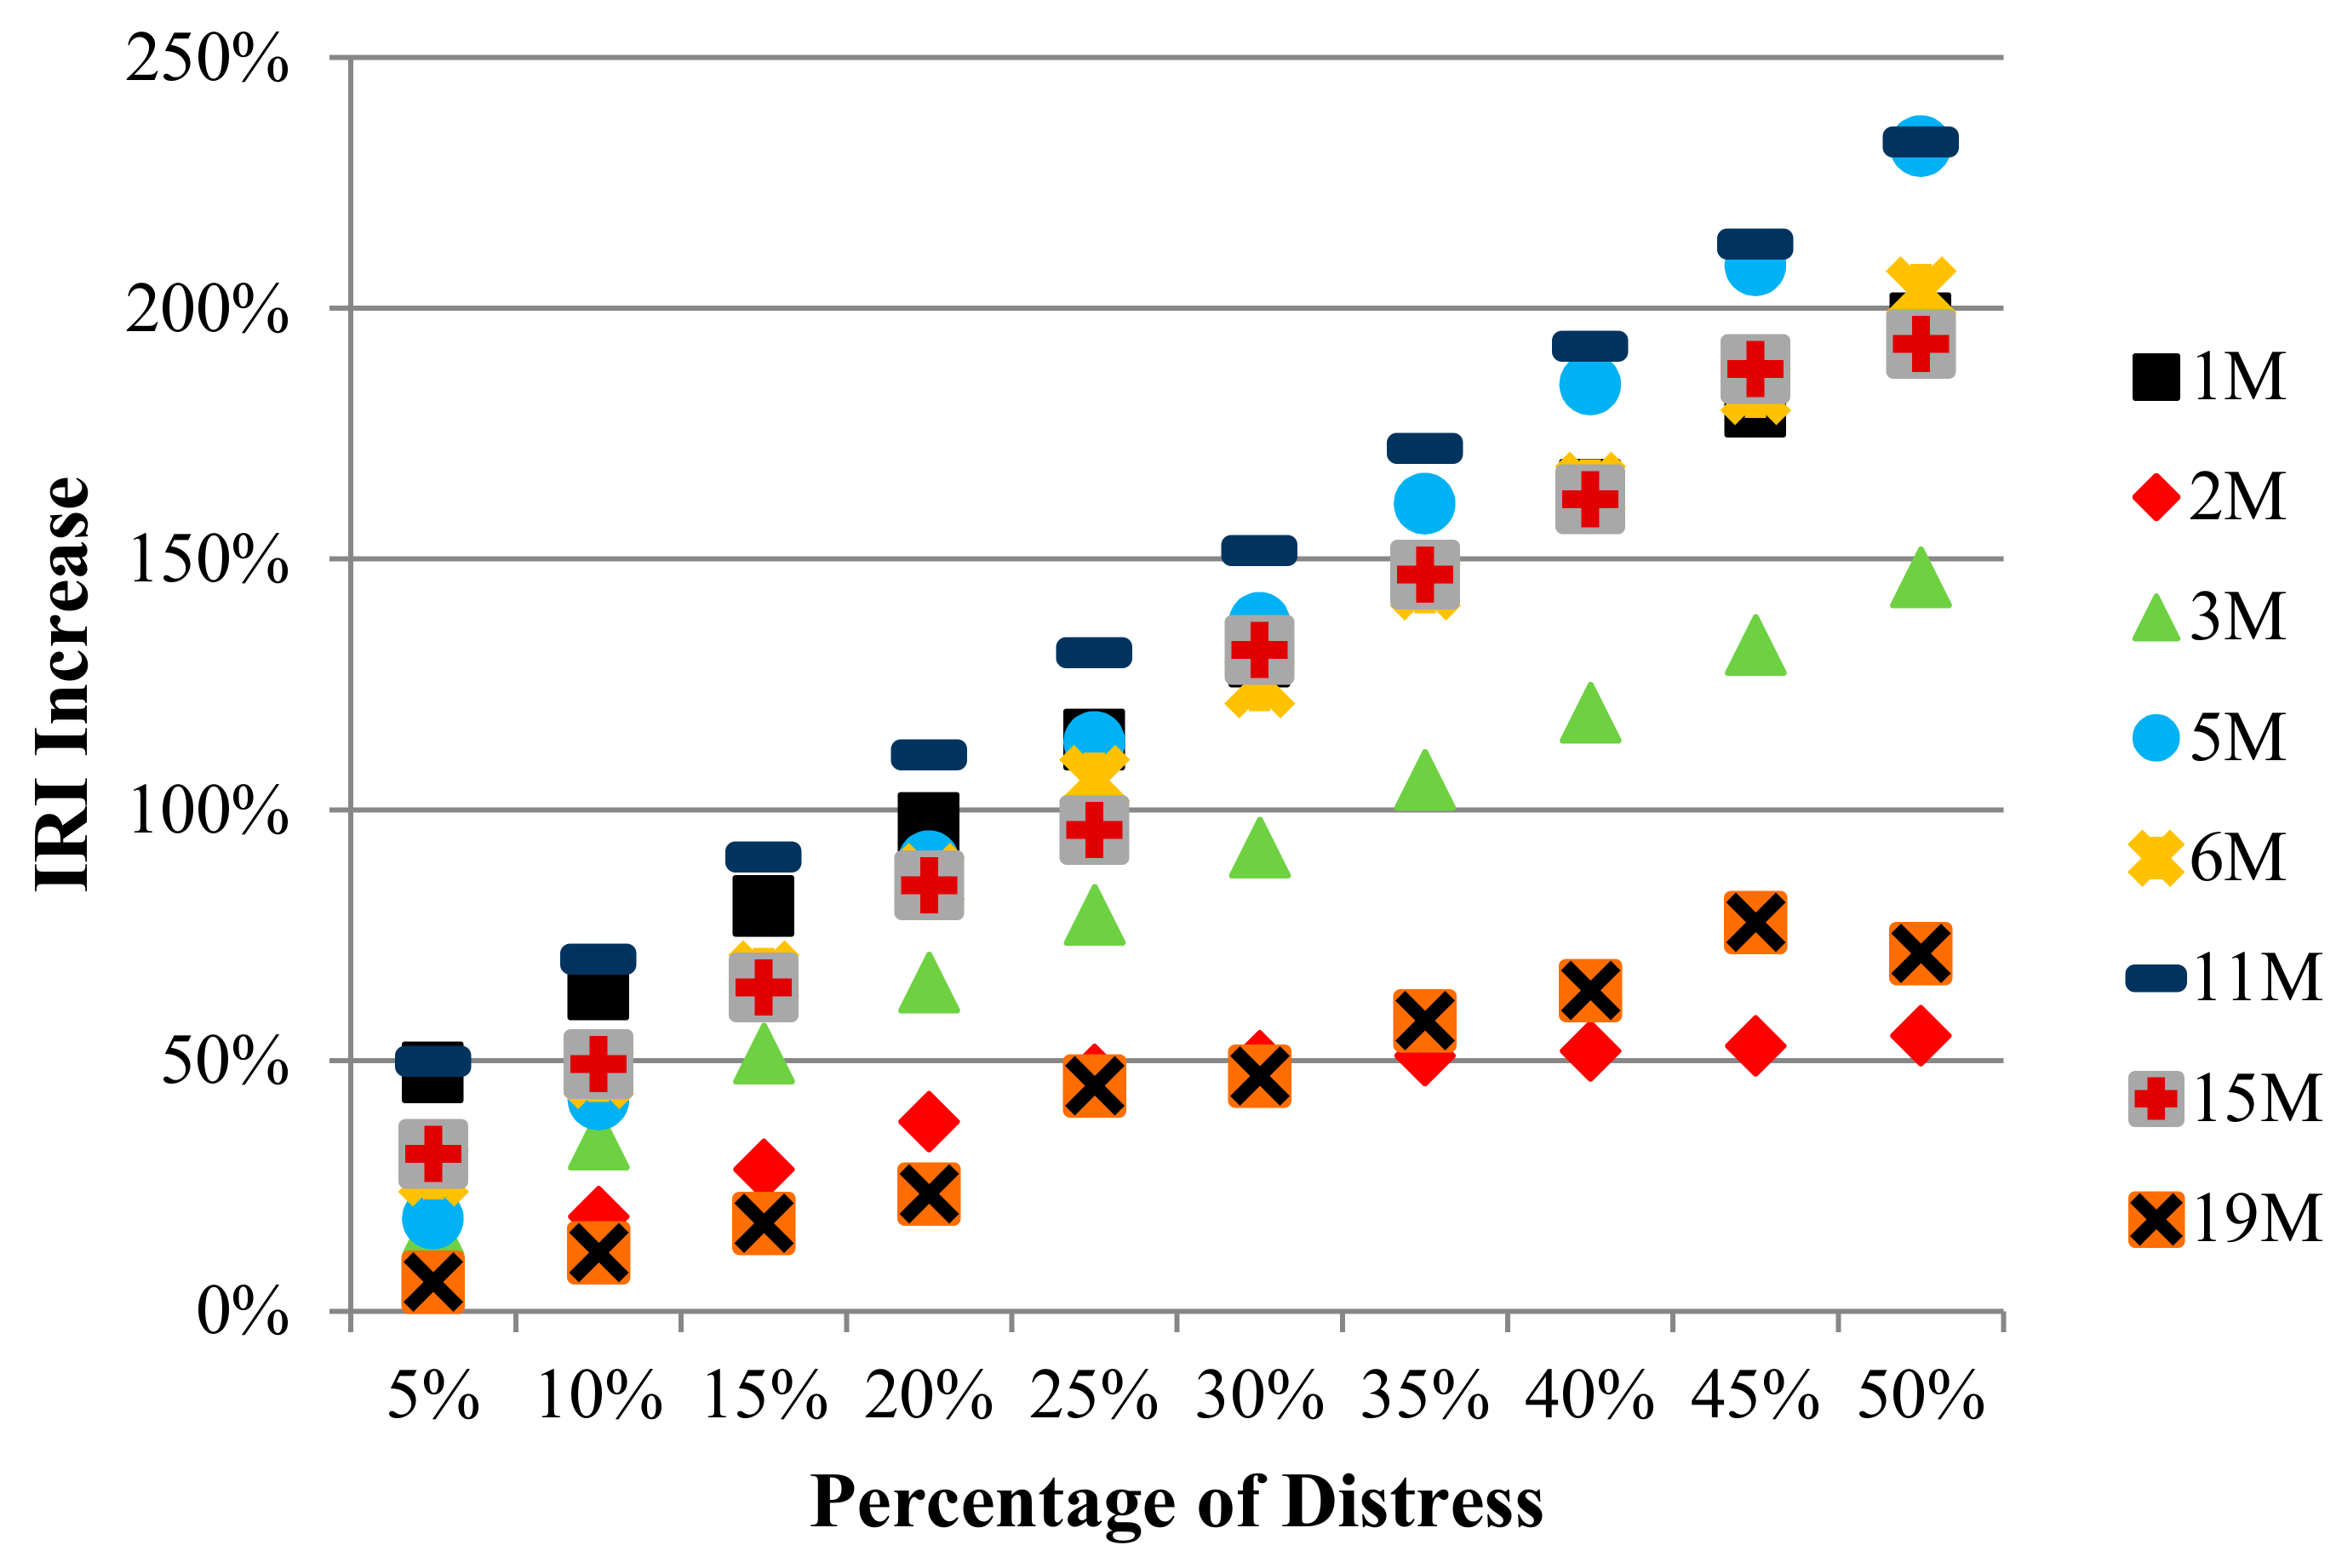
Whenever the distress of the medium severity level was examined, in the case where the quantity of distress in the evaluated area was small, it was seen that the distress was close to each other (in the range of 6%–50%). It was seen that there were significant differences in terms of the effects of distress as the quantities of distress grew. It was noticed that a moderate severity level of patching, corrugation, depression, alligator cracking, and rutting-type distress had the most detrimental effects causing IRI increase. As the quantity of distress in the evaluated area increased, it was observed that the effect of block cracking was slightly lower compared to the other types of distress, and raveling and bleeding-type distress affected the IRI increase at the lowest level. These evaluations are shown in Figure 8.
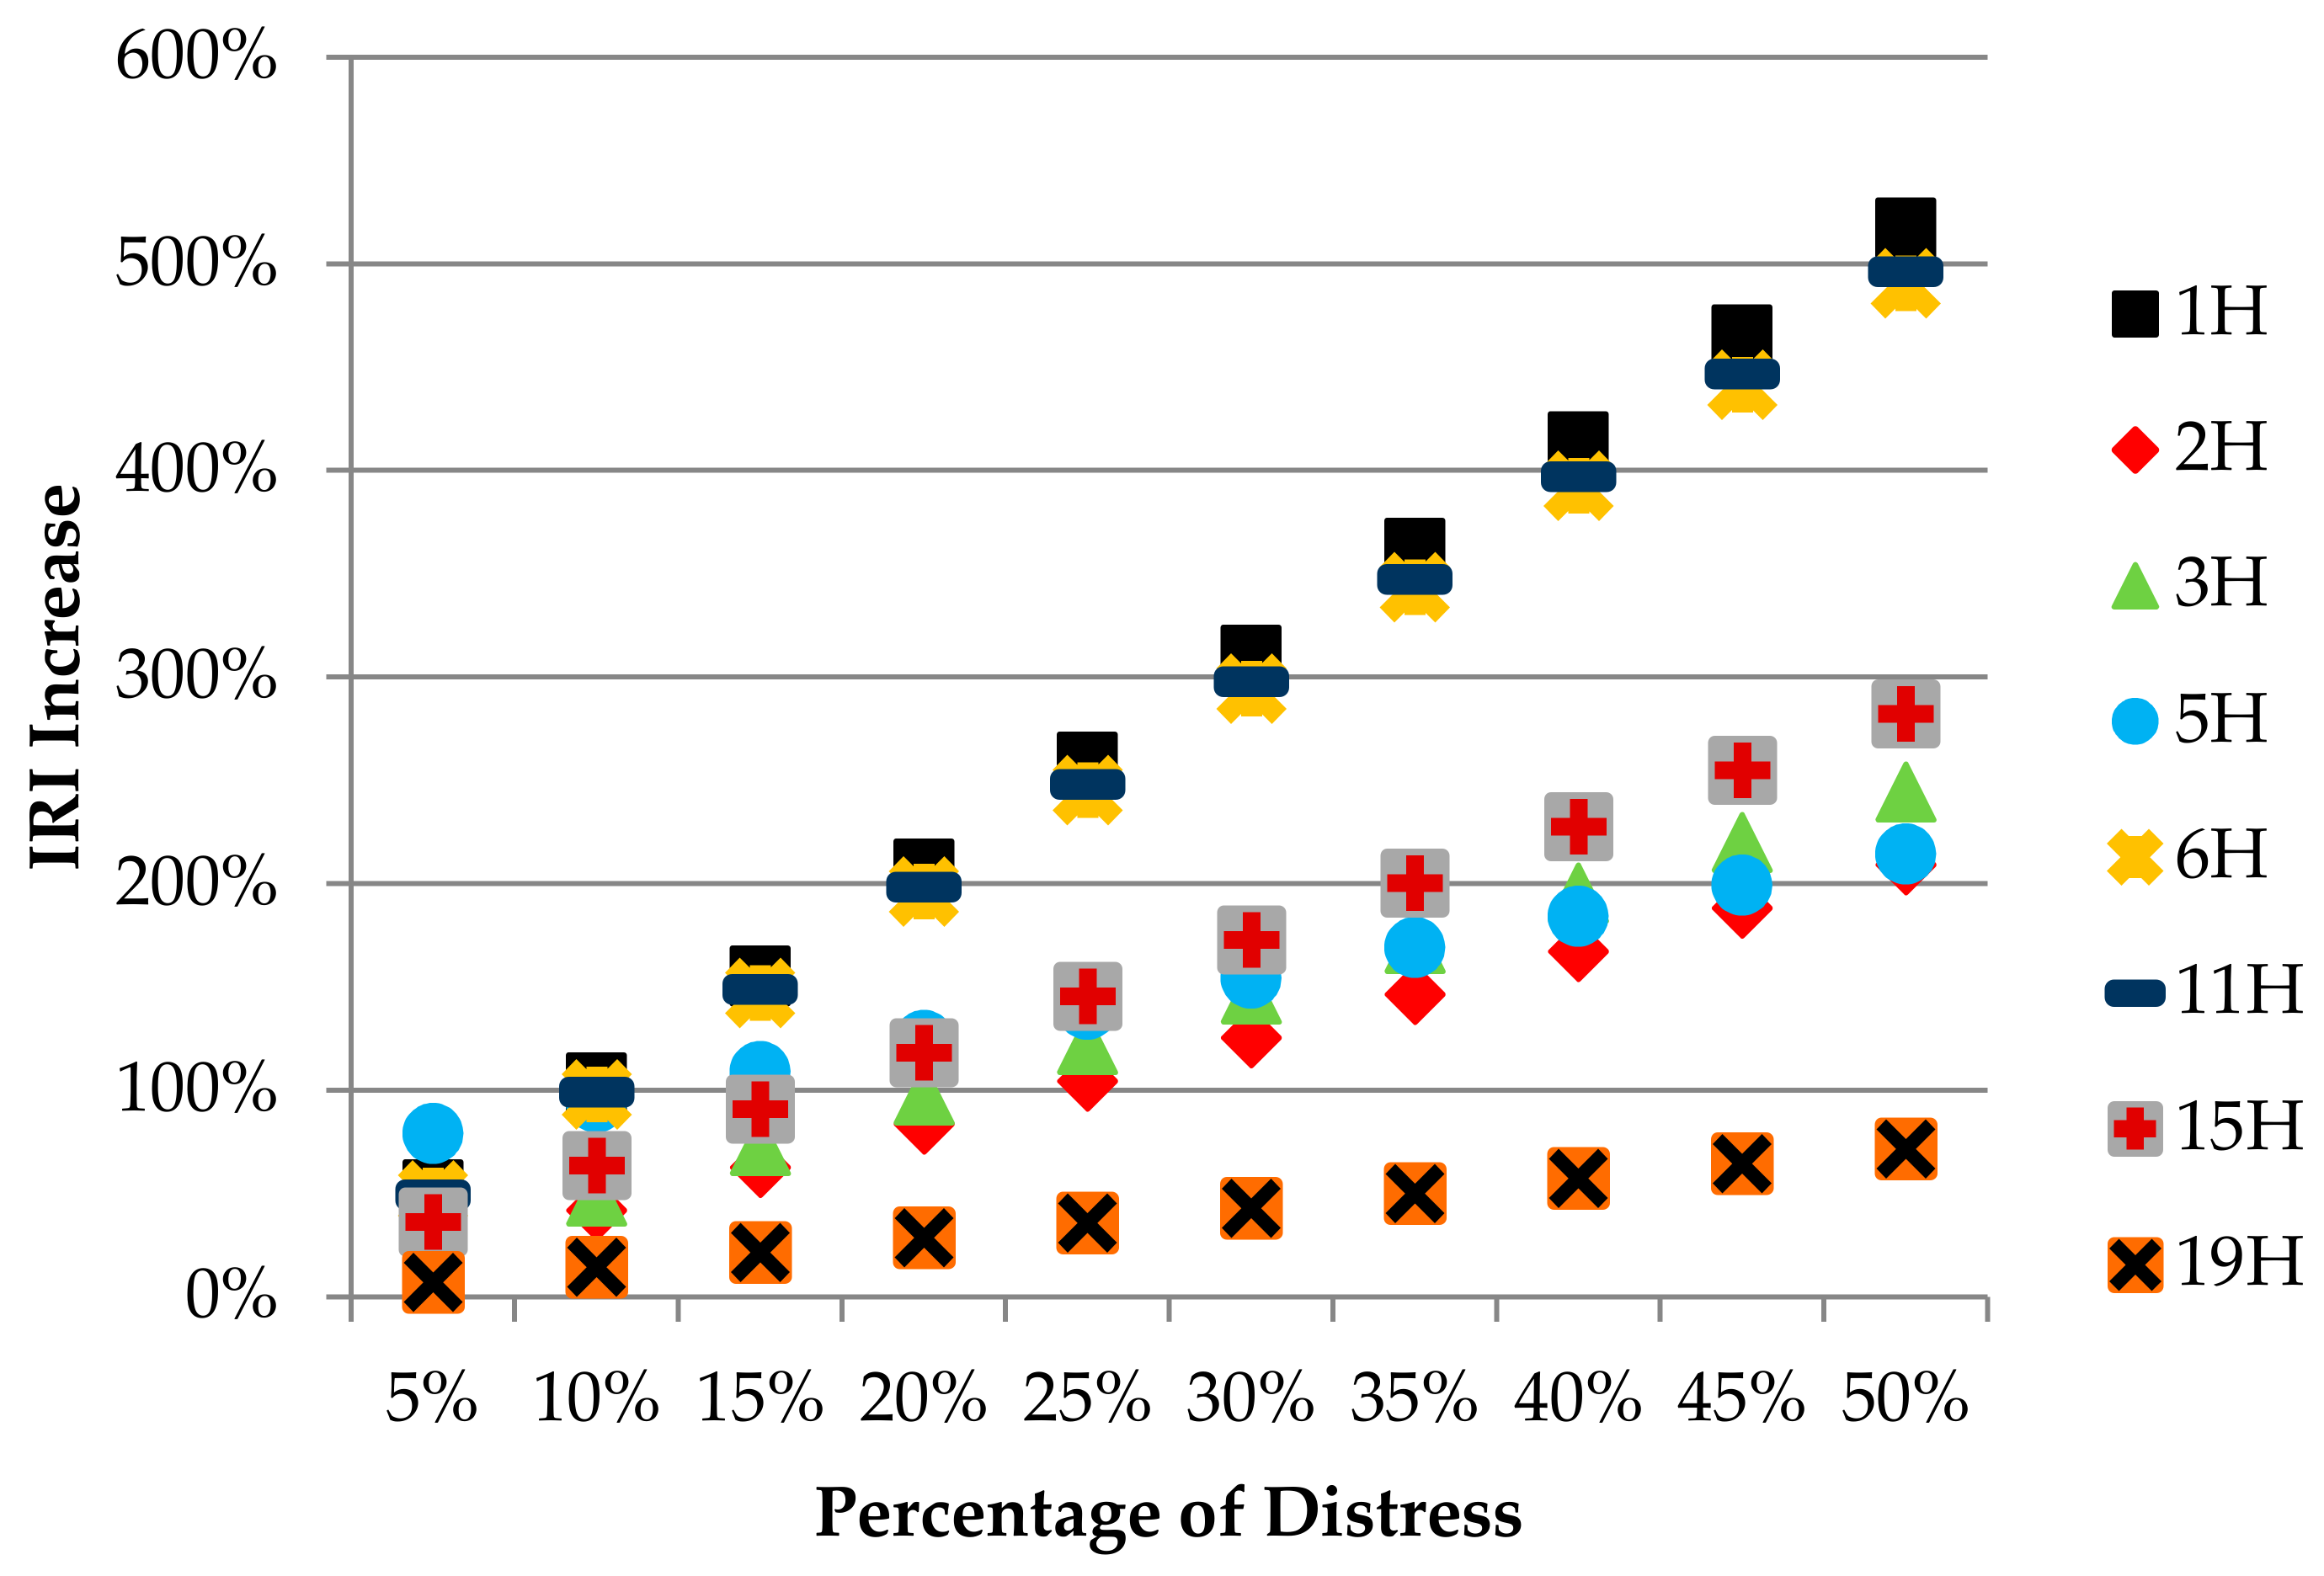
Whenever the distress of the high severity level was examined, the effects on the increase of IRI (in the range of 7%–79%) were relatively close to each other, as seen in the cases of other severity levels. As the quantity of distress in the evaluated area increased, it was understood that alligator cracking, patching, and depression-type distress were causing a significant increase in IRI. Rutting, block cracking, corrugation, and bleeding-type distress caused relatively less IRI increase and raveling-type distress caused the least increase in IRI between all the examined distresses. All these evaluations are shown graphically in Figure 9.
4. Discussion
The sensitivity and effects of the International Roughness Index (IRI) increase of eight different types of distress were determined by means of the generated IRI prediction model. Studies evaluating the effects of different types of distress on the IRI increase in the literature are quite limited. In fact, there are almost no studies examining the types of distress that consider different severities. It is thought that this is the strongest side of the study. It is obvious that the study will contribute to the literature and give a new perspective to researchers who are engaged in similar studies. It also contains practical conclusions about which types of distress should be prioritized for maintenance and repair work by the agencies responsible for the operation of road pavements.
The Multivariate Adaptive Regression Splines (MARS) technique was used to model the relationships between surface distress and IRI. Among other situations, this model has not been used for obtaining effective results against some input values for models examining many independent variables. This suggests that MARS is a method that should be preferred when the relationships between surface distress and IRI are determined.
It is understood from the analysis that, as the quantity of impairment increases for each type of distress, the IRI value increases. It is seen that increases in IRI are caused by alligator cracking, depression, and patching-type distress most often. Additionally, it is also noteworthy that the raveling-type distress least increases the IRI and the effects on IRI increases for both medium and high severity levels are close to each other. However, at different levels of severity regarding rutting and block cracking, as the quantity of distress seen in the evaluated section increases, the effect on the increase in IRI seems to increase equally. As expected, the increase in IRI in low and moderate severities of corrugation-type distress resembles that of alligator cracking, depression, and patching-type distress. However, in the case of high severity distress, contrary to what is expected, there is not much effect on the increase of IRI. This is thought to be due to an insufficiency of data used in the model calibration as well as the distress during the measurement, which might be seen in different regions from the direction in which the IRI data was gathered. Assuming that this is a problem in detecting the sensitivity of the input parameters of the models created by a large number of inputs (independent variables), it is necessary to keep in mind that in subsequent studies high severity corrugation-type distress needs to be verified to have an effect on IRI increase.
Although each study cannot be exactly the same as another, similar results were obtained in the study conducted by Lin et al. [12] wherein the researchers tried to determine the improvement provided to the IRI in case of repair to the distress with the help of a model developed by the Artificial Neural Network (ANN) technique. It seems that the repair of cracking and superficial deformation-type distress has contributed significantly to the improvement of IRI values in this study.
5. Conclusions
Regarding hot mixed asphalt (HMA) pavements, the pavement surface distress effects on the International Roughness Index (IRI) were examined, and are considered to be performance indicators of pavements. To evaluate the types of distress, the surface distress identifications proposed by the PAVER system were used. Relations between IRI and ten different types of distress data (29 different model inputs were formed which considered different levels of severity) was collected in field studies and were digitized by means of the model created using the Multivariate Adaptive Regression Splines (MARS) approach. Through this model, the impact of the changes of input parameters (pavement surface distress) on IRI was determined. Eight different types of pavement distress, including alligator cracking, bleeding, block cracking, corrugation, depression, patching, rutting, and raveling, were collected in area measurement units to make the comparison between parameters more realistic.
During the evaluations for all types of distress, it was observed that the quantity of surface distress in the evaluated area increased as the IRI value increased. It was determined that alligator cracking, depression, and patching-type distress caused the greatest increase in IRI, especially if the distress severity was high, the increase in IRI value was up to 500%, and if it was moderate, the increase in IRI value was up to 200%. The raveling-type distress had the least effect on the increase in IRI and, even in different quantities, the effect of the distress seen in both severities were very close to each other. The other type of distress that had the least effect on IRI increase was bleeding. However, high severity bleeding-type deterioration led to a more than double increase in IRI, as compared to moderate and low severity. However, it was observed that the rates of increase in the IRI regarding the different severity levels of the rutting-type distress were very close to each other. The type of distress that was observed to have the most homogenous change in IRI increase, with increasing quantity of distress observed between different severities and evaluated area, was block cracking.
Since surface distress determinations of pavements made in the field showed that many distress types are seen together, in this study, the effects of surface distress on IRI was investigated by examining the sensitivities of the input parameters of the generated prediction model. During the later stages of the study, it became very clear that using similar analyses with a large number of data sets contributed to the literature and to the evaluation of different types of distress. Additionally, the use of multiple techniques in modelling studies to conduct comparative assessments will ensure that the most appropriate modelling technique to be used for this purpose is identified. Using the help of the findings obtained from this and similar studies, it is thought that significant input can be provided to help the agencies responsible for the upkeep of the pavement to plan maintenance and repair activities.
Funding
This research received no external funding
Acknowledgments
The author acknowledges the support given by Istanbul University and Ondokuz Mayis University. The author would like to thank the General Directorate of Highways and all its valued employees for their assistance in making IRI and pavement distress measurements.
Conflicts of Interest
The author declares no conflicts of interest.
References
- Guide for Design of Pavement Structures; American Association of State Highway and Transportation Officials: Washington, DC, USA, 1993; p. 624.
- Hozayen, H.A.; Alrukaibi, F. Development of acceptance measures for long term performance of bot highway projects. In Efficient Transportation and Pavement Systems: Characterization, Mechanisms, Simulation, and Modeling; Sayed, A.-Q., Ed.; Taylor&Francis Group: London, UK, 2009; pp. 335–348. [Google Scholar]
- Al-Omari, B.; Darter, M.I. Effect of pavement deterioration types on IRI and rehabilitation. Transp. Res. Rec. 1995, 1505, 57–65. [Google Scholar]
- Aguiar-Moya, J.P.; Prozzi, J.A.; de Fortier Smit, A. Mechanistic-empirical iri model accounting for potential bias. J. Transp. Eng. 2011, 137, 297–304. [Google Scholar] [CrossRef]
- Mactutis, J.; Alavi, S.; Ott, W. Investigation of relationship between roughness and pavement surface distress based on westrack project. Transp. Res. Rec. 2000, 1699, 107–113. [Google Scholar] [CrossRef]
- Sandra, A.K.; Sarkar, A.K. Development of a model for estimating international roughness index from pavement distresses. Int. J. Pavement Eng. 2013, 14, 715–724. [Google Scholar] [CrossRef]
- Attoh-Okine, N.O.; Mensah, S.; Nawaiseh, M. A New Technique for Using Multivariate Adaptive Regression Splines (MARS) in Pavement Roughness Prediction. Proc. Inst. Civ. Eng. Transp. 2003, 156, 51–55. [Google Scholar] [CrossRef]
- Chandrakasu, M.; Rajiah, M. Development of a roughness estimation model for low volume roads. Grdevinar 2018, 70, 97–104. [Google Scholar] [Green Version]
- Chandra, S.; Sekhar, C.R.; Bharti, A.K.; Kangadurai, B. Relationship between pavement roughness and distress parameters for indian highways. J. Transp. Eng. 2013, 139, 467–475. [Google Scholar] [CrossRef]
- Mahmood, M.; Rahman, M.; Mathavan, S. Distress based pavement performance prediction models. In Proceedings of the Eighth International Conference on Maintenance and Rehabilitation of Pavements, Singapore, 27–29 July 2016; pp. 357–368. [Google Scholar]
- Zhou, L.; Ni, F.; Leng, Z. Development of an asphalt pavement distress evaluation method for freeways in china. Int. J. Pavement Res. Technol. 2014, 7, 159–167. [Google Scholar]
- Lin, J.-D.; Yau, J.-T.; Hsiao, L.-H. Correlation analysis between international roughness index (IRI) and pavement distress by neural network. In Proceedings of the 82nd Annual Meeting of the Transportation Research Board, Washington, DC, USA, 12–16 January 2003. [Google Scholar]
- Yang, J.; Lu, J.; Gunaratne, M.; Xiang, Q. Overall pavement condition forecasting using neural networks—An application to florida highway network. In Proceedings of the 82nd Annual Meeting of the Transportation Research Board, Washington, DC, USA, 12–16 January 2003. [Google Scholar]
- Attoh-Okine, N.O. Analysis of learning rate and momentum term in backpropagation neural network algorithm trained to predict pavement performance. Adv. Eng. Softw. 1999, 30, 291–302. [Google Scholar] [CrossRef]
- Terzi, S. Modeling the pavement serviceability ratio of flexible highway pavements by artificial neural networks. Constr. Build. Mater. 2007, 21, 590–593. [Google Scholar] [CrossRef]
- Choi, J.H.; Adams, T.M.; Bahia, H.U. Pavement roughness modeling using back-propagation neural networks. Comput.-Aided Civ. Infrastruct. Eng. 2004, 19, 295–303. [Google Scholar] [CrossRef]
- Pan, N.-F.; Ko, C.-H.; Yang, M.-D.; Hsu, K.-C. Pavement performance prediction through fuzzy regression. Expert Syst. Appl. 2011, 38, 10010–10017. [Google Scholar] [CrossRef]
- Moazami, D.; Behbahani, H.; Muniandy, R. Pavement rehabilitation and maintenance prioritization of urban roads using fuzzy logic. Expert Syst. Appl. 2011, 38, 12869–12879. [Google Scholar] [CrossRef]
- Karaşahin, M.; Terzi, S. Performance model for asphalt concrete pavement based on the fuzzy logic approach. Transport 2014, 29, 18–27. [Google Scholar] [CrossRef]
- Terzi, S. Modeling for pavement roughness using the anfis approach. Adv. Eng. Softw. 2013, 57, 59–64. [Google Scholar] [CrossRef]
- Kırbaş, U.; Karaşahin, M. Estimating PCI using Vibration Data for Asphalt Concrete Pavements. In Proceedings of the 2nd World Congress on Civil, Structural, and Environmental Engineering (CSEE’17), Barcelona, Spain, 2–4 April 2017; pp. 1–9. [Google Scholar]
- Lantieri, C.; Lamperti, R.; Simone, A.; Vignali, V.; Sangiorgi, C.; Dondi, G. Mobile laser scanning system for assessment of the rainwater runoff and drainage conditions on road pavements. Int. J. Pavement Res. Technol. 2015, 8, 1–9. [Google Scholar]
- Suanpaga, W.; Yoshikazu, K. Riding quality model for asphalt pavement monitoring using phase array type L-band synthetic aperture radar (PALSAR). Remote Sens. 2010, 2, 2531–2546. [Google Scholar] [CrossRef]
- Jo, Y.; Ryu, S. Pothole detection system using a black-box camera. Sensors 2015, 15, 29316–29331. [Google Scholar] [CrossRef] [PubMed]
- Radopoulou, S.C.; Brilakis, I. Patch detection for pavement assessment. Autom. Constr. 2015, 53, 95–104. [Google Scholar] [CrossRef]
- Lokeshwor, H.; Das, L.K.; Goel, S. Robust method for automated segmentation of frames with/without distress from road surface video clips. J. Transp. Eng. 2014, 140, 31–41. [Google Scholar] [CrossRef]
- Koch, C.; Brilakis, I. Pothole detection in asphalt pavement images. Adv. Eng. Inf. 2011, 25, 507–515. [Google Scholar] [CrossRef]
- Dondi, G.; Barbarella, M.; Sangiorgi, C.; Lantieri, C.; De Marco, L. A semi-automatic method for identifying defects on road surfaces. In ICSDC 2011: Integrating Sustainability Practices in the Construction Industry; Chong, W.K.O., Hermreck, C., Eds.; American Society of Civil Engineers: Reston, VA, USA, 2012; pp. 704–711. [Google Scholar]
- ASTM E 950 Standard Test Method for Measuring the Longitudinal Profile of Traveled Surfaces with an Accelerometer Established Inertial Profiling Reference; ASTM International: West Conshohocken, PA, USA, 2009.
- Sayers, M.W.; Karamihas, S.M. The Little Book of Profiling; University of Michigan: Ann Arbor, MI, USA, 1998. [Google Scholar]
- Sayers, M.W.; Gillespie, T.D.; Queiroz, C.A.V. The International Road Roughness Experiment: Establishing Correlation and a Calibration Standard for Measurements; The World Bank: Washington, DC, USA, 1986; p. 454. [Google Scholar]
- Perera, R.W.; Kohn, S.D. Quantification of Smoothness Index Differences Related to Long-Term Pavement Performance Equipment Type; FHWA-HRT-05-054; Federal Highway Administration: McLean, VA, USA, 2005; p. 145.
- Sayers, M.W. On the calculation of international roughness index from longitudinal road profile. Transp. Res. Rec. 1995, 1501, 1–12. [Google Scholar]
- Cantisani, G.; Loprencipe, G. Road roughness and whole body vibration: Evaluation tools and comfort limits. J. Transp. Eng. 2010, 136, 818–826. [Google Scholar] [CrossRef]
- ASTM E 1923-08 Standard Practice for Computing International Roughness Index of Roads from Longitudinal Profile Measurements; ASTM International: West Conshohocken, PA, USA, 2008.
- ASTM D 6433-11 Standard Practice for Roads and Parking Lots Pavement Condition Index Surveys; ASTM International: West Conshohocken, PA, USA, 2011.
- Loprencipe, G.; Pantuso, A. A specified procedure for distress identification and assessment for urban road surfaces based on pci. Coatings 2017, 7, 65. [Google Scholar] [CrossRef]
- Friedman, J.H. Multivariate adaptive regression splines. Ann. Stat. 1991, 19, 1–67. [Google Scholar] [CrossRef]
- Weber, G.-W.; Batmaz, İ.; Köksal, G.; Taylan, P.; Yerlikaya-Özkurt, F. Cmars: A new contribution to nonparametric regression with multivariate adaptive regression splines supported by continuous optimization. Inverse Prob. Sci. Eng. 2012, 20, 371–400. [Google Scholar] [CrossRef]
- Attoh-Okine, N.O.; Cooger, K.; Mensah, S. Multivariate adaptive regression (MARS) and hinged hyperplanes (HHP) for doweled pavement performance modeling. Constr. Build. Mater. 2009, 23, 3020–3023. [Google Scholar] [CrossRef]
- Rounaghi, M.M.; Abbaszadeh, M.R.; Arashi, M. Stock price forecasting for companies listed on tehran stock exchange using multivariate adaptive regression splines model and semi-parametric splines technique. Phys. A 2015, 438, 625–633. [Google Scholar] [CrossRef]
- Zhang, W.G.; Goh, A.T.C. Multivariate adaptive regression splines for analysis of geotechnical engineering systems. Comput. Geotech. 2013, 48, 82–95. [Google Scholar] [CrossRef]
Figure 1.
Quarter-car model graphic display and constants. Adapted with permission from [34]. Copyright 2010 ASCE.
Figure 1.
Quarter-car model graphic display and constants. Adapted with permission from [34]. Copyright 2010 ASCE.

Figure 2.
The cameras used in the study and the measurement method.

Figure 3.
Evaluated road sections in this study.

Figure 4.
Distress images used in the description of alligator cracking in ASTM D 6433-11 Standard: (a) low, (b) medium, and (c) high severity levels. Reproduced with permission from [36]. Copyright 2011 ASTM.
Figure 4.
Distress images used in the description of alligator cracking in ASTM D 6433-11 Standard: (a) low, (b) medium, and (c) high severity levels. Reproduced with permission from [36]. Copyright 2011 ASTM.

Figure 5.
Multivariate Adaptive Regression Splines (MARS) model prediction accuracy.

Figure 6.
Proportional effects of the increase of international roughness index despite various quantity ratios of distress at the pavement surface: Alligator cracking (a); bleeding (b); block cracking (c); corrugation (d); depression (e); patching (f); rutting (g); and, raveling (h).
Figure 6.
Proportional effects of the increase of international roughness index despite various quantity ratios of distress at the pavement surface: Alligator cracking (a); bleeding (b); block cracking (c); corrugation (d); depression (e); patching (f); rutting (g); and, raveling (h).

Figure 7.
Effects of low severity distress on international roughness index increase.

Figure 8.
Effects of medium severity distress on international roughness index increase.

Figure 9.
Effects of high severity distress on international roughness index increase.


Table 1.
Traffic and climate information of the evaluated sections.
| Road No. | Annual Average Daily Traffic | Percentage of Heavy Vehicle (%) | Max. Temp. (°C) | Min. Temp. (°C) | Measurement Date (M.Y) |
|---|---|---|---|---|---|
| 200-10 | 11,549 | 31% | 40.8 | –21.5 | 12.2009 |
| 200-11 | 11,549 | 31% | 40.8 | –21.5 | 12.2009 |
| 200-12 | 16,586 | 26% | 40.8 | –21.5 | 12.2009 |
| 100-26 | 2566 | 51% | 39.2 | –32.6 | 10.2010 |
| 100-27 | 3907 | 49% | 27.6 | –15.5 | 10.2010 |
| 100-28 | 8544 | 22% | 27.6 | –15.5 | 10.2010 |
| 100-32 | 2388 | 41% | 30.0 | –16.2 | 10.2010 |
| 100-33 | 2301 | 42% | 38.6 | –25.0 | 10.2010 |
| 260-21 | 2822 | 45% | 27.6 | –15.5 | 10.2010 |
Table 2.
Distress classifications for asphalt concrete pavement in ASTM D 6433-11 [36].
Table 2.
Distress classifications for asphalt concrete pavement in ASTM D 6433-11 [36].
| Distress Code | Distress Name | Unit of Measure | Defined Severity Levels | Cause |
|---|---|---|---|---|
| 1 | Alligator cracking | m2 | Yes | Load |
| 2 | Bleeding | m2 | Yes | Other |
| 3 | Block cracking | m2 | Yes | Climate |
| 4 | Bumps and sags | m | Yes | Other |
| 5 | Corrugation | m2 | Yes | Other |
| 6 | Depression | m2 | Yes | Other |
| 7 | Edge cracking | m | Yes | Load |
| 8 | Joint reflection cracking | m | Yes | Climate |
| 9 | Lane/shoulder drop-off | m | Yes | Other |
| 10 | Long. and trans. cracking | m | Yes | Climate |
| 11 | Patching | m2 | Yes | Other |
| 12 | Polished aggregate | m2 | No | Other |
| 13 | Potholes | Number | Yes | Load |
| 14 | Railroad crossings | m2 | Yes | Other |
| 15 | Rutting | m2 | Yes | Load |
| 16 | Shoving | m2 | Yes | Other |
| 17 | Slippage cracking | m2 | Yes | Other |
| 18 | Swell | m2 | Yes | Other |
| 19 | Raveling | m2 | Yes | Climate |
| 20 | Weathering | m2 | Yes | Climate |
Table 3.
Relations between surface distress types and International Roughness Index (IRI).
| IRI and 1L | IRI and 1M | IRI and 1H | IRI and 2L | IRI and 2M | IRI and 2H | |
| Correlation | 0.434 | 0.348 | 0.088 | 0.092 | 0.062 | 0.141 |
| Significance | 0.000 | 0.000 | 0.000 | 0.000 | 0.000 | 0.000 |
| IRI and 3L | IRI and 3M | IRI and 3H | IRI and 5L | IRI and 5M | IRI and 5H | |
| Correlation | 0.092 | 0.224 | 0.073 | 0.155 | 0.230 | 0.225 |
| Significance | 0.000 | 0.000 | 0.000 | 0.000 | 0.000 | 0.000 |
| IRI and 6L | IRI and 6M | IRI and 6H | IRI and 10L | IRI and 10M | IRI and 10H | |
| Correlation | 0.227 | 0.157 | 0.084 | 0.096 | 0.163 | 0.090 |
| Significance | 0.000 | 0.000 | 0.000 | 0.000 | 0.000 | 0.000 |
| IRI and 11L | IRI and 11M | IRI and 11H | IRI and 13L | IRI and 13M | IRI and 13H | |
| Correlation | 0.349 | 0.267 | 0.146 | 0.148 | 0.069 | 0.142 |
| Significance | 0.000 | 0.000 | 0.000 | 0.000 | 0.000 | 0.000 |
| IRI and 15L | IRI and 15M | IRI and 15H | IRI and 19M | IRI and 19H | ||
| Correlation | 0.431 | 0.231 | 0.130 | 0.193 | 0.068 | |
| Significance | 0.000 | 0.000 | 0.000 | 0.000 | 0.000 |
Table 4.
Basic functions used in Multivariate Adaptive Regression Splines model.
| Basic Functions | Basic Functions |
|---|---|
| BF1 = max(0; 1L − 9.4) | BF35 = max(0; 6M − 1.3333) |
| BF2 = max(0; 9.4 − 1L) | BF36 = max(0; 1.3333 − 6M) |
| BF3 = max(0; 15L − 4.3333) | BF37 = max(0; 10L − 30.0667) |
| BF4 = max(0; 4.3333 − 15L) | BF38 = max(0; 30.0667 − 10L) |
| BF5 = max(0; 11L − 5.9) | BF39 = max(0; 2H) |
| BF6 = max(0; 5.9 − 11L) | BF40 = max(0; 6H) |
| BF7 = max(0; 5H − 2) | BF41 = max(0; 13M) |
| BF8 = max(0; 2 − 5H) | BF42 = max(0; 15M − 20.3333) |
| BF9 = max(0; 3M − 16) | BF43 = max(0; 13H) |
| BF10 = max(0; 16 − 3M) | BF44 = max(0; 1L − 4.6667) |
| BF11 = max(0; 11M − 5) | BF45 = max(0; 19H) |
| BF12 = max(0; 5 − 11M) | BF46 = max(0; 19M − 20) |
| BF13 = max(0; 15M − 7.9) | BF47 = max(0; 2L − 18.8333) |
| BF14 = max(0; 7.9 − 15M) | BF48 = max(0; 5L − 1.5) |
| BF15 = max(0; 1M − 2.6667) | BF49 = max(0; 5L − 5.8333) |
| BF16 = max(0; 2.6667 − 1M) | BF50 = max(0; 15M − 24.8333) |
| BF17 = max(0; 5L − 19.3333) | BF51 = max(0; 1H) |
| BF18 = max(0; 19.3333 − 5L) | BF52 = max(0; 10H) |
| BF19 = max(0; 6L − 7.3333) | BF53 = max(0; 10L − 8.1000) |
| BF20 = max(0; 7.3333 − 6L) | BF54 = max(0; 10L − 46) |
| BF21 = max(0; 5M − 4.1) | BF55 = max(0; 11L − 31.3333) |
| BF22 = max(0; 4.1 − 5M) | BF56 = max(0; 11L − 20.6667) |
| BF23 = max(0; 19M − 35.3333) | BF57 = max(0; 3H) |
| BF24 = max(0; 35.3333 − 19M) | BF58 = max(0; 10L − 38.3333) |
| BF25 = max(0; 11H) | BF59 = max(0; 15L − 21.7333) |
| BF26 = max(0; 2M − 29) | BF60 = max(0; 3L − 7) |
| BF27 = max(0; 29 − 2M) | BF61 = max(0; 15M − 12.1) |
| BF28 = max(0; 3L − 32.3333) | BF62 = max(0; 10M − 11.6) |
| BF29 = max(0; 32.3333 − 3L) | BF63 = max(0; 11.6 − 10M) |
| BF30 = max(0; 13L) | BF64 = max(0; 6L − 4.5) |
| BF31 = max(0; 15H − 1) | BF65 = max(0; 2L − 29.6667) |
| BF32 = max(0; 1 − 15H) | BF66 = max(0; 5L − 10.4) |
| BF33 = max(0; 2L − 4.6667) | BF67 = max(0; 10M − 5) |
| BF34 = max(0; 4.6667 − 2L) |
Table 5.
IRI prediction model regression statistical values.
| Statistical Component | IRI |
|---|---|
| Mean (observed) | 1.855523 |
| Standard deviation (observed) | 0.905978 |
| Mean (predicted) | 1.855523 |
| Standard deviation (predicted) | 0.781759 |
| Mean (residual) | 0.000000 |
| Standard deviation (residual) | 0.457873 |
| R-square | 0.744579 |
| R-square adjusted | 0.739196 |
Table 6.
IRI prediction model ANOVA decomposition.
| Function | Mean | Standard Deviation | Number of Basic Function | Independent Variable |
|---|---|---|---|---|
| 1 | 1.506778 | 3.613975 | 3 | 1L |
| 2 | 0.204866 | 1.427734 | 2 | 1M |
| 3 | 0.007132 | 0.193302 | 1 | 1H |
| 4 | 3.249570 | 8.611857 | 4 | 2L |
| 5 | 0.619575 | 4.944756 | 2 | 2M |
| 6 | 0.048002 | 0.991252 | 1 | 2H |
| 7 | 1.154942 | 6.085346 | 3 | 3L |
| 8 | 0.407284 | 3.433640 | 2 | 3M |
| 9 | 0.009813 | 0.317481 | 1 | 3H |
| 10 | 2.403955 | 5.109487 | 5 | 5L |
| 11 | 0.276196 | 2.159583 | 2 | 5M |
| 12 | 0.156546 | 1.524540 | 2 | 5H |
| 13 | 0.477147 | 1.922288 | 3 | 6L |
| 14 | 0.086636 | 1.009642 | 2 | 6M |
| 15 | 0.005362 | 0.133473 | 1 | 6H |
| 16 | 7.88986 | 12.27248 | 5 | 10L |
| 17 | 0.567759 | 2.820660 | 3 | 10M |
| 18 | 0.028275 | 0.544379 | 1 | 10H |
| 19 | 1.611209 | 6.957987 | 4 | 11L |
| 20 | 0.215023 | 1.824592 | 2 | 11M |
| 21 | 0.028154 | 0.518288 | 1 | 11H |
| 22 | 0.029944 | 0.253386 | 1 | 13L |
| 23 | 0.012038 | 0.157478 | 1 | 13M |
| 24 | 0.019269 | 0.244752 | 1 | 13H |
| 25 | 5.970056 | 7.472103 | 3 | 15L |
| 26 | 1.309388 | 4.257650 | 5 | 15M |
| 27 | 0.085635 | 0.836833 | 2 | 15H |
| 28 | 0.874375 | 5.929459 | 3 | 19M |
| 29 | 0.066029 | 1.260636 | 1 | 19H |
© 2018 by the author. Licensee MDPI, Basel, Switzerland. This article is an open access article distributed under the terms and conditions of the Creative Commons Attribution (CC BY) license (http://creativecommons.org/licenses/by/4.0/).
Share and Cite
MDPI and ACS Style
Kırbaş, U. IRI Sensitivity to the Influence of Surface Distress on Flexible Pavements. Coatings 2018, 8, 271. https://doi.org/10.3390/coatings8080271
AMA Style
Kırbaş U. IRI Sensitivity to the Influence of Surface Distress on Flexible Pavements. Coatings. 2018; 8(8):271. https://doi.org/10.3390/coatings8080271
Chicago/Turabian StyleKırbaş, Ufuk. 2018. "IRI Sensitivity to the Influence of Surface Distress on Flexible Pavements" Coatings 8, no. 8: 271. https://doi.org/10.3390/coatings8080271
Note that from the first issue of 2016, this journal uses article numbers instead of page numbers. See further details here.