High-Temperature Oxidation Resistance of NiAl Intermetallic Formed In Situ by Thermal Spraying


1
Department of Material Science and Engineering, Shenyang University of Technology, Shenyang 110870, China
2
Guidao jiaotong Polytechnic Institute, Shenyang 110023, China
3
Dalian Huarui Heavy Industrial Special Spare Parts Co., Ltd., Dalian 116052, China
*
Author to whom correspondence should be addressed.
Coatings 2018, 8(8), 292; https://doi.org/10.3390/coatings8080292
Submission received: 30 June 2018
/
Revised: 8 August 2018
/
Accepted: 12 August 2018
/
Published: 19 August 2018
(This article belongs to the Special Issue From Metallic Coatings to Additive Manufacturing)
Abstract
:An Al/Ni composite coating was deposited on the surface of a pure Ti substrate by arc spray technology and plasma spray technology. In order to enable the in-situ reaction between the Al/Ni composite coating and the specimen, they were heated under different conditions. In addition, oxidation testing was conducted to test the oxidation-resistant property of the coating. The phase transition regulation of the coating after heating, the influence of heating at different temperatures and time on the reaction depth, and the correlated theory of the in-situ formation of the NiAl intermetallic compounds were studied and analyzed. The results showed that after the heat treatment, a ragged wave-like morphology was exhibited in the diffusion front of Al, and a small amount of the Ni in the diffusion region did not participate in the reaction. The growth of the NiAl intermetallic layer in the diffusion region of the Al/Ni/Ti specimen was obviously slower compared with the Al/Ni specimen.
1. Introduction
Titanium and titanium alloys are widely used as structural materials in fields such as the aerospace industry or automobile industry, due to their high melting point, low density, and their superior high-temperature mechanical properties [1,2,3,4,5]. However, the maximum temperature at which the alloys can be used is 873 K, above which the mechanical properties will be reduced and the life of the alloys seriously affected. In order to improve the oxidation resistance of Ti alloys while maintaining their outstanding performance, a coating that has excellent oxidation resistance can be added to the Ti alloys.
NiAl intermetallics are often used as heat-resistant coatings on metals, as they always (below 1373 K, in a general atmospheric environment) [6] have excellent high-temperature resistance to oxidation. This is because NiAl intermetallics have high melting points. In addition, a dense Al2O3 film that has excellent protection performance can be formed on the surface of metal materials when there is a high Al content in the NiAl intermetallic [7].
Co/Si co-doped beta-NiAl coating on nickel-based superalloys was prepared using the pack cementation method by Meng [8], and the result showed that the coating exhibits a good cyclic oxidation resistance. The results of Yao’s study showed that the microcrystalline beta-NiAl coating exhibited good oxidation resistance by forming exclusive alpha-A12O3 scales during cyclic oxidation tests at 1373 K in air [6]. In Sato’s study [9], coatings consisting of a Ni aluminide/Ni bilayer on Nb-W and Nb-W-Mo alloys were prepared by electro deposition and the result showed that the coating specimen with a thick Ni layer had a high oxidation resistance, as a surface layer consisting of NiAl was formed after the oxidation test. In Wang’s study [10], an outermost coating with single-phase Ni2Al3 was obtained on a copper surface by electrodepositing nickel, followed by slurry pack aluminizing, and the result showed that the NiAl coating had excellent high-temperature oxidation resistance when the oxidation time was 250 h.
To date, different kinds of oxidation-resistant coatings have been prepared on the surface of Ti and Ti alloys using different processes [11,12,13,14,15] but there is little research on the preparation of NiAl intermetallics coatings on Ti alloys [16,17]. Although, theoretically, NiAl coatings can be prepared directly on Ti alloys by the thermal spraying of NiAl compound powders, the temperature of the flame in thermal spraying is about 3000–20,000 K and NiAl intermetallics will be molten, decomposed, and are seriously oxidized below 2000 K. Therefore, it is very difficult to ensure the microstructure and properties of the coating with this method. Moreover, the bonding that forms between NiAl intermetallic coatings prepared by thermal spraying and Ti alloys is mechanical bonding, and the coating has a different thermal expansion coefficient from that of the Ti alloys, which may cause the coating to be easily peeled off from substrate in high-temperature environment [18,19].
Ti-6Al-4V was commonly used in engineering, but the pure Ti which could be applied in practical applications [20,21,22,23] as well, as the Al element was contained in Ti-6Al-4V, the component of pure Ti was simpler, and the experimental process was easier to analyze. Thus, an Al/Ni composite coating was deposited on the surface of a pure Ti substrate using arc spray technology and plasma spray technology. In order to enable the in-situ reaction with the Al/Ni composite coating, the specimen was heated under different conditions, and a dense NiAl intermetallic coating with high bonding strength was obtained. The method is very efficient and is easy to realize in engineering. The nature of the bonding between the NiAl coating and the substrate ranged from mechanical to metallurgical, and the adhesive strength was greatly improved in comparison to mechanical bonding, which provides application possibilities for engineering. The phase transition of the coating after heating, the influence of heating at different temperatures and time on the reaction depth, and the related theory of the in-situ formation of NiAl intermetallic compounds were also studied in this paper. The effect of the coating on the oxidation resistance and its protection mechanism were investigated. The results may provide some theoretical basis for practical applications.
2. Experimental Procedure
2.1. Preparation of Specimen
The substrate material used in this study was industrial pure Ti (Aoguan Metal Materials Co., Ltd., Taizhou, China). Each of the substrate specimens was formed into a 30 mm long, 30 mm wide, and 10 mm thick shape. All of the surfaces of the specimens were sprayed with 150 µm thick Ni coatings by plasma spray technology, and then 150 µm thick Al coatings were deposited onto the Ni coatings by arc spray technology. The specimens, in different ceramic boats, were treated by heating as follows under an air atmosphere in the resistance furnace: 973 K/2 h, 973 K/5 h, 973 K/10 h, 973 K/20 h, 1073 K/10 h, and 1173 K/10 h.
There were obvious differences between the structure of the Ni coating prepared by thermal spraying and the Ni metal material prepared by the metallurgical process. Because of the presence of flat particles, pores, and inclusions, the Ni coating prepared by thermal spraying was much more complex. In order to further analyze the formation processing of the NiAl phases which were obtained during the heat treatment of the Al/Ni/Ti specimen, the phase formation processing of the pure Ni substrate with 300 μm pure Al coating during the heat treatment process (973 K/2 h, 973 K/5 h, 973 K/10 h, 973 K/20 h) was first studied under simple conditions in this paper.
The plasma spray equipment used was type Praxair3710 (Praxair, Cleveland, OH, USA), and the arc spray equipment was type XDP-5, which were made by the Shenyang University of Technology. The spraying materials were pure Ni powders (Zhongzhou Metal Materials Co., Ltd., Nangong, China) of 300 mesh with a purity greater than 99.9% and industrial Al welding wire (Naihe Metal Materials Co., Ltd., Jinhua, China) (2 mm in diameter) with a purity greater than 99.8%. The parameters for the plasma spray process and arc spray process are listed in Table 1 and Table 2.
2.2. Test Analysis
The microstructures of the coatings before and after heat treatment were characterized by a scanning electron microscope (SEM; S-3400 and S-4800, Hitachi, Tokyo, Japan). The chemical composition of the diffusion reaction regions was characterized by an energy-dispersive spectrometer (EDS, S-3400, Hitachi, Tokyo, Japan) (the acceleration voltage was 20.0 kV) which was equipped with SEM. The distribution of chemical elements at the coating–substrate interface was characterized by EDS. The intermetallic compounds formed in the diffusion reaction process were characterized by X-ray diffraction (XRD; Shimadzu, 7000, Kyoto, Japan) with Cu-Kα radiation (λ = 0.1541 nm) at 40 kV 30 mA.
In order to test the high temperature oxidation resistance of the NiAl intermetallic which was formed during the heating reaction, the Al2O3 film on the Al/Ni/Ti specimen was removed by waterproof abrasive paper (500#) after the heat treatment. It was then put in a new ceramic boat and dried to a constant weight. The oxidation resistance of the specimen after treatment was tested at 1073 K for 100 h under an air atmosphere in the furnace. Every 10 h, the specimen was removed from the furnace and then cooled to room temperature. The heating rate of the furnace was 20 °C/min and the air cooling rate was about 25 °C/min. The comparative experiments for the pure Ti were performed under the same conditions. The mass gain of the specimen was weighed during every period on an electronic balance, which was accurate to 0.1 mg. The oxidation kinetics curves of the specimen and the pure Ti were then obtained.
3. Results
3.1. Analysis of the Phase Change Process of Coating after Heat Treatment
3.1.1. The Phase Change Process of the Al/Ni Comparative Specimen
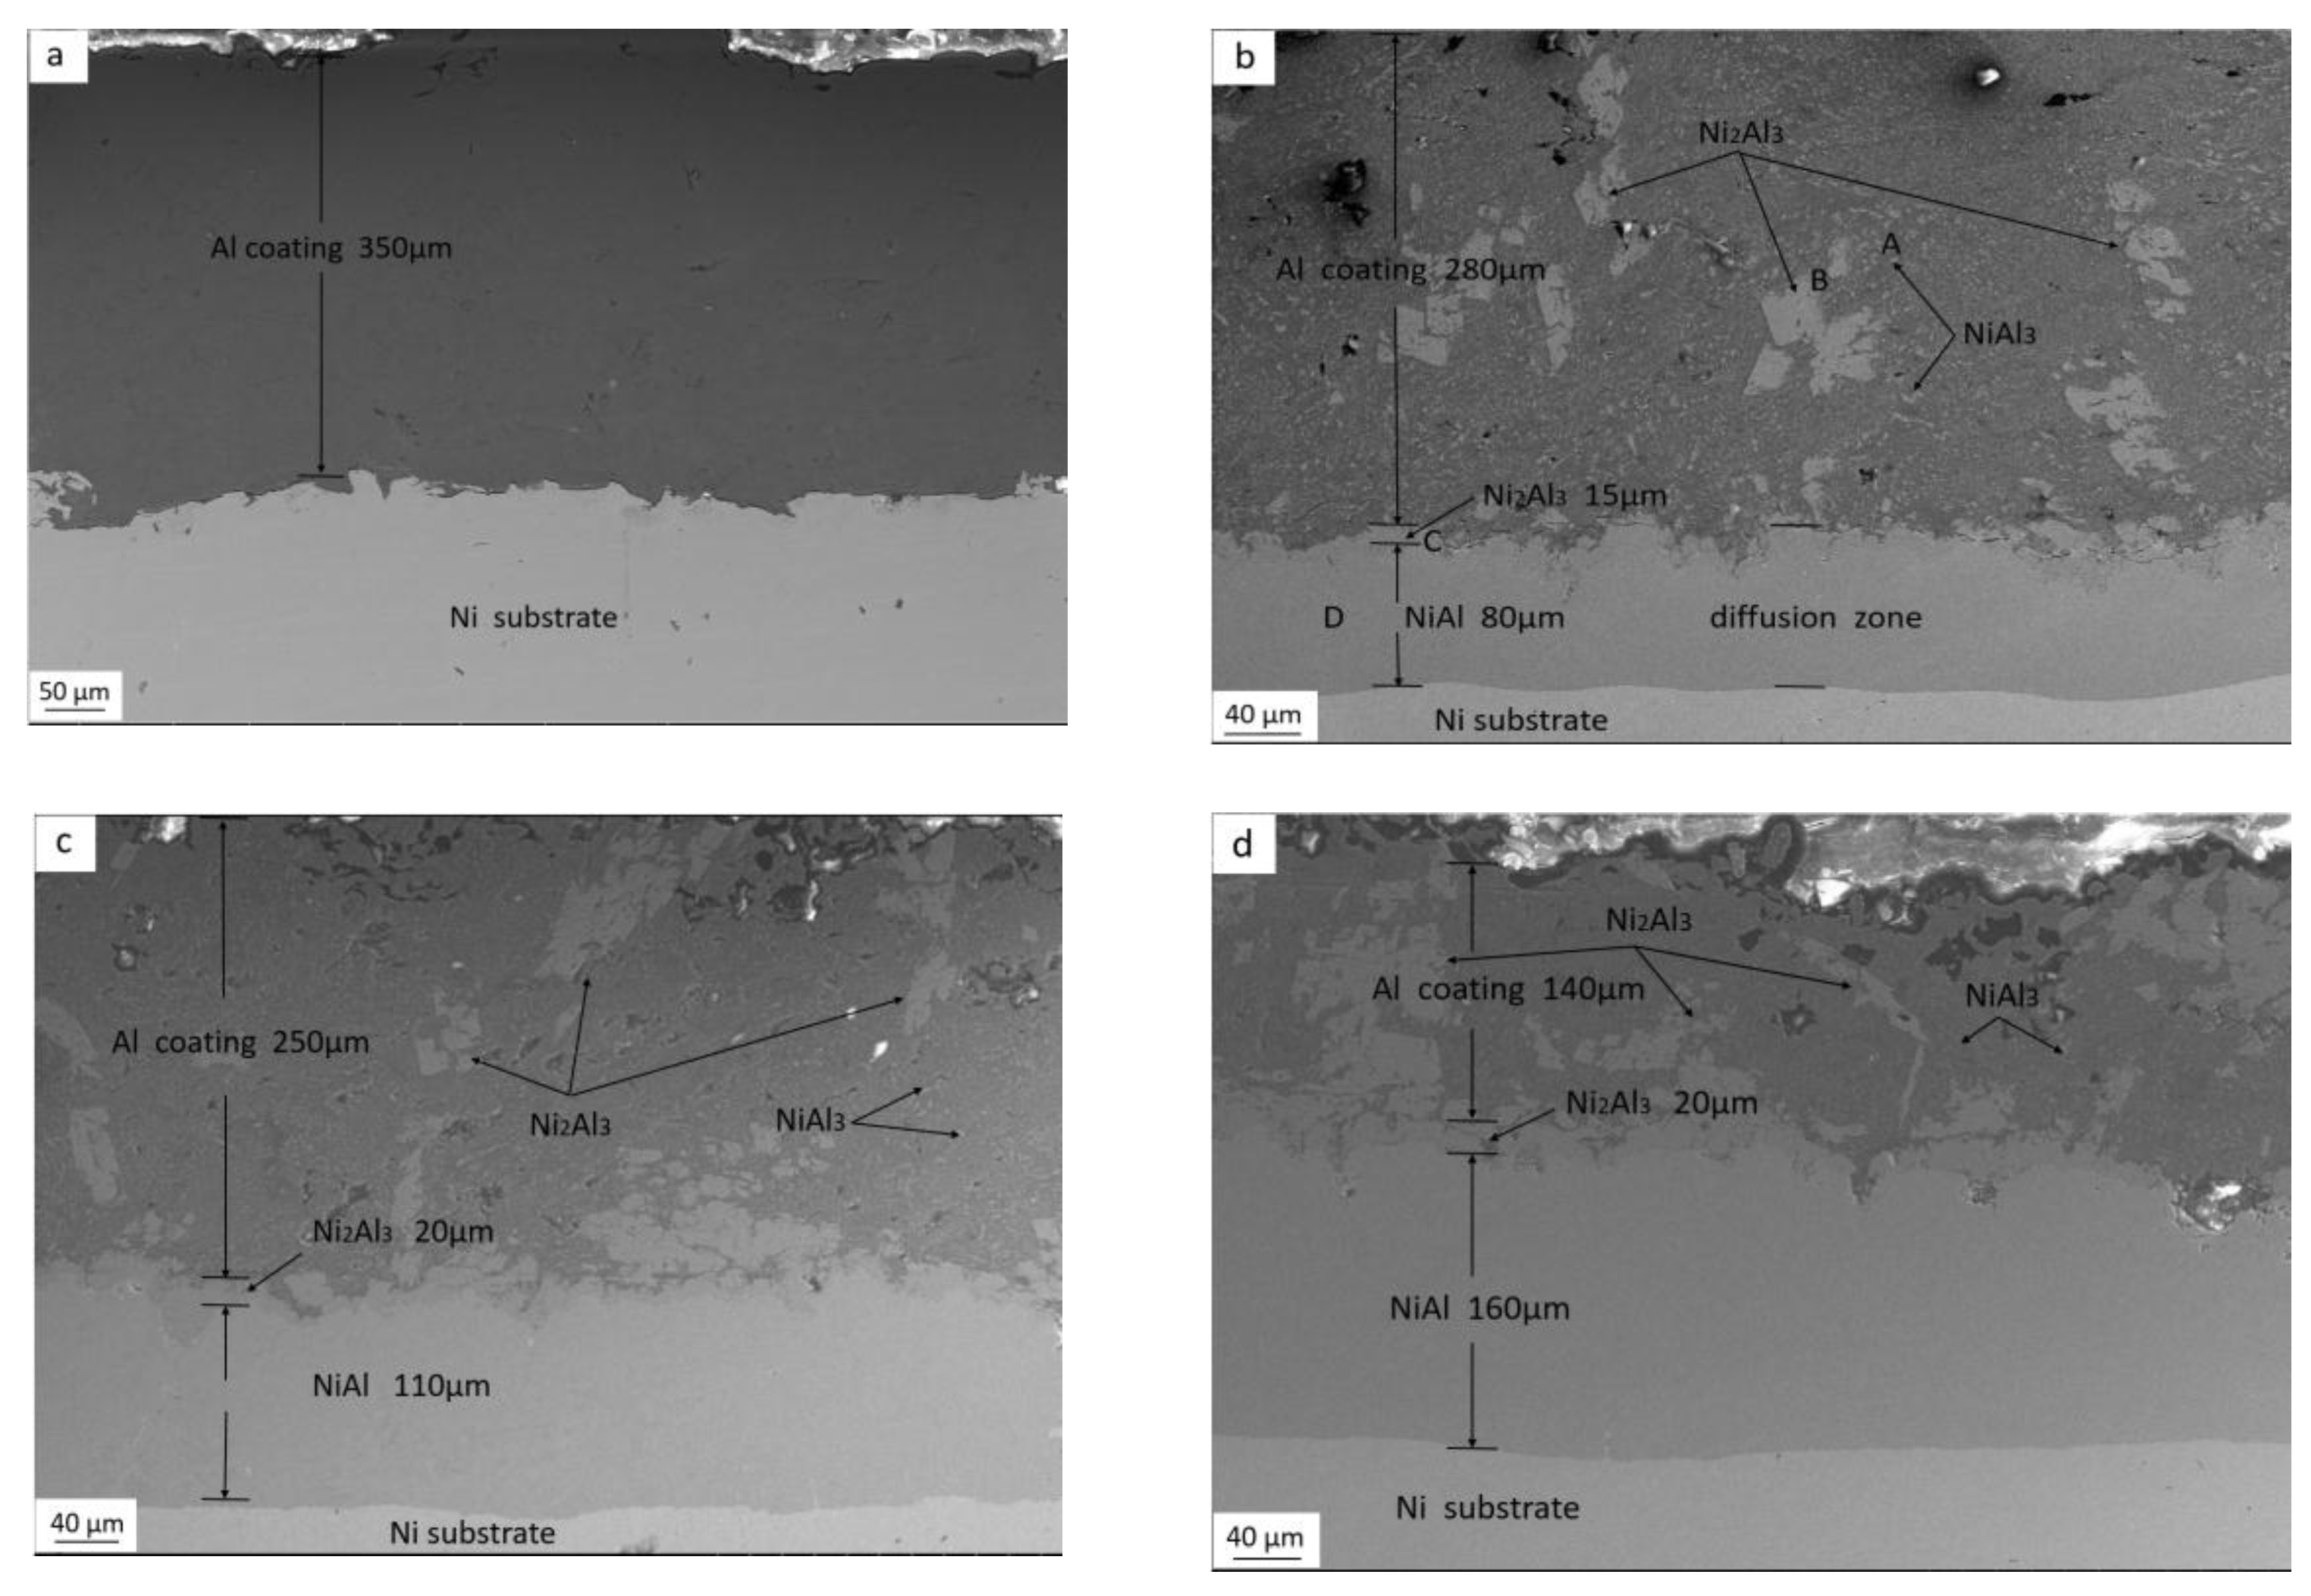
Figure 1a shows the microstructure of the unheated interface. The dark gray areas in the figure are the 350 μm thick Al coating and the lighter areas are Ni.
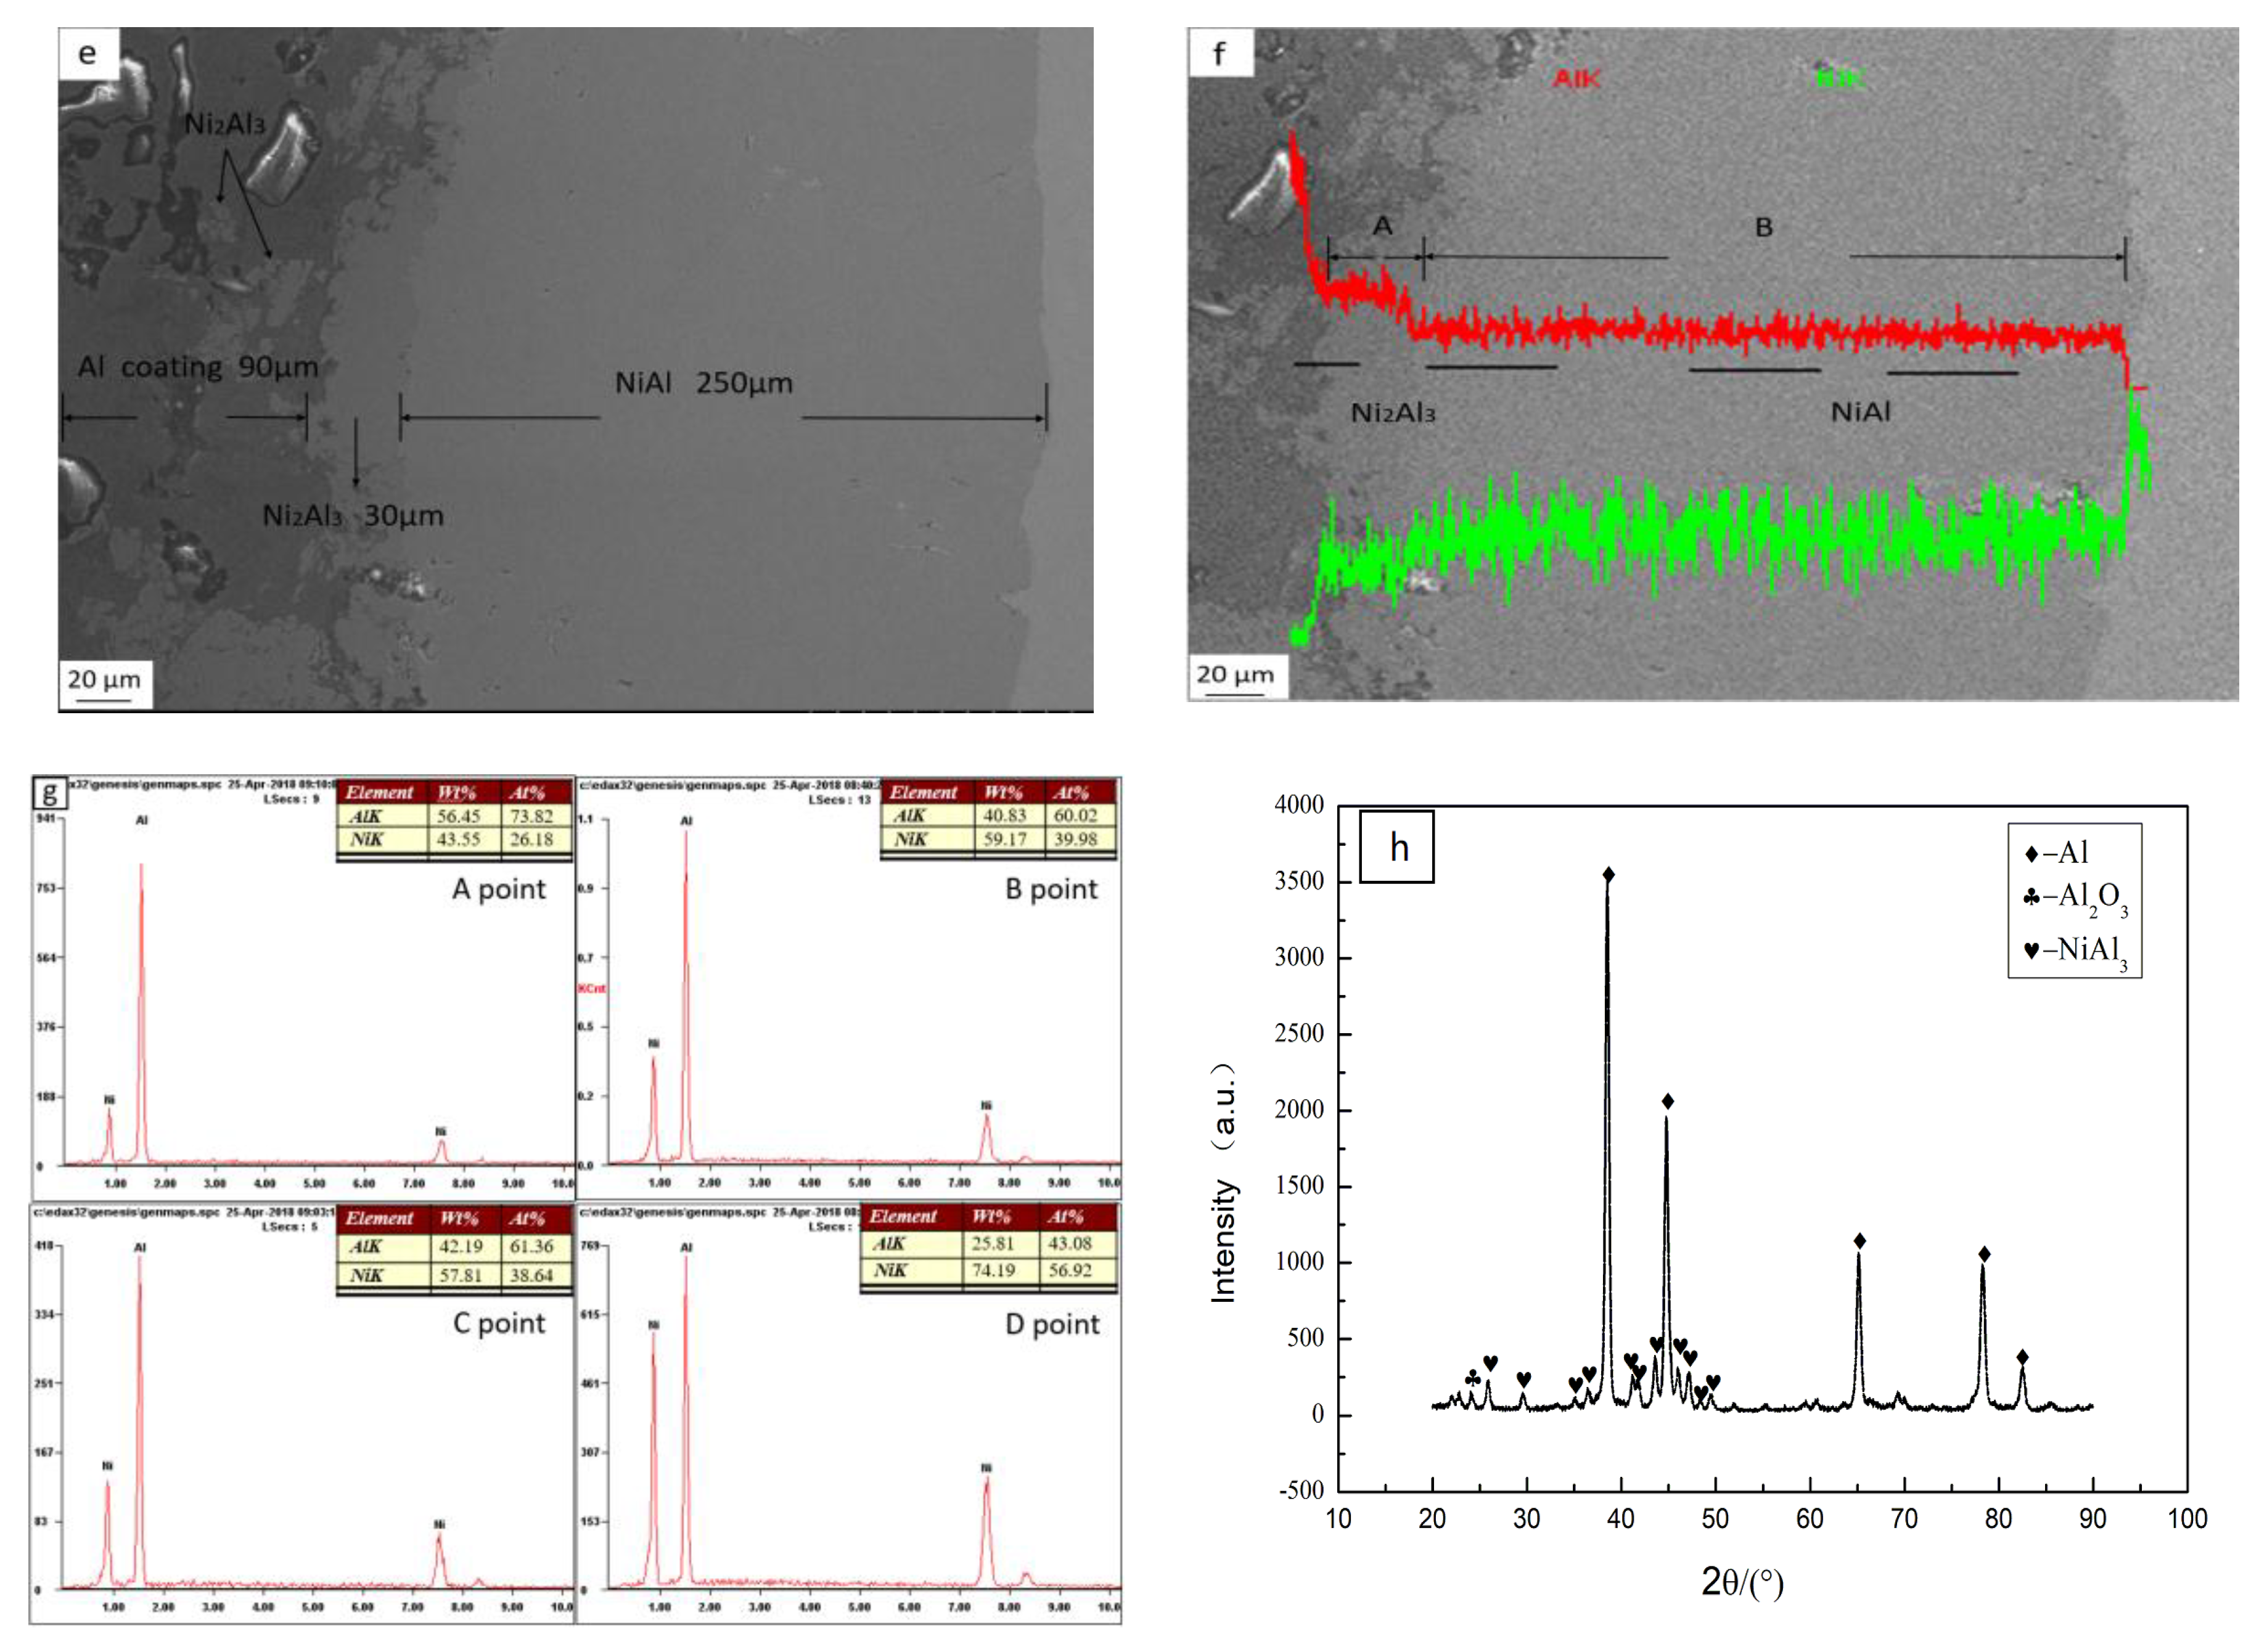
Figure 1b shows the microstructure of the interface that was heated for 2 h at 973 K. As shown in the figure, after heating at 973 K for 2 h, there were some light gray lump-like phases and many small-sized dispersed phases in the Al coating. In addition, a roughly 95 μm-thick diffusion region was formed between the Al coating and the Ni substrate. It can also be seen from Figure 1b that the diffusion region exhibited two different shades; the darker region, which was about 15 μm thick and close to the Al coating, and the lighter region, which was about 80 μm thick and close to the Ni substrate.
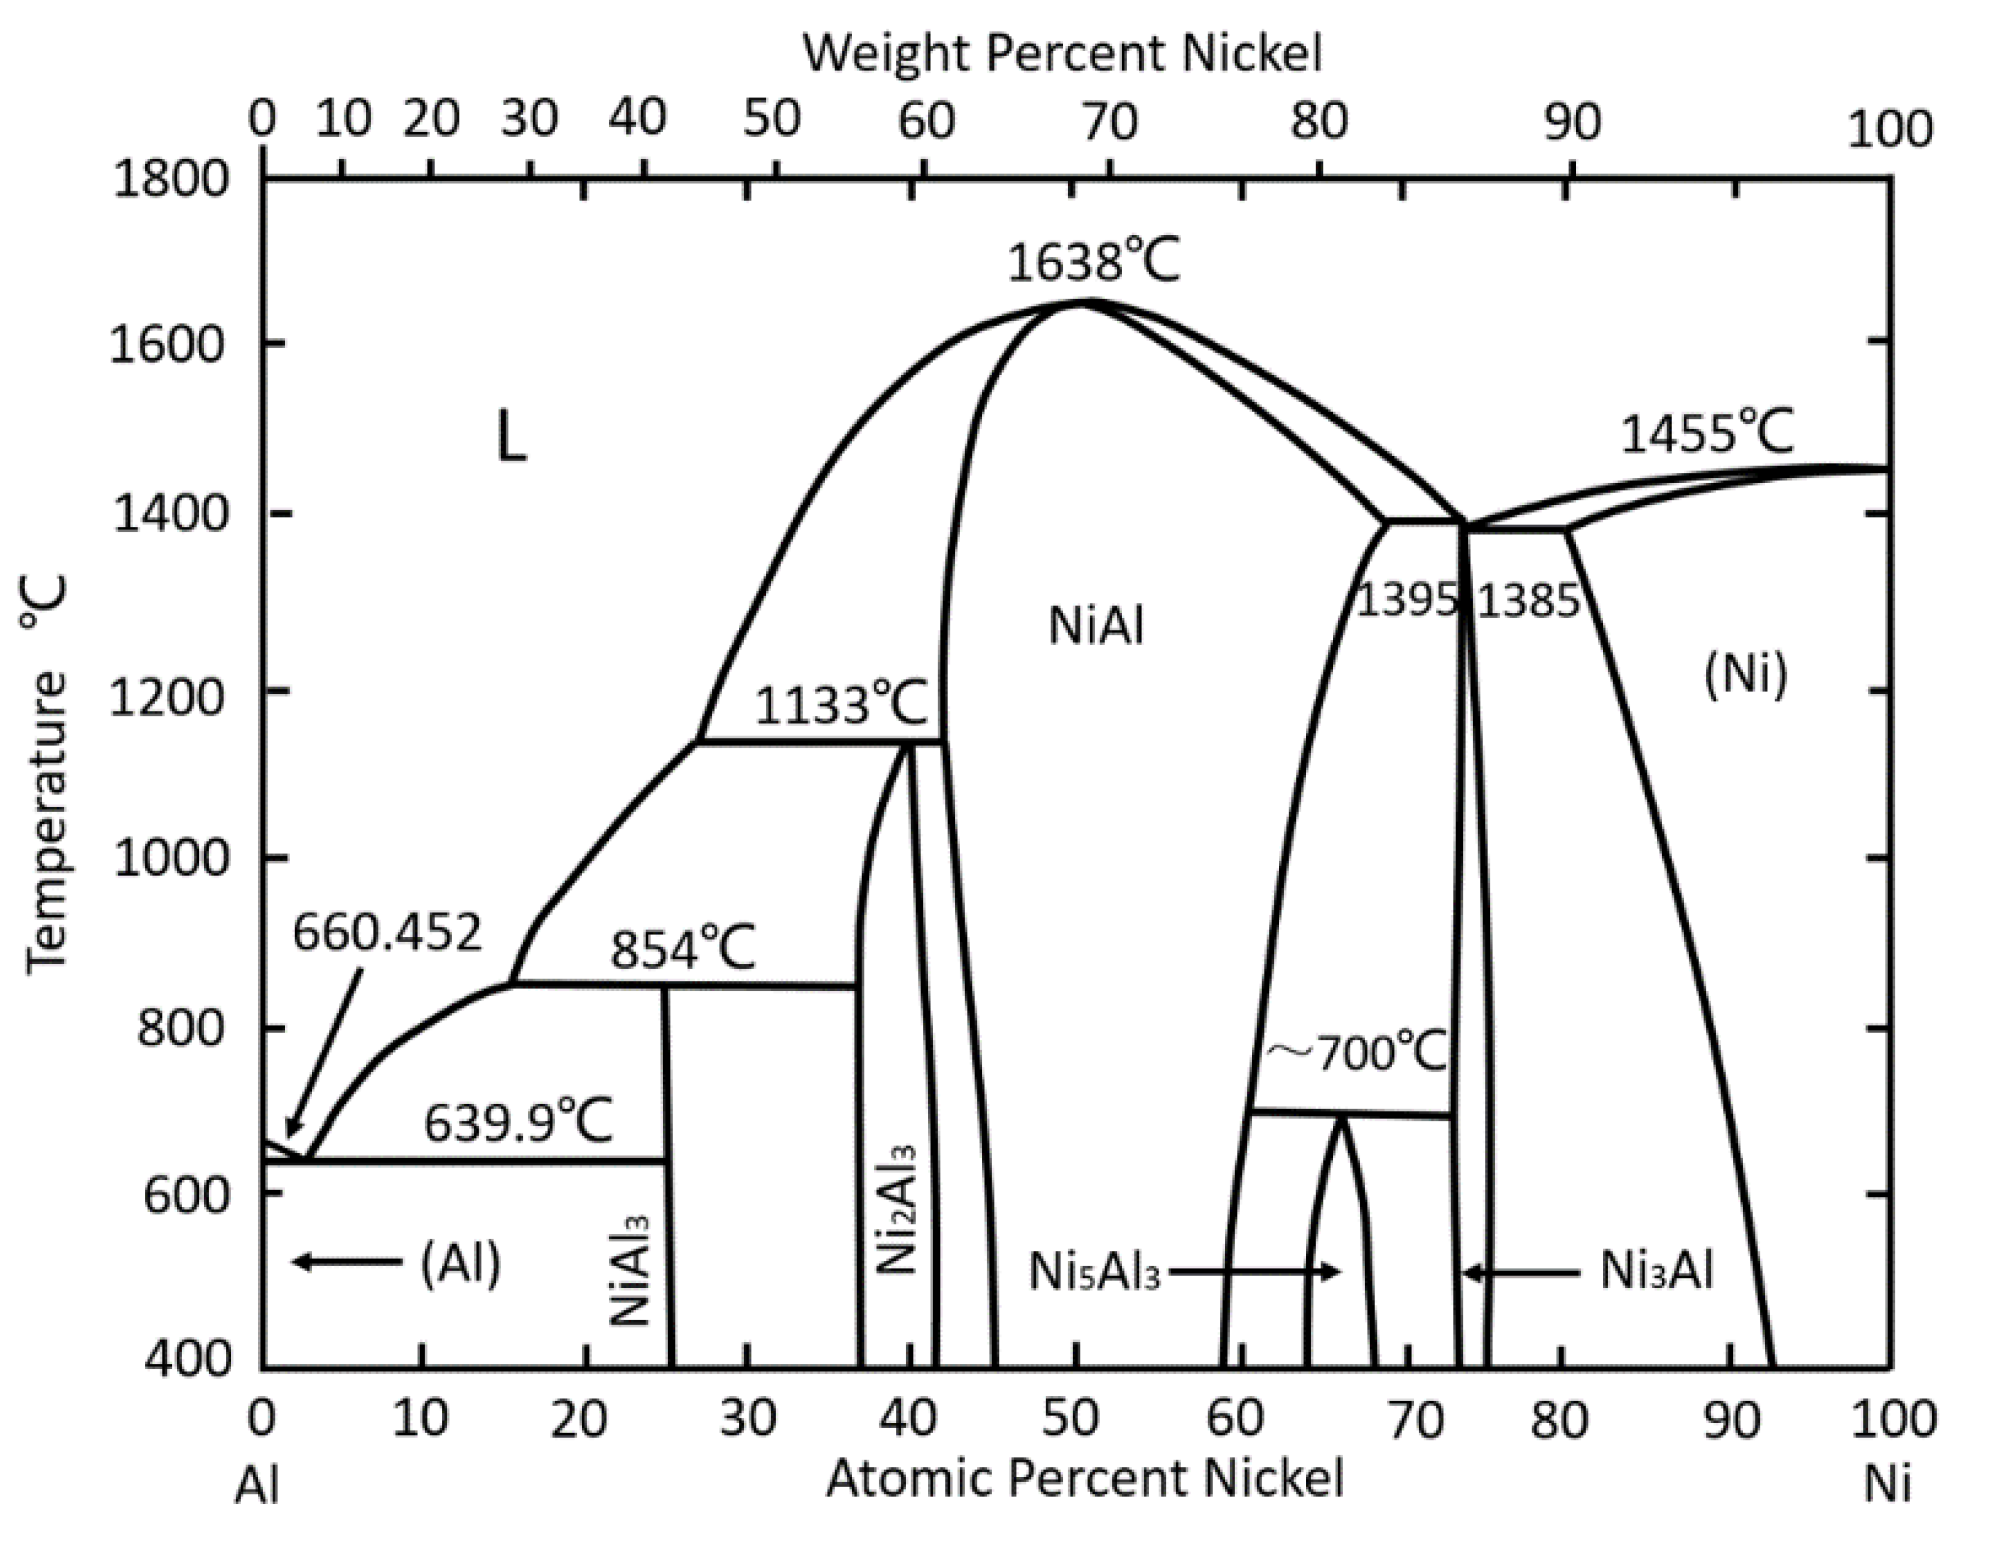
Figure 1g shows the EDS results of the points A, B, C, and D marked in Figure 1b, and it can be seen that the atomic percentages of Al at points A, B, C, and D were 73.82%, 60.02%, 61.36%, and 43.08%. According to the Al-Ni binary system shown in Figure 2 [24], the atomic percentage of Al in the NiAl3 phase was 75% and the atomic percentage of Al in Ni2Al3 phase was 58–63%. When the atomic percentage of Al was in the wide range of 41% to 55%, NiAl phase could be formed. The NiAl phases were rich in Ni when the atomic percentage of Al was below 50%, and the phases were rich in Al when the atomic percentage of Al was above 50%. It can be hypothesized that the small dispersed phases at point A were intermetallic NiAl3, the lump-like phases of point B were Ni2Al3, the 15 µm thick phase at point C was Ni2Al3, and the 80 µm thick phase at point D was NiAl.
Figure 1h is the XRD pattern of the Al coating after testing for 2 h at 973 K. As shown in Figure 1h, the diffraction peak of Al, Al2O3, and NiAl3 phases were observed in the XRD spectrum. There was still some elemental Al on the surface of contrast specimen after testing for 2 h at 973 K, and little Al was oxidized to Al2O3. In addition, the NiAl3 phase was formed during the in-situ reaction between Al and Ni. However, the diffraction peak of the Ni2Al3 and NiAl phase could not be observed in the XRD spectrum; this might result from the fact that the thickness of the unreacted Al coating on the surface of contrast specimen was too thick such that X-rays could not penetrate it.
Therefore, it was assumed that after heating at 973 K for 2 h, dispersed NiAl3 phases, lump-like Ni2Al3 phases, and a layered NiAl phase that had a certain thickness were formed in order, advancing to the Ni substrate.
Figure 2 shows that the melting point of the NiAl3 phase was very low (1127 K); and the reaction Ni + 3Al = NiAl3 is an exothermic reaction, while all the NiAl3 phases formed in the heat treatment were melted and dispersed in liquid Al at 973 K. The melting point of the Ni2Al3 phase was likewise relatively low (1406 K), and the formation of Ni2Al3 was an exothermic reaction as well [25,26]. During this stage, part of the Ni2Al3 phase was melted and dispersed in liquid Al, while some Ni2Al3 phase was not melted and formed a Ni2Al3 intermetallic compound with a certain thickness. The NiAl phase was a kind of β phase electron intermetallic compound which had a similar B2 structure. The melting point of the NiAl phase was higher (1911 K), so the NiAl phases were not melted with the NiAl3 and Ni2Al3 phases, and they could exist stably, finally forming a region that had a certain thickness.
Figure 1c–e are cross-sectional SEM images of the Al coating after heating for 5, 10, and 20 h at 973 K. As shown in these figures, the elemental Al continuously diffused towards the Ni substrate under the action of the driving force of the concentration gradient as the reaction time prolonged. The thickness of the NiAl phase also increased with the advance of diffusion front of Al, and the thickness of Al coating decreased gradually with the continuous diffusion of Al. Likewise, with the constant reduction of the concentration of Al, the growth rate of Al-rich NiAl3 and Ni2Al3 phases was slower. As a result, the amount of lump-like Ni2Al3 phases and dispersed small-sized NiAl3 phases which were floating in the Al coating didn’t increase. The increase in the thickness of the Ni2Al3 phase which was not completely melted was very small.
As shown in Figure 1f, steps appeared in the intensity when the concentration profiles of the elemental Al and Ni moved through the interface between the Al coating and region A; and between region A and region B. This means that the composition changed at each interface and different kinds of intermetallic compounds were formed. The concentration profiles of the elemental Al and Ni appeared as two steps in region A and region B. The results showed that region A and region B were both single-phase structures and were composed of different intermetallic compounds. This was a second method confirming the existence of Ni2Al3 and NiAl phases.
3.1.2. The Phase Change Process of Al/Ni Composite Coating on the Surface of Ti Substrate
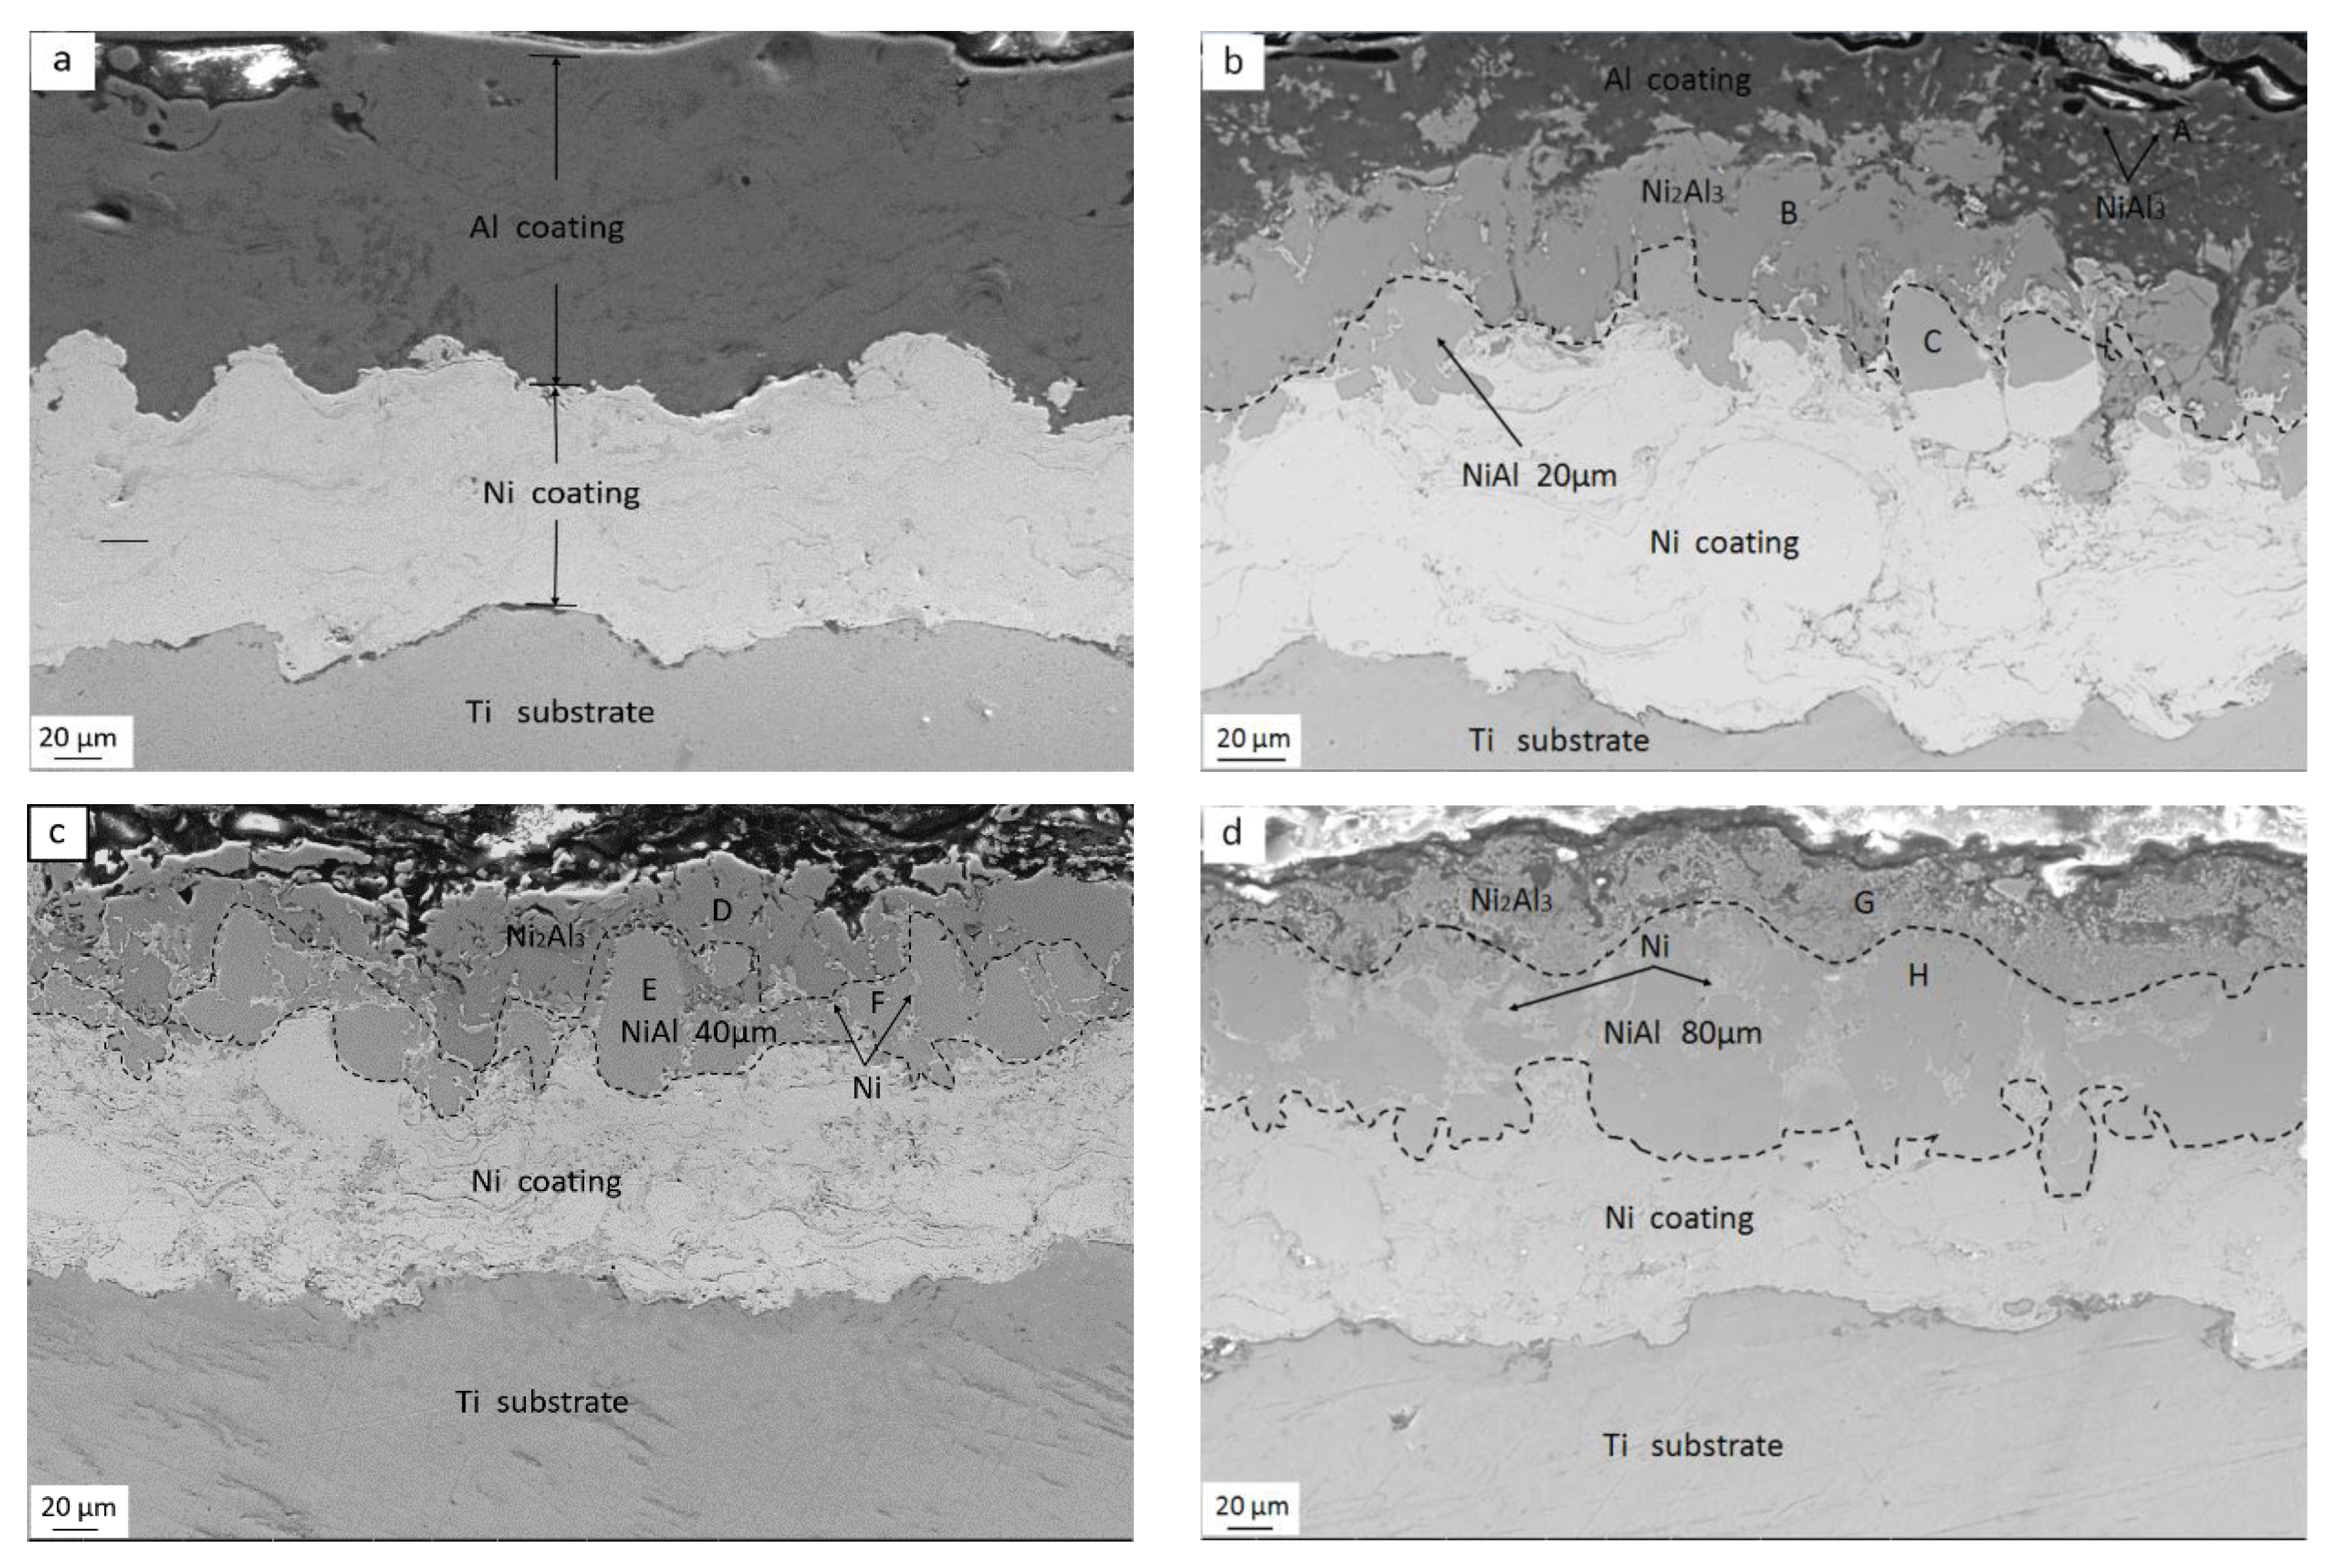
Figure 3a is a cross-sectional SEM image of the Al/Ni coating without heating. As shown in the figure, the intermediate light gray zone was a 130 µm-thick Ni coating, the Ti substrate was under the Ni coating, and there was a 170 µm-thick pure Al coating on the Ni coating. The thermal sprayed coating was composed of a mass of deformed particles which were stacked mutually upon one another [27], and the interface between the Al coating and Ni coating also exhibited a kind of wave-like structure.
Figure 3b–e are the cross-sectional SEM images of the Al/Ni coating after testing for 2, 5, 10, and 20 h at 973 K. As shown in Figure 3b, the diffusion region exhibited a kind of layered structure which had different depths, and there were some dispersed small size phases floating in the Al coating. Comparing the atomic percentage of Al at points A, B, and C in Table 3 and of the different Ni-Al intermetallic compounds, it might be determined that the dispersed small size phases were NiAl3, the darker layered structure close to the Al coating was composed of a Ni2Al3 phase, and the lighter layered structure close to the unreacted Ni coating was composed of NiAl phase. Namely, the elemental Al continuously diffused towards the Ni coating during the reaction, and the Al-rich NiAl3, Ni2Al3 phases and Ni-rich NiAl phase were formed in order while advancing to the Ti substrate with the decrease of Al content. As the reactions that caused the Al and Ni to form Ni-Al intermetallic compounds were exothermic, and the melting points of the NiAl3 and Ni2Al3 phases were not high, all the NiAl3 phases which had low melting points were melted and dispersed in liquid Al, while some of the Ni2Al3 phases were melted and dispersed in liquid Al also, but the NiAl phases which had a high melting point could exist stably.
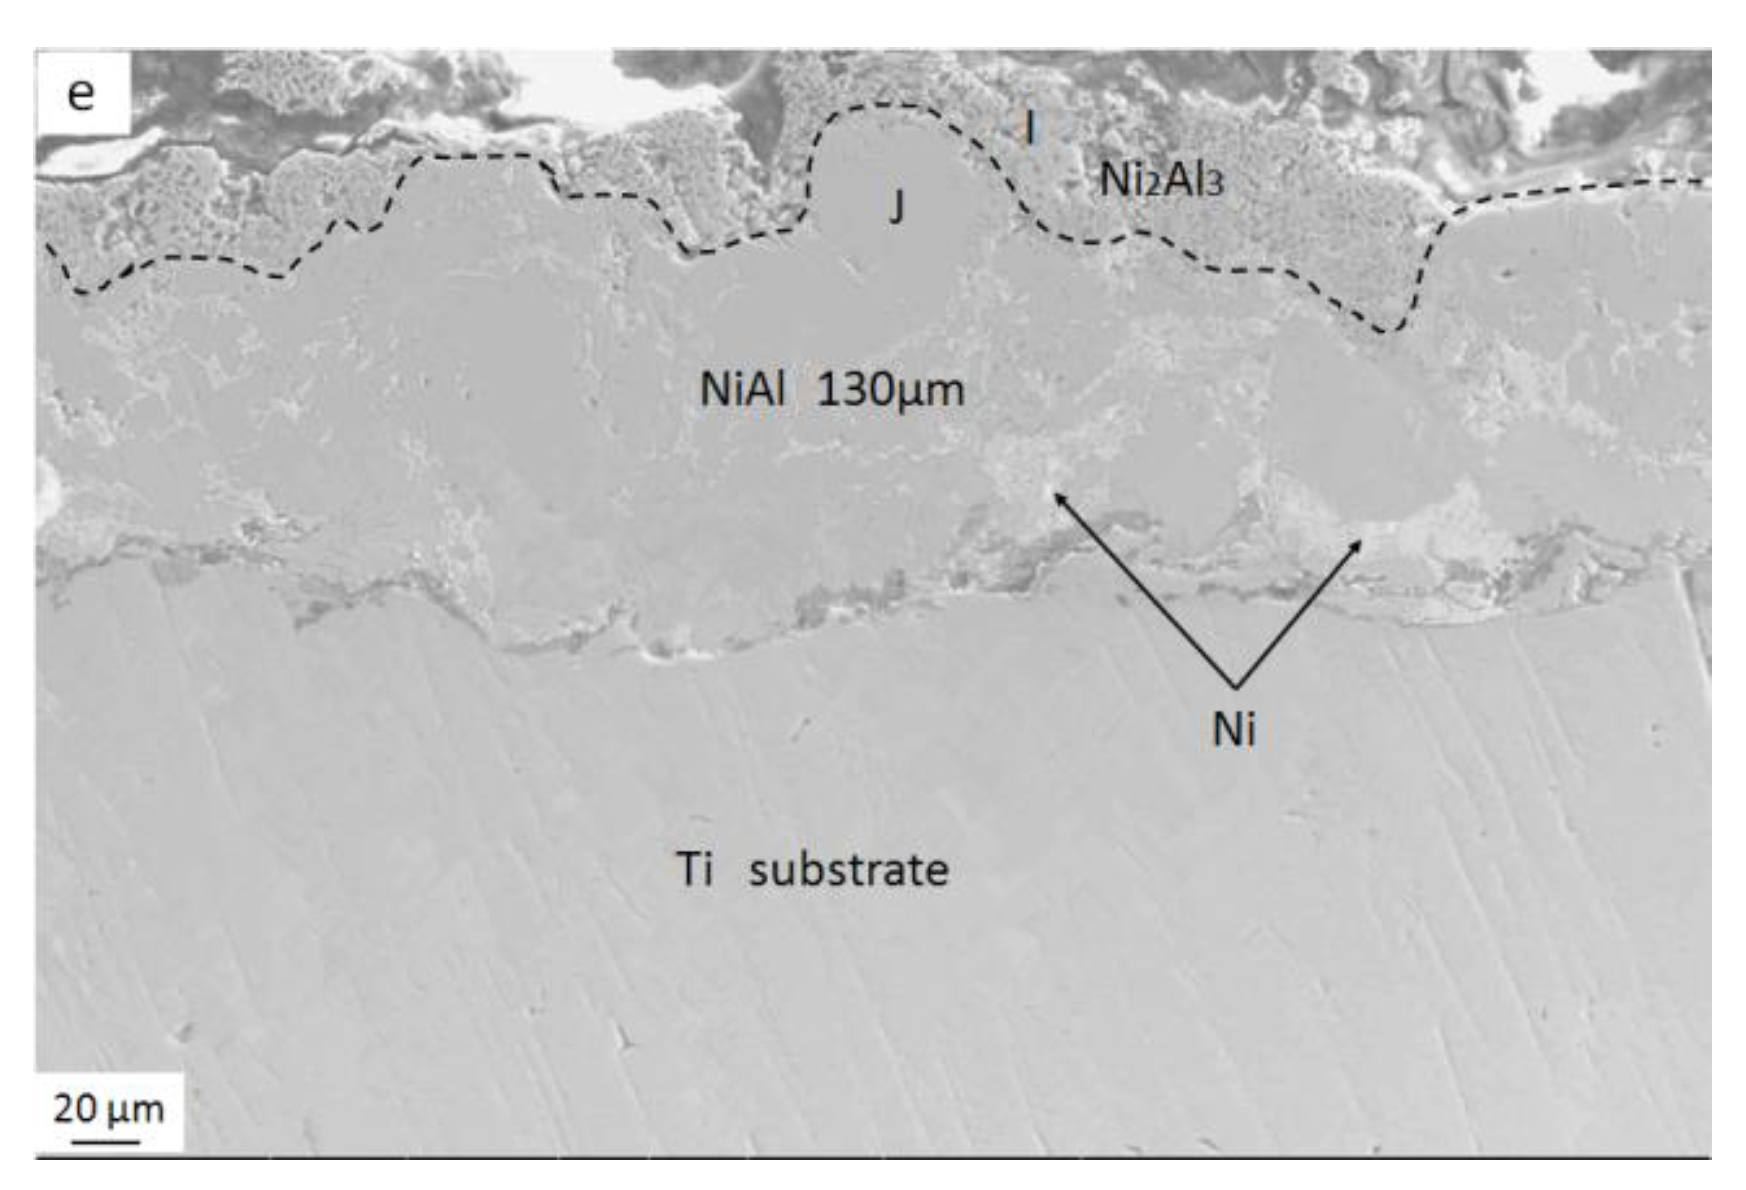
Comparing the atomic percentage of Al at points D, E, G, H, I, and J in Table 3 and the different Ni-Al intermetallic compounds, it might be determined that the phases represented by points D, G, and I were Ni2Al3 intermetallic compounds and the phases represented by E, H, and J were NiAl intermetallic compounds. According to the EDS results, the phase that was represented by point F was pure Ni; i.e., there were some unreacted elemental Ni in the diffusion reaction region.
As shown in Figure 3b–e, as the reaction time prolonged, the thickness of the NiAl region continually increased under the action of the driving force of the concentration gradient. After 20 h, the diffusion front of Al reached the surface of Ti substrate, and most of the Ni coating had reacted with Al.
3.2. Effect of Heating Temperature and Time on the Formation of the Phase and the Depth of Phase Change Reaction
3.2.1. Effect of Heating Time on the Formation of Phase
As shown in Figure 2, the Ni-Al binary phase diagram, five kinds of Ni-Al intermetallic compounds (NiAl3, Ni2Al3, NiAl, Ni5Al3, and Ni3Al) could be formed with the reduction of Al content. However, whether in the Al/Ni comparative specimen or Al/Ni/TI specimen, only three obvious Ni-Al intermetallic compounds (NiAl3, Ni2Al3, NiAl) could be found in the Al and Ni reaction zone under the different heat treatment conditions in this paper. This result was similar to that of Goward’s result [28], but that study mainly researched the mechanisms of the formation of diffusion aluminide coatings on nickel-based superalloys. The in-situ reaction process of Al/Ni composite coating on the surface of Ti substrate was not mentioned, but there were obvious differences between the structure of Ni coating and the Ni metal material.
In theory, the Ni3Al phase should be formed at the diffusion frontier of Al alongside the decrease in the concentration of the elemental Al. However, the Ni3Al phase was not found by SEM/EDS/XRD; this might be due to the fact that the amount of the Ni3Al phases was too small. Moreover, only with a large number of the elemental Ni diffusing from Ni coating to NiAl phase, the phenomenon whereby the NiAl phase converted to a Ni3Al phase on a large scale happened. However, the highest temperature in this paper was 1173 K and the melting point of Ni was 1726 K; as a result, such a phenomenon hardly occurred in this paper.
In addition, the NiAl3 phase and Ni2Al3 phase which were formed in the diffusion reaction region of Al/Ni comparative specimen or Al/Ni/Ti specimen were both fully or partially melted and dispersed in the Al coating, and only the high-melting-point NiAl intermetallic could exist stably. A region (with a certain thickness) that was composed of NiAl phase was finally formed.
3.2.2. The Effect of Heating Time on the Depth of Phase Change Reaction
As can be seen in Table 4, there was a significant difference between the Al/Ni comparative specimen and the Al/Ni/Ti specimen in the growth rate of NiAl intermetallic phase that was generated in the diffusion reaction region. Compared to the NiAl comparative specimen, the thickness of NiAl phase which was formed by the Al/Ni/Ti specimen was much thinner after the same heating time, and the increments of thicknesses of NiAl phase were also relatively few as the reaction time was prolonged. This was because there were obvious differences between the original microstructure of Ni coating prepared by thermal spraying and the Ni metal material prepared by the metallurgical process, so the diffusion speeds of the liquid Al in the Ni coating and the Ni metal material were different.
3.2.3. Effect of Heating Temperature on the Depth of Phase Change Reaction
Figure 4a,b are the cross-sectional SEM images of the Al/Ni coating after testing for 10 h at 1073 K and of the Al/Ni coating after testing for 10 h at 1173 K. As shown in Figure 4a,b, the higher the temperature, the easier the diffusion from Al to Ni coating. A 130 µm-thick Ni coating was penetrated by the elemental Al after 20 h at 973 K, a 150 µm-thick Ni coating was penetrated by elemental Al after only 10 h at 1073 K, and most of the Ni coating reacted with Al. When the reaction temperature was 1173 K, the elemental Al not only penetrated the 150 µm-thick Ni coating but also diffused into the Ti substrate after 10 h.
Figure 5 is the XRD pattern of Al/Ni coatings after 973 K/20 h, 1073 K/10 h, and 1173 K/10 h in-situ reactions. Since EDS analysis has limitations, the phases were also characterized by X-ray diffraction. The melting points of and NiAl3 and Ni2Al3 phases were low, and the reactions by which Al and Ni formed Ni-Al intermetallic compounds were exothermic reactions; as a result, as shown in Figure 3b, the NiAl3 and Ni2Al3 phases were mixed with Al coating. Except for the diffusion to Ni coating, Al was also oxidized, and Al2O3 was formed during the heat treatment process. The NiAl3 and Ni2Al3 phases might be peeled off from the specimen along with the breaking of Al2O3. Thus, as shown in Figure 3e (cross-sectional SEM images of the Al/Ni coating after testing for 20 h at 973 K) and Figure 4a (cross-sectional SEM image of the Al/Ni coating after testing for 10 h at 1073 K), no obvious NiAl3 phase could be found in the images, and, as shown in Figure 4b (cross-sectional SEM image of the Al/Ni coating after testing for 10 h at 1173 K), only an obvious NiAl phase could be found in the image.
As a result, the diffraction peak of the NiAl3 phase could not be obviously observed in the XRD spectrum after heating for 20 h at 973 K and 10 h at 1073 K, and only the obvious diffraction peak of the NiAl phase was observed in the XRD spectrum after heating for 10 h at 1173 K. These results confirmed the findings from EDS.
3.3. Analysis of the Relevant Theories of In-Situ Formation of NiAl Intermetallic Compounds
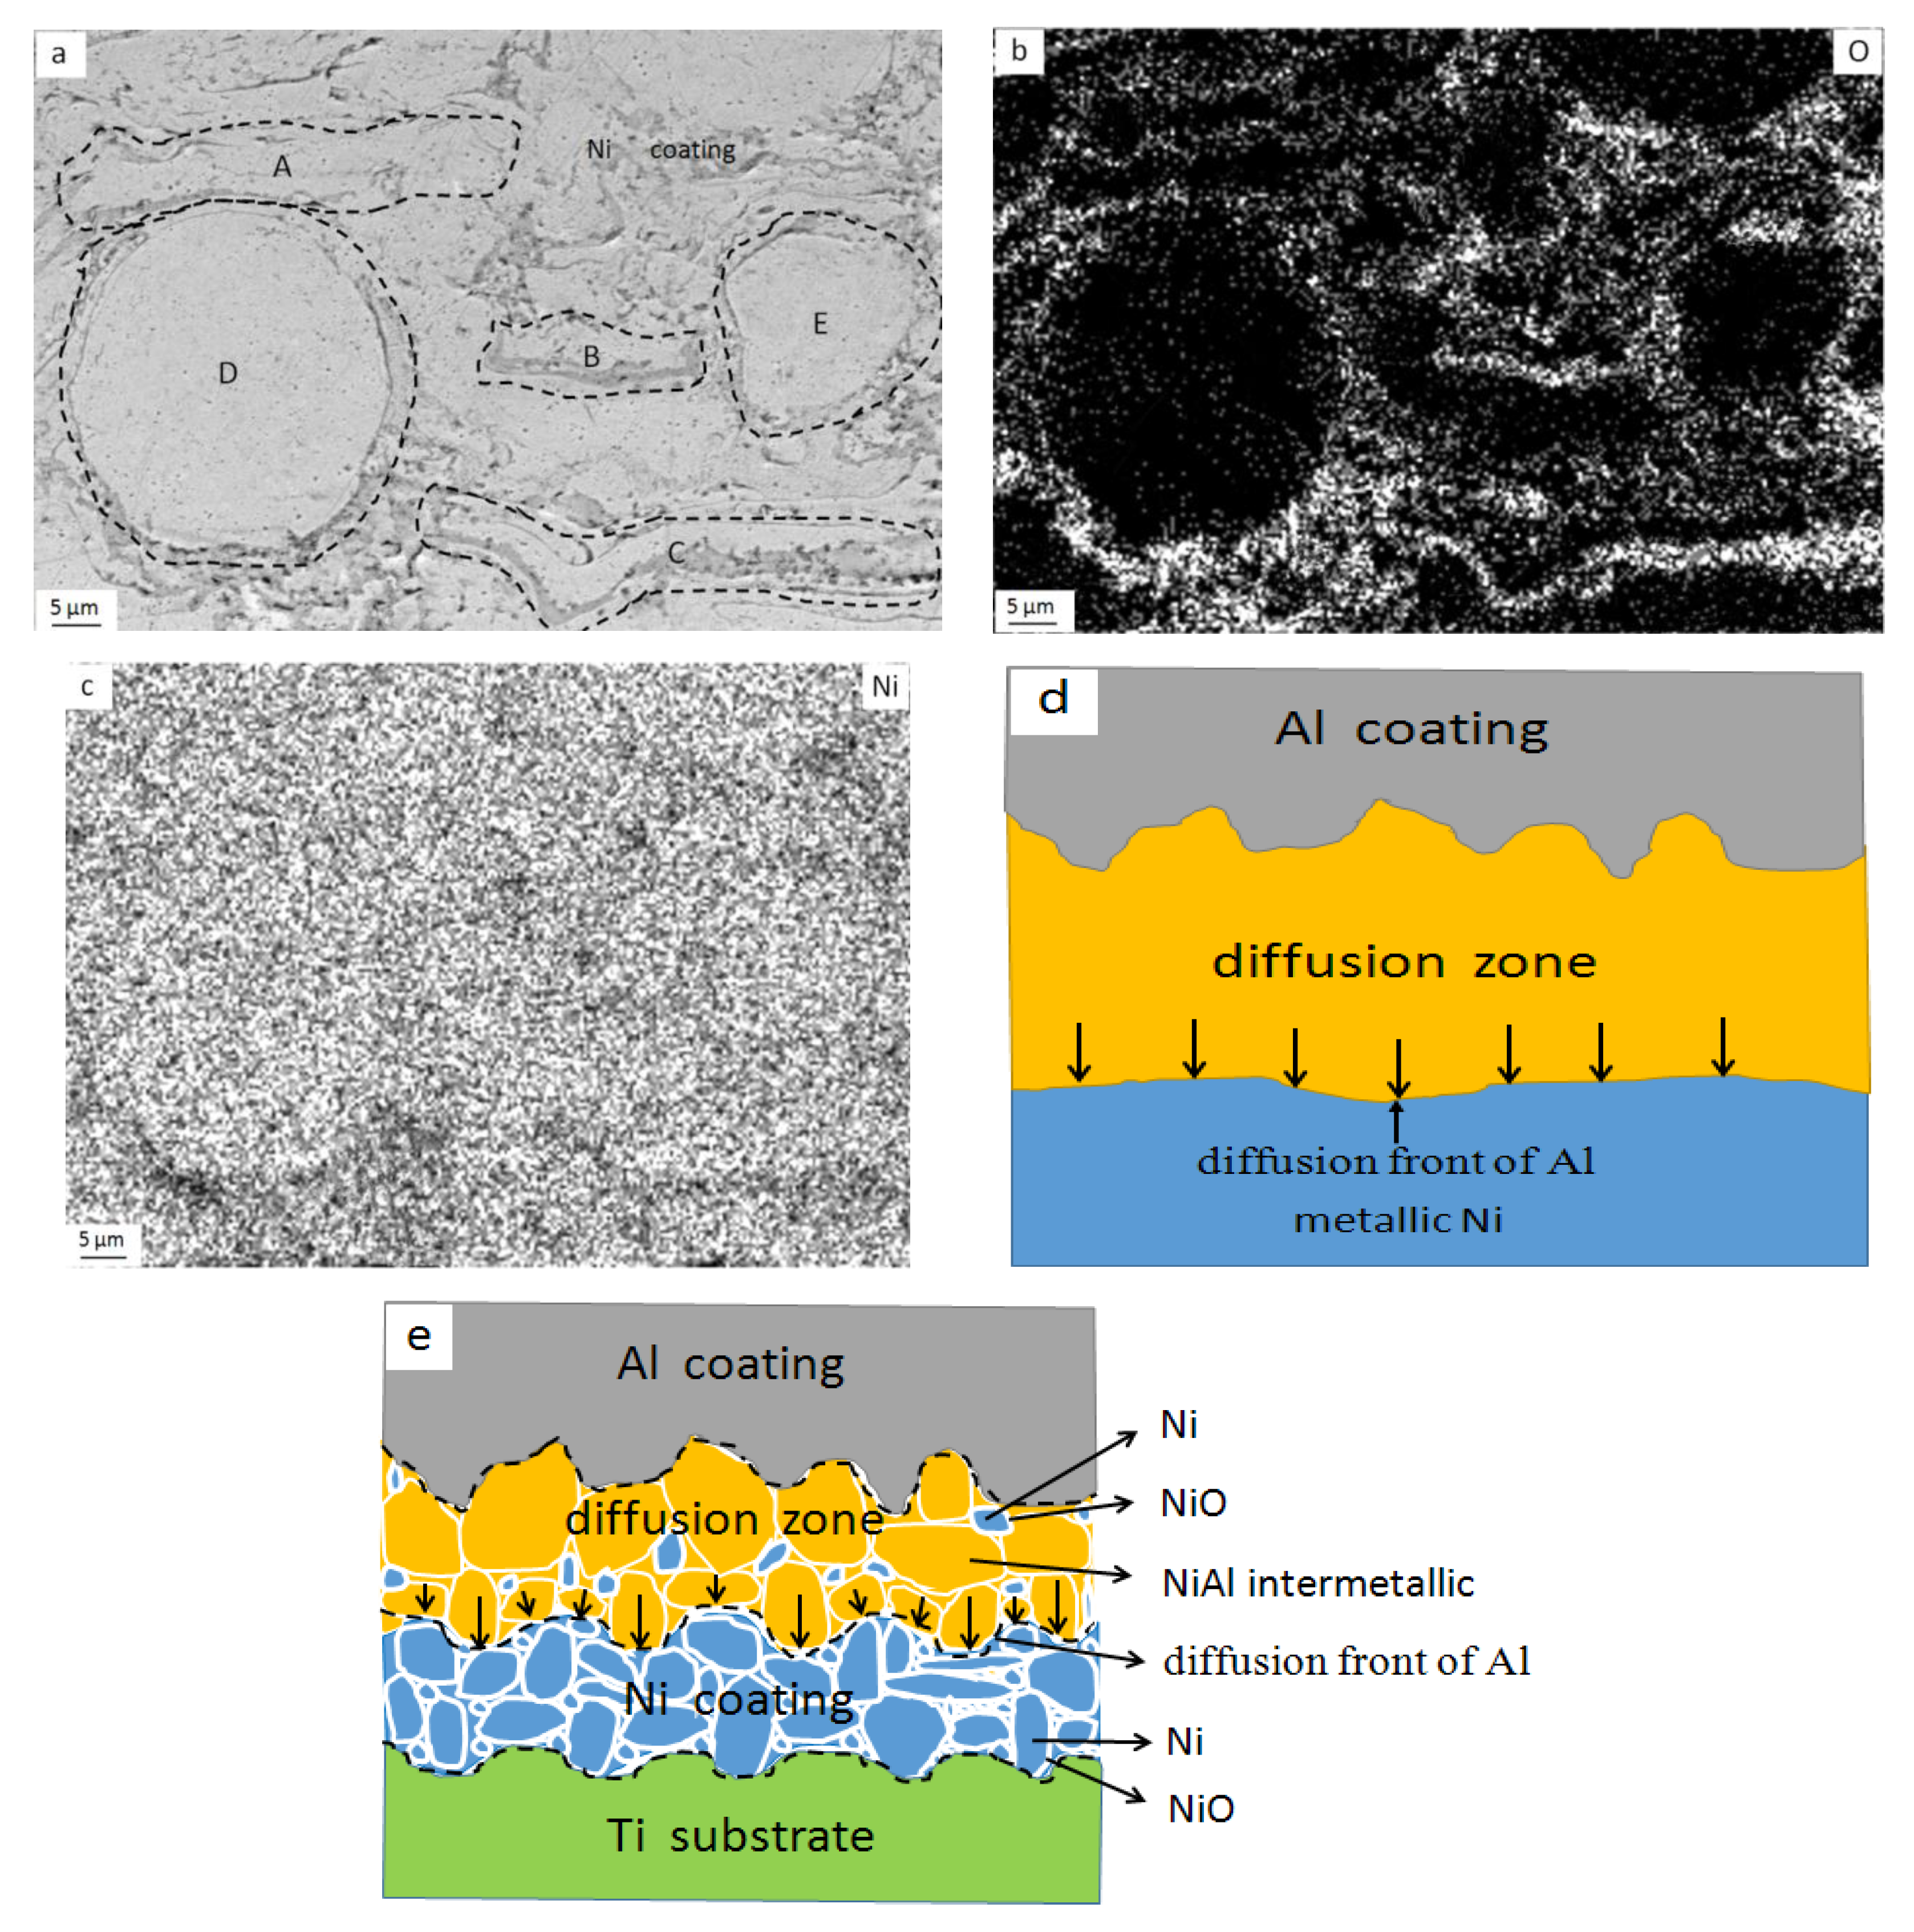
The experiments found that the diffusion front of Al in the Al/Ni comparative specimen was basically straight, but the diffusion front of Al in the Ni coating was uneven, and the diffusion varied greatly in depth everywhere as shown in Figure 1b–e, the cross-sectional SEM images of Al coating after testing for 2, 5, 10, and 20 h at 973 K, and Figure 3b–e, the cross-sectional SEM images of Al/Ni coating after testing for 2, 5, 10, and 20 h at 973 K. The reason for this phenomenon was considered to be as follows: the lattice of the Ni metal material prepared by metallurgical process was continuous and Al could be uniformly diffused in it. However, as shown in Figure 6a,e, the plasma sprayed Ni coating was composed of particles that were different in shape and stacked mutually upon one another; some spray particles become flat and relatively thin during the collision between the spraying particles and Ti substrate, as shown in Figure 6a (the particle represented by points A, B and C), and some particles were thicker, as shown in Figure 6a (the particle represented by points D and E). Thus, the diffusion depth of Al in Ni coating was different along with the varying thickness of the Ni spraying particles.
Generally, the Ni coating was less dense than Ni metals, but as can be seen again in Figure 1b–e, Figure 3b–e, and Table 4, the diffusion and reaction depth of Al in the comparative specimens was greater than in the Ni coating under the same conditions; with a difference of 2–4 times, the phenomenon above was unusual. However, as the thermal spray process of coating was conducted in a normal atmospheric environment, although argon could be used as the protective gas, the surfaces of the spraying particles were inevitably oxidized during flight. In the subsequent process of deposition and flattening, some of the oxides were broken, but some oxides also remained between the flat particles, blocking the diffusion of Al to the Ni coating. As shown in Figure 6b,c, the Ni coating was composed of spray particles that were wrapped in NiO oxidation films. The encapsulations (NiO) of the particles showed a relative integrity, which made it difficult for elemental Al to react with the inner Ni. As a result, all the Ni-Al intermetallic compounds in the comparative specimens were formed strictly in a layered distribution structure. But, in the Ni coating not only was an uneven diffusion front formed, but also some unreacted Ni particles remained in the rear of the compound layer. Only when there were cracks in the NiO oxidation films on the surface of the Ni spraying particles did the Al penetrate through the cracks into the inner Ni and react with it sufficiently. As shown in Figure 3b–e, the cross-sectional SEM images of Al/Ni coating after testing for 2, 5, 10, and 20 h at 973 K, the content of unreacted Ni in the diffusion reaction region gradually decreased with the increase of reaction time or reaction temperature. Thus, the diffusibility of Al was improved with the continuous progress of the metallurgical reaction and the increase of temperature in the reaction region, allowing Al to penetrate through NiO into the inner Ni again and further react with it sufficiently.
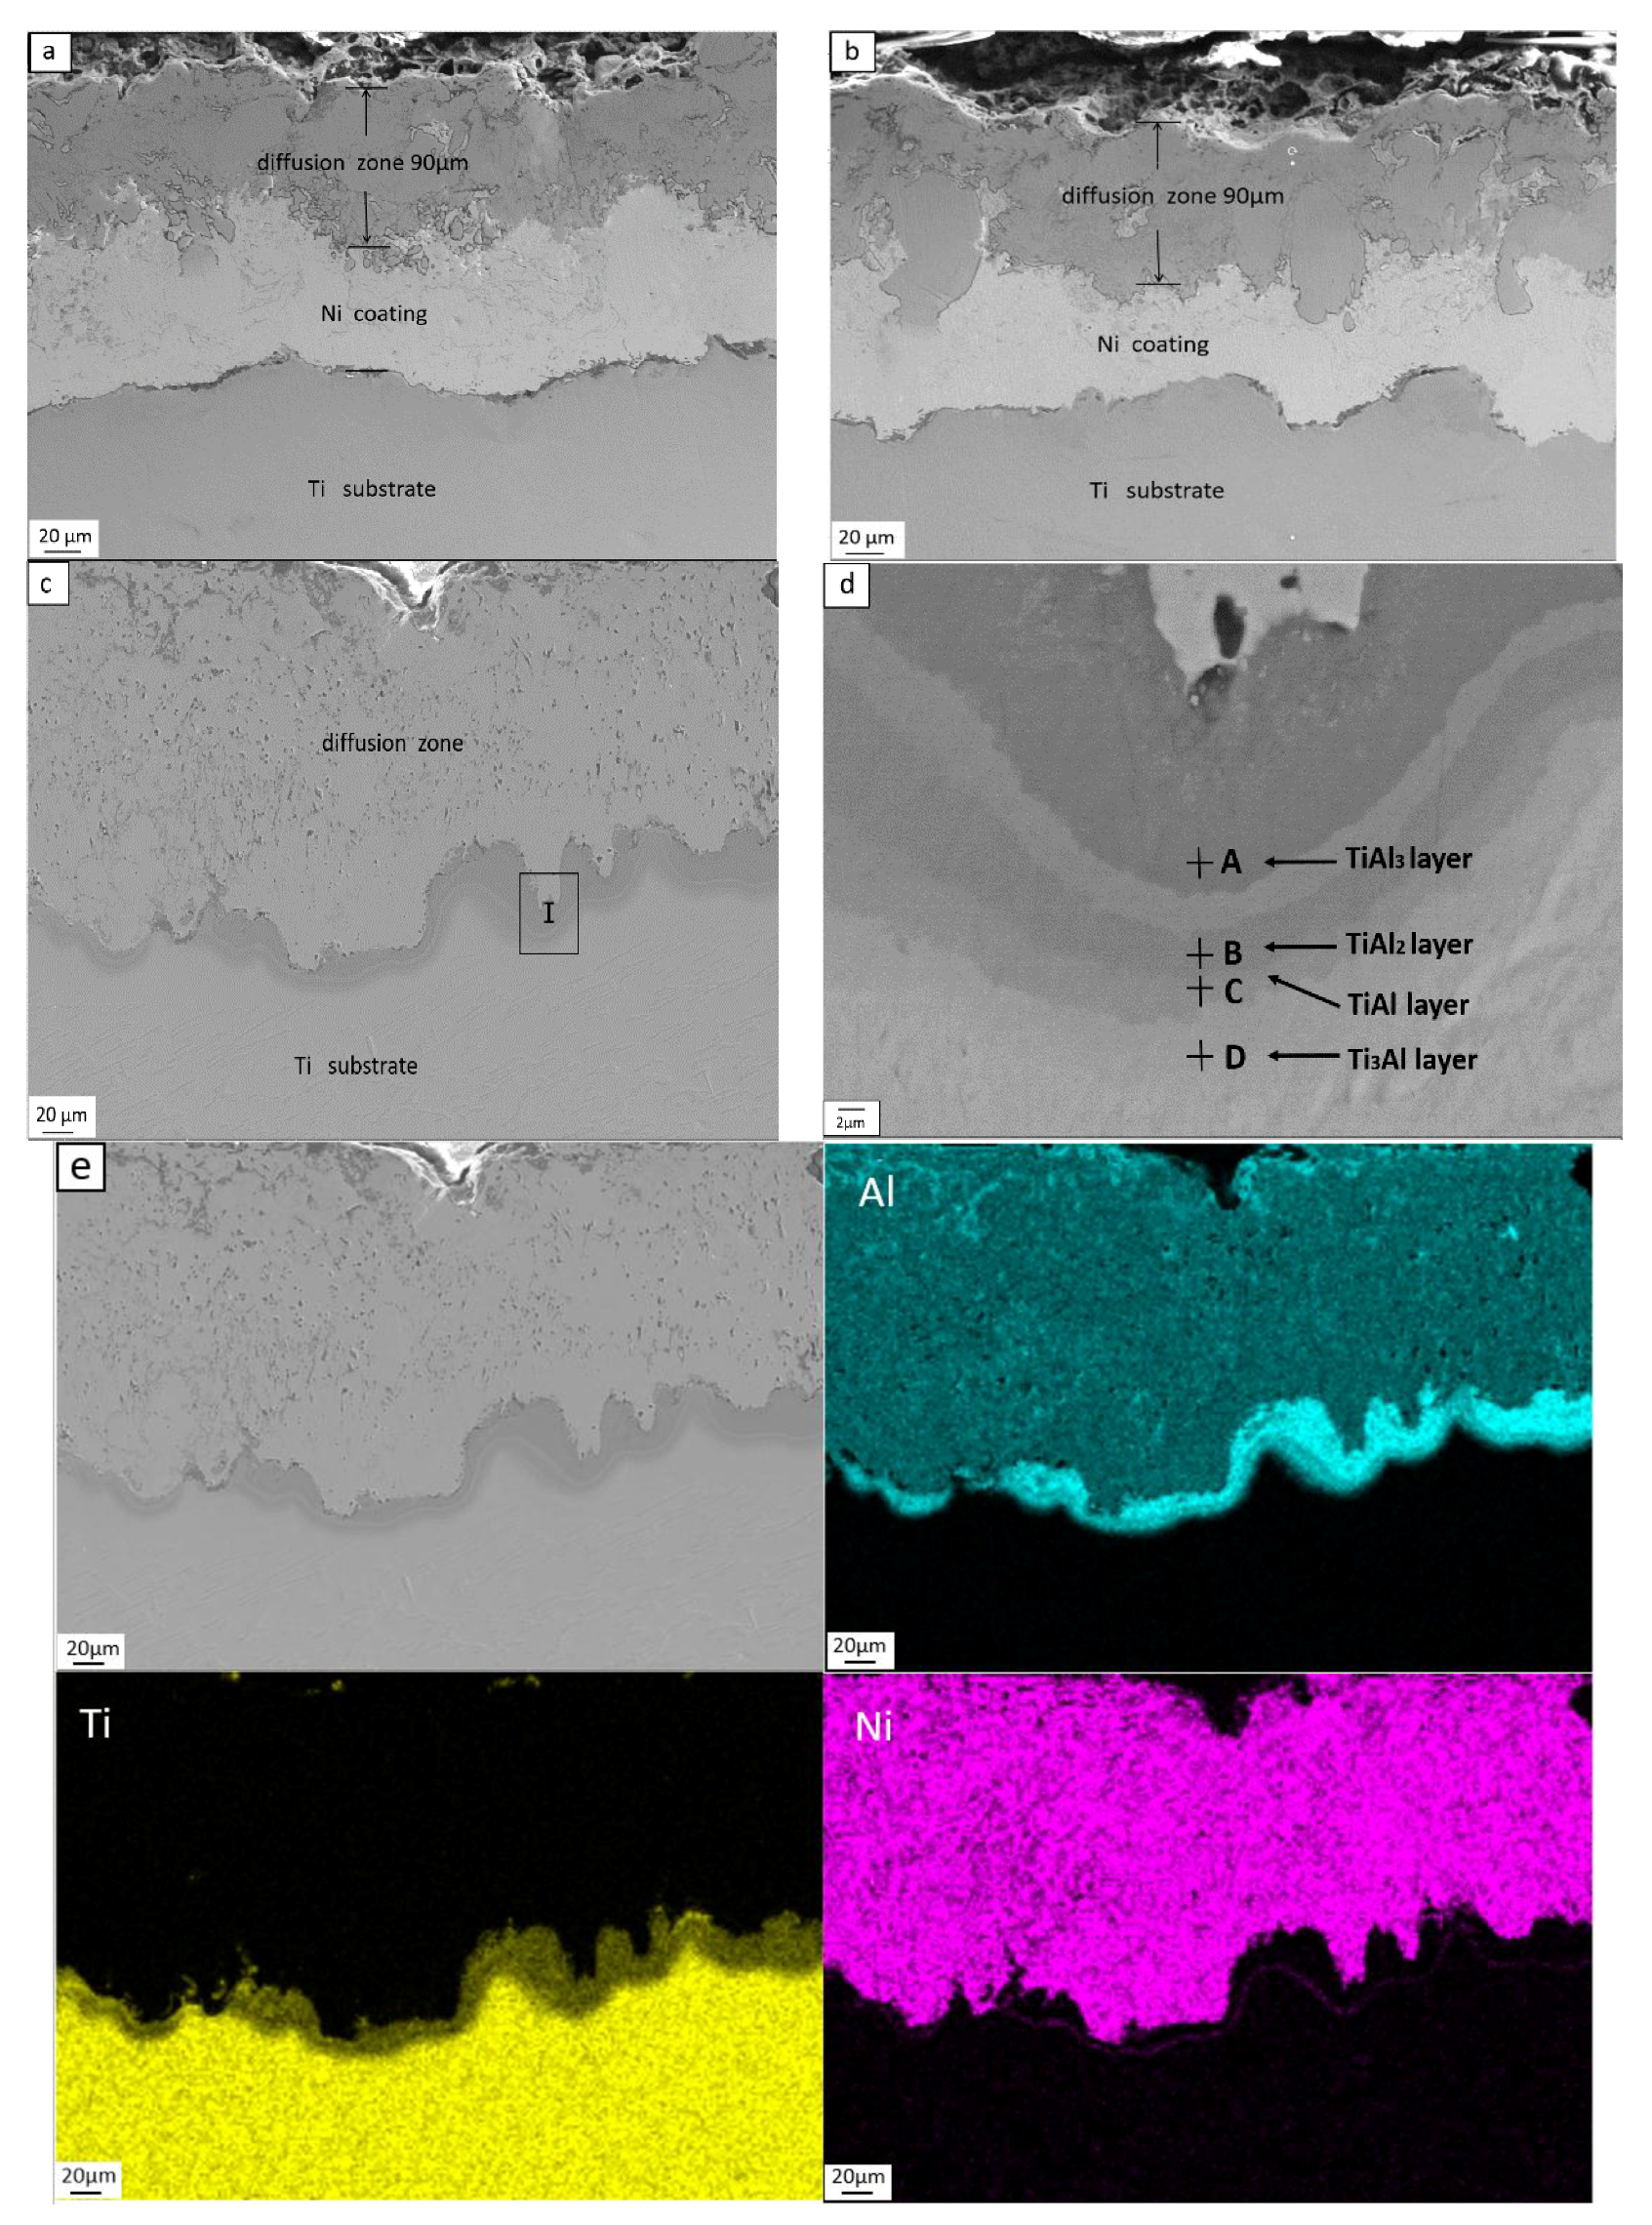
Figure 7a,b are the cross-sectional SEM images of the Al/Ni coating (with the Al coating 50 μm thick) after testing for 5 h and 10 h at 1173 K, respectively. As shown in the figures, all the Al was diffused into the Ni coating after heating at 1173 K for 5 h and the thickness of the diffusion reaction layer was about 90 µm, but the thickness did not increase when the reaction time was extended to 10 h. Thus, when the Al coating on the surface of specimen was thinner, the elemental Al could quickly diffuse into the Ni coating during the heating period. The concentration gradient of the Al disappeared when there was no more Al on the surface of specimen, and the diffusion front of Al no longer advanced to the Ni coating.
The experiments also show that when the Al coating was thick enough (150 μm), the elemental Al could not only penetrate the Ni coating, but could also reach the surface of the Ti substrate at a proper temperature and time, and TiAl intermetallics were produced during the further reaction between elemental Al and Ti. Figure 7c is the cross-sectional SEM image of Al/Ni coating (with the Al coating having a 150 μm thickness) after testing for 10 h at 1173 K, and Figure 7d is the expanded view of region I in Figure 7c. As shown in Figure 7c,d, a layer-like region appeared at the interface between the Al, Ni diffusion reaction region and Ti substrate. The chemical compositions (at %) of points A, B, C, and D, as marked in Figure 7d, are shown in Table 5. It can be speculated that the phases represented by points A, B, C, and D are TiAl3, TiAl2, TiAl, and Ti3Al intermetallic compounds, according to the EDS results.
As shown in Figure 7e, the content of Al at the interface between the diffusion reaction region and Ti substrate was obviously greater than in the diffusion reaction region. This was because the content of Al on the surface of specimen could be kept at a high level throughout the reaction when the Al coating was thick enough, and the elemental Al continuously diffused towards Ni substrate under the driving force of the concentration gradient as the reaction time was prolonged. Finally, the elemental Al penetrated the Ni coating and reached the surface of Ti substrate, and TiAl intermetallics which were rich in Al were produced during further reaction between elemental Al and Ti. The results from Izumi [29] show that it was beneficial for the content of Al to remain at a relatively high level when there was an Al-rich layer under the Ni-Al layer, and the oxidation resistance of Ni-Al layer would become excellent, especially with long-term oxidation.
Above all, when the thickness of the Al coating of Al/Ni/Ti specimen was 150 μm, almost all the Ni coating had reacted after testing for 10 h at 1173 K, but when the thickness of Al coating was reduced to 50 μm, a certain thickness of the Ni coating remained unreacted under the same conditions.
3.4. Study of Oxidation Resistance
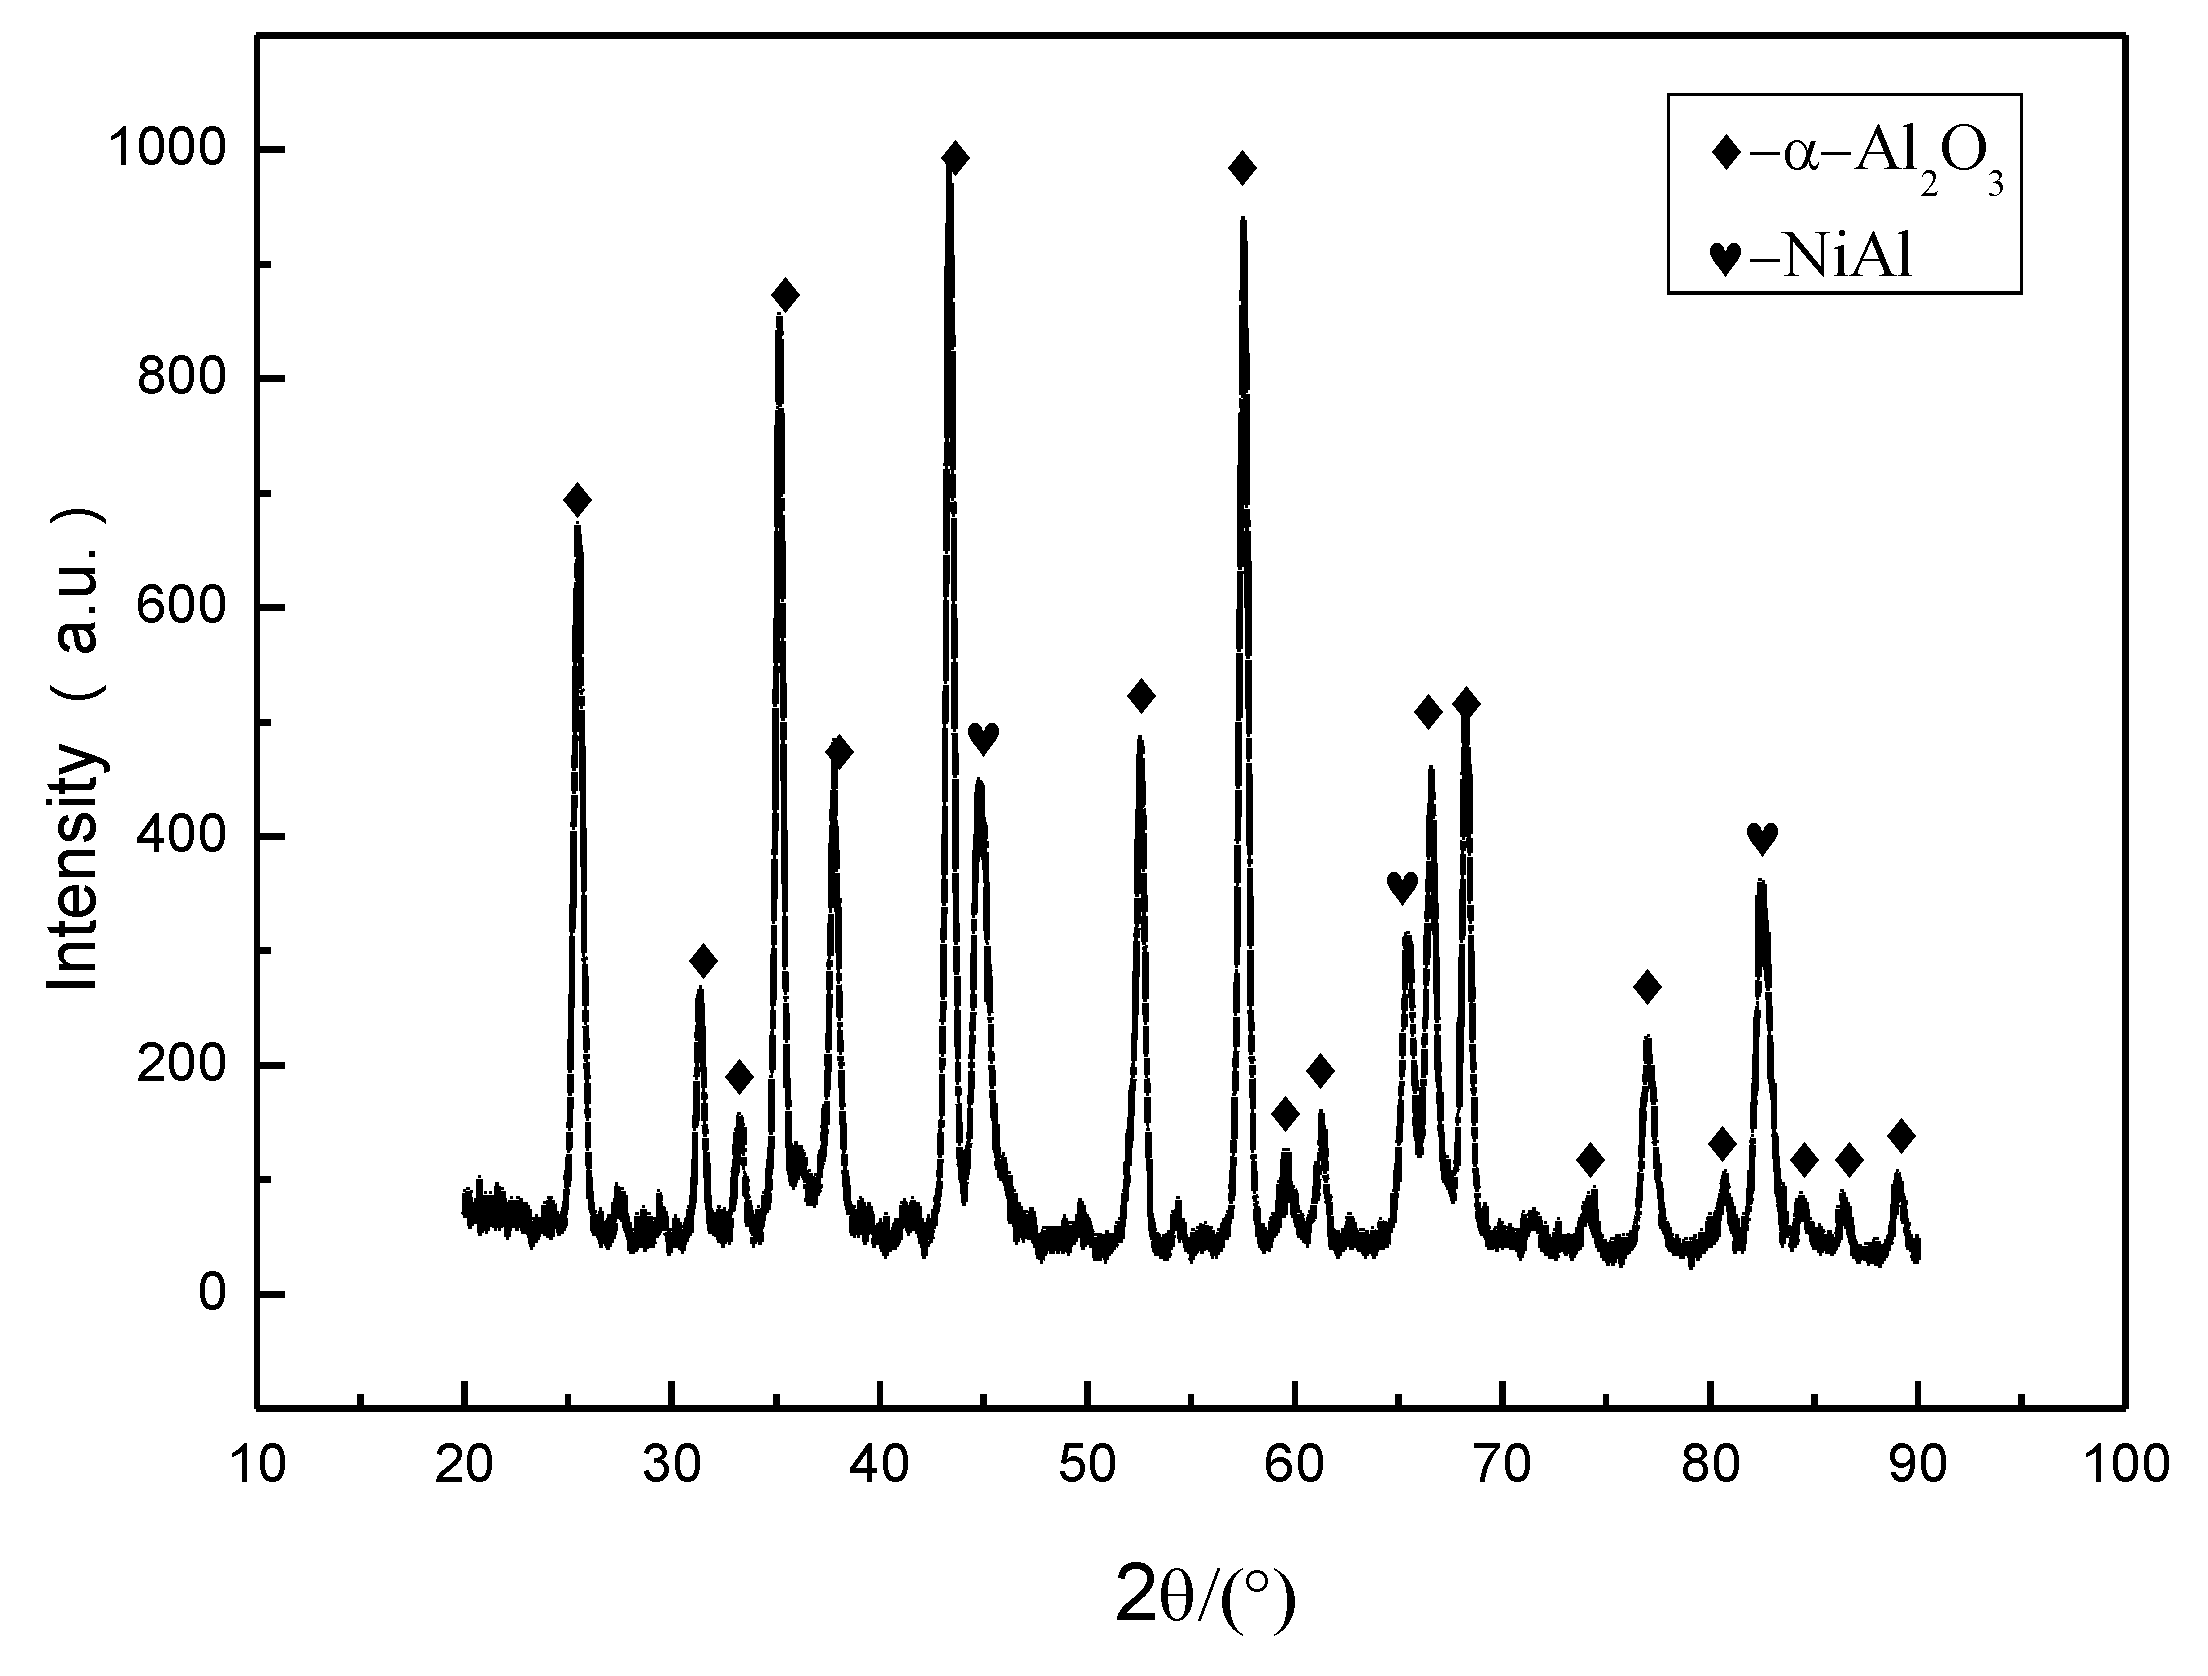
As the Ni2Al3 phase was highly brittle, which made it easy to break under the action of external force [30], the presence of the Ni2Al3 phase in the coating was not generally desirable for practical applications. However, the oxidation resistance of the NiAl phase was excellent; from the results described above, it was found that after 973 K/20 h, 1073 K/10 h, and 1173 K/10 h in-situ reaction, the Ni2Al3 phase was not stable: it was fully or partially melted and dispersed in the Al coating. Only the high melting point NiAl phase could exist stably, and a region (with a certain thickness) that was composed of NiAl phase was finally formed. In order to further test the high-temperature oxidation resistance of the NiAl intermetallic, the surface layer of Al/Ni/Ti specimen after testing for 10 h at 1173 K was removed by waterproof abrasive paper to expose the NiAl intermetallic phase completely. Then, the oxidation resistance of NiAl intermetallic phase and pure Ti without coating was examined at 1073 K for 100 h under atmosphere conditions.
Figure 8 is the XRD pattern of the NiAl intermetallic phase after oxidation testing at 1073 K for 100 h (10 cycles). As shown in Figure 8, many diffraction peaks of Al2O3 could be observed in the XRD spectrum after the oxidation test. In addition, the diffraction peak of NiAl phase could also be observed in Figure 8, because the entire surface was not completely covered with an Al2O3 oxidation film of even thickness and some of the NiAl phase could be detected.
As shown in Figure 9, the total weight gains of the non-coated Ti and coated Al/Ni/Ti specimens were 2.1 mg and 0.7 mg, respectively, after oxidation for 100 h. The total weight gain of non-coated Ti was almost triple that of the coated Al/Ni/Ti specimen.
Figure 9 also shows the oxidation kinetics curves of Ti alloy with and without coating at 1073 K for 100 h (10 cycles). The curve for pure Ti without coating is nearly straight. This was because the Ti was easily oxidized by molecular oxygen to produce TiO2 in a high-temperature environment, and TiO2 which had a rutile structure was easy to break. With prolonged oxidation time, the TiO2 was peeled off continuously from the surface of specimen and the exposed Ti substrate would be oxidized again.
Regression analysis showed that the oxidizing dynamics curve of Al/Ni/Ti specimen after heat treatment and removal of Al2O3 film was approximately parabolic. Only at the beginning of oxidation was the oxygen weight gain of the specimen larger, while it exhibited a marked reduction in the later stage of oxidation. This was because the intermetallic NiAl was relatively rich in Al which formed in the process of in-situ reaction between Al coating and Ni coating. In this case, it was assumed that the Al2O3 was formed by the reaction between the NiAl phase and the oxygen in the air at the beginning of oxidation. The surface of the specimen was covered with Al2O3 film, which increased constantly, and the oxidation of the specimen could thereby be suppressed more effectively. Moreover, the solubility of Ti in the intermetallic NiAl was quite low, and as a result, the diffusion of elemental Ti from the substrate to the surface could be suppressed effectively by the NiAl intermetallic phase as the oxidizing time increased. The continuity and stability of the Al2O3 film was protected.
After heat treatment, the Al/Ni/Ti specimen had better high-temperature oxidation resistance than the pure Ti without a protective coating.
4. Conclusions
- After heating at 973 K, metallurgical reactions took place between the Al/Ni composite coating. The NiAl3, Ni2Al3, and NiAl intermetallics were formed in sequence in the diffusion region, which advanced to the Ti substrate. However, NiAl3 and Ni2Al3 were all or partly dissolved in liquid Al, while only the high melting point NiAl intermetallic could exist stably, and a region (composed of the NiAl phase) that had a certain thickness was finally formed.
- The thickness of the NiAl phase increased as the reaction time prolonged. The thickness of the NiAl phase was 20 µm after heating at 973 K for 2 h and the thickness of NiAl phase was 130 µm when the heating time was extended to 20 h.
- The higher the temperature, the easier the diffusion from the Al to the Ni coating; the 150 μm-thick Ni coating was penetrated by elemental Al after about 20 h at 973 K, whereas the same thickness of Ni coating was penetrated by elemental Al after only 10 h at 1073 K. When the reaction temperature was raised to 1173 K, the elemental Al not only penetrated the 150 μm-thick Ni coating, but also diffused into the Ti substrate after 10 h.
- After the heat treatment, a ragged wave-like morphology was exhibited in the diffusion front of Al and a small amount of elemental Ni in the diffusion region did not participate in the reaction. The growth of the NiAl intermetallic in the diffusion region of the Al/Ni/Ti specimen was obviously slower compared with the Al/Ni specimen. Furthermore, when the Al coating on the surface of the specimen was thinner, all the elemental Al diffused into the Ni coating in a short time and the thickness of diffusion reaction layer did not increase with the increasing reaction time after the Al coating was depleted. However, the elemental Al could not only penetrate the Ni coating, but also reached the surface of the Ti substrate when the Al coating was thick enough. TiAl intermetallics which were rich in Al were produced during the further reaction between elemental Al and Ti.
- The specimen after heat treatment had a better high-temperature oxidation resistance than the pure Ti substrate without coating, as a certain thickness of NiAl intermetallic phase was produced.
Author Contributions
Experiment and Writing-Original Draft Preparation, Q.J.; Conceptualization and Supervision, D.L.; Interpretation of Data, S.L.; SEM Analysis, Z.Z; Writing-Review & revising, N.Z.
Funding
This research was funded by the Natural Science Foundation of Liaoning Province (No. 201602553), National Natural Science Foundation of China (No. 51301112).
Acknowledgments
Thanks to Yifan Pu for giving help on the SEM observation.
Conflicts of Interest
The authors declare no conflict of interest.
References
- Riedl, H.; Koller, C.M.; Munnik, F.; Hutter, H.; Mendez Martin, F.; Rachbauer, R.; Kolozsvári, S.; Bartosik, M.; Mayrhofer, P.H. Influence of oxygen impurities on growth morphology, structure and mechanical properties of Ti-Al-N thin films. Thin Solid Films 2016, 603, 39–49. [Google Scholar] [CrossRef]
- Cui, H.Z.; Ma, L.; Cao, L.L.; Teng, F.L.; Cui, N. Effect of NiAl content on phases and microstructures of TiC-TiB2-NiAl composites fabricated by reaction synthesis. Trans. Nonferr. Met. Soc. China 2014, 24, 346–353. [Google Scholar] [CrossRef]
- Sina, H.; Surreddi, K.B.; Iyengar, S. Phase evolution during the reactive sintering of ternary Al-Ni-Ti powder compacts. J. Alloy Compd. 2016, 661, 294–305. [Google Scholar] [CrossRef]
- Vera, M.L.; Colaccio, Á.; Rosenberger, M.R.; Schvezov, C.E.; Ares, A.E. Influence of the Electrolyte Concentration on the Smooth TiO2 Anodic Coatings on Ti-6Al-4V. Coatings 2017, 7, 39. [Google Scholar] [CrossRef]
- O’Sullivan, C.; O’Hare, P.; Byrne, G.; O’Neill, L.; Ryan, K.B.; Crean, A.M. A Modified Surface on Titanium Deposited by a Blasting Process. Coatings 2011, 1, 53–71. [Google Scholar] [CrossRef] [Green Version]
- Yao, H.R.; Bao, Z.B.; Shen, M.L.; Zhu, S.L.; Wang, F.H. A magnetron sputtered microcrystalline beta-NiAl coating for SC superalloys. Part II. Effects of a NiCrO diffusion barrier on oxidation behavior at 1100 degrees C. Appl. Surf. Sci. 2017, 407, 485–494. [Google Scholar] [CrossRef]
- Pettit, F.S. Oxidation mechanisms for nickel-aluminum alloys at temperatures between 900° and 1300 °C. Trans. Metall. Soc. AIME 1967, 239, 1296–1305. [Google Scholar]
- Meng, X.X.; Pei, Y.W.; Shao, W.; Qu, W.T.; Zhou, C.G. Cyclic oxidation behaviour of Co/Si co-doped beta-NiAl coating on nickel based superalloys. Corros. Sci. 2018, 133, 112–119. [Google Scholar] [CrossRef]
- Sato, N.; Fuji, M.; Kohiruimaki, N.; Fukumoto, M.; Hara, M. Preparation of Ni aluminide/Ni bilayer coating on Nb-W alloys by molten salt electrodeposition and oxidation resistance. Oxid. Met. 2016, 1, 29–38. [Google Scholar] [CrossRef]
- Wang, H.X.; Zhang, Y.; Cheng, J.L.; Li, Y.S. High temperature oxidation resistance and microstructure change of aluminized coating on copper substrate. Trans. Nonferr. Metal. Soc. China 2015, 25, 184–190. [Google Scholar] [CrossRef]
- Gong, X.; Chen, R.R.; Wang, Q.; Wang, Y.; Zhang, N.N.; Zhang, Z.L.; Fu, H.Z. Cyclic oxidation behavior and oxide scale adhesion of Al/NiCrAlY coating on pure titanium alloy. J. Alloy Compd. 2017, 729, 679–687. [Google Scholar] [CrossRef]
- Mitoraj-Krolikowska, M.; Godlewska, E. Silicide coatings on Ti-6Al-1Mn (at.%) alloy and their oxidation resistance. Surf. Coat. Technol. 2018, 334, 491–499. [Google Scholar] [CrossRef]
- Chen, C.; Feng, X.M.; Shen, Y.F. Oxidation behavior of a high Si content Al-Si composite coating fabricated on Ti–6Al–4V substrate by mechanical alloying method. J. Alloy Compd. 2017, 701, 27–36. [Google Scholar] [CrossRef]
- Parlikar, C.; Alam, M.Z.; Sarkar, R.; Das, D.K. Effect of oxidation resistant Al3Ti coating on tensile properties of a near α-Ti alloy. Surf. Coat. Technol. 2013, 236, 107–117. [Google Scholar] [CrossRef]
- Dai, J.J.; Zhang, F.Y.; Wang, A.M.; Yu, H.J.; Chen, C.Z. Microstructure and properties of Ti-Al coating and Ti-Al-Si system coatings on Ti-6Al-4V fabricated by laser surface alloying. Surf. Coat. Technol. 2017, 309, 805–813. [Google Scholar] [CrossRef]
- Izumi, T.; Nishimoto, T.; Narita, T. Formation and oxidation behavior of Ni2Al3 coating on heat-resistant Ti-alloy. Intermetallics 2005, 13, 615–619. [Google Scholar] [CrossRef]
- Abe, T.; Sato, N.; Fukumoto, M.; Hara, M. Preparation of Ni aluminide/Ni or TiAl3 bilayer coating on TiAl by molten salt electrodeposition and cyclic oxidation resistance. J. Jpn. Inst. Met. Mater. 2013, 77, 245–252. [Google Scholar] [CrossRef]
- Sato, T.; Nezu, A.; Watanabe, T. Preparation of Ti-Al intermetallic compound by wire arc spraying. Trans. Mater. Res. Soc. Jpn. 2000, 25, 301–304. [Google Scholar]
- Kiselev, S.P.; Ryashin, N.S. Ti-Al intermetallic compounds synthesis in coatings deposited by cold spraying. Am. Inst. Phys. Conf. Ser. 2016, 1770, 3496–3502. [Google Scholar] [CrossRef]
- Kofstad, P. High-temperature oxidation of titanium. J. Less-Common Met. 1967, 12, 449–464. [Google Scholar] [CrossRef]
- Guo, C.; Zhou, J.S.; Chen, J.M.; Zhao, J.R.; Yu, Y.J.; Zhou, H. Improvement of the oxidation and wear resistance of pure Ti by laser cladding at elevated temperature. Surf. Coat. Technol. 2010, 205, 2142–2151. [Google Scholar] [CrossRef]
- Song, Y.H.; Park, J.S.; Kim, J.M.; Yi, S.H. Oxidation behaviors of pure Ti thermal plasma spray coated Mo-Si-B alloys. Mater. Sci. Forum 2011, 695, 365–368. [Google Scholar] [CrossRef]
- Kusabiraki, K.; Kuroda, N.; Motohira, I.; Ooka, T. High-Temperature Oxidation of Pure Titanium in Co2 and Ar-10%CO2 Atmospheres. Oxid. Met. 1997, 48, 289–302. [Google Scholar] [CrossRef]
- Biswas, A.; Roy, S.K.; Gurumurthy, K.R.; Prabhu, N.; Banerjee, S. A study of self-propagating high-temperature synthesis of NiAl in thermal explosion mode. Acta Mater. 2002, 50, 757–773. [Google Scholar] [CrossRef] [Green Version]
- Zhu, H.G.; Ai, Y.L.; Li, J.L.; Min, J.; Chu, Da.; Zhao, J.; Chen, J. In situ fabrication of α-Al2O3 and Ni2Al3 reinforced aluminum matrix composites in an Al–Ni2O3 system. Adv. Powder Technol. 2011, 22, 629–633. [Google Scholar] [CrossRef]
- Cao, J.; Song, X.G.; Wu, L.Z.; Qi, J.L.; Feng, J.C. Characterization of Al/Ni multilayers and their application in diffusion bonding of TiAl to TiC cermet. Thin Soid Films 2012, 520, 3528–3531. [Google Scholar] [CrossRef]
- Moon, J.H.; Han, J.G.; Kim, Y.J. Performance of an atmospheric plasma torch with various inlet angles. Surf. Coat. Technol. 2005, 193, 94–100. [Google Scholar] [CrossRef]
- Goward, G.W.; Boone, D.H. Mechanisms of formation of diffusion aluminide coatings on nickel-base superalloys. Oxid. Met. 1971, 3, 475–495. [Google Scholar] [CrossRef]
- Izumi, T.; Nishimoto, T.; Narita, T. Superior long-term oxidation resistance of Ni-Al coated TiAl alloys. Intermetallics 2005, 13, 727–732. [Google Scholar] [CrossRef]
- Alimadadi, H.; Kjartansdóttir, C.; Burrows, A.; Kasama, T.; Møller, P. Nickel-aluminum diffusion: A study of evolution of microstructure and phase. Mater. Charact. 2017, 130, 105–112. [Google Scholar] [CrossRef]
Figure 1.
(a) Cross-sectional SEM image of Al coating on the metallurgical Ni piece without heating; (b–e) cross-sectional SEM images of Al coating after testing for 2, 5, 10, and 20 h at 973 K; (f) concentration profiles of elemental Al and Ni in Figure 1 (e,g) EDS results of points A, B, C, and D marked in Figure 1 (b). (h) XRD pattern of Al coating on the metallurgical Ni piece after testing for 2 h at 973 K.

Figure 2.
Binary phase diagram of the Ni-Al system. Reproduced from [24] with permission. Copyright 2002 Elsevier.
Figure 2.
Binary phase diagram of the Ni-Al system. Reproduced from [24] with permission. Copyright 2002 Elsevier.
Figure 3.
(a) Cross-sectional SEM image of the Al/Ni coating without heating; (b–e) cross-sectional SEM images of Al/Ni coating after testing for 2, 5, 10, and 20 h at 973 K.
Figure 3.
(a) Cross-sectional SEM image of the Al/Ni coating without heating; (b–e) cross-sectional SEM images of Al/Ni coating after testing for 2, 5, 10, and 20 h at 973 K.


Figure 4.
(a) Cross-sectional SEM image of Al/Ni coating after testing for 10 h at 1073 K; (b) Cross-sectional SEM image of Al/Ni coating after testing for 10 h at 1173 K.
Figure 4.
(a) Cross-sectional SEM image of Al/Ni coating after testing for 10 h at 1073 K; (b) Cross-sectional SEM image of Al/Ni coating after testing for 10 h at 1173 K.

Figure 5.
XRD patterns of the Al/Ni coatings after 973 K/20 h, 1073 K/10 h, and 1173 K/10 h in-situ reaction.
Figure 5.
XRD patterns of the Al/Ni coatings after 973 K/20 h, 1073 K/10 h, and 1173 K/10 h in-situ reaction.
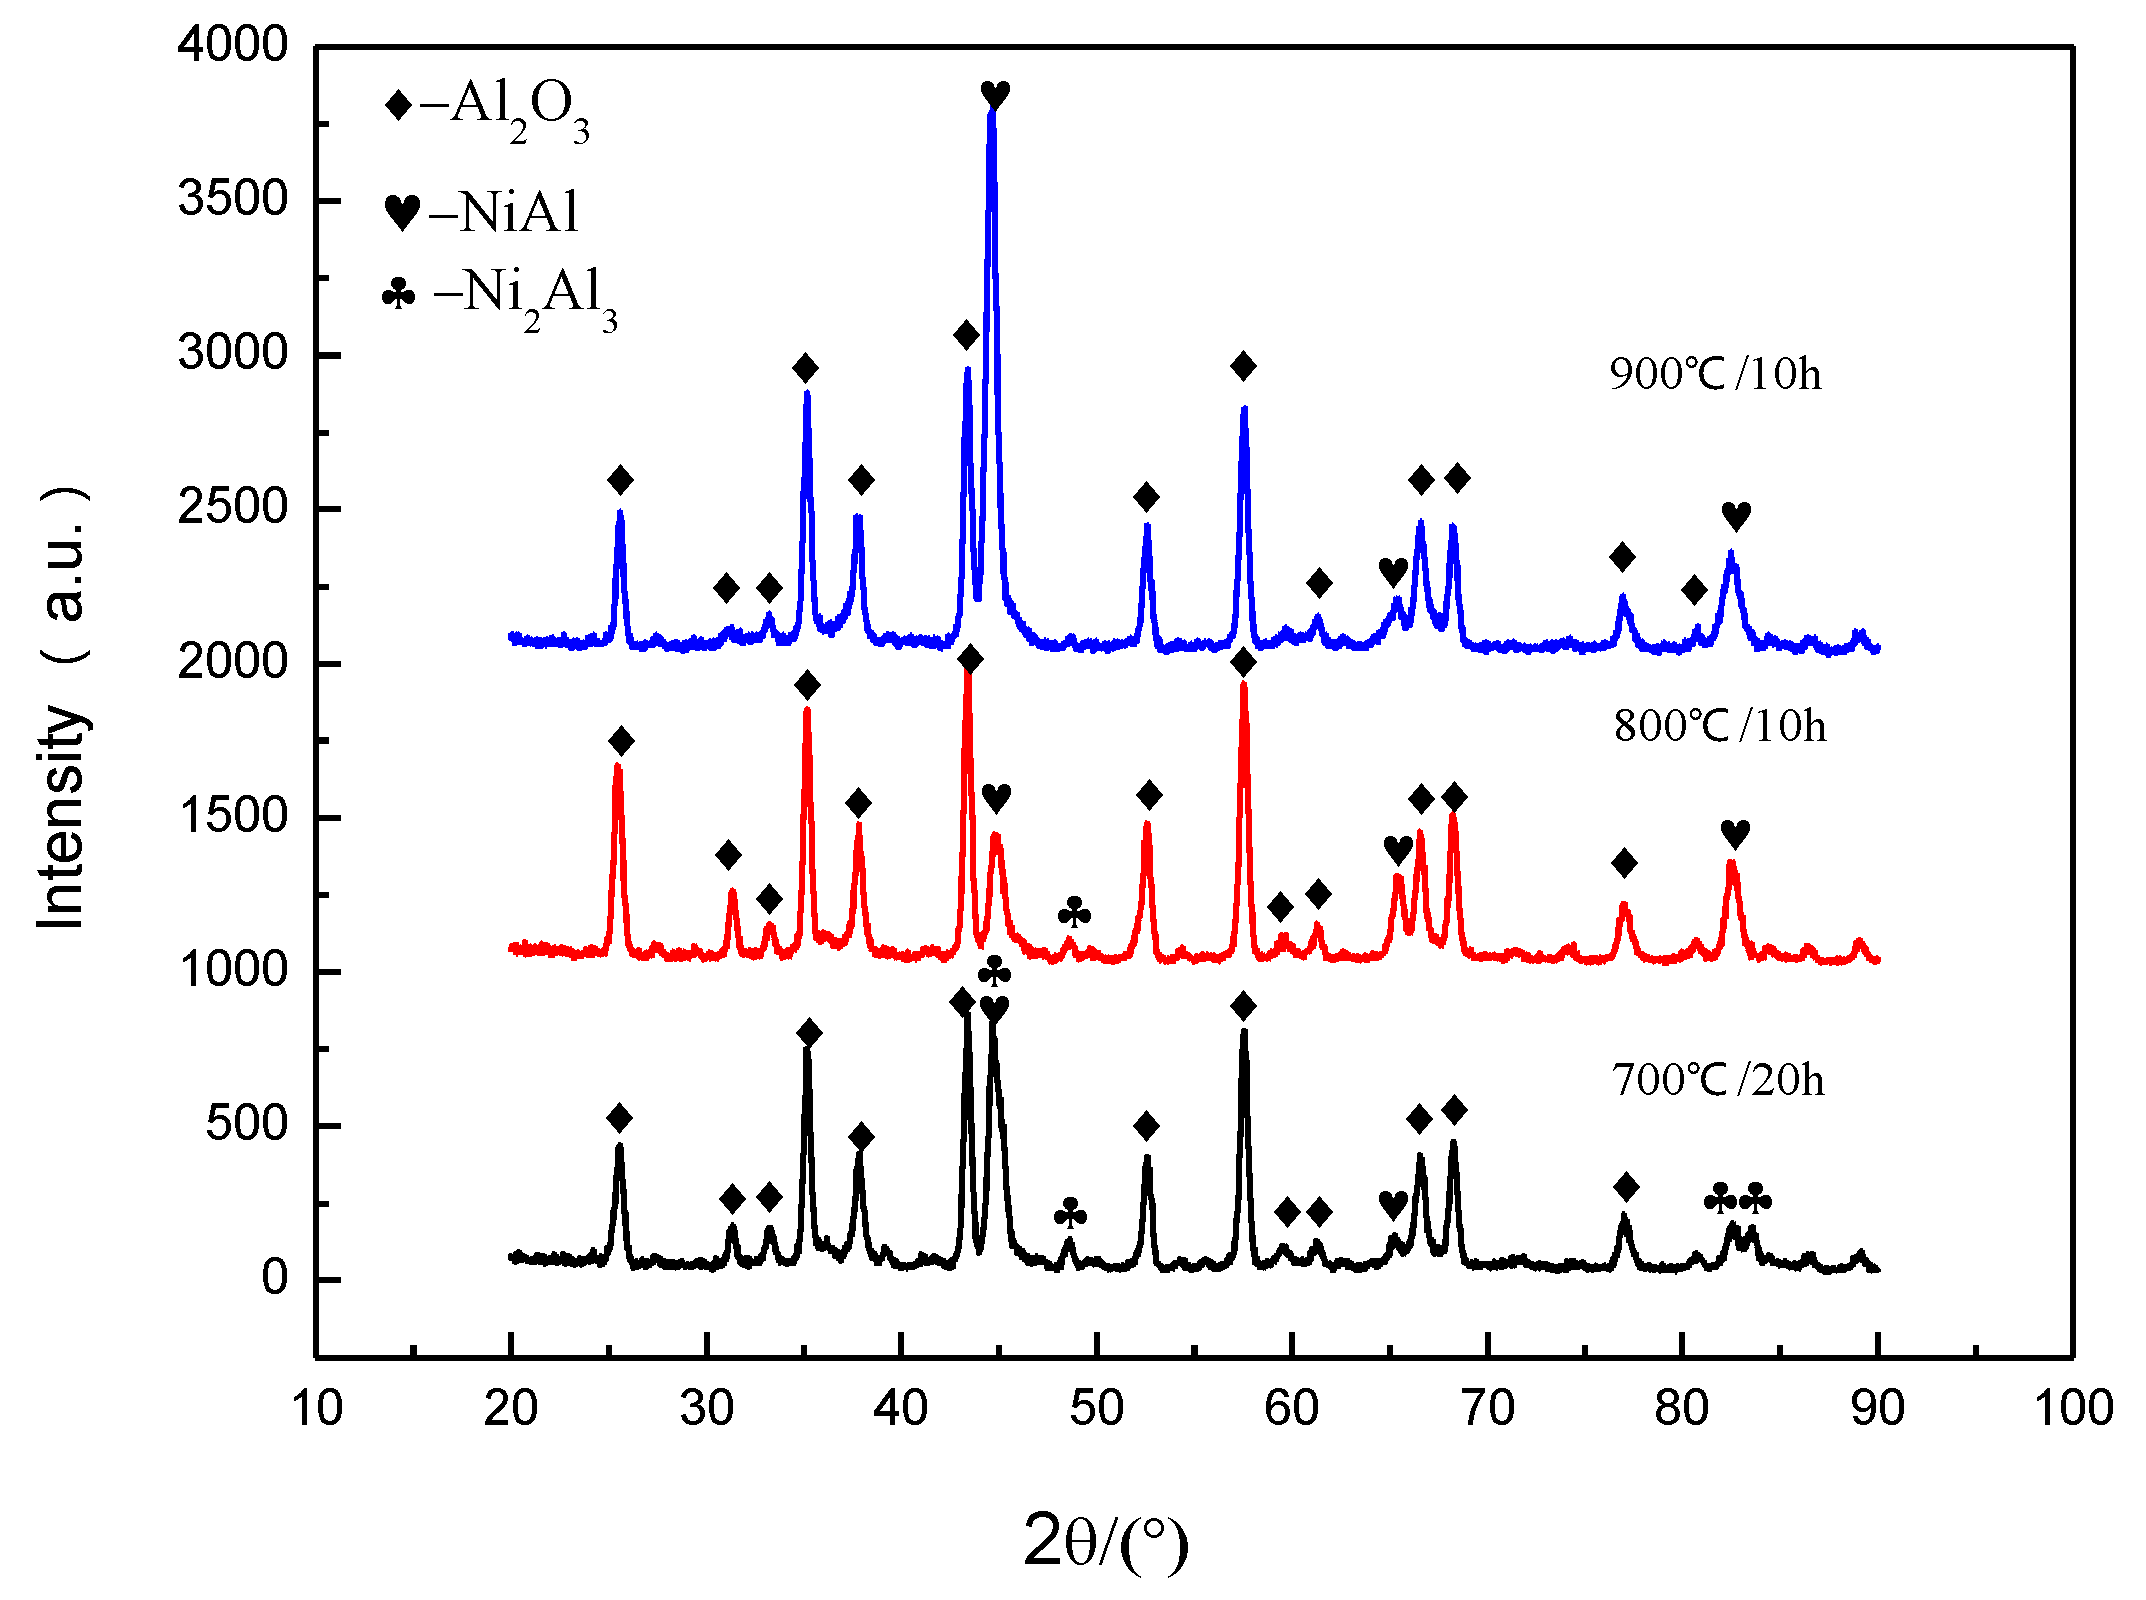
Figure 6.
(a) Cross-sectional SEM image of Ni coating without heating; (b,c) the distributions of elemental O and Ni in (a); (d,e) schematic diagram of Al/Ni specimen and Al/Ni/Ti specimen after heating.
Figure 6.
(a) Cross-sectional SEM image of Ni coating without heating; (b,c) the distributions of elemental O and Ni in (a); (d,e) schematic diagram of Al/Ni specimen and Al/Ni/Ti specimen after heating.

Figure 7.
(a) Cross-sectional SEM image of Al/Ni coating (Al coating 50 μm thick) after testing for 5 h at 1173 K; (b) cross-sectional SEM image of Al/Ni coating (Al coating 50 μm thick) after testing for 10 h at 1173 K; (c) cross-sectional SEM image of Al/Ni (Al coating 150 μm thick) coating after testing for 10 h at 1173 K; (d) expanded view of region I in (c); (e) distributions of elemental Al, Ti, and Ni in (c).

Figure 8.
XRD pattern of NiAl intermetallic coating after oxidation testing at 1073 K for 100 h (10 cycles).
Figure 8.
XRD pattern of NiAl intermetallic coating after oxidation testing at 1073 K for 100 h (10 cycles).

Figure 9.
Oxidation kinetics curves of Ti alloy with and without coating at 1073 K for 100 h (10 cycles).
Figure 9.
Oxidation kinetics curves of Ti alloy with and without coating at 1073 K for 100 h (10 cycles).


Table 1.
Plasma spraying parameters.
| Materials | Voltage/V | Current/A | Distance/mm | Feeding Powder Amount/(L·min−1) |
|---|---|---|---|---|
| Ni | 40 | 500 | 100 | 7 |
Table 2.
Arc spraying parameters.
| Materials | Voltage/V | Current/A | Atomization Compressed Air Supply Pressure/MPa | Distance/mm |
|---|---|---|---|---|
| Al | 31 | 180 | 0.6 | 150 |
Table 3.
Chemical composition (at %) of different points, as marked in Figure 3b–e.
Table 3.
Chemical composition (at %) of different points, as marked in Figure 3b–e.
| Elements | A | B | C | D | E | F | G | H | I | J |
|---|---|---|---|---|---|---|---|---|---|---|
| Al | 76.31 | 62.52 | 42.32 | 60.02 | 41.62 | 0 | 61.83 | 42.73 | 59.05 | 41.60 |
| Ni | 23.69 | 37.48 | 57.68 | 39.98 | 58.38 | 100 | 38.17 | 57.27 | 40.95 | 58.40 |
Table 4.
Thickness (µm) of NiAl intermetallic phase with 973 K/2 h, 973 K/5 h, 973 K/10 h, and 973 K/20 h treatment of Al/Ni contrast specimens and Al/Ni/Ti specimens.
Table 4.
Thickness (µm) of NiAl intermetallic phase with 973 K/2 h, 973 K/5 h, 973 K/10 h, and 973 K/20 h treatment of Al/Ni contrast specimens and Al/Ni/Ti specimens.
| Specimens | 973 K/2 h | 973 K/5 h | 973 K/10 h | 973 K/20 h |
|---|---|---|---|---|
| Al/Ni | 80 | 110 | 160 | 250 |
| Al/Ni/Ti | 20 | 40 | 80 | 130 |
Table 5.
Chemical composition (at %) of different points, as marked in Figure 7d.
Table 5.
Chemical composition (at %) of different points, as marked in Figure 7d.
| Points | Al | Ti |
|---|---|---|
| A | 73.83 | 26.17 |
| B | 65.00 | 35.00 |
| C | 50.39 | 49.61 |
| D | 22.14 | 77.86 |
© 2018 by the authors. Licensee MDPI, Basel, Switzerland. This article is an open access article distributed under the terms and conditions of the Creative Commons Attribution (CC BY) license (http://creativecommons.org/licenses/by/4.0/).
Share and Cite
MDPI and ACS Style
Jia, Q.; Li, D.; Li, S.; Zhang, Z.; Zhang, N. High-Temperature Oxidation Resistance of NiAl Intermetallic Formed In Situ by Thermal Spraying. Coatings 2018, 8, 292. https://doi.org/10.3390/coatings8080292
AMA Style
Jia Q, Li D, Li S, Zhang Z, Zhang N. High-Temperature Oxidation Resistance of NiAl Intermetallic Formed In Situ by Thermal Spraying. Coatings. 2018; 8(8):292. https://doi.org/10.3390/coatings8080292
Chicago/Turabian StyleJia, Qianqian, Deyuan Li, Shumei Li, Zhuang Zhang, and Nannan Zhang. 2018. "High-Temperature Oxidation Resistance of NiAl Intermetallic Formed In Situ by Thermal Spraying" Coatings 8, no. 8: 292. https://doi.org/10.3390/coatings8080292
Note that from the first issue of 2016, this journal uses article numbers instead of page numbers. See further details here.