Article

Preliminary Study of Linear Density, Tenacity, and Crystallinity of Cotton Fibers †

1
Cotton Structure & Quality Research Unit, Southern Regional Research Center (SRRC), ARS, USDA, New Orleans, LA 70124, USA
2
Fiber Physics LLC, Pickens, SC 29671, USA
*
Author to whom correspondence should be addressed.
Mention of a product does not constitute a warranty by the U.S. Department of Agriculture and does not imply its approval to the exclusion of other products that may also be suitable.
Fibers 2014, 2(3), 211-220; https://doi.org/10.3390/fib2030211
Submission received: 7 May 2014 / Revised: 18 June 2014 / Accepted: 26 June 2014 / Published: 14 July 2014
(This article belongs to the Special Issue Cellulose Fibers)

Abstract

:
An investigation of the relationships among fiber linear density, tenacity, and structure is important to help cotton breeders modify varieties for enhanced fiber end-use qualities. This study employed the Stelometer instrument, which is the traditional fiber tenacity reference method and might still be an option as a rapid screening tool because of its low cost and portable attributes. In addition to flat bundle break force and weight variables from a routine Stelometer test, the number of fibers in the bundle were counted manually and the fiber crystallinity (CIIR) was characterized by the previously proposed attenuated total reflection-sampling device based Fourier transform infrared (ATR-FTIR) protocol. Based on the plots of either tenacity vs. linear density or fiber count vs. mass, the fibers were subjectively divided into fine or coarse sets, respectively. Relative to the distinctive increase in fiber tenacity with linear density, there was an unclear trend between the linear density and CIIR for these fibers. Samples with similar linear density were found to increase in tenacity with fiber CIIR. In general, Advanced Fiber Information System (AFIS) fineness increases with fiber linear density.

1. Introduction

Cotton fiber is a type of natural cellulose I (β 1→4 linked glucose residues), with the quantity of cellulose varying greatly with the stages of fiber development or growth [1]. Compositional and structural differences between these fibers, as well as their physical properties and end-use qualities, have been investigated considerably over the years by diversified and comprehensive techniques. Such methods include wet chemistry, microscopy, X-ray diffractometry (XRD), molecular spectroscopy and well-defined fiber testing in the cotton industry [1,2,3,4,5,6,7,8,9,10,11]. As an example, attenuated total reflection (ATR) sampling device based Fourier transform infrared (ATR-FTIR) spectroscopy has evolved as an important and successful analytical tool to investigate the plant fiber growth-induced changes in compositions and structures. One such typical application was to compare the transition phase between cotton varieties by either plotting the integrated intensities of characteristic IR bands or performing the principal component analysis (PCA) [9,10], as IR spectral intensity changes resulted from the transition between primary and secondary cell wall synthesis in fiber cellulose.
The tenacity (or strength) attribute is an essential end-use quality of natural cotton fibers. Linking fiber tenacity with the physical and chemical structure is of great interest, as this knowledge could be of value to cotton breeders for cotton variety enhancement and to fiber processors for yarn quality improvement. For instance, Abbot et al. [12] observed that cottons with similar micronaire values can have different yarn strengths, and also that linear density is a much better predictor of yarn strength than micronaire.
Cotton micronaire is determined by both maturity (degree of secondary cell wall development) and fineness (weight per unit length) of the fibers [13]. Three different systems have been developed to routinely measure fiber maturity and fineness, namely the cross-sectional Imaging Analysis (IA), the Advanced Fiber Information System (AFIS) and Cottonscope [11,14]. Other gravimetric methods have also been applied to determine the fiber linear density [15,16]. Frequently, fiber linear density is referred to as fiber fineness; to avoid the confusion from IA and AFIS measurement, the term “fiber linear density” from gravimetric testing will be used in this study. Notably, the Cottonscope measurement is a gravimetric method and a slight bias between the Cottonscope and IA fineness results were observed [17].
The term crystallinity index (CI) has been used to describe the relative portion of crystalline cellulose in a simple two-phase model (crystalline vs. amorphous areas) within a cellulose sample [18]. It has been determined predominantly by a curve-fitting process that extracts individual crystalline peaks from the XRD intensity profile. As a different approach, ATR-FTIR spectroscopy technique was attempted to identify the spectral intensity differences between immature and mature fibers and further to estimate the degree of cotton cellulose maturity (MIR) and cotton fiber crystallinity (CIIR) [19,20]. It concluded that using the ATR-FTIR method to assess the cotton fiber CI is appropriate and reasonable with the following considerations: (1) a simple ATR-FTIR protocol avoids the need to perform any pretreatment of the cotton fibers (such as cutting in a routine XRD measurement); (2) it can analyze small amounts of fiber (as little as 0.5 mg) compared to ~150 mg fibers on an XRD aluminum holder (25 mm diameter × 2 mm deep); and (3) it requires only a short time (less than 2 min) for sample loading, spectral acquisition, and subsequent result reporting.
The main objective of this study was to correlate fiber linear density with tenacity and crystallinity. The Stelometer instrument was utilized, because: (1) the bundle length within the Stelometer clamps is known (15 mm), so that the fiber linear density of a sample can be derived if the number of fibers in a weighed bundle is known; and (2) the Stelometer protocol is a traditional laboratory-based tenacity test [21] and might still be preferred by cotton researchers and breeders as a simple screening tool due to its significant low cost and portability. However, it has a number of drawbacks compared to other strength measurement methods. For example, it is a tedious and labor-intensive procedure that requires experienced operators and generates only a few fiber quality indices. A flowchart of the experimental design linking fiber quality characteristics with fiber structural information is briefly depicted in Figure 1.
Figure 1. A flow chart of experimental design.
Fibers 02 00211 g001

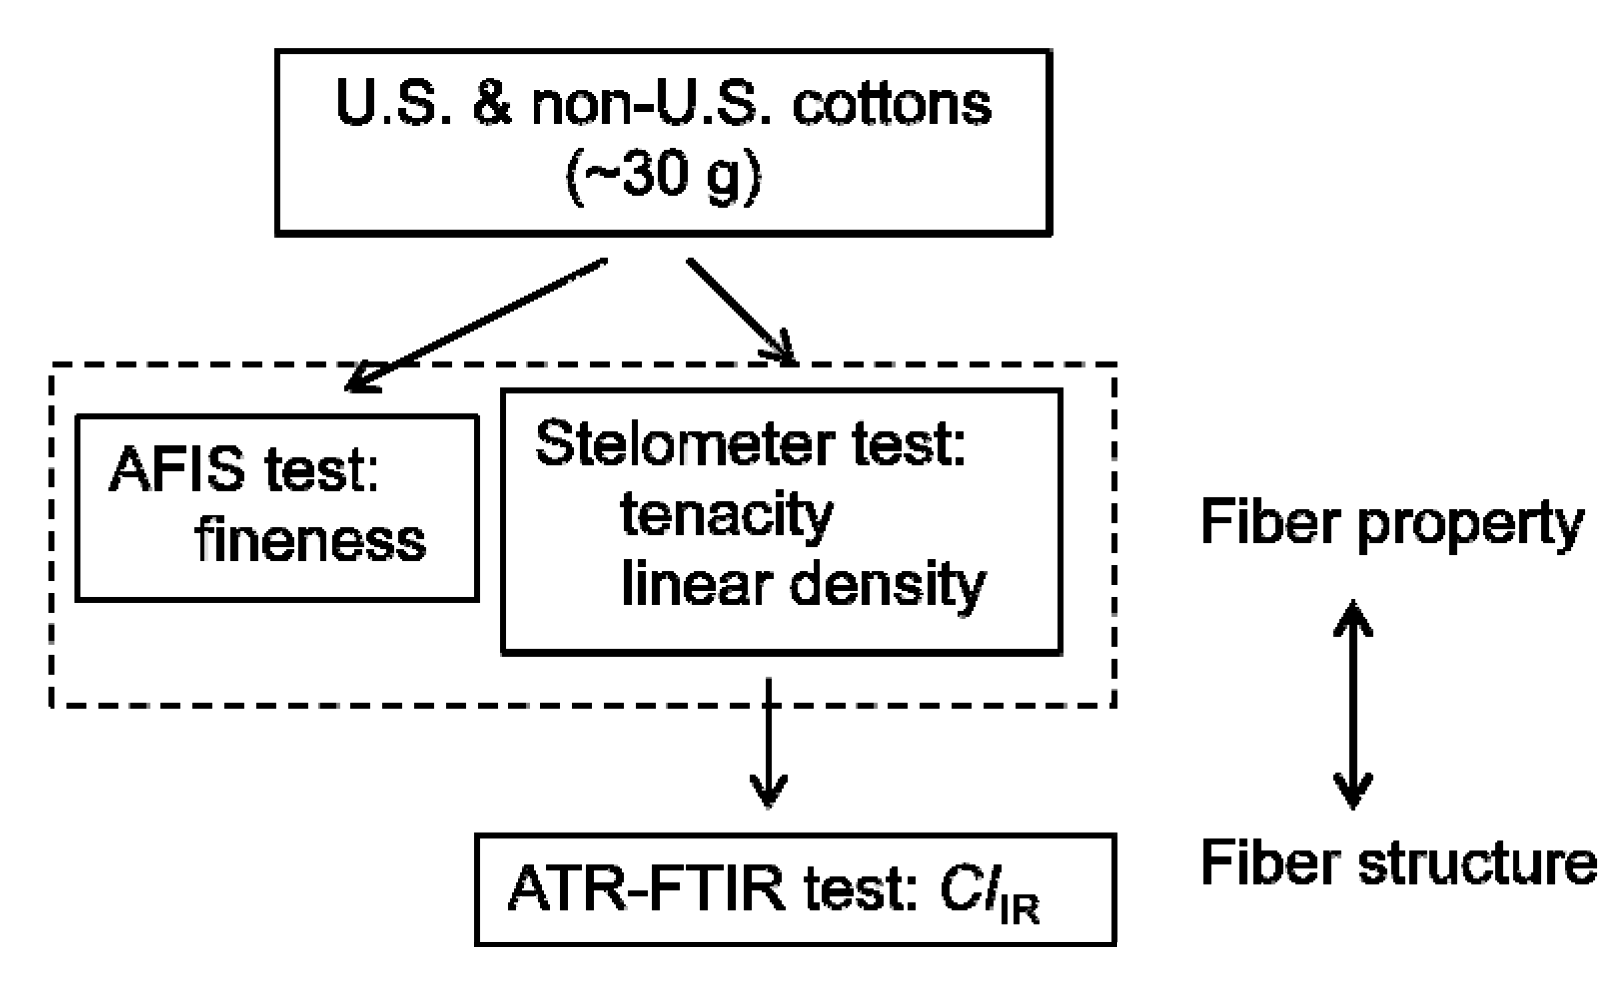
2. Experimental Section

2.1. Cotton Samples

A set of 19 lint cottons (which were acquired during the ginning process) from the 2009 crop-year was used, with 11 samples representing two Upland varieties grown in the United States and 8 fibers originating from international growers (5 from 2 growing areas in an Asian country and 3 from another Asian country). These cottons of ~30 g were kept at a standard environment of both a constant relative humidity (65% ± 2%) and temperature (21 ± 1 °C) for at least 48 h, before Stelometer testing, the ATR-FTIR spectral collection and AFIS measurement [22].

2.2. AFIS Test

Fiber fineness was determined from routine AFIS (Uster Technologies, Inc., Knoxville, TN, USA) test. Following the standard procedure, about 0.5 g of lint cottons was taken to run AFIS fineness measurement and a average of 3 replicates (~5000 fibers/replicate) for each sample was used.

2.3. Stelometer Test and Fiber Number Count

A Stelometer flat bundle tester (Spinlab, Knoxville, TN, USA) with 1/8-inch (3.2-mm) clamp spacing was utilized to determine the cotton fiber Stelometer tenacity property [21]. In practice, an average of six bundle breaks within each sample was obtained by two experienced operators. However, only one of two portions in one bundle breakage of six repeats was counted under a desk magnifier with light and then interpreted in this preliminary study, because of obvious time-consuming, labor-intensive, and prone to error in counting the fiber number of an individual bundle.

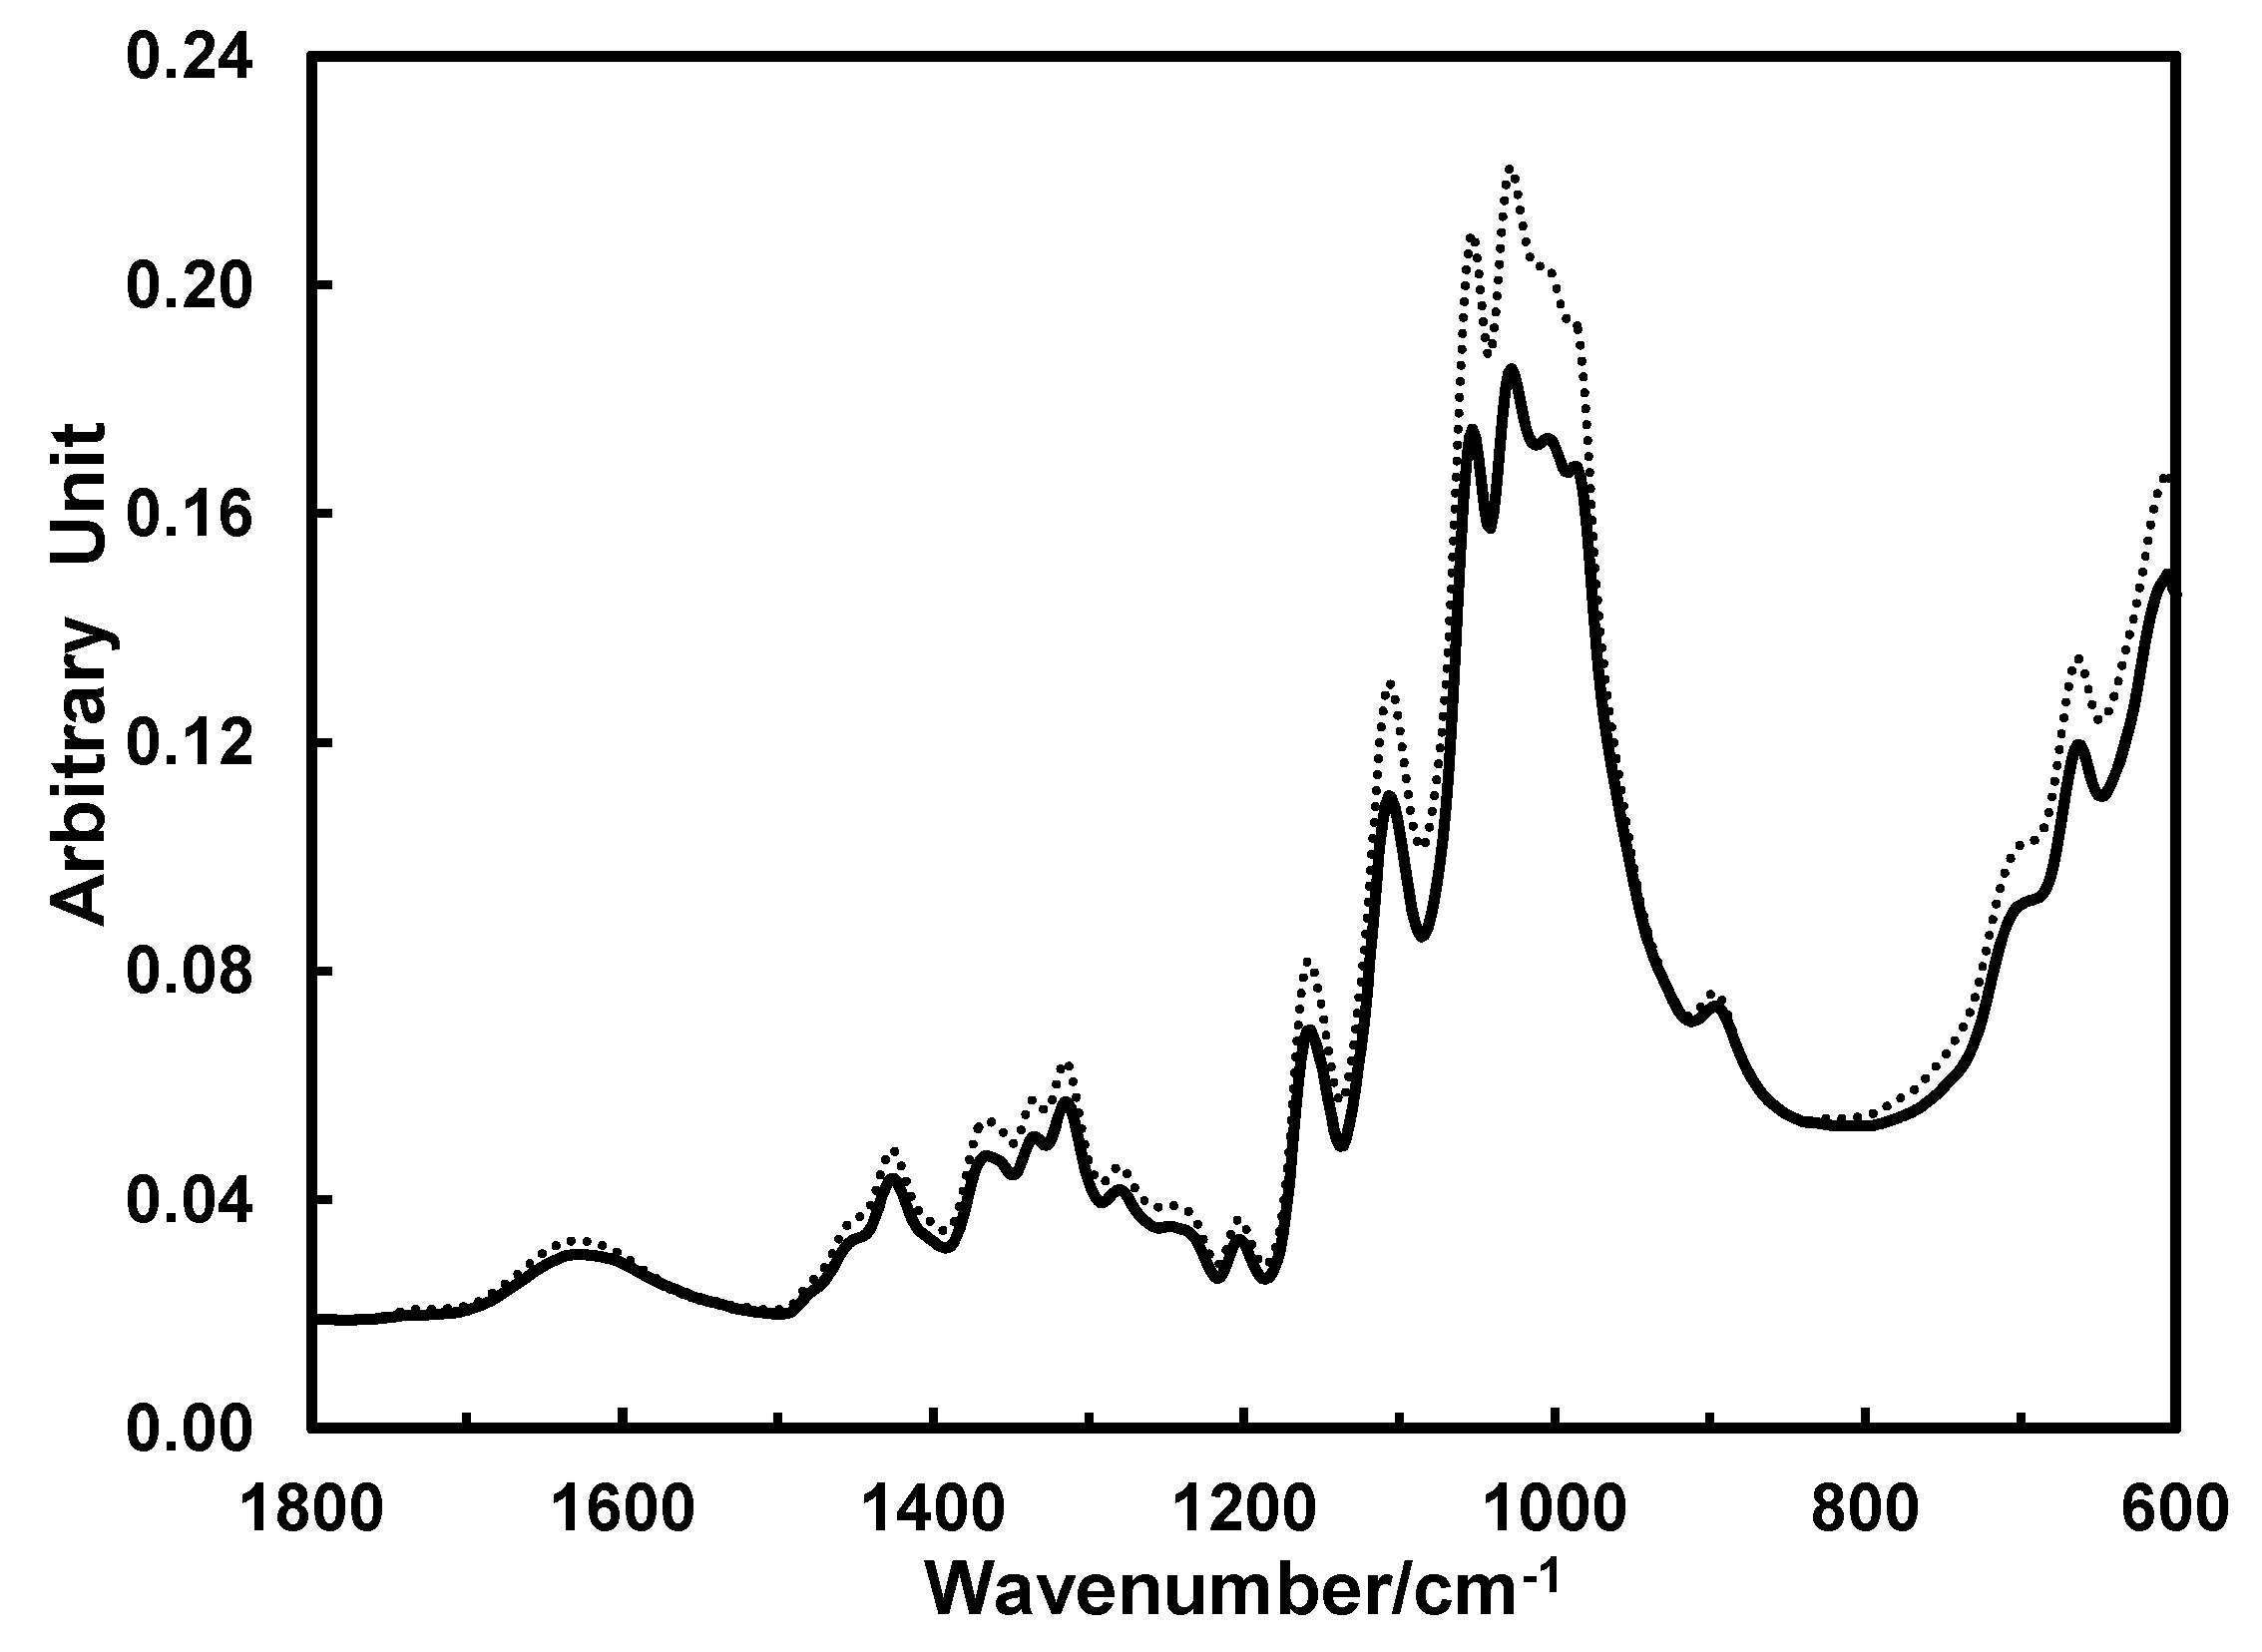
2.4. CIIR Calculation

All ATR-FTIR spectra were collected in absorbance unit with an FTS 3000MX Fourier transform IR spectrometer (Varian Instruments, Randolph, MA, USA) equipped with a ceramic source, a KBr beam splitter, and a deuterated triglycine sulfate (DTGS) detector. The ATR sampling device utilized a DuraSamplIR single-pass diamond-coated internal reflection accessory (Smiths Detection, Danbury, CT, USA), and a consistent contact pressure was applied by a stainless steel rod and an electronic load display. Two spectra were collected for each bundle over the range of 4000–600 cm−1 at 4 cm−1 with 32 co-added scans and their average was used for the analysis.
The spectra were imported to Grams/AI software (Version 7, Thermo Galactic, Salem, NH, USA) and smoothed with a Savitzky–Golay function (polynomial = 2 and points = 11). The dataset was then loaded into Microsoft Excel 2000 to calculate the CIIR parameter using the same algorithms previously reported [19,20]. Representative and baseline-uncorrected ATR-FTIR spectra in the 1800 to 600 cm−1 region with different CIIR values are shown in Figure 2. The assumption in this study is that there is no apparent bias in CIIR between Stelometer broken and unbroken fibers.
Figure 2. Representative attenuated total reflection-sampling device based Fourier transform infrared (ATR-FTIR) spectra of cotton fibers with CIIR readings of 60% (dotted line) and 90% (solid line).
Fibers 02 00211 g002

3. Results and Discussion

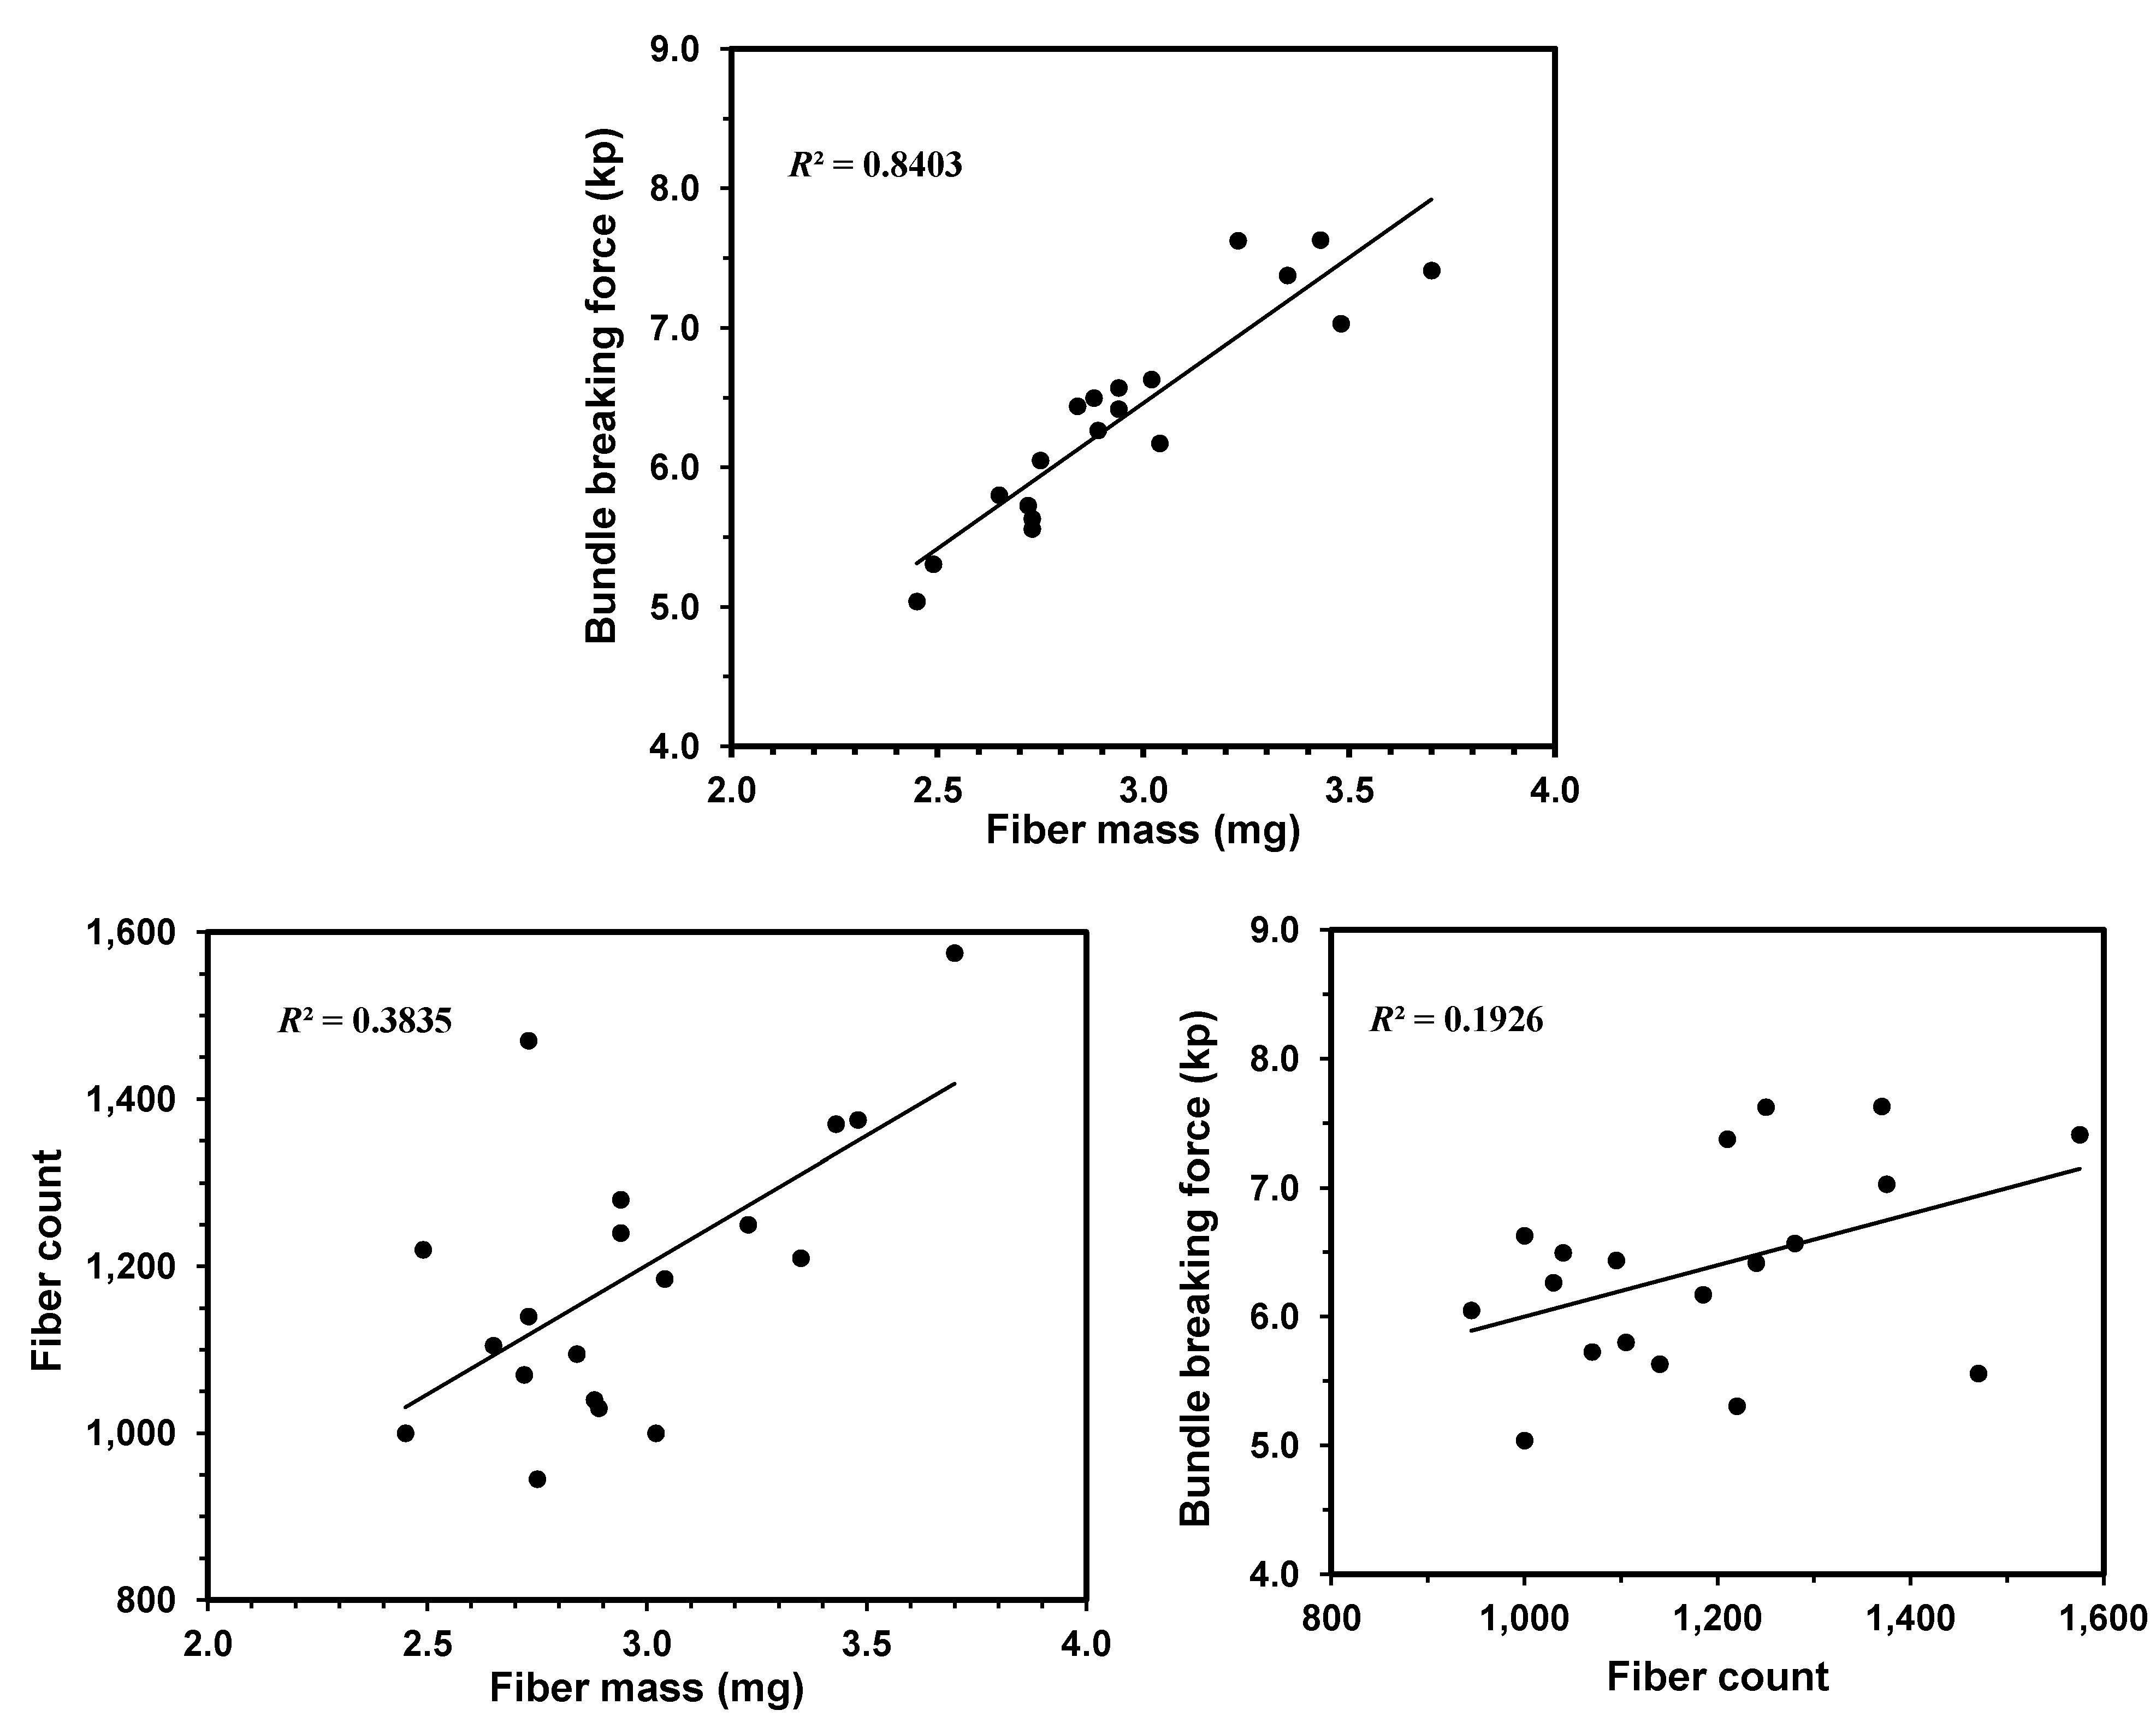
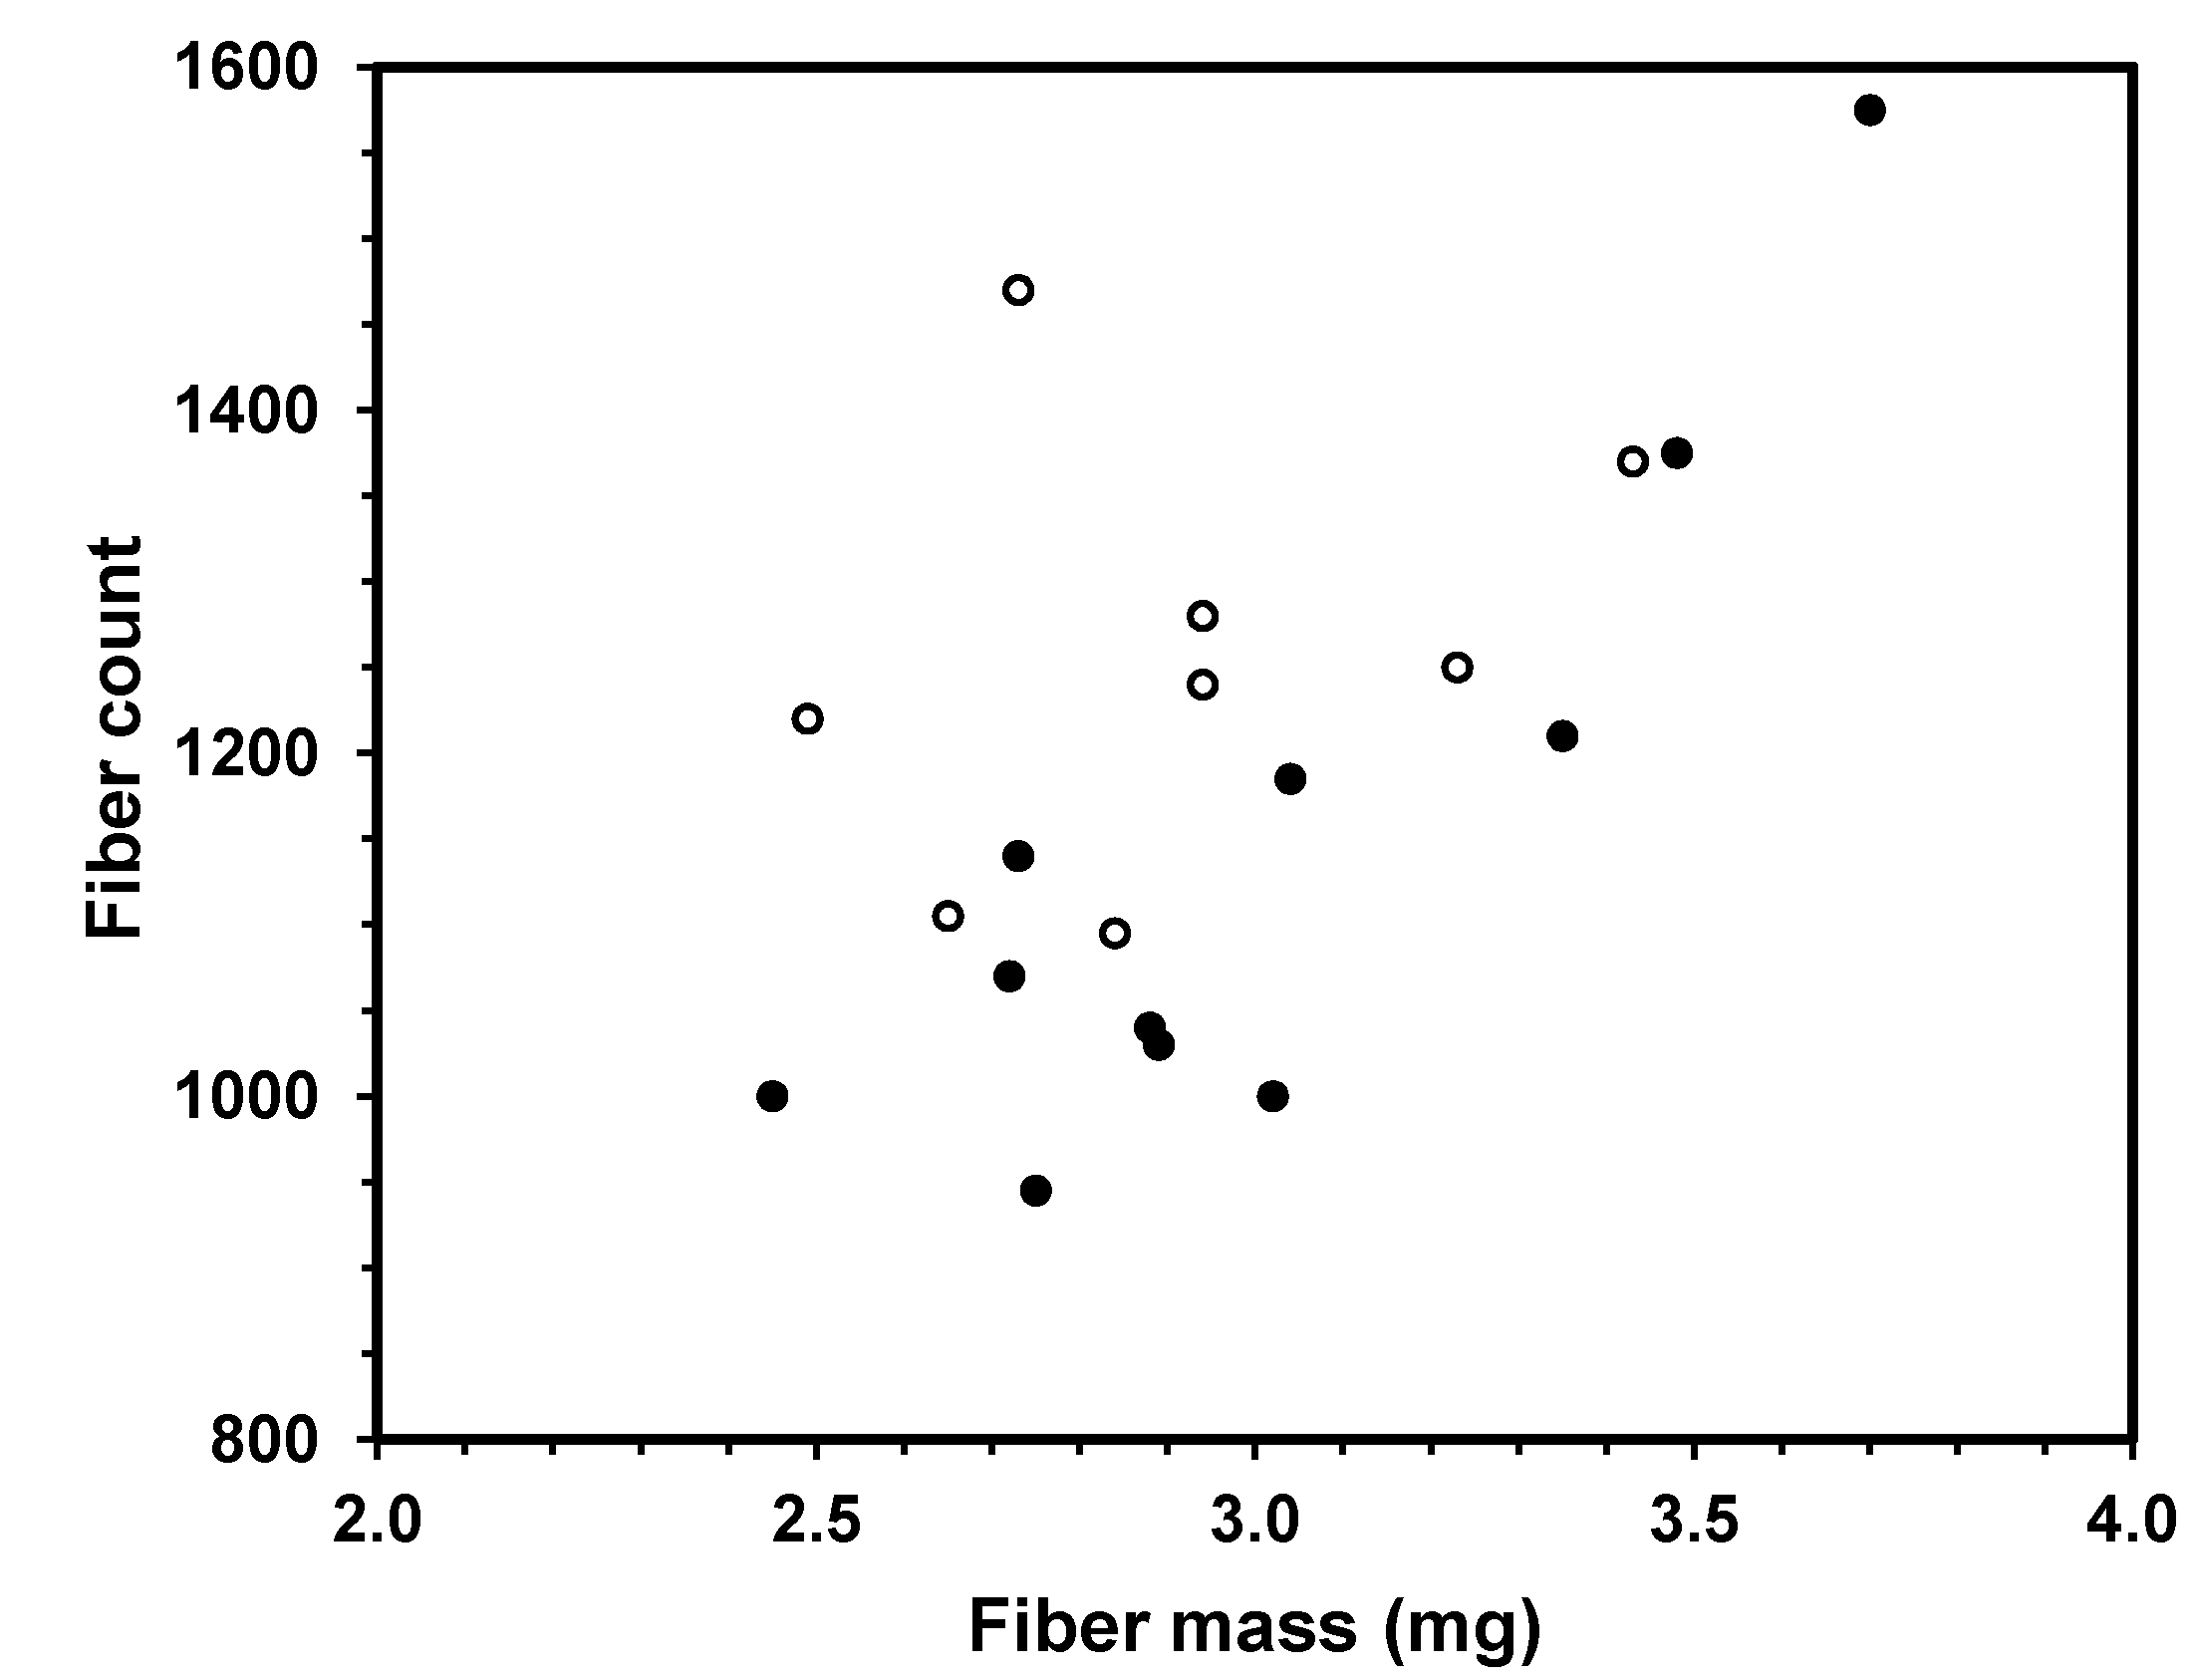
3.1. Relationships between Fiber Bundle Breaking Force, Fiber Mass and Fiber Count

The Stelometer measures the external force that is required to break a small and flat bundle of fibers. The broken bundle sample was then weighed. Figure 3a shows the relationship between fiber bundle breaking force (Kp) and fiber bundle mass among 19 diverse samples. A high determination of correlation (R2 = 0.84) was expected, as it took more force to break a heavy fiber bundle than a light one.
Figure 3b,c compare the plots relating fiber count with fiber bundle mass and breaking force, respectively. It is reasonable to observe a general increase in fiber bundle mass and breaking force with fiber number, but apparently with a much lower R2 (0.19~0.38).
Figure 3. (a) Relationship between fiber bundle breaking force and fiber mass; (b) relationship between fiber count and fiber mass; (c) relationship between fiber bundle breaking force and fiber count.
Fibers 02 00211 g003

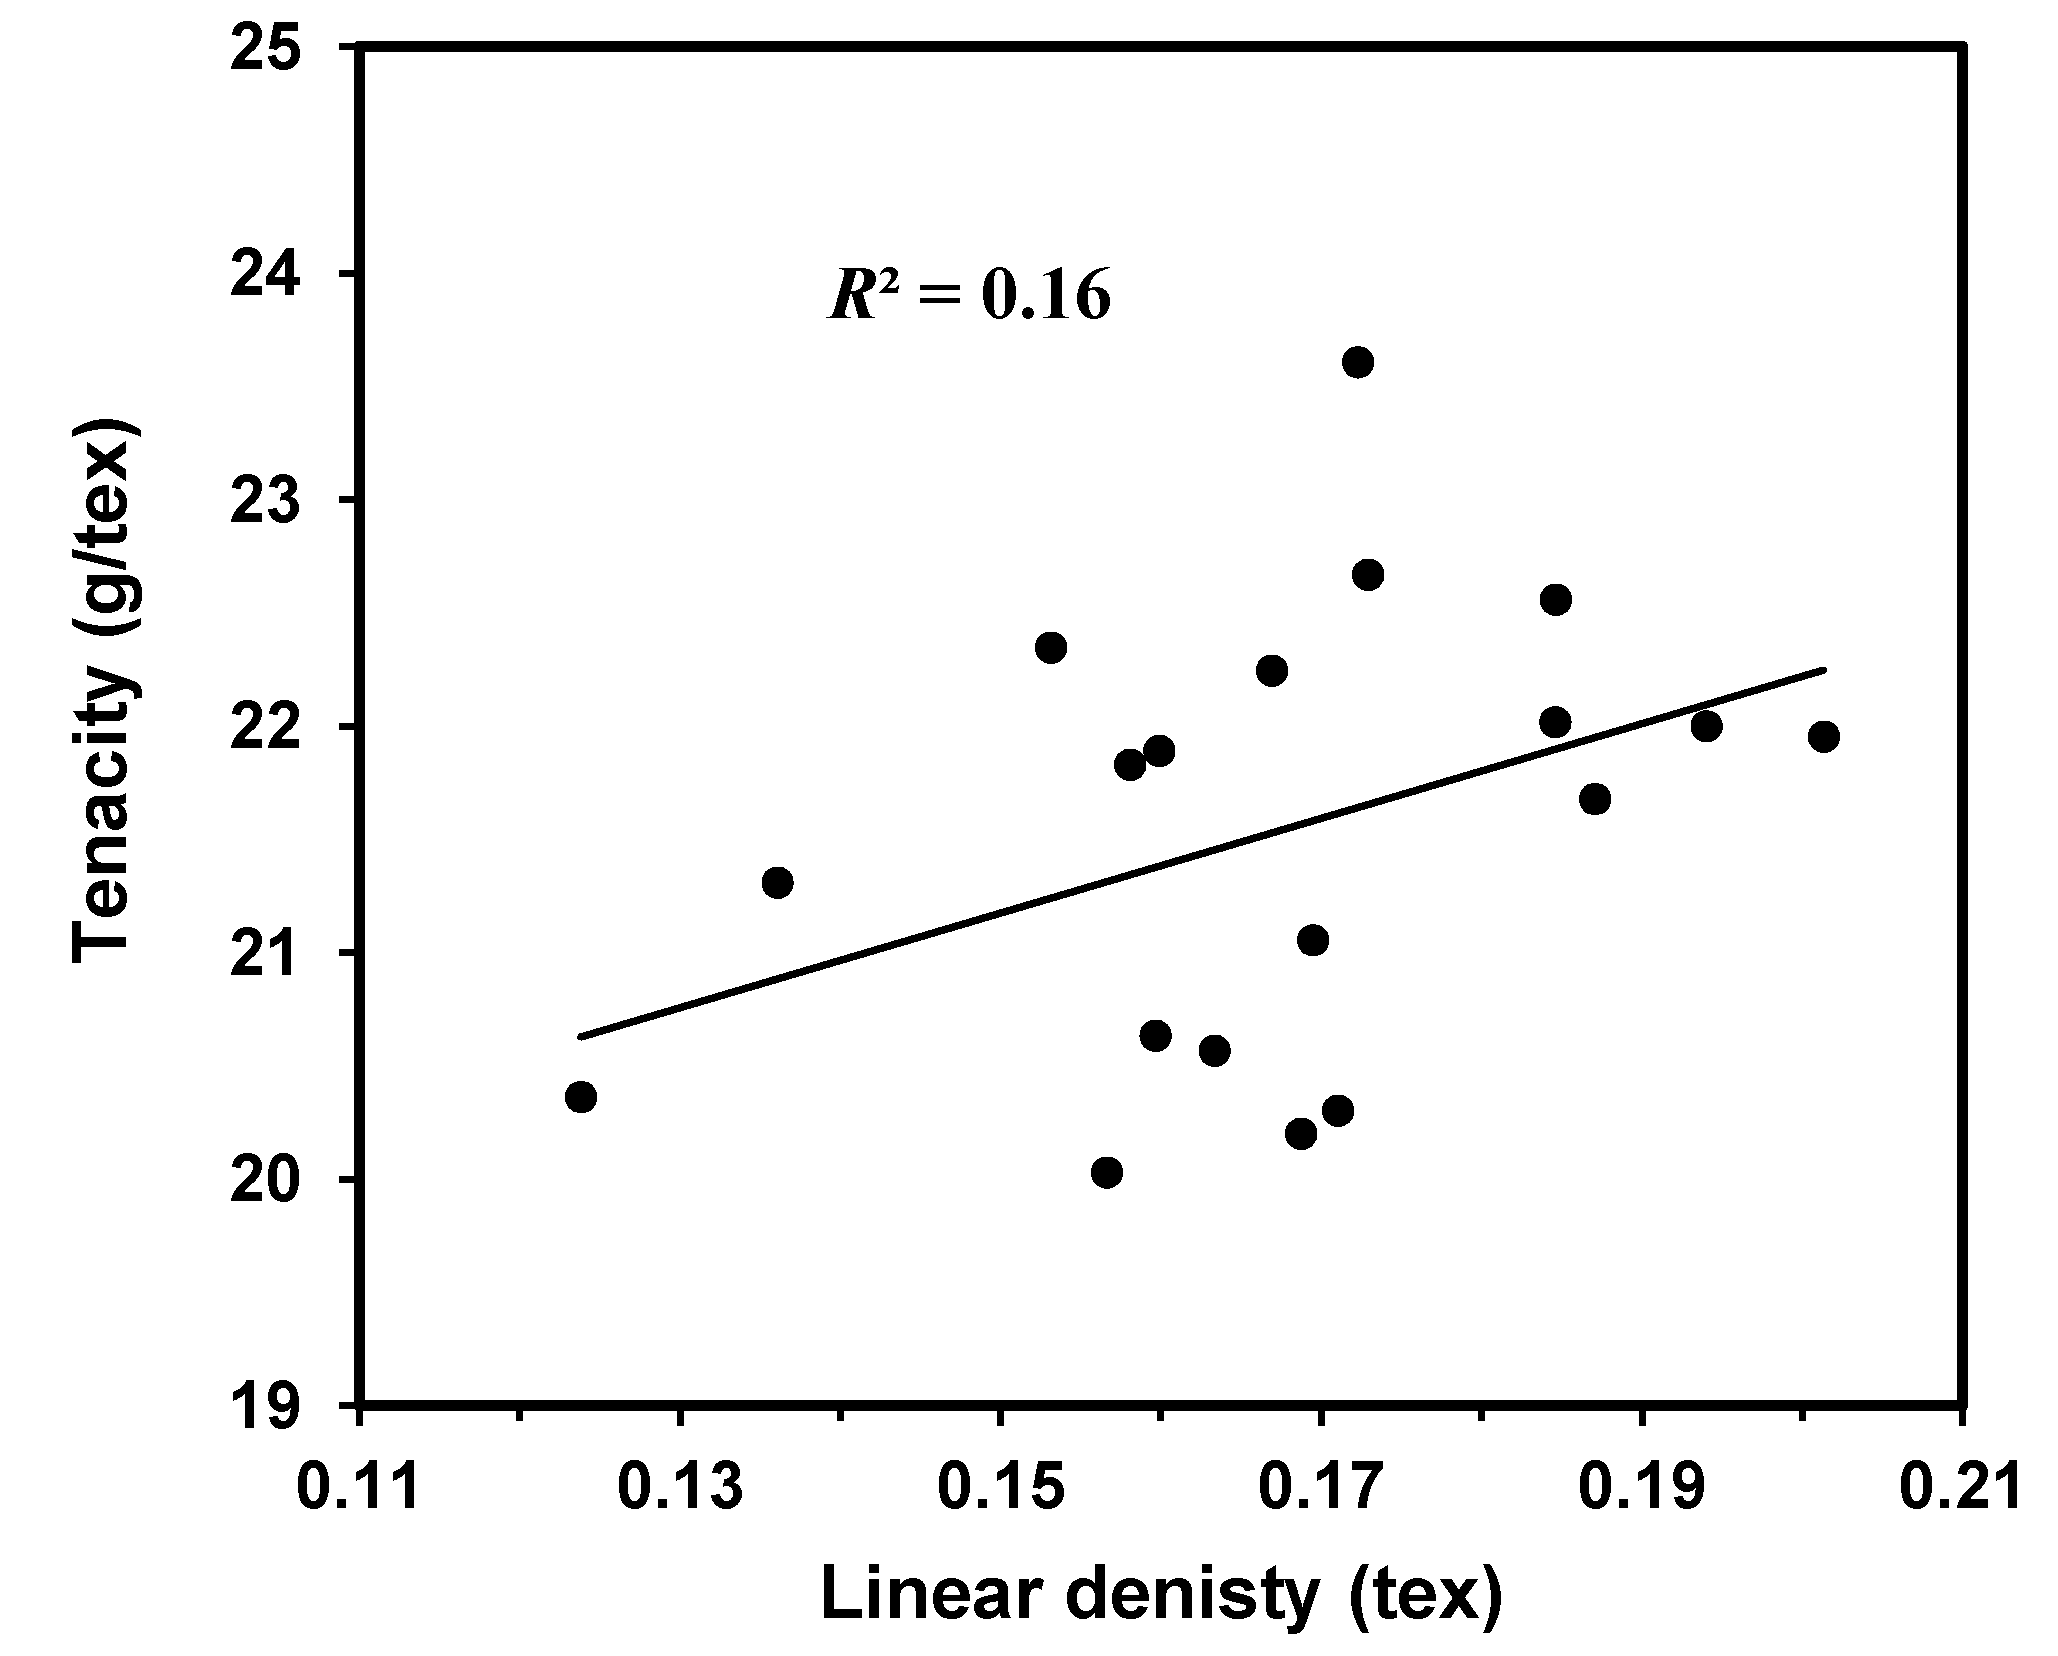
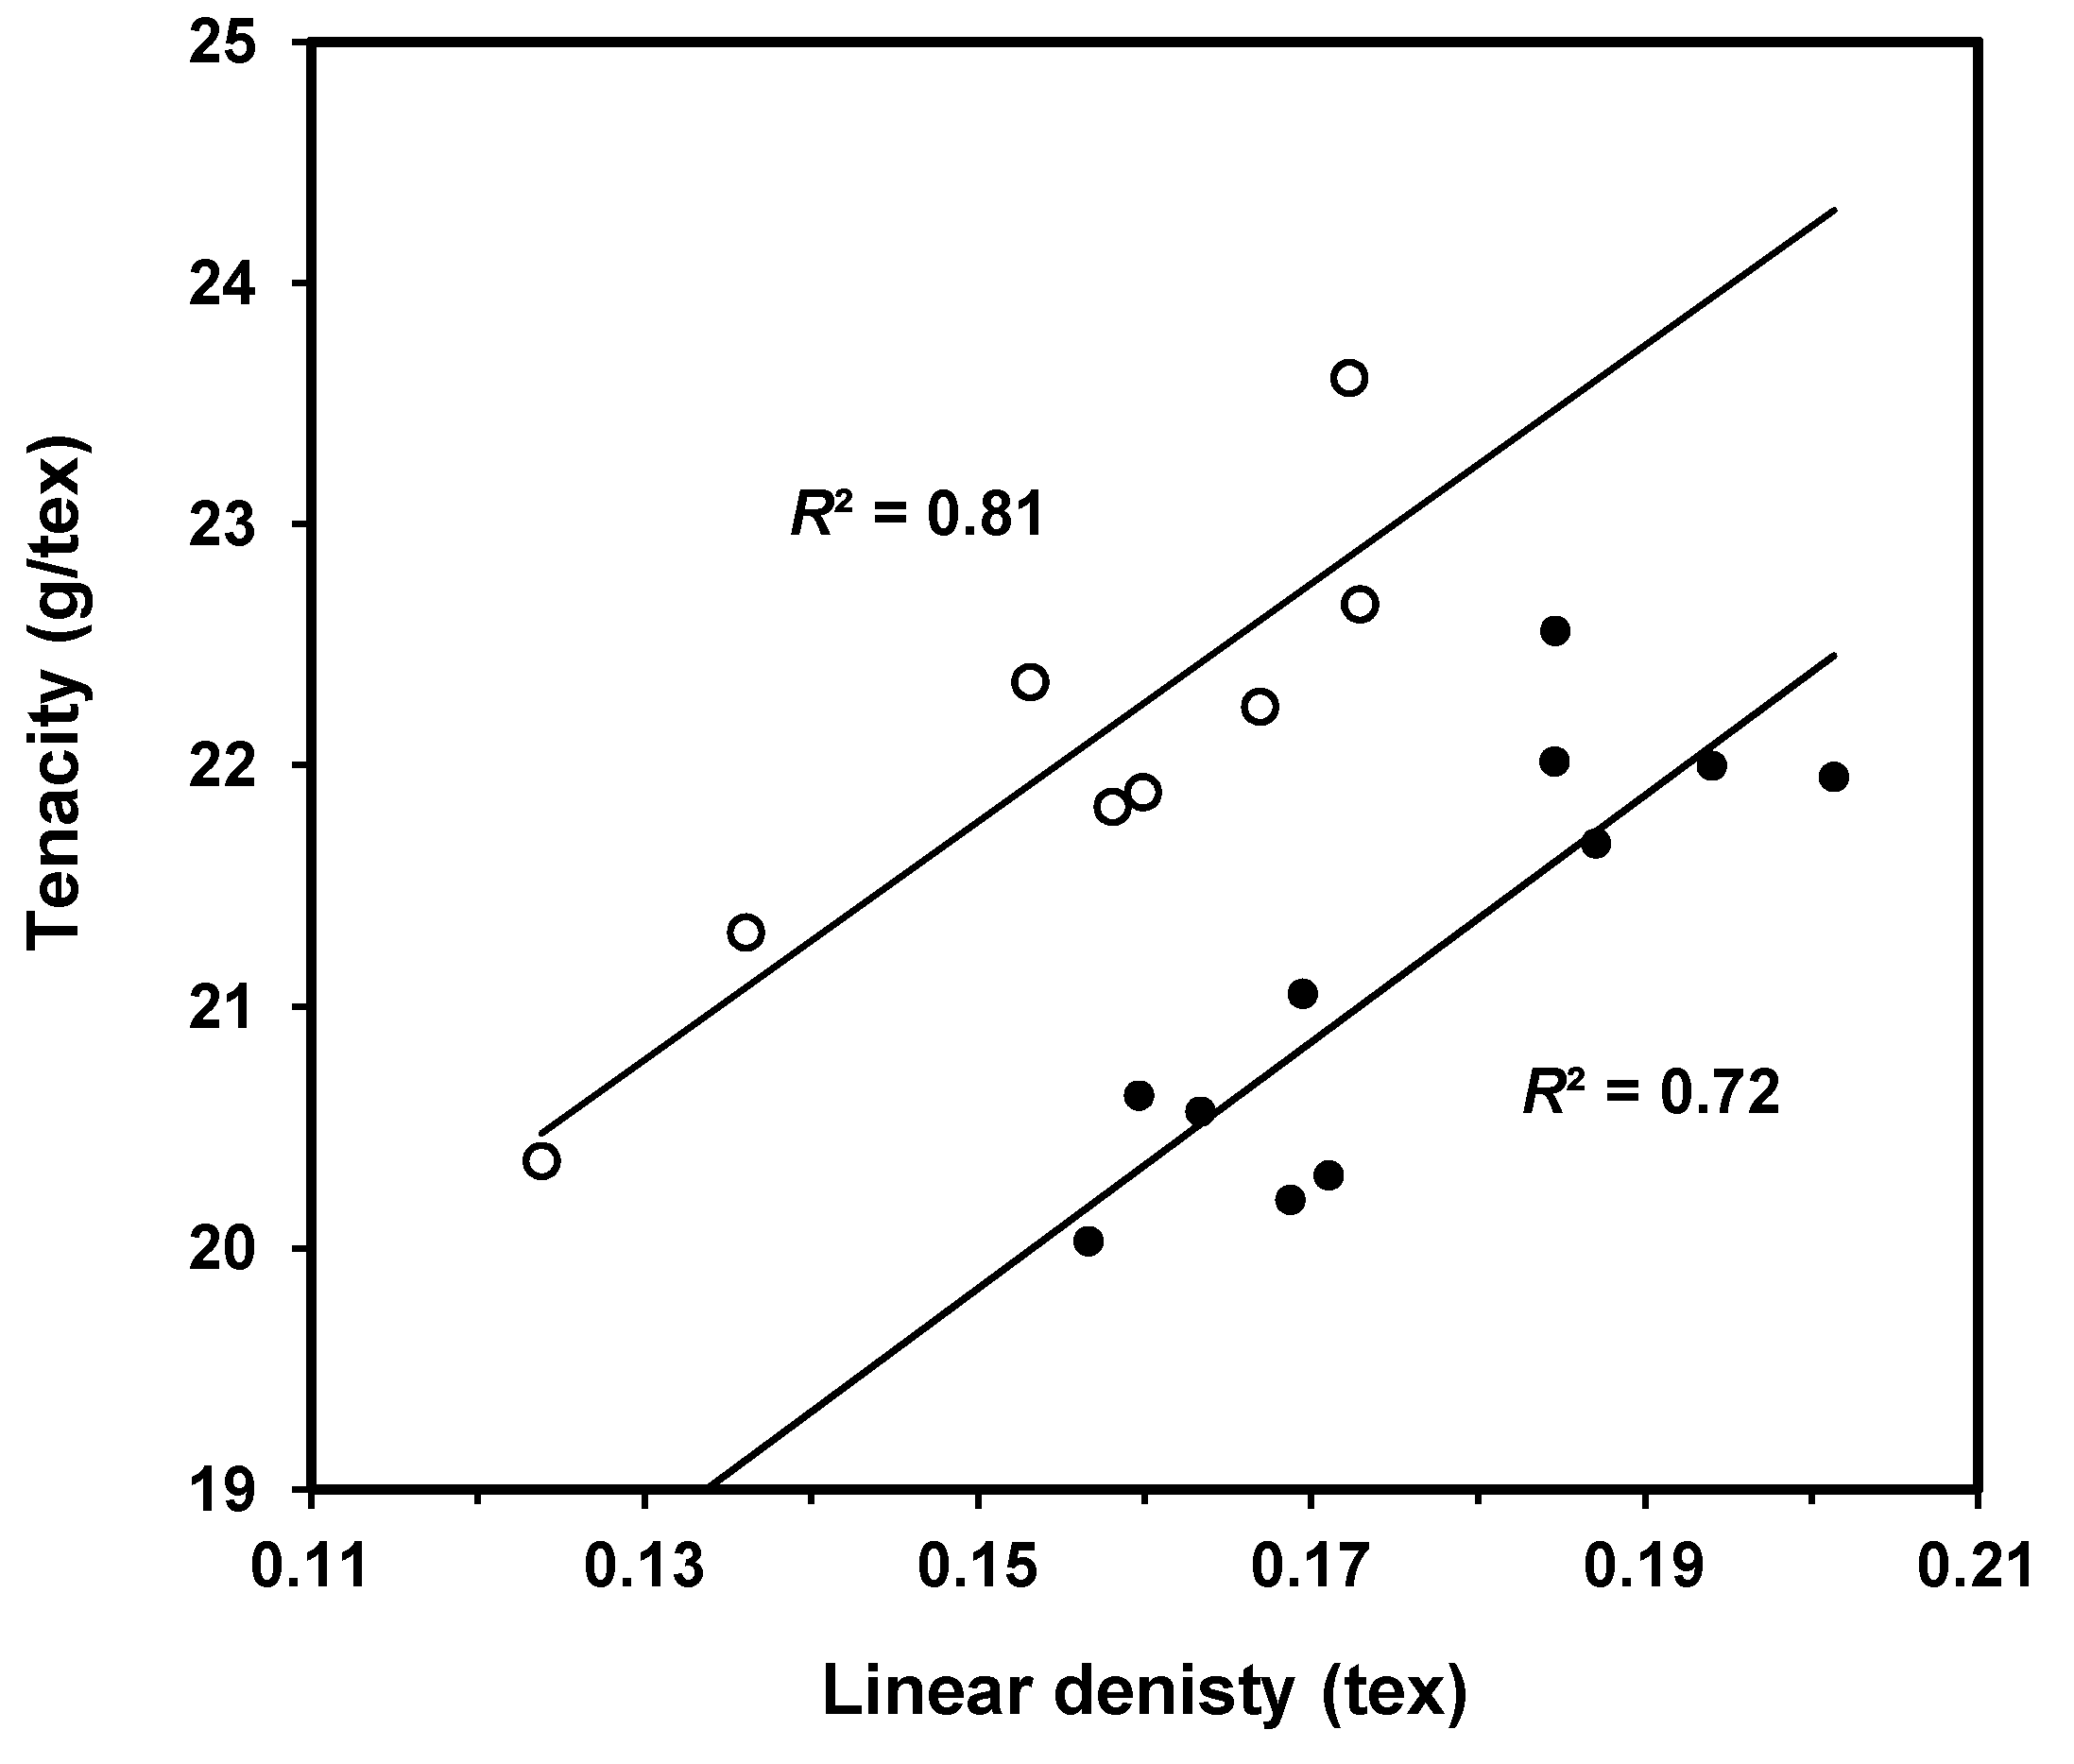
3.2. Fiber Tenacity and Linear Density

Stelometer tenacity in the unit of g/tex (1 tex = 1 g/km) was simply calculated using the bundle breaking force and the known weight of fiber bundle from samples in Figure 3a. The fiber linear density in tex was estimated from the fiber bundle weight and fiber number in Figure 3b, and also the known bundle length. Fiber tenacity varies with fiber linear density insignificantly (Figure 4).
Linear densities of developmental SJ-2 Acala cottons at various days post-anthesis (dpa) were assessed by Hsieh el al. [16]. They acquired these values from the weights of 100 1-cm long fibers, in which these middle 1-cm sections were cut from an array of combed and aligned fibers. They reported the linear densities of 0.045, 0.055, 0.12, 0.16, 0.17, and 0.19 tex for the fibers at 21, 27, 29, 34, 47, and 62 dpa, respectively. Despite different approaches in examining the linear density, the current observation on commercial-ready or mature cottons in Figure 4 is in good agreement with those from Hsieh et al. [16].
Figure 4. Correlation between fiber bundle tenacity and linear density.
Fibers 02 00211 g004

3.3. Fine and Coarse Fibers

Due to the scattered distribution in Figure 4, the samples were subjectively divided into two subsets and the resultant pattern is given in Figure 5. The corresponding samples in Figure 3b were represented and are shown in Figure 6. As the samples having the same fiber mass contain differing fiber numbers (Figure 6), it might refer the samples with more fiber counts as fine fibers and, in turn, the samples with less fiber numbers as coarse fibers. Under this concept, fine fibers are relative to coarse ones when they have close masses. In average, fine and coarse Stelometer bundles have approximately 432 and 381 fibers/mg, respectively. Notably, the subjective criterion of assigning the fibers into fine or coarse groups is based on the relationship between tenacity and linear density as well as between fiber count and mass.

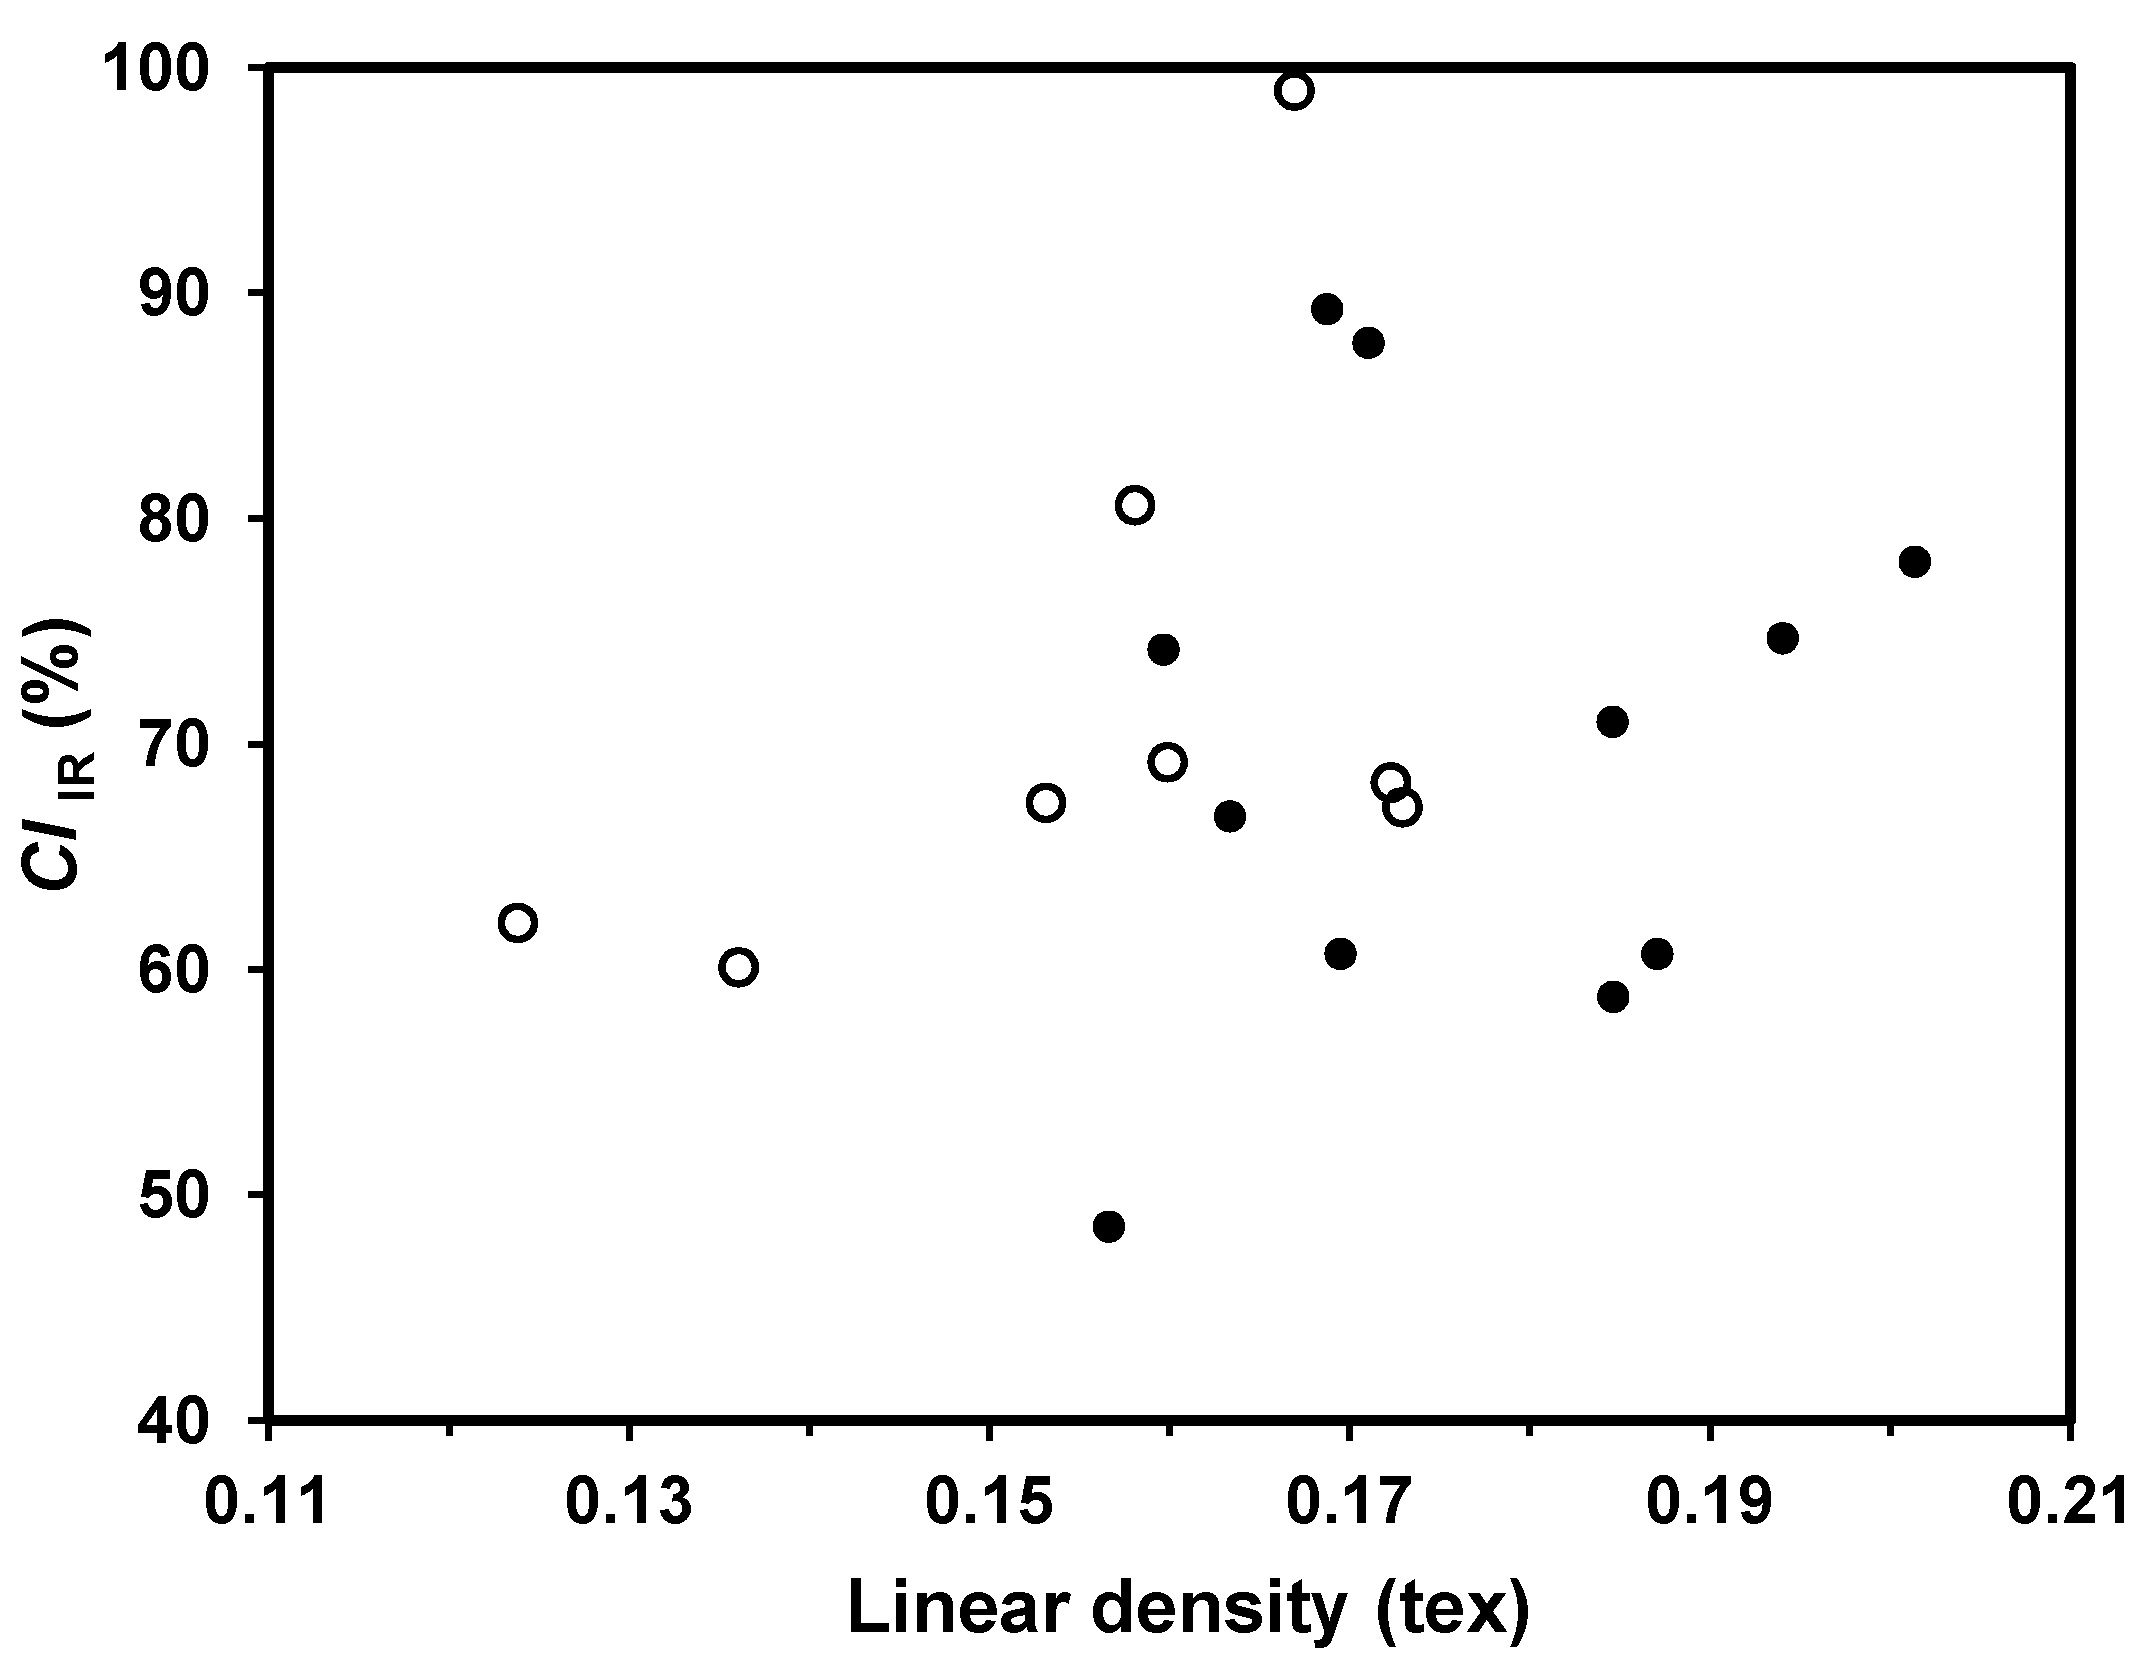
3.4. Fiber Linear Density and Tenacity vs. Fiber Crystallinity

The relationship between the linear density and CIIR for fine and coarse fibers is depicted in Figure 7. Over all, linear density increases insignificantly with CIIR. Identical to the proceeding report [22], the tenacity of these fibers were nearly independent of CIIR (data not shown).
In Figure 7, the means of CIIR are 71.7% and 70.0% for respective fine and coarse fibers, implying a slightly variation in CIIR between two types of fibers. Further examination of both Figure 5 and Figure 7 suggests that, when fibers show close linear densities of either 0.16 or 0.17 tex, those fibers with higher CIIR exhibit greater tenacity than ones with lower CIIR. For example, among six samples having a linear density of approximately 0.16 tex, three fine fibers with a averaged tenacity of 22.0 g/tex indicate a mean CIIR of 79.9% while three coarse fibers with a averaged tenacity of 20.4 g/tex correspond to a averaged CIIR of 70.5%. Likely, this implies that fiber crystallinity contributes positively to fiber tenacity, and a direct comparison between crystallinity and tenacity among the fibers becomes meaningful when they posses appropriate fiber mass and count (or similar linear density).
Figure 5. Representation of Figure 4 with two subsets of fine (○) and coarse (●) fibers.
Fibers 02 00211 g005
Figure 6. Representation of Figure 3b with two subsets of fine (○) and coarse (●) fibers.
Fibers 02 00211 g006
A recent study [23] reported an unclear trend between averaged fiber tenacity and CIIR for Upland fibers (Gossypium hirsutum) but a clear tendency between fiber tenacity and CIIR for Pima fibers (Gossypium barbadense). In current investigation, the samples were part of those Upland fibers used previously [23]. However, there was a difference between this and previous attempt; that is, this study only analyzed one bundle breakage of six tests for a sample, while the earlier one utilized the average of six bundle breaks within a sample.

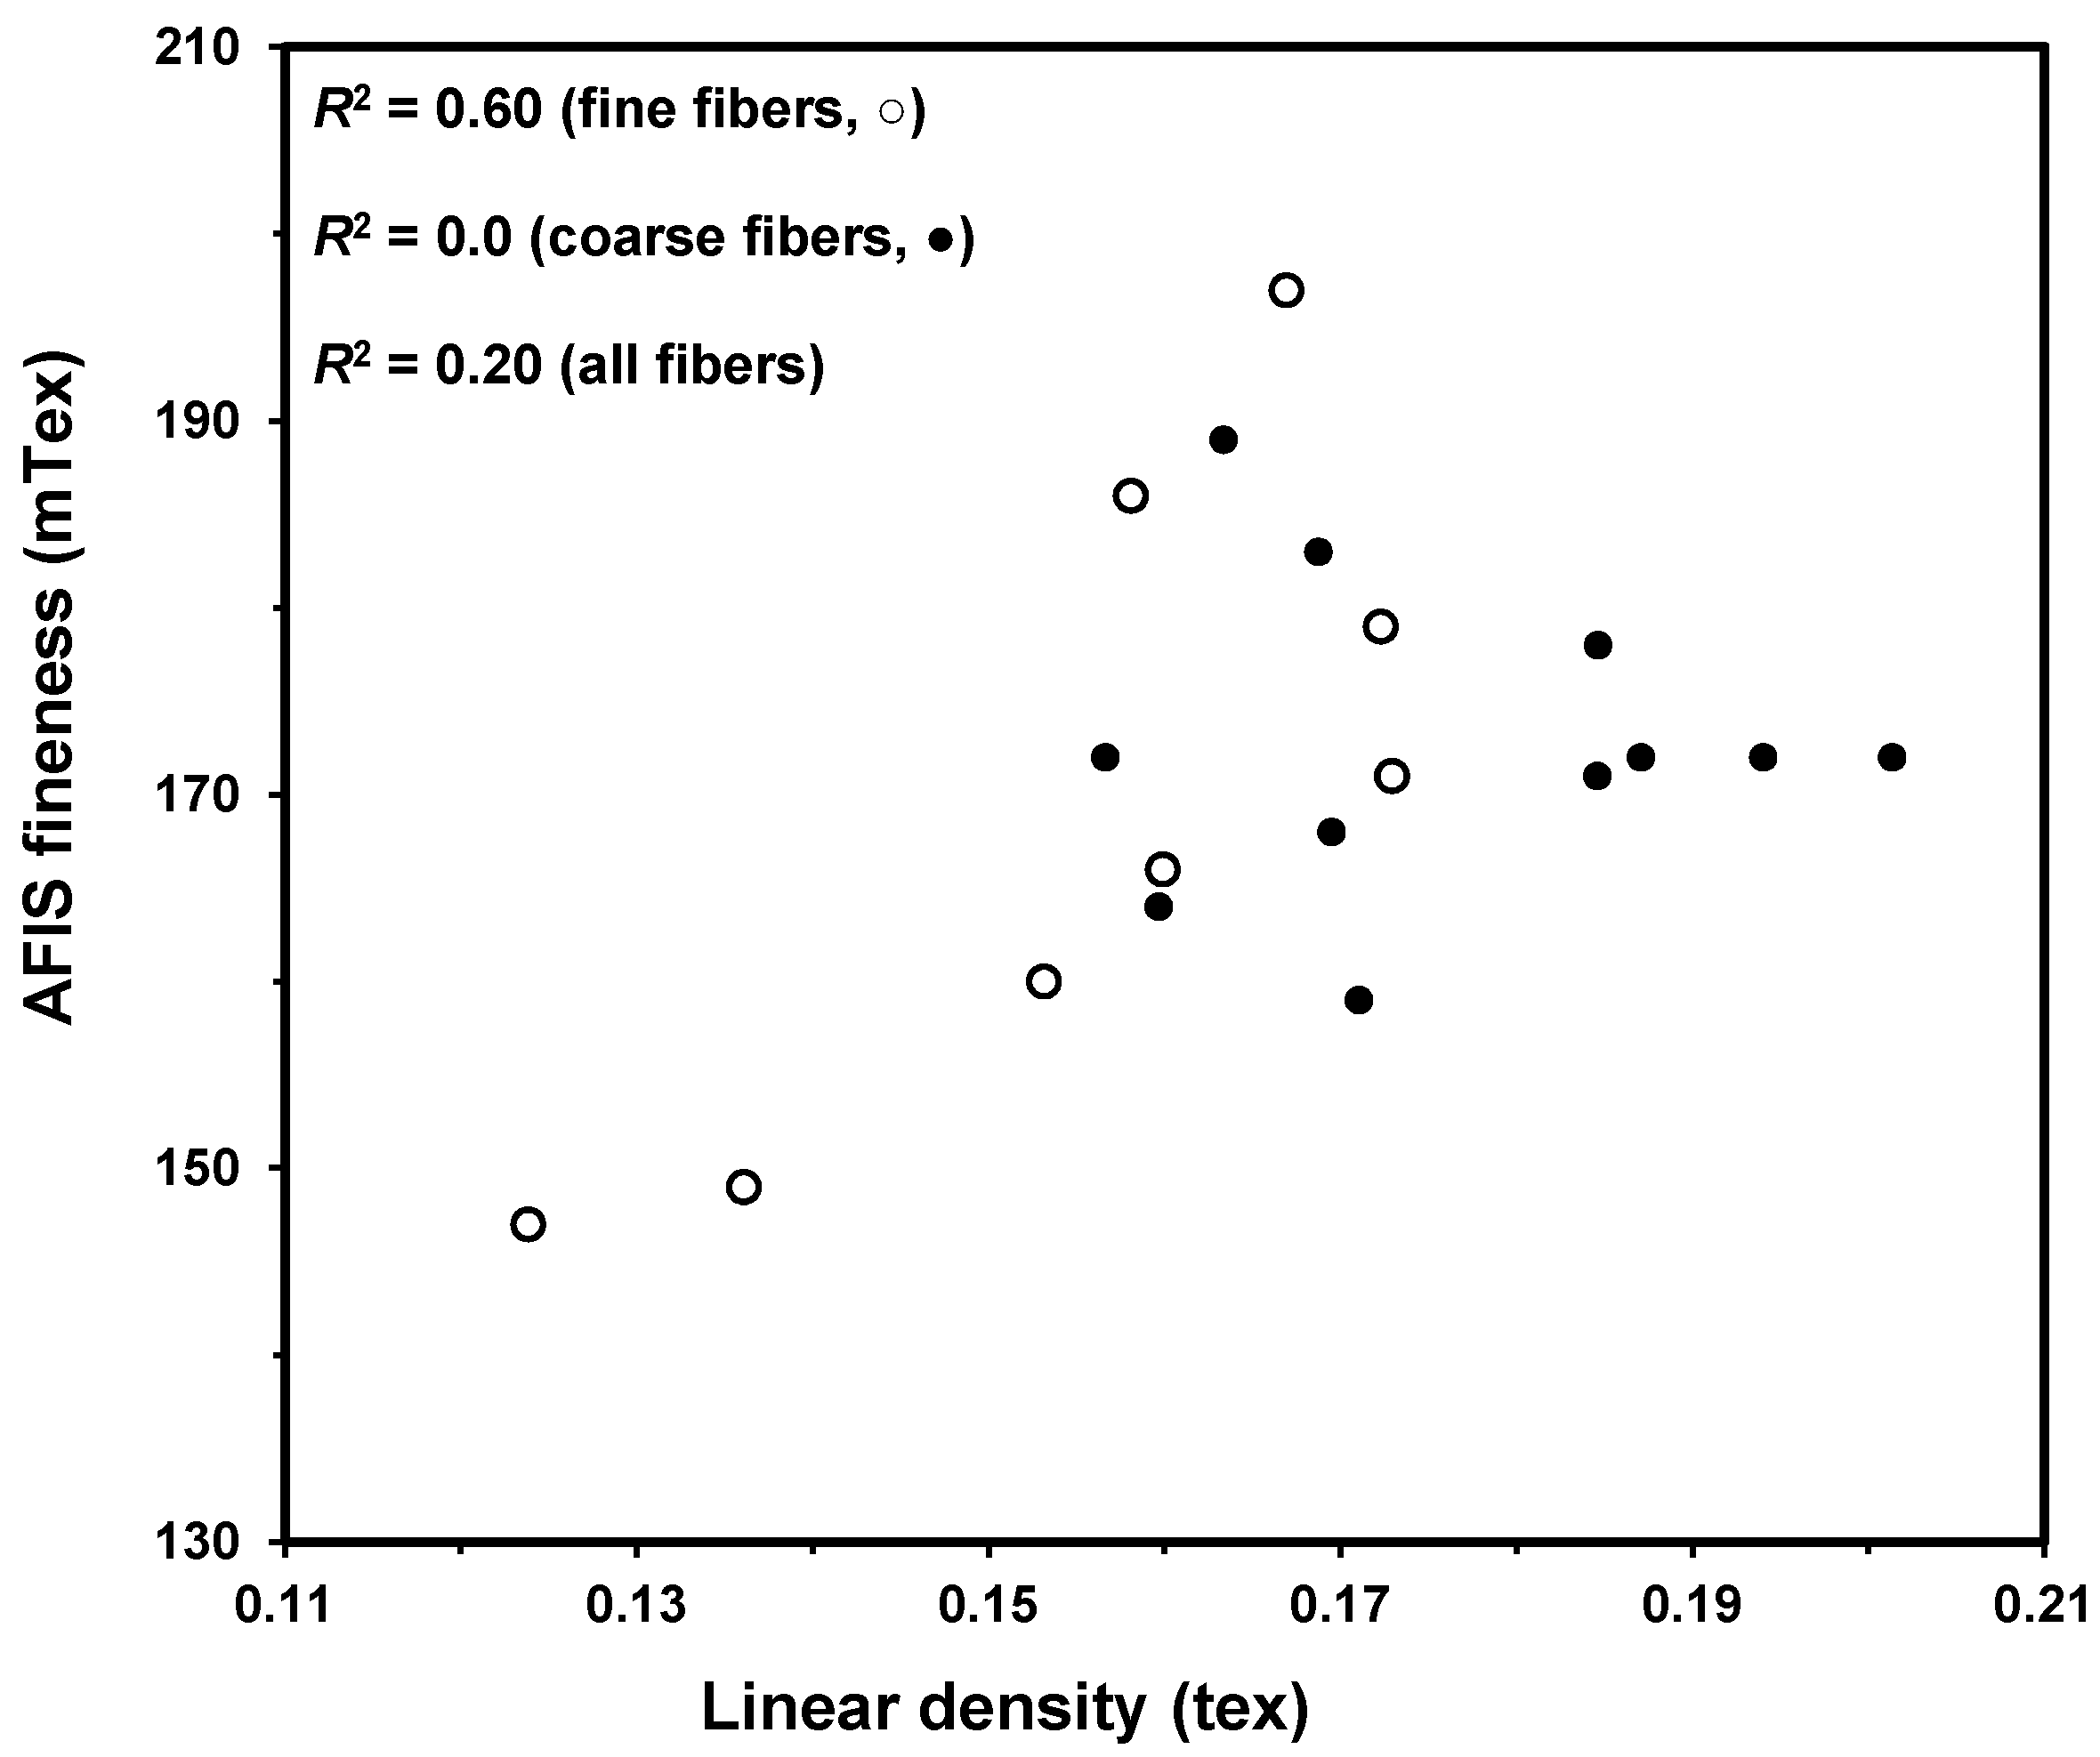
3.5. AFIS Fineness versus Fiber Linear Density

Despite a relatively scattered pattern in Figure 8, it indicates a general increase (R2 = 0.20) in AFIS fineness along with linear density, at least for fine fibers (R2 = 0.60). Apparently, more studies are necessary to understand the similarities or differences between two approaches of determining fiber linear density, cross-sectional based AFIS vs. gravimetric based one in this study.
Figure 7. Plot of CIIR vs. linear density between fine (○) and coarse (●) fibers.
Fibers 02 00211 g007
Figure 8. Comparison of Advanced Fiber Information System (AFIS) fineness vs. linear density among fine (○) and coarse (●) fibers.
Fibers 02 00211 g008

4. Conclusions

Fiber mass, count, and breaking force from Stelometer testing were used to generate tenacity and linear density of diversified cottons. From the plot of tenacity vs. linear density and also the plot of fiber count vs. mass, the fibers were subjectively divided into two classes of either fine or coarse. That is, fibers with similar weights but more (or less) fiber counts were considered to be fine (or coarse) fibers. This led to averaged 432 and 381 fibers/mg as well as 71.7% and 70.0% CIIR in respective fine and coarse Stelometer bundles. Fiber tenacity increases linearly with linear density among fine or coarse fibers, whereas, in general, AFIS fineness increases with linear density. Notably, fiber tenacity increases with CIIR when the samples have close linear densities.

Acknowledgments

We sincerely thank L. James and N. Carroll (ARS, Clemson, SC, USA) for technical assistance in collecting the Stelometer reference data and also our collaborators for providing the domestic and international cotton samples.

Author Contributions

Yongliang Liu conceived the research, organized the experiments, counted the fibers, interpreted the results, wrote and edited the manuscript. Devron Thibodeaux conceived the research and was responsible for Stelometer and AFIS measurement. James Rodgers suggested the linear density and edited the manuscript. All authors read and approved the final manuscript.

Conflicts of Interest

The authors declare no conflict of interest.

References

  1. Hsieh, Y.-L. Chemical structure and properties of cotton. In Cotton: Science and Technology; Gordon, S., Hsieh, Y.-L., Eds.; Woodhead Publishing Limited: Cambridge, England, 2007; pp. 3–34. [Google Scholar]
  2. Thibodeaux, D.P.; Evans, J.P. Cotton fiber maturity by image analysis. Text. Res. J. 1986, 56, 130–139. [Google Scholar] [CrossRef]
  3. Maxwell, J.M.; Gordon, S.G.; Huson, M.G. Internal structure of mature and immature cotton fibers revealed by scanning probe microscopy. Text. Res. J. 2003, 73, 1005–1012. [Google Scholar] [CrossRef]
  4. Bradow, J.M.; Hinojosa, O.; Wartelle, L.H.; Davidonis, G.; Saaaenrath-Cole, G.F.; Bauer, P.J. Applications of AFIS fineness and maturity module and X-ray fluorescence spectroscopy in fiber maturity evaluation. Text. Res. J. 2003, 66, 545–554. [Google Scholar]
  5. Hequet, E.; Wyatt, B.; Abidi, N.; Thibodeaux, D.P. Creation of a set of reference material for cotton fiber maturity measurements. Text. Res. J. 2006, 76, 576–586. [Google Scholar] [CrossRef]
  6. Hsieh, Y.-L.; Hu, X.-P.; Nguyen, A. Strength and crystallinity structure of developing Acala cotton. Text. Res. J. 1997, 67, 529–536. [Google Scholar]
  7. Hartzell-Lawson, M.M.; Hsieh, Y.-L. Characterizing the noncellulosics in developing cotton fibers. Text. Res. J. 2000, 70, 810–819. [Google Scholar] [CrossRef]
  8. Abidi, N.; Hequet, E.; Cabrales, L. Changes in sugar composition and cellulose content during the secondary cell wall biogenesis in cotton fibers. Cellulose 2010, 17, 153–160. [Google Scholar] [CrossRef]
  9. Abidi, N.; Cabrales, L.; Hequet, E. Fourier transform infrared spectroscopic approach to the study of the secondary cell wall development in cotton fiber. Cellulose 2010, 17, 309–320. [Google Scholar] [CrossRef]
  10. Abidi, N.; Cabrales, L.; Haigler, C.H. Changes in the cell wall and cellulose content of developing cotton fibers investigated by FTIR spectroscopy. Carbohydr. Polym. 2014, 100, 9–16. [Google Scholar] [CrossRef]
  11. Paudel, D.R.; Hequet, E; Abidi, N. Evaluation of cotton fiber maturity measurements. Ind. Crops Prod. 2013, 45, 435–441. [Google Scholar] [CrossRef]
  12. Abbot, A.M.; Higgerson, G.J.; Long, R.L.; Lucas, S.R.; Naylor, G.R.S.; Tischler, C.R.; Purmalis, M.M. An instrument for determining the average fiber linear density (fineness) of cotton lint samples. Text. Res. J. 2009, 80, 822–833. [Google Scholar]
  13. Lord, E. Air flow through plugs of textile fibers part II. The micronaire test for cotton. J. Text. Inst. 1956, 47, T16–T47. [Google Scholar] [CrossRef]
  14. American Society for Testing and Materials (ASTM D5866–12). Standard test method for neps in cotton fibers. In Annual Book of ASTM Standards; ASTM International: West Conshohocken, PA, USA, 2012. [Google Scholar]
  15. American Society for Testing and Materials (ASTM D1577–12). Standard test method for linear density of textile fibers. In Annual Book of ASTM Standards; ASTM International: West Conshohocken, PA, USA, 2012. [Google Scholar]
  16. Hsieh, Y.-L.; Honik, E.; Hartzell, M.M. A developmental study of single fiber strength: Greenhouse grown SJ-2 Acala cotton. Text. Res. J. 1995, 65, 101–112. [Google Scholar] [CrossRef]
  17. Rodgers, J.; Delhom, C.; Fortier, C.; Thibodeaux, D. Rapid measurement of cotton fiber maturity and fineness by image analysis microscopy using the Cottonscope®. Text. Res. J. 2012, 82, 259–271. [Google Scholar] [CrossRef]
  18. Park, S.; Baker, J.; Himmel, M.; Parilla, P.; Johnson, D. Cellulose crystallinity index: Measurement techniques and their impact on interpreting cellulase performance. Biotechnol. Biofuels J. 2010, 3, 1–10. [Google Scholar] [CrossRef]
  19. Liu, Y.; Thibodeaux, D.; Gamble, G. Development of Fourier transform infrared spectroscopy in direct, non-destructive, and rapid determination of cotton fiber maturity. Text. Res. J. 2011, 81, 1559–1567. [Google Scholar] [CrossRef]
  20. Liu, Y.; Thibodeaux, D.; Gamble, G.; Bauer, P.; VanDerveer, D. Comparative investigation of Fourier transform infrared (FT-IR) spectroscopy and X-ray Diffraction (XRD) in the determination of cotton fiber crystallinity. Appl. Spectrosc. 2012, 66, 983–986. [Google Scholar] [CrossRef]
  21. American Society for Testing and Materials (ASTM D1445–12). Standard test method for breaking strength and elongation of cotton fibers (flat bundle method). In Annual Book of ASTM Standards; ASTM International: West Conshohocken, PA, USA, 2012. [Google Scholar]
  22. Liu, Y.; Thibodeaux, D.; Rodgers, J. Fiber Mass, Count and breAking Force from Stelometer Test. In Proceedings of the 2014 Beltwide Cotton Conference, New Orleans, LA, USA, 6–8 January 2014; National Cotton Council of America: Memphis, TN, USA, 2014. [Google Scholar]
  23. Liu, Y.; Thibodeaux, D.; Gamble, G.; Rodgers, J. Preliminary study of relating cotton fiber tenacity and elongation with crystallinity. Text. Res. J. 2014. [Google Scholar] [CrossRef]

