Article

Infrared Imaging of Cotton Fiber Bundles Using a Focal Plane Array Detector and a Single Reflectance Accessory

by
Michael Santiago Cintrón
1,*,
Joseph G. Montalvo
1,
Terri Von Hoven
1,
James E. Rodgers
1,
Doug J. Hinchliffe
2,
Crista Madison
2,
Gregory N. Thyssen
2 and
Linghe Zeng
3
1
Cotton Structure & Quality Research Unit, Southern Regional Research Center (SRRC), Agricultural Research Service (ARS), United States Department of Agriculture (USDA), New Orleans, LA 70124, USA
2
Cotton Chemistry & Utilization Research Unit, Southern Regional Research Center (SRRC), ARS, USDA, New Orleans, LA 70124, USA
3
Crop Genetics Research Unit, Jamie Whitten Delta States Research Center, ARS, USDA, Stoneville, MS 38776, USA
*
Author to whom correspondence should be addressed.
Fibers 2016, 4(4), 27; https://doi.org/10.3390/fib4040027
Submission received: 29 September 2016 / Revised: 18 October 2016 / Accepted: 18 October 2016 / Published: 10 November 2016

Abstract

:
Infrared imaging is gaining attention as a technique used in the examination of cotton fibers. This type of imaging combines spectral analysis with spatial resolution to create visual images that examine sample composition and distribution. Herein, we report on the use of an infrared instrument equipped with a reflection accessory and an array detector system for the examination of cotton fiber bundles. Cotton vibrational spectra and chemical images were acquired by grouping pixels in the detector array. This technique reduced spectral noise and was employed to visualize cell wall development in cotton fibers bundles. Fourier transform infrared spectra reveal band changes in the C–O bending region that matched previous studies. Imaging studies were quick, relied on small amounts of sample and provided a distribution of the cotton fiber cell wall composition. Thus, imaging of cotton bundles with an infrared detector array has potential for use in cotton fiber examinations.

Graphical Abstract

1. Introduction

Millions of cotton fiber examinations are performed every year. A bundle sample from all commercial bales of cotton produced in the United States is examined with a high volume instrument (HVI) as part of a cotton classification system [1,2,3]. Classing of cotton determines marketable fiber properties, such as fiber strength, length, micronaire, trash content (grade), and uniformity [2,4,5]. In addition, the advanced fiber information system (AFIS) can provide information on fiber length and maturity [2,3]. Similar classing examinations are becoming standard in other cotton-producing countries [6]. Moreover, cotton breeders rely on studies of fiber properties and fiber development (e.g., cell wall development, maturity ratio) when selecting new cotton varieties. Given the high volume of examinations, there is a need for developing new methods and technologies that might improve the efficiency and informative capability of current cotton characterization systems.
Infrared spectroscopy (IR) can be used to examine the quality, development and structure of cotton fibers [2,7,8,9]. While IR spectroscopy has long been used in cotton fiber studies, recent studies have established the use of Fourier transform infrared spectroscopy (FTIR) and an attenuated total reflection (ATR) attachment for fiber characterization [7,10,11,12]. ATR is an infrared sampling technique used to routinely sample solid or liquid materials [13,14,15,16]. Most ATR techniques rely on multiple reflections of the IR sampling beam along a sample. Abidi and coworkers used FTIR-ATR for the examination of cotton fiber cell wall development [10,11,12], while Lui and coworkers explored maturity determinations with FTIR-ATR [7]. Fortier and collaborators explored the use of FTIR-ATR and near-IR in cotton trash identification [17]. The ATR accessory presents significant improvements over classic IR techniques; it offers minimal sample preparation while also providing fast determinations [7,10,17]. Limitations of FTIR-ATR include the small total sample area examined with each scan (typical ATR crystals have a diameter of 1.5–5 mm) and the one-dimensional aspect of data acquisition (traditional ATR data has low or no spatial resolution).
Chemical imaging represents an emerging research field in the characterization of cotton fibers. Chemical images are prepared by collecting a multitude of spectra in spatially defined sample areas. The combination of spatial resolution and spectral signatures results in a visual image that can be used to pinpoint sample composition, uniformity, and distribution. Sample composition and uniformity are difficult to measure with traditional ATR units given their low spatial resolution. Recently, Mustafic and coworkers used fluorescence imaging to identify foreign matter in small cotton bundles [18]. The number of studies applying IR imaging to cotton fibers has been limited. Early studies concentrated on cell wall development or composition [19,20,21,22,23,24]. More recently, a high resolution focal plane array (FPA) detector [25] was used with an IR microscope to image developing cotton fibers [26]. The FPA-equipped system presented significant improvements over previous imaging studies; notably, the detector allowed for the simultaneous collection of thousands of spectral points. Still, that study was limited to the imaging of individual cotton fibers. An FPA detector was also used in a macro sampling chamber to image trash commonly found in cotton samples [27]. The preliminary study used a single reflectance ATR accessory to sample botanical and field trash. Single reflectance ATR techniques have gained attention following the widespread adoption of more sensitive IR detectors. The macro sampling chamber allows for the imaging of larger samples (bundles). While this technique proved effective in identifying various trash samples, the study made evident the limited reflectance of cotton fiber bundles [27]. Compared to the trash components, the cotton spectra lacked definition and showed significant spectral noise. Herein, we further explore the use of a single reflectance ATR accessory for the infrared imaging of cotton fiber bundles. Our study sought to establish a working technique that produced IR spectra of cotton bundles with reduced spectral noise or artifacts. To accomplish this end, spatial IR data was grouped into delineated data clusters. Data grouping is a tool that simplifies spectral analysis [28]. A potential application for the ATR-FPA technique was also explored. Data grouping was used to image bundles of developing cotton fibers and to examine the uniformity of their cell wall development and sample composition.

2. Materials and Methods

2.1. Plant Materials

Cotton samples from four varieties, Stoneville 474 (STV474; PI578877), Deltapine Acala 90 (DP90; PI564767), Tamcot Pyramid (Pyramid; PI617042), and M-240 RNR (M240; PI592511), were grown in 2015 under standard field conditions in Stoneville, MS, USA. Samples were harvested at different developmental time points between 18 and 24 days post-anthesis (DPA). Mature samples were also collected from open cotton bolls (60+ DPA). Fibers for all developmental points were removed from the cotton seed by hand, cleaned with water to remove excess plant and soluble material, and allowed to dry overnight in an oven (~90 °C). Each sample is composed of fibers from multiple cotton bolls and plants. The samples were not subjected to mechanical cleaning or blending.

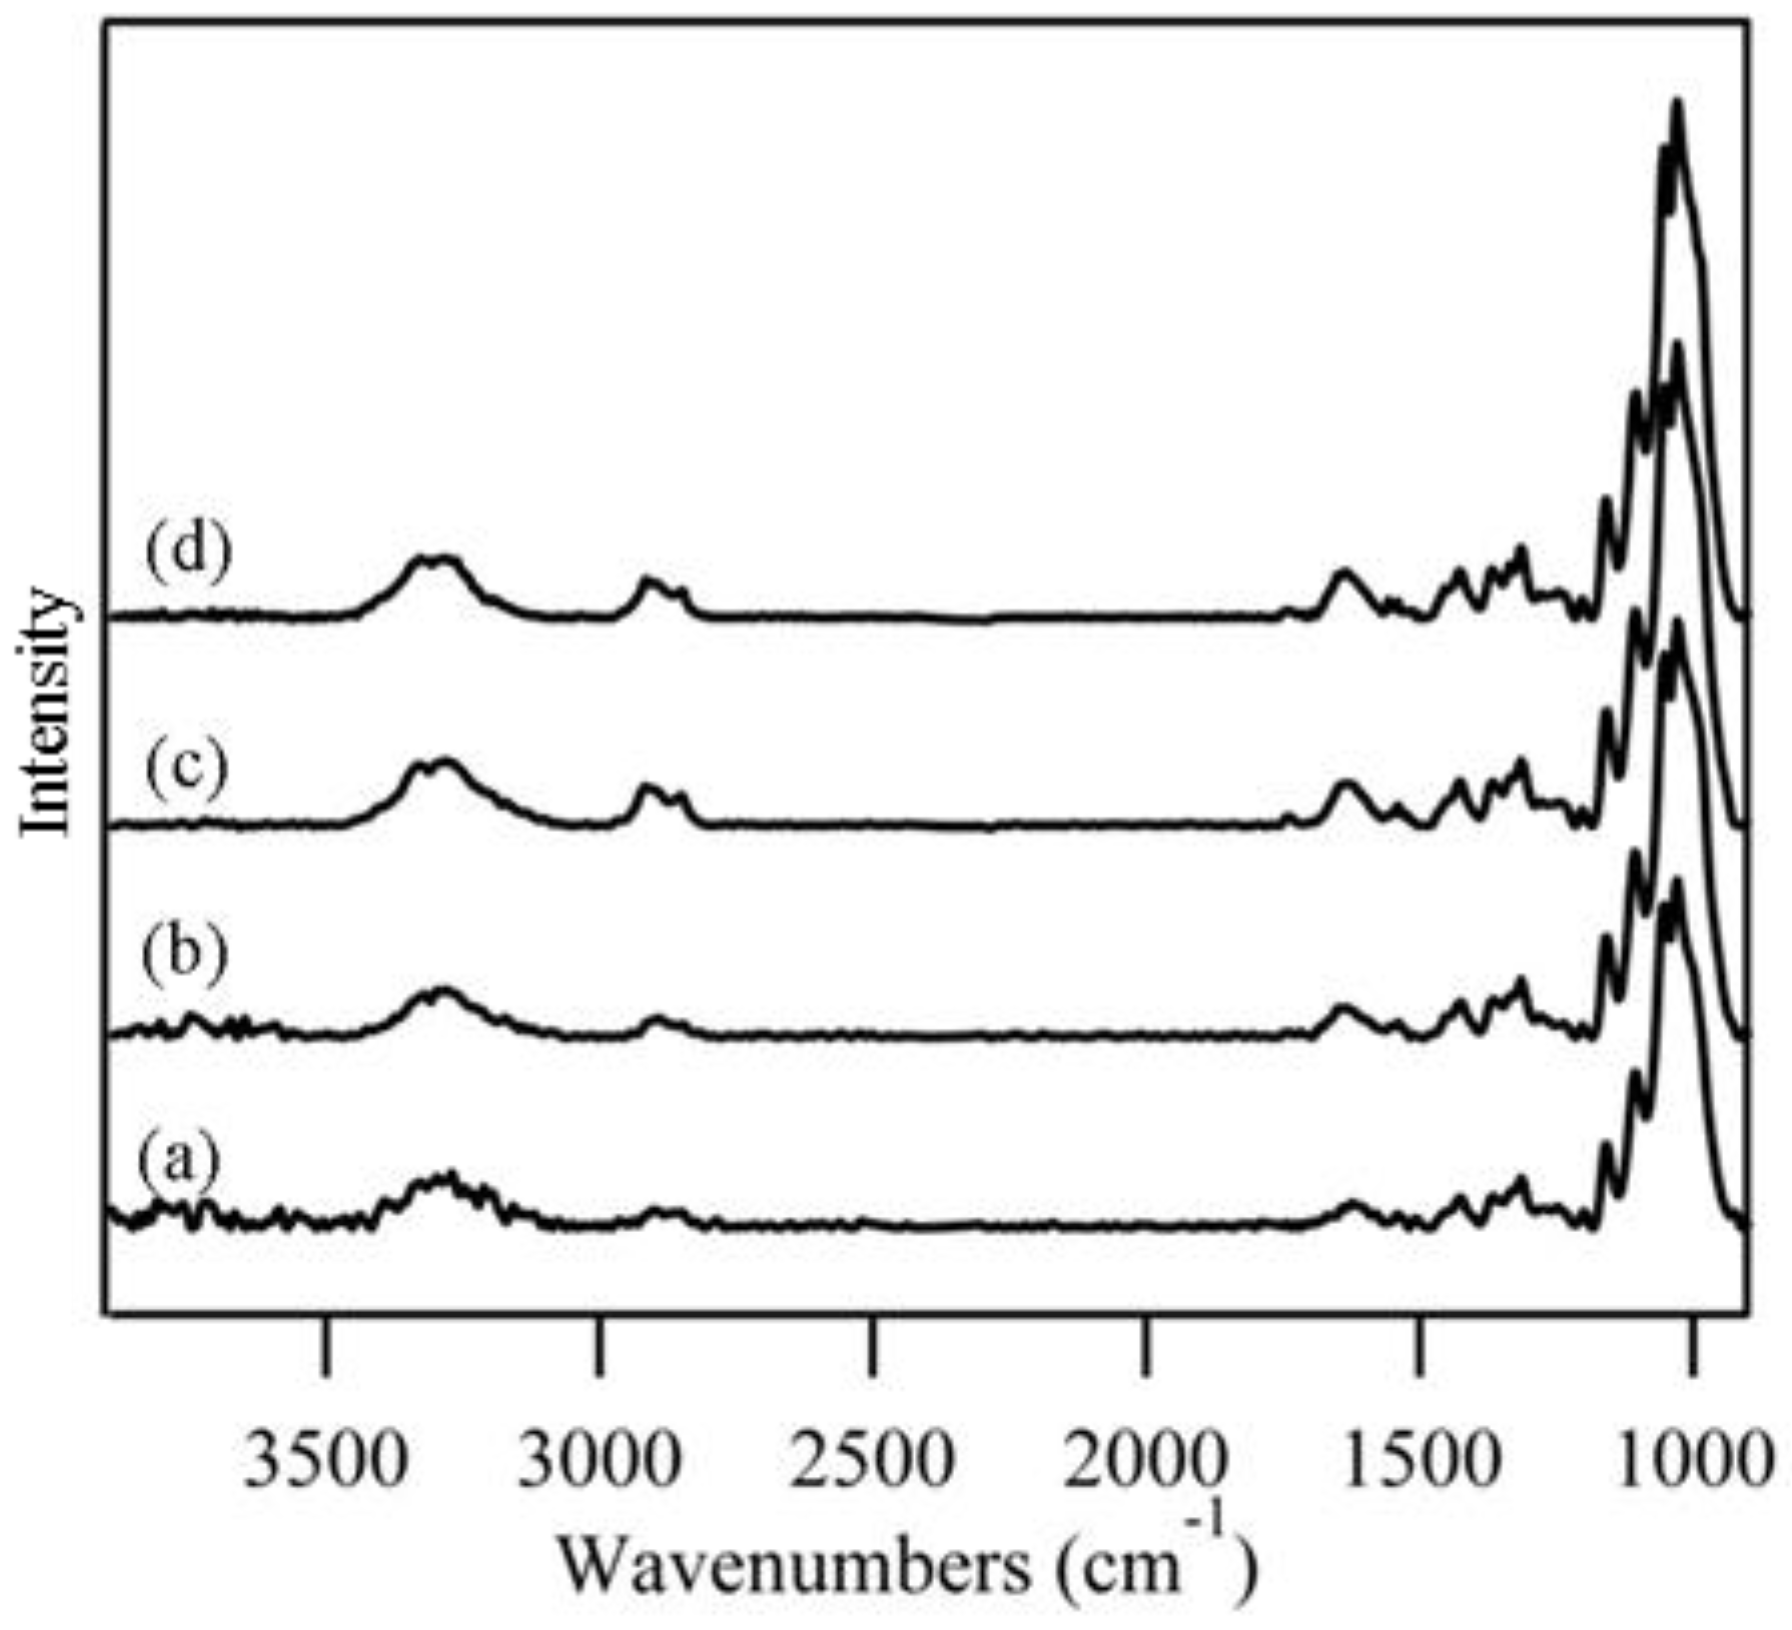
2.2. FTIR Examination

Cotton fiber bundles were examined with an IMAC macro sampling chamber (Bruker Optics, Billerica, MA, USA) equipped with a Mid-IR focal-plane array (FPA) detector and a FastIR single reflection ATR unit (Harrick Scientific Products, Pleasantville, NY, USA; Figure S1). The macro chamber and ATR unit were used as provided by the manufacturers. Small bundles (~500 mg) of the fiber samples were combed and placed atop the ATR crystal. Each cotton bundle was secured with a metal clamp and metal plate in a manner that assured consistent pressure for all samples. All FTIR data was collected in reflectance mode. Unless noted differently, samples were examined with 128 scans with a resolution of 8 cm−1 (3800 cm−1–900 cm−1). Spectra were corrected against an air background. Spectra for each sample were corrected for atmospheric CO2 and baseline-corrected using the OPUS 3D spectroscopy software (version 6.5) (Bruker Optics, Billerica, MA, USA). Under these conditions, examination of the 15 mm × 15 mm sampling window was completed in about 10 min under these settings, each examination produced a total of 16,834 spectra (128 pixels × 128 pixels). Pixel grouping (co-addition of adjacent pixels) was performed, 2 × 2, 4 × 4, 8 × 8, or 16 × 16, as indicated. Except when otherwise noted, spectra are the average of eight distinct fiber bundle areas within a sample. Sampling points were selected in areas that showed high intensity for cotton spectral bands. Spectra were plotted with IGOR Pro (version 6.2, Wavemetrics, Portland, OR, USA). IR bands assignments are taken from previous studies [26,29,30].
Single-point IR studies were performed with a Vertex 70 (Bruker Optics) equipped with an ATR sampling accessory (Pike Technologies, Madison, WI, USA). Cotton samples were placed on top of the ATR crystal (1.5 mm in diameter) and secured with a metal clamp. A total of 128 scans were measured for each sample point with a resolution of 8 cm1 (3800 cm−1–900 cm1). Spectra are presented without ATR correction.

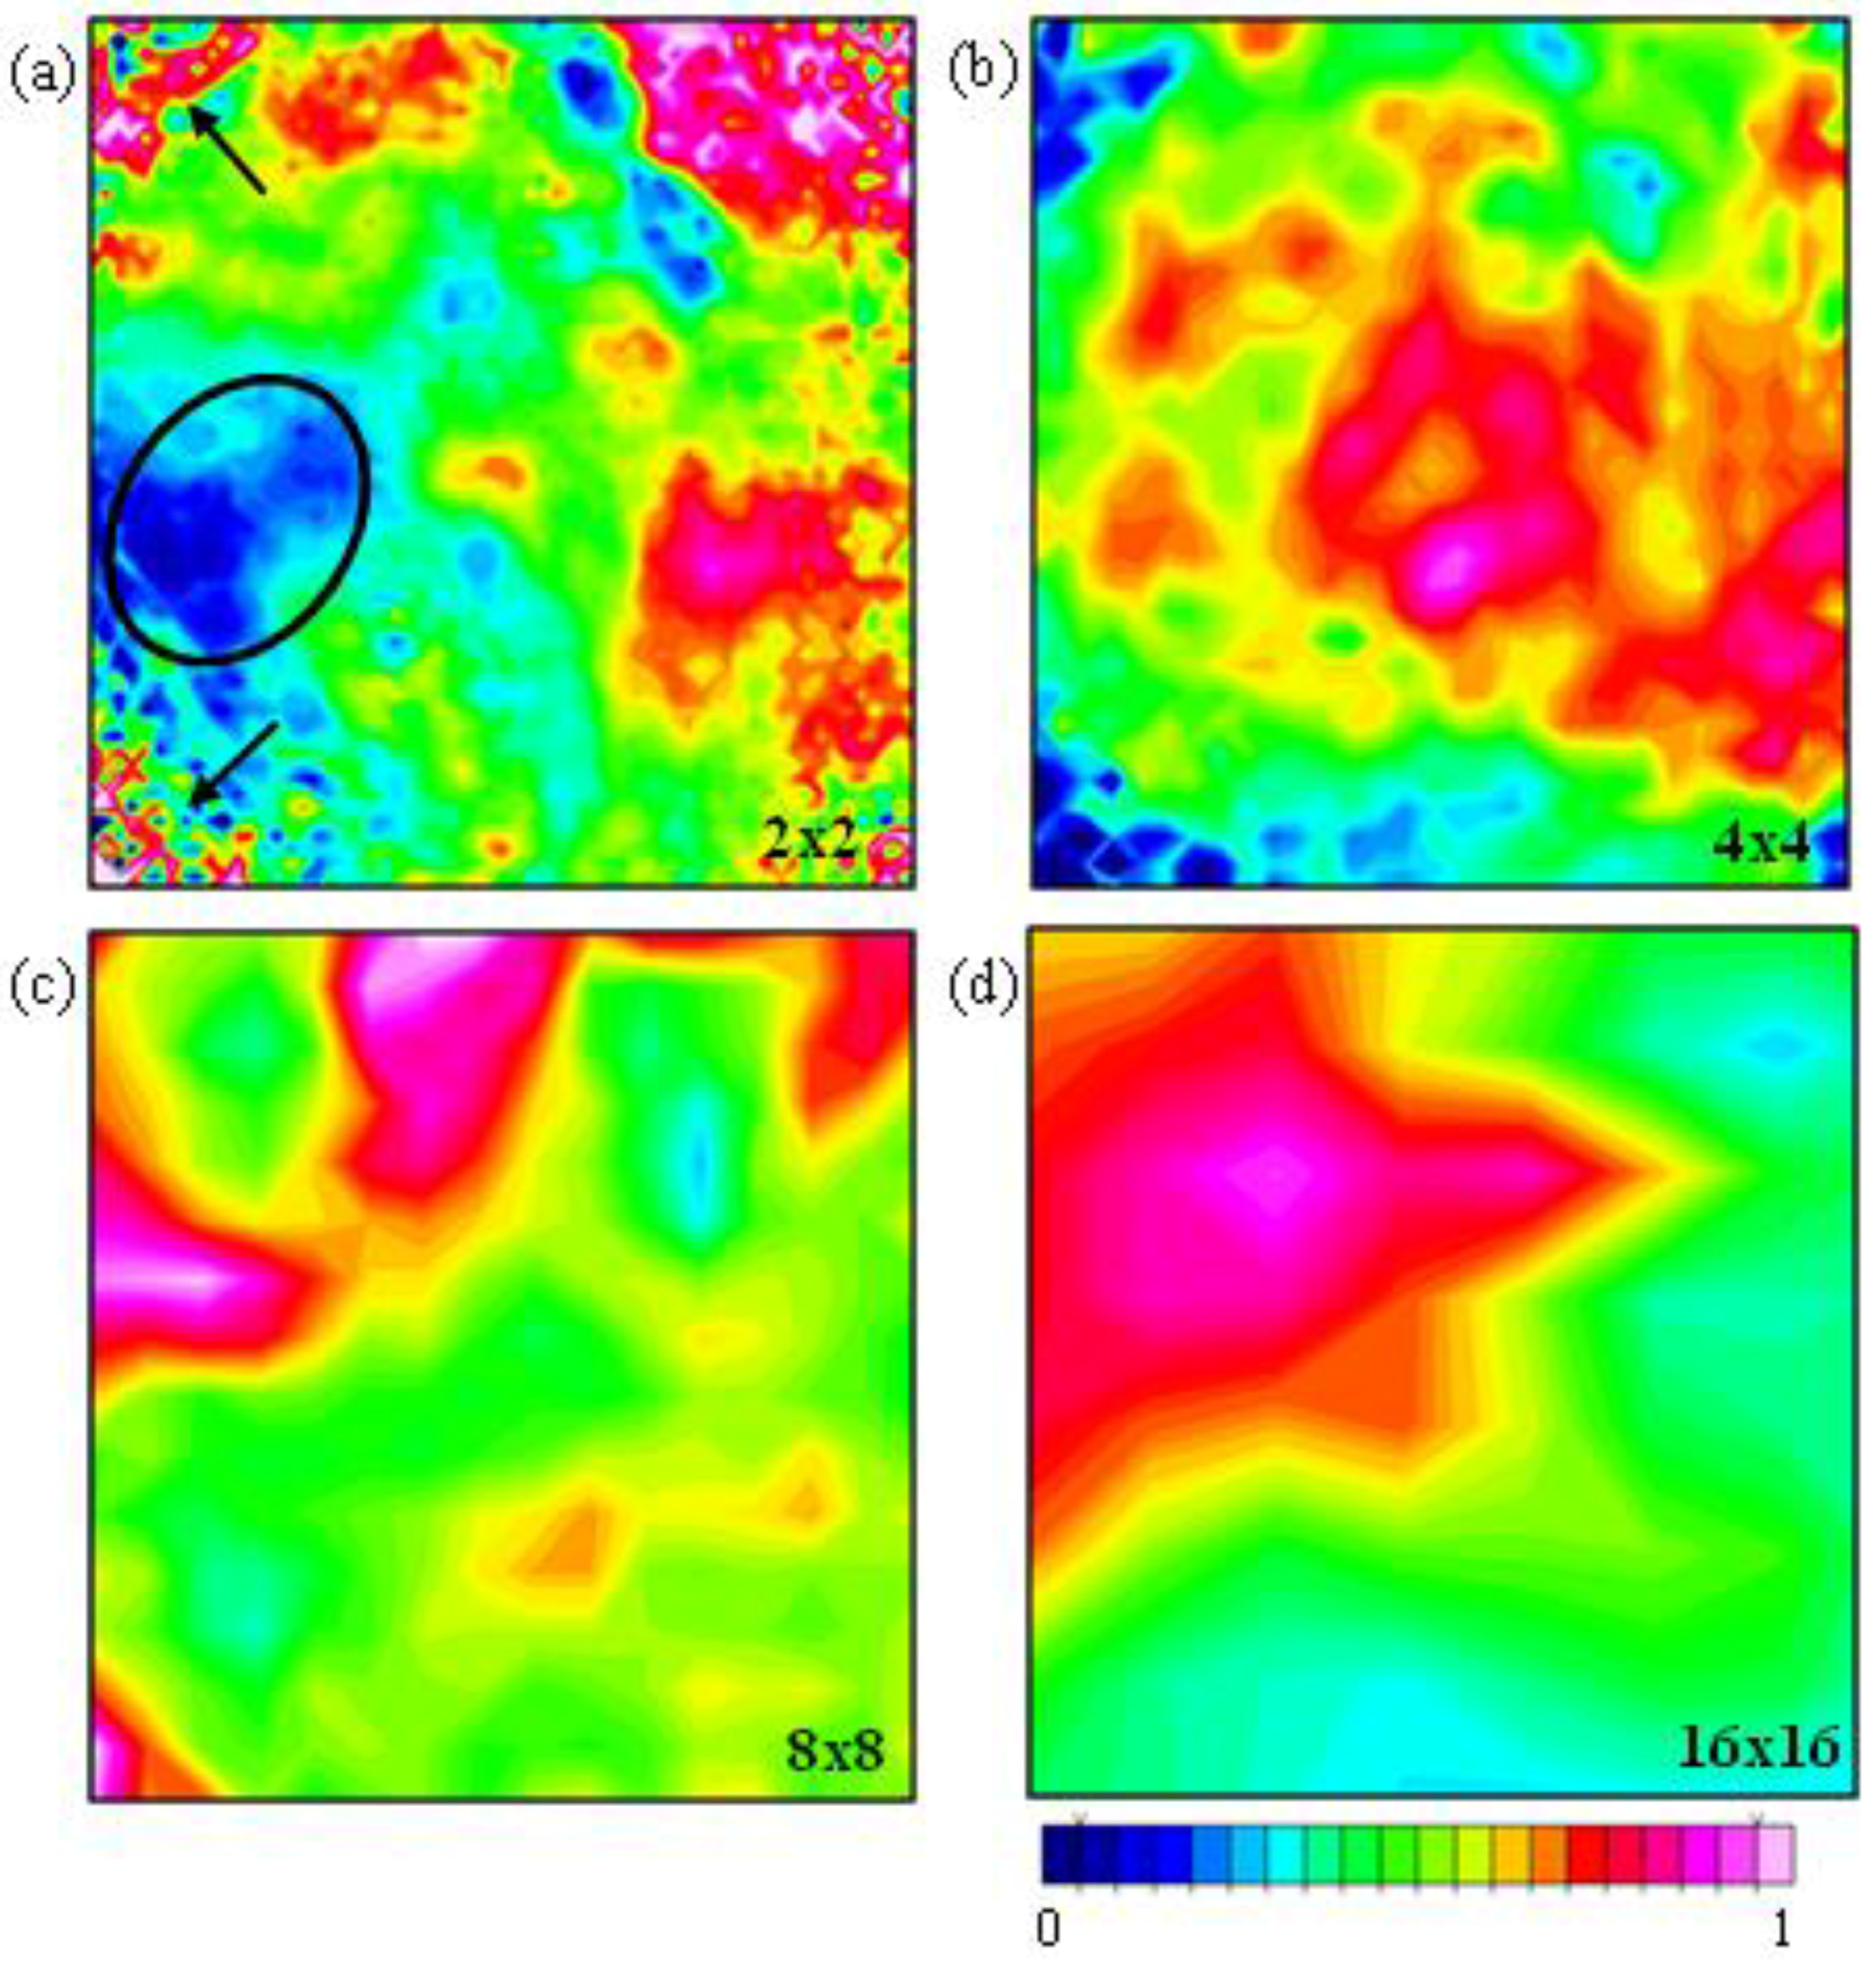
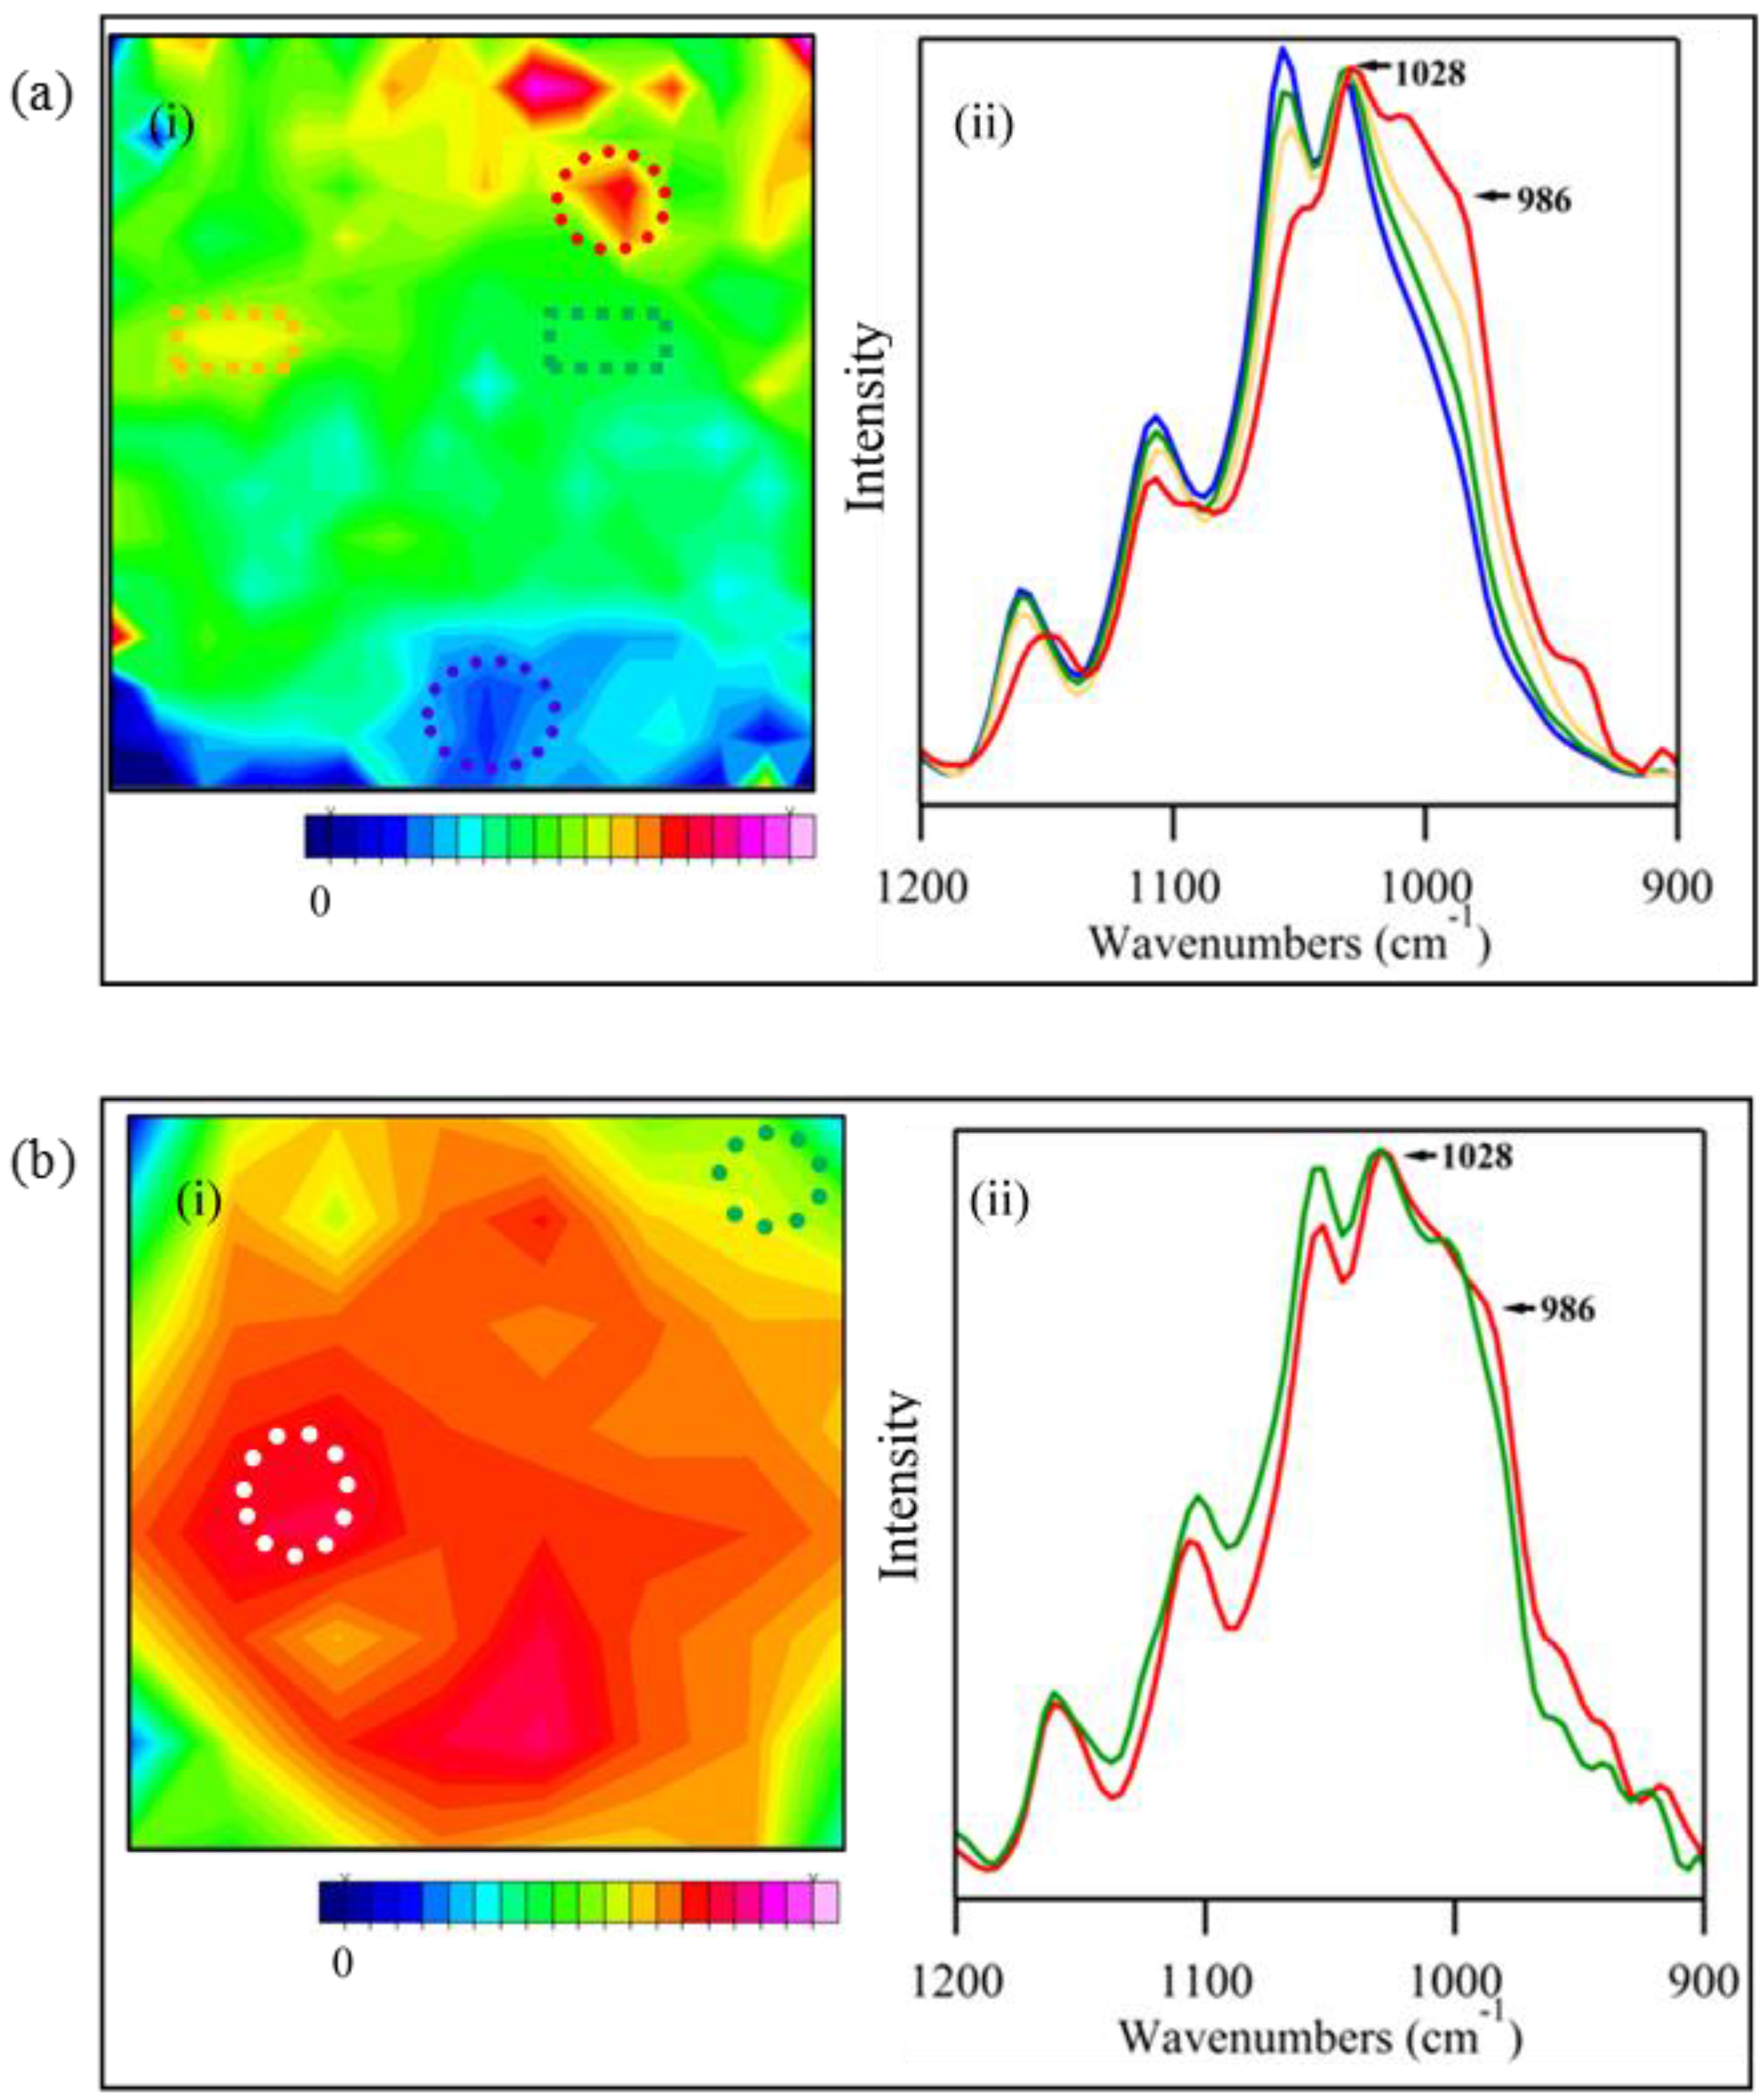
2.3. Chemical Imaging

Three-dimensional data analysis was performed with the 3D function of the OPUS software package (Bruker Optics, Billerica, MA, USA). Spectral bands were integrated using the measurement function in OPUS. Grouping of spectral data was performed as indicated. The default integration method was used. Unless otherwise noted, chemical images are presented scaled to the highest observed integration. These points correspond to the red and pink tones observed in the chemical distribution maps while blue tones correspond to integrations at or below zero.

2.4. Fiber Analysis

The hand harvested/hand ginned fibers were analyzed at the Southern Regional Research Center. Cotton bundles were analyzed on the advanced fiber information system 2 (AFIS 2) (Uster Technologies AG, Uster, Switzerland). This is a fully automated instrument, based on single fiber testing. A sample in sliver form is fed into the fiber individualizer, which separates the matrix into individual entities composed of fibers, neps, trash, and dust. The 22 DPA cotton samples were analyzed using 0.1 g slivers due to limited sample size [31]. All the other cotton slivers were 0.5 g, 30 cm long of randomly selected fibers with five replicates of each being analyzed.

3. Results

Figure 1a shows FTIR spectra of a mature cotton fiber bundle obtained with a single reflectance ATR accessory and a FPA detector. All spectra shown in Figure 1a were collected simultaneously. While the individual spectra show the prominent C–O bending peaks (1185 cm−1–950 cm−1) [26,29,30], the features show great distortion when compared to a routine spectrum collected with a benchtop ATR accessory (Figure 1b). The band distortion is especially heightened for the OH region (3600–3000 cm−1), the CH region (3000–2700 cm−1), and part of the fingerprint region that typically showcases O–H and C–H bending modes (1500 and 1150 cm−1, respectively) [26,29,30]. A chemical image (infrared distribution map) of a cotton bundle is shown in Figure 2. This image represents the integration of the C–O bands (1185–950 cm−1) in each of the 16,384 pixels examined with the ATR and FPA detector (individual spectra from five of these pixels are shown in Figure 1a). The chemical image shows few sample areas with high integrations (red tones). In addition, the integrations show high variability, with areas of high intensity bordering many areas with low integrations (blue tones). Since integrations are not normalized, some of this variability could arise from pixel sensitivity (detector-based sensitivity).
However, close inspection of the individual spectra indicates spectral noise as the main source of the variability (arrows in Figure 2). Increasing the number of scans (to 640) did not significantly improve the appearance of the cotton spectra or the chemical images (data not shown). Significantly longer scanning times were not attempted, since these would be time-prohibitive. We also note that the initial experimental parameters produced defined spectra and even-toned chemical images for a different cellulose-based material (Figure S2).

3.1. Grouping of Spectral Data

Spectral data aggregation was explored as a means of reducing the effects of cotton spectral noise and to simplify analysis. A progression of cotton bundle spectra obtained by grouping spectral data into defined areas of 2 × 2, 4 × 4, 8 × 8, and 16 × 16 pixel sets is shown in Figure 3. A moderate improvement is observed in the spectra grouped into 2 × 2 and 4 × 4 pixel sets (Figure 3a,b, respectively), particularly in the O–H and C–H bending region seen between 1500 and 1150 cm−1. Nevertheless, the O–H and C–H stretches are still overshadowed by spectral noise. Spectra grouped into 8 × 8 and 16 × 16 sets show defined cotton spectral bands with reduced spectral noise (Figure 3c,d, respectively). In both cases, the C–H stretches are clearly visible (3000–2700 cm−1), along with the C–O bands (1185–950 cm−1) and the various bending modes (1500 and 1150 cm−1). Indeed, comparison to a normalized ATR spectrum obtained with a benchtop instrument reveals the O–H stretching region (3600–3000 cm−1) as the only section with reduced intensity and significant noise (Figure S2). All other bands, including the C–H stretch region, show great similarity in shape and relative intensity. We note that O–H band distortion is not unprecedented; a previous study of cotton fibers with the FPA detector and an FTIR microscope presented similar O–H band distortions that seemed to be associated to cotton fiber thickness and light scattering [26].
Data grouping also improves the appearance of the cotton bundles distribution maps (progression shown in Figure 4). As before, these chemical images illustrate the integration of the C–O bands (1185–950 cm−1) in each pixel set without normalization. The chemical image corresponding to the 2 × 2 data grouping (Figure 4a) shows a more uniform image when compared to the one shown in Figure 2. Most areas in the chemical image show medium (green tones) to high integrations (red tones) for the C–O bands (1185–950 cm−1). Still, some variability and noise is observed near the sampling area corners, and an area of low intensity (deep blue tone, circled) is observed in the left center of the chemical image. Since the ATR sample crystal is evenly covered with the cotton sample during each examination, large areas of low integration suggest the presence of noise and scattering effects that overshadow the cotton spectra. A spectrum extracted from the blue areas shown in Figure 5a supports this assumption (Figure S3). The extracted spectrum shows some of the cotton bands in the fingerprint region; however, these seem to be concealed by an uneven baseline (1500–900 cm−1). The chemical image from the 4 × 4 grouping also exhibits blue tones and spectral noise near the edges of the chemical images, but, overall, the image shows a more uniform distribution with a majority of green and red tones (Figure 4b). Grouping of spectra into 8 × 8 and 16 × 16 data sets further improves the uniform appearance of the chemical images (Figure 4c,d). Few areas in both images result in low integrations or in spectra with significant noise or artifacts. Grouping of data pixels also results in chemical images with reduced spatial resolution. Still, even the 16 × 16 examinations provide 64 distinct sampling points that can provide information on the composition and distribution of a sample (see below). In comparison, a common benchtop FTIR unit with an ATR attachment can only examine one sample area at a time. Our results imply that sampling of cotton fiber bundles with the ATR accessory and FPA detector is best accomplished with an 8 × 8 or 16 × 16 grouping of data pixels. These experimental settings show reduced spectral noise while also maintaining moderate spatial resolution.

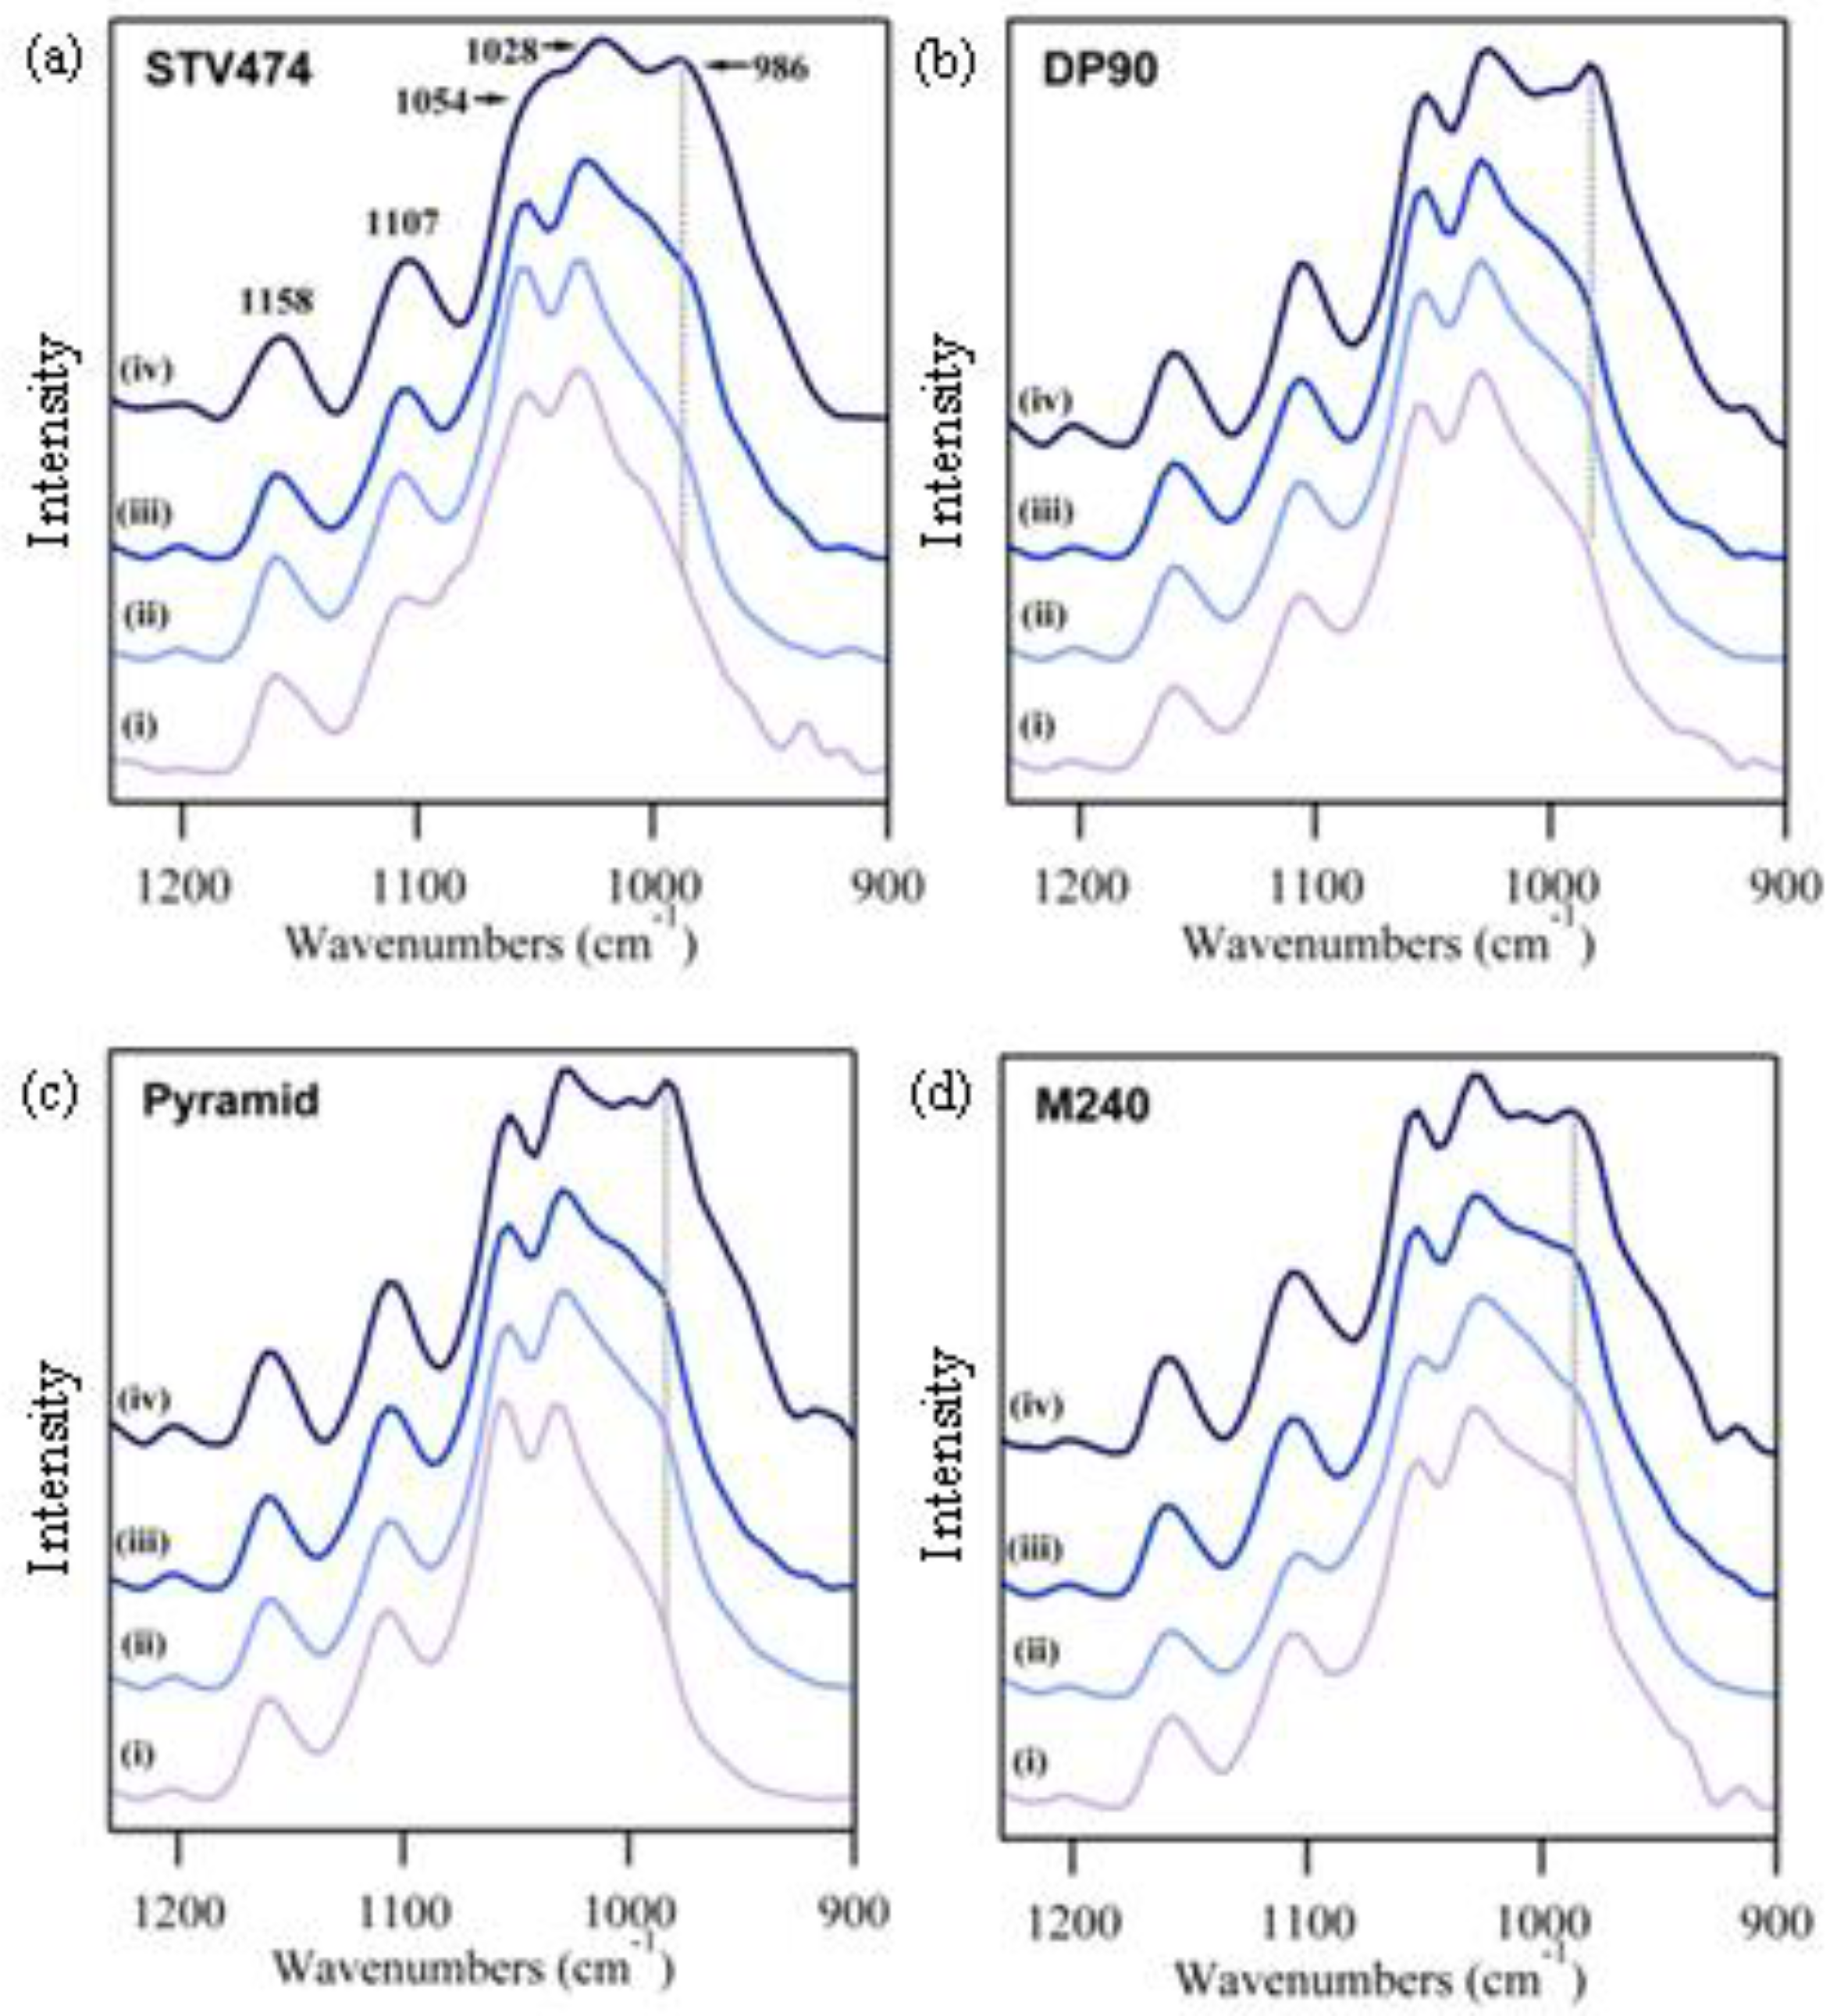
3.2. Examination of Cotton Fiber Development

We investigated if the single reflectance ATR accessory and a FPA detector system could be used to monitor changes in the composition of developing cotton fibers. For this study, we concentrated on changes to the C–O bending region (1185–950 cm−1) during secondary cell wall development [26]. Figure 5 shows the FTIR ATR spectra for four varieties of cotton, each harvested at 18, 20, 22, and 60+ DPA. These time points were selected since they coincide with significant cell wall development [30,32], which was confirmed by AFIS 2 data (Table 1). We note that these maturity ratio (MR) values serve only for guidance, since the AFIS 2 exhibits bias against low maturity cotton [32]. Hence, values for the 22 DPA samples might be overestimated. Prominent peaks in the C–O bending region include peaks centered at 1107, 1054, and 1028 cm−1. Additionally, a shoulder band is observed near 986 cm−1 for all four varieties. The 986 cm−1 has been previously described as an unspecified cellulose C–O vibration [7]. A peak inflection near 1006 cm−1 is also observed for the mature sample in three of the varieties (DP90, Pyramid and M240). While small discrepancies are observed, all varieties display an intense 1028 cm−1 peak at every developmental point (Figure 5a–d). The 1028 cm−1 peak has been previously described as a cellulose C6–O6–H vibration [26,29]. In contrast to the 1028 cm−1 peak, the shoulder band near 986 cm−1 increases in relative intensity as the development of the cotton increases. The relative intensity of the 986 cm−1 differs among the undeveloped (18 DPA) cotton fibers, with the Pyramid sample (Figure 5ci) appearing to have the lowest intensity, and the M240 sample the highest (Figure 5di). Still, the intensity of the 986 cm−1 for the undeveloped fiber bundles at 18 DPA does not predict the intensity observed in the fully developed sample. For example, the relative intensity of the 986 cm−1 peak in the fully grown Pyramid bundle sample (Figure 5civ) is higher than the one observed for the M240 bundle (Figure 5div). The progression of these two bands suggests that the ATR-FPA technique presented herein can be used to monitor cell wall development in cotton fiber bundles.

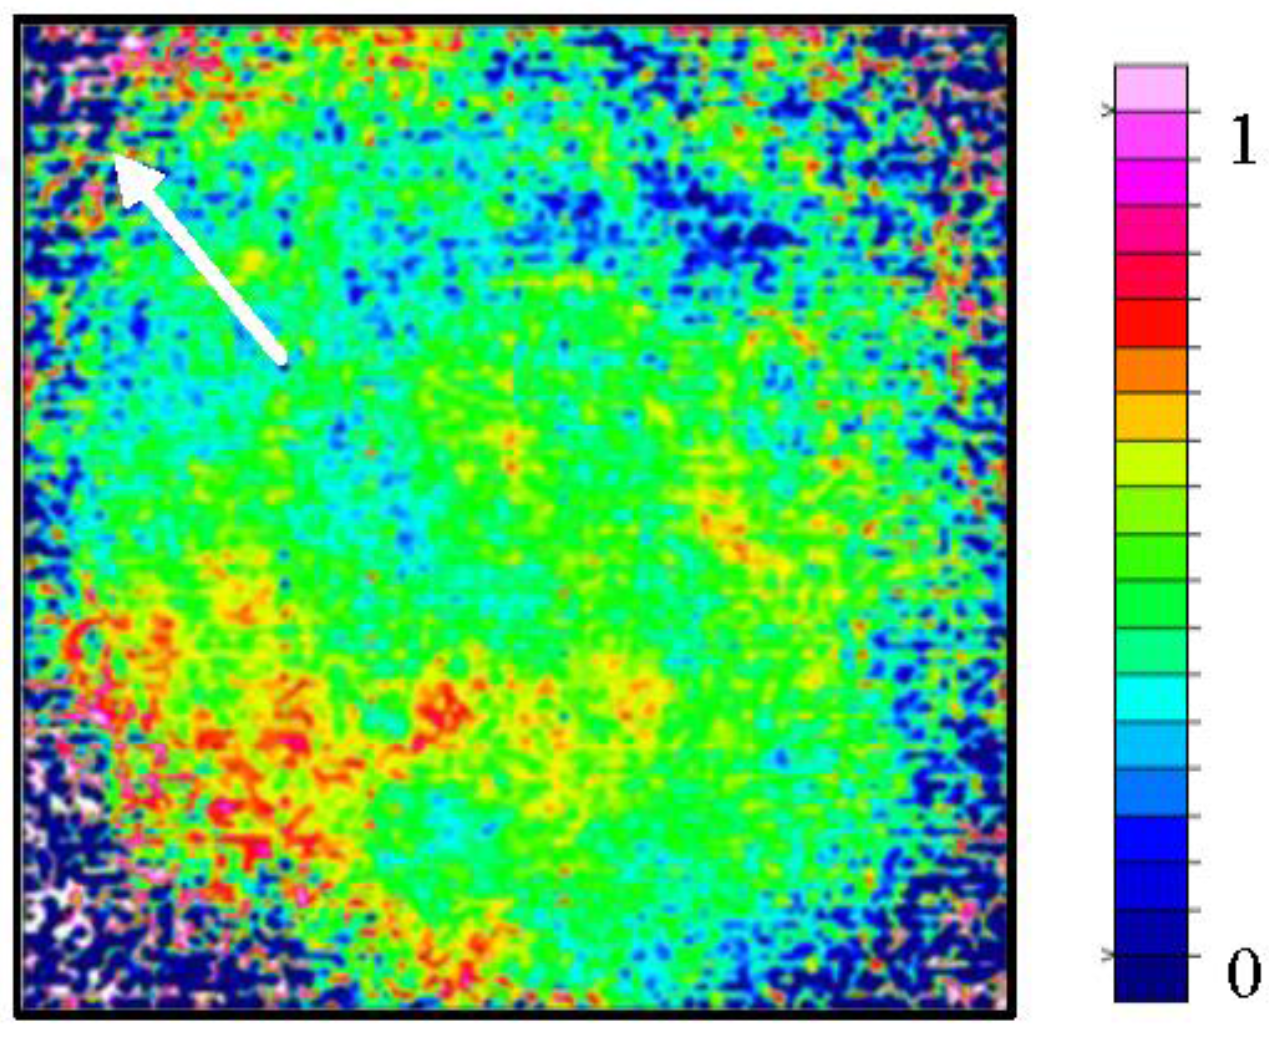
3.3. Examination of Sample Distribution

FTIR ATR-FPA chemical distribution maps reveal the heterogeneous composition of cotton fiber bundles. Chemical images were created to visualize cotton sample distribution (Figure 6). In preparing these images, spectral data from each of the grouped pixels were normalized to the dominant C–O peak at 1028 cm−1. The normalized pixels were then integrated to the shoulder band centered at 986 cm−1, thus, the chemical images in Figure 6 serve to visualize the level of cell wall development in the examined fiber bundle. We note that previous chemical images presented herein (Figure 2 and Figure 4) served to compare integrations between grouped pixels in a given chemical image. In contrast, spectral normalization facilitates comparison of specific band intensity to the 1028 cm−1 peak at each pixel, that is, the comparison is localized.
Figure 6a shows the normalized chemical image of a 20 DPA cotton bundle (STV 474). The image shows mostly green tones, which correspond to integrations with moderate—low intensity for the 986 cm−1 shoulder band (Figure 6ai). Three other tones are observed: an area with yellow (moderate high) integrations and two small areas with red (high integrations) and blue (low integrations). Figure 6aii presents infrared cotton bundle spectra from the indicated data groups in the chemical image. As expected, there is a progression in the intensity of the 986 cm−1 that parallels the intensity in the chemical image. The spectrum from the blue region of the image shows the least intense shoulder band, and the spectra from the green to yellow to red areas show increasing shoulder band intensity. Since the majority of the chemical image is shaded green, it is not surprising that the representative spectrum from the green region shown in Figure 6aii displays great similarity to the average spectrum presented for the 20 DPA STV474 bundle shown in Figure 5aii. A normalized chemical image of a 22 DPA STV474 cotton bundle shows a more uniform composition (Figure 6bi). While there are minor changes in the composition, the majority of the chemical image represents bundle sections that show a moderately high integration for the 986 cm−1 shoulder band. There are, however, some sections that show green and yellow integrations, indicative of less developed cotton fibers. The spectral difference between the green and red section is small, but perceptible in Figure 6bii. Noticeably, the rapid change in 986 cm−1 shoulder band intensity observed between the 20 and 22 DPA chemical images coincides with the change observed in Figure 5aii, aiii. Additional chemical images for the 18 DPA and mature fiber bundle sample are shown in Figure S4. Our results confirm that normalized chemical images for cotton bundles can be used to visually monitor cell wall development and to depict the diversity of sample composition.

4. Conclusions

An FTIR instrument equipped with a single reflection ATR accessory and FPA detector can be used to create chemical images of cotton fiber bundles. Previous IR imaging studies that examined large numbers of cotton fibers relied either on point by point examinations or on FTIR spectra with low sensitivity (low signal-to-noise ratio). In this study, FTIR spectra and chemical images with improved sensitivity were acquired by the grouping of multiple adjacent pixels in the detector array. The single reflectance FPA technique was employed to examine cotton fibers undergoing secondary cell wall development, and to visualize the distribution of this developmental process in a cotton fiber bundle. Observed changes to the C–O bending region, matched previous FTIR studies of developing cotton fibers. These examinations were quick (~10 min), produced a sampling distribution, required little in the way of sample size (~500 mg), and were not destructive to the cotton samples. While preliminary, our results point to the use of IR chemical imaging as a tool in the examination of cotton fiber bundles.

Disclaimer

Mention of a product does not constitute a warranty by the U.S. Department of Agriculture and does not imply its approval to the exclusion of other products that may also be suitable.

Supplementary Materials

The following are available online at www.mdpi.com/2079-6439/4/4/27/s1.

Acknowledgments

The authors thank H.N. Cheng and Chris Mattison for their suggestions on the manuscript.

Author Contributions

Michael Santiago Cintrón performed all FT-IR experiments and interpreted the results. Doug J. Hinchliffe, Gregory N. Thyssen, Linghe Zeng, and Crista Madison designed the cotton cultivation program. In addition, they cultivated, harvested, ginned, and prepared all cotton samples used in the study. Joseph G. Montalvo and Terri von Hoven performed all fiber quality measurements and interpreted their results. Michael Santiago Cintrón, James E. Rodgers, Doug J. Hinchliffe, Joseph G. Montalvo, and Terri von Hoven conceived significant parts of the research, and wrote portions of the manuscript.

Conflicts of Interest

The authors declare no conflict of interest.

References

  1. Agricultural-Marketing-Service. The Classification of Cotton; United States Department of Agriculture: Washington, DC, USA, 1995.
  2. Wakelyn, P.J.; Bertoniere, N.R.; French, A.D.; Thibodeaux, D.P.; Triplett, B.A.; Rouselle, M.-A.; Goynes, W.R.; Edwards, J.V.; Hunter, L.; McAllister, D.D.; et al. Cotton Fiber Chemistry and Technology; CRC Press: New York, NY, USA, 2007. [Google Scholar]
  3. McCreight, D.J.; Feil, R.W.; Booterbaugh, J.H.; Backe, E.E. Test instruments and quality assurance methods. In Short Staple Yarn Manufacturing; Carolina Academic Press: Durham, NC, USA, 1997; pp. 439–480. [Google Scholar]
  4. Naylor, G.R.; Delhom, C.D.; Cui, X.; Gourlot, J.-P.; Rodgers, J. Understanding the influence of fiber length on the high volume instrument™ measurement of cotton fiber strength. Text. Res. J. 2014, 84, 979–988. [Google Scholar] [CrossRef]
  5. Turhan, Y.; Toprakci, O. Comparison of high-volume instrument and advanced fiber information systems based on prediction performance of yarn properties using a radial basis function neural network. Text. Res. J. 2012, 83, 130–147. [Google Scholar] [CrossRef]
  6. Drieling, A.; Gourlot, J.-P. Cotton/worldwide harmonisation. In Industrial Applications of Natural Fibres: Structure, Properties and Technical Applications; Müssig, J., Ed.; Wiley: Hoboken, NJ, USA, 2010; pp. 353–370. [Google Scholar]
  7. Liu, Y.; Thibodeaux, D.; Gamble, G. Development of fourier transform infrared spectroscopy in direct, non-destructive, and rapid determination of cotton fiber maturity. Text. Res. J. 2011, 81, 1559–1567. [Google Scholar]
  8. Montalvo, J.; VonHoven, T. Analysis of cotton. In Near-Infrared Spectroscopy in Agriculture; Roberts, C.A., Workman, J., Reeves, J.B., Eds.; American Society of Agronomy, Agronomy Monograph: Madison, WI, USA, 2004; Volume N0. 44, pp. 671–728. [Google Scholar]
  9. Rodgers, J.; Montalvo, J.; Davidonis, G.; VonHoven, T. Near infrared measurement of cotton fiber micronaire, maturity and fineness-A comparative investigation. Text. Res. J. 2010, 80, 780–793. [Google Scholar] [CrossRef]
  10. Abidi, N.; Cabrales, L.; Hequet, E. Fourier transform infrared spectroscopic approach to the study of the secondary cell wall development in cotton fiber. Cellulose 2010, 17, 309–320. [Google Scholar] [CrossRef]
  11. Abidi, N.; Hequet, E.; Cabrales, L. Applications of fourier transform infrared spectroscopy to study cotton fibers. In Fourier Transforms-New Analytical Approaches and Ftir Strategies; Nikolic, G., Ed.; InTech: Cairo, Egypt, 2011. [Google Scholar]
  12. Abidi, N.; Hequet, E.; Cabrales, L.; Gannaway, J.; Wilkins, T.; Wells, L.W. Evaluating cell wall structure and composition of developing cotton fibers using fourier transform infrared spectroscopy and thermogravimetric analysis. J. Appl. Polym. Sci. 2008, 107, 476–486. [Google Scholar] [CrossRef]
  13. Fahrenfort, J. Attenuated total reflection. Spectrochim. Acta Mol. Biomol. Spectrosc. 1989, 45, 251–263. [Google Scholar] [CrossRef]
  14. Oberg, K.A.; Fink, A.L. A new attenuated total reflectance fourier transform infrared spectroscopy method for the study of proteins in solution. Anal. Biochem. 1998, 256, 92–106. [Google Scholar] [CrossRef] [PubMed]
  15. Hind, A.R.; Bhargava, S.K.; McKinnon, A. At the solid/liquid interface: FTIR/ATR-The tool of choice. Adv. Colloid Interface Sci. 2001, 93, 91–114. [Google Scholar] [CrossRef]
  16. Offermann, V.; Grosse, P.; Feuerbacher, M.; Dittmar, G. Experimental aspects of attenuated total reflectance spectroscopy in the infrared. Vib. Spectrosc. 1995, 8, 135–140. [Google Scholar] [CrossRef]
  17. Fortier, C.A.; Rodgers, J.E.; Cintrón, M.S.; Cui, X.; Foulk, J.A. Identification of cotton and cotton trash components by fourier transform near-infrared spectroscopy. Text. Res. J. 2011, 81, 230–238. [Google Scholar] [CrossRef]
  18. Mustafic, A.; Jiang, Y.; Li, C. Cotton contamination detection and classification using hyperspectral fluorescence imaging. Text. Res. J. 2016, 86, 1574–1584. [Google Scholar] [CrossRef]
  19. Lang, P.L.; Katon, J.E.; O’Keefe, J.F.; Schiering, D.W. The identification of fibers by infrared and raman microspectroscopy. Microchem. J. 1986, 34, 319–331. [Google Scholar] [CrossRef]
  20. Himmelsbach, D.S.; Khalili, S.; Akin, D.E. The use of FT-IR microspectroscopic mapping to study the effects of enzymatic retting of flax (Linum usitatissimum L) stems. J. Sci. Food. Agric. 2002, 82, 685–696. [Google Scholar] [CrossRef]
  21. McCann, M.C.; Hammouri, M.; Wilson, R.; Belton, P.; Roberts, K. Fourier transform infrared microspectroscopy is a new way to look at plant cell walls. Plant Physiol. 1992, 100, 1940–1947. [Google Scholar] [CrossRef] [PubMed]
  22. Tungol, M.W.; Bartick, E.G.; Montaser, A. The development of a spectral data base for the identification of fibers by infrared microscopy. Appl. Spectrosc. 1990, 44, 543–549. [Google Scholar] [CrossRef]
  23. Wang, Q.; Fan, X.; Gao, W.; Chen, J. Characterization of bioscoured cotton fabrics using FT-IR ATR spectroscopy and microscopy techniques. Carbohydr. Res. 2006, 341, 2170–2175. [Google Scholar] [CrossRef] [PubMed]
  24. Tungol, M.W.; Bartick, E.G.; Montaser, A. Forensic examination of synthetic textile fibers by microscopic infrared spectrometry. In Practical Guide to Infrared Microspectroscopy; Humecki, H.J., Ed.; Marcel Dekker, Inc.: New York, NY, USA, 1995; pp. 245–286. [Google Scholar]
  25. Lewis, E.N.; Treado, P.J.; Reeder, R.C.; Story, G.M.; Dowrey, A.E.; Marcott, C.; Levin, I.W. Fourier transform spectroscopic imaging using an infrared focal-plane array detector. Anal. Chem. 1995, 67, 3377–3381. [Google Scholar] [CrossRef] [PubMed]
  26. Cintrón, M.S.; Fortier, C.; Hinchliffe, D.J.; Rodgers, J.E. Chemical imaging of secondary cell wall development in cotton fibers using a mid-infrared focal-plane array detector. Text. Res. J. 2016. [Google Scholar] [CrossRef]
  27. Fortier, C.; Cintròn, M.S.; Rodgers, J. Fourier transform infrared macro-imaging of botanical cotton trash. AATCC J. Res. 2015, 2, 1–6. [Google Scholar] [CrossRef]
  28. De-Juan, A.; Piqueras, S.; Maeder, M.; Hancewicz, T.; Duponchel, L.; Tauler, R. Chemometric tools for image analysis. In Infrared and Raman Spectroscopic Imaging, 2nd ed.; Salzer, R., Siesler, H.W., Eds.; Wiley-VCH: Weinheim, Germany, 2014. [Google Scholar]
  29. Maréchal, Y.; Chanzy, H. The hydrogen bond network in Iβ cellulose as observed by infrared spectrometry. J. Mol. Struct. 2000, 523, 183–196. [Google Scholar] [CrossRef]
  30. Cintrón, M.S.; Hinchliffe, D. FT-IR examination of the development of secondary cell wall in cotton fibers. Fibers 2015, 3. [Google Scholar] [CrossRef]
  31. Hoven, T.V.; Montalvo, J.; Santiago, M.C.; Dowd, M.; Armijo, C.B.; Byler, R.K. Fundamental research on spiking, recovery and understanding seed coat nep counts in AFIS analysis of pre-opened cotton. Text. Res. J. 2016. [Google Scholar] [CrossRef]
  32. Kim, H.J.; Rodgers, J.; Delhom, C.; Cui, X. Comparisons of methods measuring fiber maturity and fineness of upland cotton fibers containing different degrees of fiber cell wall development. Text. Res. J. 2014, 84, 1622–1633. [Google Scholar] [CrossRef]
Figure 1. (a) Fourier transform infrared spectroscopy (FTIR) spectra of a cotton fiber bundle as determined with a single reflection attenuated total reflection (ATR) accessory and a focal-plane array (FPA) Mid-IR detector; (b) FTIR spectrum of the same cotton bundle as determined with a benchtop FTIR instrument equipped with a standard (multi-reflection) ATR accessory. FPA IR spectra are the average of eight sampling points and are shown shifted along the y-axis (normalized absorbance).
Fibers 04 00027 g001
Figure 2. Chemical image (IR distribution map) for a cotton fiber bundle as determined with a FTIR instrument equipped with a single reflection ATR accessory and a FPA Mid-IR detector. Map tones reflect the integration intensity of the C–O bending region (1185–950cm−1). Red and pink tones correspond to high intensity integrations, while dark blue color corresponds to integrations near zero.
Fibers 04 00027 g002
Figure 3. FTIR spectra of a cotton fiber bundle as determined with a single reflection ATR accessory and a FPA Mid-IR detector. Spectra were produced by grouping data into defined areas of (a) 2 × 2; (b) 4 × 4; (c) 8 × 8; and (d) 16 × 16 pixels. Spectra are the average of five sampling points, and are shown shifted along the y-axis (normalized absorbance).
Fibers 04 00027 g003
Figure 4. Chemical images (IR distribution maps) for cotton fiber bundles as determined with a FTIR instrument equipped with a single reflection ATR accessory and a FPA Mid-IR detector. Maps were produced by grouping spectral data into defined areas of (a) 2 × 2; (b) 4 × 4; (c) 8 × 8; and (d) 16 × 16 pixels. Map tones reflect the integration intensity of the C–O bending region (1185–950 cm−1). Integrations are not normalized. Red and pink tones correspond to high intensity integrations, while dark blue tones correspond to integrations near zero.
Fibers 04 00027 g004
Figure 5. FTIR spectra of the C–O stretching region for cotton fibers harvested at different developmental time points. Spectra were collected utilizing a single reflection ATR attachment and a FPA Mid-IR detector. Four varieties were examined: (a) STV474; (b) DP90; (c) Pyramid; and (d) M240. For each variety, four time points are shown: (i) 18 DPA; (ii) 20 DPA; (iii) 22 DPA; and (iv) mature fibers from open cotton bolls (~60 DPA). Spectra are shown shifted along the y-axis (normalized absorbance). A dashed line is shown crossing the region (1015 and 970 cm−1) that undergoes significant changes during cell wall development. Indicated numbers are in wavenumbers.
Fibers 04 00027 g005
Figure 6. Chemical image (IR distribution map) for a cotton fiber bundle, and FTIR spectra from the indicated sections of the map. Two developmental points are shown: (a) 20 DPA and (b) 24 DPA. (i) The chemical distribution map was produced with a FTIR instrument equipped with a single reflection ATR accessory and an FPA Mid-IR detector. Spectral data was grouped into defined 8 × 8 pixel areas and normalized to 1028 cm−1. Map tones reflect the integration intensity of the C–O shoulder band near 986 cm−1. Red and pink tones correspond to high intensity integrations, while dark blue color corresponds to integrations near zero; (ii) FTIR spectra extracted from the indicated sections of the corresponding chemical distribution map. Sections are color coordinated to the spectra shown in (ii); for clarity the red section (high intensity) in (bi) is shaded white.
Fibers 04 00027 g006
Table 1. Advanced fiber information system (AFIS 2) maturity ratio values for four cotton varieties. STDEV: standard deviation; CV: coefficient of variation.
STV474DP90M240Pyramid
22 DPA *Mature22 DPA *Mature22 DPA *Mature22 DPA *Mature
Mean0.7980.9420.8120.9580.8400.9680.8460.974
STDEV0.0150.0130.0080.0080.0140.0150.0150.021
CV1.8591.3841.0300.8731.6841.5321.7932.129
* Maturity ration (MR) values affected by the instrument being insensitive to values below a certain threshold.

