Article

Molecular Dynamics Modeling of the Effect of Axial and Transverse Compression on the Residual Tensile Properties of Ballistic Fiber

by
Sanjib C. Chowdhury
1,*,
Subramani Sockalingam
1,2,3 and
John W. Gillespie
1,4,5,6
1
Center for Composite Materials, University of Delaware, Newark, DE 19716, USA
2
SmartState Center for Multifunctional Materials and Structures, University of South Carolina, Columbia, SC 29201, USA
3
Department of Mechanical Engineering, University of South Carolina, Columbia, SC 29201, USA
4
Department of Materials Science and Engineering, University of Delaware, Newark, DE 19716, USA
5
Department of Civil and Environmental Engineering, University of Delaware, Newark, DE 19716, USA
6
Department of Mechanical Engineering, University of Delaware, Newark, DE 19716, USA
*
Author to whom correspondence should be addressed.
Fibers 2017, 5(1), 7; https://doi.org/10.3390/fib5010007
Submission received: 15 December 2016 / Revised: 3 February 2017 / Accepted: 8 February 2017 / Published: 14 February 2017
(This article belongs to the Special Issue Polymer Fibers)

Abstract

:
Ballistic impact induces multiaxial loading on Kevlar® and polyethylene fibers used in protective armor systems. The influence of multiaxial loading on fiber failure is not well understood. Experiments show reduction in the tensile strength of these fibers after axial and transverse compression. In this paper, we use molecular dynamics (MD) simulations to explain and develop a fundamental understanding of this experimental observation since the property reduction mechanism evolves from the atomistic level. An all-atom MD method is used where bonded and non-bonded atomic interactions are described through a state-of-the-art reactive force field. Monotonic tension simulations in three principal directions of the models are conducted to determine the anisotropic elastic and strength properties. Then the models are subjected to multi-axial loads—axial compression, followed by axial tension and transverse compression, followed by axial tension. MD simulation results indicate that pre-compression distorts the crystal structure, inducing preloading of the covalent bonds and resulting in lower tensile properties.

1. Introduction

High performance polymeric fibers such as Kevlar® and ultra-high molecular weight polyethylene (UHMWPE) are used in ballistic impact applications [1] due to their superior specific tensile stiffness and strength. The fiber is highly crystalline with a fibrillar structure. In Kevlar®, fibril diameter is in the range of 10 to 50 nm for Kevlar® KM2 [2] and the fibrils are connected through a network of hydrogen bonds and van der Waals and coulombic type non-bonded interactions. The foundational element of Kevlar® fiber is the crystalline lattice [3]. Based on X-ray diffraction studies, models of the Kevlar® crystalline structures have been proposed [4,5,6]. In the crystallites, chain segments are positioned into the unit cells according to the structure and morphology of the crystallites. In crystallographic terms, the lattice unit cell as shown in Figure 1 is the smallest entity that contains all the information required to construct a complete crystal. Figure 2 shows the orthorhombic p-phenylene terephthalamide (PPTA) crystal structure proposed by Northolt et al. [4,5] and Tashiro et al. [6]. This unit cell contains two molecular repeating units per crystal lattice, one at the center of the cell and four one-fourth units at each corner of the cell. This orthorhombic unit cell has dimensions a = 0.787 nm, b = 0.518 nm, and c = 1.29 nm [5,6]. In the YZ (bc) lattice plane, hydrogen bonds (dotted blue lines in Figure 3) form between the neighboring NH and CO end groups due to the close proximity of the chains. While in the XY (ab) plane, there are no hydrogen bonds between the chains. In the XY (ab) plane, inter-chain interactions are only non-bonded van der Waals (vdW) and coulombic interactions. In terms of bonding strength, vdW and coulombic interactions are weaker than hydrogen bond and hydrogen bonds are weaker than covalent bond that exist between different atoms in the chain. Therefore, from the mechanical point of view, the crystal is anisotropic. It is stronger in the Z (c) axis, weaker in the Y (b) axis, and weakest in the X (a) axis.
Figure 4 shows the crystalline lattice unit cell of polyethylene (PE). This orthorhombic unit cell has dimensions a = 0.74 nm, b = 0.493 nm, and c = 0.2534 nm [7]. Along the X and Y directions, chains interact with non-bonded van der Waals (vdW) interactions. Like Kevlar®, a structural hierarchy of sizes also exists in the UHMWPE fibers, with macro-fibrils consisting of bundles of micro-fibrils, which in turn are composed of bundles of nano-fibrils. Nano-fibrils consist of stacks of crystallites separated by thin non-crystalline plates, portions of which are spanned by inter-crystalline bridges giving a shish-kebab structure [8]. Studies show that the key morphological features of the structures of the UHMWPE fiber at different length scales depend on the process history [9].
Predicting fiber failure is a key to predict the ballistic impact performance of textile fabric armor systems. However, fiber failure within a yarn and a fabric during impact is a very complicated multiscale problem. Projectile-fiber contact induces multiaxial loading [10,11,12] on fibers that includes axial tension, axial compression (AC), transverse compression (TC), and transverse shear. Post-failure investigation of impacted fabrics indicates transverse permanent deformation (flattening) of fibers [13]. There is some evidence in the literature indicating the presence of bending of fibers [14] and compressive kink bands in polymer composites under ballistic impact [15]. In addition, fiber-level models predict flexural wave-induced curvature resulting in compressive kinking of fibers [11]. The UHMWPE Dyneema SK 76 fibers display a strain rate dependent modulus and strength behavior in high strain rate axial tension [16], whereas the longitudinal properties of Kevlar® KM2 fibers are insensitive to strain rates [17]. Under quasi-static transverse compression both Dyneema SK76 [18] and Kevlar® KM2 [19] exhibit nonlinear inelastic behavior. For a detailed literature survey on the experimental work of the materials used in this study the reader is referred to [1]. The effect of AC and TC deformation modes on the fiber tensile failure strength has not been studied extensively. There are few atomistic simulations studies [20,21,22,23,24,25] that focused on the elastic and strength properties of Kevlar® and PE crystal. Rutledge et al. [20] have determined the elastic properties of Kevlar® crystal through atomistic simulations. Grujicic et al. [21,22] studied the properties of Kevlar® filament using non-reactive force field COMPASS (Condensed-phase Optimized Molecular Potentials for Atomistic Simulation Studies) [26]. In one study [21], they investigated the effects of microstructural and topological defects such as chain ends, inorganic-solvent impurities, chain misalignments, and sheet stacking faults on the strength, ductility, and stiffness of PPTA filament. In another study [22], they investigated the effect of prior AC and torsion on the axial tensile properties of Kevlar® filament. They reported that the tensile properties were unchanged under small amounts of pre-compression (~5% strain). Recently, Yilmaz et al. [23] and Mercer et al. [24] have studied the anisotropic elastic and strength properties of Kevlar® crystal using reactive force field ReaxFF [27]. O’Connor et al. [25] have studied the effects of chain ends on the elastic and strength properties of PE crystal using a modified version of reactive force field AIREBO (Adaptive Intermolecular Reactive Empirical Bond Order) [28].
The goal of this paper is to gain insights into the effect of AC and TC on the residual tensile strength of Kevlar® KM2 and PE fiber. Experimental observations of individual single fiber quasi-static (QS) response due to AC and TC and the effect of AC and TC on tensile fiber failure are first summarized. An all-atom MD model of Kevlar® and PE is developed to better understand the experimental observations and the associated mechanisms at the atomistic-scale. The effect of AC and TC on the tensile response of the crystalline structure is studied with the MD model. Open source molecular dynamics code LAMMPS [29] is used for all molecular dynamics simulations and VMD (Visual Molecular Dynamics) [30] is used for model visualization. Reactive force field ReaxFF [27] is used for Kevlar® modeling and AIREBO [28] is used for PE modeling.

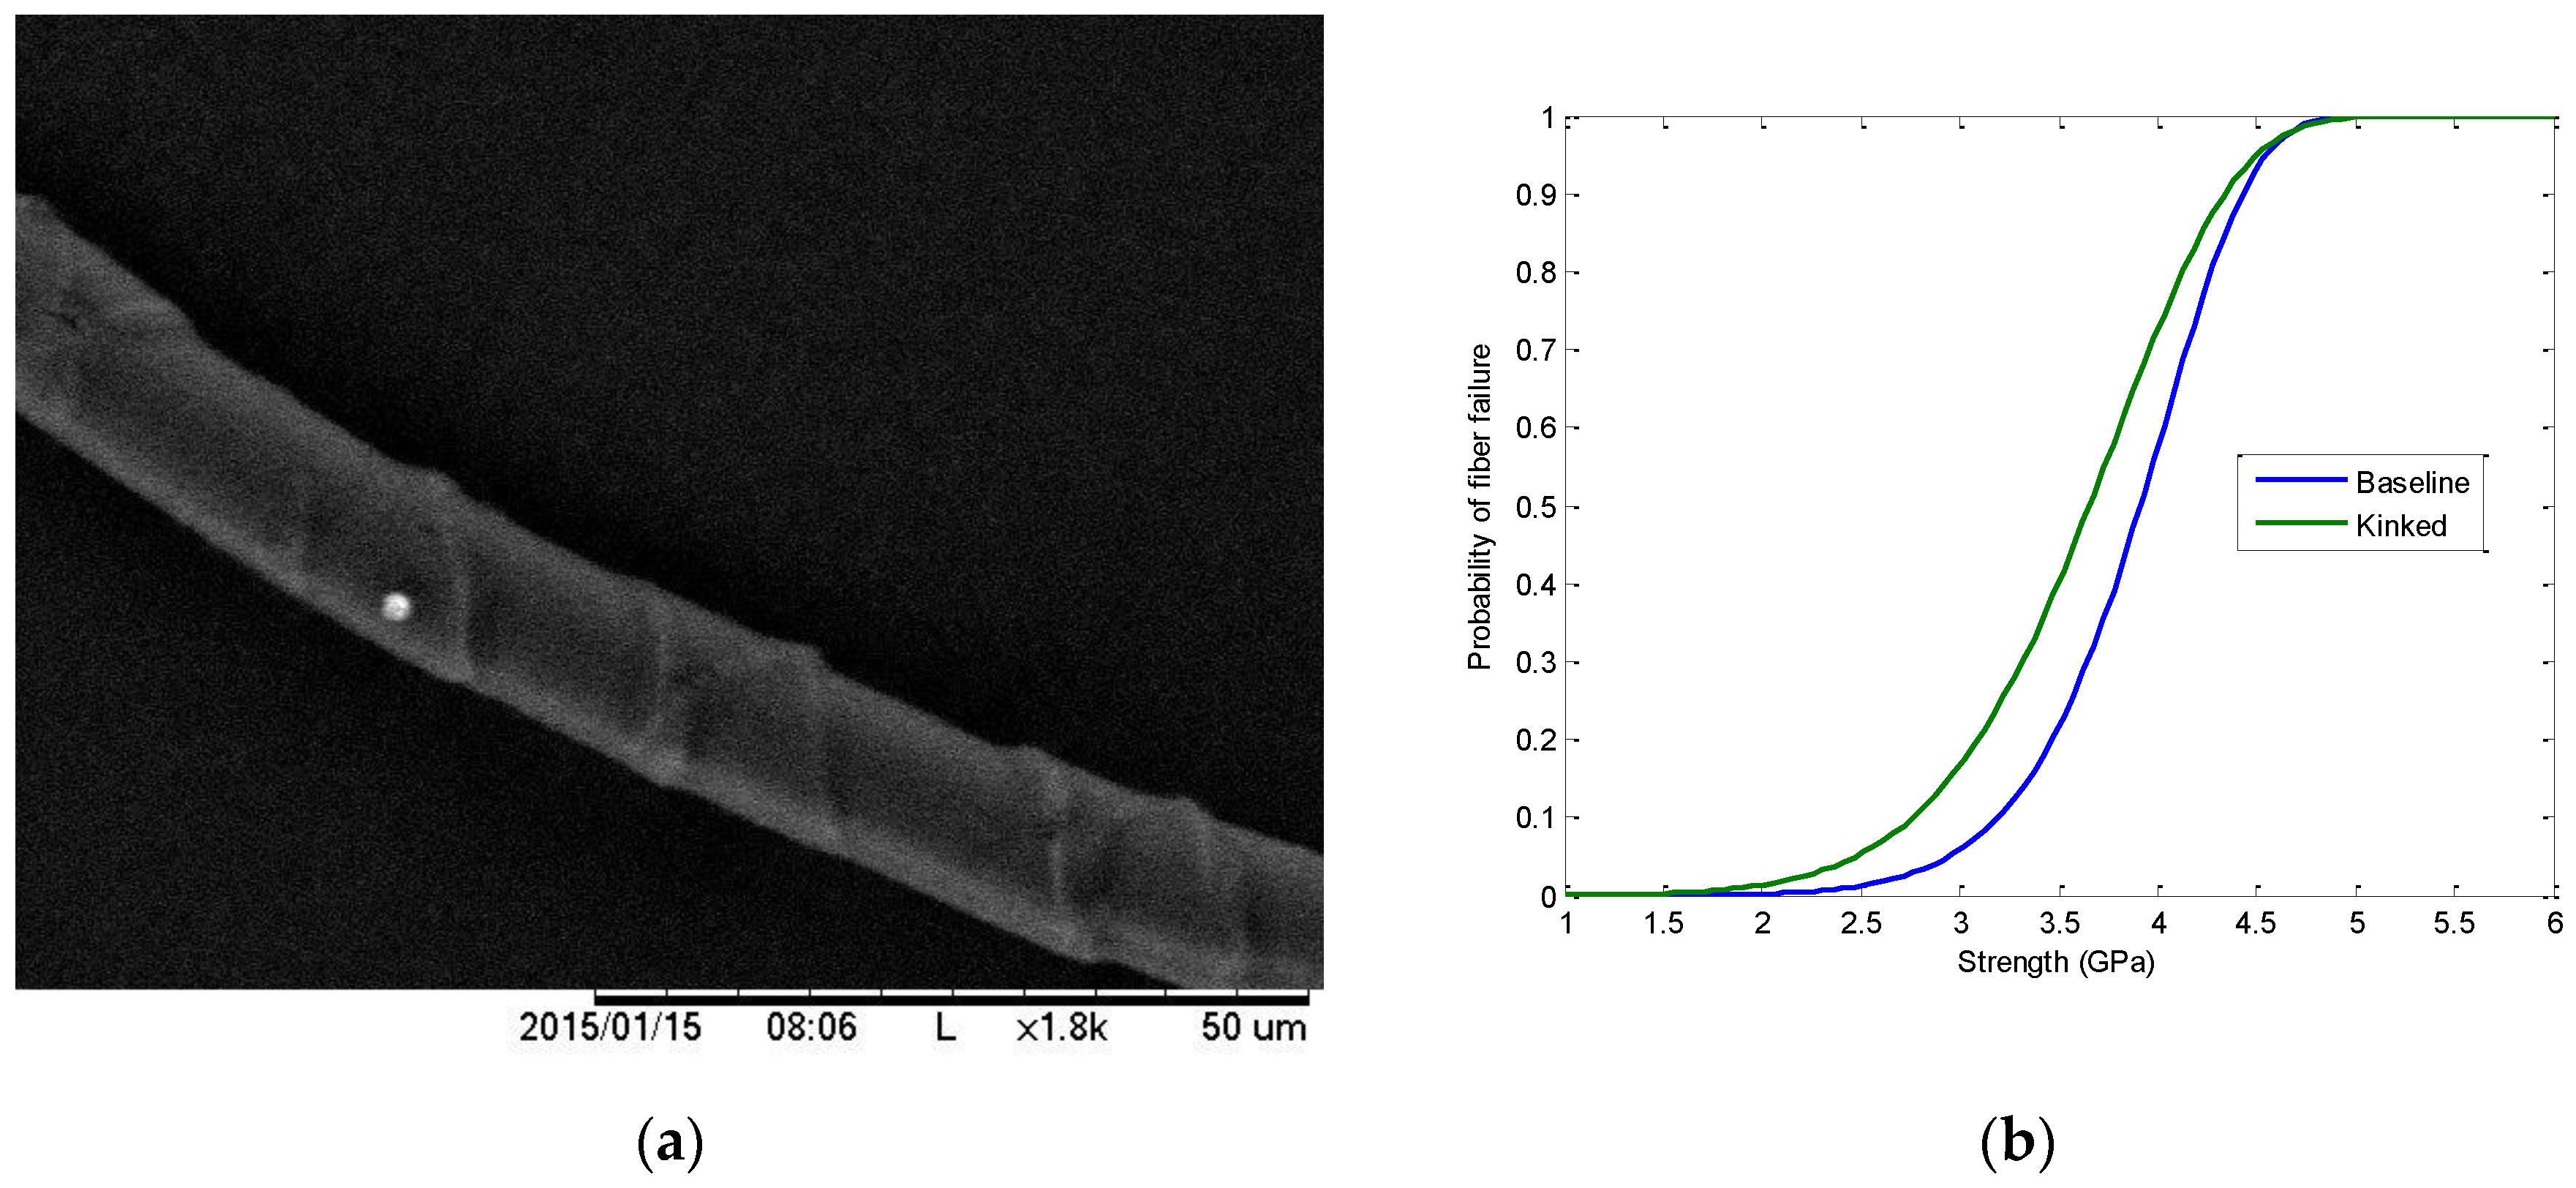
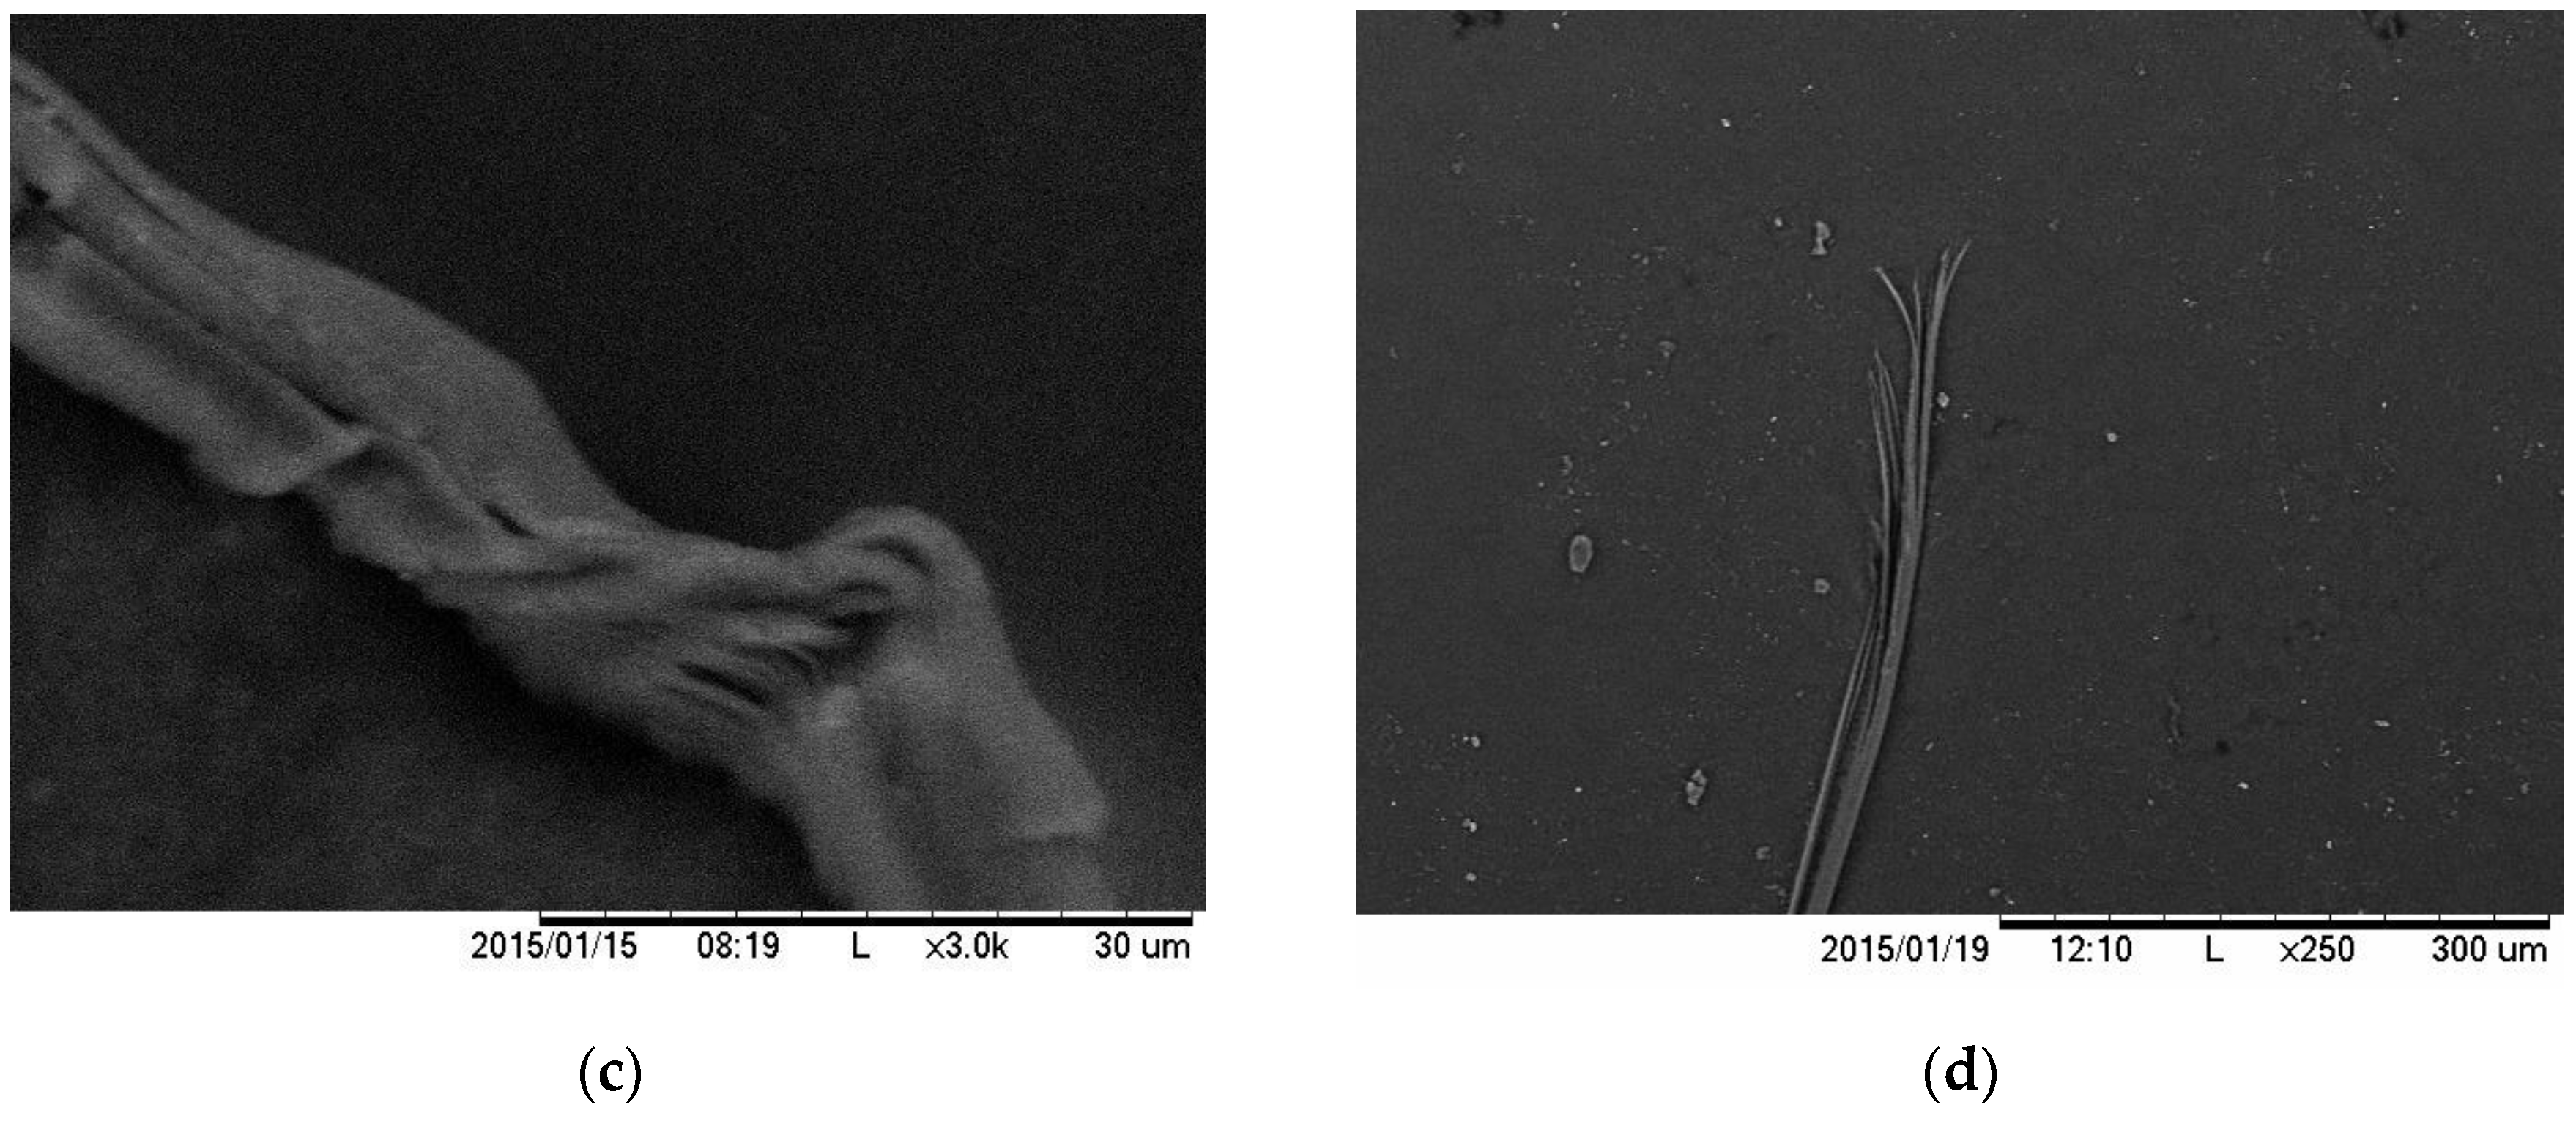
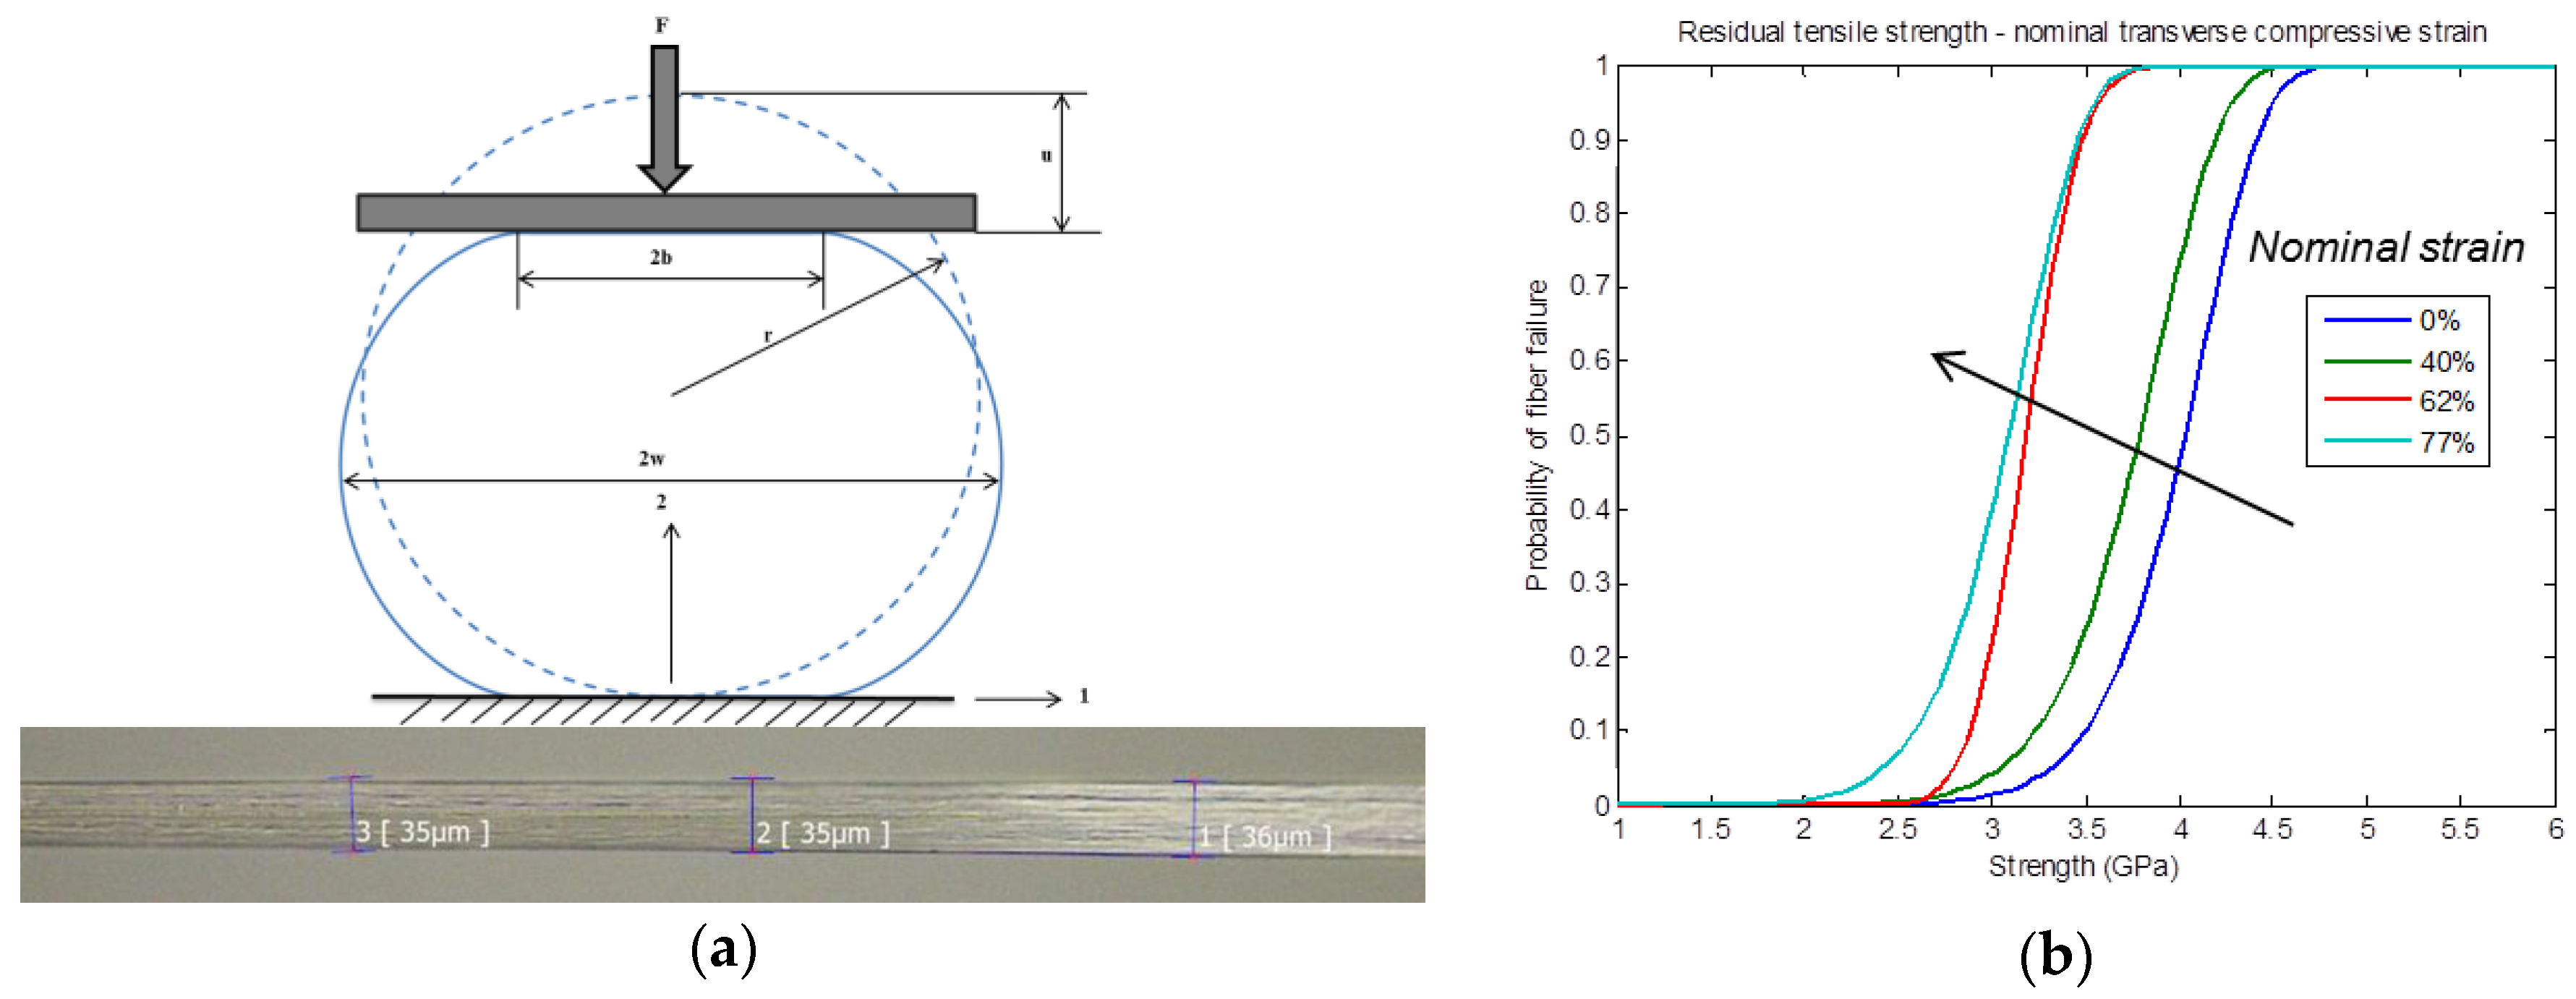
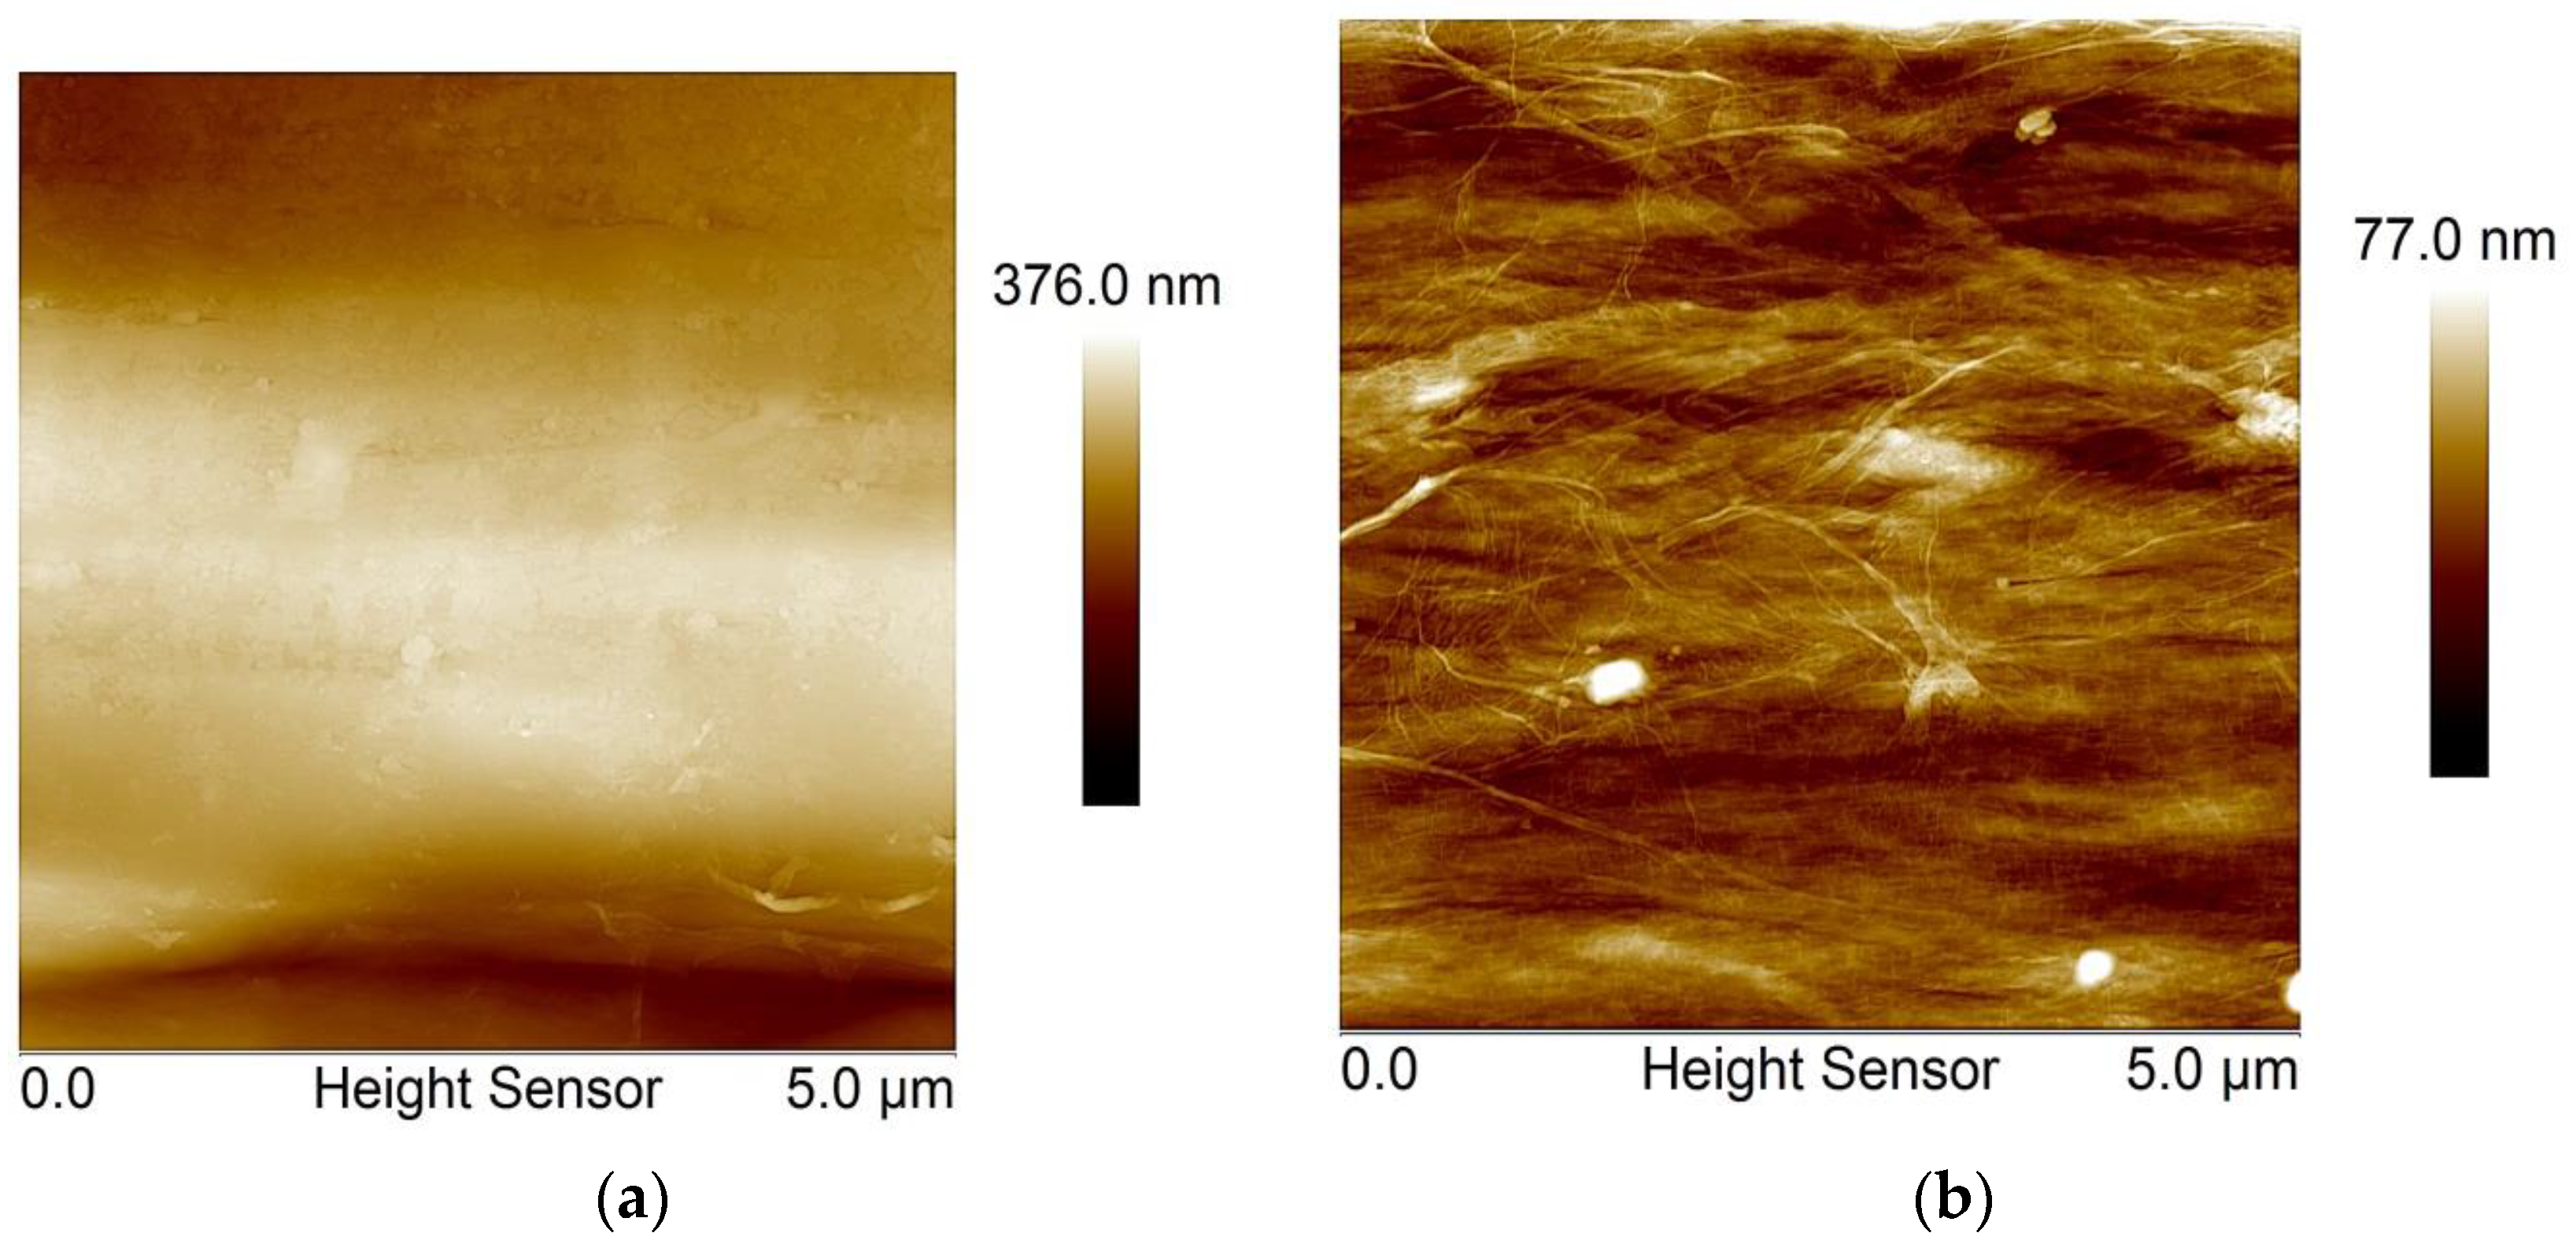
2. Experimental Observations

The effect of AC and TC on the residual tensile strength of Kevlar® KM2 fibers is summarized in this section. The curvature predicted by the fiber-level impact model [11] is physically induced by wrapping single Kevlar® KM2 fibers around a Boron fiber of radius 55 µm. AC induces the formation of kink bands in the fiber, as shown in Figure 5a. A kink band density of 70 kinks per mm and a kink band angle of 60° measured from the fiber axis are observed. The axial compressive strains are inversely proportional to the wrapping radius Rm. Therefore, a smaller wrapping radius (higher curvature) results in higher axial compressive strains and, hence, higher kink band density [31]. The QS mean tensile strength of the kinked fibers is found to be 7% lower than the baseline fibers. The statistical analysis using a 3-parameter Weibull model indicates a higher probability of fiber failure for kinked fibers at a given tensile strength, as shown by the cumulative distribution function (CDF) in Figure 5b. The probability density function (PDF) and cumulative distribution function (CDF) are given in Equations (1) and (2).
f ( σ ) = m σ 0 ( σ γ σ 0 ) m 1 e ( σ γ σ 0 ) m
F ( σ ) = 1 e x p ( ( σ γ σ 0 ) m )
where σ0 is the scale parameter, m is the shape parameter, and γ is the location parameter of the Weibull distribution. The scale and shaper parameters determined by fitting the tensile strength data to the Weibull distribution are shown in Table 1.
Post-failure investigation of the failed fibers indicates significant deformation and fibrillation around the kink bands, as shown in Figure 5c. In general, fibrillation is found to be the failure mode for both kinked and baseline fibers, as shown in Figure 5d.
Upon transverse impact, fibers are subjected to transverse compressive deformation that is sufficient to cause permanent deformation and fibrillation during short time scales [1,32]. The fibers exhibit a nonlinear inelastic response in transverse compression [19]. TC induces permanent deformation and growth of the fiber in the direction perpendicular to the loading direction, as shown in Figure 6a. To understand the effect of TC on residual tensile strength, single fibers compressed at different nominal strains are tested in axial tension. The compressed fibers of 12.7 mm gage length are then tested in axial tension in an Instron micro tester according to ASTM D 3822-01. A 5N load cell and a rate of 0.1 in/min are used to test all the fibers. A total of 25 samples each are tested for different levels of TC. The fibers subjected to a 60% nominal TC strains showed a 20% reduction in the average tensile strength compared to baseline fibers. This reduction in the tensile strength may be attributed to the damage induced by TC. The residual tensile strength data is fitted using a Weibull distribution, and the CDF plots are shown in Figure 6b. The CDF of the compressed fibers shifts to the left with increasing levels of applied compressive strains. Therefore, there is a higher probability of failure for compressed fibers at a given tensile strength.
Similar to Kevlar® KM2, UHMWPE Dyneema SK76 fibers exhibit a nonlinear inelastic behavior in TC. The compressive elastic modulus of Dyneema SK76 is higher than Kevlar® KM2. However, the yield stress of Dyneema SK76 fibers is lower and the response is compliant (exhibit higher growth in the compressed width under TC) compared to Kevlar® KM2 fibers [18]. The atomic force microscopy (AFM) images of a compressed fiber surface indicate a higher degree of fibrillation in the UHMWPE fibers compared to Kevlar® KM2 fibers, as shown in Figure 7. This observation may be attributed to the weaker inter-fibrillar interactions in UHMWPE fibers.

3. Molecular Simulations Details

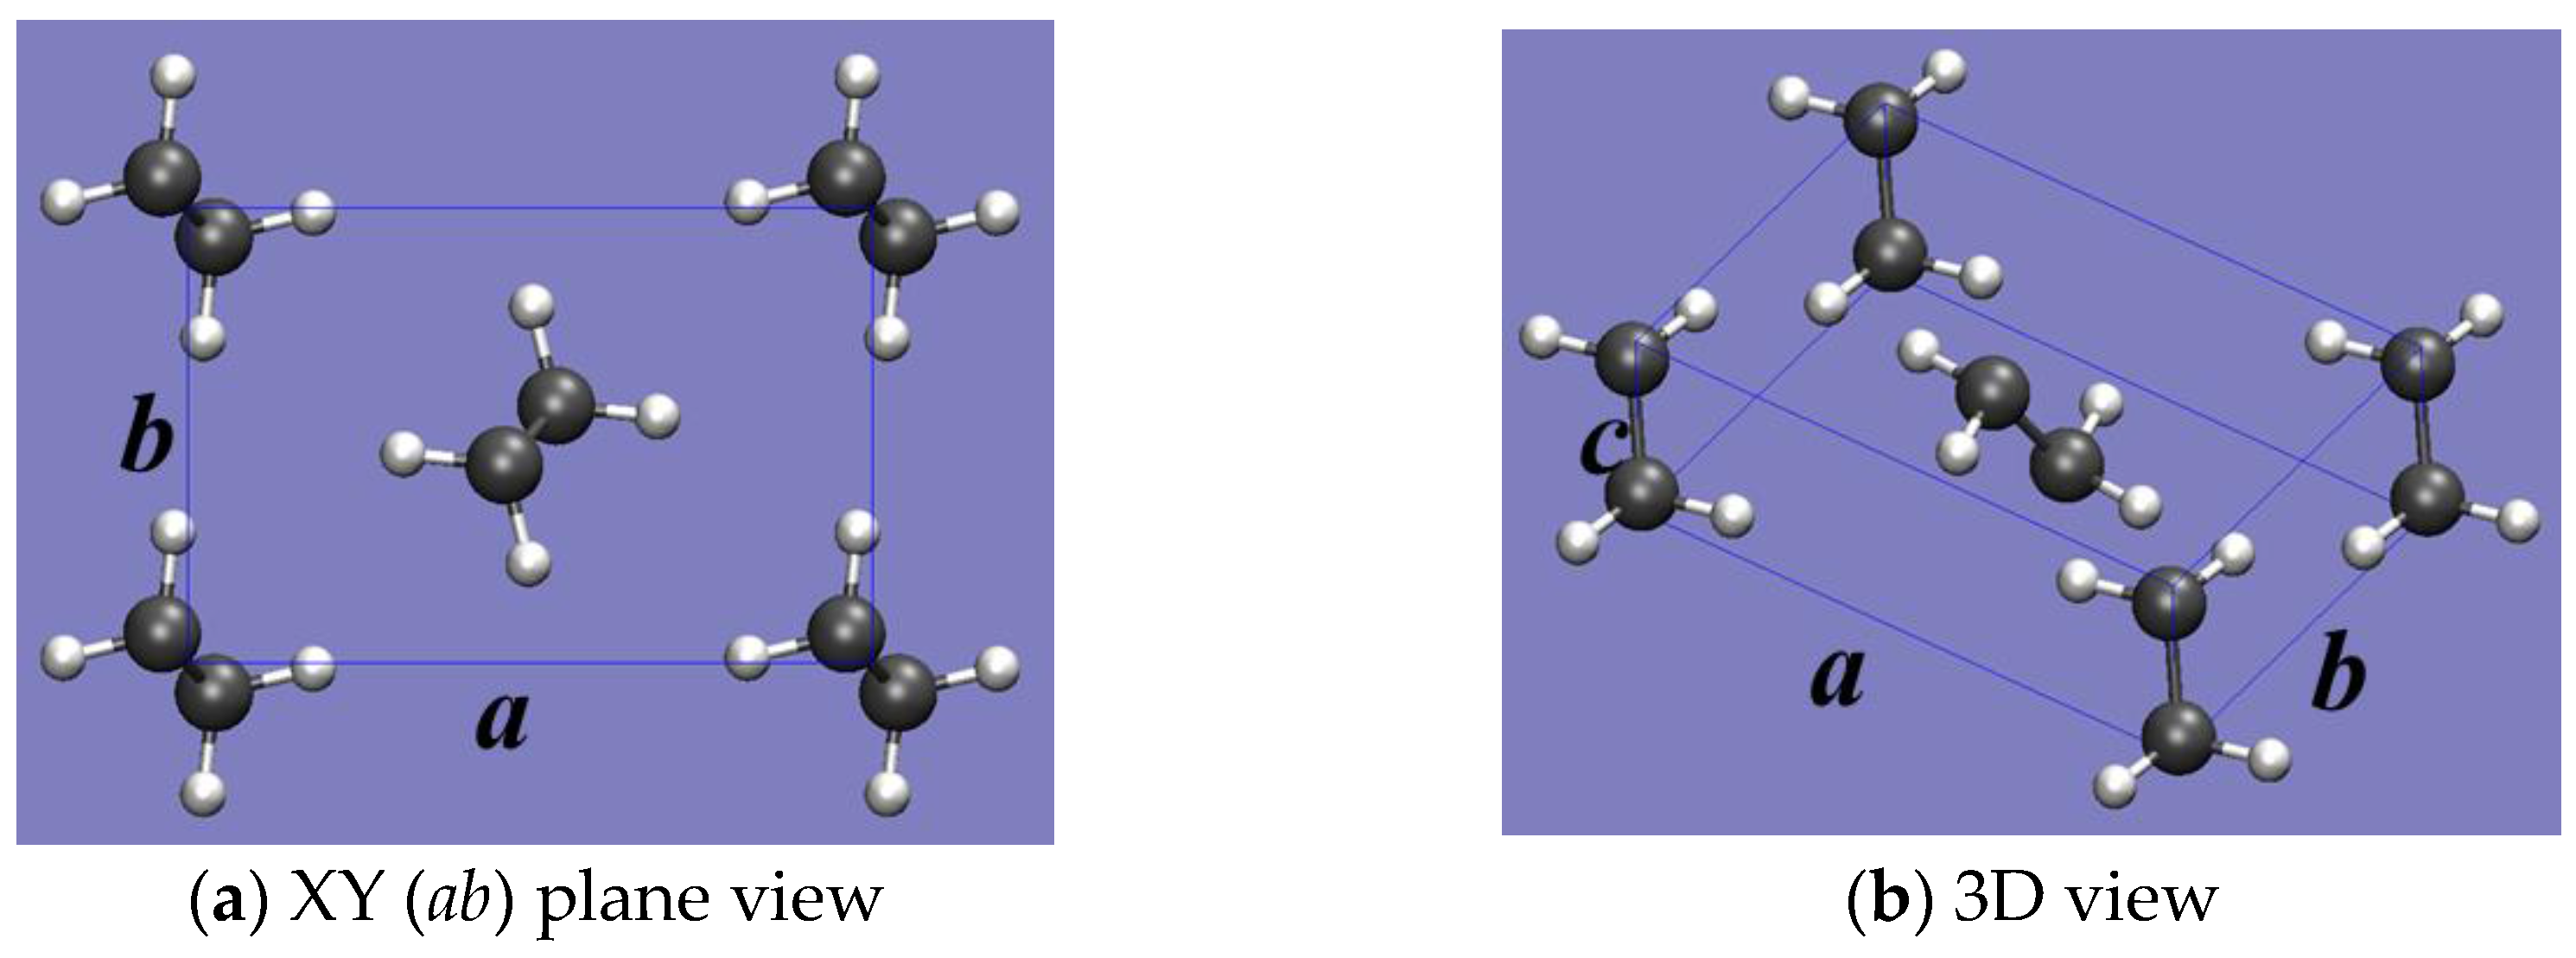
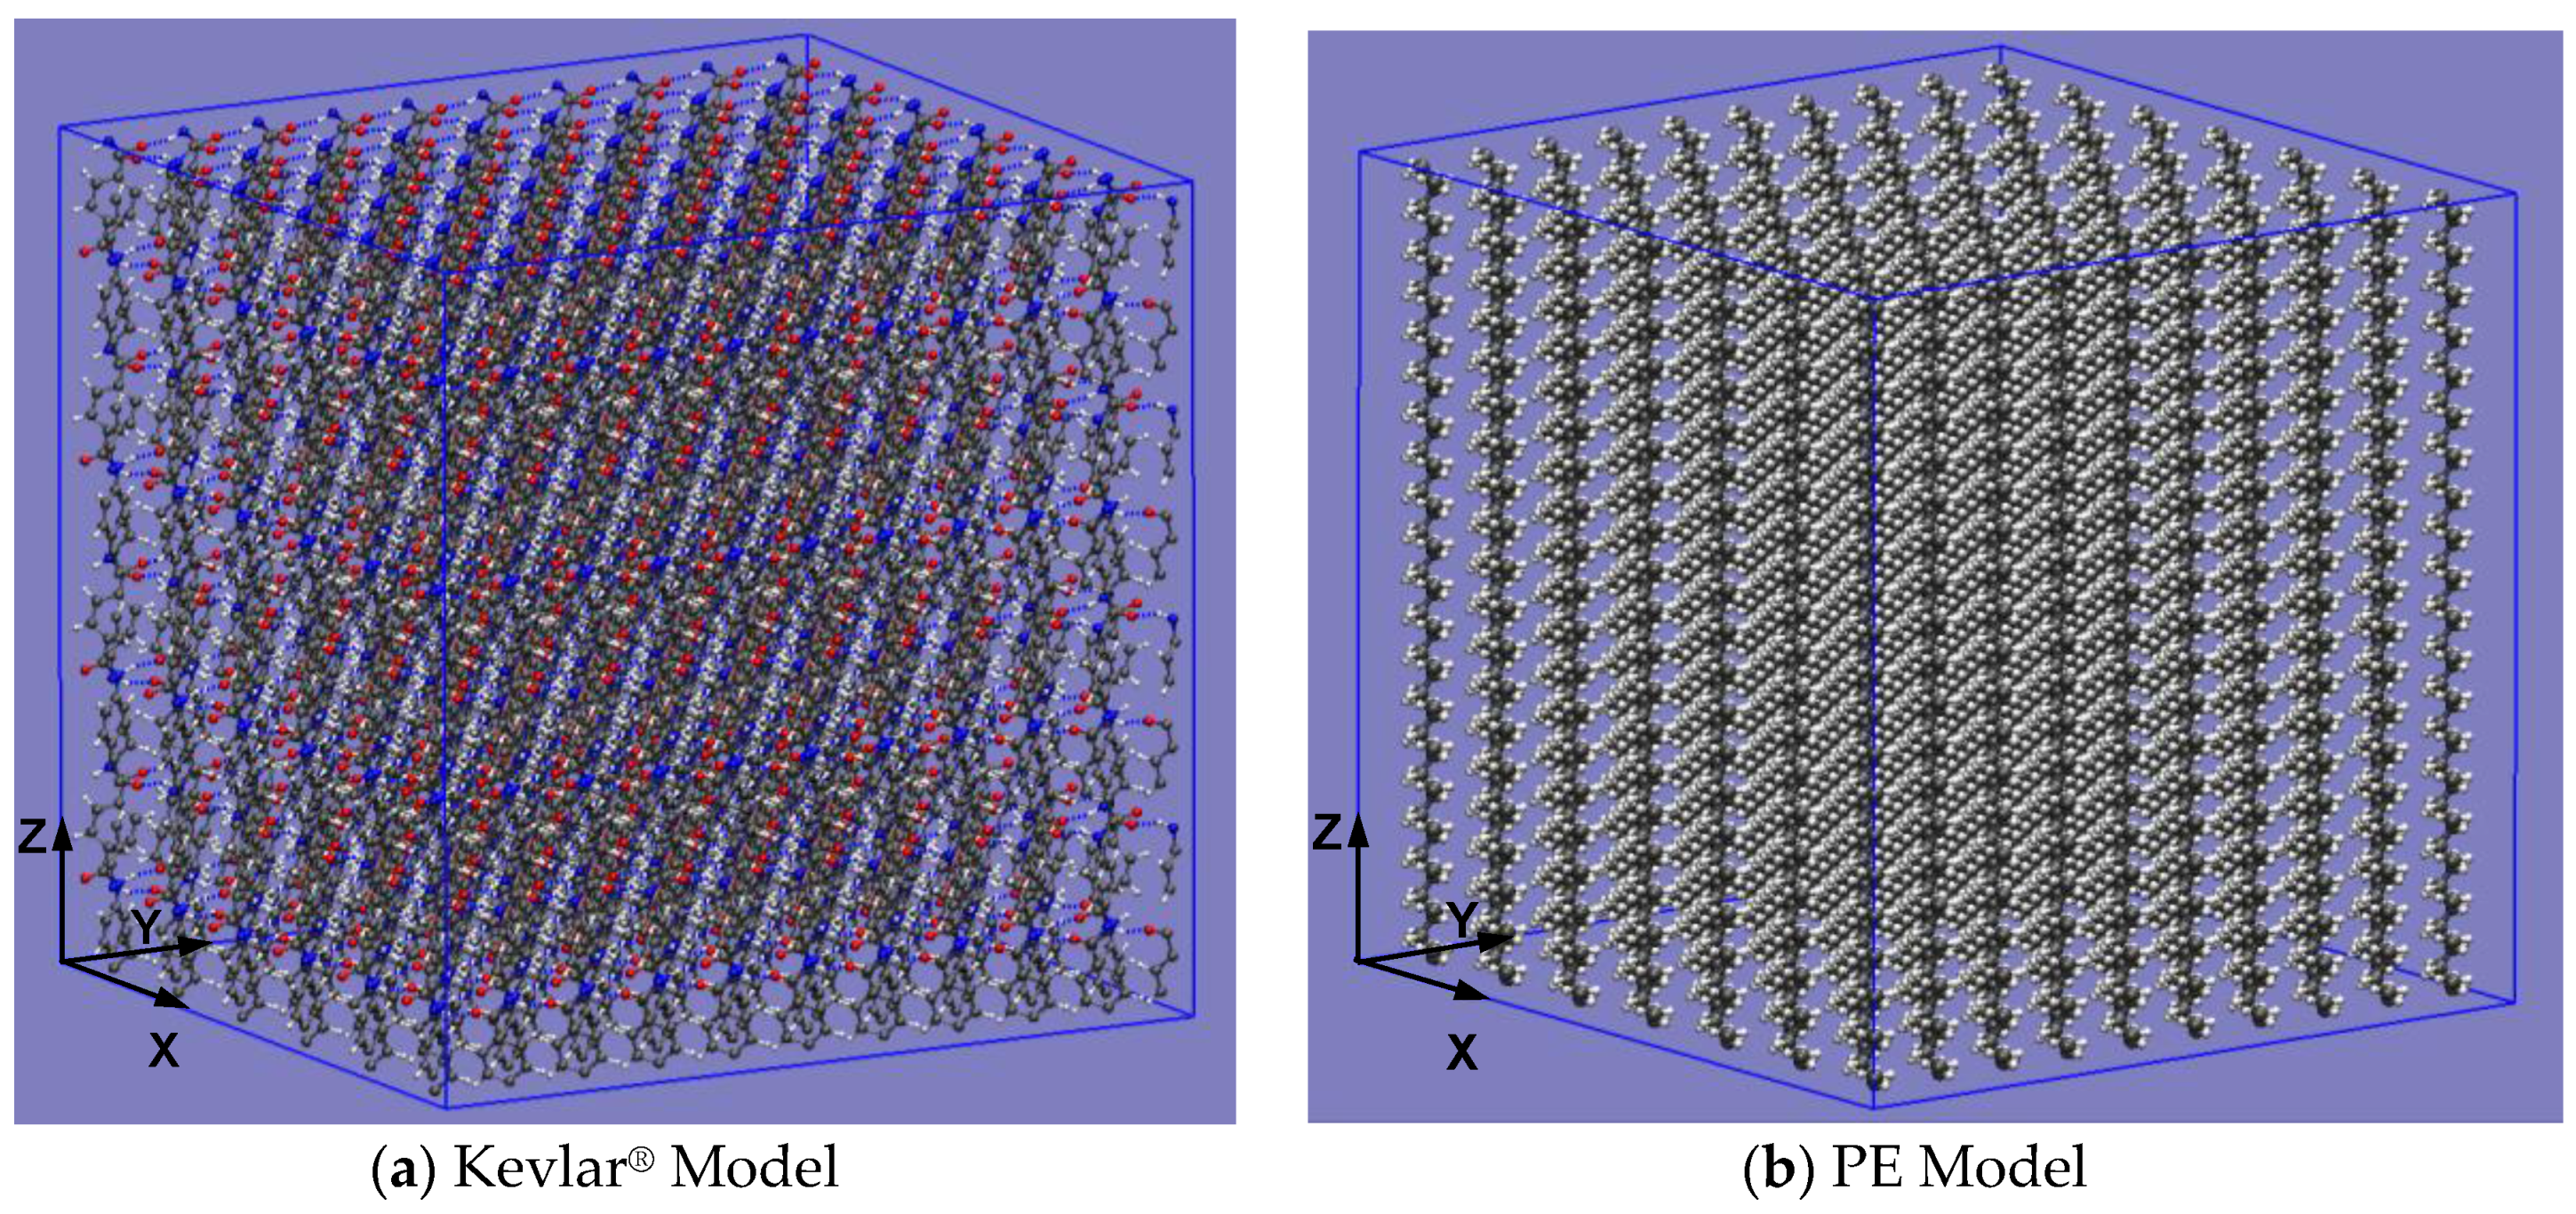
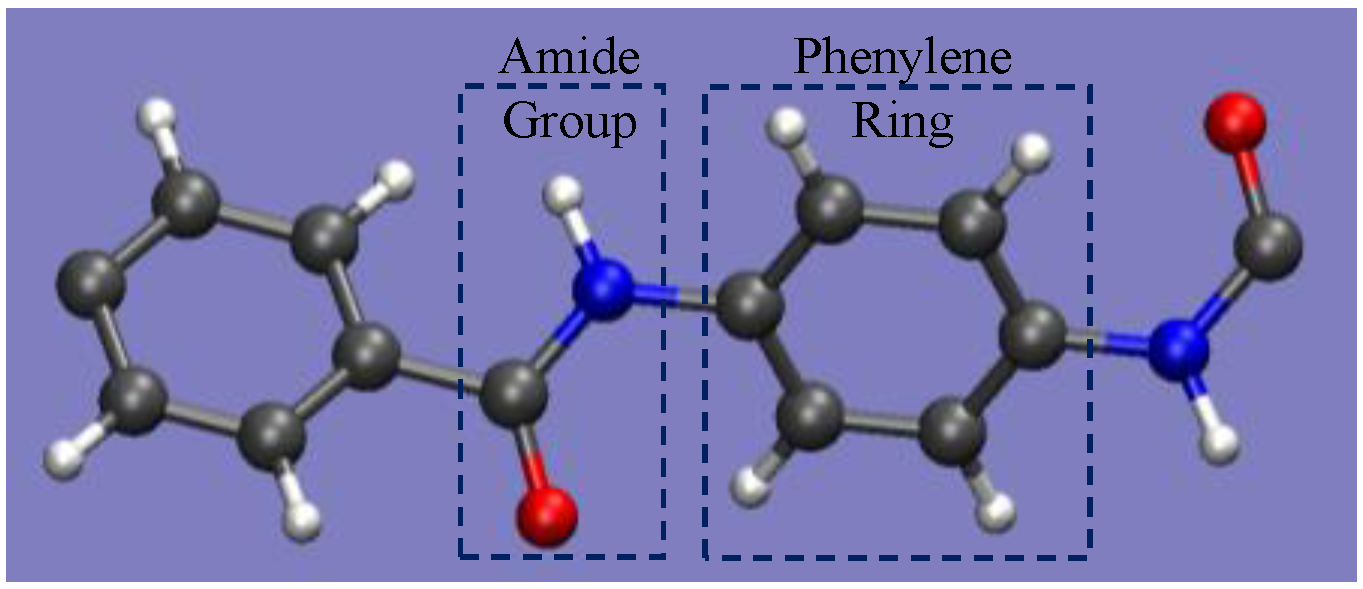
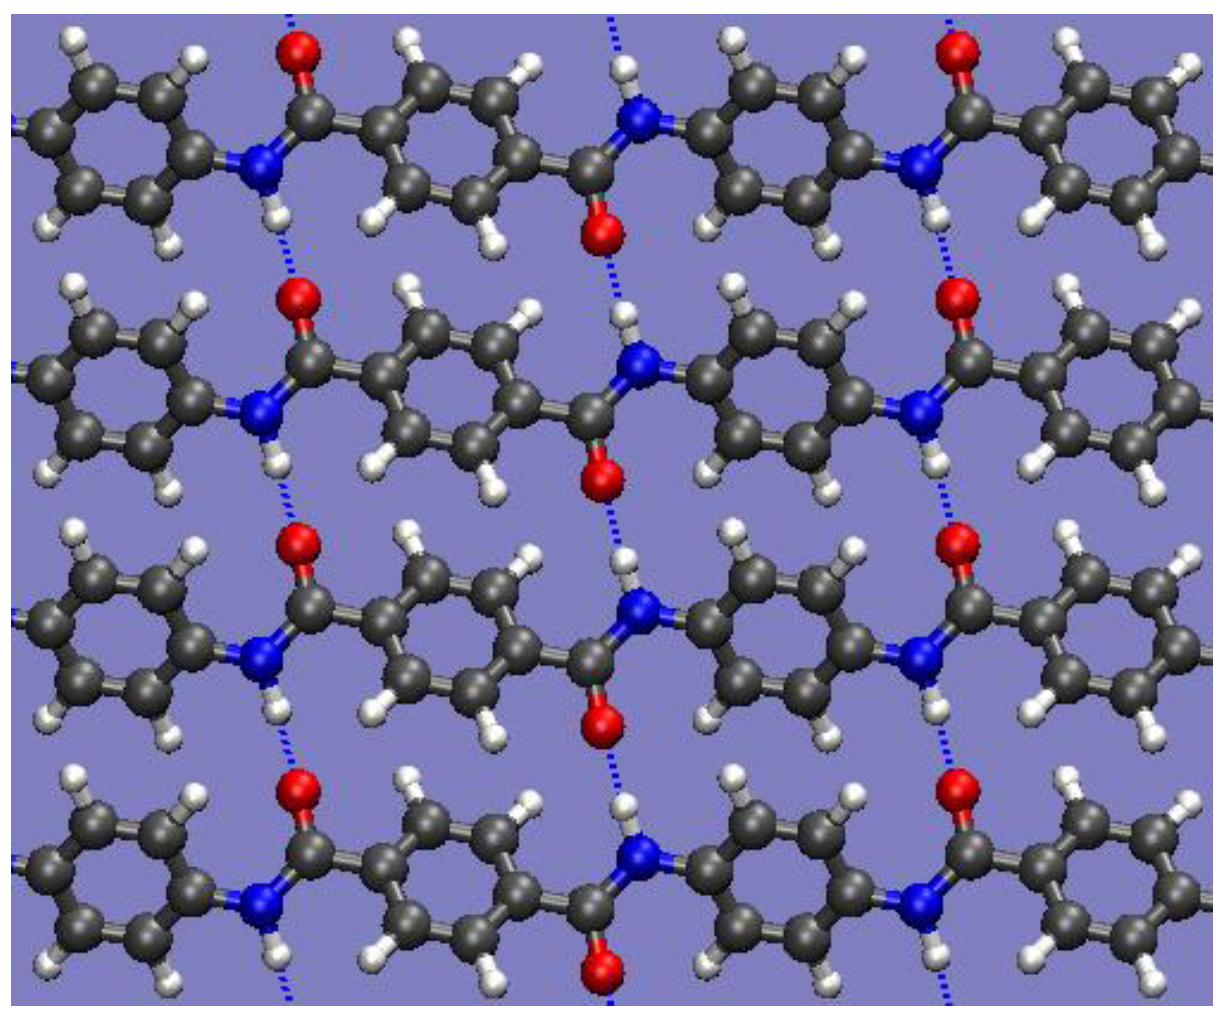
3.1. Model Development

The Kevlar® and PE models are constructed by replicating the corresponding unit cell in the X, Y, and Z directions. Figure 8 shows a three-dimensional view of the Kevlar® and PE models. The chains are aligned along the Z-axis. The dimensions of the Kevlar® model are 4.722 × 5.180 × 5.160 nm, and it has 13,440 atoms. The PE model has dimensions 5.180 × 4.930 × 5.068 nm, and it has 16,800 atoms. All models are equilibrated before applying mechanical loads.

3.2. Force Field

For MD simulations, the choice of the right force field is critical since the properties of the analyzed materials are very sensitive to the force field being used in the MD simulations. We have used reactive force fields to model the bonded and non-bonded interactions so that, under large deformation, bonds can rupture. For Kevlar®, state-of-the-art reactive force field ReaxFF [33] is used. A full description of all ReaxFF potential functions can be found elsewhere [34]. ReaxFF has different versions dedicated to different materials ranging between polymer, metals, glass, and ceramics [35]. ReaxFF parameter sets developed by Liu et al. [27] for polymer and energetic materials are used for Kevlar®. Mercer et al. [24] have used Liu parameters in Kevlar® modeling, and they have shown that this parameter set predicts well the structure and mechanical properties of Kevlar®. For PE, widely used reactive force field AIREBO [28] is used. Equation (3) shows the functional form of the AIREBO force field consisting of three terms. The first term E ij REBO represents the short range ( r   <   0.2   nm ) two-body (bond) and three-body (angle) bonded interactions. The second term E i j L J represents the two-body non-bonded pair interaction. This term adds long range ( 0.2   nm   <   r   <   cutoff ) interaction using a form similar to the 12-6 Lennard-Jones potential. The third term is the bonded four-body (torsion) bonded interaction. Detailed formulae for the AIREBO potentials and parameters values can be found elsewhere [28,29]. The cut-off function embedded in the switching function in the REBO term introduces a dramatic increase in the interatomic force near the bond breaking length. To avoid this overestimation, we use an inner cut-off radius of 0.2 nm for C–C interaction [36,37,38].
E = 1 2 i j i [ E i j R E B O + E i j L J + k i , j l i , j , k E ijkl tors ]

3.3. Simulations Conditions

Before applying a mechanical load, the models created in Section 3.1 are relaxed at 1 atmospheric pressure with an NPT (isothermal-isobaric) ensemble to get the stable equilibrium structure. The Kevlar® model is first heated at 500 K for 20 ps. Next it is cooled down to 300 K within 50 ps and then further relaxed at 300 K for 100 ps. The PE model is relaxed at 300 K for 400 ps with an NPT ensemble. To apply a normal load, the models are subjected to uniform strain. For that, the solution domain is linearly expanded (for tension) and contracted (for compression) with a constant strain/displacement rate by scaling the coordinates of all atoms along the corresponding direction at every time step followed by MD time integration [39]. To mimic the plane-stress condition, movements in other directions (i.e., transverse to the loading direction) due to Poisson’s effect are allowed (i.e., zero net force in these directions) [39]. MD simulations for loading are conducted using an NPT ensemble at 300 K and 1 atmospheric pressure. The time step used in the MD time integration is 0.1 fs, and strain rate used in the mechanical loading is 10 9   s 1 . Periodic boundary conditions are used in all simulations. Temperature and pressure are controlled by using Nose-Hoover thermostat and barostate in LAMMPS.
Stress is calculated using the classic definition of virial stress [40,41].
σ i j V = 1 V α = 1 N [ m α v i α v j α + 1 2 β     α r i j α β f i j α β ]
where V is the model volume, N is the number of atoms in the model, m is the mass of atom, v is the velocity of atom, r is the inter-atomic distance, and f is the inter-atomic force. The subscripts i and j stand for the values of the X, Y, and Z directions. The above virial stress corresponds to true stress. Engineering stress is determined by scaling the virial true stress with the initial cross-section area (i.e., area at the starting of load) of the model. Engineering stress and strain are defined using the following formula.
σ = σ i j V × A A 0
ε = L L 0 L 0
where A is the instantaneous cross-section area, A0 is the initial cross-section area, L0 is the initial gage length, L is the current gage length, σ is the engineering stress, and ε is the engineering strain.

4. Results and Discussion

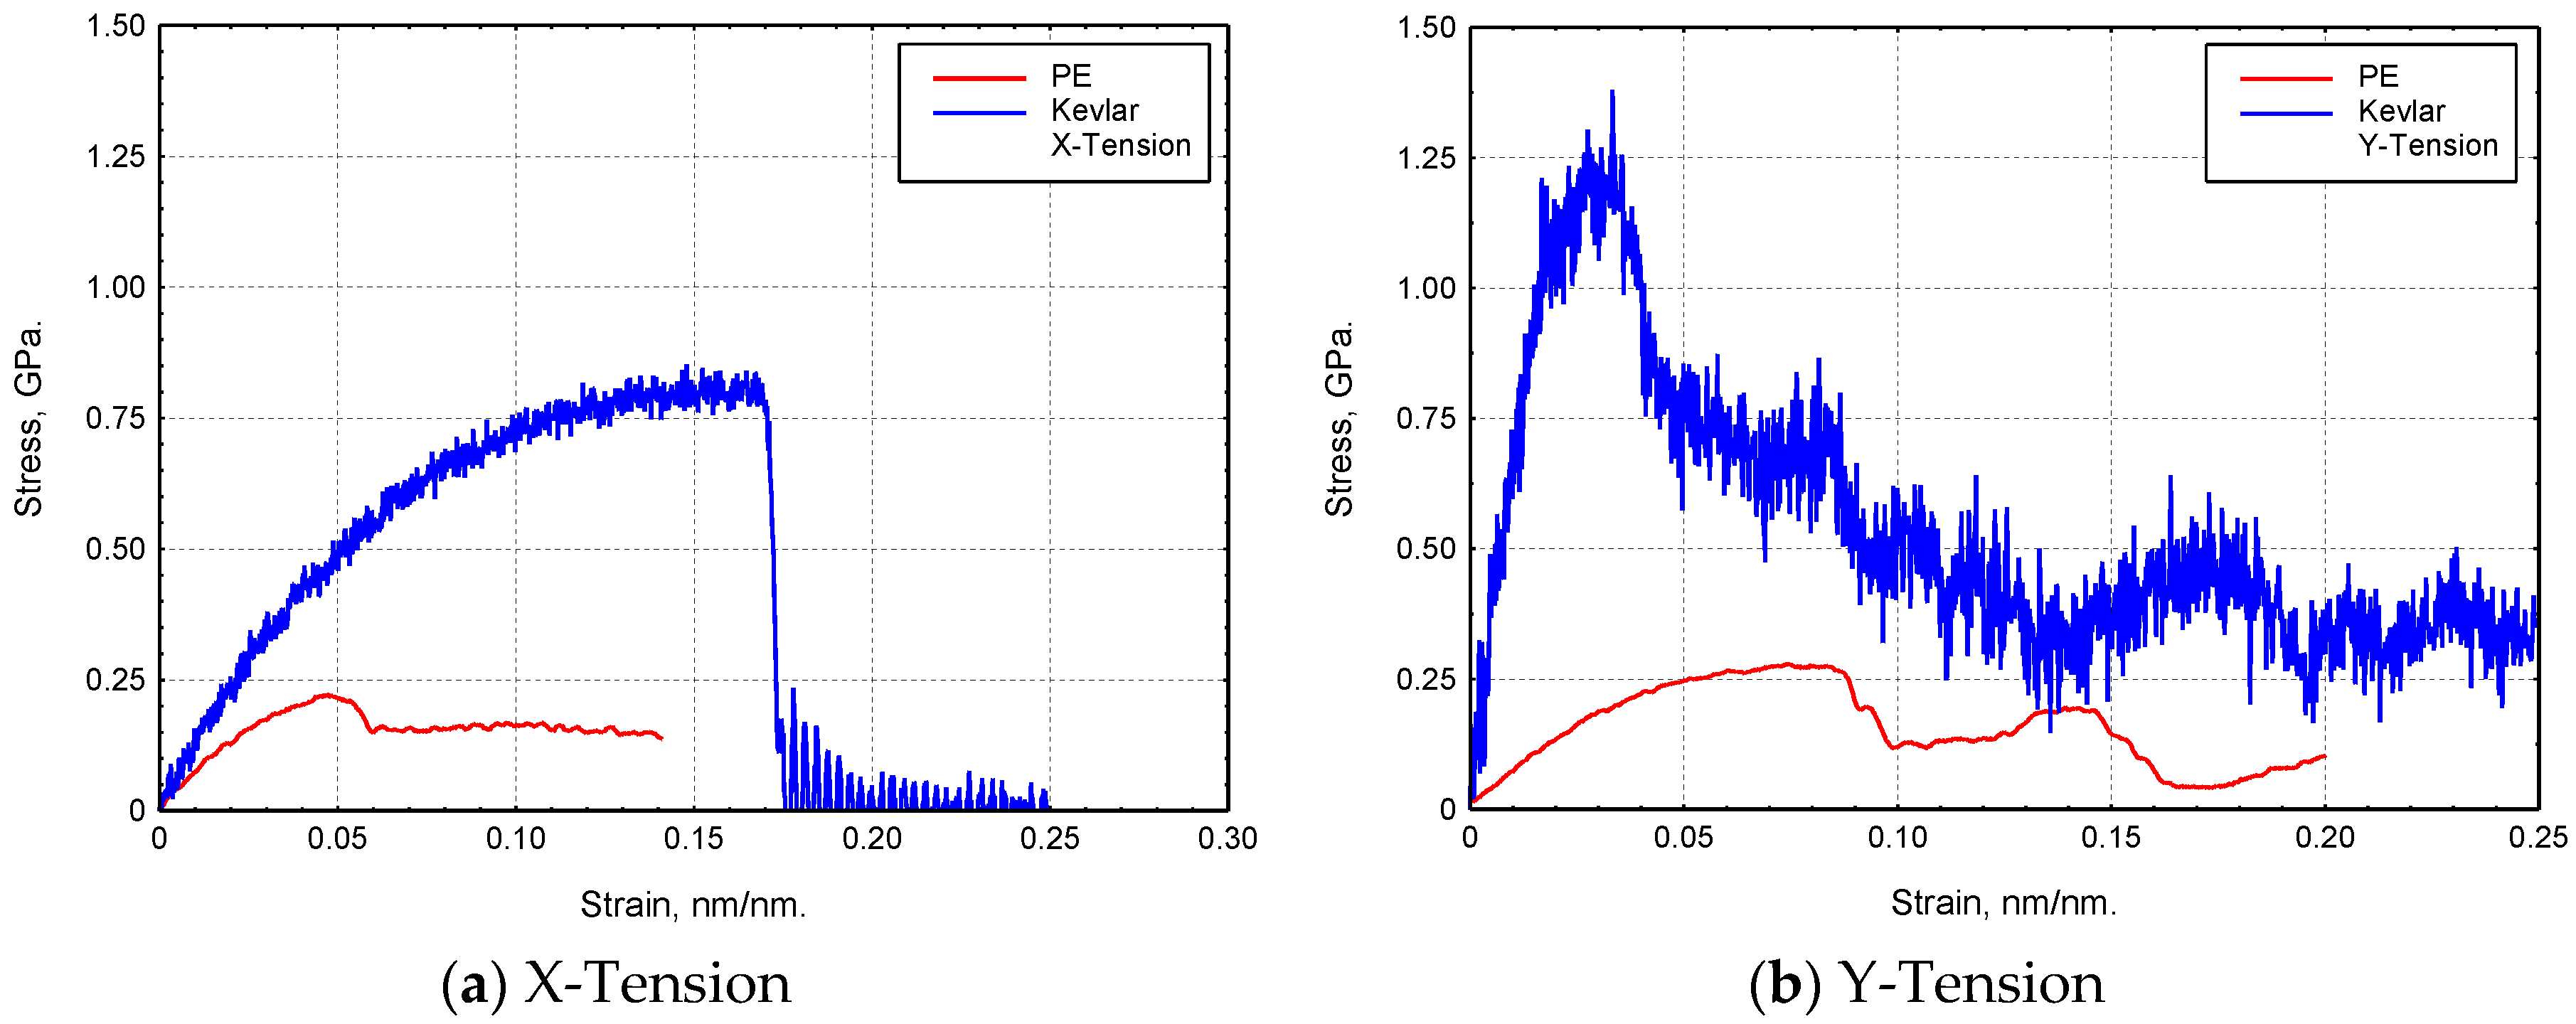
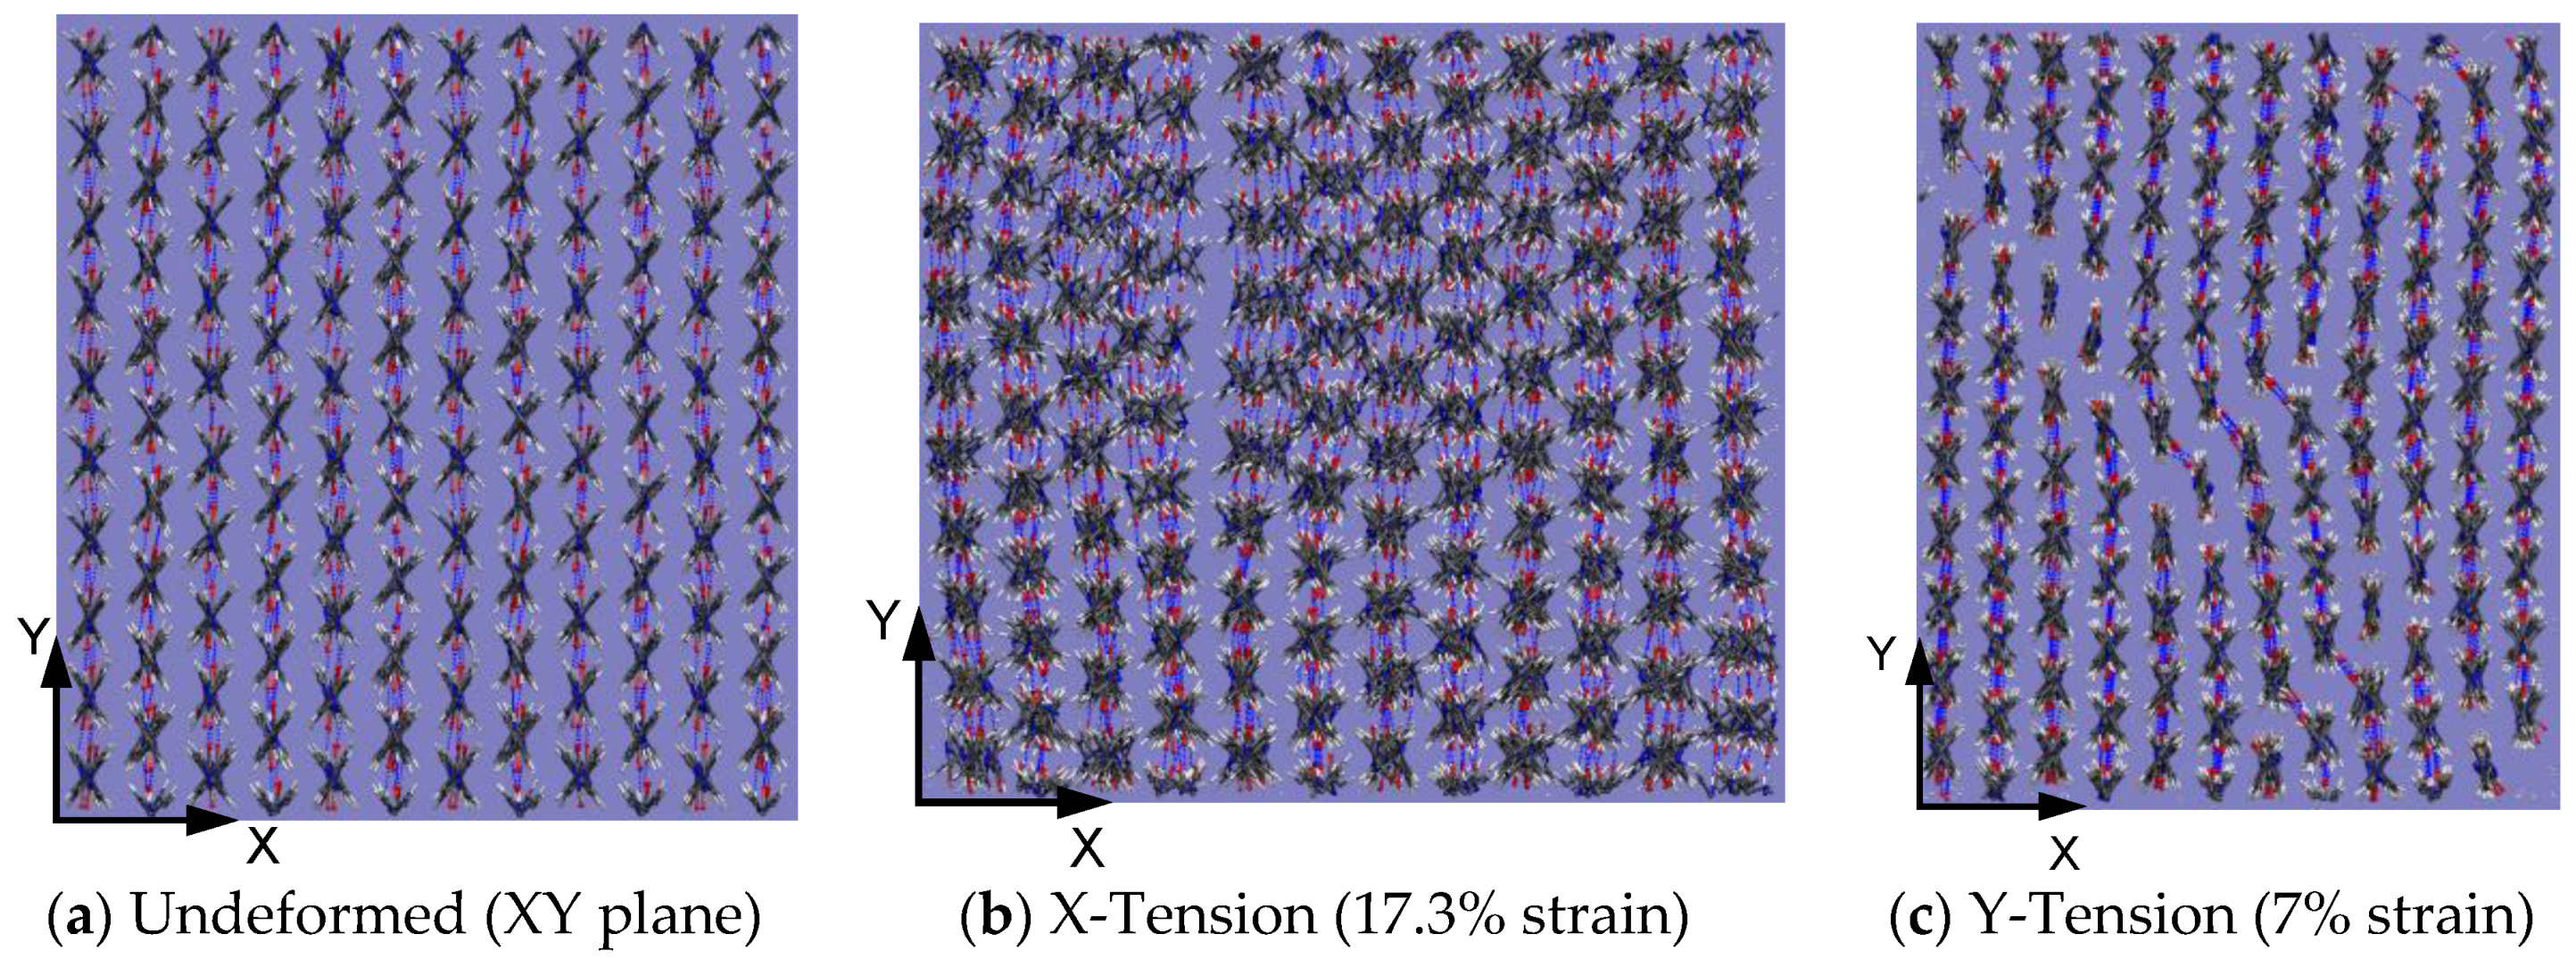
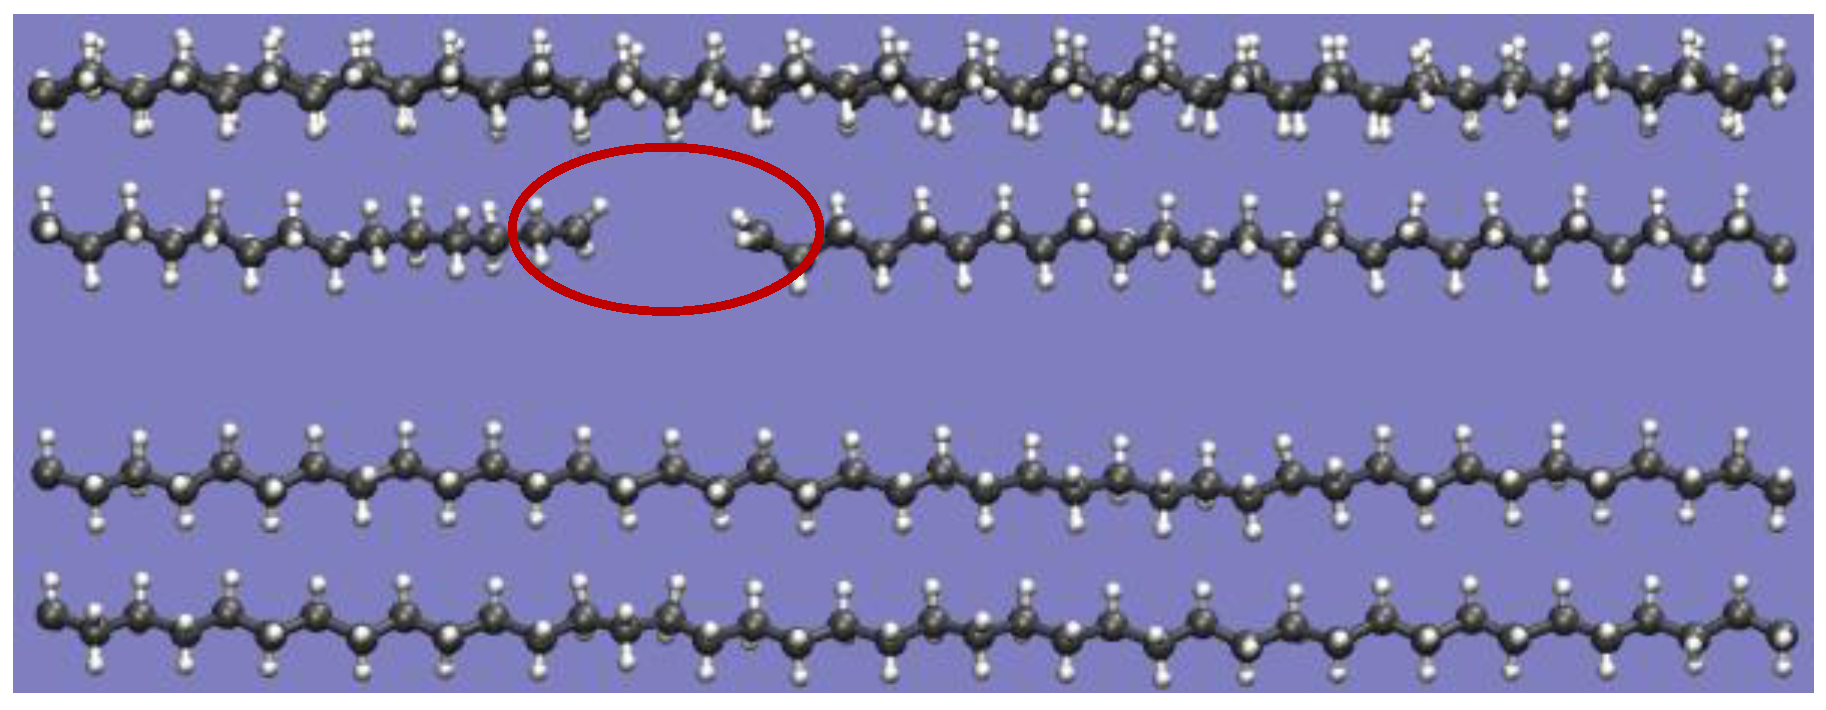
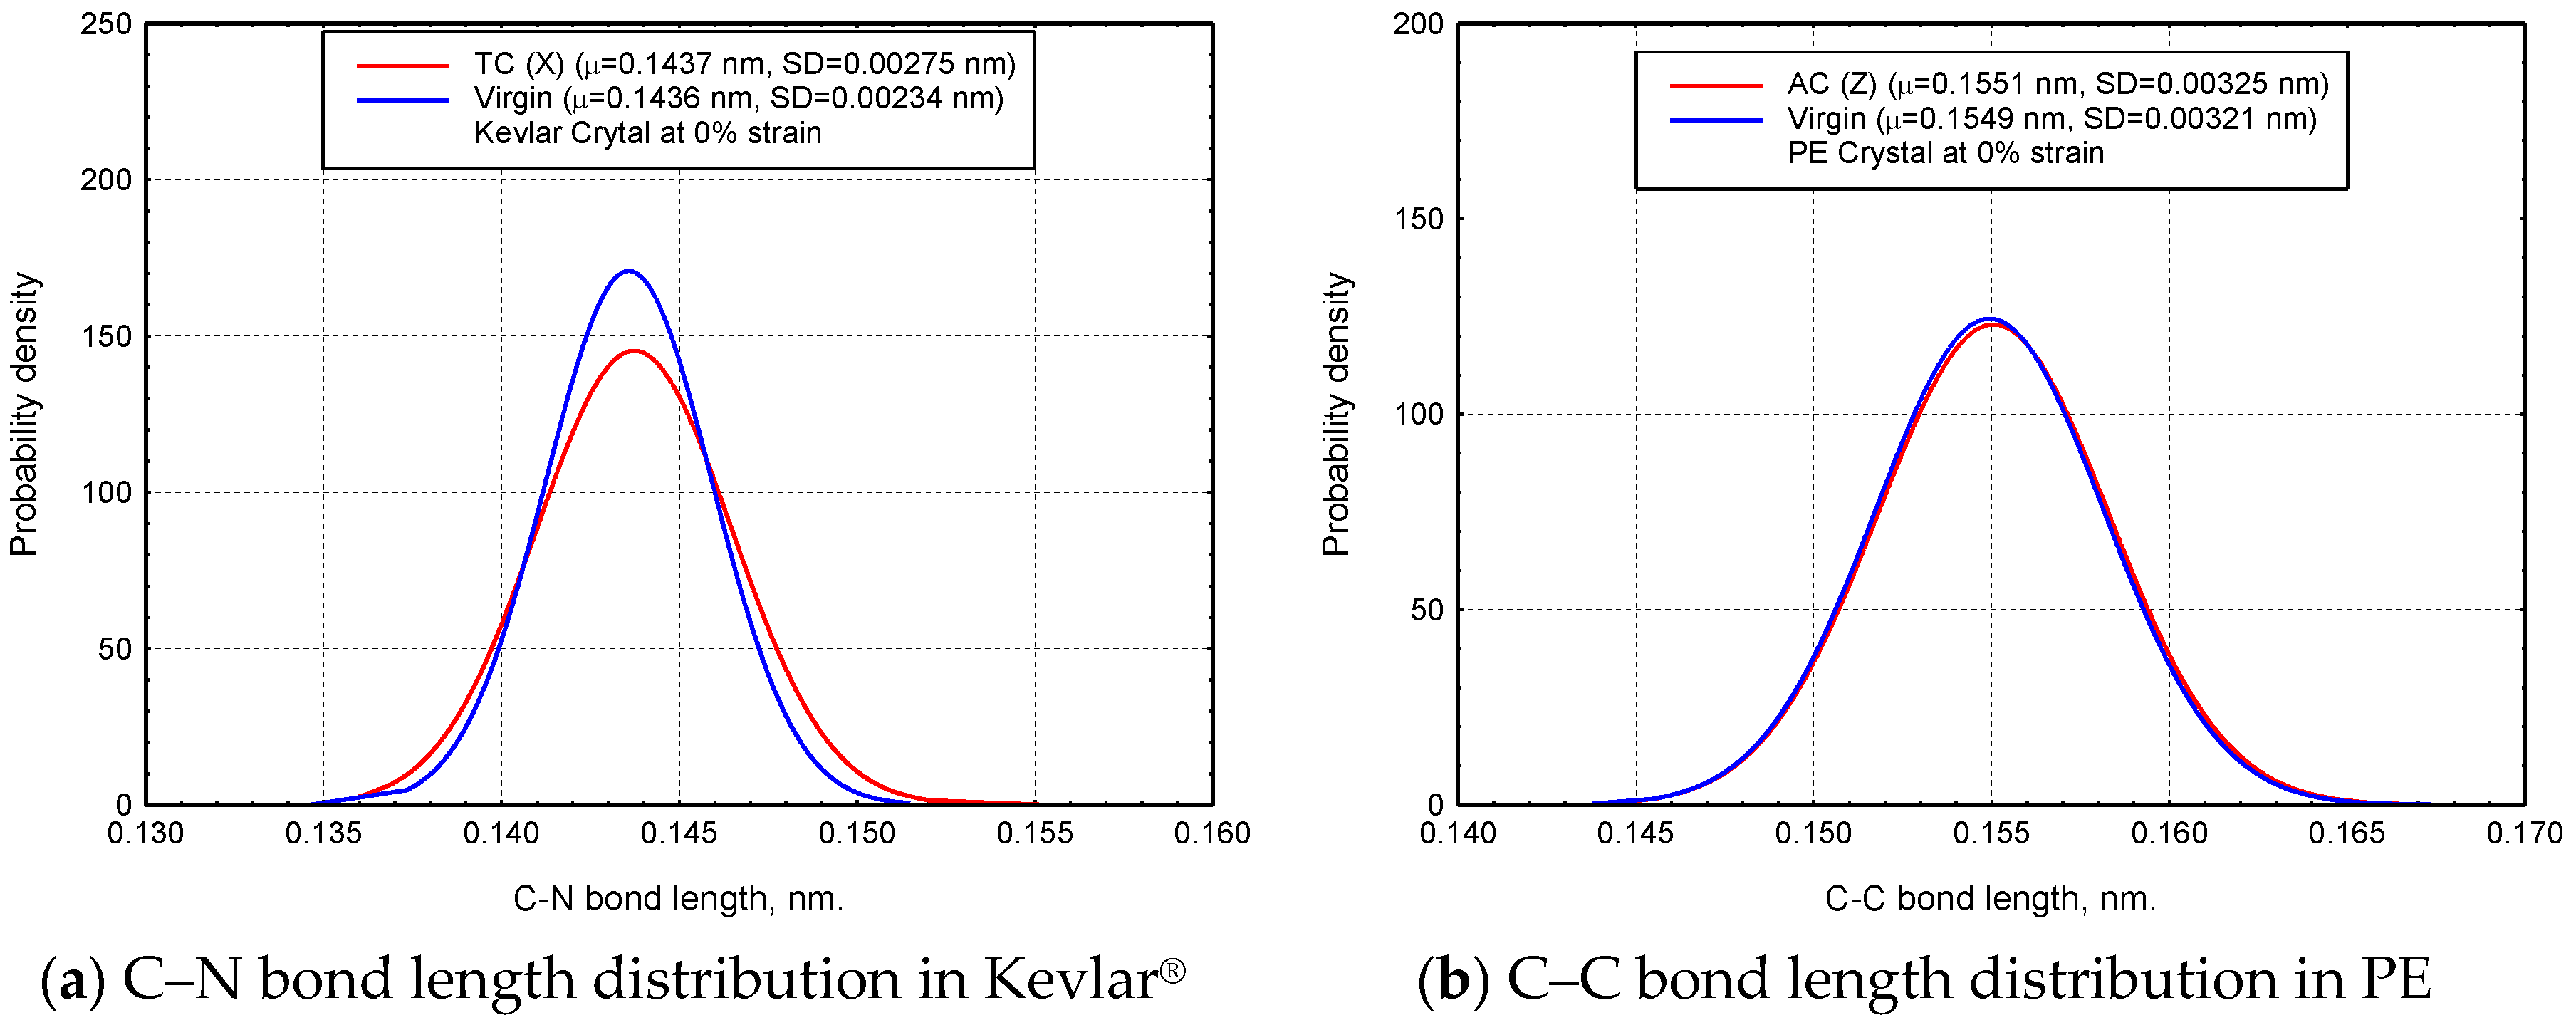
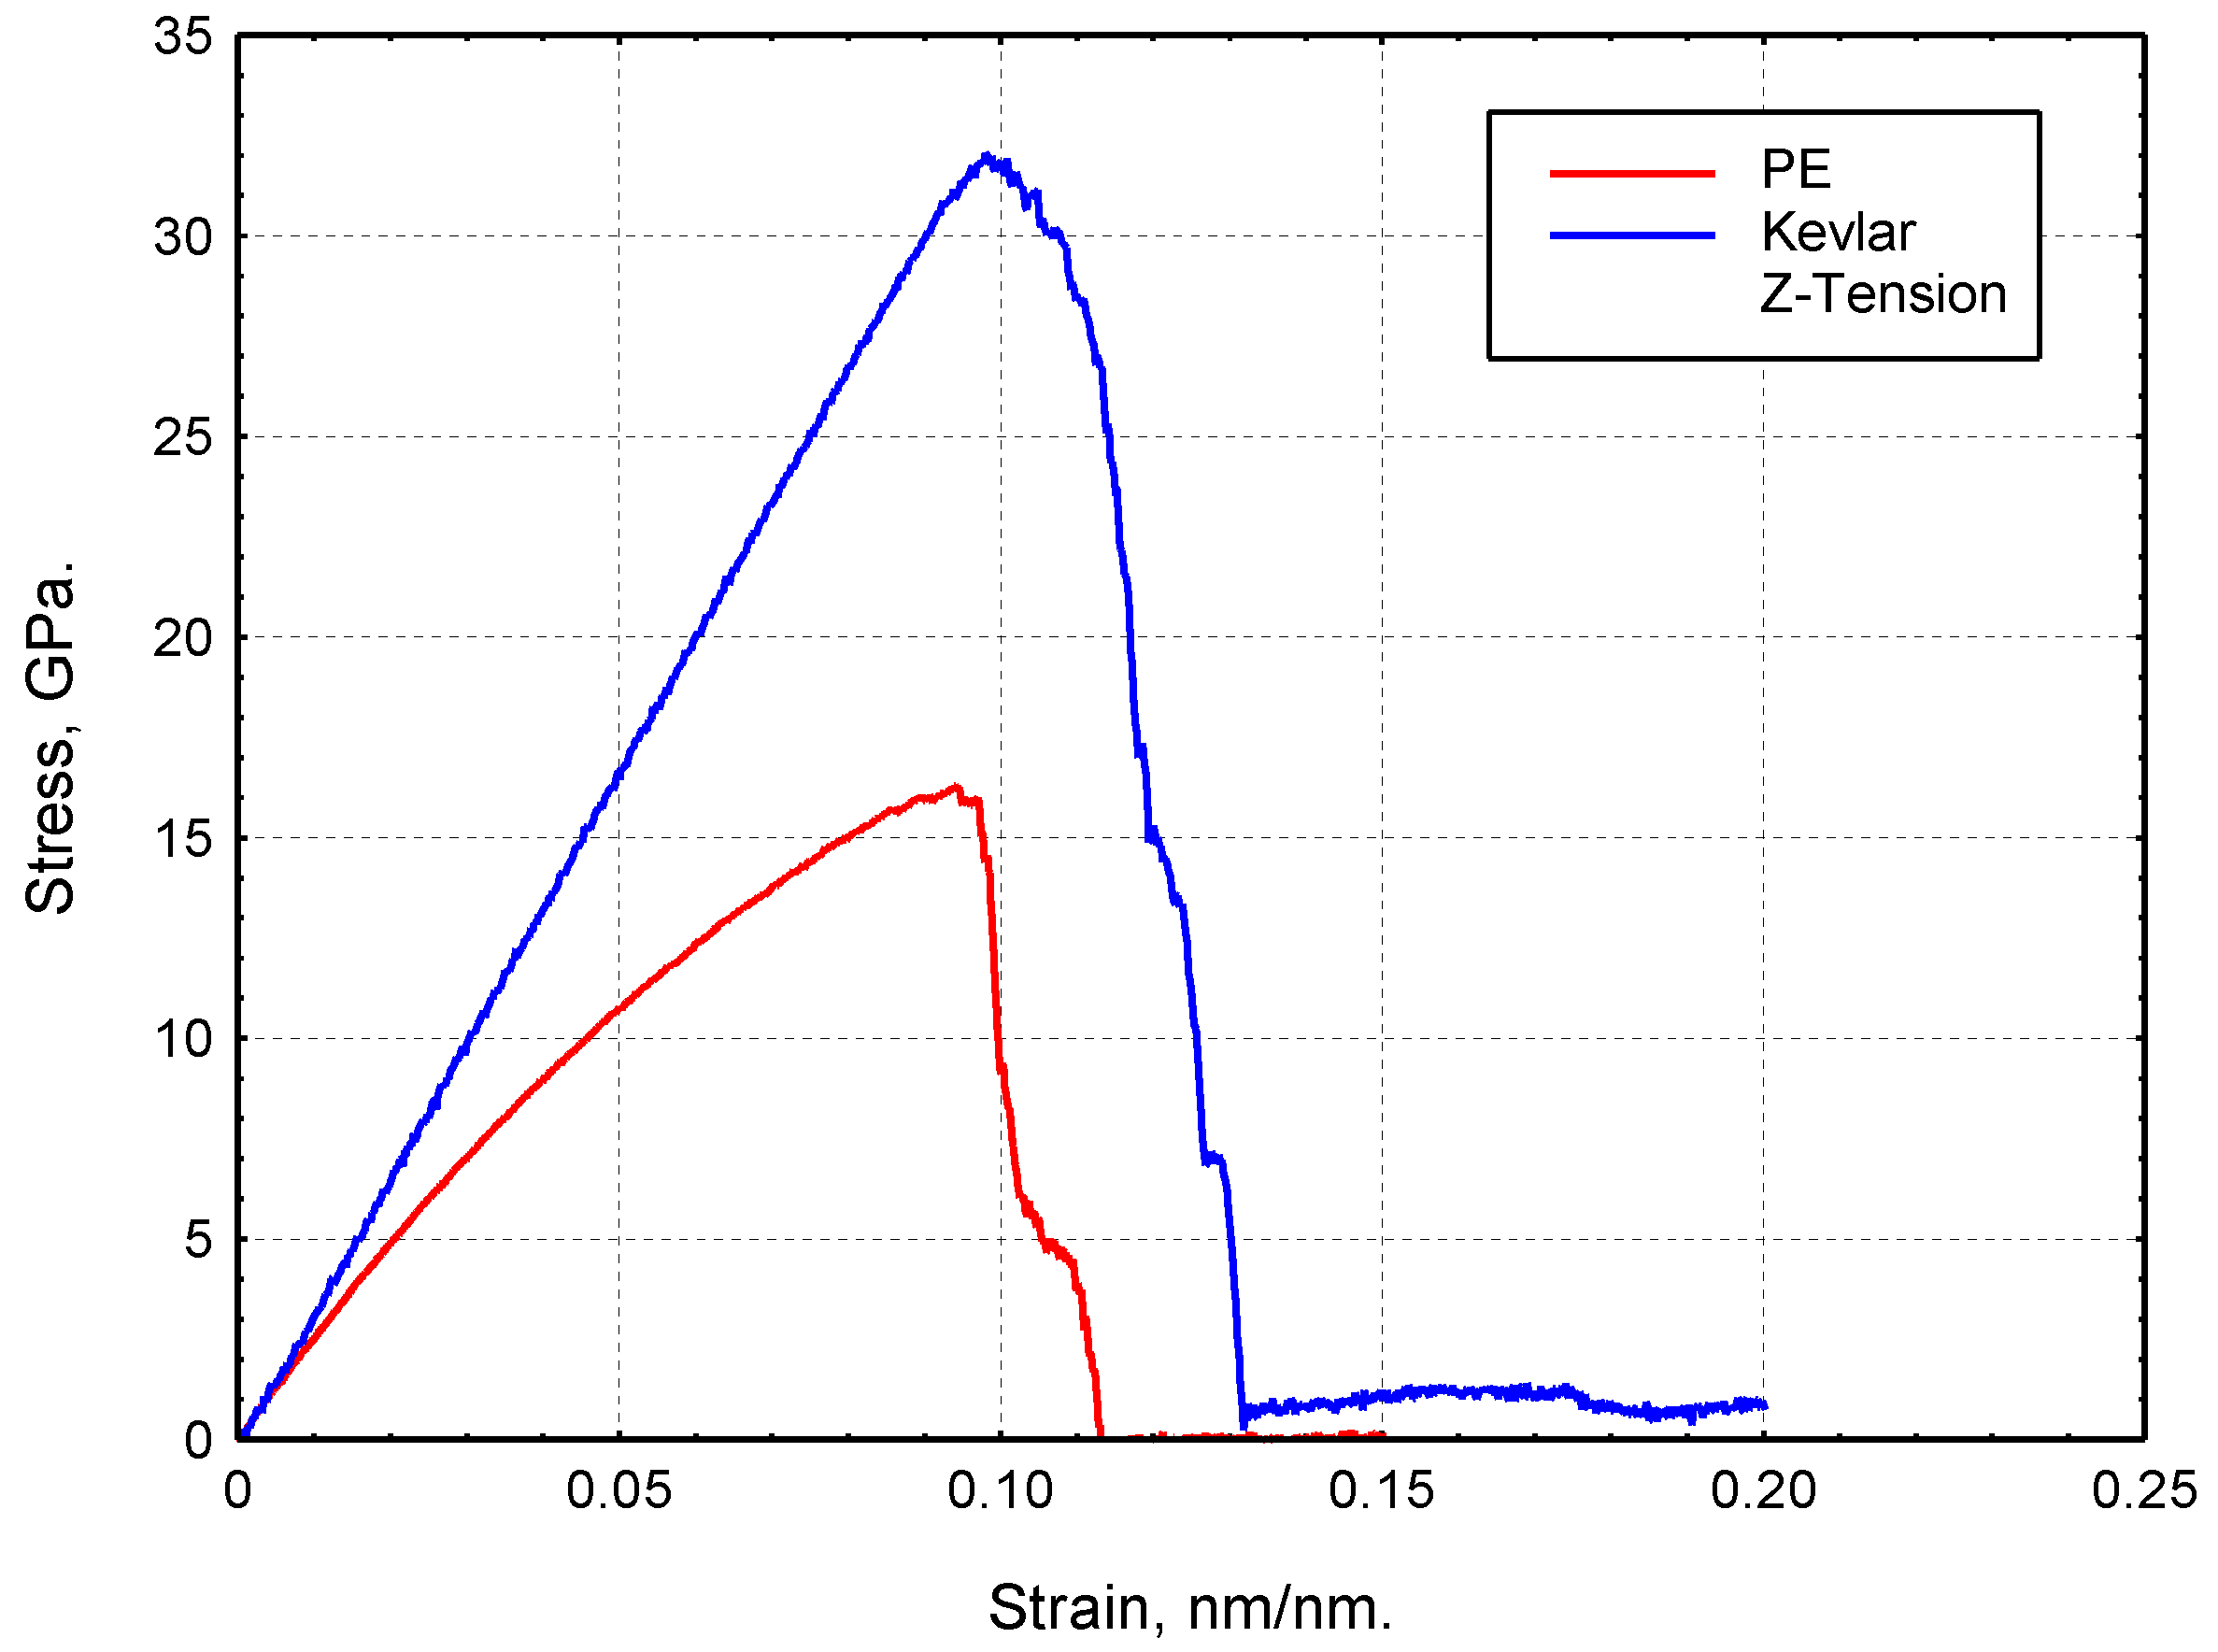
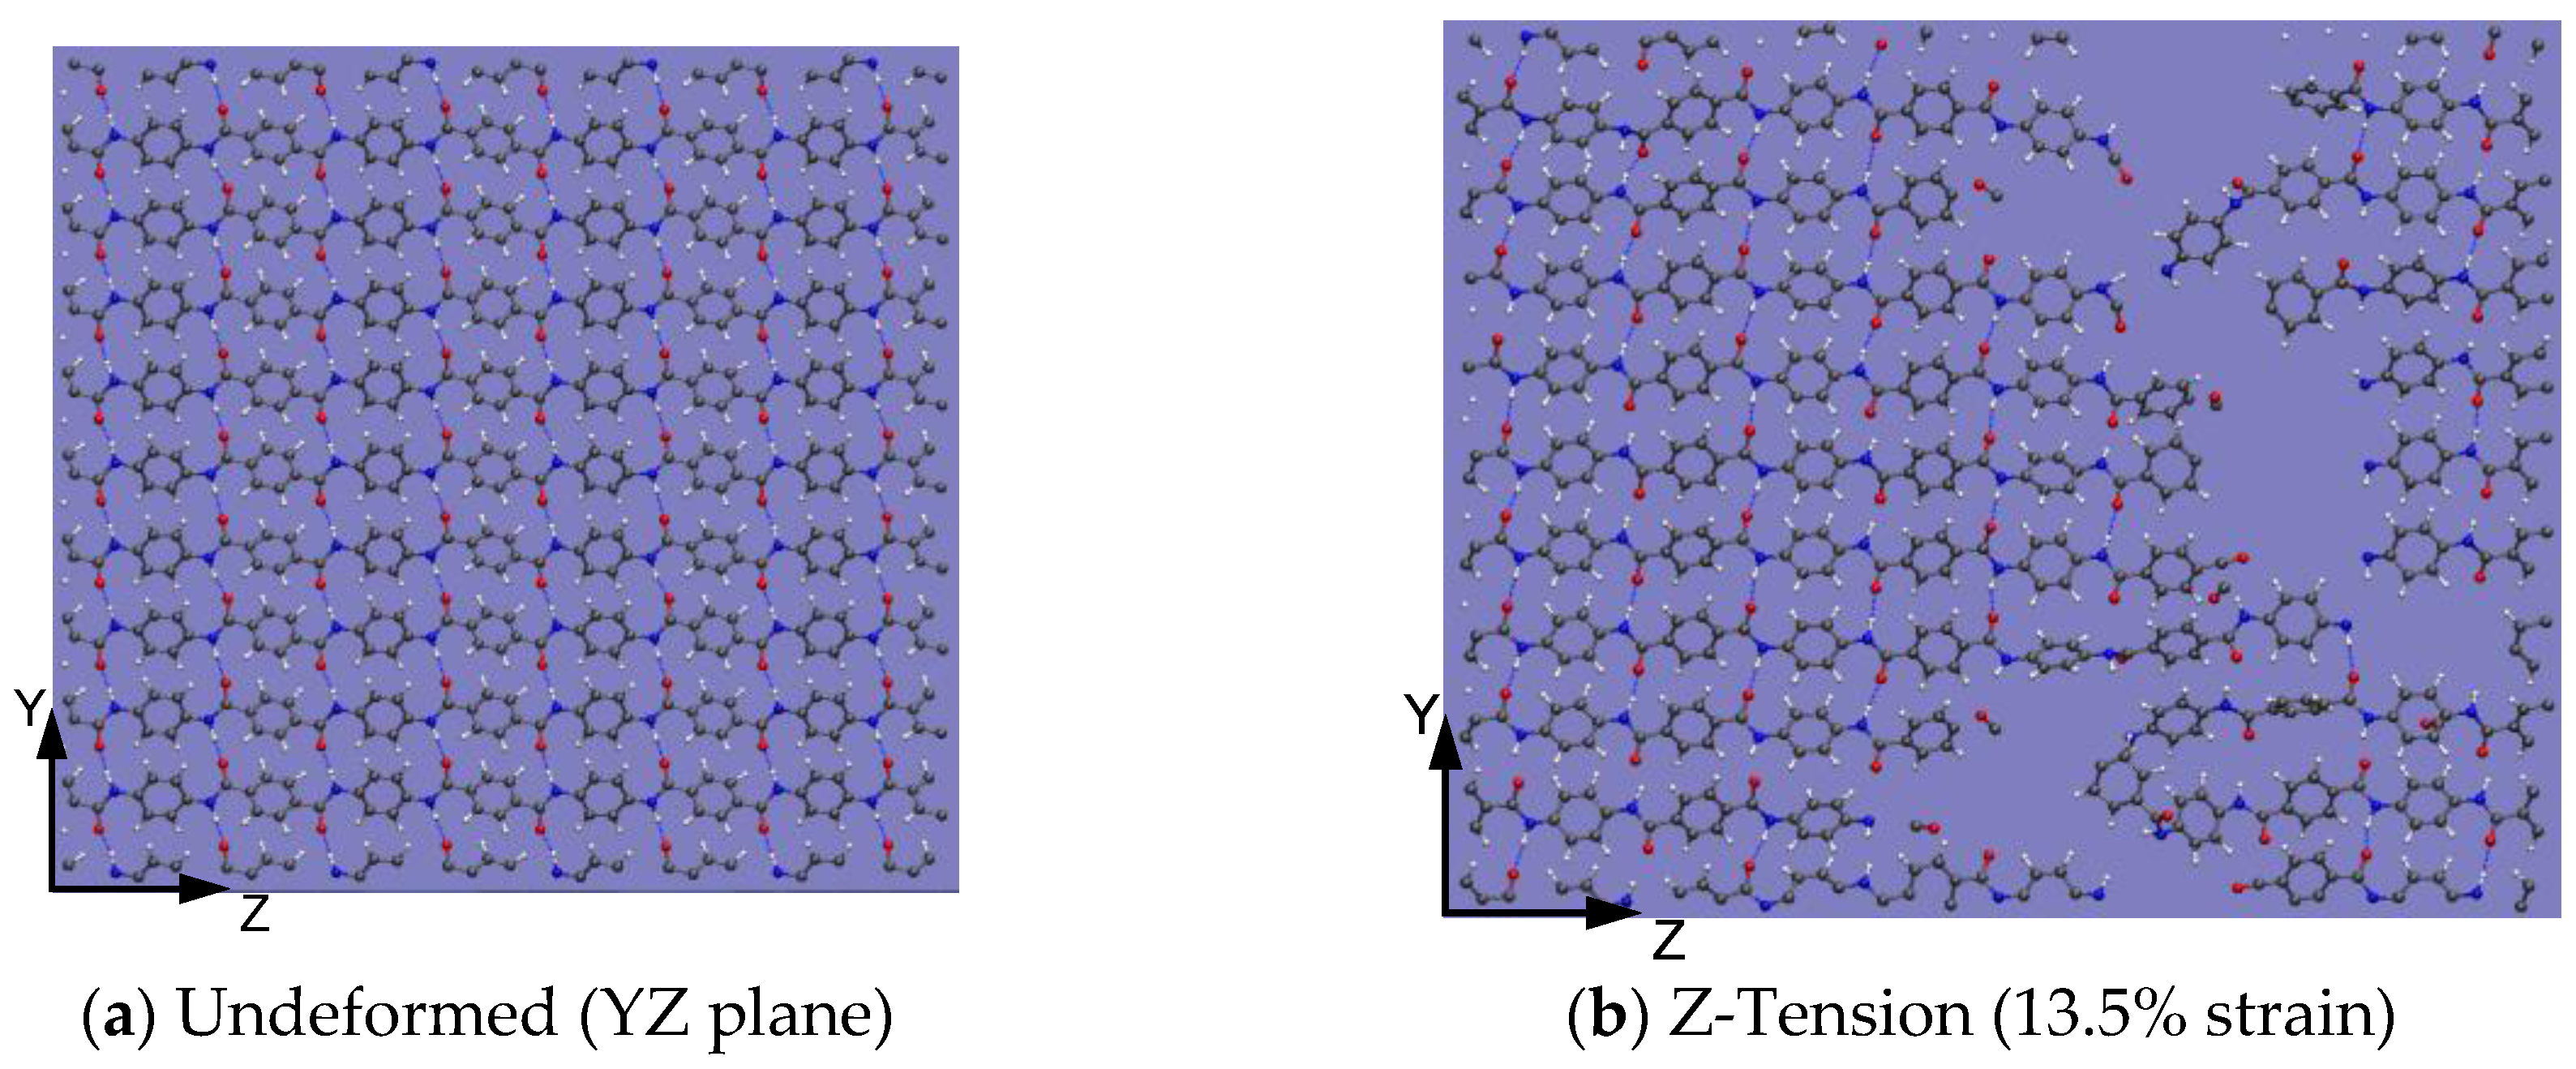
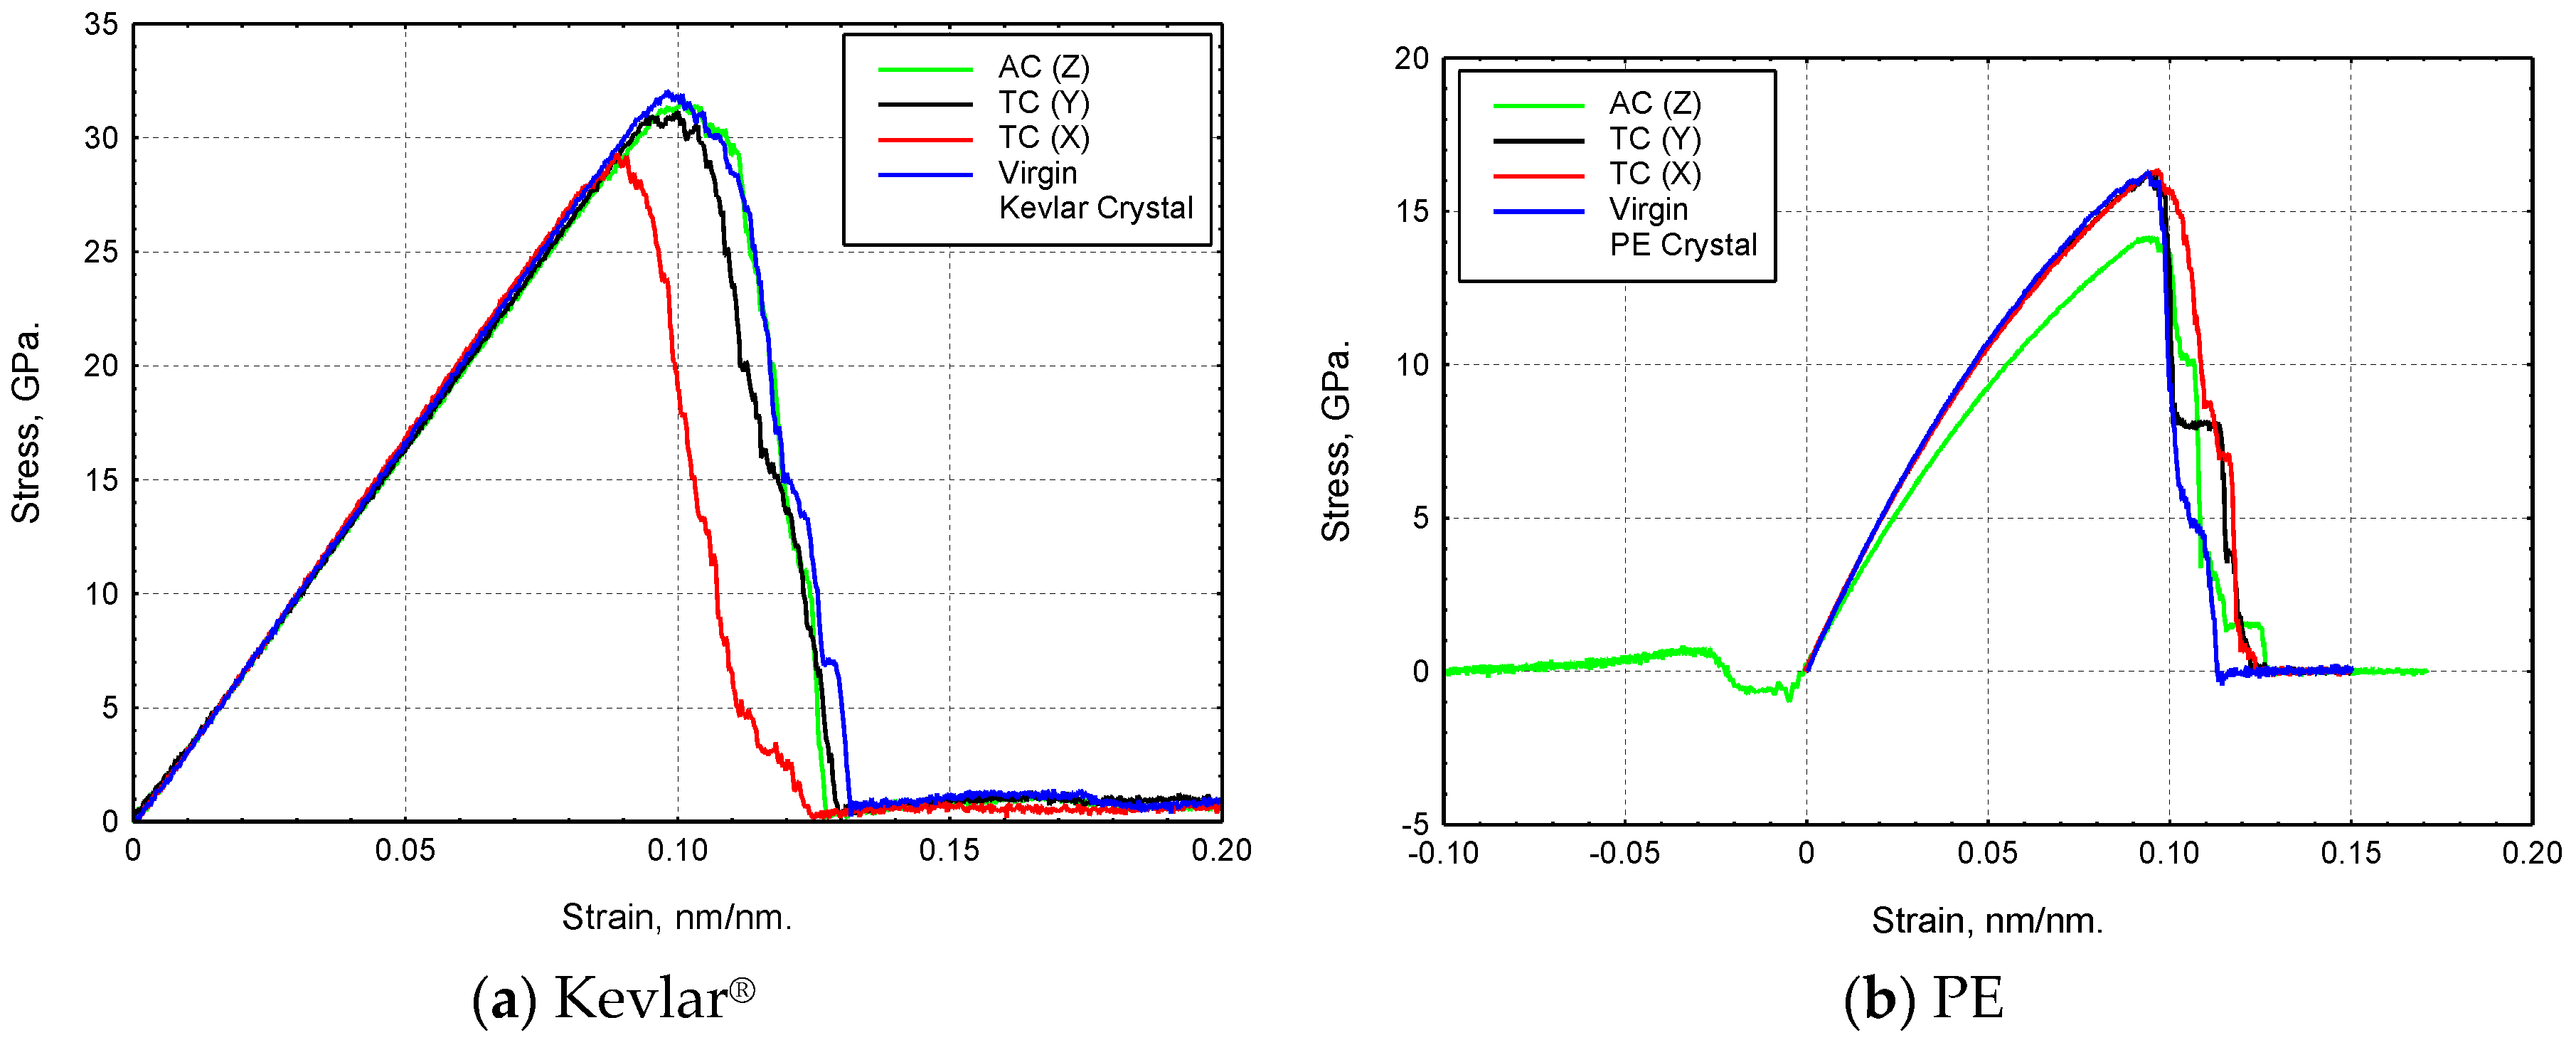
4.1. Mechanical Properties of the Virgin Crystals

The densities of the relaxed Kevlar® and PE models predicted by ReaxFF and AIREBO force fields are 1.56 g/cc and 0.95 g/cc, which are in very good agreement with the experimental density of 1.48 g/cc for Kevlar® [3] and 0.91–0.97 g/cc for PE [8]. Figure 9 shows the tensile stress-strain responses of the Kevlar® and PE in the fiber direction (Z-direction) loading. Tensile stress-strain responses in the transverse direction loading are shown in Figure 10. The strength values are determined from the peak value of the stress-strain curves. To determine the modulus, linear regression of the stress-strain curves is performed in the strain range 0 < ε < 0.01.
Tensile modulus and strength values obtained from the stress-strain responses are presented in Table 2. MD simulations results shows that Kevlar® has higher tensile modulus and tensile strength than PE, consistent with experimental observations [16,42]. While PE is isotropic in the transverse directions (i.e., in the X and Y directions), Kevlar® is anisotropic in the transverse directions. This is due to the presence of hydrogen bonds in one transverse direction (here in Y direction) in Kevlar®. The Z-direction (i.e., axial) tensile modulus and X-direction tensile modulus of Kevlar® obtained from the present simulation are in good agreement with previous simulation values of 303 GPa and 13 GPa, respectively, obtained by Rutledge et al. [20] in their atomistic simulations. The axial modulus obtained from the present simulation is very close to that (=320 GPa) reported by Mercer et al. [24] using ReaxFF. However, simulation modulus and strength values are much higher than the upper bound of the experimental modulus (~200 GPa) and strength (~4.0 GPa) values obtained for Kevlar® fibers [3]. This could be attributed to the low strain rate used in the experiments as well as other factors associated with the experimental fibers including the random orientation of crystals and different microstructural and topological defects. For PE, the axial modulus of 257 GPa in the Z-direction obtained from the present simulation is comparable with the experimental and simulation results, which are in the range of 235–300 GPa, reported in the literature [25,43,44,45]. The axial modulus of PE reported by O’Connor et al. [25] from MD simulation is 258 GPa, which is in excellent agreement with the present simulation value.
Figure 11, Figure 12, Figure 13 and Figure 14 show the snapshots of damage for Kevlar® and PE under transverse and axial tension. In transverse tension, non-bonded interaction and hydrogen bonding interaction (in the case of Kevlar®) become weaker with large strain. As a result, chains separate and rotate, and the cystal loses its structural integrity. Under axial tension, damage initiates through covalent bond breakages (Figure 12b and Figure 14).

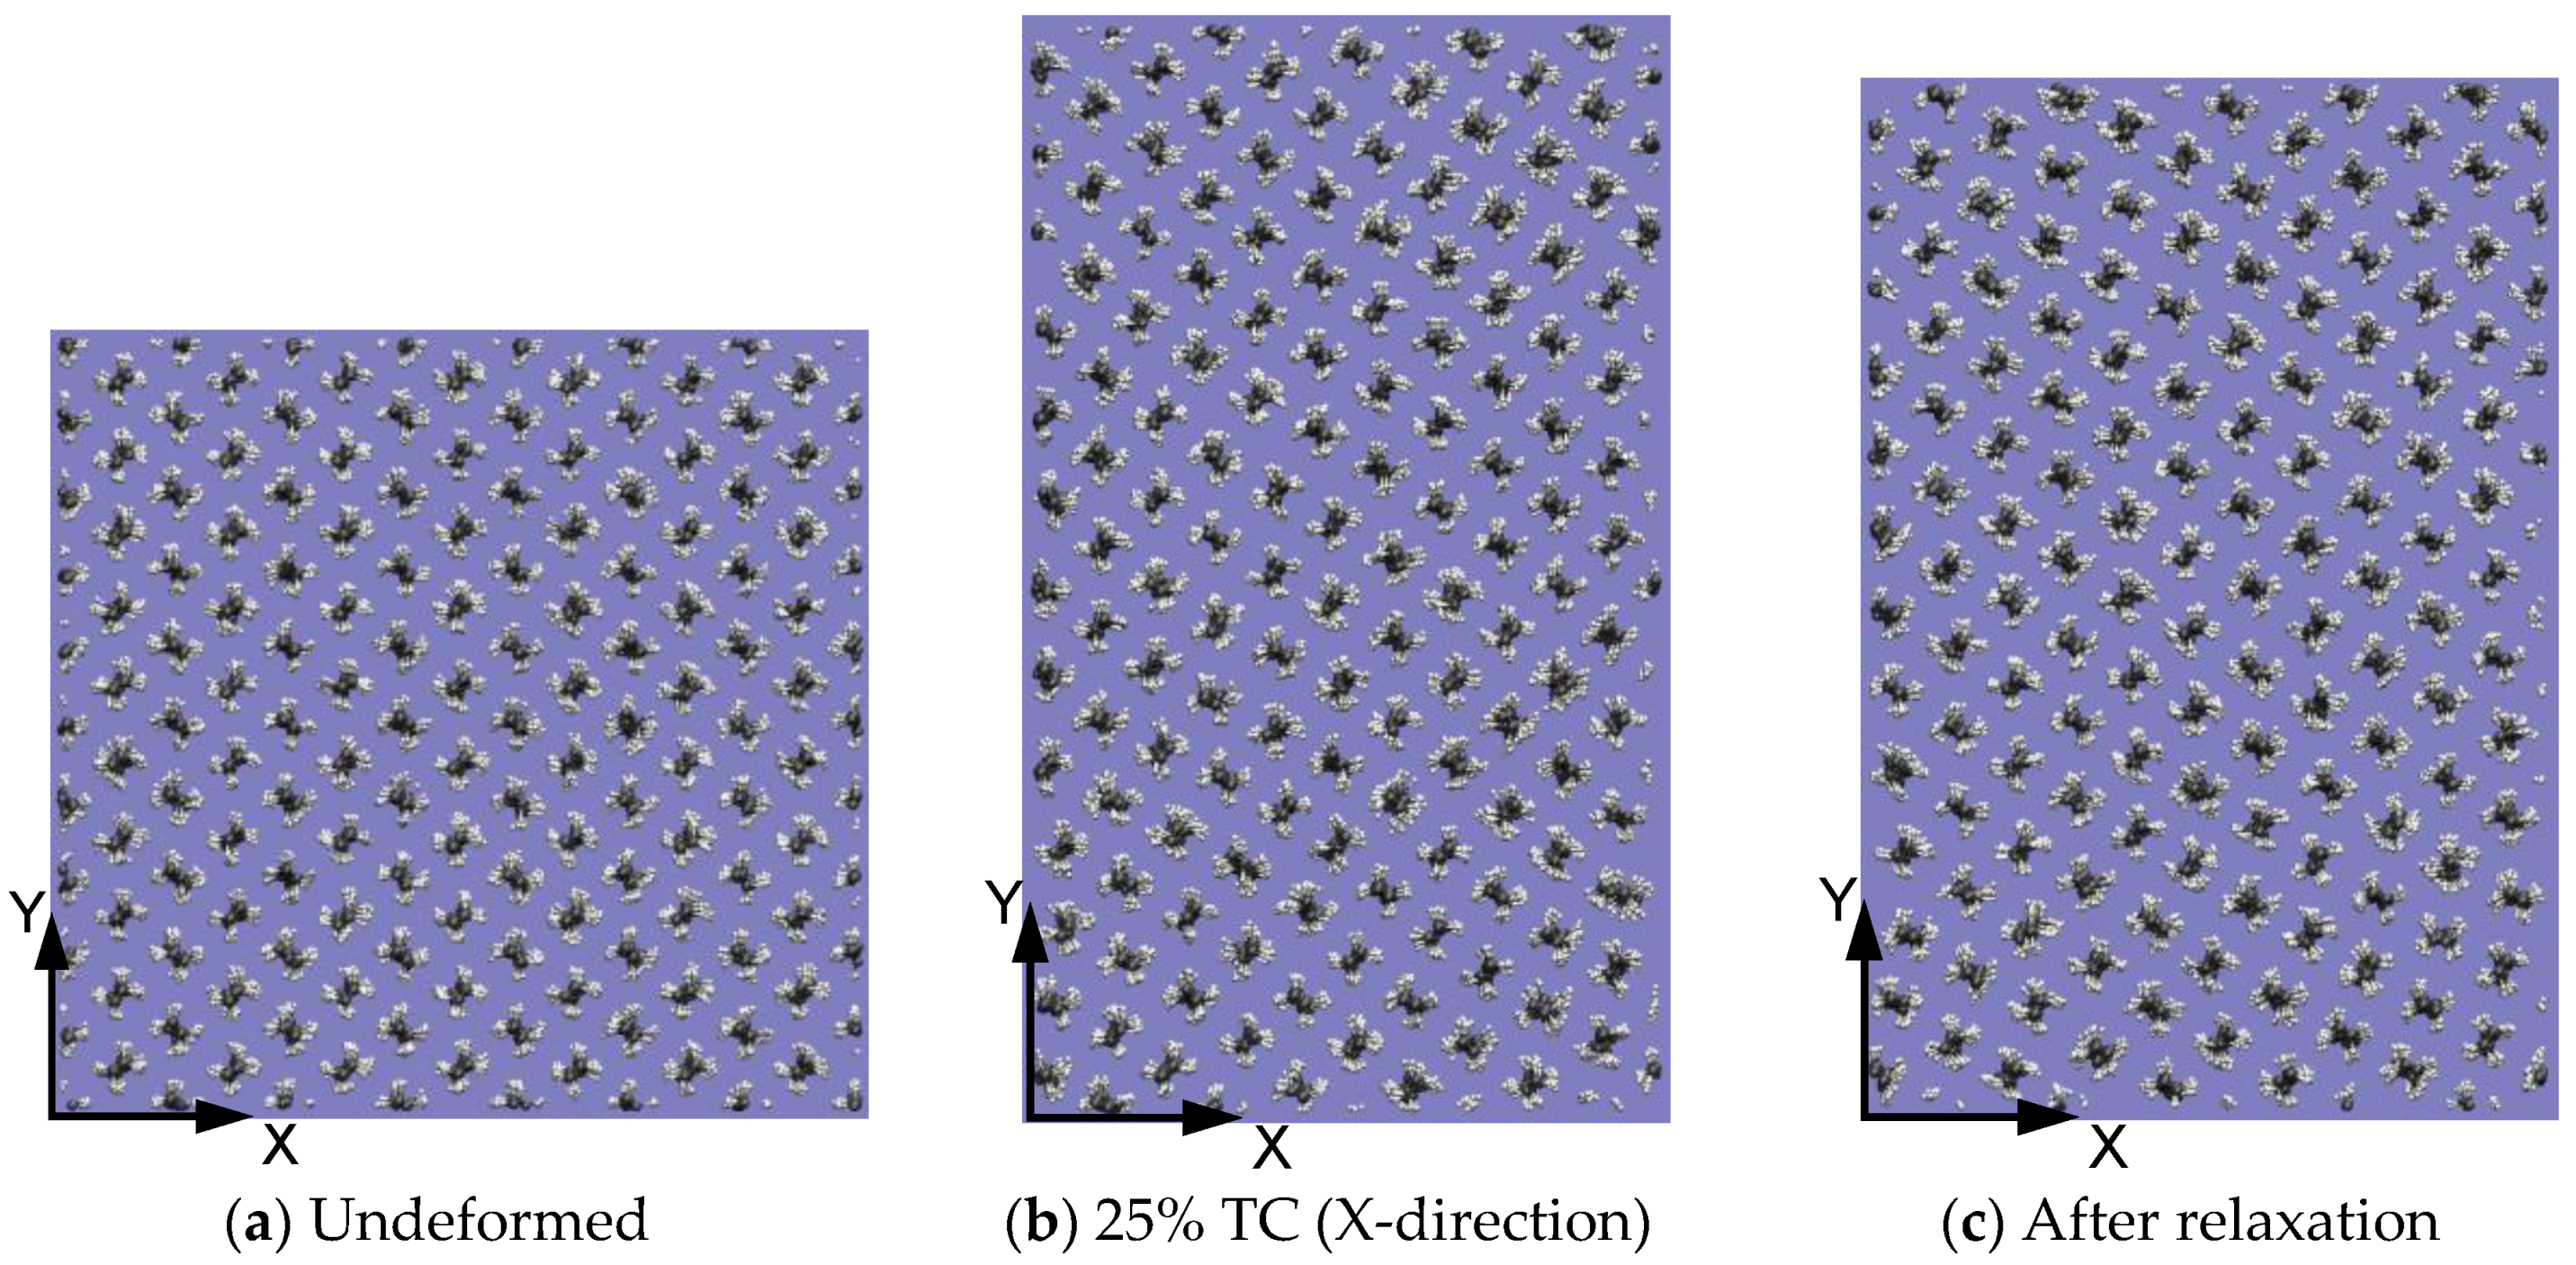
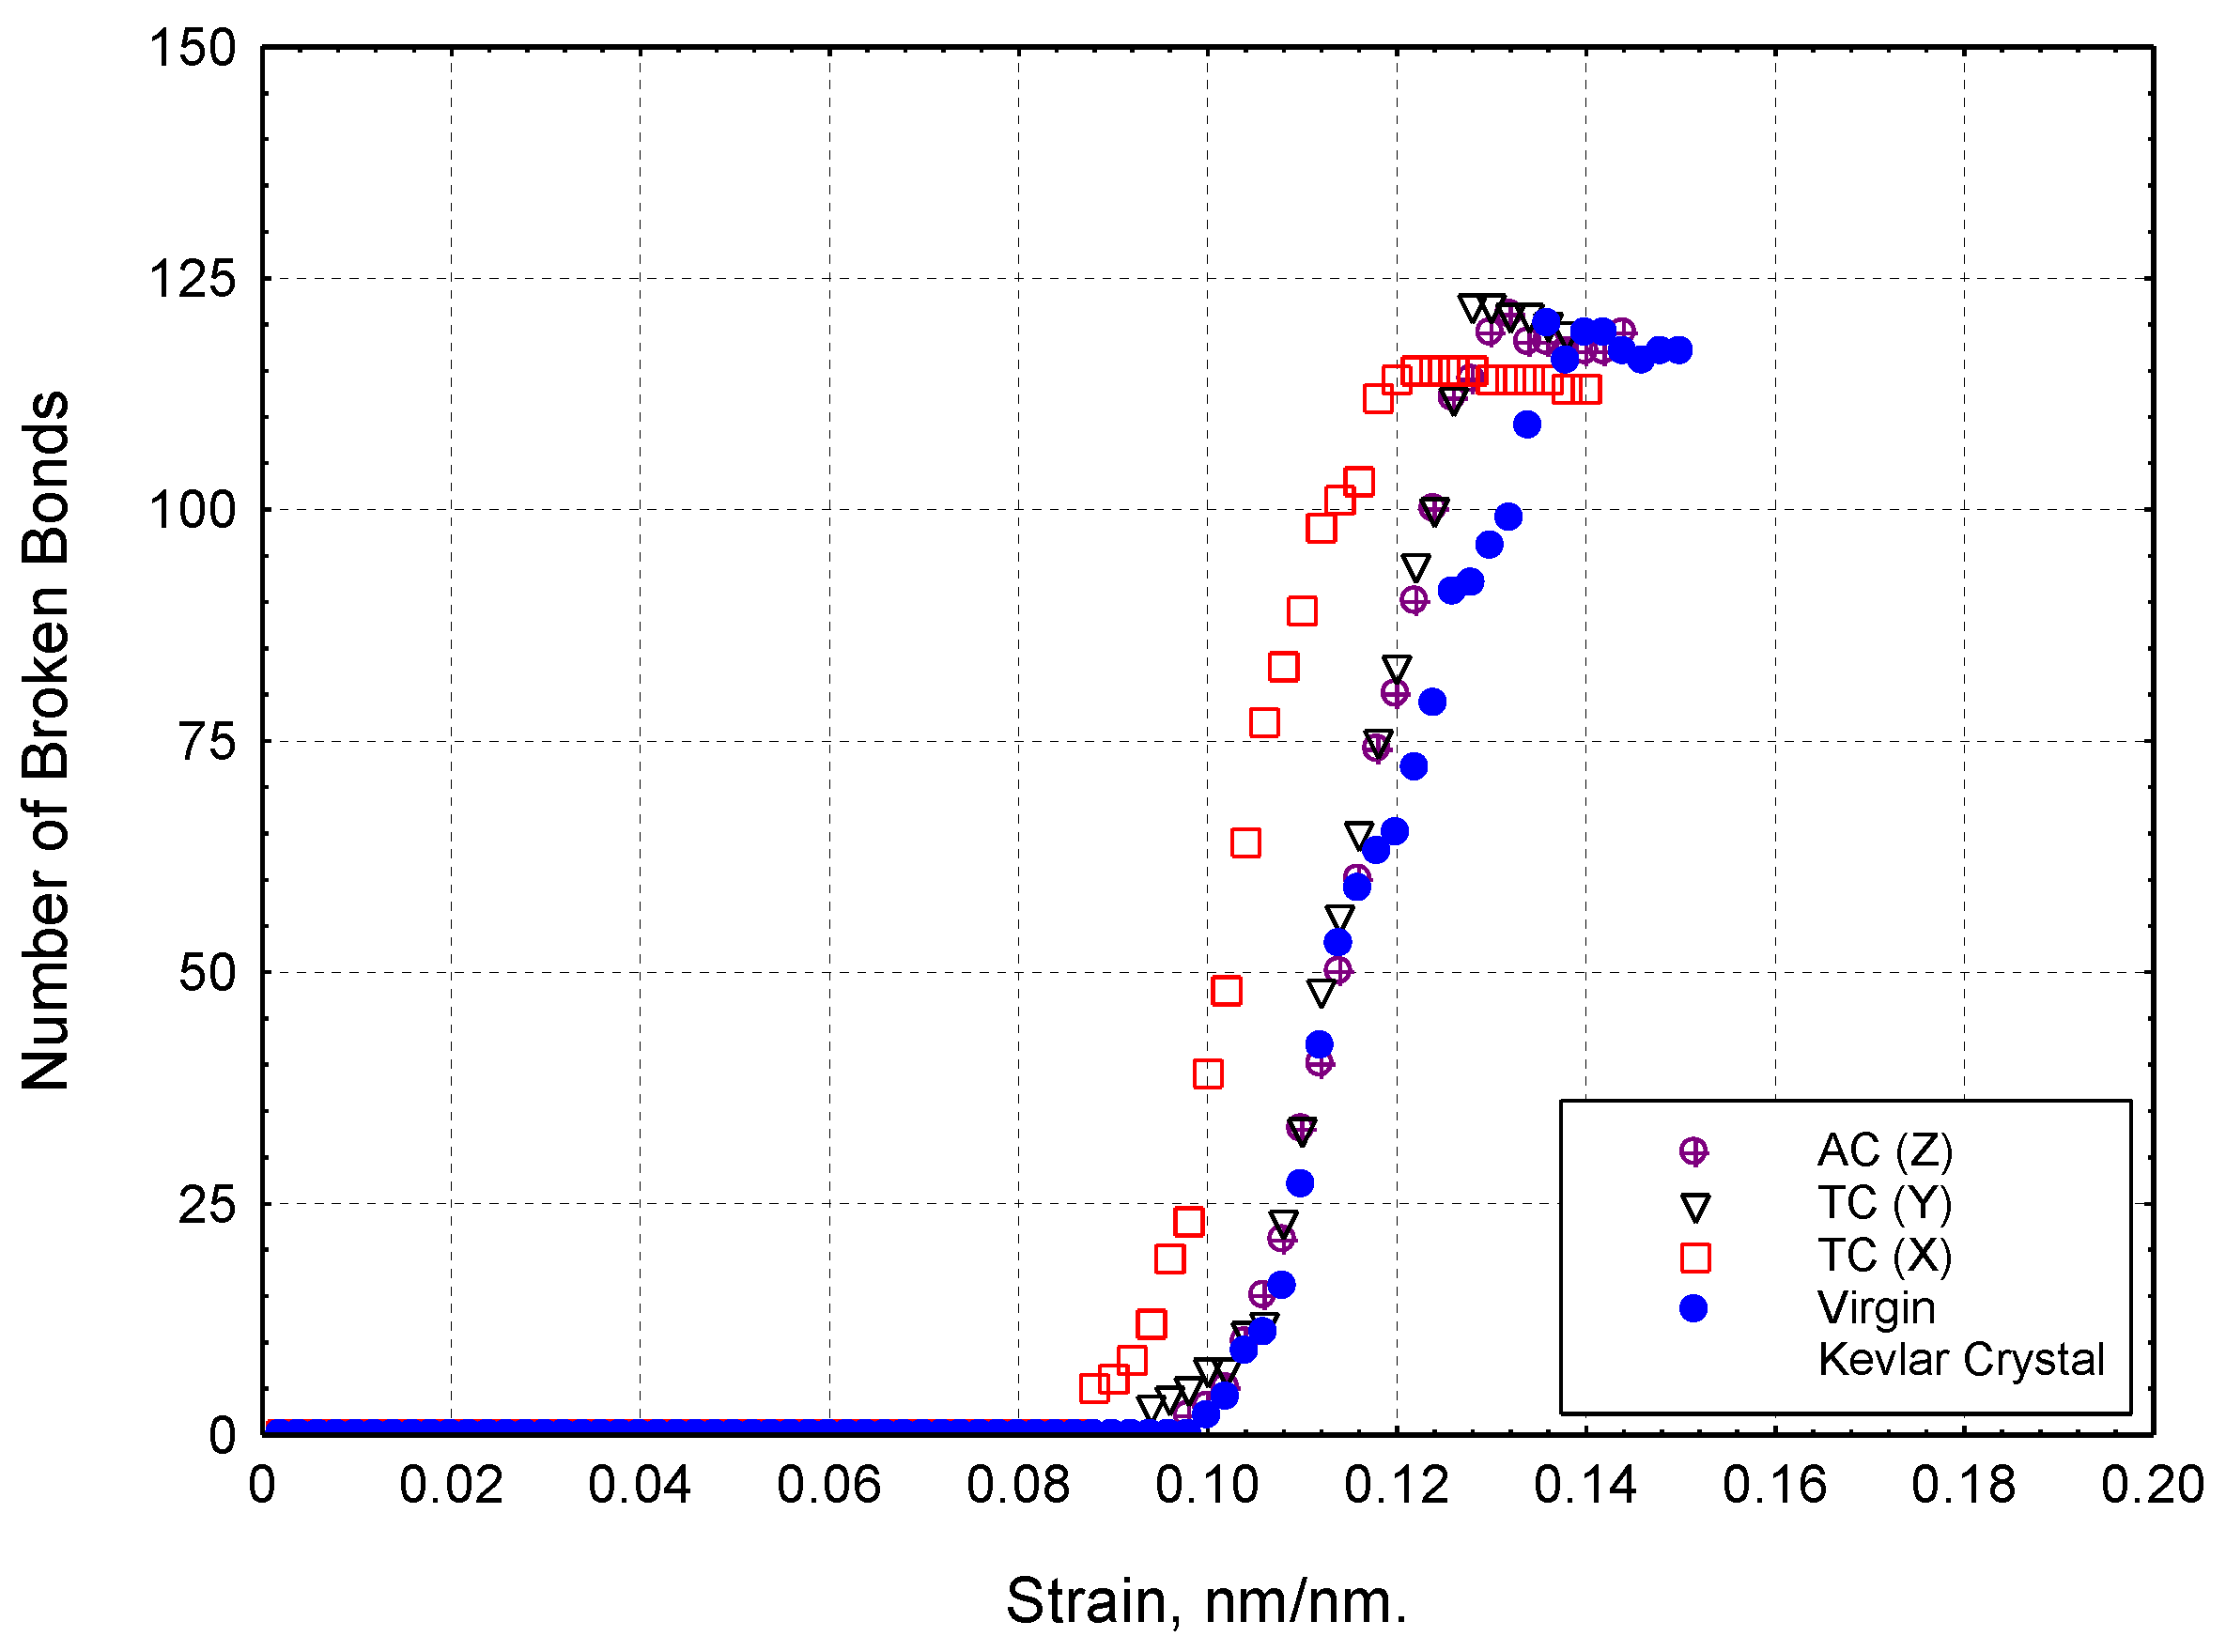
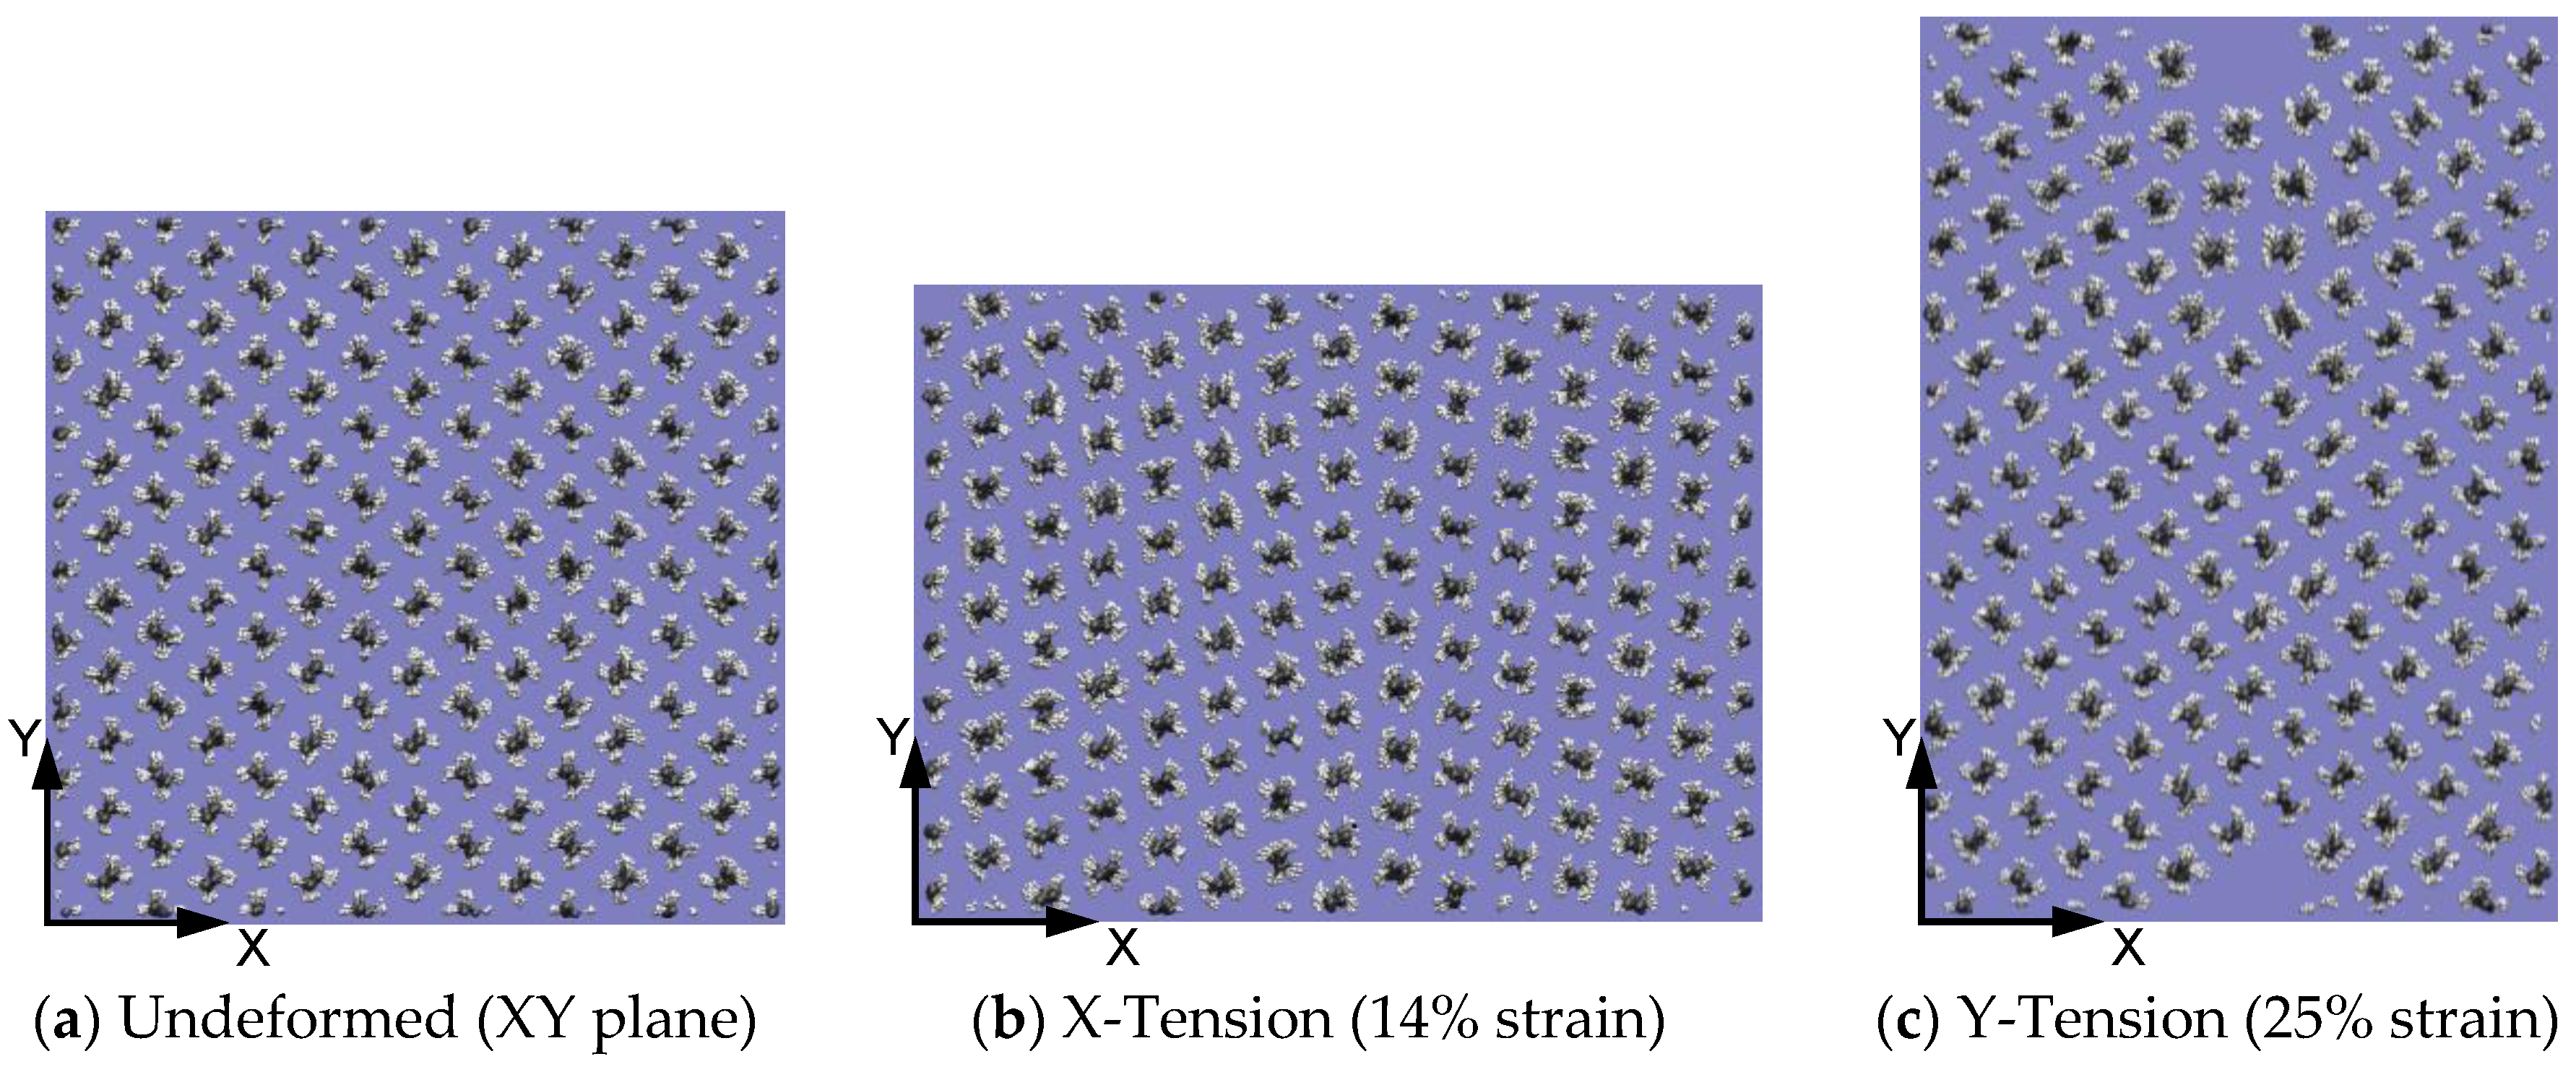
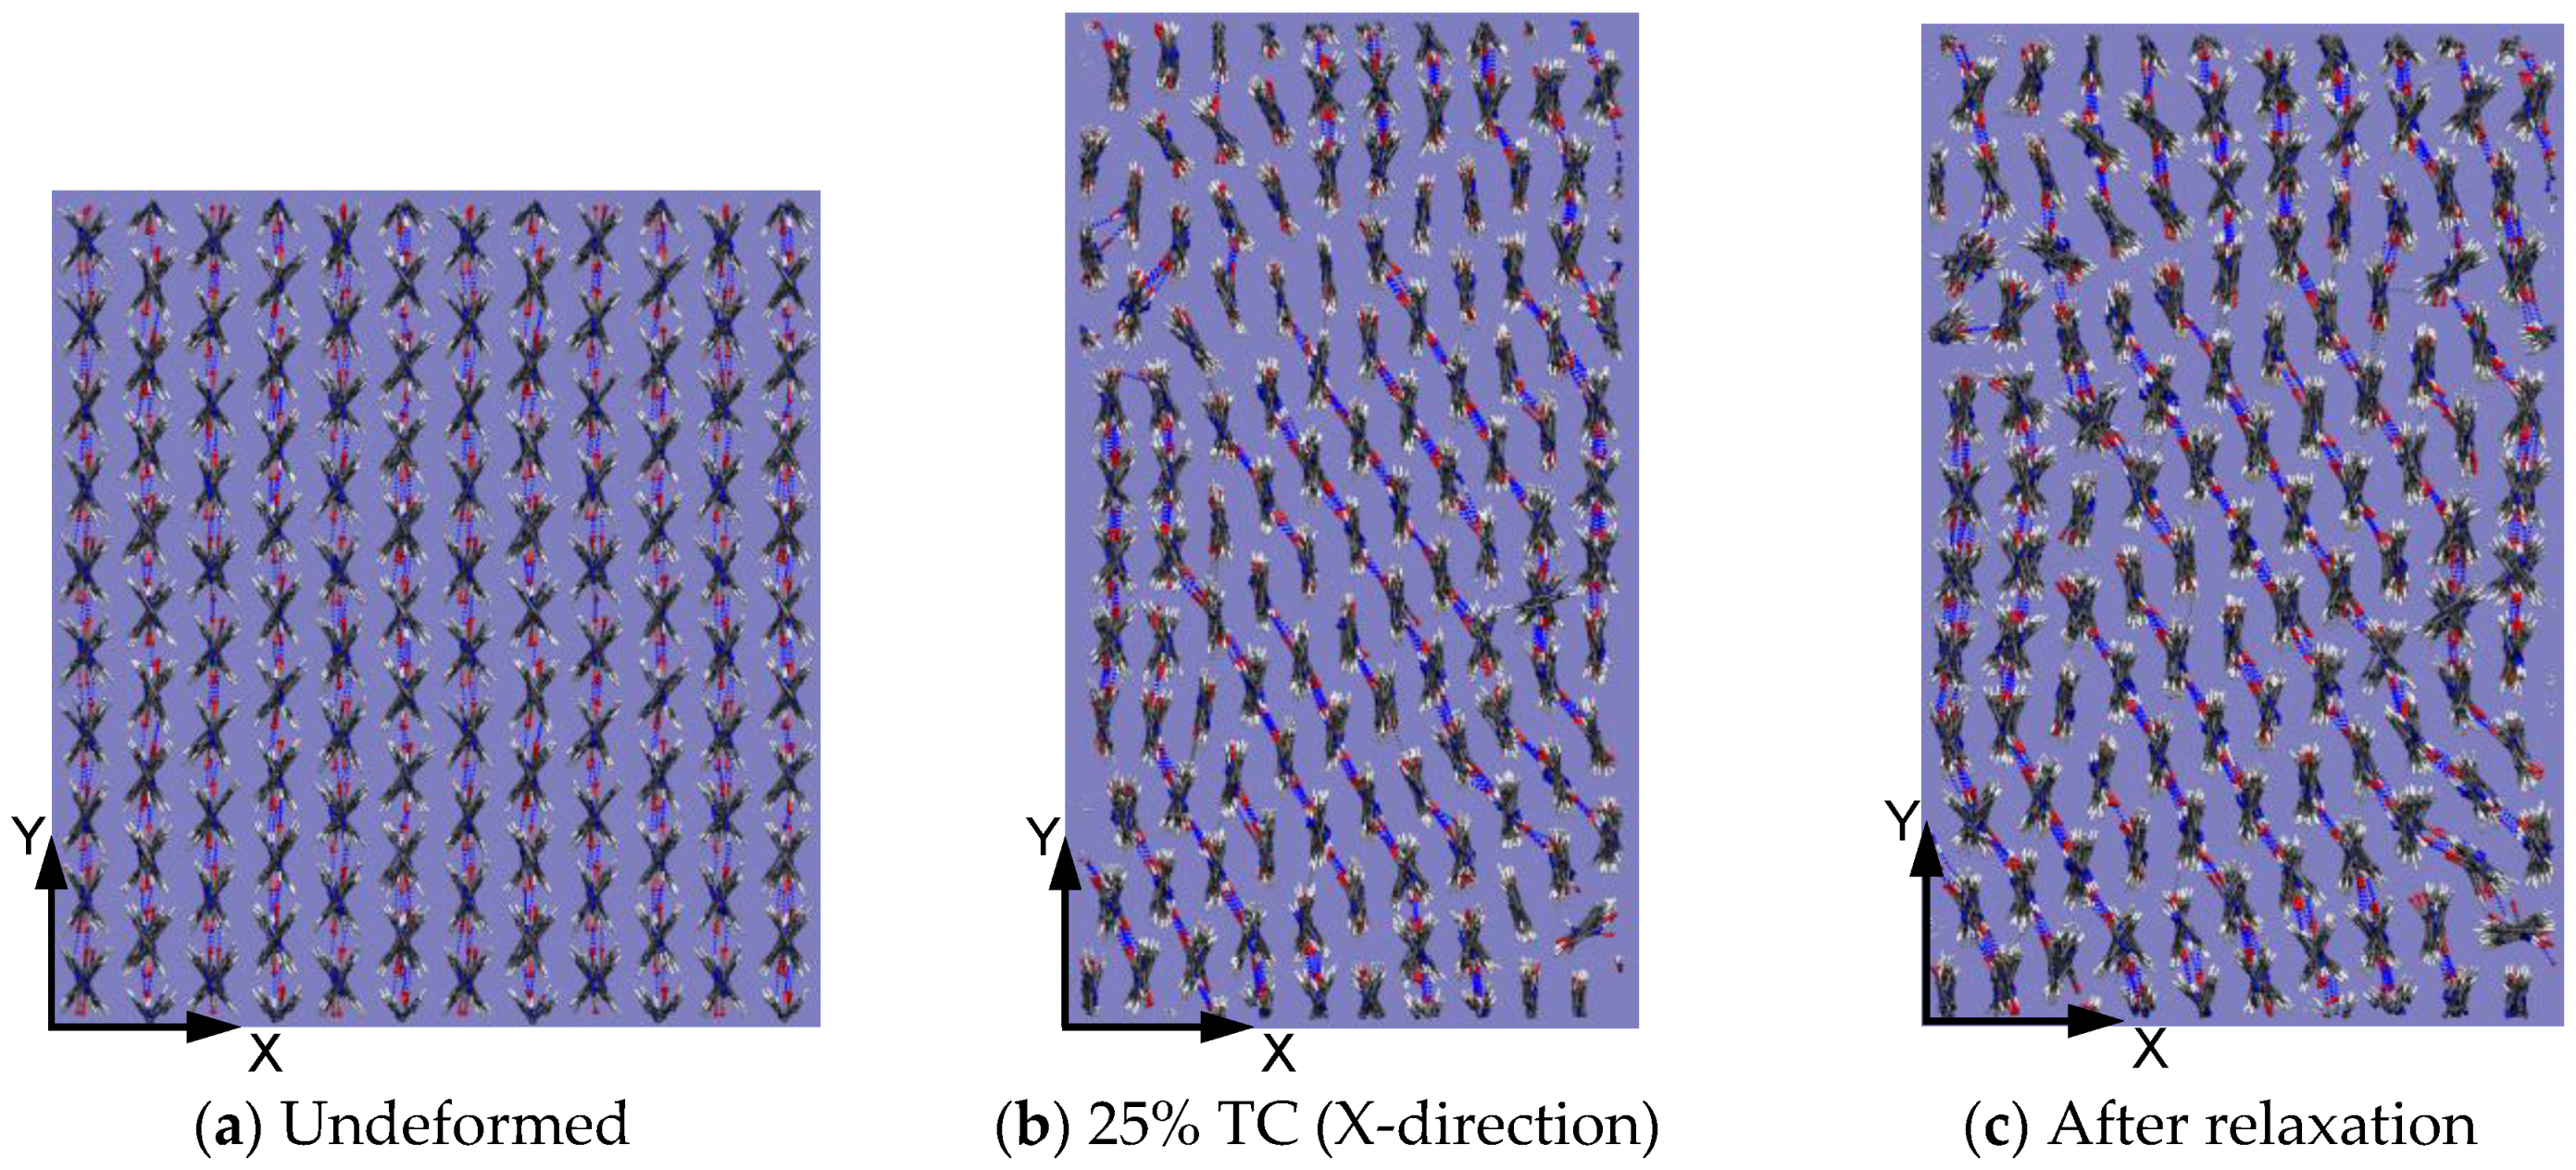
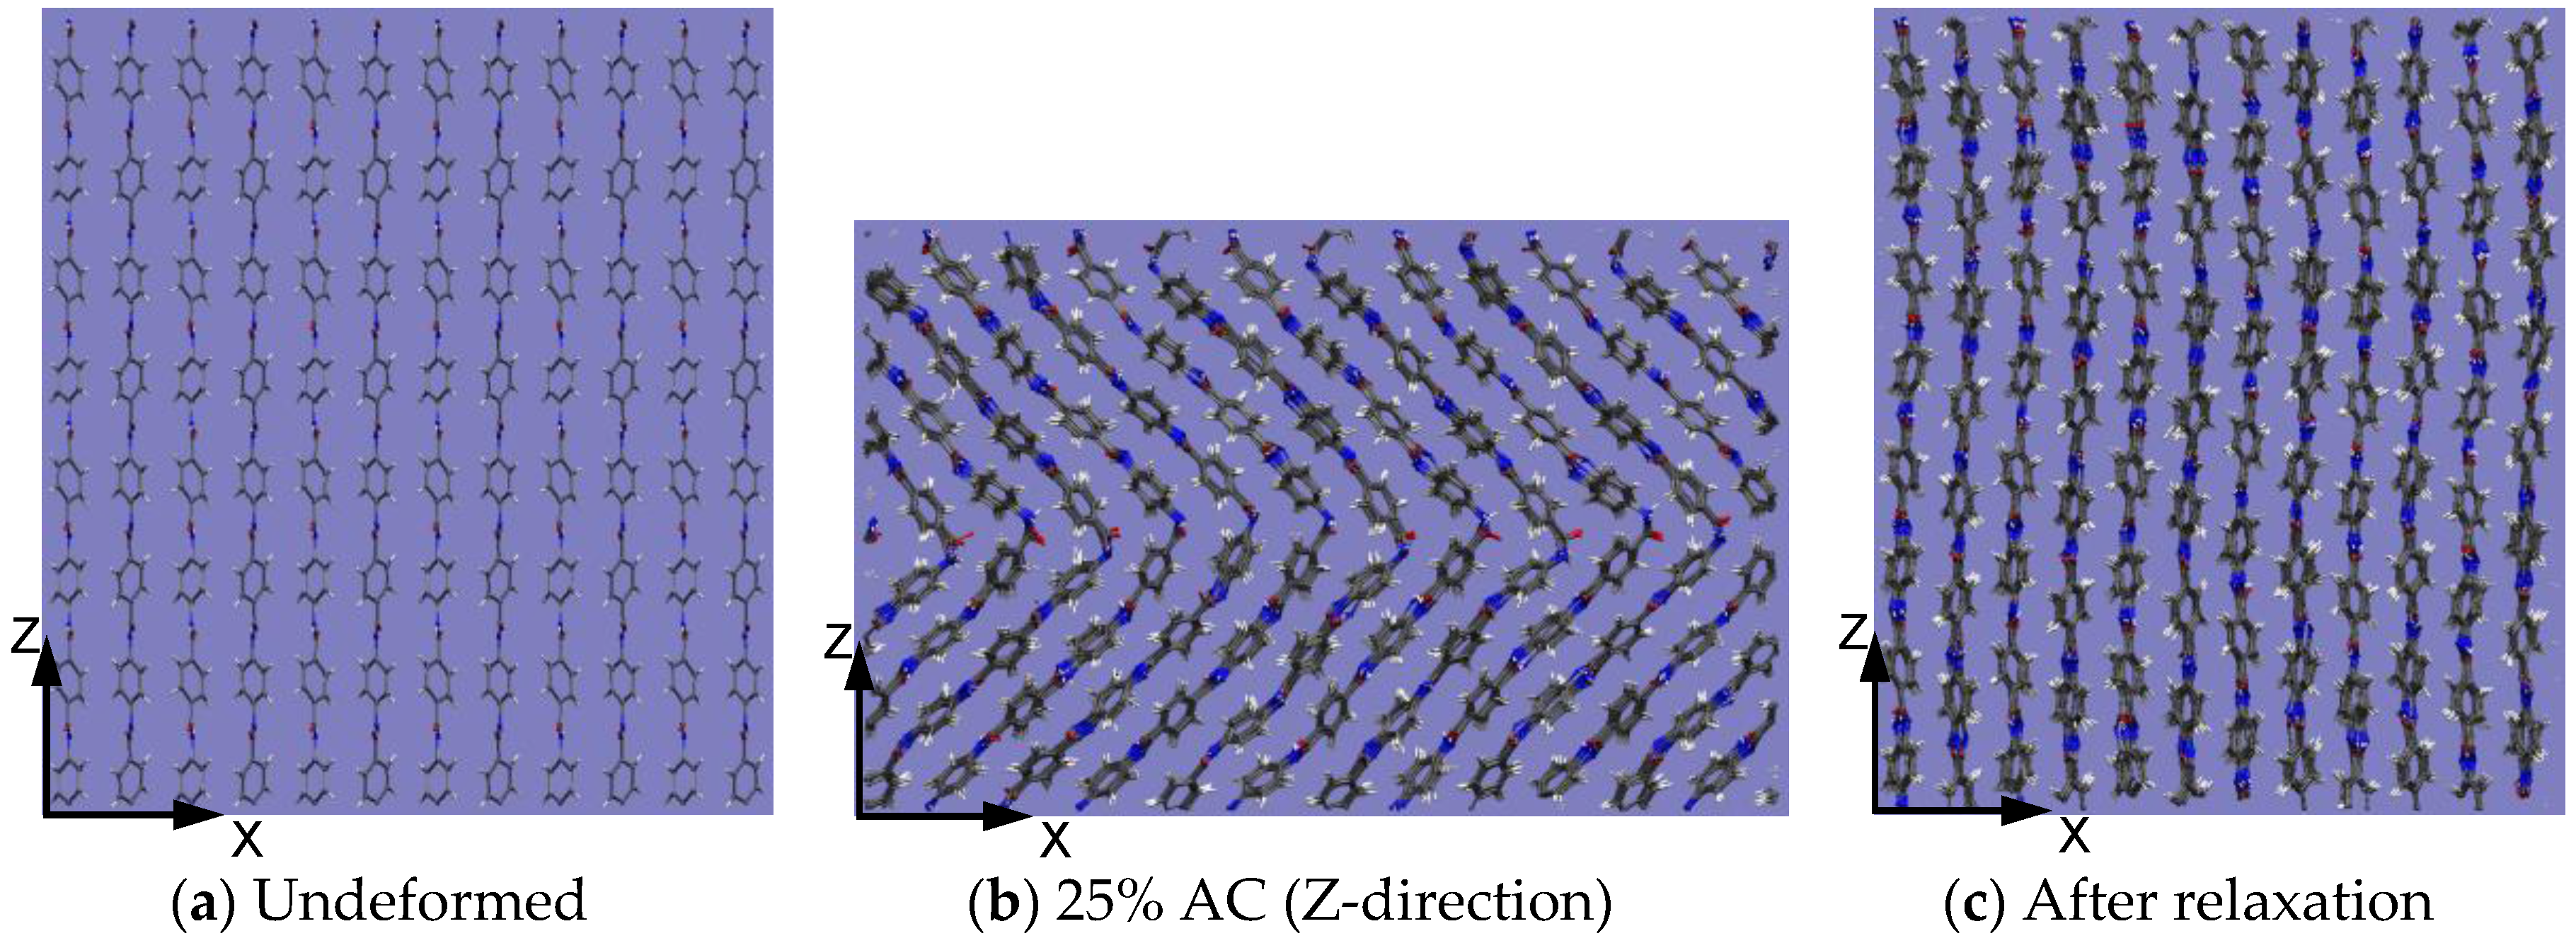
4.2. Mechanical Properties of the Pre-Compressed Crystals

To identify the effects of AC and TC on the axial tensile modulus and strength, Kevlar® and PE models are at first subjected to 25% axial and transverse compressive strain. This strain level is far beyond the elastic limit as indicted by the compressive stress-strain response (not reported here). Depending on the projectile radius and multiaxial loading angle, experimental ballistic fibers experience more than 18% AC strain [46]. During TC, the fibers are subjected to strains as high as 77% [19]. To have consistency with the experimental strain range, we chose 25% strain in both the AC and TC cases. The deformed models are relaxed for 60 ps for Kevlar® and 400 ps for PE to achieve an equilibrium state. Then the models are subjected to axial tension. Figure 15 shows the tensile stress-strain responses of the pre-compressed models along with the virgin models. Axially compressed PE crystal is more compliant (Figure 15b), and it starts to pick up load when the crystal chains become straight from their kinked form. Pre-compression reduces tensile modulus and strength leading to reduction factors up to 4% and 9% respectively for Kevlar®. For PE, significant reduction in the modulus and strength are observed in AC compared to TC loading. Tensile modulus and strength exhibit reduction factors of 19% and 12%, respectively, when the axially compressed crystal is subjected to an axial tensile load. To gain more insight into this reduction mechanism, we have analyzed the deformed crystal structure (Figure 16, Figure 17, Figure 18 and Figure 19). AC and TC change the crystal morphology by distorting the crystal structure through hydrogen bond breakages (in Kevlar®), weakening the non-bonded interactions and chain rotation. The model loses its structural integrity through the chain separation, which is analogous to fibrillation (i.e., splitting of fibers) observed in the fibers. Some distortions are recovered during relaxation following the compression. However, a sufficient amount of distortion remains in the structure (e.g., Figure 16c and Figure 19c). Pre-compression changes the energetics of the crystal structure. Significant change in the bonded and non-bonded interactions during compression results in covalent bond elongation and contraction (Figure 20). Elongated bonds in the pre-compressed crystal fail earlier (Figure 21) at lower tensile loads. As result, the mechanical performance of the models with pre-compression decrease can be quantified by reduction factors. The percent reduction in the axial tensile strength allows for comparison to experimental results [46]. It should be mentioned that, unlike perfect crystal, experimental fibers have other sorts of defects that could influence the failure strength and reduction factors under pre-compression.

5. Conclusions

All-atoms molecular dynamics (MD) simulations of Kevlar® and PE are carried out to understand the tensile property reduction mechanism under multi-axial loadings. Anisotropic properties predicted by the present simulations indicate that Kevlar® is stronger than PE. PE is found to be transversely isotropic, while Kevlar® is transversely anisotropic due to the presence of hydrogen bonds in one transverse direction. For multi-axial loadings, the models are first subjected to axial compression (AC) and transverse compression (TC) by 25% strain. The compressed models are relaxed to get an equilibrated structure, and then these are subjected to axial tension up to fracture. AC and TC change the crystal morphology by distorting the crystal structure through hydrogen bond breakages (in Kevlar®), weakening the non-bonded interactions and chain rotation. Though some distortions are recovered during relaxation following the compression, a sufficient amount of distortion remains in the structure, which reduces mechanical performance. Pre-compression reduces tensile modulus and tensile strength up to 4% and 9%, respectively, for Kevlar® and up to 19% and 12%, respectively, for PE. Experimentally, a reduction in the tensile failure strength of 7% is observed for Kevlar® KM2 fibers due to prior AC, whereas Kevlar® KM2 fibers subjected to a 60% nominal TC strains showed a 20% reduction in the average tensile strength compared to virgin fibers.

Acknowledgments

This research was sponsored by the Army Research Laboratory and was accomplished under Cooperative Agreement Number W911NF-12-2-0022. The views and conclusions contained in this document are those of the authors and should not be interpreted as representing the official policies, either expressed or implied, of the Army Research Laboratory or the U.S. Government. The U.S. Government is authorized to reproduce and distribute reprints for Government purposes, notwithstanding any copyright notation herein. S.S. acknowledges the help from Reid Bremble and Michael Carroll with the single fiber experiments. S.C.C. would like to thank Evan Martz for his help in MD models development and simulation data reduction.

Author Contributions

J.W.G.J. supervised S.C.C. who conducted molecular simulations and S.S. who conducted experiments. S.C.C., S.S. and J.W.G.J. contributed to data analysis and manuscript writing.

Conflicts of Interest

The authors declare no conflict of interest.

References

  1. Sockalingam, S.; Chowdhury, S.C.; Gillespie, J.W., Jr.; Keefe, M. Recent advances in modeling and experiments of Kevlar ballistic fibrils, fibers, yarns and flexible woven textile fabrics—A review. Text. Res. J. 2016. [Google Scholar] [CrossRef]
  2. McAllister, Q.P.; Gillespie, J.W., Jr.; VanLandingham, M.R. The influence of surface microstructure on the scratch characteristics of Kevlar fibers. J. Mater. Sci. 2013, 48, 292–1302. [Google Scholar] [CrossRef]
  3. Yang, H.H. Kevlar Aramid Fiber; John Wiley & Sons: New York, NY, USA, 1991. [Google Scholar]
  4. Northolt, M.; van Aartsen, J. On the crystal and molecular structure of poly-(p-phenylene terephthalamide). J. Polym. Sci. Polym. Lett. Ed. 1973, 11, 333–337. [Google Scholar] [CrossRef]
  5. Northolt, M. X-ray diffraction study of poly (p-phenylene terephthalamide) fibres. Eur. Polym. J. 1974, 10, 799–804. [Google Scholar] [CrossRef]
  6. Tashiro, K.; Kobayashi, M.; Tadokoro, H. Elastic moduli and molecular structures of several crystalline polymers, including aromatic polyamides. Macromolecules 1977, 10, 413–420. [Google Scholar] [CrossRef]
  7. Avitable, G.; Napolitano, R.; Pirozzi, B. Low temperature crystal structure of polyethylene: Results from a neutron diffraction study and from potential energy calculations. J. Polym. Sci. B 1975, 13, 351–355. [Google Scholar] [CrossRef]
  8. Peacock, A.J. Handbook of Polyethylene: Structures, Properties and Applications; Marcel Dekker, Inc.: New York, NY, USA, 2000. [Google Scholar]
  9. McDaniel, P.B.; Deitzel, J.M.; Gillespie, J.W. Structural hierarchy and surface morphology of highly drawn ultra high molecular weight polyethylene fibers studied by atomic force microscopy and wide angle X-ray diffraction. Polymer 2015, 69, 148–158. [Google Scholar] [CrossRef]
  10. Hudspeth, M.; Li, D.; Spatola, J.; Chen, W.; Zheng, J. The effects of off-axis transverse deflection loading on the failure strain of various high-performance fibers. Text. Res. J. 2015. [Google Scholar] [CrossRef]
  11. Sockalingam, S.; Gillespie, J.W., Jr.; Keefe, M. Dynamic modeling of Kevlar KM2 single fiber subjected to transverse impact. Int. J. Solids Struct. 2015, 67–68, 297–310. [Google Scholar] [CrossRef]
  12. Sockalingam, S.; Gillespie, J.W., Jr.; Keefe, M. Modeling the fiber length-scale response of Kevlar KM2 yarn during transverse impact. Text. Res. J. 2016. [Google Scholar] [CrossRef]
  13. Tan, V.; Lim, C.; Cheong, C. Perforation of high-strength fabric by projectiles of different geometry. Int. J. Impact Eng. 2003, 28, 207–222. [Google Scholar] [CrossRef]
  14. Bazhenov, S.; Dukhovskii, I.; Kovalev, P.; Rozhkov, A. The fracture of SVM aramide fibers upon a high-velocity transverse impact. Polym. Sci. Ser. A 2001, 43, 61–71. [Google Scholar]
  15. Greenhalgh, E.; Bloodworth, V.; Iannucci, L.; Pope, D. Fractographic observations on Dyneema® composites under ballistic impact. Compos. Part A 2013, 44, 51–62. [Google Scholar] [CrossRef]
  16. Sanborn, B.; DiLeonardi, A.M.; Weerasooriya, T. Tensile properties of Dyneema SK76 single fibers at multiple loading rates using a direct gripping method. J. Dyn. Behav. Mater. 2015, 1, 4–14. [Google Scholar] [CrossRef]
  17. Cheng, M.; Chen, W.; Weerasooriya, T. Mechanical properties of Kevlar® KM2 single fiber. J. Eng. Mater. Technol. 2005, 127, 197–203. [Google Scholar] [CrossRef]
  18. McDaniel, P.; Sockalingam, S.; Deitzel, J.; Gillespie, J.W., Jr.; Keefe, M.; Bogetti, T.A.; Weerasooriya, T.; Casem, D. The effect of fiber meso/nanostructure on the transverse compression response of ballistic fibers. Compos. Part A 2016, 94, 133–145. [Google Scholar] [CrossRef]
  19. Sockalingam, S.; Bremble, R.; Gillespie, J.W., Jr.; Keefe, M. Transverse compression behavior of Kevlar KM2 single fiber. Compos. Part A 2016, 81, 271–281. [Google Scholar] [CrossRef]
  20. Rutledge, G.C.; Suter, U.W. Calculation of mechanical properties of poly(para-phenylene terephthalamide) by atomistic modelling. Polymer 1991, 32, 2179–2189. [Google Scholar] [CrossRef]
  21. Grujicic, M.; Bell, W.C.; Glomski, P.S.; Pandurangan, B.; Yen, C.-F.; Cheeseman, B.A. Filament-level modeling of aramid-based high-performance structural materials. J. Mater. Eng. Perform. 2011, 20, 1401–1413. [Google Scholar] [CrossRef]
  22. Grujicic, M.; Yavari, R.; Ramaswami, S.; Snipes, J.S.; Yen, C.-F.; Cheeseman, B.A. Molecular-level study of the effect of prior axial compression/torsion on the axial-tensile strength of PPTA fibers. J. Mater. Eng. Perform. 2013, 22, 3269–3287. [Google Scholar] [CrossRef]
  23. Yilmaz, D.E. Modeling failure mechanisms of poly(p-phenylene terephthalamide) fiber using reactive potentials. Comput. Mater. Sci. 2015, 109, 183–193. [Google Scholar] [CrossRef]
  24. Mercer, B.S. Molecular Dynamics Modeling of PPTA Crystals in Aramid Fibers. Ph.D. Thesis, University of California, Berkeley, CA, USA, 19 May 2016. [Google Scholar]
  25. O’Connor, T.C.; Robbins, M.O. Chain ends and the ultimate strength of polyethylene fibers. ACS Macro Lett. 2016, 5, 263–267. [Google Scholar] [CrossRef]
  26. Sun, H. COMPASS: An ab initio force-field optimized for condensed-phase applications—Overview with details on alkane and benzene compounds. J. Phys. Chem. B 1998, 102, 7338–7364. [Google Scholar] [CrossRef]
  27. Liu, L.; Liu, Y.; Zybin, S.V.; Sun, H.; Goddard, W.A. ReaxFF-lg: Correction of the reaxFF reactive force field for london dispersion, with applications to the equations of state for energetic materials. J. Phys. Chem. A 2011, 115, 11016–11022. [Google Scholar] [CrossRef] [PubMed]
  28. Stuart, S.J.; Tutein, A.B.; Harrison, J.A. A reactive potential for hydrocarbons with intermolecular interactions. J. Chem. Phys. 2008, 12, 6472–6486. [Google Scholar] [CrossRef]
  29. Plimpton, S. Fast parallel algorithms for short range molecular dynamics. J. Comp. Phys. 1995, 117, 1–19. [Google Scholar] [CrossRef]
  30. Humphrey, W.; Dalke, A.; Schulten, K. VMD—Visual molecular dynamics. J. Molec. Graph. 1996, 14, 33–38. [Google Scholar] [CrossRef]
  31. Andres, L.A.; Deitzel, J.M.; Gillespie, J.W., Jr. Compressive strength analysis for high performance fibers with different modulus in tension and compression. J. Compos. Mater. 2009, 43, 661–674. [Google Scholar]
  32. Sockalingam, S.; Gillespie, J.W., Jr.; Keefe, M. On the transverse compression response of Kevlar KM2 using fiber-level finite element model. Int. J. Solids Struct. 2014, 51, 2504–2517. [Google Scholar] [CrossRef]
  33. Van Duin, A.C.T.; Dasgupta, S.; Lorant, F.; Goddard, W.A. ReaxFF: A reactive force field for hydrocarbons. J. Phys. Chem. A 2001, 105, 9396–9409. [Google Scholar] [CrossRef]
  34. ReaxFF Manual. Available online: http://www.engr.psu.edu/adri/ReaxffManual.aspx (accessed on 1 December 2016).
  35. Senftle, T.; Hong, S.; Islam, M.; Kylasa, S.B.; Zheng, Y.; Shin, Y.K.; Junkermeier, C.; Engel-Herbert, R.; Janik, M.; Aktulga, H.M.; et al. The ReaxFF reactive force-field: Development, applications, and future directions. npj Comput. Mater. 2016, 2, 15011. [Google Scholar] [CrossRef]
  36. Chowdhury, S.C.; Okabe, T. Computer simulation of carbon nanotube pull-out from polymer by the molecular dynamics method. Compos. Part A 2007, 38, 747–754. [Google Scholar] [CrossRef]
  37. Chowdhury, S.C.; Okabe, T.; Nishikawa, M. Effects of vacancy defects on the interfacial shear strength of carbon nanotube reinforced polymer composite. J. Nanosci. Nanotechnol. 2010, 10, 739–745. [Google Scholar] [CrossRef] [PubMed]
  38. Chowdhury, S.C.; Haque, B.Z.; Gillespie, J.W., Jr. Molecular simulations of the carbon nanotubes intramolecular junctions under mechanical loading. Comput. Mater. Sci. 2014, 82, 503–509. [Google Scholar] [CrossRef]
  39. Chowdhury, S.C.; Haque, B.Z.; Gillespie, J.W., Jr. Molecular dynamics simulations of the structure and mechanical properties of silica glass using reaxFF. J. Mater. Sci. 2016, 51, 10139–10159. [Google Scholar] [CrossRef]
  40. Clausius, R. On a mechanical theorem applicable to heat. Philos. Mag. 1870, 40, 122–127. [Google Scholar]
  41. Tsai, D.H. The virial theorem and stress calculation in molecular dynamics. J. Chem. Phys. 1979, 70, 1375–1382. [Google Scholar] [CrossRef]
  42. Sanborn, B.; Weerasooriya, T. Quantifying damage at multiple loading rates to Kevlar KM2 fibers due to weaving, finishing, and pre-twist. Int. J. Impact Eng. 2014, 71, 50–59. [Google Scholar] [CrossRef]
  43. Crist, B.; Hereña, P.G. Molecular orbital studies of polyethylene deformation. J. Polym. Sci. Part B 1996, 34, 449–457. [Google Scholar] [CrossRef]
  44. Barham, P.J.; Keller, A. The achievement of high-modulus polyethylene fibers and the modulus of polyethylene crystals. J. Polym. Sci. B 1979, 17, 591–593. [Google Scholar] [CrossRef]
  45. Sakurada, I.; Kaji, K. Relation between polymer conformation and elastic modulus of crystalline region of polymer. J. Polym. Sci. Polym. Symp. 1970, 31, 57. [Google Scholar] [CrossRef]
  46. Sockalingam, S.; Gillespie, J.W., Jr.; Keefe, M. Influence of multiaxial loading on Kevlar KM2 single fiber failure. Text. Res. J. 2016. [Google Scholar] [CrossRef]
Figure 1. Repeating unit of Kevlar® chain. (Atom color: black—carbon, white—hydrogen, red—oxygen, and blue—nitrogen).
Fibers 05 00007 g001
Figure 2. Kevlar® crystal unit cell. (Atom color: black—carbon, white—hydrogen, red—oxygen, and blue—nitrogen).
Fibers 05 00007 g002
Figure 3. Hydrogen bonds (dotted blue lines) in between the adjacent Kevlar® chains.
Fibers 05 00007 g003
Figure 4. Crystal unit cell of polyethylene (PE). (Atom color: black—carbon, and white—hydrogen).
Fibers 05 00007 g004
Figure 5. Effect of axial compression (AC) (a) kink bands [1] (Reproduced with permission from [1], SAGE, 2016); (b) cumulative distribution function (CDF); (c) fibrillation around kink bands; and (d) fibrillated fiber failure.
Fibers 05 00007 g005aFibers 05 00007 g005b
Figure 6. Effect of transverse compression (TC) (a) deformation at 66% nominal strain [19] and (b) CDF. (Reproduced with permission from [19], Elsevier, 2016).
Fibers 05 00007 g006
Figure 7. Atomic force microscopy (AFM) images of compressed (a) Kevlar® KM2 at 62% nominal strain and (b) Dyneema SK76 at 71% nominal strain [18]. (Reproduced with permission from [18], Elsevier, 2017).
Fibers 05 00007 g007
Figure 8. Molecular Model of (a) Kevlar® and (b) PE. (Atom color: black—carbon, white—hydrogen, red—oxygen, and blue—nitrogen).
Fibers 05 00007 g008
Figure 9. Variations of stress with strain for Kevlar® and PE in Z-direction (axial) tensile loading.
Fibers 05 00007 g009
Figure 10. Variations of stress with strain for Kevlar® and PE in (a) X- and (b) Y-direction tensile loading.
Fibers 05 00007 g010
Figure 11. Snapshots of the Kevlar® model at (a) undeformed (XY plane view); (b) X-tension; and (c) Y-tension. (Hydrogen bonds are shown by dotted blue lines).
Fibers 05 00007 g011
Figure 12. Snapshots of the Kevlar® model at (a) undeformed (YZ plane view) and (b) Z-tension.
Fibers 05 00007 g012
Figure 13. Snapshots of the PE model at (a) undeformed (XY plane view); (b) X-tension; and (c) Y-tension.
Fibers 05 00007 g013
Figure 14. Chain breakage in PE under Z-tension.
Fibers 05 00007 g014
Figure 15. Effects of pre-compression on the axial tensile stress-strain response for (a) Kevlar® and (b) PE.
Fibers 05 00007 g015
Figure 16. Snapshots of the Kevlar® model at (a) 0% strain; (b) 25% TC in the X-direction; and (c) relaxation following TC in the X-direction.
Fibers 05 00007 g016
Figure 17. Snapshots of the Kevlar® model at (a) 0% strain; (b) 25% AC in the Z-direction; and (c) relaxation following TC in the X-direction.
Fibers 05 00007 g017
Figure 18. Snapshots of the PE model at (a) 0% strain; (b) 25% TC in the X-direction; and (c) relaxation following TC in the X-direction.
Fibers 05 00007 g018
Figure 19. Snapshots of the PE model at (a) 0% strain; (b) 25% AC in the Z-direction; and (c) relaxation following AC in the Z-direction. (A few chains are randomly chosen for clarity).
Fibers 05 00007 g019
Figure 20. Effects of pre-compression on the distribution of key bond length in (a) Kevlar® and (b) PE. (μ = mean, SD = standard deviation).
Fibers 05 00007 g020
Figure 21. Variation of the number of broken bonds with strain during tensile loading of virgin and pre-compressed Kevlar® crystal.
Fibers 05 00007 g021
Table 1. Weibull parameters.
Fiber TypesScale Parameter (σ0)Shape Parameter (m)Location Parameter (γ)
Baseline fibers5.3112.54−1.24
Kinked fibers4.558.20−0.69
Table 2. Tensile modulus and strength data of Kevlar® and PE crytal.
ModelsModulus (GPa)Strength (GPa)
X-DirectionY-DirectionZ-DirectionX-DirectionY-DirectionZ-Direction
Kevlar®12.074.0325.00.801.1931.90
PE6.46.7257.00.230.2815.90

