
A Model for the Prediction of the Tensile Strength of Fiber-Reinforced Concrete Members, Before and After Cracking


School of Civil Engineering, National Technical University of Athens, Zografou, GR-15773, Greece
*
Author to whom correspondence should be addressed.
Fibers 2017, 5(3), 27; https://doi.org/10.3390/fib5030027
Submission received: 10 April 2017
/
Revised: 23 June 2017
/
Accepted: 27 June 2017
/
Published: 28 July 2017
(This article belongs to the Special Issue Fibers and Techniques for Upgrading of Concrete and Masonry Constructions)
Abstract
:The tensile behavior of concrete or mortar plays an important role for delaying the formation and propagation of cracks, and also for upgrading the bearing capacity of existing concrete and masonry constructions. Although the presence of steel fibers is known to improve, often considerably, the tensile capacity of concrete members, methods for the quantification of this improvement are still limited. For this reason, a model has been developed for the prediction of the tensile strength of steel fiber-reinforced concrete members, as crack opening occurs. Given the geometry and the physical characteristics of reinforced concrete member and fibers, the model predicts: (1) the number of fibers crossing a crack’s surface; (2) the distribution of these fibers in terms of (i) the angle a fiber forms with the crack surface (fiber inclination) and (ii) the embedded length of the fiber at both sides of the surface; (3) resistance to crack opening provided by each fiber, in relation to its position and inclination. On the results of the results obtained, the influence of the number of fibers on the reduction of crack widening in concrete or mortar is remarkable and can be estimated with satisfactory precision. In upgrading existing concrete and masonry constructions, this tensile behavior is found to play important role.
1. Introduction
The use of steel fiber-reinforced concrete (SFRC), in the construction of structural members is increasing in recent years due mainly to the favorable contribution of the fibers to crack elimination and/or controlled propagation [1,2]. Materials other than steel are also used for the construction of fibers of various types (e.g., glass, nylon, etc.), mainly to control cracking of non-structural elements (such as pavements, decks and floors) [3,4]. Classification of performance of FRC is rather empirical, as it is based on test results. In addition to limiting crack propagation, it has also been reported that the presence of fibers leads to more uniform crack patterns.
Mechanical characteristics, such as brittleness reduction, can also be improved, though not significantly in terms of strength [5,6,7,8,9,10], except for tensile capacity. More specifically, the contribution of fibers, especially steel fibers, to the tensile capacity of concrete is quite significant. The influence of exposure of fibers to high temperature has also been investigated [11]. Among several existing types of steel fibers, hook-end fibers are most effective in increasing the tensile capacity [12]. This is the reason for the present study's main focus on this type of fibers.
Several relevant mathematical models that have been developed produce results that correlate and converge with some series of experimental data [13,14], while, in other cases, they exhibit significant divergence [15]. Such models examine the operation of fibers and their effectiveness not only in crack control, but also in the improvement of the mechanical characteristics of concrete (direct tensile strength and compressive strength within a biaxial or triaxial stress field) and the interrelation of various factors. Apart from the volumetric ratio, which is the main one, other factors are the fiber distribution and fiber orientation to the crack surface and bond.
The proposed model gives satisfactory explanation to the observed mode of failure of the fibers, which is mainly a pullout mode; regardless of the orientation of any hook formation and the embedded length at each side of the crack.
2. Materials and Methods
2.1. Model Description
Given the geometry and the volumetric percentage of steel fibers in a reinforced concrete (RC) member, the first step is to determine the number of fibers traversing a plane formed by a possible crack due to tension; tension may occur for any reason, such as bending or shrinkage. Provided that steel fibers are properly mixed into concrete, they can be considered as randomly oriented in three dimensions, while their center points will be almost evenly distributed throughout the entire volume of the member (in the common case where the fiber length is very small, compared to the dimensions of the concrete section). Formation or widening of the crack is prevented by each fiber that is intercepted by the crack plane, according to the crossing angle and the available anchor type and length, until each fiber’s loading capacity is reached, and as long as the fiber does not rupture or is not pulled out.
The proposed model quantitatively describes the fibers’ (with hooked ends) reaction to the widening of the crack. It could be also used for straight fibers, though their contribution is negligible.
The detailed description is provided for hooked fibers of length lf and diameter d, as presented in Figure 1.
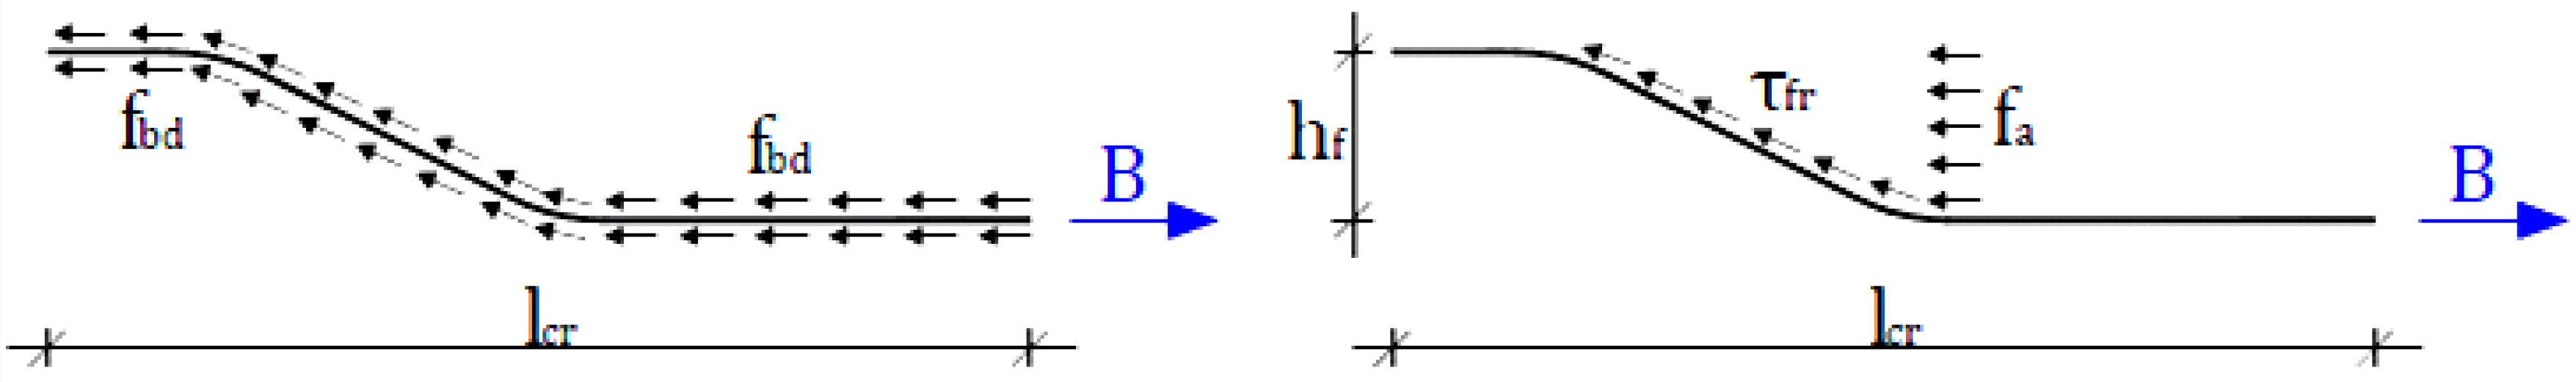
After formation and widening of a crack, each fiber that crosses it is subjected to the extraction force B, which is provided simultaneously by two mechanisms, as presented at Figure 2. The first mechanism is due to bond stress developing at the fiber interface with the surrounding concrete fbd, while the second corresponds to the reaction stress fa of the concrete to the pullout pressure of the inclined part of the fiber, plus the friction stresses τfr that develop due to this reaction. It should be noted that a fiber becomes so flexible, when subjected to pullout, that it cannot develop any flexural capacity; it practically performs as a cable, as described in Figure 3.
The combined effect of the above-mentioned two mechanisms would have an effect up to the capacity limit of the fiber in tension Bud (Equation (1), second part).
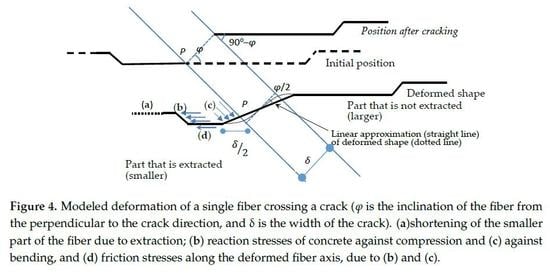
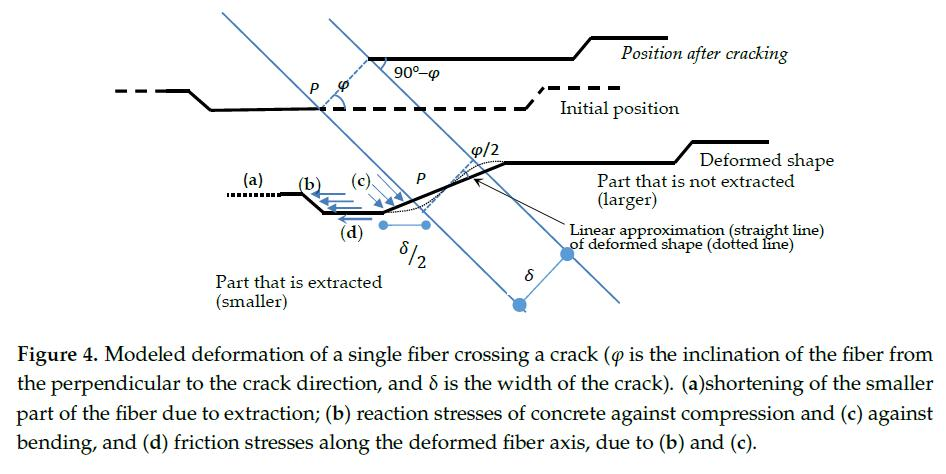
In the case that a fiber is not perpendicular to the crack plane (Figure 4, ϕ≠0), then due to transverse forces (resulting to high stresses to the concrete near the surface of the crack) a rupture to the surrounding concrete takes place locally, resulting in redistribution of stresses (with a performance similar to the one of the piles or dowels) and changing the geometry of the deformed fiber.
An approximation of such changes is provided in Figure 4. On the basis of testing experience, it has been considered that local concrete rupture results in the reduction of the transverse angle ϕ to approximately 50% (ϕ/2) (Figure 4).
Resistance to the extraction is provided by three mechanisms: (a) bond stress between fiber and concrete; (b) compressive reaction of concrete due to hook extraction and local deformation perpendicular to crack opening, and (c) to relevant friction forces.
The above mechanisms can be expressed in the form of Equation (1). Their sum cannot exceed the tensile capacity of the fiber, Bud.
Because the first term of Equation (1) has a relatively small influence at the final sum, the pullout capacity of a fiber is negligible if a crack does not intersect its middle part (length l1, Figure 1), so Equation (1) becomes:
As fibers are mainly used for the prevention of cracking, the main aspect of interest is the coefficient of their bearing capacity which is perpendicular to the cracking plane, (Bcosϕ).
After the formation of a crack, the geometry of each fiber changes. Concrete resisting the transverse fiber’s deformation is locally overcome due to the concentration of stresses, and the fiber deforms accordingly. An approximation in this deformation leads to the simplified model that is shown in Figure 5; to model the mentioned deformation, the “effective” angle of the fiber’s crossing is transformed from ϕ to .
The equilibrium for each fiber, with initial angle ϕ gives:
Of more interest is the total force (corresponding to all fibers forming the angle ϕ with the crack) perpendicular to the crack:
2.2. Volumetric Contribution of Fibers
The fibers are considered to be distributed uniformly in the mass of concrete; a volumetric ratio is usually provided in the concrete mix proportions. Even if uniformity is achieved, the distribution of the fibers according to the angle they cross a crack plane also has to be calculated.
If we consider the unified area of the crack plane P (Figure 6), the middle point of the fibers, forming angle φi with the axis perpendicular to the crack, that crosses it inside their portion of length l1, will be located inside a strip with width w=l1cos (ϕi).
The number of the above mentioned fibers, as they are uniformly distributed in the volume (volumetric ratio ρ*αϕ) is:
Where factor modifies the volumetric factor , according to angle (Figure 6).
Equation (5) can be rewritten as:
For the calculation of , the following needs to be considered:
In the case of distribution in a plane, would be constant (independent of ϕ, equal to unity), but for spatial distribution, it varies with angle as follows:
Referring to Figure 7a, if we move the central point of all fibers, forming angle ϕi with the axis of the opening of the crack, in a single point, C, then the edges of their central part would be on a circle with radius:
As the spatial volumetric ratio is constant, then the number of fibers, at an angle with values between ϕ = 0 and ϕ = ϕ1, will be analogous to the total number of fibers multiplied by the area of the spherical segment that is formed by the angle ϕ, divided by half the area of the total sphere.
Then:
According to (6), substituting in (8):
Then
In the early stage of cracking, where δ≈0, the iteration of Equation (10) for all possible angles gives:
Factor r = 0.5 in Equation (11) defines the average effectiveness factor of the fibers due to their spatial contribution, provided that each fiber is efficiently anchored. Different models have resulted different values, from 0.60 to 0.64 [15,16]. This is due to the two-dimensional (2-D) consideration, while the three-dimensional (3-D) distribution is considered here.
The experimental evaluation of the effectiveness factor gives values varying from 0.32 to 0.58 [17,18]. A recently published review paper [19] presents several experimental results performed by various researchers, according to which the splitting capacity of plain concrete cannot be increased significantly with the use of fibers, but it can be altered to more ductile behavior.
Existing models cover the case where the crack has just formed and its width is negligible. When the crack starts to widen, the participation factor alters, due to the geometry change, as mentioned in Section 2.2.
According to Equations (4) and (5) of the proposed model:
Using the following abbreviations for the constants:
and, iterating Equation (12), the result is:
2.3. Influence of Crack Widening
2.3.1.Geometrical Limitations
Equation (16) gives the analytical solution without taking into account the extraction of any fiber crossing the crack. As the crack tends to develop, the shorter part of all embedded fibers begins to be extracted out of the concrete, while the concrete locally ruptures to a depth of the order of half the crack width. In consequence, as described in Figure 8, the maximum crack length that a fiber is able to sustain, while still providing resistance, is double the initial distance of the fiber’s hook from the intersection point. Thus:
There exists also another limitation; from Figure 8 it is evident that:
2.3.2. Influence of Crossing Angle
As the crack develops, a number of fibers gradually lose their capacity due to their extraction; their quantity is a function of their spatial orientation and of the point of their initial intersection with the crack plane. It becomes very complicated to combine Equations (8)–(16) to Equations (17) and (18) in terms of analytical solution; a numerical approach can be used for every case study, instead. An analytical case study is provided at the following section.
3. Results
3.1. Case Study
The characteristics of the materials and of the case study are included in Appendix B. The percentage ratio ρ=0.5% should be modified to its active value (ρact), in accordance with Equation (5) and with the geometric characteristics of the fiber (Table A1 and Figure A1) as follows:
Then, according to Equation (19), the total active number or fibers is calculated, using intervals of 10°; it has been calculated that intervals of 1° provide better accuracy of the order of 2%–3%only. A step of the calculation procedure has as follows:
The number of fibers can be calculated as:
Accordingly, Table 1 provides the calculated values for all angle intervals:
In order to calculate the pullout capacity of a single fiber, the following calculations are made:
where mm, the equivalent distance between adjacent fibers.
Friction τfr, due to reaction stress is
τfr=μ·fα·sinθ=0.45·35.41·sin26.5°=7.11 MPa
According to Equation (1), the maximum pullout force for a fiber crossing a crack at the position (l1/4), which is the average length lav, is:
This force is modified according to the intersection point with the crack, but holds a remarkable participation factor, if this point is located inside the middle region (between the hooks). This modification results to a participation factor, dependent of the crossing point, as presented in Table 2.
It is interesting to allocate the bearing capacity to the three components that constitute the pullout capacity of a fiber, as presented in Table 3; it becomes evident that the compressive resistance of the hook and the corresponding friction are the main components of the fibers’ resistance to crack opening. For a fiber crossing a crack at the “average position” (l1/4), the sum of the resisting forces of all three mechanisms is B = 0.1868 kN. If we consider a crossing angle ϕ = 35° (as in Figure 8), then
T = 0.45·0.0863=0.0388 kN
F = 0.1869∙cos27.5° + 0.0388 = 0.2046 kN ≤ Bud=0.4418 kN
Resistance to extraction is
Fx,27.5°,l1/4 = 0.2046·cos27.5° = 0.1815 kN
3.2. Quantification of Volumetric Distribution of Fibers
Combining the values of Table 1 (number of fibers per crossing angle) and of Table 4 (a single fiber’s resistance to a crack opening, up to the maximum, per case, crack width), the total pullout resisting force, due to the fibers’ contribution only, of the considered 300/300 mm concrete section C25/30, with volumetric fibers’ ratio 0.50%, in accordance to crack width, is presented in Figure 9. For comparison, the concrete tensile capacity is about
Had all fibers been perpendicular to the crack and totally bonded, their pullout capacity would have been
According to (19), the pullout capacity due to the fibers (ρ = 0.5%) is in the order of 10%–12% of the tensile capacity of concrete. Since all equations for this capacity are linear to with respect to ρ, the relevant capacity would increase accordingly if a larger ratio ρ (up to the level a homogeneous distribution could be assured) can be achieved (e.g., ρ = 1.0% would result in more than 20% of the tensile capacity of concrete). The “effectiveness ratio” (which expresses the pullout resistance of all fibers crossing a crack), provided that all fibers were efficiently anchored and perpendicular to the crack, takes the initial value , which is gradually reduced as the crack widens. The factor r is independent of the volumetric ratio ρ, provided that the homogeneity of fibers’ distribution can be achieved.
What can be noticed from Figure 9 is that fibers sustain their capacity for a crack width of 2.50 mm, while a considerable proportion of this capacity (more than 50%) is sustained for a crack width of the order of 5 mm (about 30% of the length of the middle part of the fiber).
Repeating the same procedure for several types of industrially produced steel fibers, we have concluded that similar results can be obtained.
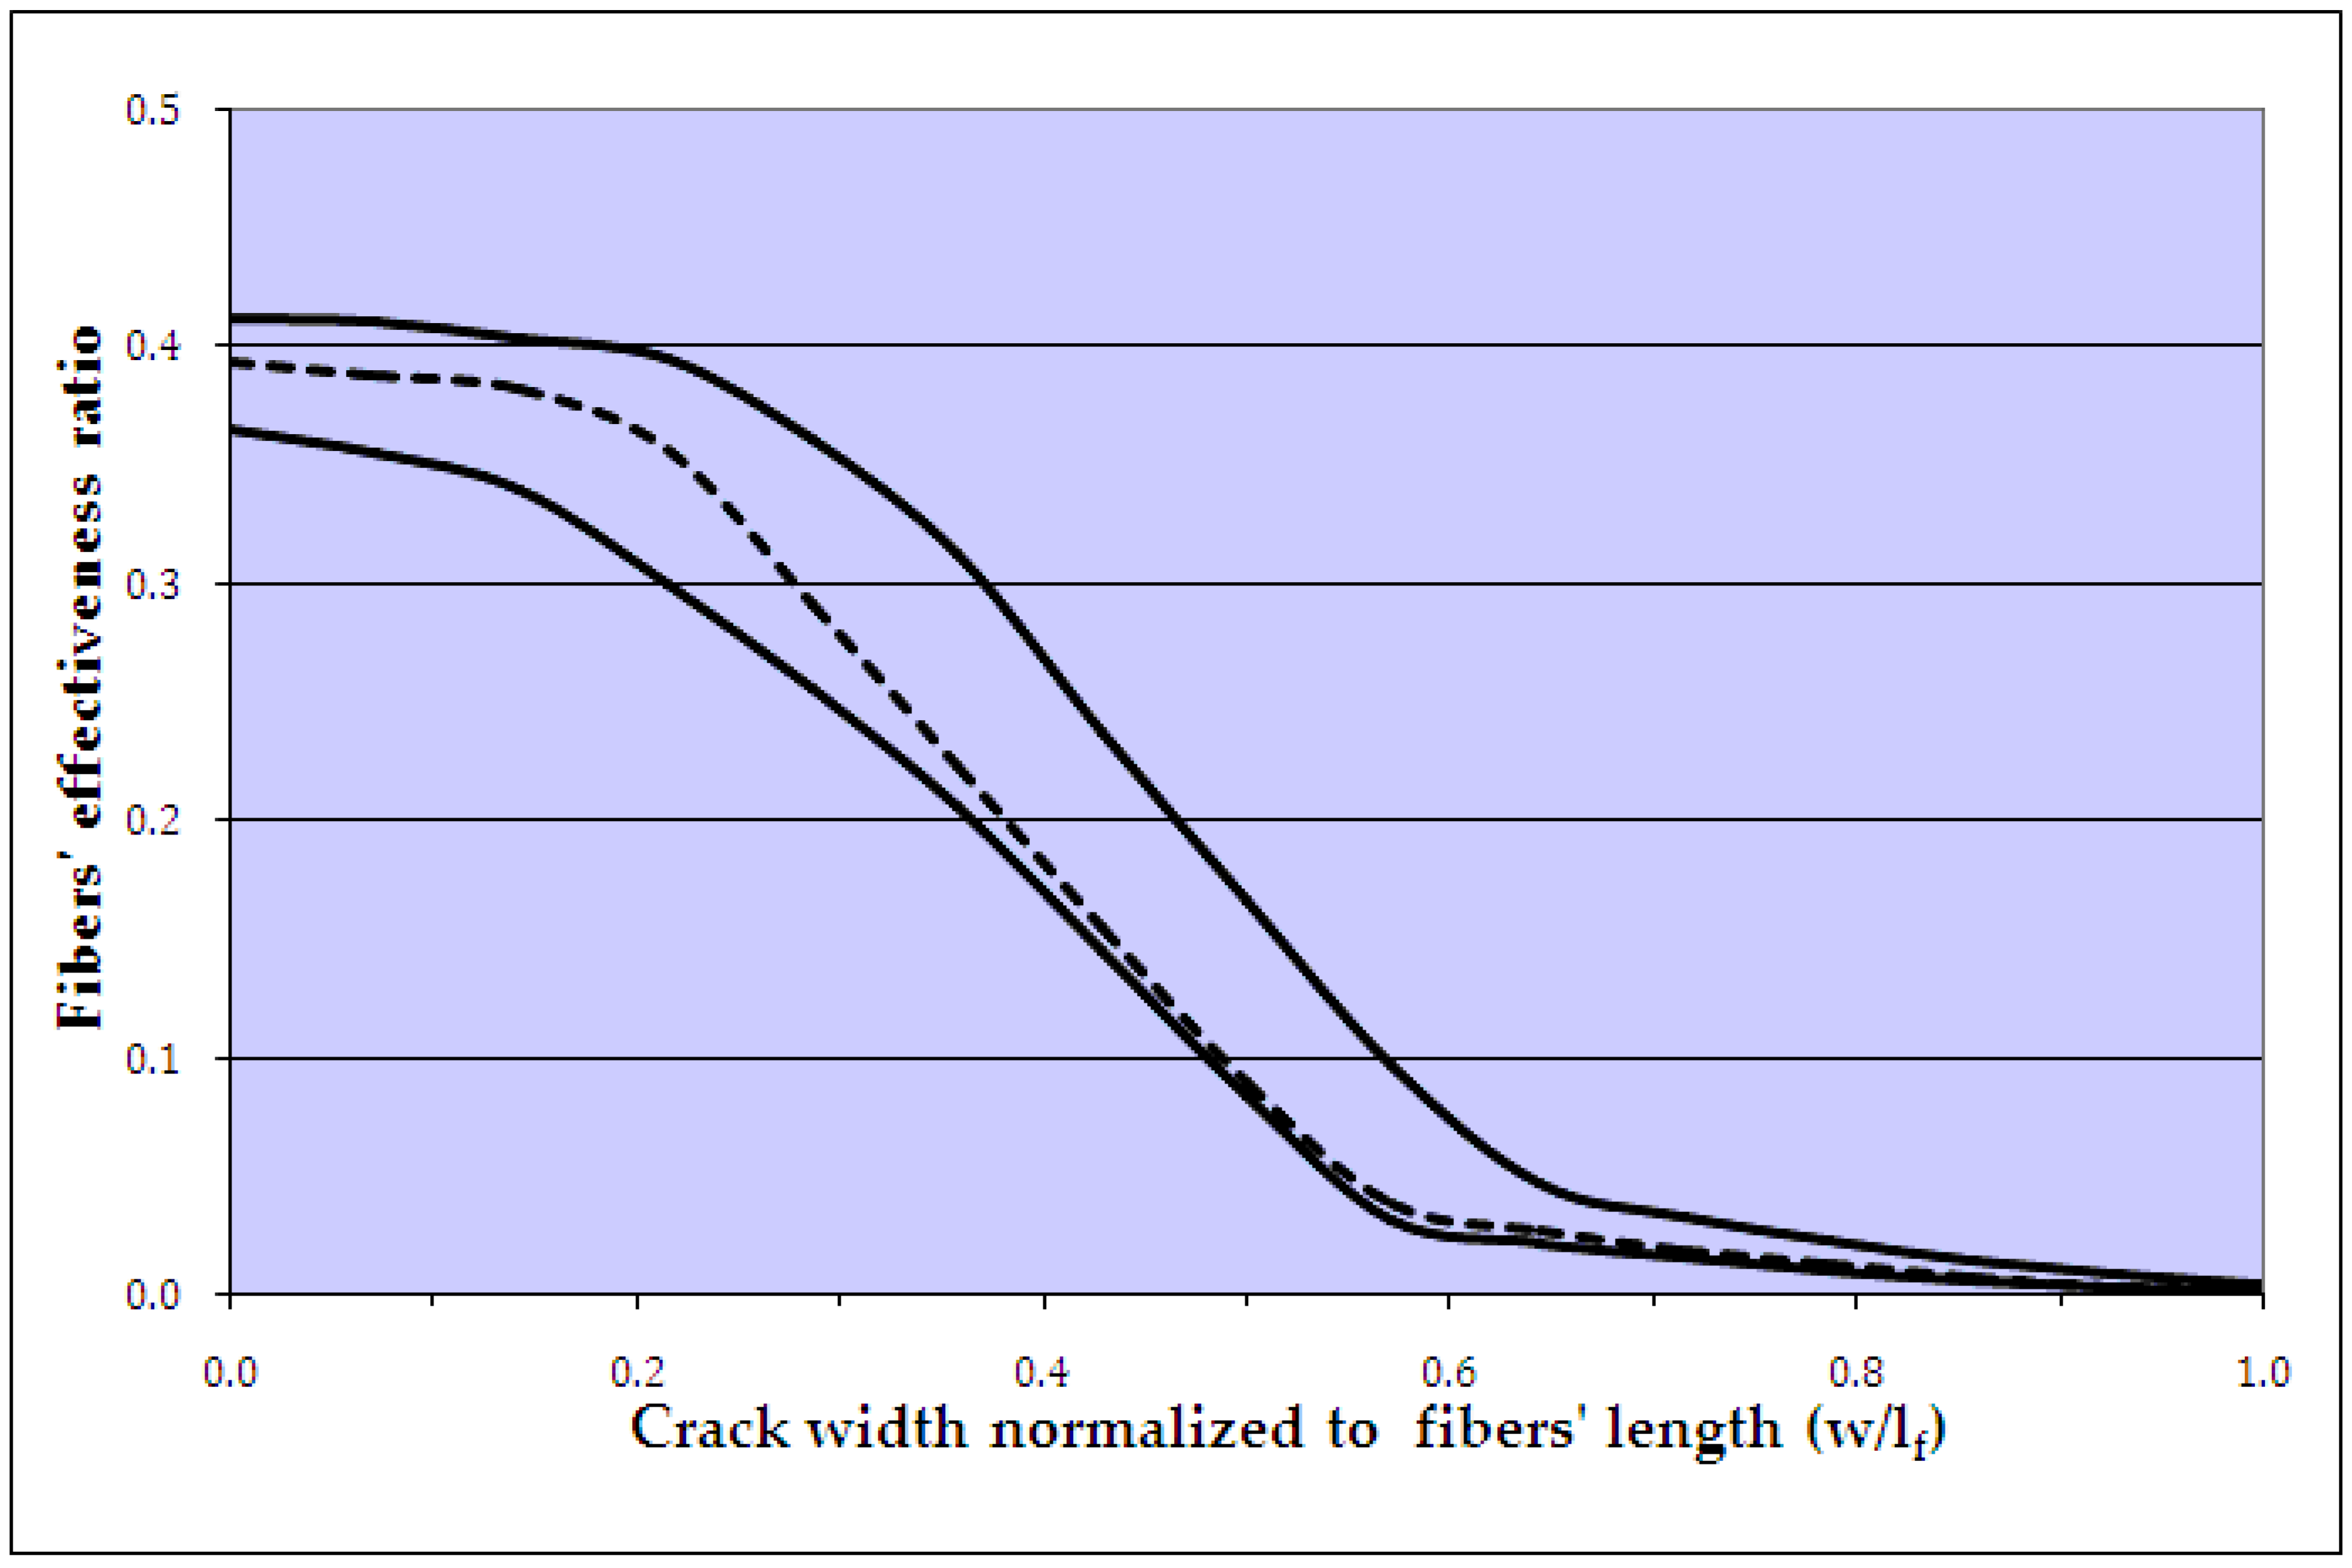
Normalizing the width of the crack to the length of the central part of the fiber l1, envelope curves have been produced and presented in Figure 10.
4. Conclusions
According to Equation (10), which is valid during the early stage of cracking, the initial pullout resistance of fibers crossing a section can be estimated using analytical expressions.
The average effectiveness factor of the fibers due to their spatial contribution, provided that each fiber is efficient anchored, has analytically been calculated as r = 0.50.
According to Figure 9 and Equation (28), this resistance is practically quite small, when compared to the tensile bearing capacity of the concrete (of the order of 10%–15% for ρ = 0.5%), even at the initial stage of the crack formation. It plays a significant role however, as it partially permits the redistribution of tensile stresses and the formation of new cracks; an increase of number of cracks leads to crack width reduction.
With the proposed numerical method, an estimation for the initial pullout resistance can be achieved, and the process of the pullout resistance, in the case of a crack starting widening, can also be described. Due to the accidental lack of anchorage of a percentage of the fibers, r ranges between 0.35 and 0.40 at the early stages of crack formation (about 15% of the length of the central part of the fiber, l1). Also, r ≈ 0.25–0.35 when crack formation reaches about 30% of l1. Practically, if cracks reach a width of about 40% of the length of the fibers’ central part, l1, their ability to resist the further opening of the crack is practically exhausted.
Relevant tests performed by other researchers [18] verify the effectiveness ratio for the small width of cracks, for w/L1 ratios up to about 0.10 (unfortunately, their experimental setup could not provide a descending branch, in order to compare with higher w/L1 ratios).
Other experiments performed for hooked end fibers [2] describe a similar behavior to that presented in Figure 10, with the difference being that the effectiveness ratio is reduced for smaller values of w/L1. The effectiveness ratio is rather constant up to values of w/L1 to 0.05 and subsequently it remains equal to 50% of its initial value for larger w/L1.
In a recent review paper [19], other researchers’ tests on specimens report the constant effectiveness values for w/L1 ratio up to 0.2.
A test of specimens submitted to four-point flexural bending [20] showed that reduction of the effectiveness ratio was not so abrupt for larger w/L1 ratios. This could be attributed to the test method used. Flexural bending tests form cracks of linearly varying width, so there is always a number of fibers that remain active.
As a proposal for future work, the model described herein, which is valid for cracks of pure tensile type (where the width is the same along the rupture surface) could be altered to cover flexural type cracking.
Author Contributions
Emmanouil Vougioukas has formed the proposed model and wrote the paper and Maria Papadatou has performed the numerical analysis.
Conflicts of Interest
The authors declare no conflict of interest.
Appendix A
List of symbols
| Ac | area of concrete |
| B | pullout resistant force of a fiber |
| Bud | design value of maximum pullout force of a fiber, in the case that the fiber reaches the yield stress |
| Fextr,ϕ,perp | total pullout resistance of fibers forming an angle ϕ perpendicular to crack direction |
| Nϕ | number of fibers that cross a crack, forming an angle ϕ perpendicular to crack direction |
| df | diameter of a fiber |
| hf | hook height (Figure 1) |
| fctm | tensile strength of concrete |
| fbd | ultimate bond stress between fiber and concrete (EC2-1, cl. 8.4.2) |
| fsy | tensile yield stress of a fiber |
| fα | the bearing capacity of concrete against compression inside a bent of a fiber, that can be calculated as (EC2-1, cl. 8.4.2): |
| αb | the distance (perpendicular to the crack plane) between axes of adjacent fibers. In case of uniformly oriented fibers, this can be efficiently approximated by
Then
|
| αϕ | modification factorof the volumetric ratio, regarding angle φ |
| lf | total length of fiber (refer to Figure 1) |
| l1 | length of middle part of fiber (refer to Figure 1) |
| lav | for one fiber, is the length of the smaller of the two parts of it, as divided by a crack plane; for many fibers is the average of the smaller parts, practically (refer to Figure 1) |
| n | number of effective fibers that cross area A (function of the volumetric ratio) |
| r | effectiveness ratio for fibers [refer to section 3.2] |
| μ | friction coefficient between fiber and concrete, considered here as μ = 0.45. |
| ρ | volumetric ratio of fibers |
| ρact | active volumetric ratio of fibers |
| τfr | friction due to compression inside a bent fiber, τfr = μfα |
| ϕ | angle formed by a fiber perpendicular to crack direction |
Appendix B
Details of the characteristics of the materials used for the case study.

Table A1.
Characteristics of the case study fibers.
| Property | Quantity | Property | Quantity |
|---|---|---|---|
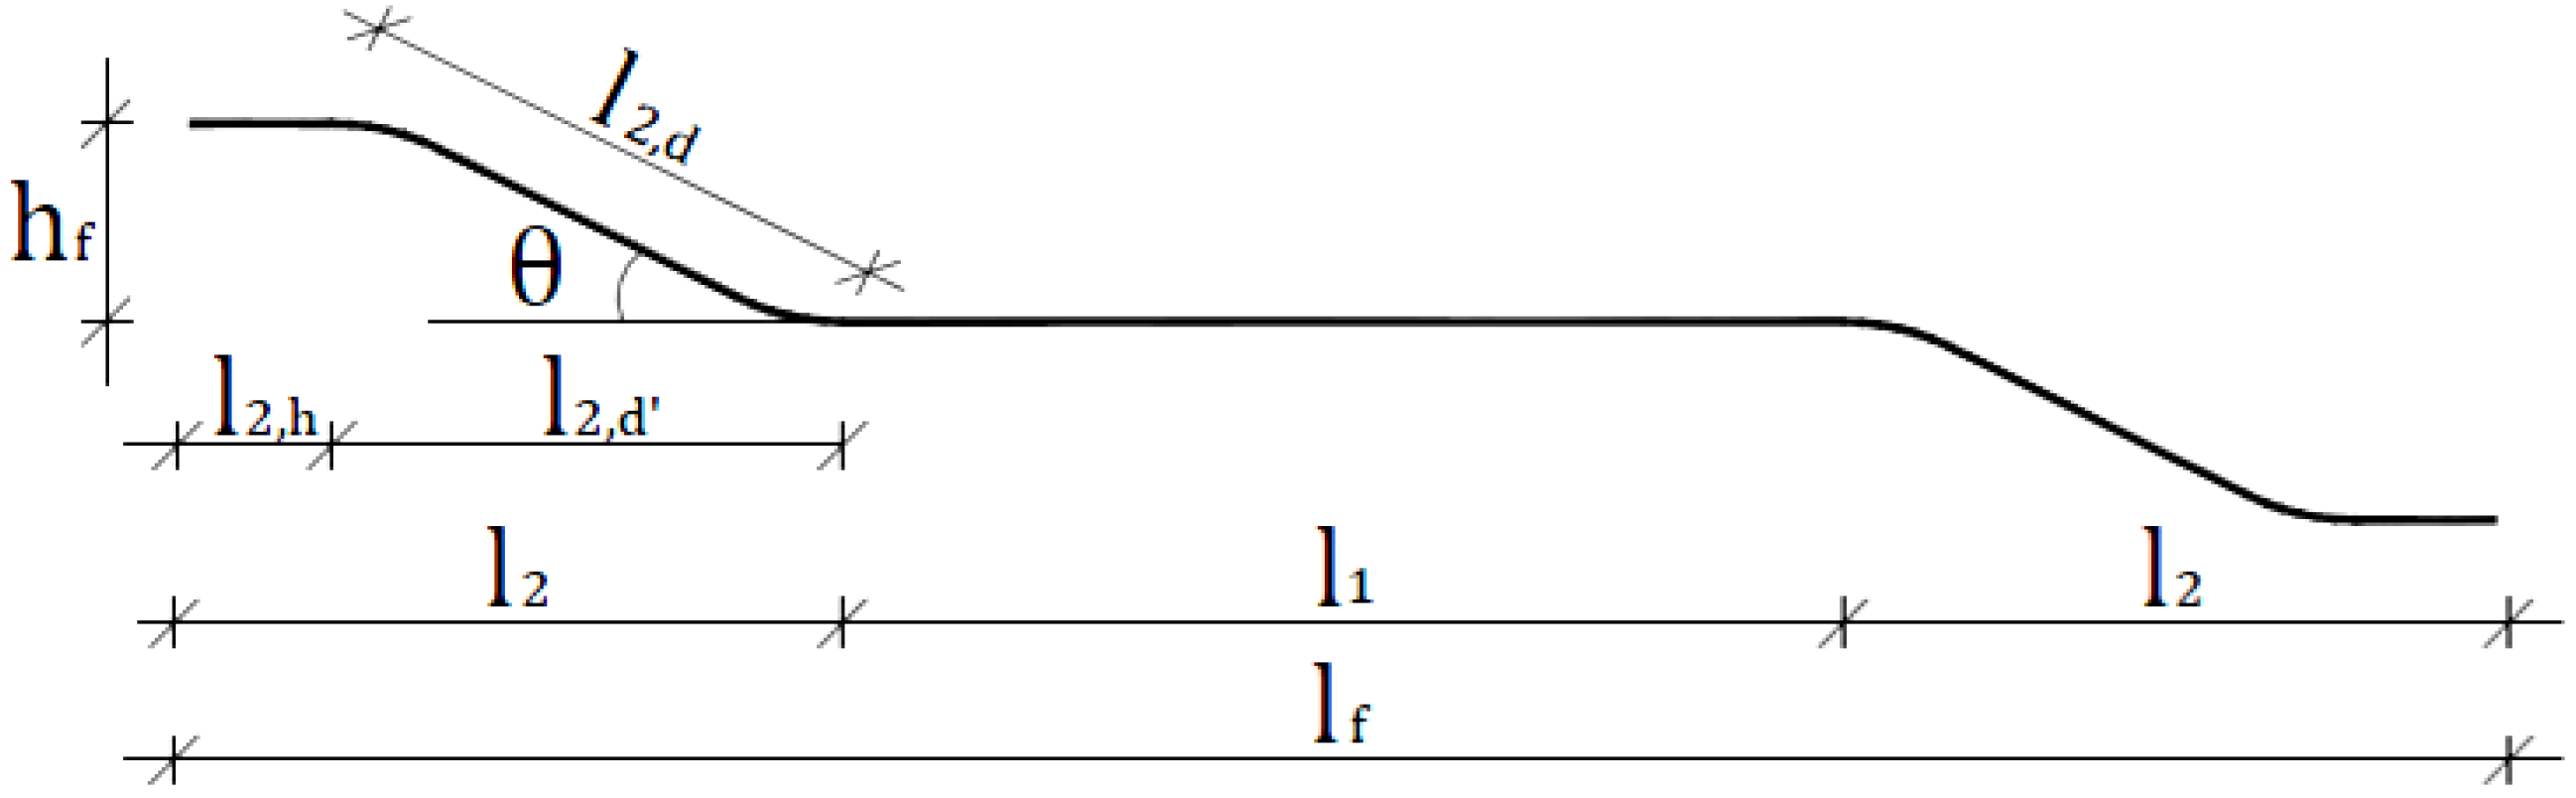
| Diameter df (mm) | 0.75 | Long. dim. of hook hf (mm) | 2.50 |
| Total longitudinal dimension lf (mm) | 29.0 | Angle of hook θ (°) | 26.5 |
| Central straight part l1 (mm) | 14.0 | Total Length ltot (mm) | 30.2 |
| Long. dimension of hook (mm) | 7.50 | Area Af (mm2) | 0.44 |
| Horizontal part l2,h (mm) | 2.49 | Volume Vf (mm3) | 13.3 |
| Diagonal part l2,d (mm) | 5.60 | Vol. of straight part V1 (mm3) | 6.18 |
| Horizontal T l2,d’ (mm) | 5.01 | Volumetric ratio | 0.50% |
| Capacity to tension fsy (MPa) | 1150 | Modulus of elasticity Es (MPa) | 2 × 10⁵ |
Figure A1.
Geometry of the fibers of the case study (dimensions in mm).
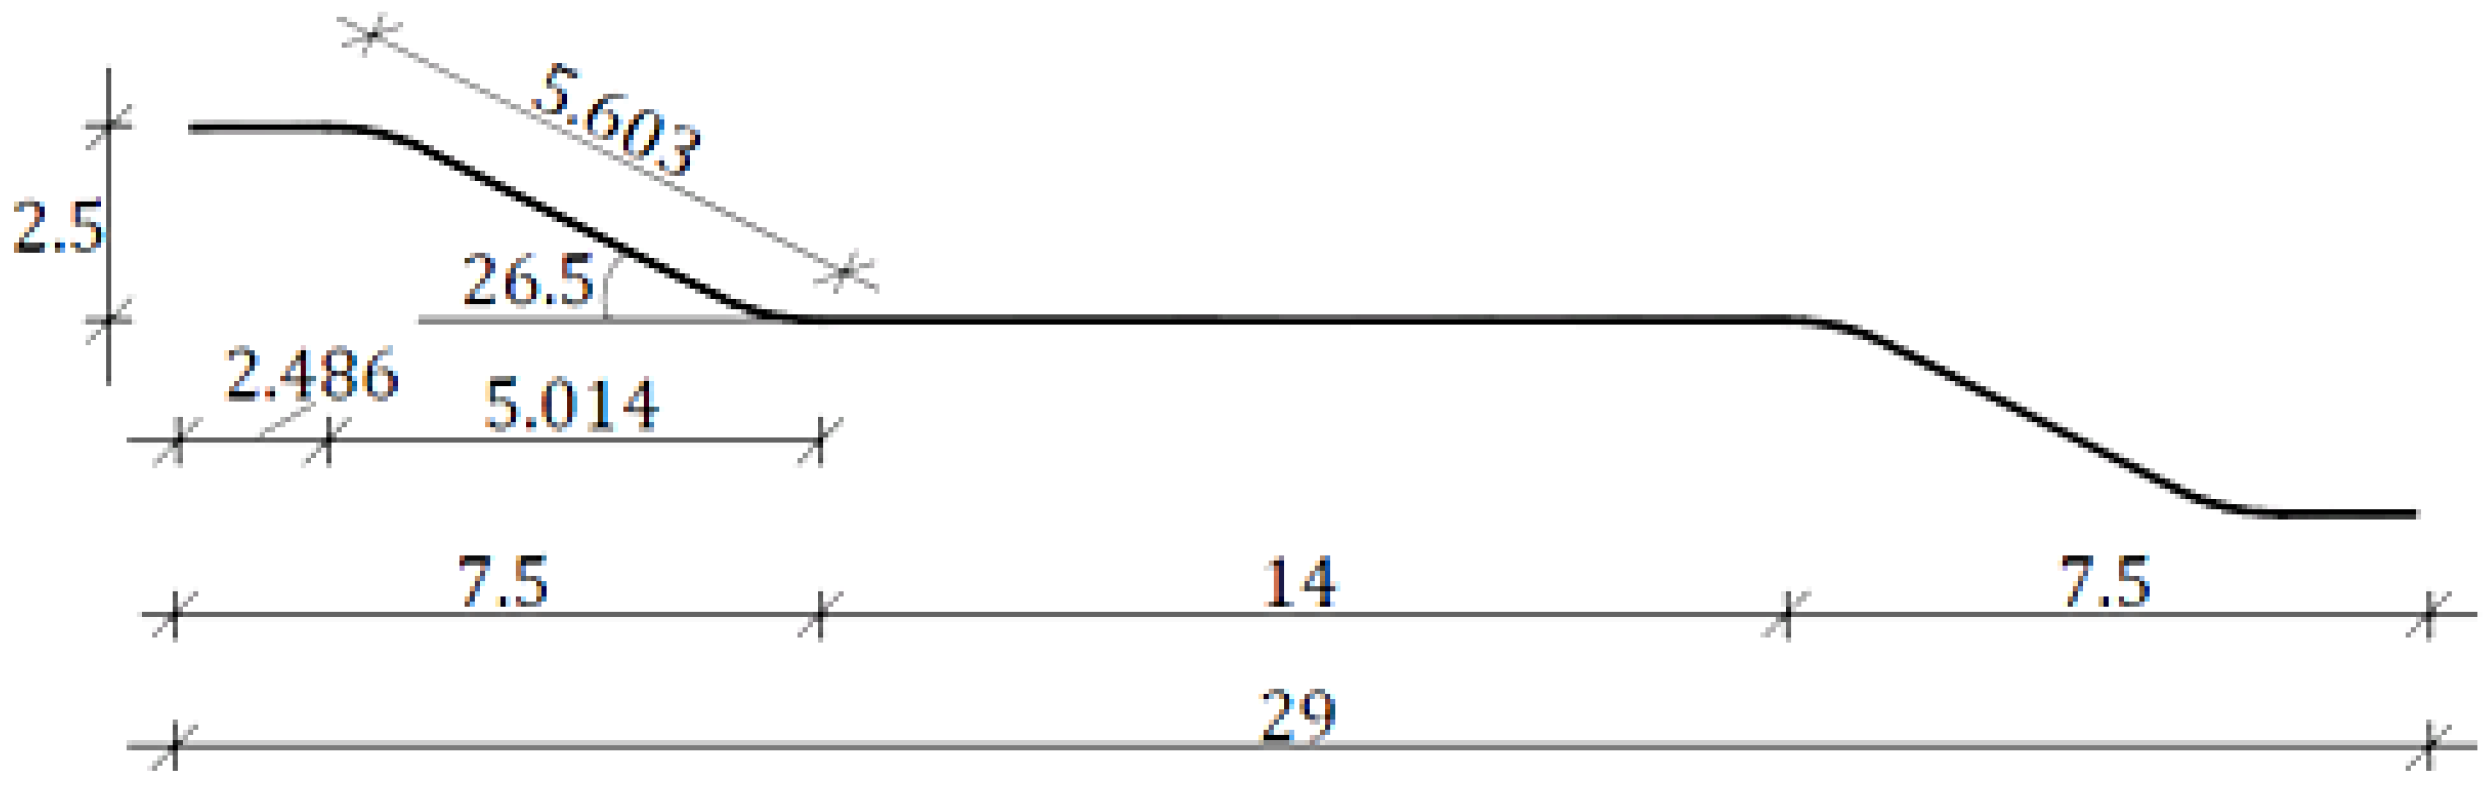
Table A2.
Characteristics of the concrete specimen.
| Property | Quantity | Property | Quantity |
|---|---|---|---|
| Length L (mm) | 600 | Compressive Strength fck (MPa) | 25.0 |
| Width B (mm) | 300 | Tensile Strength fctm (MPa) | 2.565 |
| Height H (mm) | 300 | Modulus of Elasticity (GPa) | 30.5 |
References
- Sorensen, C.O.; Berge, E.A.; Saga, P.E.; Østvold, A. Factors affecting the efficiency of fibers in concrete on crack reduction. Open J. Civ. Eng. 2013, 3, 80–85. [Google Scholar] [CrossRef]
- Buratti, N.; Mazzotti, C.; Savoia, M. Post-cracking behavior of steel and macro-synthetic fiber-reinforced concretes. Constr. Build. Mater. 2011, 25, 2713–2722. [Google Scholar] [CrossRef]
- Mehran, K.; Majid, A. Use of glass and nylon fibers in concrete for controlling early age micro cracking in bridge decks. Constr. Build. Mater. 2016, 125, 800–808. [Google Scholar]
- Boscato, G.; Russo, S. Experimental investigation on repair of RC pavements with SFRC. In Proceedings of the 2nd International Conference on Concrete Repair, Rehabilitation and Retrofitting (ICCRRR), Cape Town, South Africa, 24–26 November 2008; pp. 449–450. [Google Scholar]
- Kurihara, N.; Kunieda, M.; Kamada, T.; Uchida, Y.; Rokugo, K. Tension softening diagrams and evaluation of properties of steel fiber reinforced concrete. Eng.Fract. Mech. 2000, 65, 235–245. [Google Scholar] [CrossRef]
- Holschemacher, K.; Mueller, K.; Ribakov, Y. Effect of steel fibers on mechanical properties of high-strength concrete. Mater. Des. 2010, 31, 2604–2615. [Google Scholar] [CrossRef]
- Yang, J.M.; Min, K.H.; Shin, H.O.; Yoon, Y.S. Effect of steel and synthetic fibers on flexural behavior of high strength concrete beams reinforced with FRP bars. Compos. Part B 2012, 43, 1077–1086. [Google Scholar] [CrossRef]
- Meda, A.; Minelli, F.; Plizzari, G.A. Flexural behavior of RC beams in fiber reinforced concrete. Compos. Part B 2012, 43, 2930–2937. [Google Scholar] [CrossRef]
- Soutsos, M.N.; Lampropoulos, A.P. Flexural performance of fiber reinforced concrete made with steel and synthetic fibers. Constr. Build. Mater. 2012, 36, 704–710. [Google Scholar] [CrossRef]
- Olivito, R.S.; Zuccarello, F.A. An experimental study on the tensile strength of steel fiber reinforced concrete. Compos. Part B 2010, 41, 246–255. [Google Scholar] [CrossRef]
- Choumanidis, D.; Badogiannis, E.; Nomikos, P.; Sofianos, A. The effect of different fibers on the flexural behaviour of concrete exposed to normal and elevated temperatures. Constr. Build. Mater. 2016, 129, 266–277. [Google Scholar] [CrossRef]
- Balaguru, P.; Najm, H. High-performance fiber-reinforced concrete mixture proportions with high fiber volume fractions. ACI Mater. J. 2004, 101, 281–286. [Google Scholar]
- Lee, J.H.; Chob, B.; Choic, E. Flexural capacity of fiber reinforced concrete with a consideration of concrete strength and fiber content. Constr. Build. Mater. 2017, 138, 222–231. [Google Scholar] [CrossRef]
- Deluce, J.R.; Lee, S.-C.; Vecchio, F.J. Crack model for steel fiber-reinforced concrete members containing conventional reinforcement. ACI Struct. J. 2014, 111, 94–102. [Google Scholar]
- Lee, C.; Kim, H. Orientation factor and number of fibers at failure plane in ring-type steel fiber reinforced concrete. Cem.Concr. Res. 2010, 40, 810–819. [Google Scholar] [CrossRef]
- Alberti, M.G.; Enfedaque, A.; Galvez, J.C. On the prediction of the orientation factor and fiber distribution of steel and macro-synthetic fibers for fiber-reinforced concrete. Cem. Concr. Compos. 2017, 77, 29–48. [Google Scholar] [CrossRef]
- Lee, S.-C.; Oh, J.-H.; Cho, J.-Y. Fiber orientation factor on rectangular cross-section in concrete Members. IACSIT Int. J. Eng. Technol. 2015, 7, 470–473. [Google Scholar]
- Georgiadi-Stefanidi, K.; Mistakidis, E.; Pantousa, D.; Zygomalas, M. Numerical modeling of the pull-out of hooked steel fibres from high-strength cementitious matrix, supplemented by experimental results. Constr. Build. Mater. 2010, 24, 2489–2506. [Google Scholar] [CrossRef]
- Afroughsabet, V.; Biolzi, L.; Ozbakkaloglu, T. High-performance fiber-reinforced concrete: A review. J. Mater. Sci. 2016, 14, 6517–6551. [Google Scholar] [CrossRef]
- Baltay, P.; Gjelsvik, A. Coefficient of friction for steel on concrete at high normal stress. J. Mater. Civ. Eng. 1990, 2, 46–49. [Google Scholar] [CrossRef]
Figure 1.
Typical geometry of a hooked fiber bar of diameter df. Dimensions and properties of the fiber used for the case study are shown in Appendix A.
Figure 1.
Typical geometry of a hooked fiber bar of diameter df. Dimensions and properties of the fiber used for the case study are shown in Appendix A.

Figure 2.
Mechanisms reacting to extraction force B for a fiber embedded in concrete: bond fbd (left) and combination of capacity of concrete against compression inside a bent fa and the corresponding friction τfr (right).
Figure 2.
Mechanisms reacting to extraction force B for a fiber embedded in concrete: bond fbd (left) and combination of capacity of concrete against compression inside a bent fa and the corresponding friction τfr (right).

Figure 3.
Phases [(α)–(ε)] of extraction for a fiber, embedded in concrete, due to formation of a perpendicular crack (initial wB + Δw). Extraction length (Δs) increases until fiber is fully extracted.
Figure 3.
Phases [(α)–(ε)] of extraction for a fiber, embedded in concrete, due to formation of a perpendicular crack (initial wB + Δw). Extraction length (Δs) increases until fiber is fully extracted.

Figure 4.
Modeled deformation of a single fiber crossing a crack (ϕ is the inclination of the fiber from the perpendicular to the crack direction, and δ is the width of the crack). (a)shortening of the smaller part of the fiber due to extraction; (b) reaction stresses of concrete against compression and (c) against bending, and (d) friction stresses along the deformed fiber axis, due to (b) and (c).
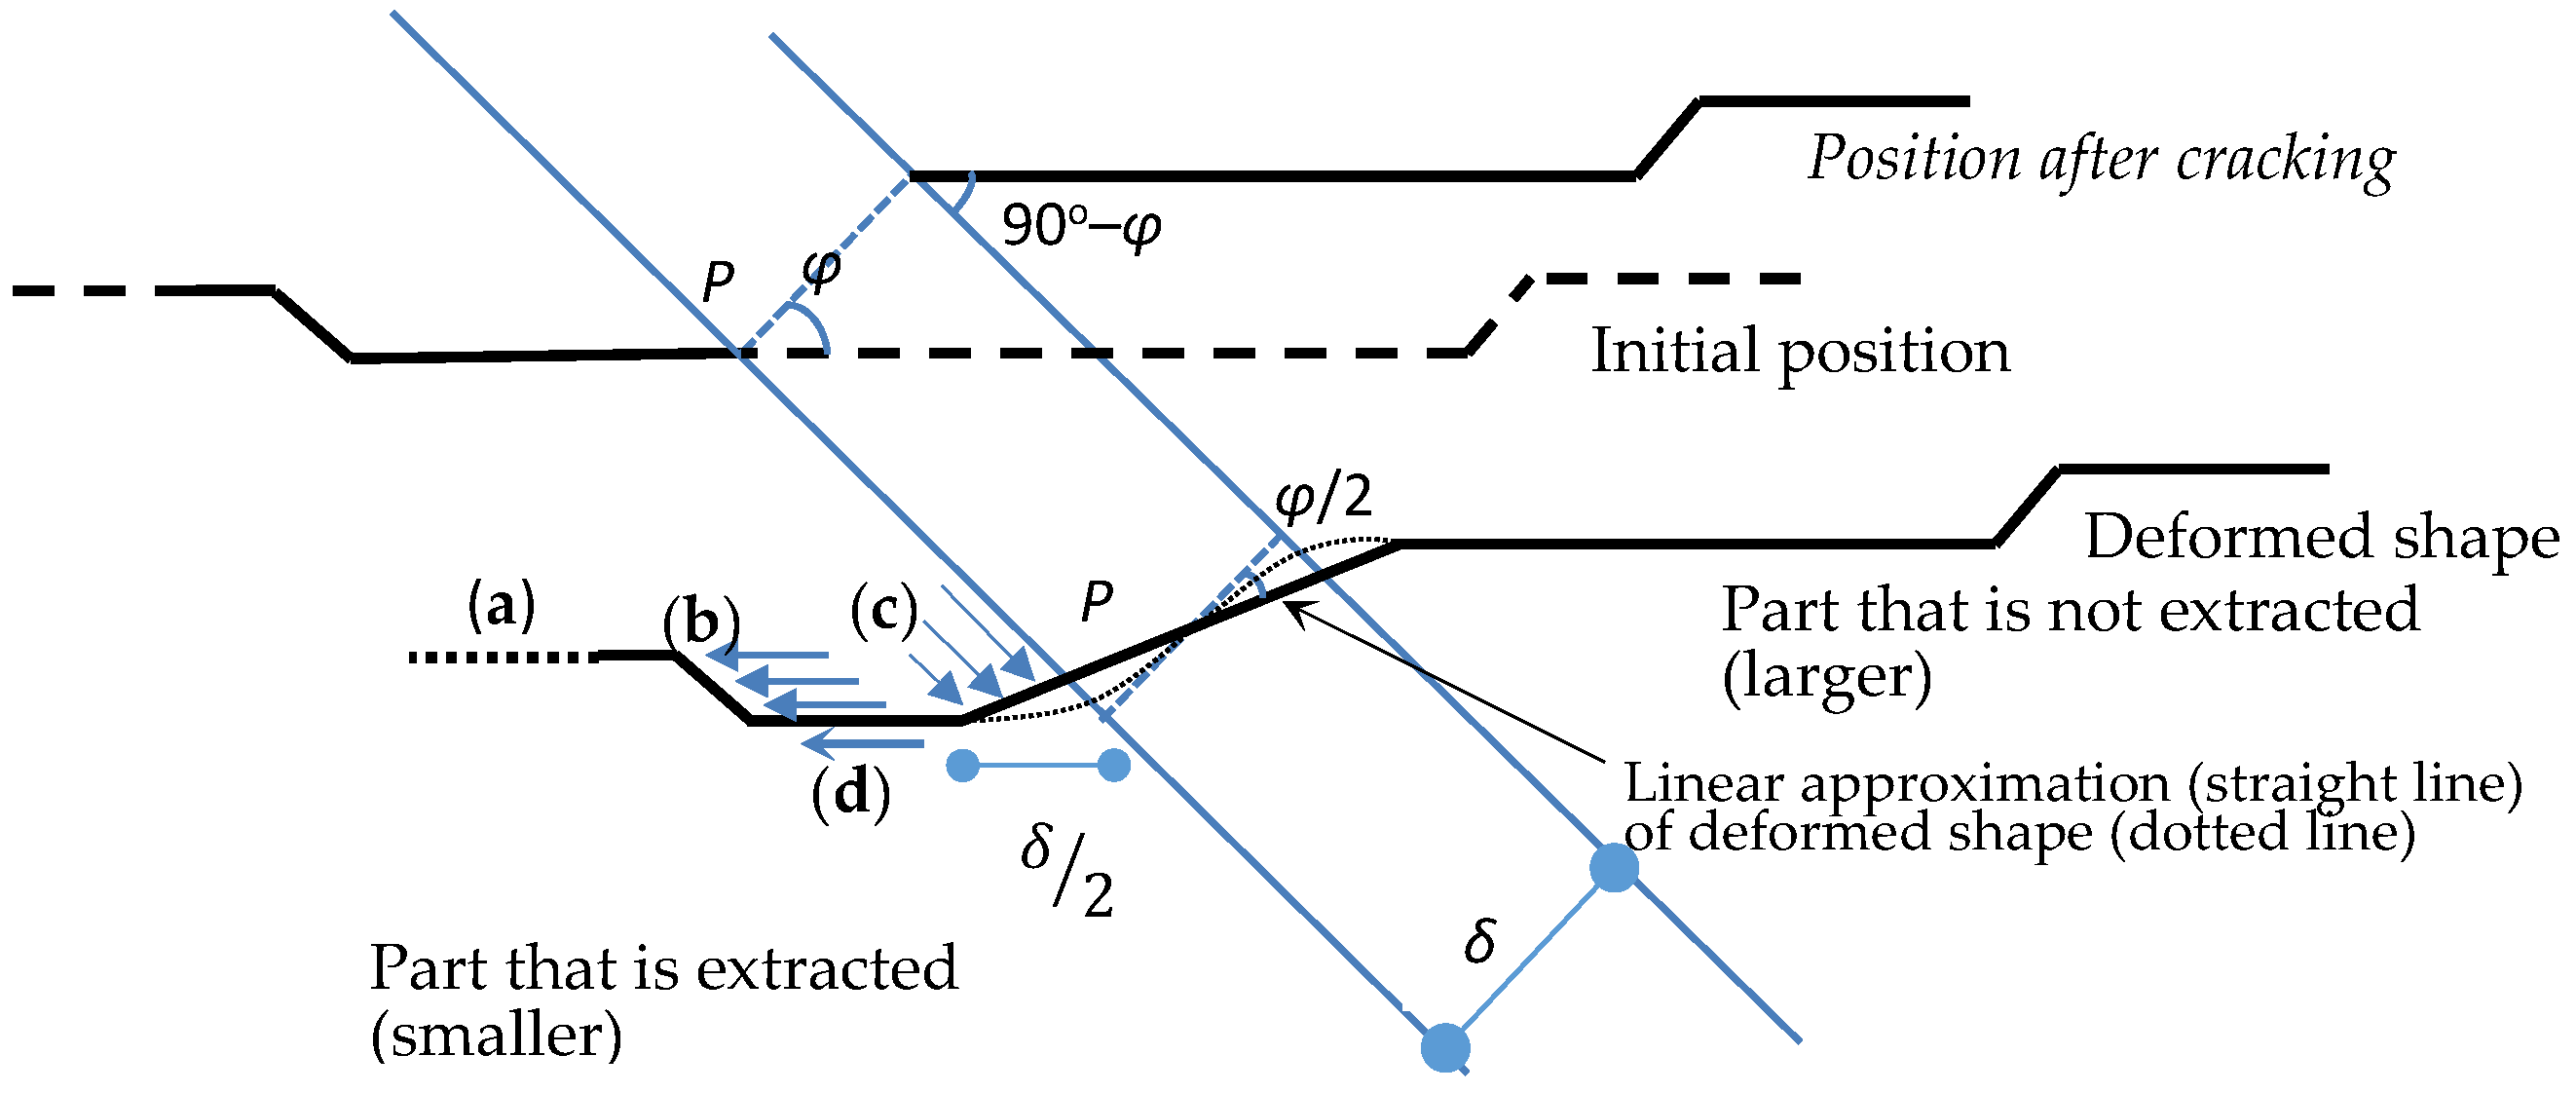
Figure 5.
Equilibrium forces for the part of a fiber that tends to extract (the smaller among two), the dotted line (a) symbolizes the beginning of the extraction.
Figure 5.
Equilibrium forces for the part of a fiber that tends to extract (the smaller among two), the dotted line (a) symbolizes the beginning of the extraction.
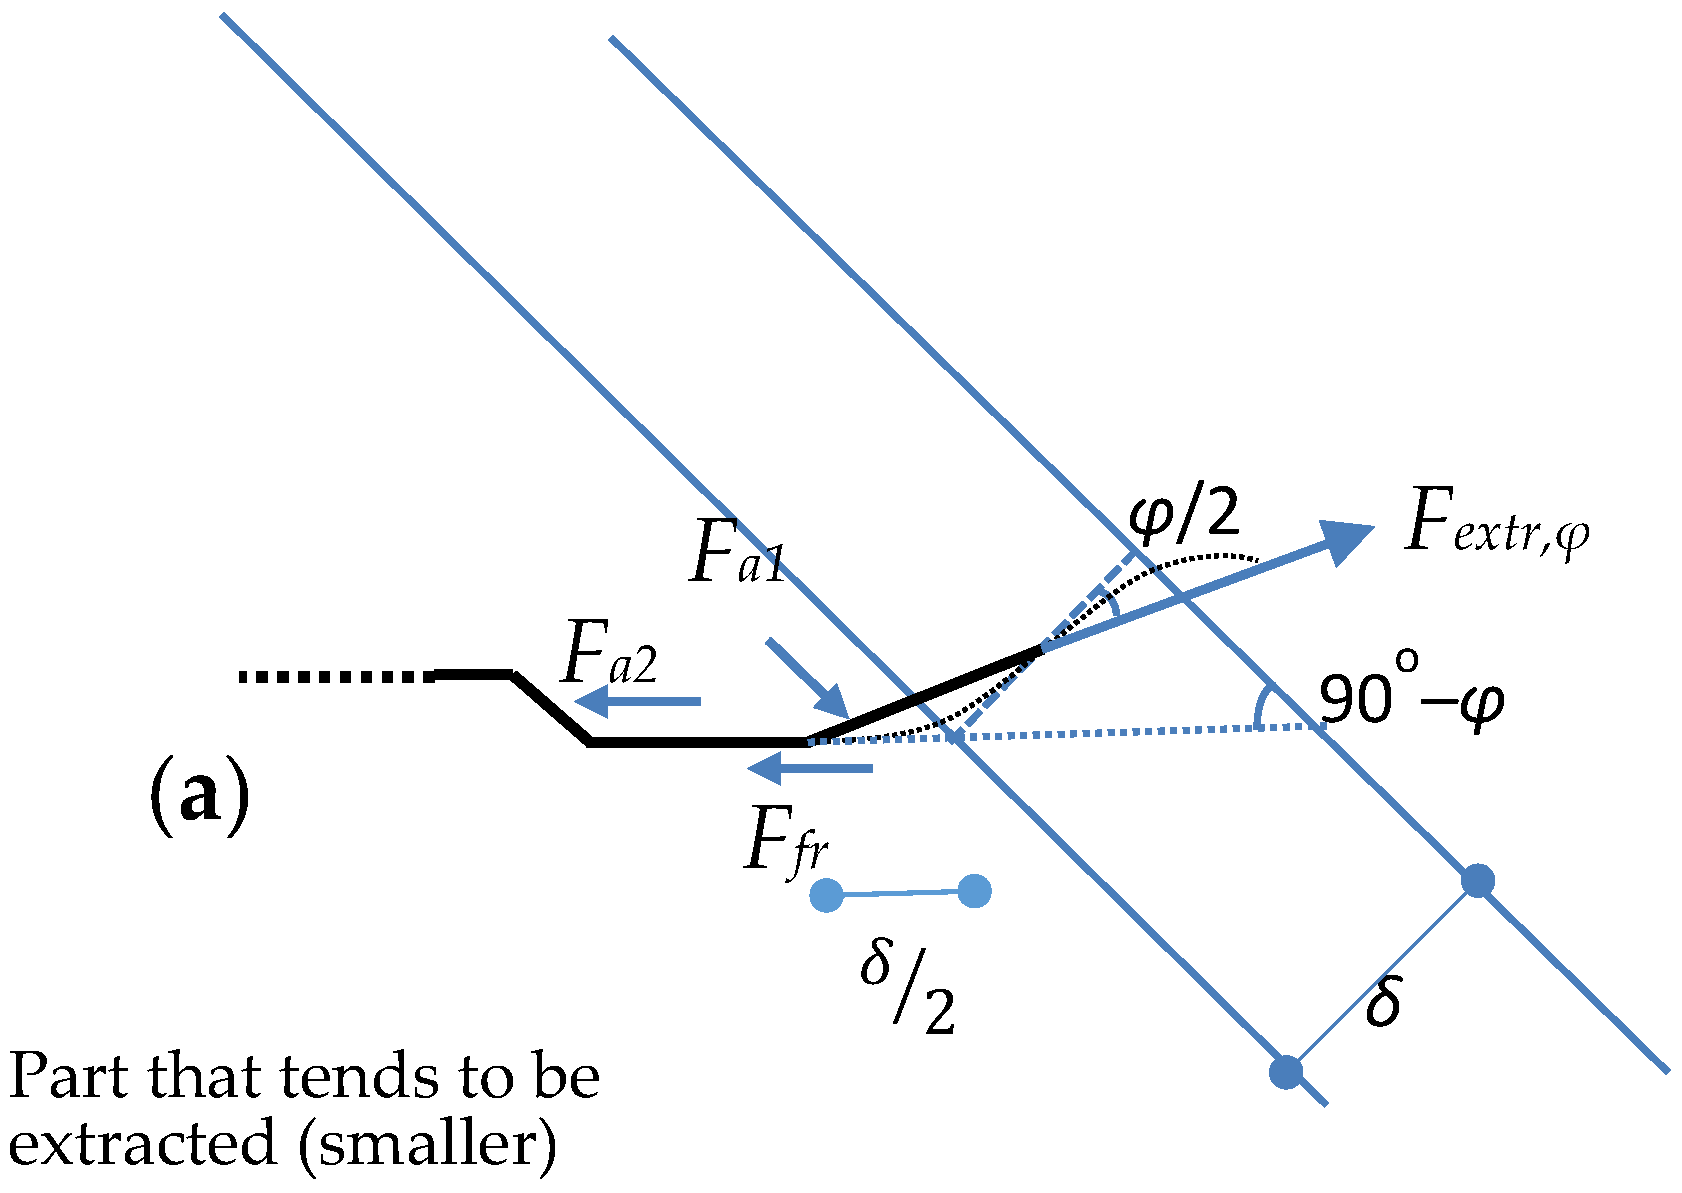
Figure 6.
Width (w) of strip that includes the center point of all fibers with orientation angle ϕ to the plane of the crack (P) that they cross.
Figure 6.
Width (w) of strip that includes the center point of all fibers with orientation angle ϕ to the plane of the crack (P) that they cross.

Figure 7.
Figure for the quantification of factor : (a) Maximum crack width (w) of the strip that includes the center point of all fibers with orientation angle ϕ to the plane of the crack (P) that cross it; (b) Ratio of the surface areas of a spherical segment.
Figure 7.
Figure for the quantification of factor : (a) Maximum crack width (w) of the strip that includes the center point of all fibers with orientation angle ϕ to the plane of the crack (P) that cross it; (b) Ratio of the surface areas of a spherical segment.

Figure 8.
Modeled sequence deformation of a single fiber crossing a crack (ϕ is the inclination of the fiber from the perpendicular to the crack direction, and δ (δ ≤ δmax,ϕ) is the width of the crack. (a): gradual shortening of the smaller part of the fiber due to extraction; (b): available extraction length at the formulation of the crack; (δmax,ϕ): maximum crack length that can be sustained by a fiber forming angle ϕ with a crack, with available distance to hook end equal to b.

Figure 9.
Overall pullout resistance of 300/300 mm section C25/30, ρ = 0.5%.
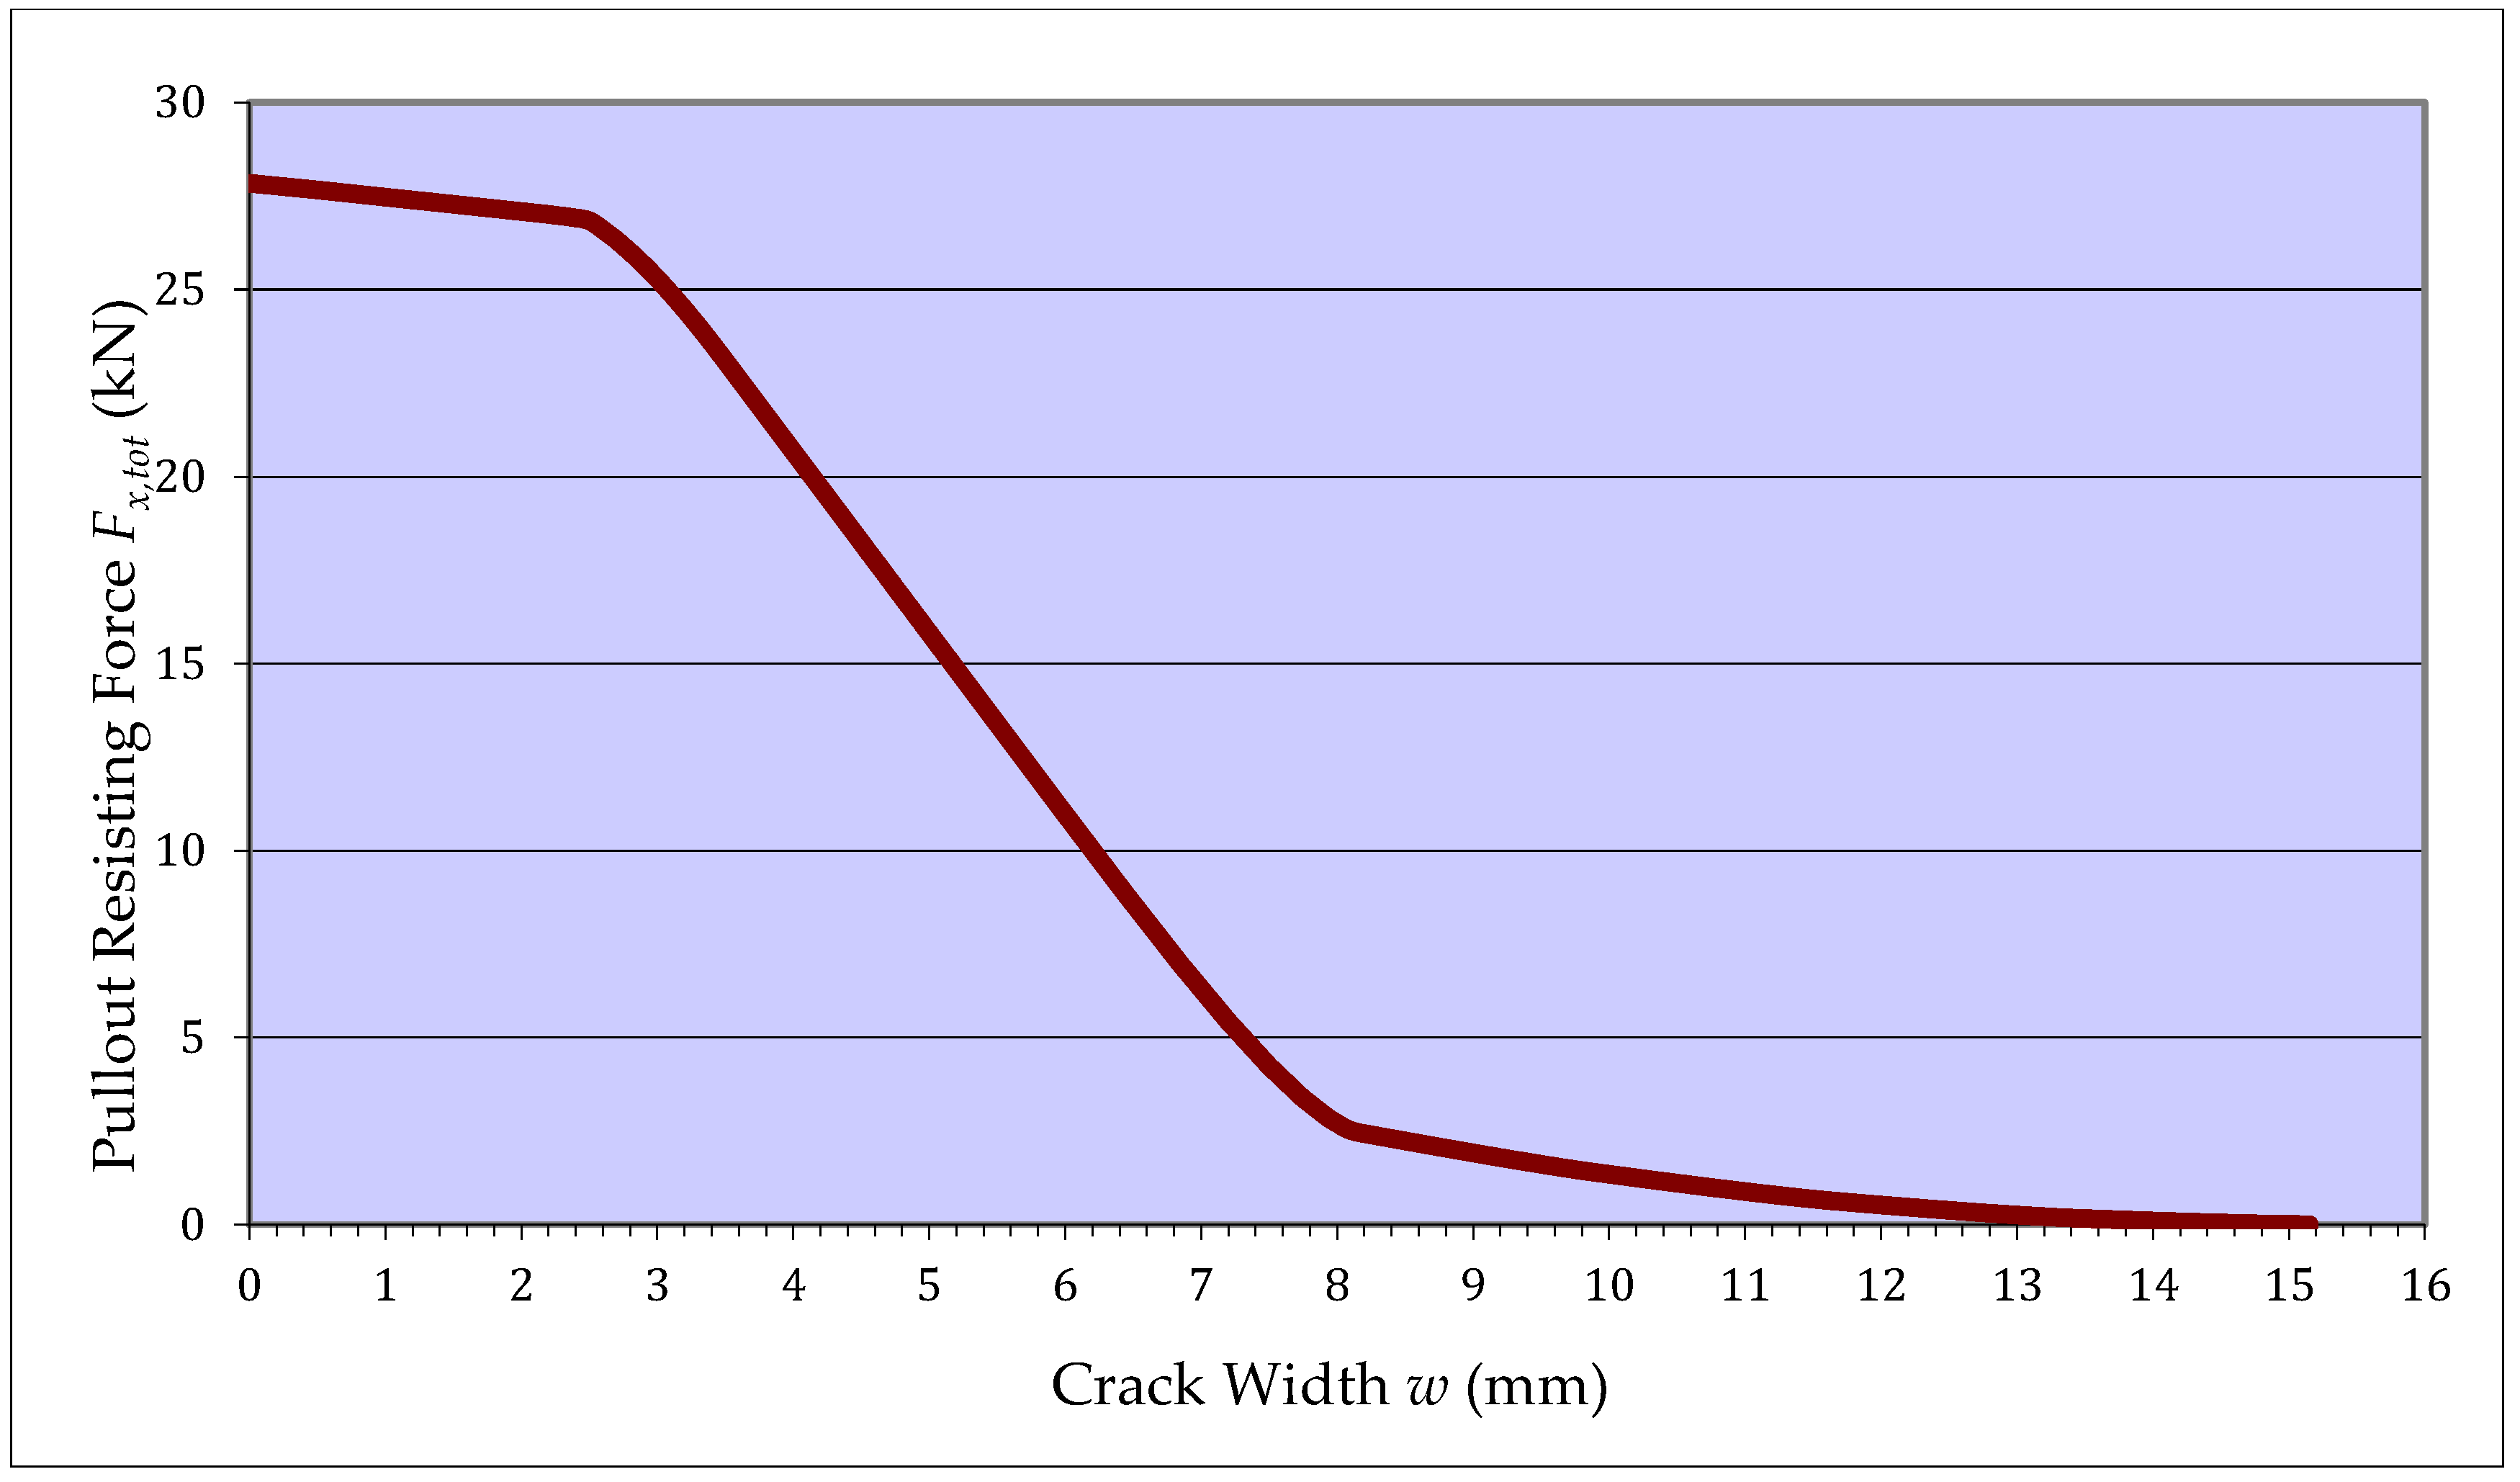
Figure 10.
The effectiveness ratio of the fiber in relevance with crack width for several steel hooked fibers. (Continuous lines for upper and lower bounds, dotted line for the case study presented in detail).
Figure 10.
The effectiveness ratio of the fiber in relevance with crack width for several steel hooked fibers. (Continuous lines for upper and lower bounds, dotted line for the case study presented in detail).

Table 1.
Number of fibers traversing the crack plane.
| Intervals for ϕ | Number of Fibers Nϕ |
|---|---|
| (0°–10°) | 2.12 |
| (10°–20°) | 6.30 |
| (20°–30°) | 10.29 |
| (30°–40°) | 13.97 |
| (40°–50°) | 17.22 |
| (50°–60°) | 19.95 |
| (60°–70°) | 22.08 |
| (70°–80°) | 23.53 |
| (80°–90°) | 24.27 |
| Total | 139.74 |
Table 2.
Participation factor of a fiber, in accordance with the intersection point with a crack.
| Crossing Point | Length of Middle Part l1’ (mm) | Total Length lav (mm) | Total Pullout Force B (kN) | Participation Factor |
|---|---|---|---|---|
| 0 (at the hook) | 0 | 8.089 | 0.1646 | 78.8% |
| l1/8 | 1.75 | 9.839 | 0.1758 | 84.1% |
| l1/4 | 3.5 | 11.589 | 0.1869 | 89.4% |
| 3l1/8 | 5.25 | 13.339 | 0.1980 | 94.7% |
| l1/2 | 7 | 15.089 | 0.2091 | 100.0% |
Table 3.
Quantification of the influence of the mechanisms that resist the crack opening.
| Crossing Point | Bond | Compressive Resistance | Friction | |||
|---|---|---|---|---|---|---|
| Fbd(kN) | Percentage | Fα(kN) | Percentage | Tfr(kN) | Percentage | |
| 0 | 0.0513 | 31.2% | 0.0664 | 40.3% | 0.0469 | 28.5% |
| l1/8 | 0.0624 | 35.5% | 0.0664 | 37.8% | 0.0469 | 26.7% |
| l1/4 | 0.0735 | 39.4% | 0.0664 | 35.5% | 0.0469 | 25.1% |
| 3l1/8 | 0.0846 | 42.8% | 0.0664 | 33.5% | 0.0469 | 23.7% |
| l1/2 | 0.0957 | 45.8% | 0.0664 | 31.8% | 0.0469 | 22.4% |
Table 4.
Maximum axial force and force coefficient perpendicular to the crack, with the corresponding maximum crack opening before extraction, in accordance to embedded length.
Table 4.
Maximum axial force and force coefficient perpendicular to the crack, with the corresponding maximum crack opening before extraction, in accordance to embedded length.
| Angle ϕ (°) | Maximum Axial Force Per Fiber (kN) | Coefficient Perprendicular to Crack (kN) | Maximum Crack Width before Fiber Extraction (mm),in Accordance to Embedded Length | ||||
|---|---|---|---|---|---|---|---|
| 0 (hook) | |||||||
| 5° | 0.1946 | 0.1435 | 6.00 | 7.30 | 8.55 | 9.90 | 11.15 |
| 15° | 0.1994 | 0.1582 | 6.45 | 7.85 | 9.25 | 10.65 | 12.00 |
| 25° | 0.2028 | 0.1710 | 6.85 | 8.35 | 9.80 | 11.30 | 12.75 |
| 35° | 0.2046 | 0.1815 | 7.20 | 8.80 | 10.35 | 11.90 | 13.45 |
| 45° | 0.2048 | 0.1892 | 7.50 | 9.15 | 10.75 | 12.40 | 14.00 |
| 55° | 0.2035 | 0.1941 | 7.75 | 9.45 | 11.10 | 12.80 | 14.45 |
| 65° | 0.2006 | 0.1959 | 7.95 | 9.65 | 11.35 | 13.10 | 14.85 |
| 75° | 0.1962 | 0.1946 | 8.10 | 9.80 | 11.55 | 13.30 | 15.15 |
| 85° | 0.1903 | 0.1902 | 8.15 | 9.90 | 11.65 | 13.40 | 15.15 |
© 2017 by the authors. Licensee MDPI, Basel, Switzerland. This article is an open access article distributed under the terms and conditions of the Creative Commons Attribution (CC BY) license (http://creativecommons.org/licenses/by/4.0/).
Share and Cite
MDPI and ACS Style
Vougioukas, E.; Papadatou, M. A Model for the Prediction of the Tensile Strength of Fiber-Reinforced Concrete Members, Before and After Cracking. Fibers 2017, 5, 27. https://doi.org/10.3390/fib5030027
AMA Style
Vougioukas E, Papadatou M. A Model for the Prediction of the Tensile Strength of Fiber-Reinforced Concrete Members, Before and After Cracking. Fibers. 2017; 5(3):27. https://doi.org/10.3390/fib5030027
Chicago/Turabian StyleVougioukas, Emmanouil, and Maria Papadatou. 2017. "A Model for the Prediction of the Tensile Strength of Fiber-Reinforced Concrete Members, Before and After Cracking" Fibers 5, no. 3: 27. https://doi.org/10.3390/fib5030027
Note that from the first issue of 2016, this journal uses article numbers instead of page numbers. See further details here.