Revolver Hollow Core Optical Fibers
by
Igor A. Bufetov
, 
Alexey F. Kosolapov
*,
Andrey D. Pryamikov
, 
Alexey V. Gladyshev
,
Anton N. Kolyadin
,
Alexander A. Krylov
,
Yury P. Yatsenko
and
Alexander S. Biriukov
Fiber Optics Research Center, Russian Academy of Sciences, Moscow 119333, Russia
*
Author to whom correspondence should be addressed.
Fibers 2018, 6(2), 39; https://doi.org/10.3390/fib6020039
Submission received: 15 May 2018
/
Revised: 4 June 2018
/
Accepted: 5 June 2018
/
Published: 7 June 2018
(This article belongs to the Special Issue Hollow Core Optical Fibers)
Abstract
:Revolver optical fibers (RF) are special type of hollow-core optical fibers with negative curvature of the core-cladding boundary and with cladding that is formed by a one ring layer of capillaries. The physical mechanisms contributing to the waveguiding parameters of RFs are discussed. The optical properties and possible applications of RFs are reviewed. Special attention is paid to the mid-IR hydrogen Raman lasers that are based on RFs and generating in the wavelength region from 2.9 to 4.4 μm.
1. Introduction
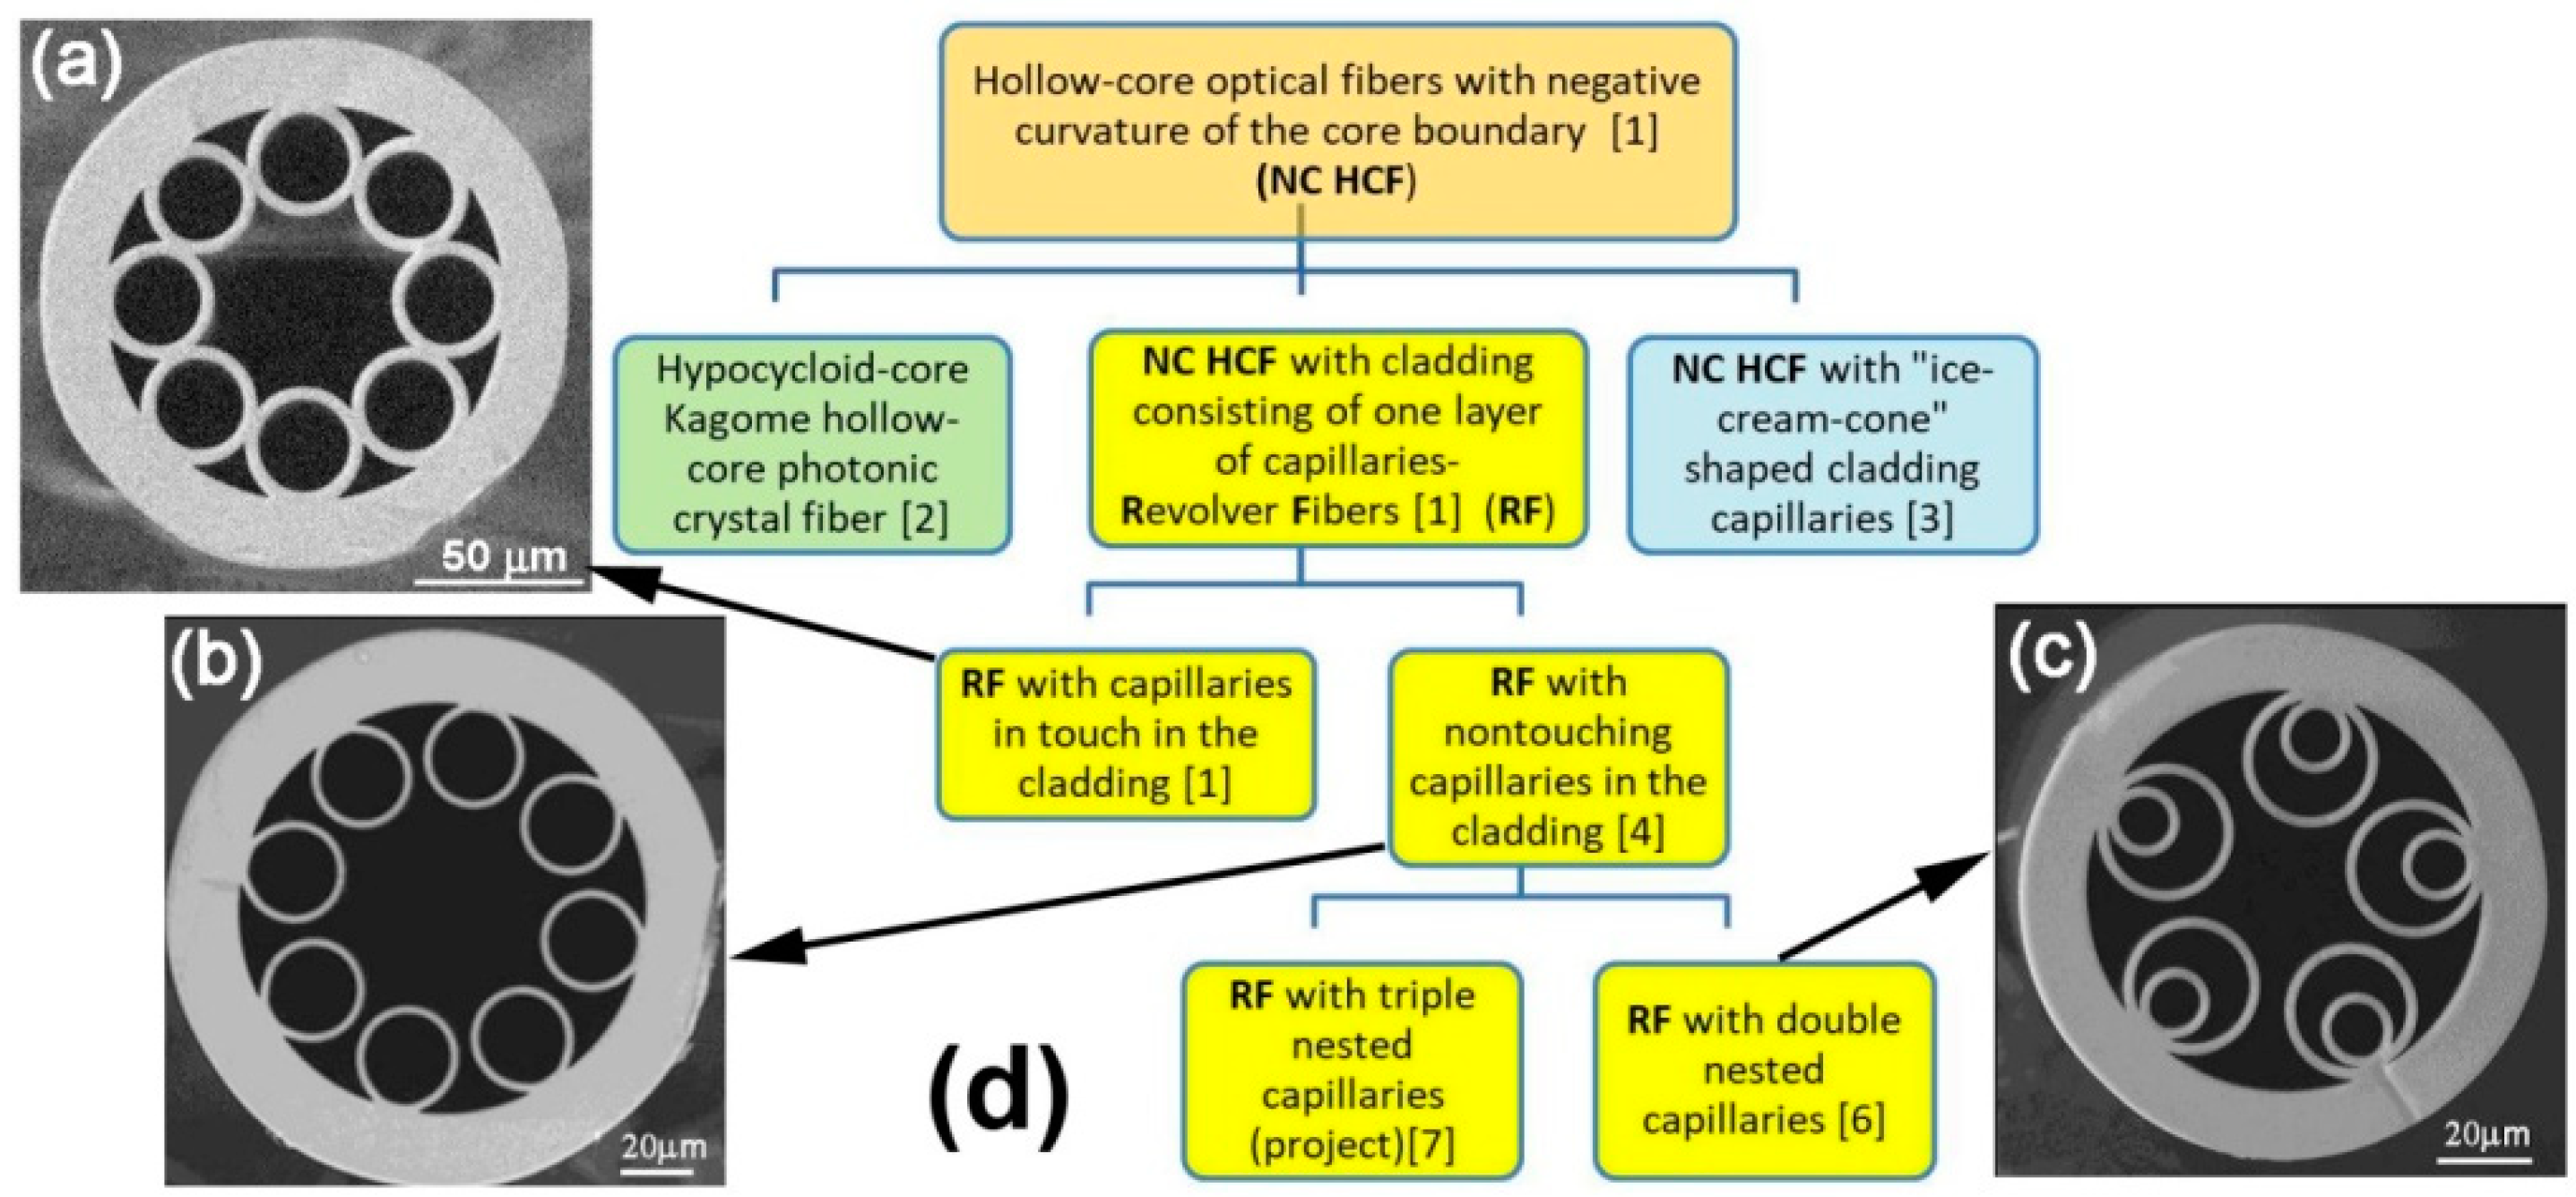
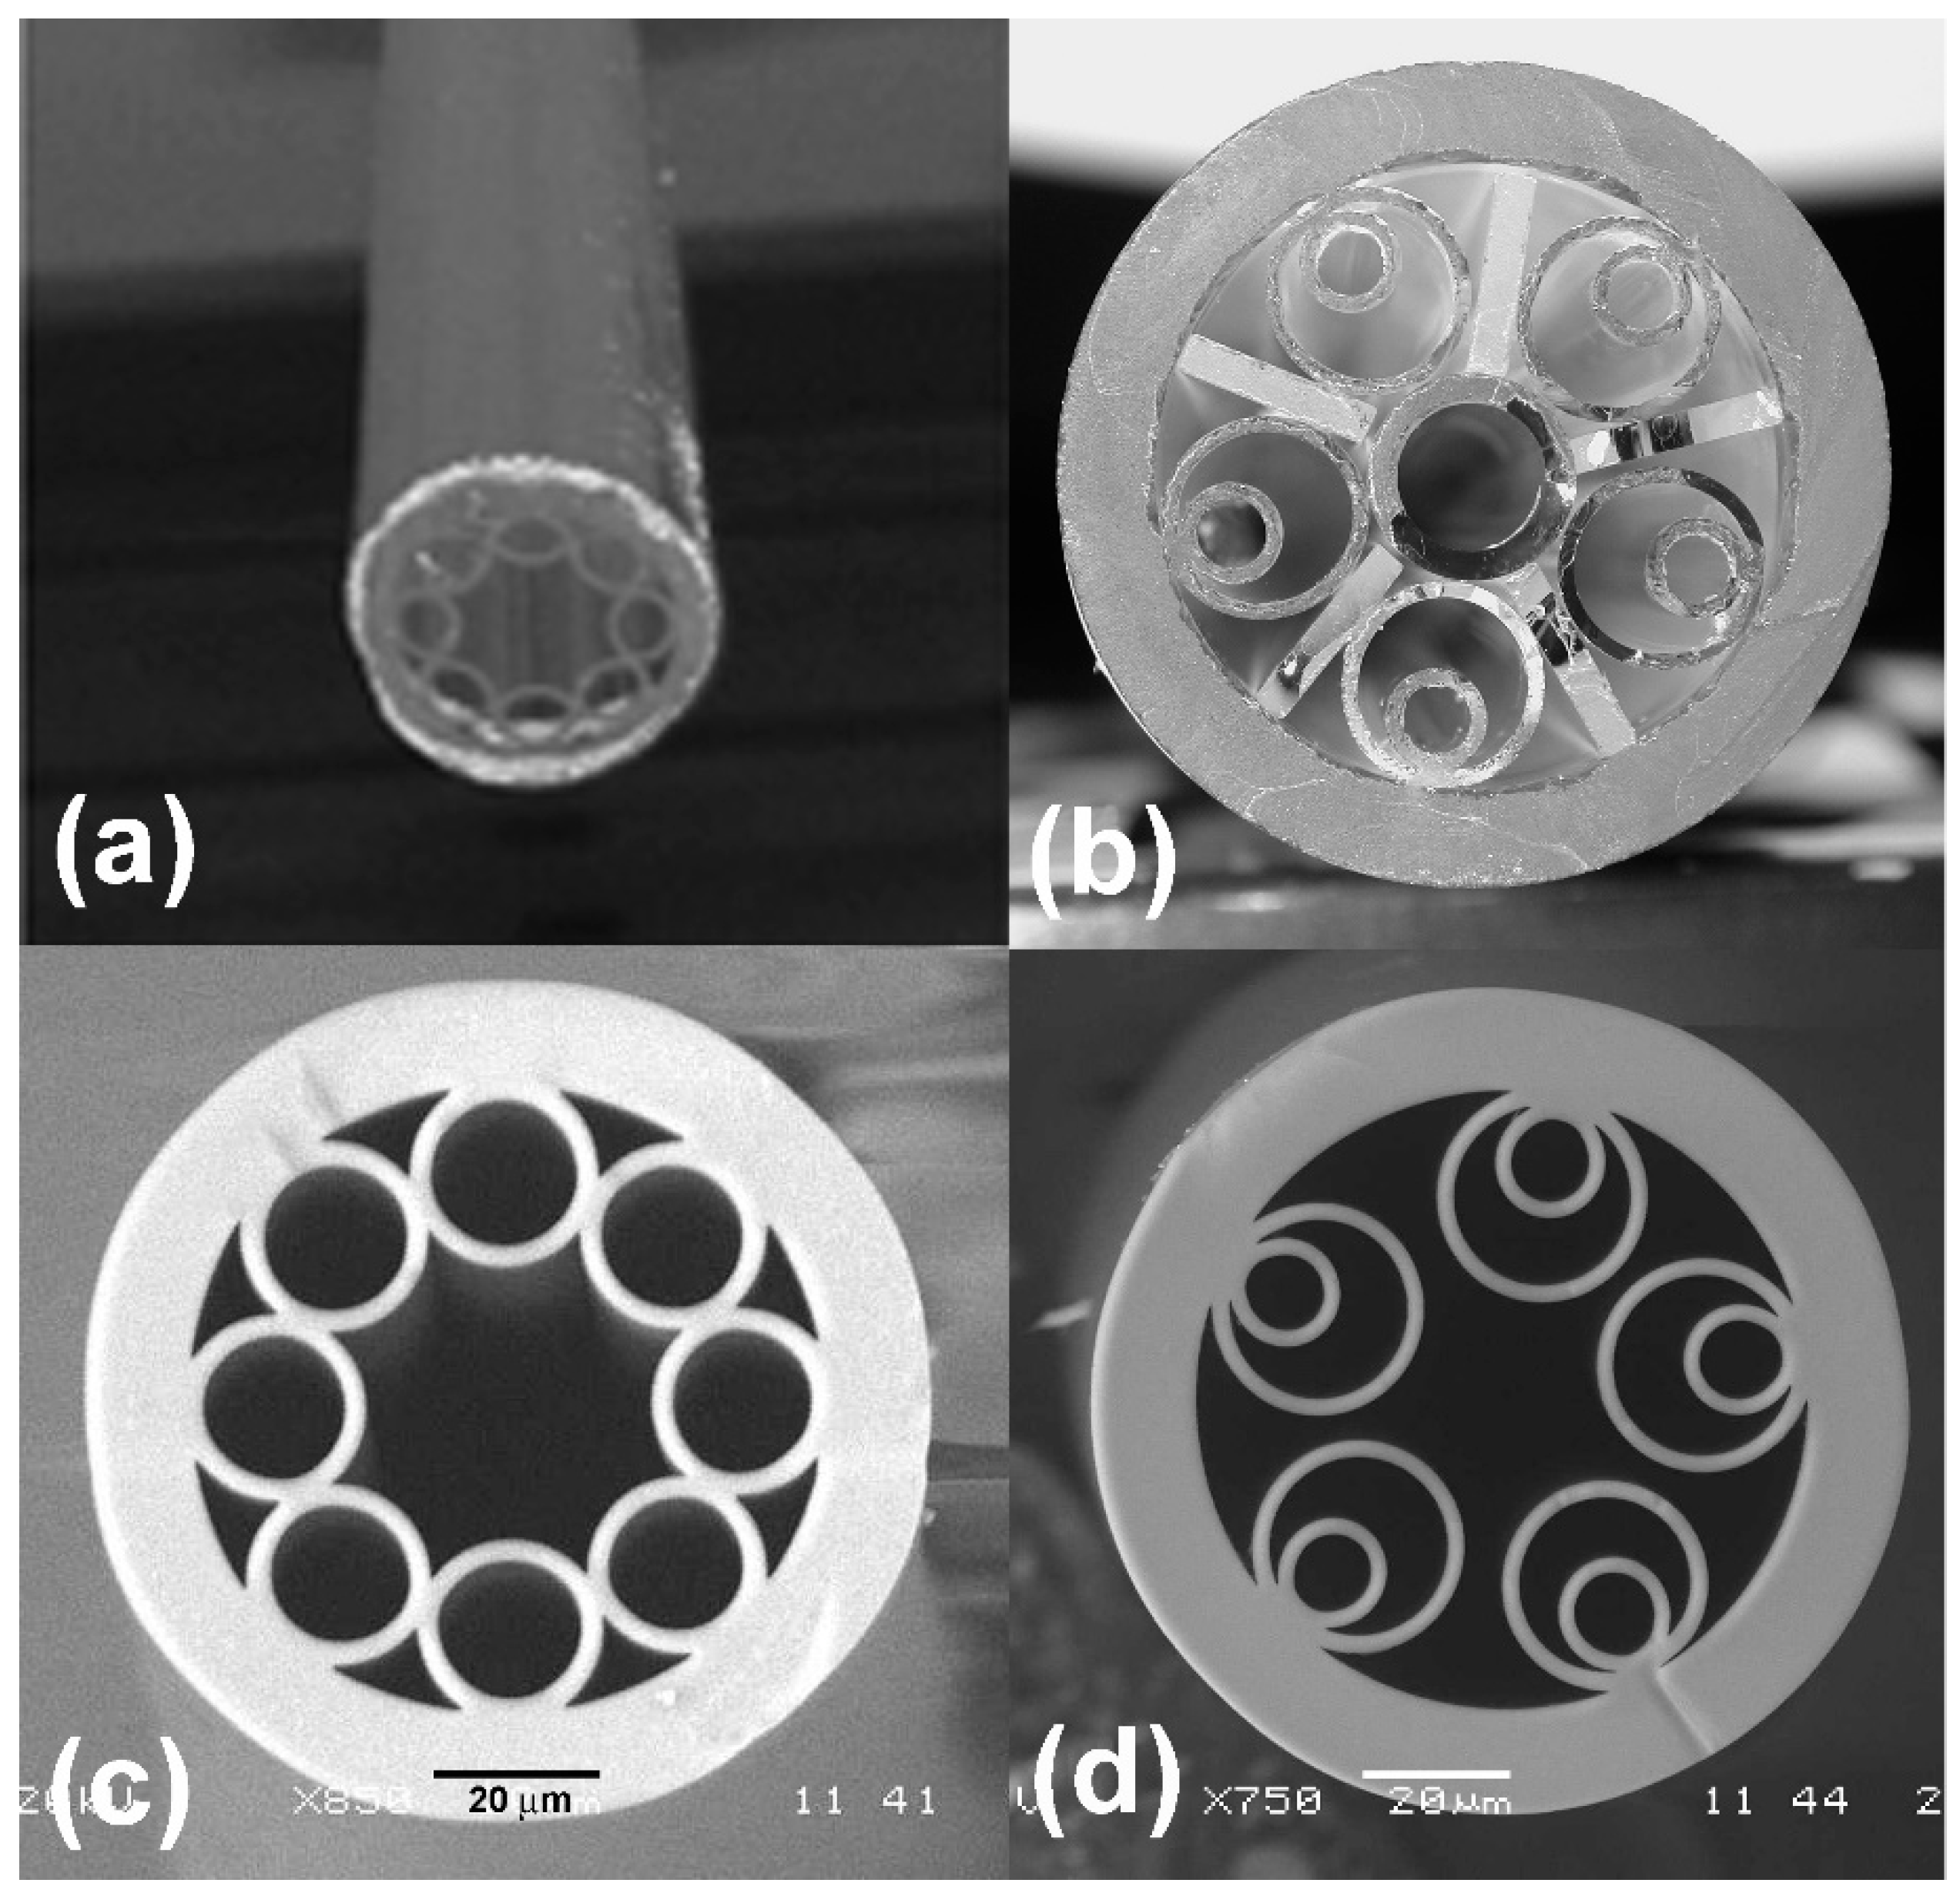
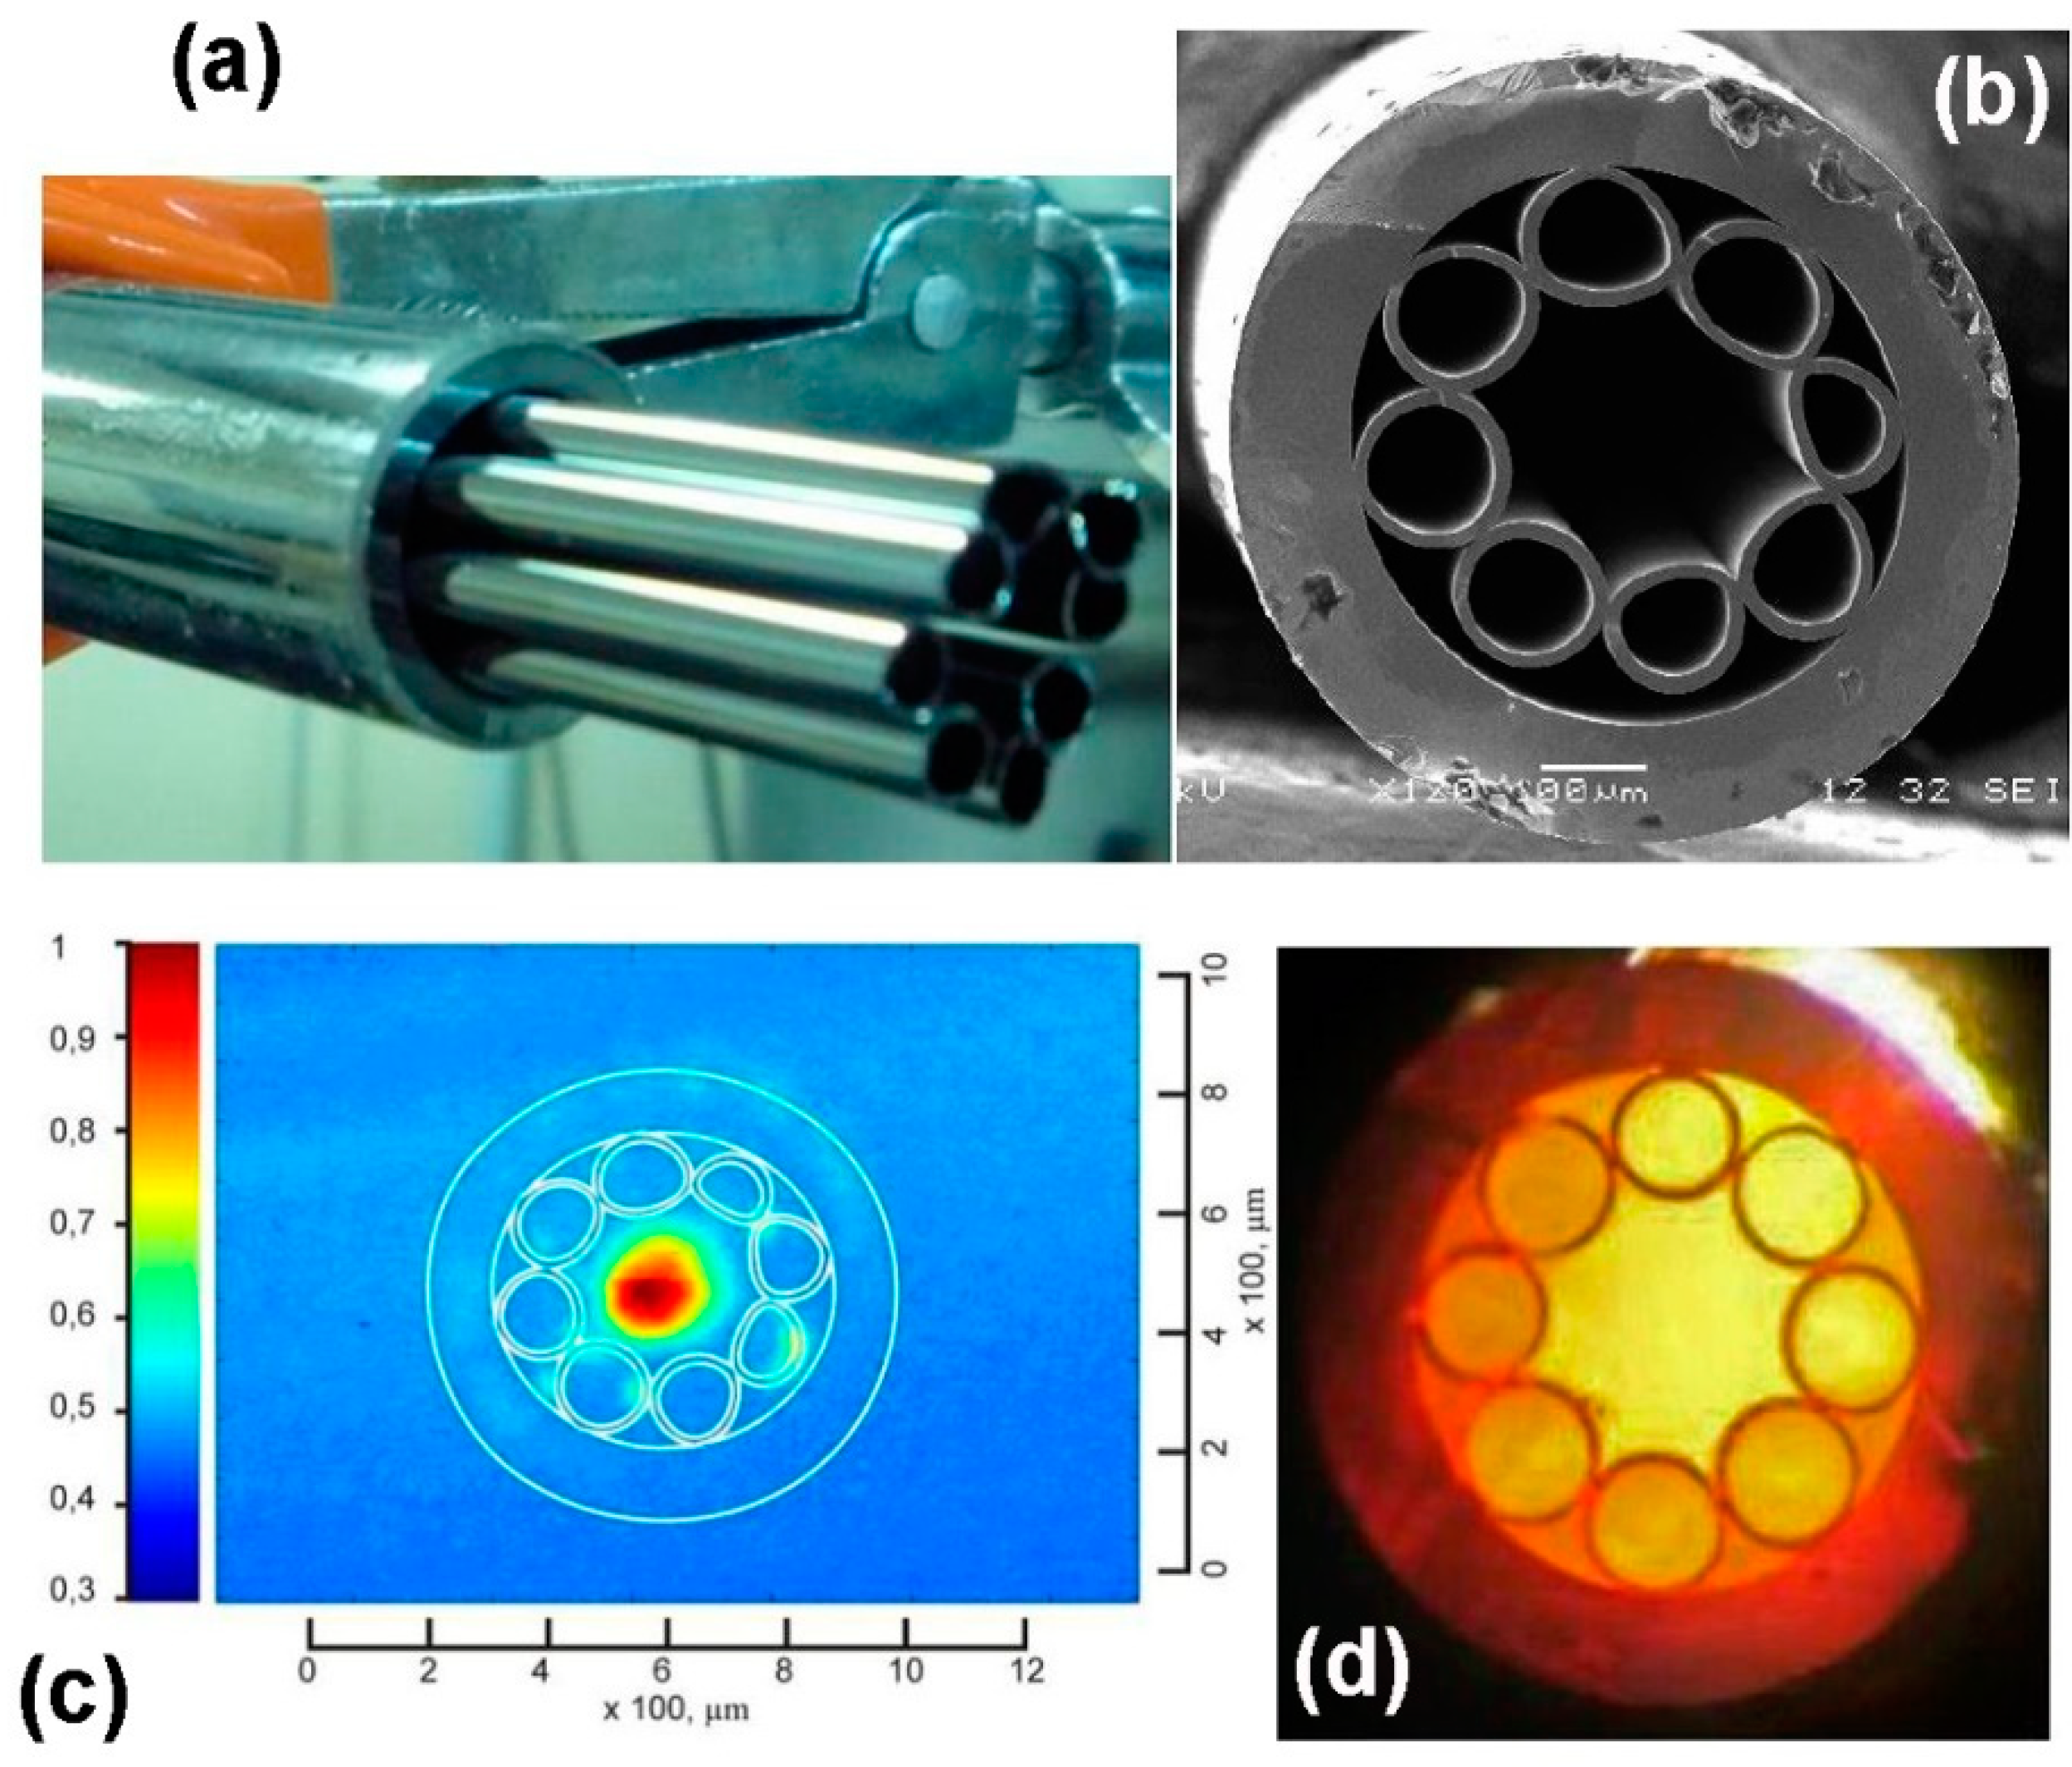
Revolver fibers (RF), which are a special type of hollow-core fibers (HCF), were proposed and experimentally realized for the first time in FORC RAS in 2011 [1]. Since then, various RF designs have been demonstrated (Figure 1a–c). The key concept behind RFs is the negative curvature of the core-cladding interface. For the first time, this concept was introduced in [1]; where it was clearly shown that it is negative curvature that reduces the optical losses in the HCF significantly.
The importance of this concept was highlighted by authors [1] who initially suggested referring to such fibers as negative-curvature hollow-core fibers (NC HCF). Later, the abbreviation “NC HCF” became also to be applied to other fiber designs, such as Kagome HCFs with hypocycloid core-cladding boundary [2], and HCFs with “ice-cream-cone” shaped cladding [3]. However, RFs should be distinguished among other types of NC HCFs, because (1) the RFs provide an extremely low overlap of the optical mode with the cladding material and (2) RFs have very simple design of the cladding, which is based on a single layer of cylindrical or elliptical capillaries, and this fact enables new possibilities to optimize the fiber performance [4]. The design simplicity makes RFs a new starting point for the further development of low loss HCFs (Figure 1a–c). To distinguish such fibers from other NC HCFs, a separate name “revolver fibers” was proposed in [5].
It should be noted that RF scarcely could be attributed to photonic crystal fibers (PCF). The key feature of PCFs is the structure of fiber cladding that can be described as some unit cell linearly translated with some period in two dimensions of the fiber cross section. This complex structured cladding defines optical bandgaps, which correspond to the transmission spectral bands of the PCF, and thus, governs the optical properties of fiber. Alternatively, the cladding of RFs is not structured as a crystal. The optical properties of RFs are defined by reflection of light on the elements of the core-cladding interface only.
This fact was confirmed by numerical simulations in many works (see, e.g., [8]). So, it seems not appropriate to refer RF as PCFs.
This review is organized as follows. Section 2 describes the general properties of RFs by simple analytical models. In Section 3, the properties of experimentally realized RFs are reviewed and supported by numerical simulations. Section 4 is devoted to a fabrication technology of the revolver fibers. Then, some applications of the RFs are discussed in Section 5, which reviews the recent advances in mid-infrared Raman lasers based on gas-filled revolver fibers, and in Section 6, where short pulse propagation in air-filled RFs is considered.
2. Physical Demonstrative Approach to the Waveguiding Properties of RF
Unlike PCFs that use the phenomenon of the energy band gaps formation to limit the propagation of light in a direction perpendicular to the axis of the fiber, the waveguiding properties of RFs are due to the reflection of radiation from structures that are located at the core-cladding interface. This interface influences the optical properties of RFs by means of many interrelated geometrical parameters, such as diameter of the hollow core, the shape and number of capillaries in the cladding, capillary diameter and wall thickness, etc. Usually, the effects of all geometrical parameters are precisely taken into account via time consuming numerical simulations (see, e.g., recent extensive review [9] and references therein). This Section, however, highlights the fact that general waveguiding properties of revolver fibers can be understood on the basis of simple analytical models using a kind of method of successive approximations.
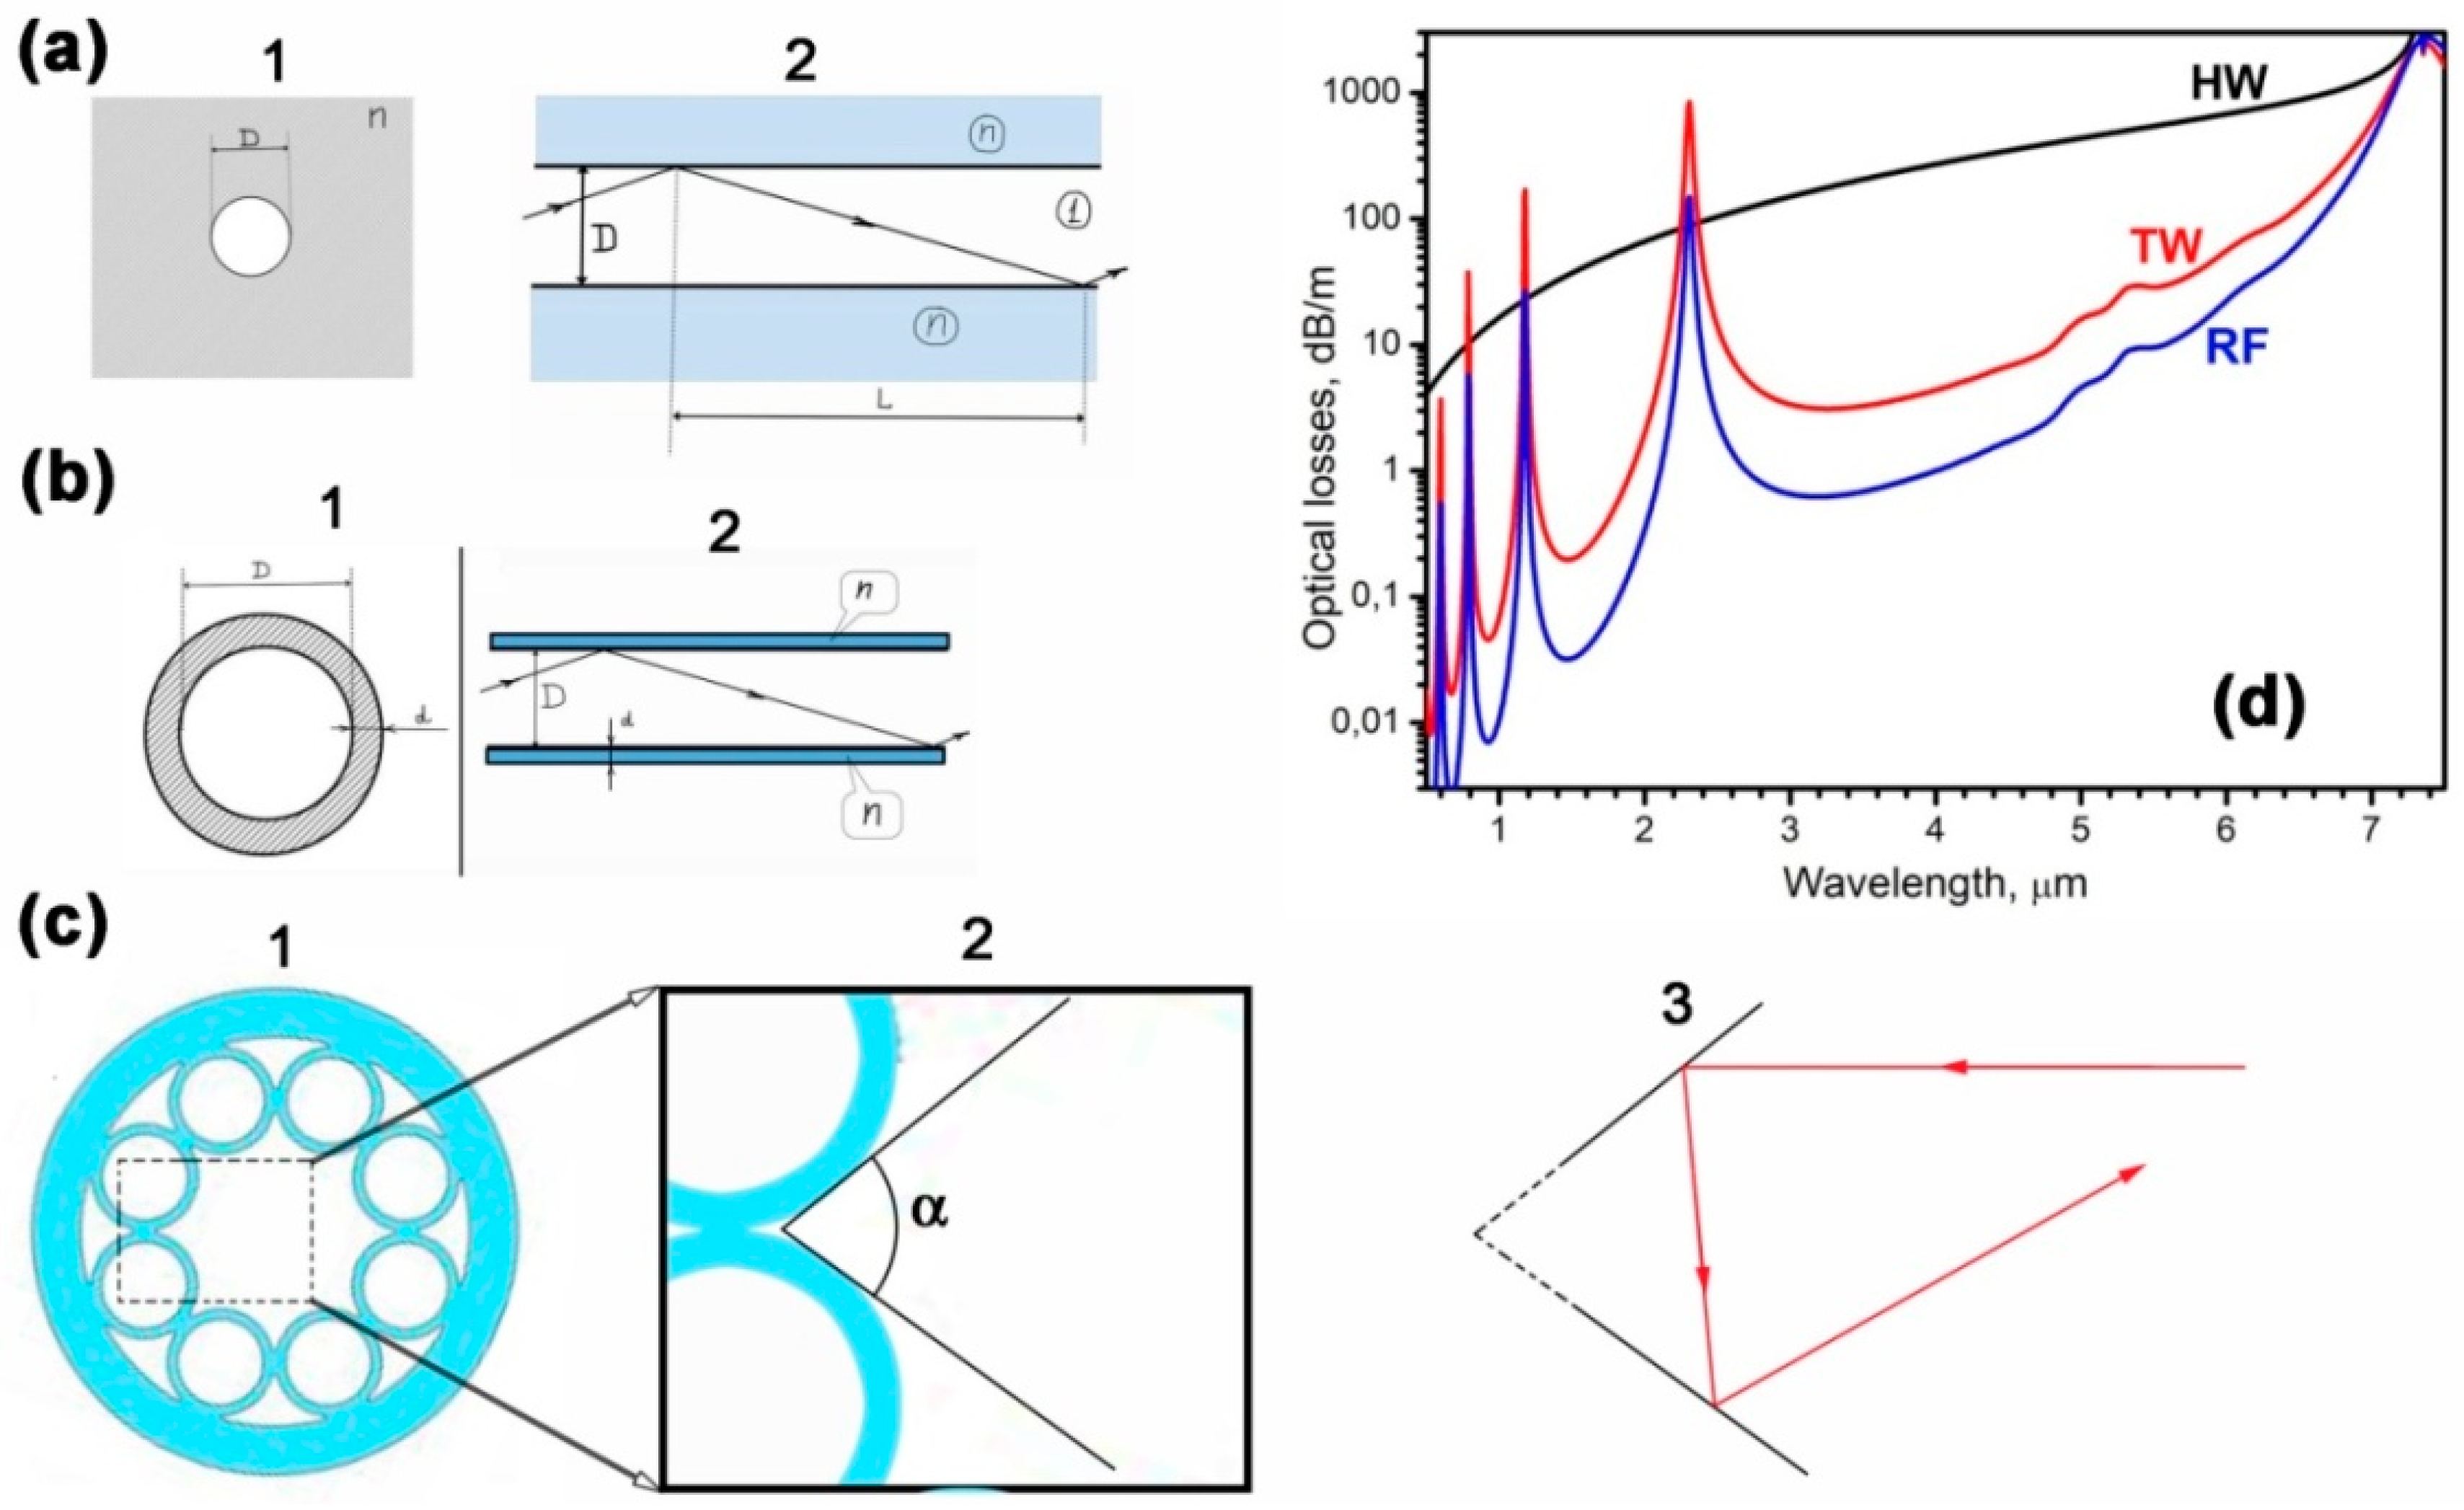
As an initial approximation to RF, one can take the simplest model of optical waveguide in the form of an opening in a dielectric (its scheme is depicted in Figure 2a). Such hollow waveguide (HW) was considered in detail in [10]. In this case, the Fresnel reflection from the surface separating the hollow core with the dielectric determines the optical loss level of this fiber (Figure 2d, line 1). It is possible to significantly reduce the optical losses of such a fiber by increasing the reflection coefficient from the core-cladding interface e.g., by reflection from two surfaces, using as a waveguide, a capillary with a thin glass wall (tube waveguide—TW) and constructive interference of radiation that is reflected from both surfaces of the capillary. Such a fiber was considered in [11], and it can be taken as a second approximation to RF (model TW). In this case, the capillary wall serves as a Fabry-Perot interferometer, the transmission spectrum of the optical fiber, respectively, acquires a band structure. When the resonance condition for the radiation incident on the wall at an incidence angle of almost π/2 is satisfied, the reflection coefficient decreases, which leads to large optical losses in the optical fiber. If the resonance condition is violated (or the antiresonance condition is met), then the reflection coefficient from the capillary wall increases significantly and the optical fiber transparency zones are formed (see Figure 2d, line 2). Later, such a mechanism was actually re-considered in [12], and it was given the abbreviated name ARROW (AntiResonant Reflecting Optical Waveguide). Note that it is possible to further develop the resonantly reflecting structure of the fiber cladding (see, for example, [13]). In the case of RF, such a development leads to a structure with double nested capillaries [6,7] (see Figure 1c). Finally, an introduction of negative curvature at the core-cladding interface by forming a reflective cladding as a capillary layer (RF, [1]) preserves the band structure of the light transmission spectrum, but it leads to a further increase in the reflection coefficient of radiation at the core-cladding interface. As a consequence, the optical fiber losses are significantly reduced. This can be explained qualitatively, as follows. The parts of the capillaries walls that are located closer to the center of the core act as parts of the cladding in the TW model. Parts of the capillary walls, which deviate significantly from the circle inscribed into the RF core, interact with electromagnetic radiation as the sides of the corner with highly reflective coating (see Figure 2c, 2). In the ray approximation, it can be said that the light rays are reflected from these corner structures (see Figure 2c, 3), and the decrease in the glancing angle of the rays and the decrease in the radiation intensity as we approach the angle vertex [14] leads to a significant decrease in optical losses in comparison with the model TW. In addition, when the capillaries in the shell are separated by a distance d << from each other, where is the component of the wave vector perpendicular to the axis of the fiber, the propagation conditions of the radiation along the core practically do not change. This roughly corresponds to the removal of a part of the “mirror” angle at its vertex, which is indicated by the dotted line in Figure 2c, 3. However, in this case, the excitation of the cladding modes that are associated with the areas of contact of capillaries with each other will be substantially reduced. All of this leads as a result to the further effective reduction of optical losses in the RFs. This was confirmed experimentally in [4].
Already in the case of HW, the high reflection coefficient at the core-cladding interface leads to the fact that the modes in HW are similar to the modes in perfect conducting metallic waveguides, when operating far from cutoff. This feature was mentioned in [10]. RFs, as any other NC HCFs, have an even higher reflection at the core-cladding boundary. For this reason, the radiation power in RF is even more concentrated in the hollow fiber core. In these circumstances, the optical absorption of the material, from which the RF is made, recedes into the background, while the optical losses of the RF become mostly defined by the geometric parameters of the optical fiber design and by the conditions for Fresnel reflection at the interfaces. This means that RF can be used to exploit a variety of optical phenomena, even in those spectral regions where the fiber material (e.g., silica) is opaque.
As shown by the simple RF models that are discussed above, the possibility of waveguiding the laser radiation with low losses in RFs in the UV and mid-IR spectral ranges is mainly due to dispersion of complex refractive index n(λ) = Re(n(λ)) + i·Im(n(λ)) of a fiber material. Note, the choice of materials for RFs is largely limited: up to now, RFs have been made of silica glass, chalcogenide glass [15], and organic glass (polymethylmethacrylate) [16]. Waveguiding properties are also influenced by the ratio of the wavelength to the basic geometric dimensions of RF, such asthe diameter of the hollow core Dcore and the thickness of the capillary walls d. However, this ratio can be optimized for a wavelength of interest during the fiber manufacturing process.
For RFs that are made of silica glass, the optical loss increases with wavelength in the mid-IR range up to a wavelength of 7.3 μm (see Figure 2d). This occurs for two reasons: Re(nSiO2) decreases [17], which leads to a decrease in the Fresnel reflection coefficient from air-glass surfaces (here the Fresnel reflection coefficient is mainly determined by the Re(nSiO2) value, since the value of Im(nSiO2) is small in comparison with unity). In addition, radiation absorption in the silica capillary wall begins to reveal itself in the wavelength region of about 5 μm. As a result, the efficiency of the ARROW mechanism decreases and the value of the reflection coefficient from the capillary wall starts to decrease further, approaching the values that are characteristic for the HW model. This is also true for longer wavelengths of the mid-IR range, with the exception of small regions around 7.3 μm, and possibly around 9 μm and 20 μm. Note, that around those wavelengths the value of Re(nSiO2) is close to unity, and reflection at the air-silica boundary is practically absent so that silica hollow core microstructured fibers (HCMFs) cannot demonstrate any waveguide properties.
In the near-IR and visible ranges, RF from silica, like silica glass itself, exhibit their best properties. While shifting along the wavelengths towards the UV band, the value of Re(nSiO2) increases, thus reducing the optical losses in RFs. However, at a wavelength of about 150 nm, the value of Im(nSiO2) has sharp increase, which, like in the mid-IR range, leads to the “shutdown” of the ARROW interference mechanism. As a result, the value of optical losses increases up to the level that is determined by only one reflection at the core-cladding interface (HW). Nevertheless, the results that were obtained show that silica-based RFs can be used up to vacuum ultraviolet (124 nm) [18]. In the case of RFs that are made of chalcogenide glass, the waveguiding properties of RFs have been demonstrated up to wavelengths ~10 μm [15]. THz radiation can also be transmitted in polymethylmethacrylate waveguides that are similar to RFs [16].
3. RF with Various Cladding Structures
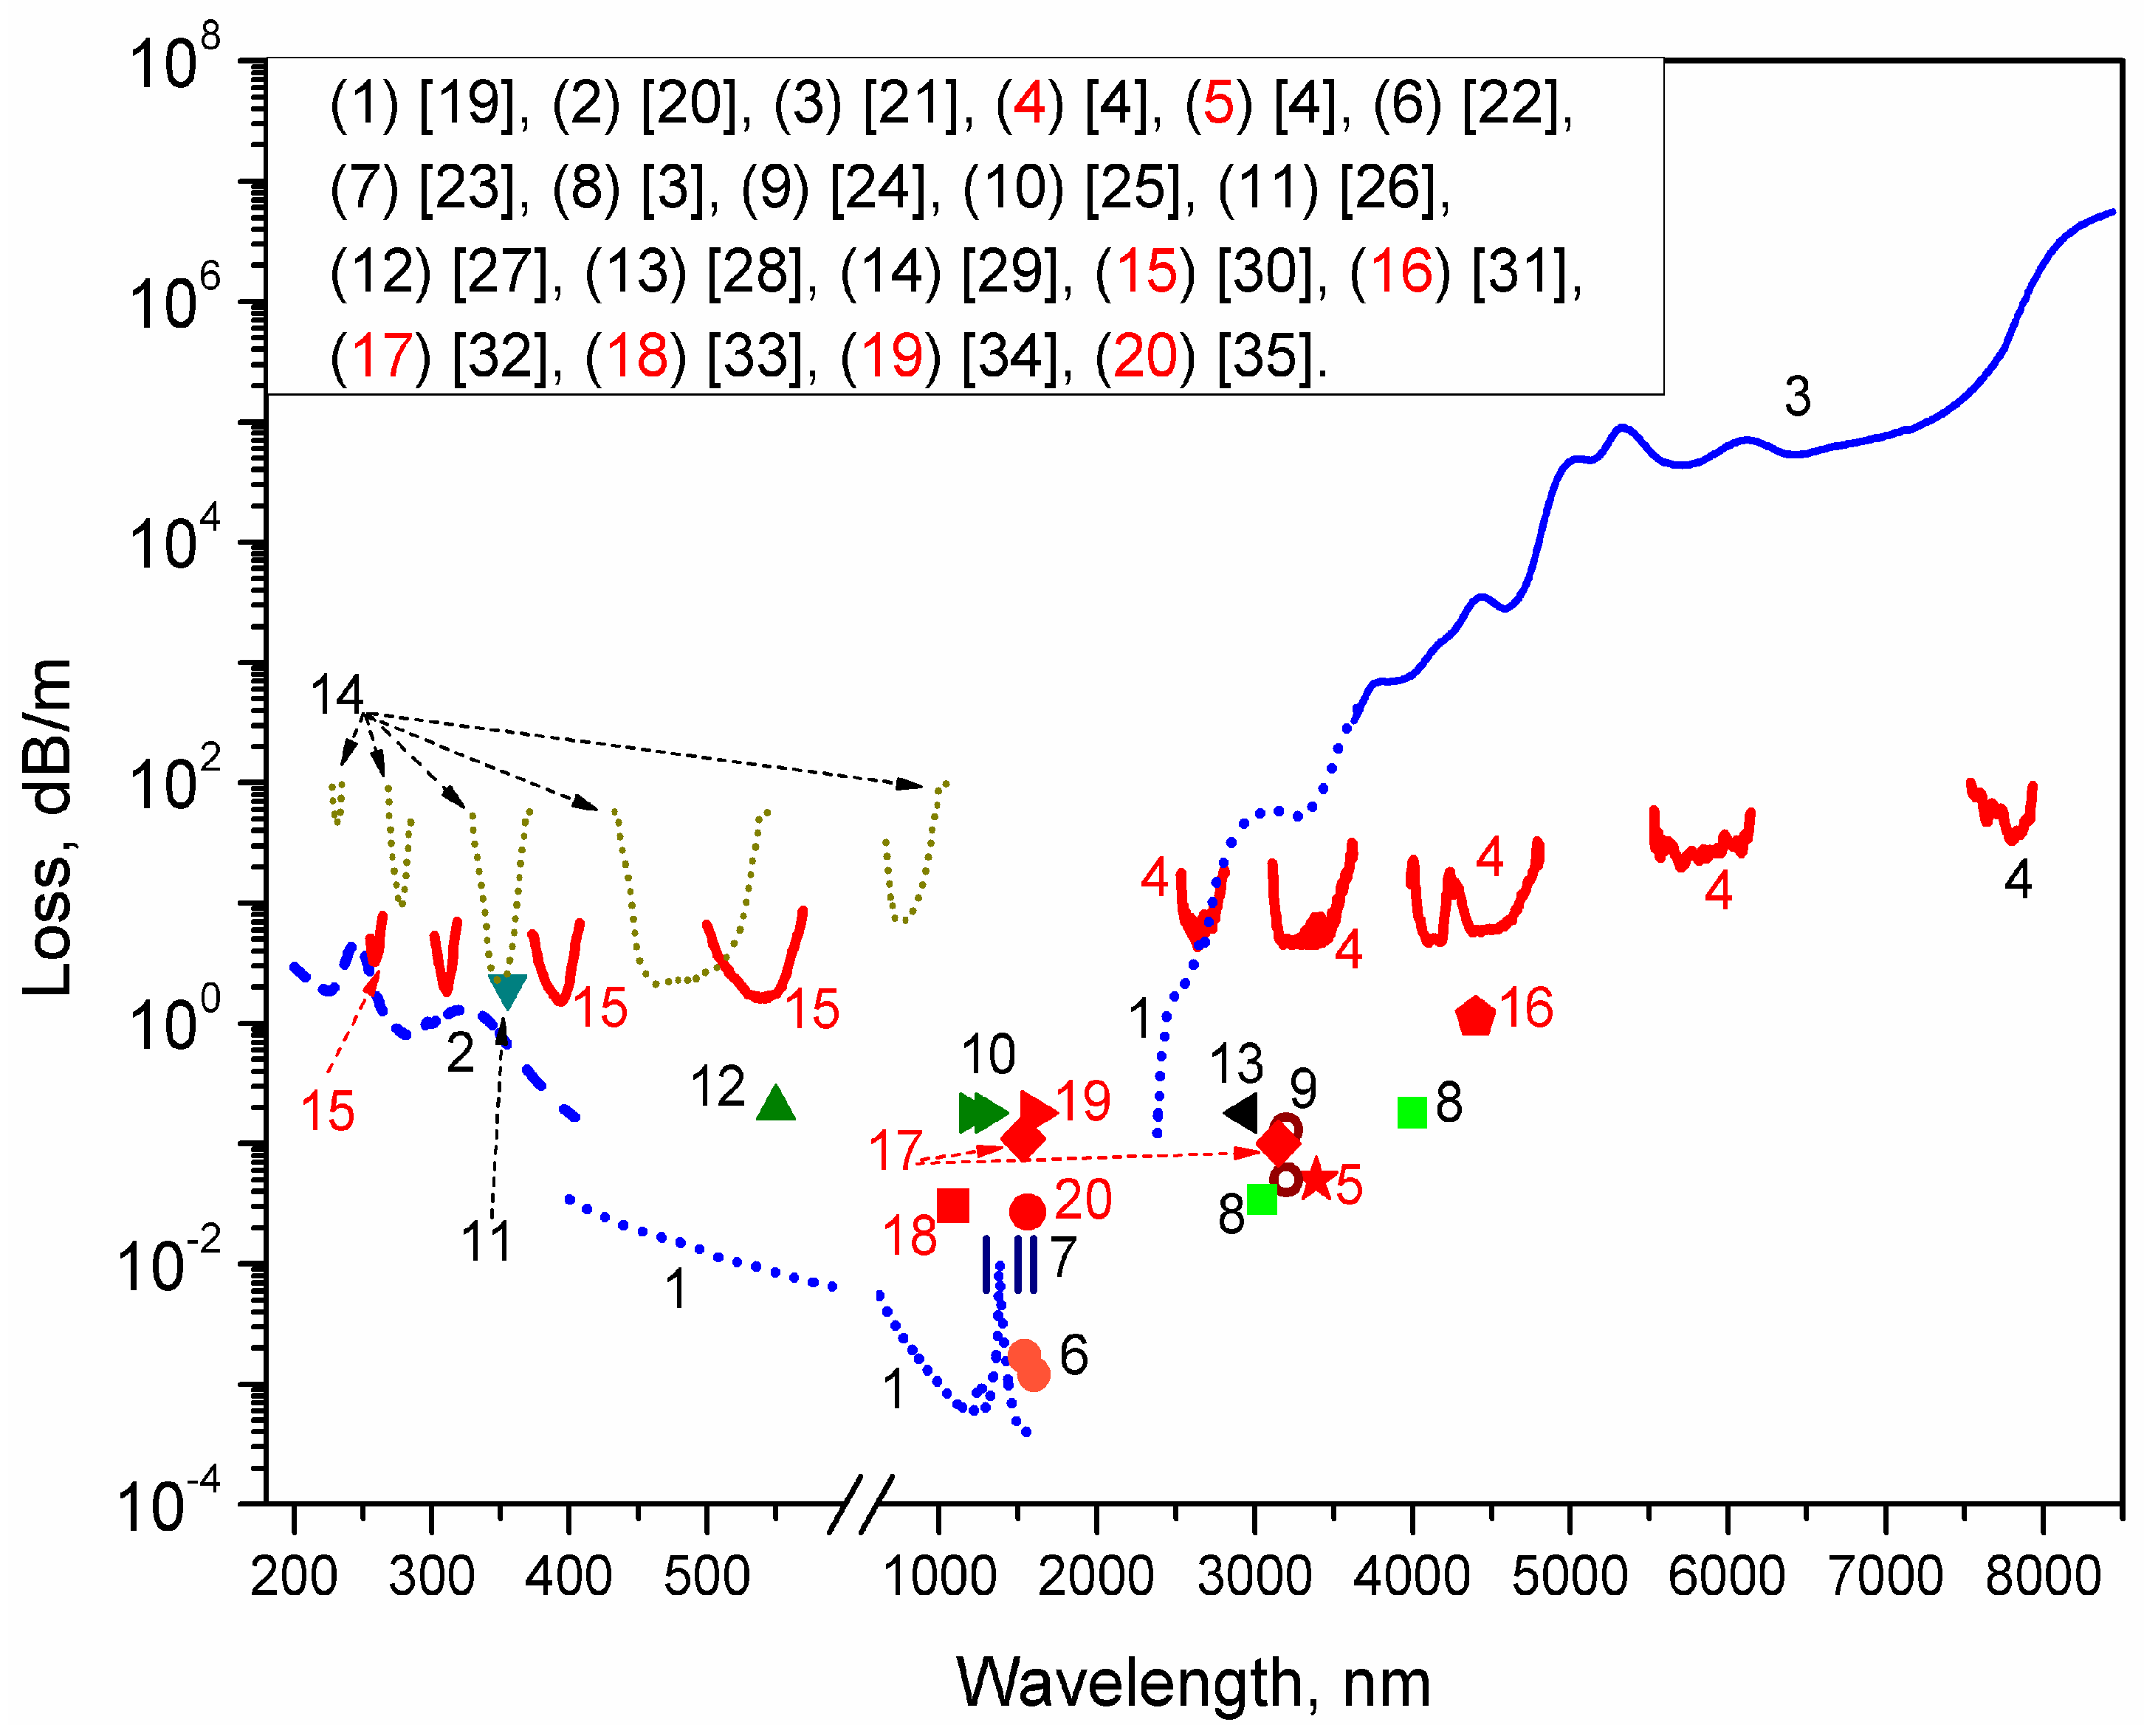
Spectral properties of RFs were investigated in detail by numerical simulation and experimentally. Optical loss is one of the main parameters of RFs. Figure 3 shows the most available now experimental data on optical losses in silica glass RFs of various types. For comparison, the optical losses in different types of silica glass HCFs and the absorption spectrum for pure silica glass are also shown. As can be seen in Figure 3, in the UV range the optical losses of RFs (Figure 3, data 15) are approaching to the absorption level of a pure silica glass (Figure 3, data 2), while HCFs that have square (data 14) and hexagonal (data 11) cores without negative curvature demonstrate properties that are similar to RFs. In the near-IR range, the photonic bandgap HCFs (data 6) have the lowest level of optical losses. At wavelengths 3–4.4 µm in the mid-IR both RFs (data 5, 16, 17) and “ice-cream-cone” shaped HCFs (data 8) show similar optical losses, which outperform the attenuation in pure silica glass (data 3). Note, the RFs (Figure 3, data 4, 16) are the only hollow-core silica fibers that have demonstrated optical transmission at wavelengths above ~4.4 µm.
Figure 3 indicates that RFs extend the applicability of silica glass technology into the mid-IR spectral range (above ~3 µm). For example, at the wavelength of 4.4 µm, where absorption coefficient of the silica glass is about 4000 dB/m (Figure 3, data 3), the RFs that are made of silica glass allowed for the demonstration of optical losses as low as 1 dB/m (Figure 3, data 16). One should note, that compared with RFs made of silica glass, the solid-core non-silica fibers have lower optical losses in the mid-IR. For example, optical losses less than 0.1 dB/m were demonstrated in fluoroindate fibers in the 2.0–4.5 µm spectral range [36] and in chalcogenide fibers at a wavelength of up to 6.5 µm [37,38]. At an even longer wavelength (8–16 µm), the silver halides fibers with optical losses below 1 dB/m are available [39]. In general, non-silica solid-core mid-IR fibers provide the level of optical losses that is 10–1000 times lower than the optical losses of the silica RFs at the same wavelengths. Nevertheless, the usage of RFs that are made of silica glass can be advantageous at wavelengths of up to ~5 µm, as reasonable level of optical attenuation can be achieved using well-developed silica glass technology. Moreover, a damage threshold of RFs is much higher when compared with solid-core non-silica mid-IR fibers. Thus, hollow-core silica RFs are indispensable for high power applications.
3.1. RFs with Touching and Non-Touching Capillaries in a Cladding
After the first RFs that had touching capillaries in the cladding (Figure 1a) [1], a modified RF with non-contacting capillaries in the cladding was proposed (Figure 1b) [4]. It turned out that this RF structure has lower optical losses than the previous one. Subsequently, RFs with non-contacting capillaries in the cladding were used in many works (see, e.g., [32,34,40,41]).
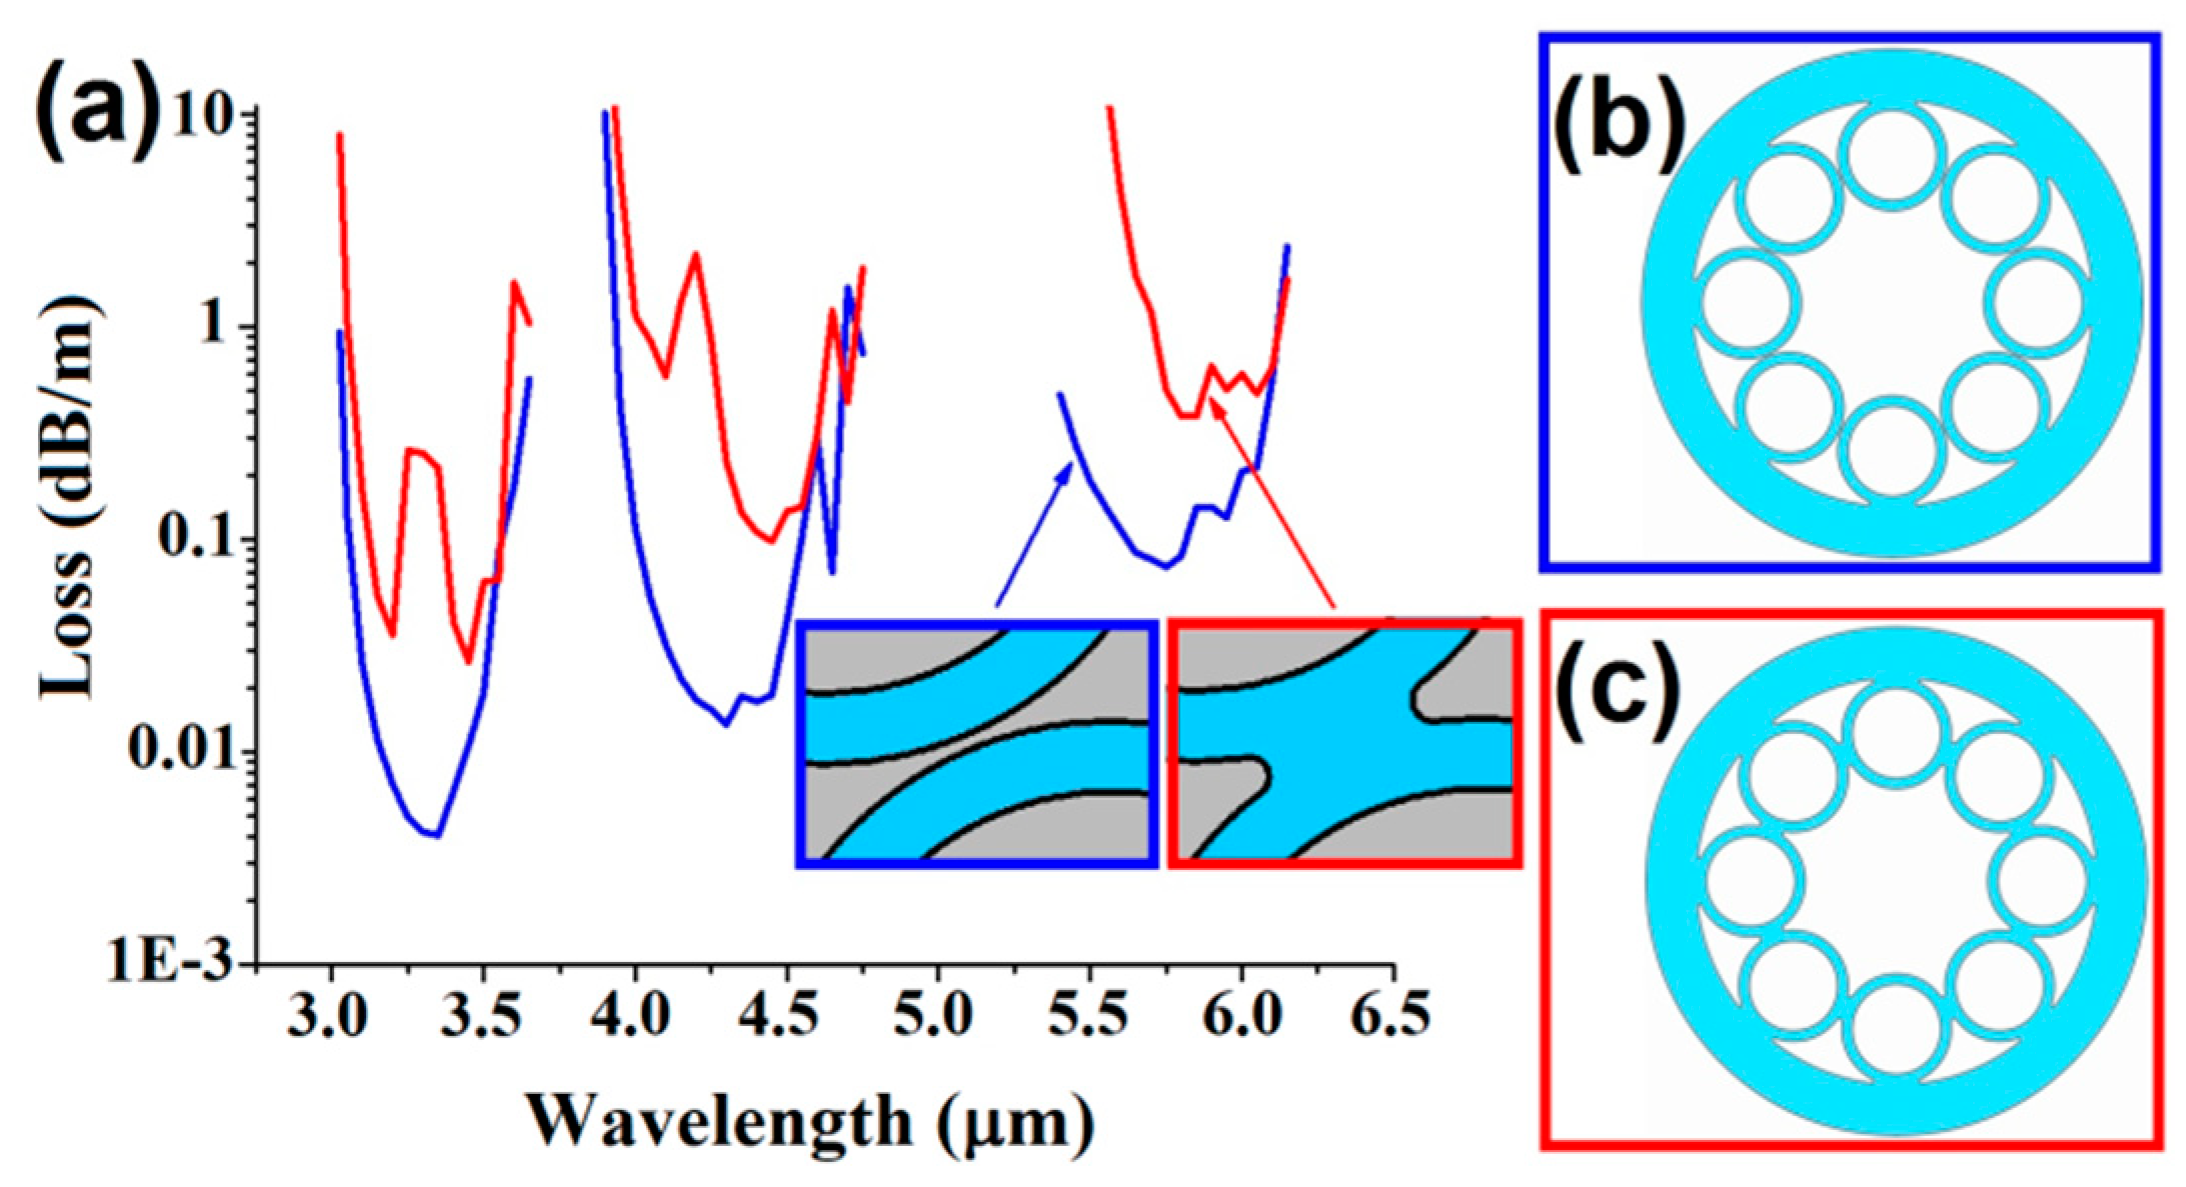
It was numerically demonstrated that the absence of touching points between capillaries removes the additional resonances in the transmission bands (Figure 4). In simulations, the two models of RFs were analyzed and compared. All of the geometrical parameters of the RFs were identical, except that gaps between the capillaries in one of the fibers (red line in Figure 4) were filled with glass (see inset in Figure 4). So, all of the difference between two curves in Figure 4a is defined by the presence of the nodes between the capillaries in the cladding. The cladding of each virtual fiber consisted of eight capillaries that had the outer and inner diameters of 63 μm and 51 μm, respectively. The minimal distance between the non-touching capillaries was 1.3 μm. The loss spectra were calculated in the spectral range of 3–6.5 μm for both RF models. It was clearly shown that the presence of nodes between the capillaries leads to an increase of optical losses due to the occurrence of resonances between the core and cladding modes.
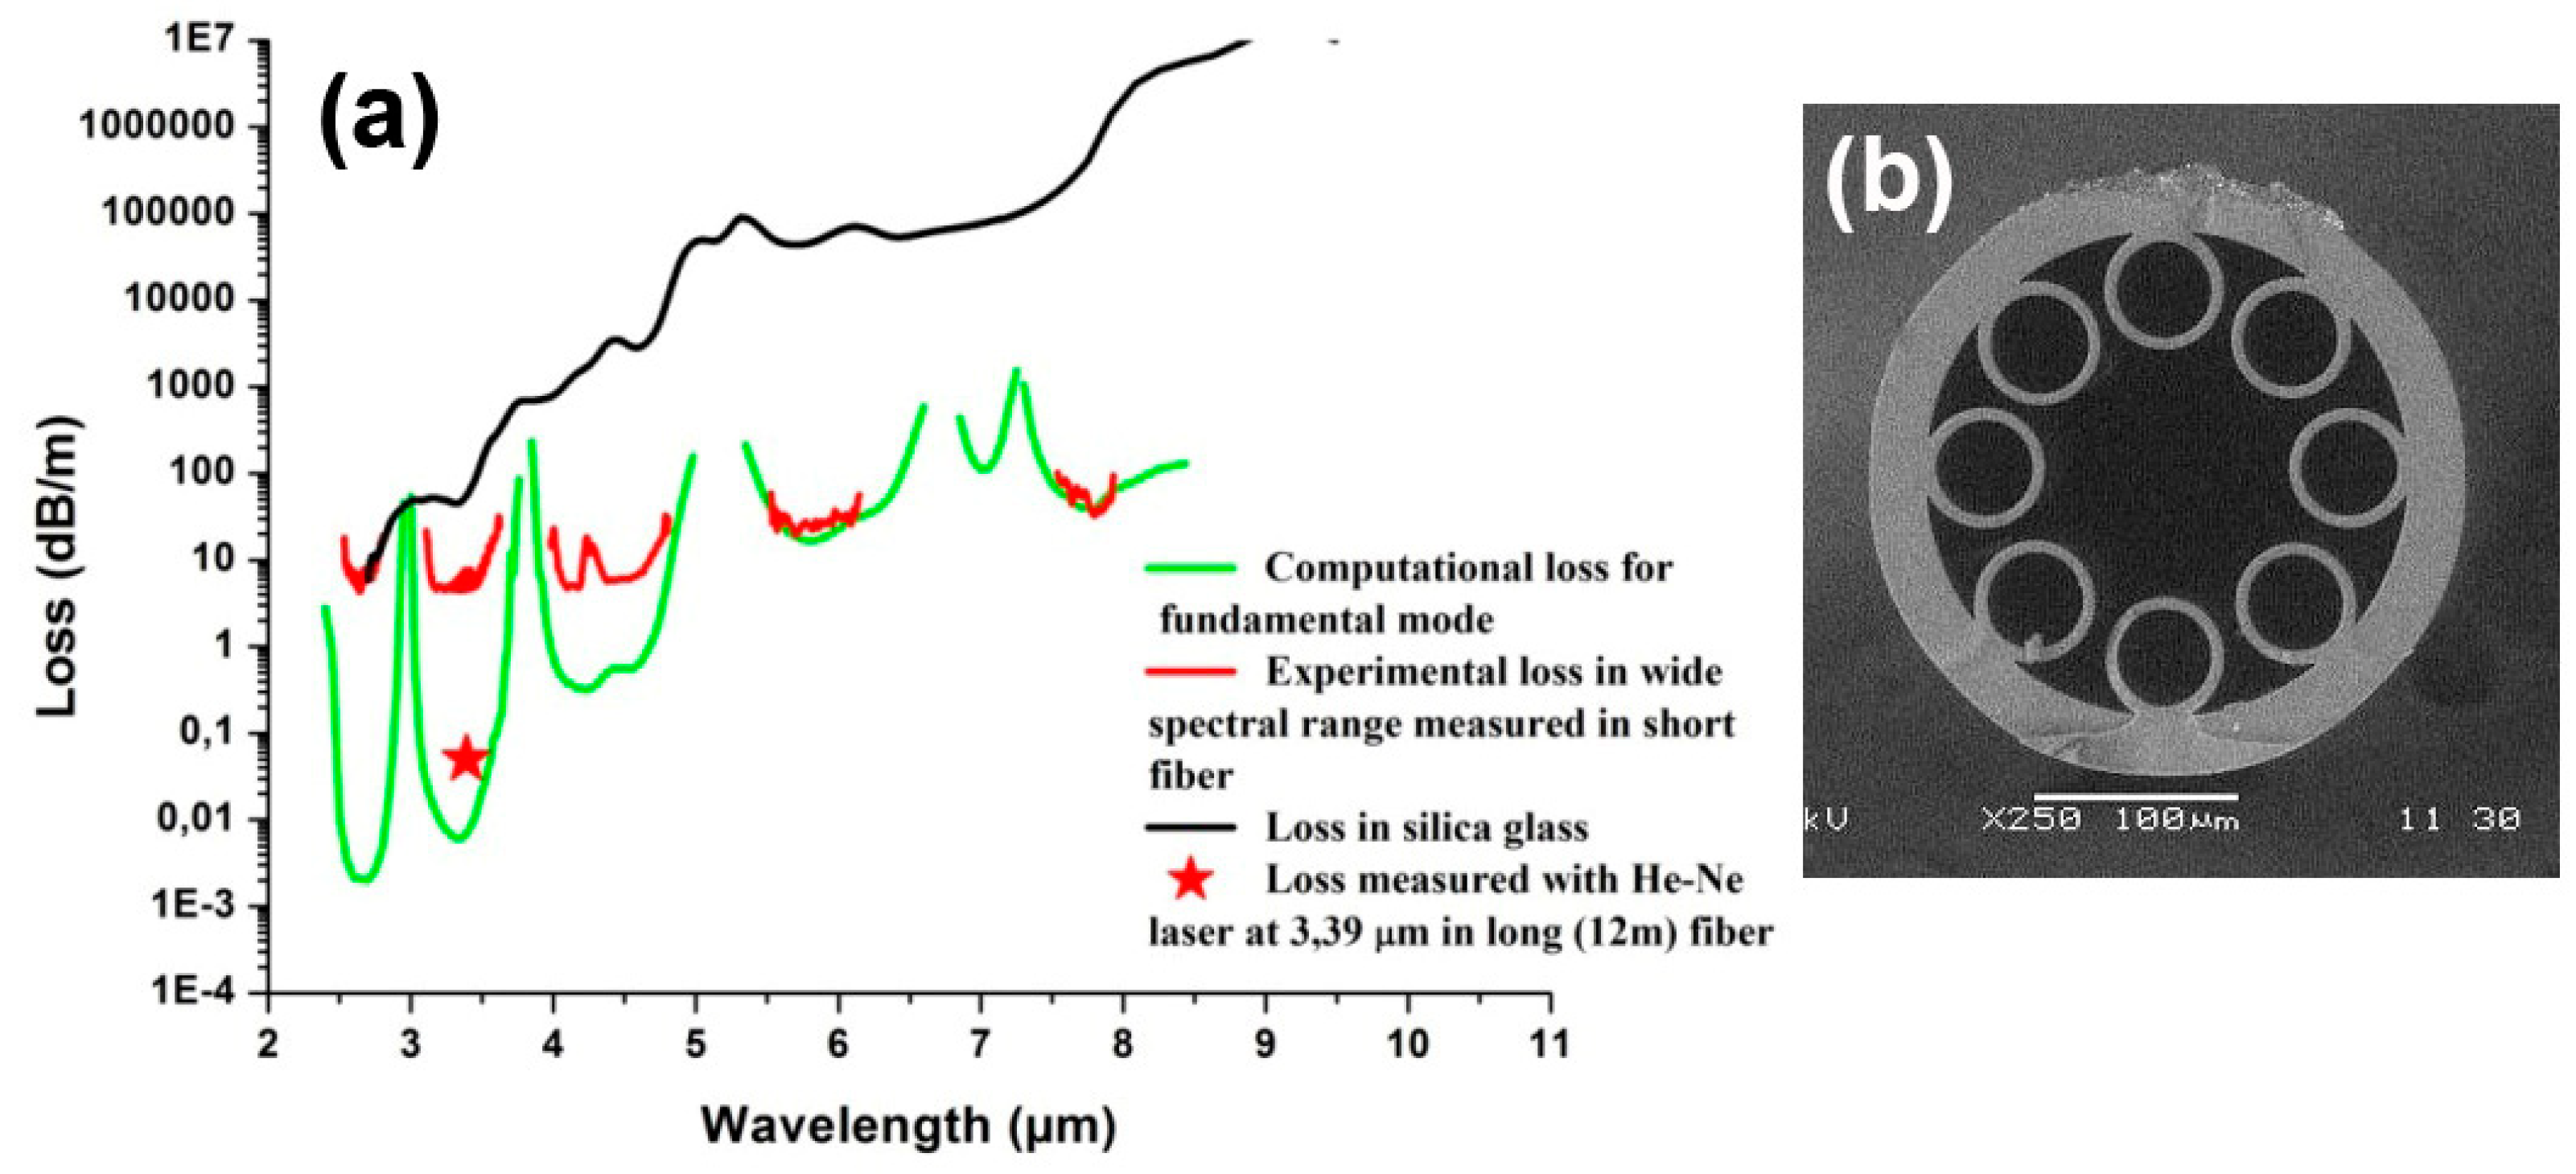
For the first time, a revolver fiber with separate capillaries in the cladding was fabricated in [4]. The real fiber had outer diameter of 290 µm, the core diameter of 110 µm and the capillary wall thickness of 6 µm. The fiber cross section and the measured spectrum of optical losses are shown in Figure 5. One can see that the average level of optical losses measured in the spectral range of 2.5–5 μm was about 4–5 dB/m. At longer wavelengths of around 5.8 and 7.7 µm the losses were measured to be 30 and 50 dB/m, respectively. Transmission bands at 3.3 and 4.3 µm have a number of absorption peaks, which are related to the absorption lines of HCl (similar to work [3]) and atmospheric CO2, respectively. Optical absorption of fused silica glass is also shown for comparison (Figure 5, black curve).
To analyze the experimental results, a numerical modeling of the optical losses for the fundamental mode of the fiber was carried out (Figure 5, green curves). As can be seen from the Figure 5, the calculated and the experimental band edges superpose very well. On the other hand, the minimum loss level in transmission bands differs significantly. It occurs mainly due to the presence of higher order modes in the process of loss measurement (multimode light source was used to excite a short fiber section during the experiment). This idea was confirmed by loss measurement that was carried out by cut-back technique in 11-m-long fiber and a few-mode 3.39 µm He-Ne laser as a light source. This experiment showed that at this wavelength the mode content in the fiber was stabilized when the fiber is longer than 3 m. When only first several modes are present in the fiber, the loss level reaches 50 dB/km (red asterisk in Figure 5), which is much closer to the loss level that was calculated for fundamental mode at 3.39 µm. Thus, real loss level in the fiber is low enough and can be estimated using the calculated loss spectrum (Figure 5, green curves).
3.2. RF with a Cladding of Single and Double Nested Capillaries
Material loss of silica glass changes from 0.1 dB/m to 105 dB/m in the wavelength range from 2 µm to 6 µm [42]. Thus, starting at wavelengths >2 μm, the total losses in silica RF begin to be increasingly determined by the material losses of silica glass. It turns out that the optical loss behavior for RFs with simple capillaries in the cladding ((Figure 1a,b) and for RFs with nested capillaries (Figure 1c) is different in the region of high material losses [42]. The optical losses in the nested RF are lower than in RFs with one row of cladding capillaries up to a certain wavelength in the mid IR spectral range. In this case, the nested capillaries work as additional reflectors and an increase in reflection coefficient gives a win in comparison with RFs with one row of cladding capillaries (Figure 1b,c). Under a further increase in the wavelength, the reflection from the nested cladding capillaries cannot compensate for the growth of material loss and the total losses, correspondingly. That is why the first hydrogen Raman laser with a generation wavelength of 4.4 µm [31,43,44] was built using RF with one row of cladding capillaries. In [4], it was shown that RFs made of silica glass could transmit light up to wavelength of 8 µm with losses of about several tens of dB/m (Figure 5). This level of optical losses is too high for practical use. Nevertheless, silica glass RFs with one row of cladding capillaries can be used in practice up to wavelength of 5 µm. It is possible because material loss of silica glass increases by approximately an order of magnitude in comparison with previous values (Figure 5a). In this way, nested RFs have lower losses in comparison with RFs with one row of cladding capillaries in the transparency region of silica glass. RFs with one row of cladding capillaries have an advantage in the region of high loss of silica glass. Also, it is necessary to take into account bend loss.
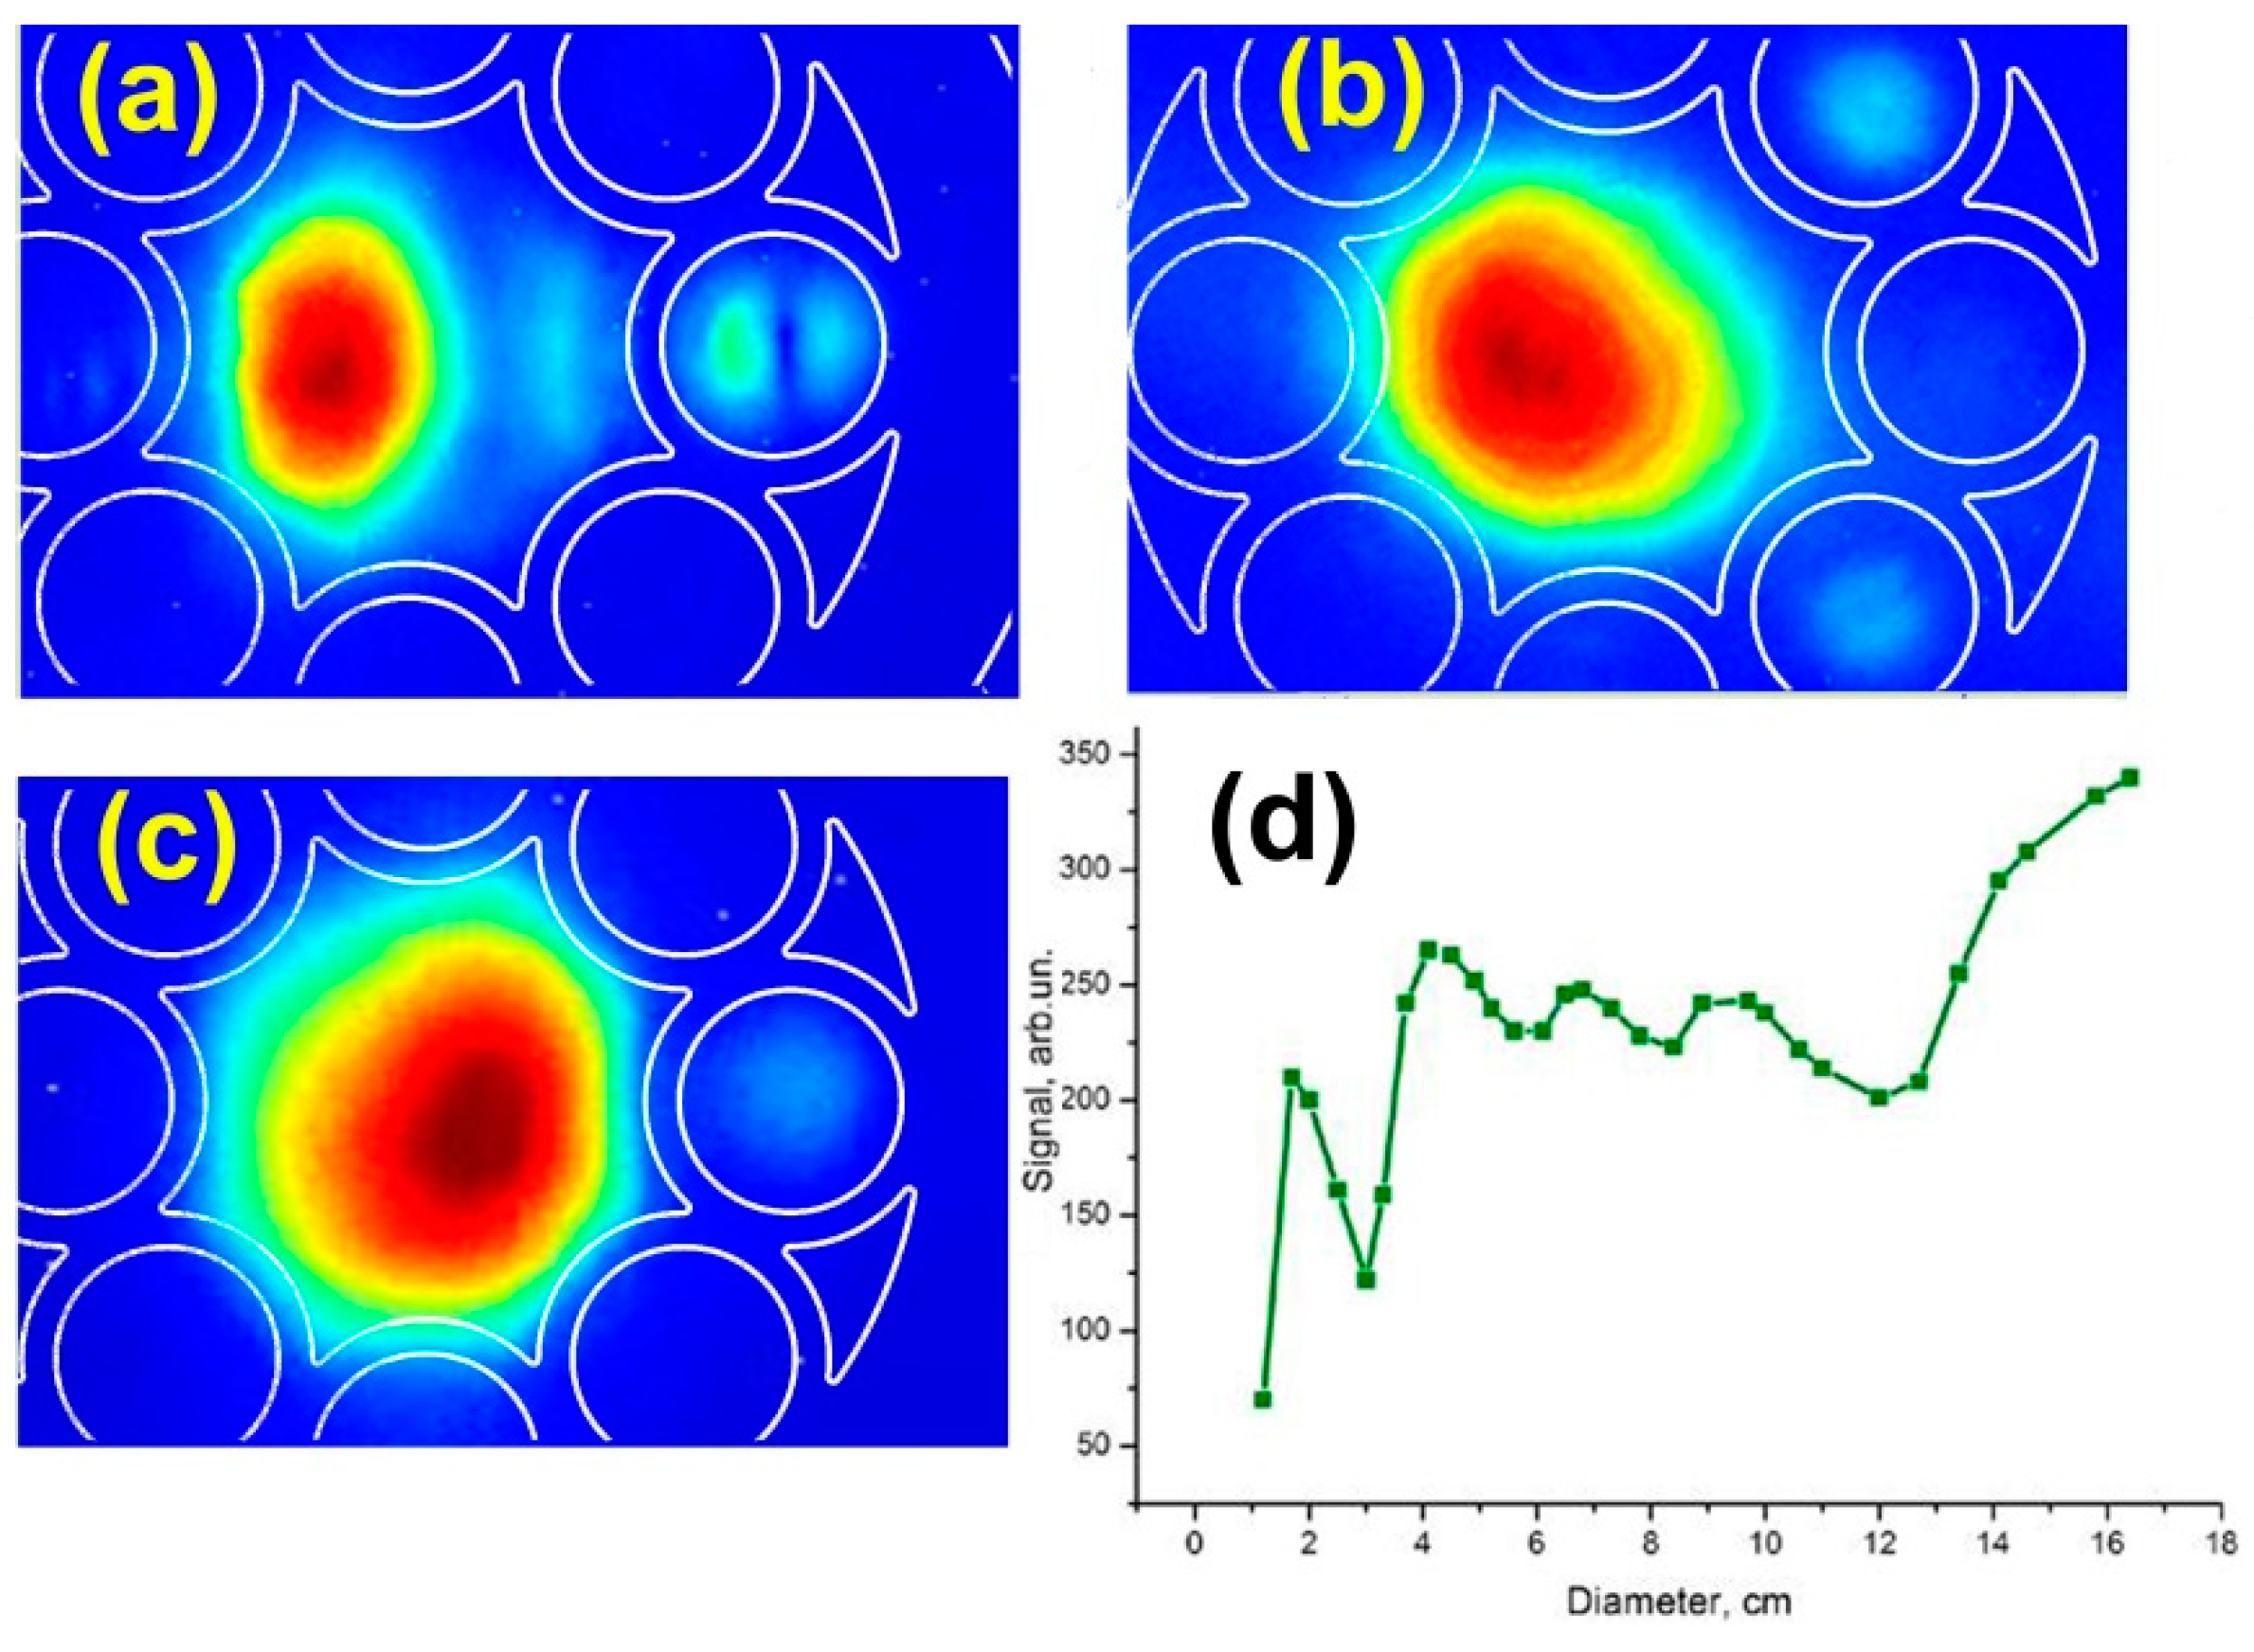
RF bending naturally results in an increase of fiber losses. However, fiber bending reveals another important feature of RF: the resonance coupling of the hollow core modes with the cladding capillary modes (Figure 6). For the first time such, the resonant coupling was found by numerical simulation in [15], and then this effect was experimentally investigated in [8,16,45].
As can be seen from Figure 6d, with a decrease in the bending diameter, the RF transmission decreases non-monotonically, but high loss peaks due to the resonant coupling between the core mode and the cladding capillary modes are observed. Depending on the bending radius, the resonant coupling can occur both in the same capillary for modes of different orders, and in different capillaries of the cladding Figure 6a–c. In both cases, the resonant coupling increases the losses in hollow core mode dramatically. Similarly, higher order core modes can be resonantly coupled to capillary modes. This RF feature can be used for the filtering of the hollow core modes. For example, if the ratio of the inner diameter of the capillary to the hollow core diameter is equal to 0.68, a resonant coupling of the core mode LP11 to the capillary mode LP01 occurs, i.e., the RF becomes quasi-single-mode [33,34].
To transmit light in RF made of silica glass in the mid IR spectral range in the vicinity of wavelength of 5 µm with losses about 1 dB/m, it is necessary to carry out optimization of the cladding geometry. The optimization parameters are thickness of the capillary wall to obtain the transmission band at the desired wavelength, the number of the cladding capillaries and diameter of the hollow core. An alternative way of solving the problem of light transmission in the mid IR spectral range with low loss is that to use soft glasses (chalcogenide, tellurite). They have low material losses in the mid IR spectral range.
3.3. Optical Properties of RFs in UV Spectral Range
A different situation is observed under light transmission in the UV spectral range. Measured losses of silica glass in the spectral range from 200 nm to 400 nm are not as high as in the mid IR spectral range. They vary from a few tenth to 10 dB/m [20]. Therefore, when comparing waveguide losses and material losses one can conclude that the former play the main role in this case (for wavelengths λ > 150 nm). In this way, the main mechanism allowing for one to decrease the level of total losses is an optimization of geometric structure of silica glass RF. On the one hand, low waveguide losses can be obtained by increasing the air core diameter. On the other hand, it leads to excitation of many air core modes due to inhomogeneous construction of the fiber occurring under the drawing. It also leads to a narrowing of the transmission bands [30]. Therefore, it is necessary to carry out the optimization of the RF geometric structure as in the case of light transmission in the mid IR spectral range. The usage of nested RFs is unlikely due to complexity of their fabrication, for example, it is very difficult to keep the sizes and shapes of the cladding capillaries under the drawing. Besides, it is important to choose a number of the cladding capillaries. For example, in [46], the waveguide regime was in silica glass RF with four capillaries in the cladding was demonstrated at loss level about 0.5 dB/m at wavelength of 350 nm. The sizes of the cladding capillaries were comparable with the air core diameter, which should lead to high bend losses. In work [30], silica glass RF with eight capillaries in the cladding was demonstrated. It transmitted light in the spectral region from 350 nm to 200 nm and the loss level was about 1–2 dB/m. The authors explained such rather high loss level by imperfect construction of the drawing fiber. In conclusion, it is worth saying about polygonal fiber, which localizes light at the expense of double antiresonant mechanism [29]. The authors of [29] proposed to use the fiber with the square core-cladding boundary. Such fiber allowed for transmitting light up to wavelength of 241 nm with optical losses that are comparable with those that were reported in work [30].
4. Technology of the RF
Until now, most of the revolver-type optical fibers had been made of silica glass. Significantly greater difficulties arise with the manufacturing of RF from glasses of other types, for example, chalcogenide glass. Let us consider the manufacturing processes of these fibers one after another.
4.1. Technology of the Silica Glass Based RF
The significant advantages of RFs over, e.g., Kagome type HCMFs, is a simpler waveguide structure. Accordingly, RFs have a simpler manufacturing technique, since the reflecting cladding contains only one layer of capillaries.
Usually, RFs are manufactured by the ‘stack and draw’ technique. This technology consists in stacking the prefabricated capillaries inside the support tube (Figure 7). In doing so, the capillaries can either touch each other (Figure 7a), or between the capillaries can be inserted additional elements at the beginning and at the end of the preform (Figure 7b). In the first case, a RF with touched capillaries [1] or an “ice-cream-cone” structure [3] is obtained. In the second case, it is possible to obtain a RF with non-touching capillaries [4]. Furthermore, simple single capillaries (Figure 7a), or capillaries of a more complex structure, for example, double nested capillaries (Figure 7b) can be used to fabricate the RF. The result is either RF with single capillaries that works best in spectral areas where silica glass has high absorption, or RF with double nested capillaries that provides less optical loss in spectral regions with low silica glass absorption.
After the stacking step, the preform is usually treated by flame to weld the capillaries with the supporting tube. However, this procedure is not necessary in some cases. For example, in [15], the RF was made from chalcogenide glass, which has a high temperature expansion coefficient, and the heat treatment was not carried out to avoid the possible cracking of the preform.
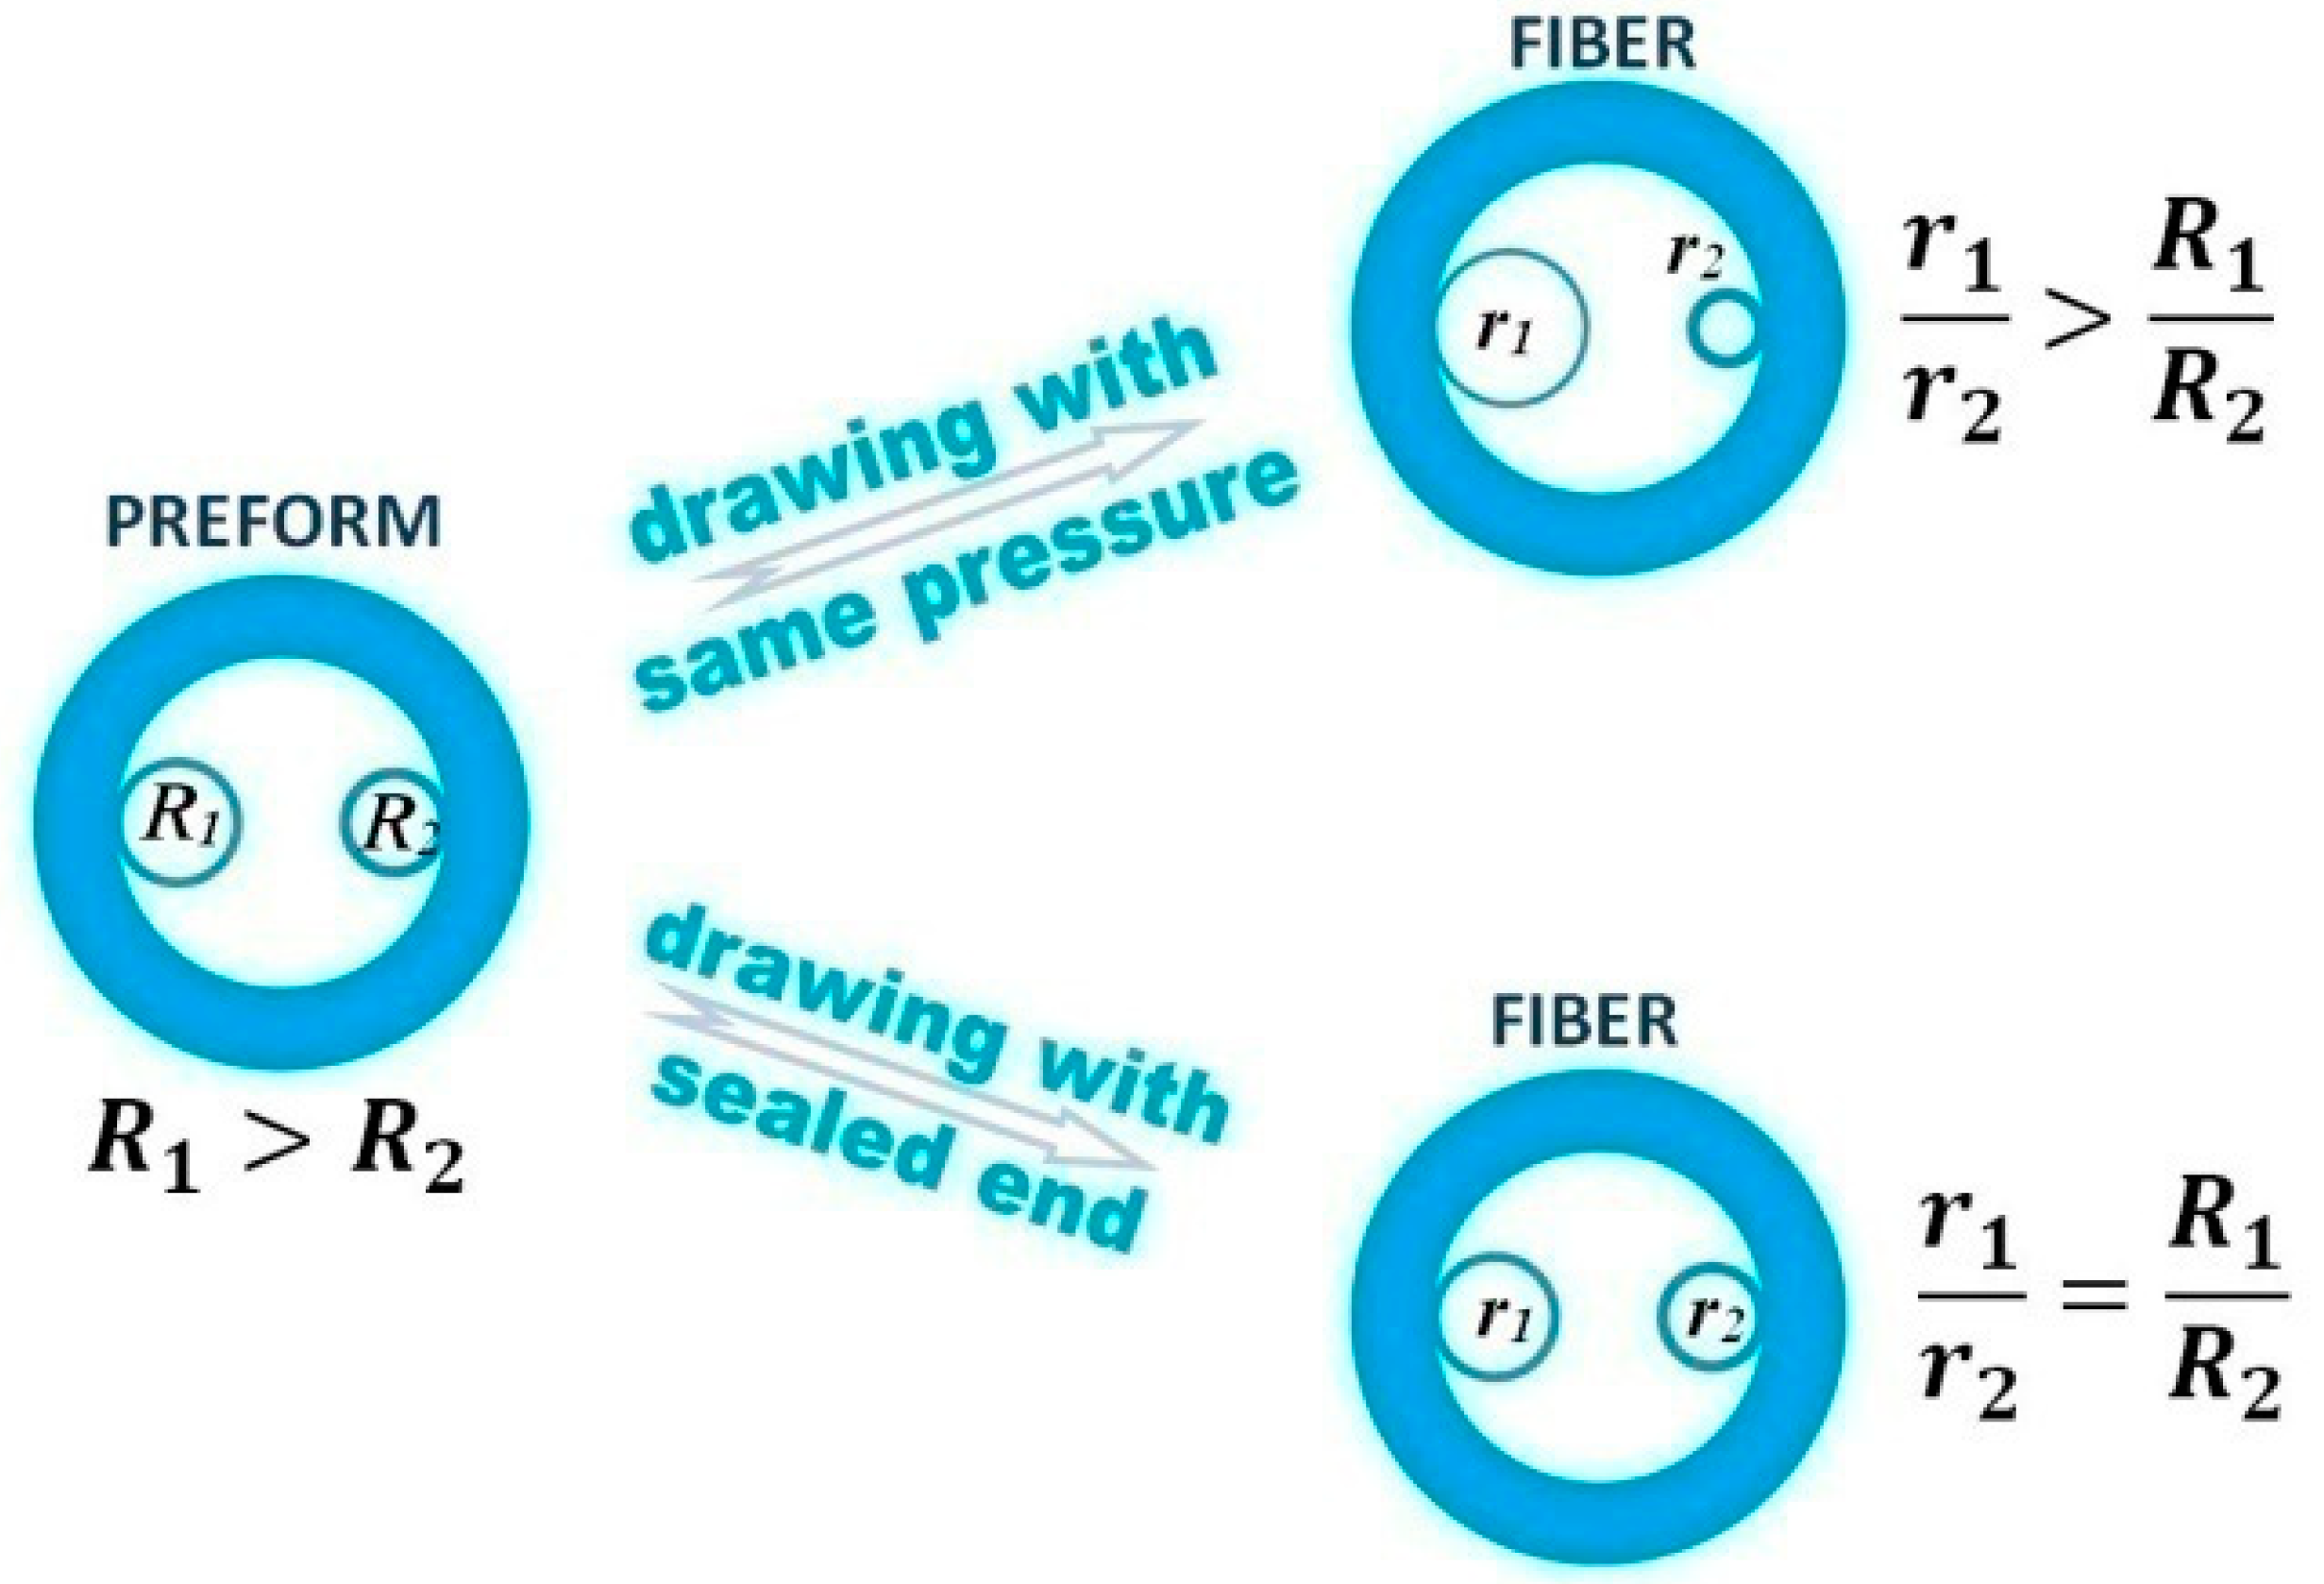
During the fiber drawing process, an excess gas pressure is applied to the capillaries, in order to prevent their collapse under the action of surface tension forces. Usually, a gas pressure regulator is used for this purpose. The regulator is connected to all capillaries and it provides the necessary overpressure. This solution has a significant drawback, which does not allow for the fabrication of RF with strictly identical capillaries. Obviously, the capillaries have dimensional deviations, and therefore the surface tension force, which tends to collapse the capillary, will be different for each of the capillaries. So, for each capillary, it is necessary to use an individual pressure regulation system, which in practice is hard to realize. As a rule, in practice, the same pressure is applied to all capillaries, while the capillaries dimensional deviations increase during the drawing process (see Figure 8, upper way). This happens because the capillaries of a smaller diameter tend to collapse during the drawing process, while capillaries of larger diameter tend to blow up. Nevertheless, the using of high-quality tubes (for example silica tubes by “Heraeus”) for the capillaries production allows for achieving good results even in technology with the same pressure being applied to all capillaries.
There is an alternative approach, which is usually applied to drawing micro-structured fibers, but is also applicable to RF production. The method is called “fiber drawing with sealed upper end” (Figure 8, bottom). The key point of this technology is that the holes of the preform are sealed at the top end of the preform. In such a way, each hole initially contains a certain gas volume and all of the holes are isolated from each other. During the drawing process, the lower part of the preform is heated, the pressure in the holes increases, and the holes expand. Therewith, the increase of the hole volume is determined by the ratio of temperature on top and bottom of the preform. In the first approximation, the increase of the hole volume does not depend on the diameter of the hole. In other words, all of the holes of the preform expand in the same way [47]. Thus, the hole size distortion, which is present in the perform, remains in the fiber. While using the technology with the same pressure being applied to all holes, the hole size deviation from the mean value increases when the fiber is drawn.
4.2. Technology and Properties of the RF Based on Chalcogenide Glasses
Although the waveguide regime in RF made of silica glass was demonstrated up to a wavelength of 7.9 μm [4], the optical losses in RFs are higher than 10 dB/m at wavelengths longer than 4.5 μm. Apparently, it is impossible to construct a silica glass hollow fiber of a reasonable core diameter, which would have optical losses at a level of ~1 dB/m at wavelengths that are greater than 5 μm. Therefore, to work in the longer wavelength range, it is necessary to develop hollow fibers that are made of other materials. Tellurite glasses have a wider transparency region [48], so, they can enable extension of the RFs low-loss region to the wavelength of 5.5–6 μm. But, a more radical benefit is the use of chalcogenide glass.
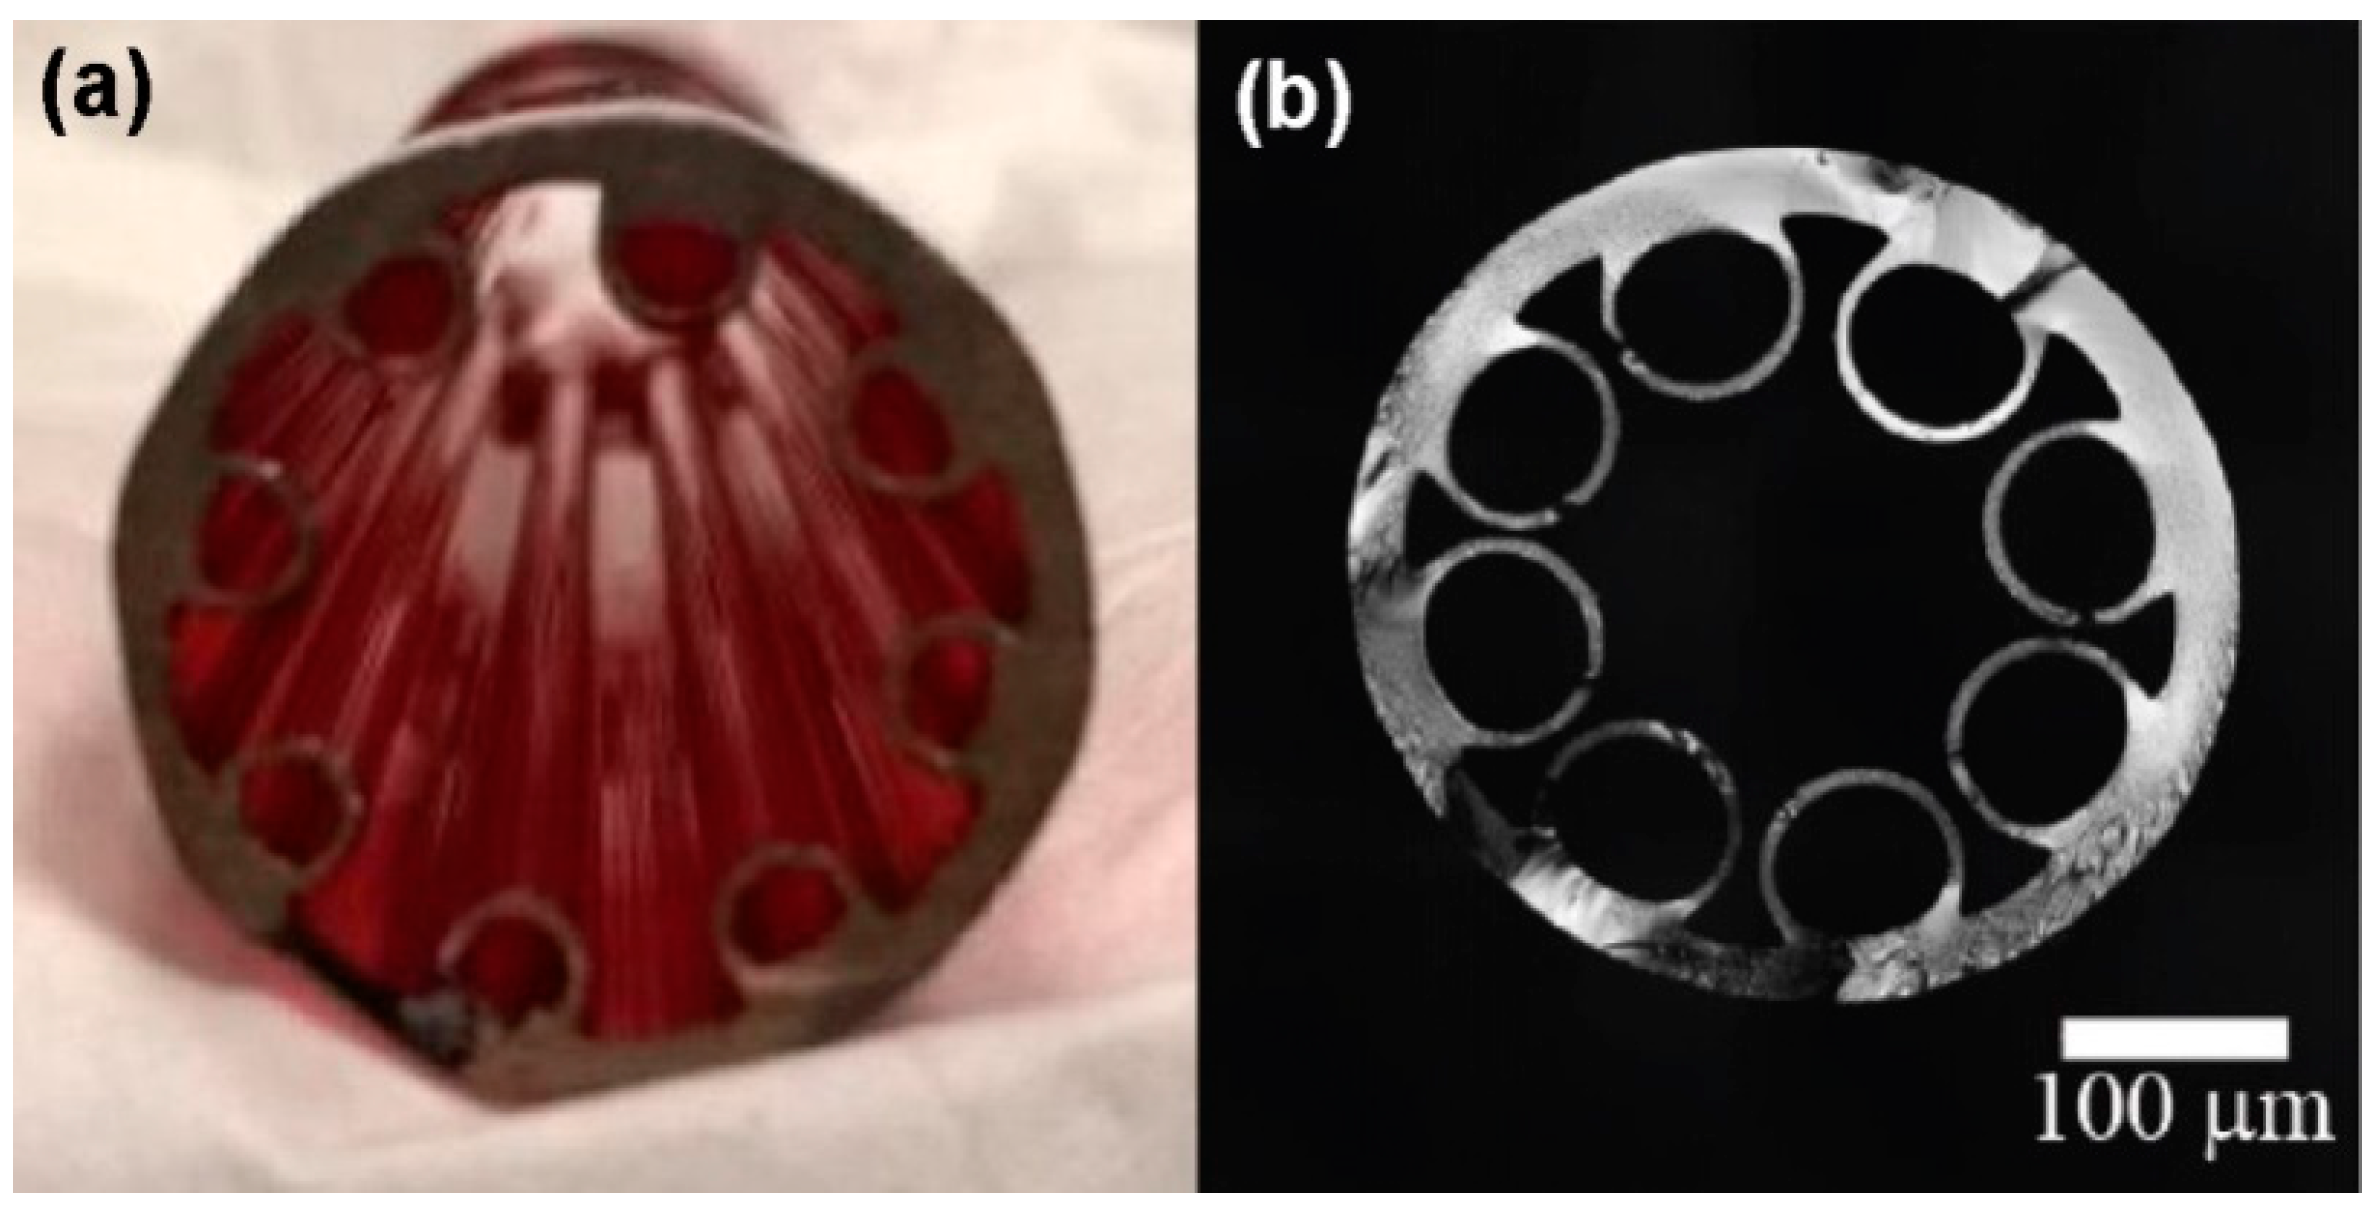
However, from the technology point of view, the chalcogenide glass is substantially less manufacturable. Both the quality of the chalcogenide glass tubes and their physical properties lead to the fact that production chalcogenide RF with perfect geometric parameters is a much more complicated task (compare the cross sections of quartz RF in Figure 7c,d and chalcogenide RF in Figure 9b,d). For the first time, a chalcogenide RF was made in 2011 [15]. To fabricate the optical fiber, a high-purity As30Se50Te20 glass was used. The fiber was made by the “stack and draw” technique. The support tube was made by the centrifugal casting method inside an evacuated silica tube. Capillaries were produced by the double crucible method from the melt of chalcogenide glass. The stacked preform is shown in Figure 9a. The preform was drawn on standard drawing tower using special low-temperature furnace. The obtained fiber had outer diameter of 750 um, core diameter of 260 µm, and capillary wall thickness of 13 µm (see Figure 9b).
Optical loss of his fiber was 11 dB/m at the wavelength of 10.6 μm. Also, the propagation of CO2 laser radiation along the hollow core has been detected by the thermal imaging camera (Figure 9c).
Then, in 2014, a similar method was used to fabricate a fiber from more technologically simple glass As2S3As2S3 [49] (Figure 9d). The minimum optical losses in that fiber were 3 dB/m at the wavelength of 4.8 μm. Also, in the loss spectrum of that fiber, there were significant absorption bands of typical impurities, for example: S-H bonds at 6.8; 4.1; 3.7; 3.1 μm; CO2 impurity at 4.31 and 4.34 μm; OH groups at 2.92 μm; and, molecular H2O at 6.33 μm. This indicates that a significant part of optical power in that fiber propagates through the glass in the process of loss measurements.
In 2015, the Gattass et al. [50] used the extrusion technology to obtain a preform of a RF of As2S3 glass. The preform had a diameter of 18 mm and a length of 135 mm (Figure 10a). The fiber drawn from that preform had the following geometric dimensions: the core diameter was 172 μm, the size of the oval capillaries was 70 by 75 μm, and the thickness of the capillary walls was 7 μm (Figure 10b). Optical loss turned out to be 2.1 dB/m at the wavelength of 10 μm.
In all works concerned with the chalcogenide RF, the theoretical calculations of optical losses using the finite element method were carried out. Actually, the experimentally measured loss is almost always several orders of magnitude higher than the theoretically calculated loss. The observed difference is explained by the strong sensitivity of the fiber optical properties to the fiber geometric deviations, and also by the imperfection of the obtained fiber structures. The increased sensitivity of chalcogenide fibers to the geometric deviations in comparison with silica fibers is due to the high refractive index of chalcogenide glasses, i.e., with the same absolute variations of the geometric thicknesses, the variations in the optical thicknesses in chalcogenide fibers are 3 to 4 times greater than in silica fibers. In addition, the dependence of the viscosity of chalcogenide glasses on temperature is several times stronger than the dependence of the viscosity of silica glass on temperature (chalcogenide glasses are “short”), i.e., at identical temperature gradients and temperature fluctuations in the fiber drawing process, the quality of chalcogenide microstructured fibers is lower than the quality of silica fibers. It is also clear that the purity and homogeneity of the chalcogenide glasses is worse than the purity and homogeneity of the high quality silica glass that was used for HCMF fabrication.
In all studies of chalcogenide RF, the loss spectra that were obtained by theoretical simulation contain a lot of resonant loss peaks. This fact is explained by the resonant coupling of hollow core modes with special type cladding modes. Similar resonance peaks are sometimes observed in the theoretically calculated loss spectra of silica RFs at the long-wavelength edge of the transmission bands [8] (see [4], Figure 4). However, in the case of chalcogenide RFs, the irregularity of the simulated spectra is observed practically always. This is because the density of states in the cladding of chalcogenide RF is much higher than in case of silica RFs due to the high refractive index of chalcogenide glasses. However, in the experiment, narrow peaks of optical losses in the transparency regions of chalcogenide RFs have never been observed. Apparently, because of the faulty geometry of the produced RFs, the real loss spectra are broadened.
5. Mid-Infrared Raman Laser Based on Revolver Fibers
What makes revolver fibers attractive is their ability to provide an extremely low overlap of an optical mode with a cladding material. As a result, the RFs can have low optical losses even in those spectral regions where the cladding material has strong fundamental absorption. In particular, silica glass can be used to fabricate revolver fibers for UV and mid-IR spectral ranges. It is instructive to compare the measured optical losses of RFs with those of pure silica glass (see Figure 3). Although, in the UV range, the RFs do not yet outperform silica glass in terms of optical losses, in the mid-IR range, the RFs optical losses are orders of magnitude less than the optical losses of silica glass. Thus, current state-of-the-art RFs fabrication technology enables the development of silica fiber devices, including fiber lasers, for the mid-IR spectral range.
HCFs paved the way to a new class of lasers—the gas fiber lasers (GFL) [51]. Such lasers combine the advantages of both fiber lasers (compactness, reliability and excellent beam quality) and gas lasers (wide range of lasing wavelengths, high output power and narrow linewidth). The gain medium of GFLs is a gas, which fills the hollow core and has dipole-active or Raman-active transitions. The hollow-core fiber ensures a small mode field diameter and a long interaction length of the light and gain medium. As a result, thresholds for nonlinear processes, such as stimulated Raman scattering (SRS), can be reduced by several orders of magnitude with respect to non-guiding schemes.
Currently, GFLs development for spectral range of 3–5 µm is an area of active research. In particular, stimulated Raman scattering (SRS) in gas-filled HCFs is used to generate mid-IR radiation. For example, 2.9–4.4 µm Raman lasers that are based on gas-filled revolver silica fibers have been recently demonstrated [43,44,52]. Such lasers in the NIR range have been implemented with fewer difficulties, since RF and HCF of other types have significantly lower optical losses in this region [51,53].
In most studies, gas fiber lasers are constructed in a cavity-free, single-pass scheme [5,51,53,54,55]. Due to strong localization of light in their core (MFD ~ 5 ÷ 50 µm) along the entire length of the fiber (~1 ÷ 10 m) active gas-filled HCFs provide a single-pass gain that is sufficient for laser radiation build-up from quantum noise. Thus, a single-pass scheme allows for one to realize efficient GFLs that are based on both SRS [51,52,53,54] and population inversion [55]. Designing a cavity for GFLs remains a challenging problem because there are neither fiber couplers nor analogues of fiber Bragg gratings for hollow-core fibers. Nevertheless, a few studies addressed cavity-based GFL schemes using a ring cavity that was made from bulk elements [40] and a Fabry-Perot cavity formed by Bragg gratings spliced to the end faces of an active hollow-core fiber [56].
An active medium of gas fiber Raman lasers can be formed with light molecular gases, such as light hydrogen (1H2), deuterium (D2), methane (CH4), and ethane (C2H6). These gases have a Raman shift (4155, 2987, 2917, and 2954 cm–1, respectively) that is large enough to enable single-stage Raman conversion of 1.5 µm radiation, generated by well-developed pulsed erbium-doped fiber lasers, into mid-IR spectral range.
A key component for making efficient mid-IR Raman fiber lasers is a hollow-core fiber, whose characteristics should satisfy certain conditions. A necessary condition is that the optical loss in the fiber should not exceed the Raman gain of an active medium. Previously [57], a quality parameter () was introduced to characterize an optical fiber as a Raman-active medium:
where g0 is the Raman gain coefficient (in units of dB/(m*W)) of the active fiber for a particular Raman conversion λ → λS; α(λP) and α(λS) are optical losses of the fiber at pump and Stokes wavelengths, respectively. The parameter PF has the same dimensions as power and is measured in watts. By its physical meaning, PF is the threshold pump power of a CW Raman laser that is based on the fiber under consideration placed in some high-Q cavity [57]. Thus, the less the value of PF, the better the fiber is for Raman conversion λP → λS, provided the pump pulse duration is sufficiently long.
The parameter PF provides a convenient tool to optimize fiber characteristics for Raman conversion. Let us consider the dependence of PF on the diameter of the hollow core using simplified analytical models of hollow waveguide (HW) and tube waveguide (TW) (see Section 2). It is known that for a straight (i.e., non-bent) HW and TW, the optical losses depend on the diameter of the hollow core D as 1/D3 and 1/D4, respectively [13]. Therefore, the models predict that for a straight fiber the figure of merit PF is proportional to 1/D (for the HW) and 1/D2 (for the TW), because g0 is proportional to 1/D2 in a case when an effective area of a fiber is proportional to D2. Consequently, the larger D, the smaller the PF. Thus, there is no optimum for the straight optical fibers with respect to the diameter of the hollow core. However, bent-induced losses must be also considered. The ability to bend is one of the main advantages of optical fibers. Assuming that we are working with HW and TW optical fibers that are coiled to a certain radius R, the bent-induced losses in such fibers are proportional to the diameter of the hollow core D. As a result, the optical loss of such fibers has a minimum at some value of the hollow core diameter at any definite wavelength. Correspondingly, the figure of merit PF reaches its minimal value at some hollow core diameter Dmin, which determines the optimal diameter of the fiber core for Raman fiber. If we choose a typical bending radius of R = 15 cm and assume that the revolver fiber is filled with hydrogen at a pressure of 30 bar, then the estimates based on both HW and TW models give rise to the value of Dmin ≈ 75 µm. Much more rigorous and complicated numerical modeling of real RFs gives approximately the same value [58].
It is important for PF to be much lower than the pump power that is achievable in the experiment. Let us consider a model fiber with a hollow-core diameter of ~75 µm filled with molecular hydrogen at room temperature and a pressure above 10 atm. Assuming that such fiber may in principle have optical losses α(λP) ~ 0.1 dB/m (in the near-IR) and α(λS) ~ 1 dB/m (in the mid-IR), we obtain for the quality parameter PF ~ 100 W. Much higher peak pump power can be reached using existing nanosecond solid-state and fiber lasers. However, it is worth noting that the fabrication of hollow-core silica fibers with mid-IR losses within 1 dB/m is a nontrivial task, because, in the wavelength range from 3 to 5 µm, the material absorption in silica glass rises sharply, from ~50 to ~50,000 dB/m (see Figure 3). Nevertheless, revolver silica fibers, which have characteristics that are mentioned above, were fabricated and mid-IR gas fiber Raman lasers were demonstrated using such fibers.
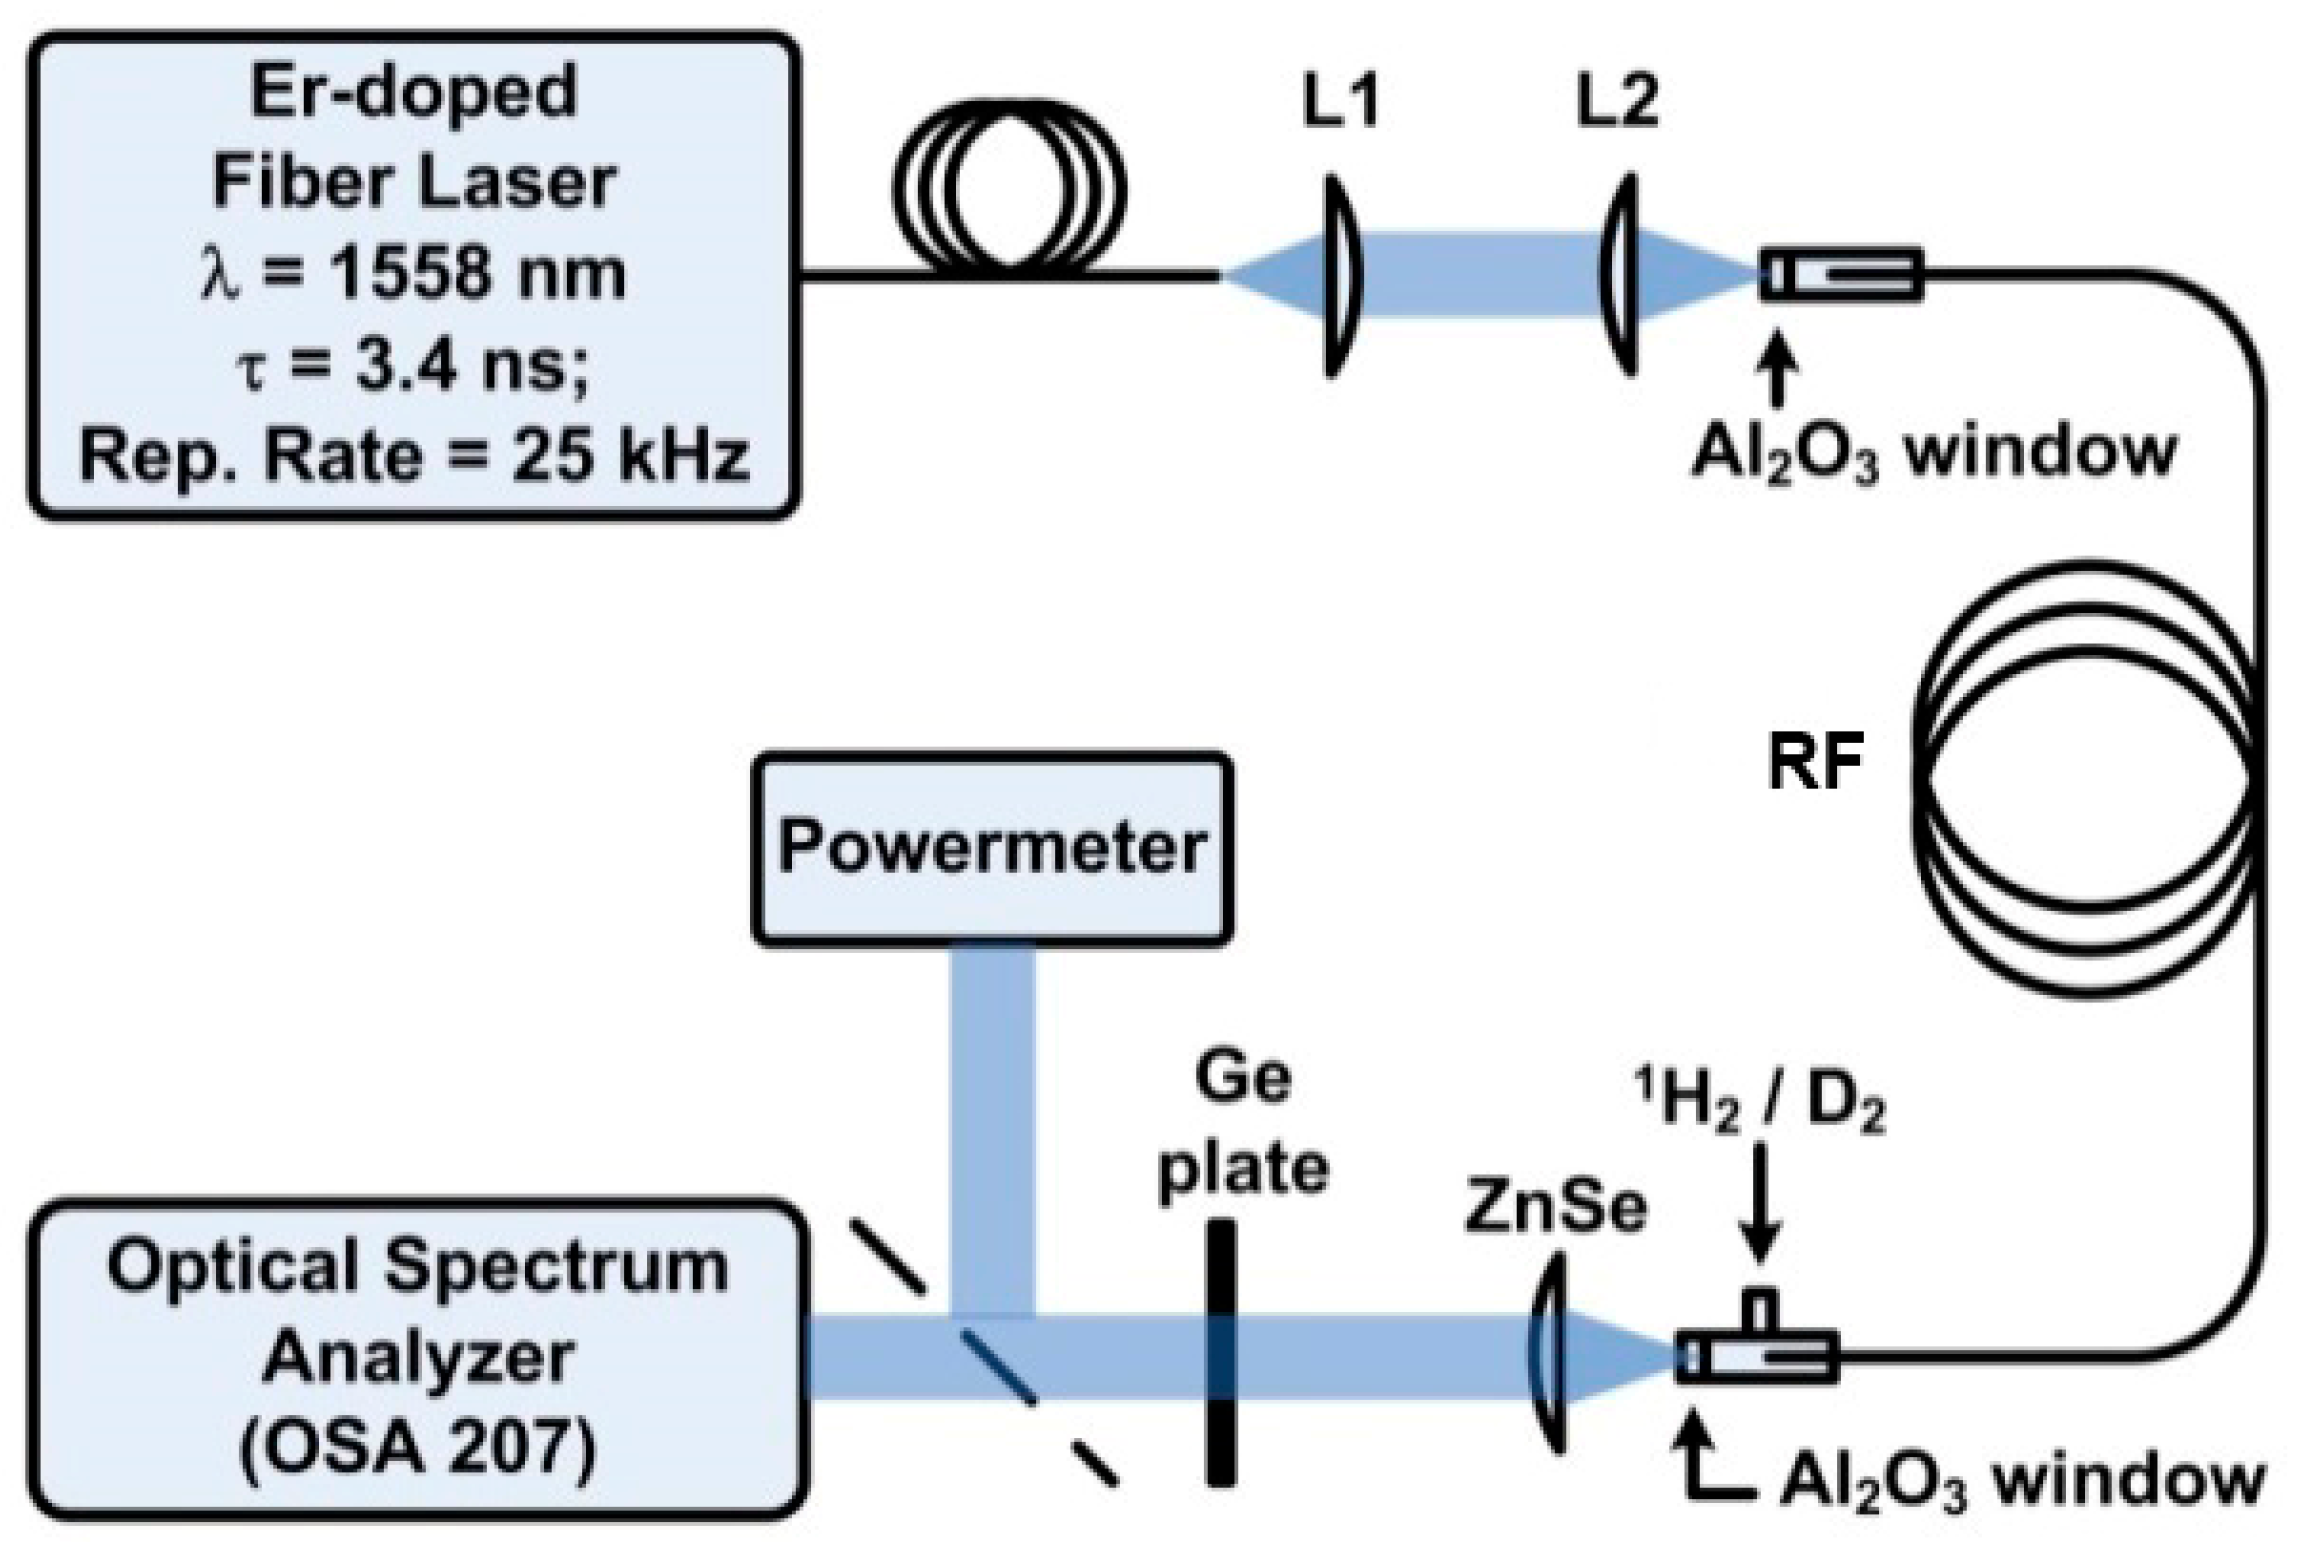
A typical single-pass scheme of the mid-IR Raman GFLs is illustrated in Figure 11. Lens system is used to couple pump radiation at the wavelength near 1.5 µm into the gas-filled revolver fiber. Both ends of the RF are hermetically sealed into miniature gas cells, which had inlets for gas injection and sapphire windows to couple/decouple the radiation. Radiation at the RF output is collimated by ZnSe lens, passes through a set of optional optical filters, and is then analyzed by spectrum analyzer and/or powermeter.
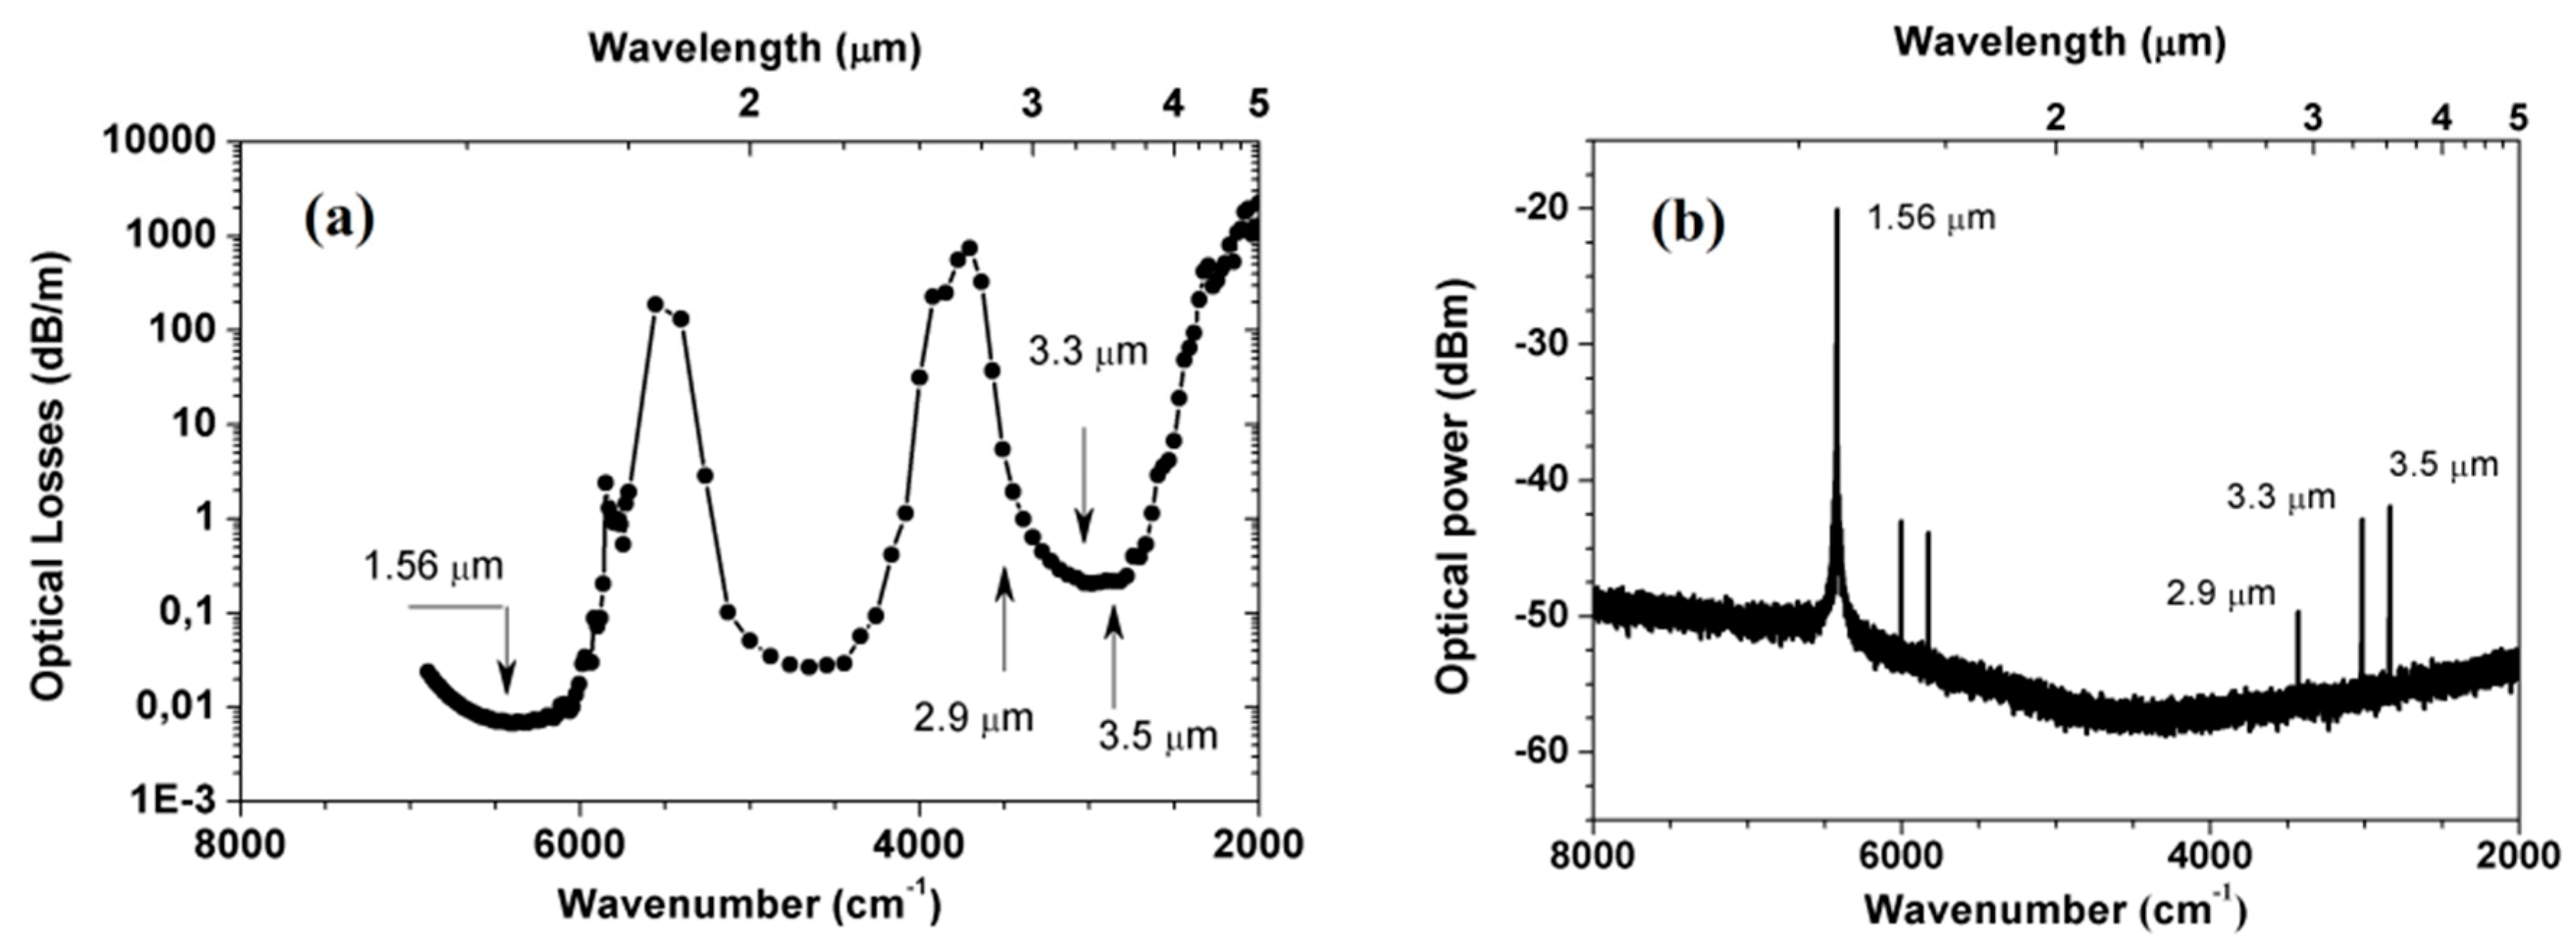
The first mid-IR Raman GFL generating at wavelengths around 3 µm was demonstrated in [59,60],where silica glass RF was used with the calculated transmission spectrum that is shown in Figure 12a. The mode field diameter of 11-m-long fiber was 45 µm. Filling the hollow core with D2 molecular deuterium (partial pressure of 28 atm) containing 1H2 molecular light hydrogen impurities (partial pressure of 2 atm) made it possible to obtain Raman lasing at wavelengths of 2.9, 3.3, and 3.5 µm (Figure 12b). The peak power in the mid-IR spectral region was about 400 W, which corresponded to an average power of about 40 mW. Conversion quantum efficiency was 10% (at λ = 2.9 µm) and 6% (at λ = 3.5 µm), with the possibility of further optimization. Note that adjusting the 1H2 and D2 partial pressures and pump power enabled predominant lasing at a wavelength of 2.9 or 3.5 µm to be obtained.
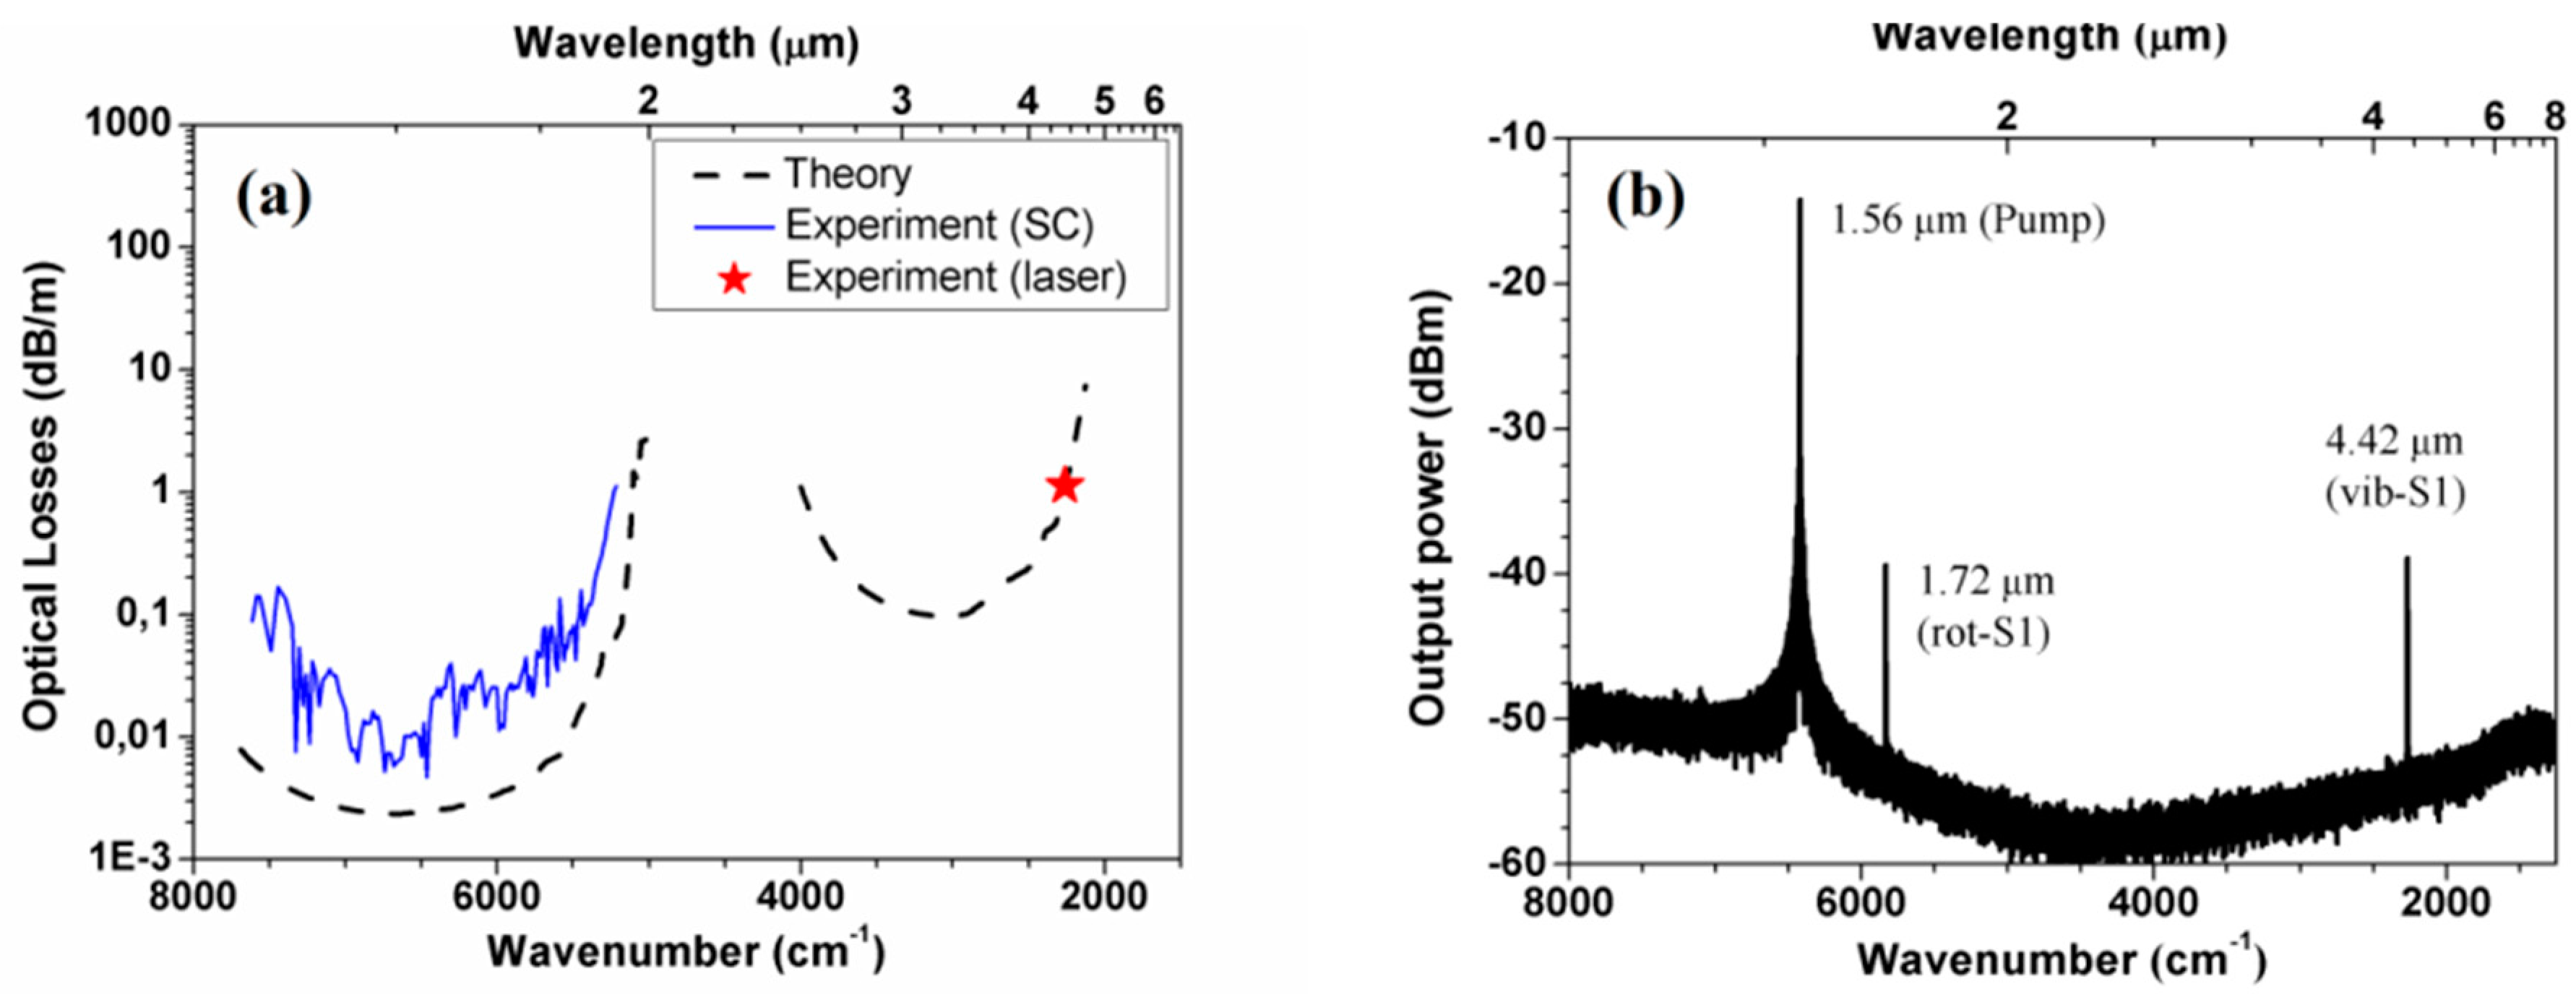
Later, in studies [43,52,61], the design of silica revolver fiber was modified so as to shift the transmission spectrum of the fiber to the ~4 µm range (Figure 13a). The mode field diameter was 56 µm. Filling the hollow core with 1H2 molecular hydrogen at a pressure of 30 atm, the first Raman lasing at a wavelength of 4.4 µm was demonstrated (Figure 13b) [43,52]. Using single-mode output of the Raman laser, the loss in the revolver fiber at this wavelength was measured to be 1.13 dB/m, being in good agreement with numerical simulation results (0.92 dB/m) [61]. Note for comparison, that the material absorption in silica glass at this wavelength is ~4000 dB/m. The use of 15-m-long RF ensured Raman lasing with a quantum efficiency of ~15% and the average power of 30 mW at the generation wavelength of 4.4 µm [52].
To improve efficiency and output power of the 4.4 µm Raman laser, it was analyzed theoretically by numerically solving a system of coupled wave equations for vibrational SRS in 1H2 molecular hydrogen [61]. For this purpose, measured optical losses at wavelengths of 1.56 and 4.4 µm (Figure 13a) were taken into account. Raman gain coefficient gR = 0.43 cm/GW was calculated for 1.56 → 4.4 µm conversion using the available data on the linewidth and scattering cross section of the Q(1) vibrational transition of molecular hydrogen [62,63,64]. The theoretically evaluated optimal Raman laser length was found to be ~3.5 m, which is substantially shorter than the hollow-core fiber length (15 m) that was used in previous experiments.
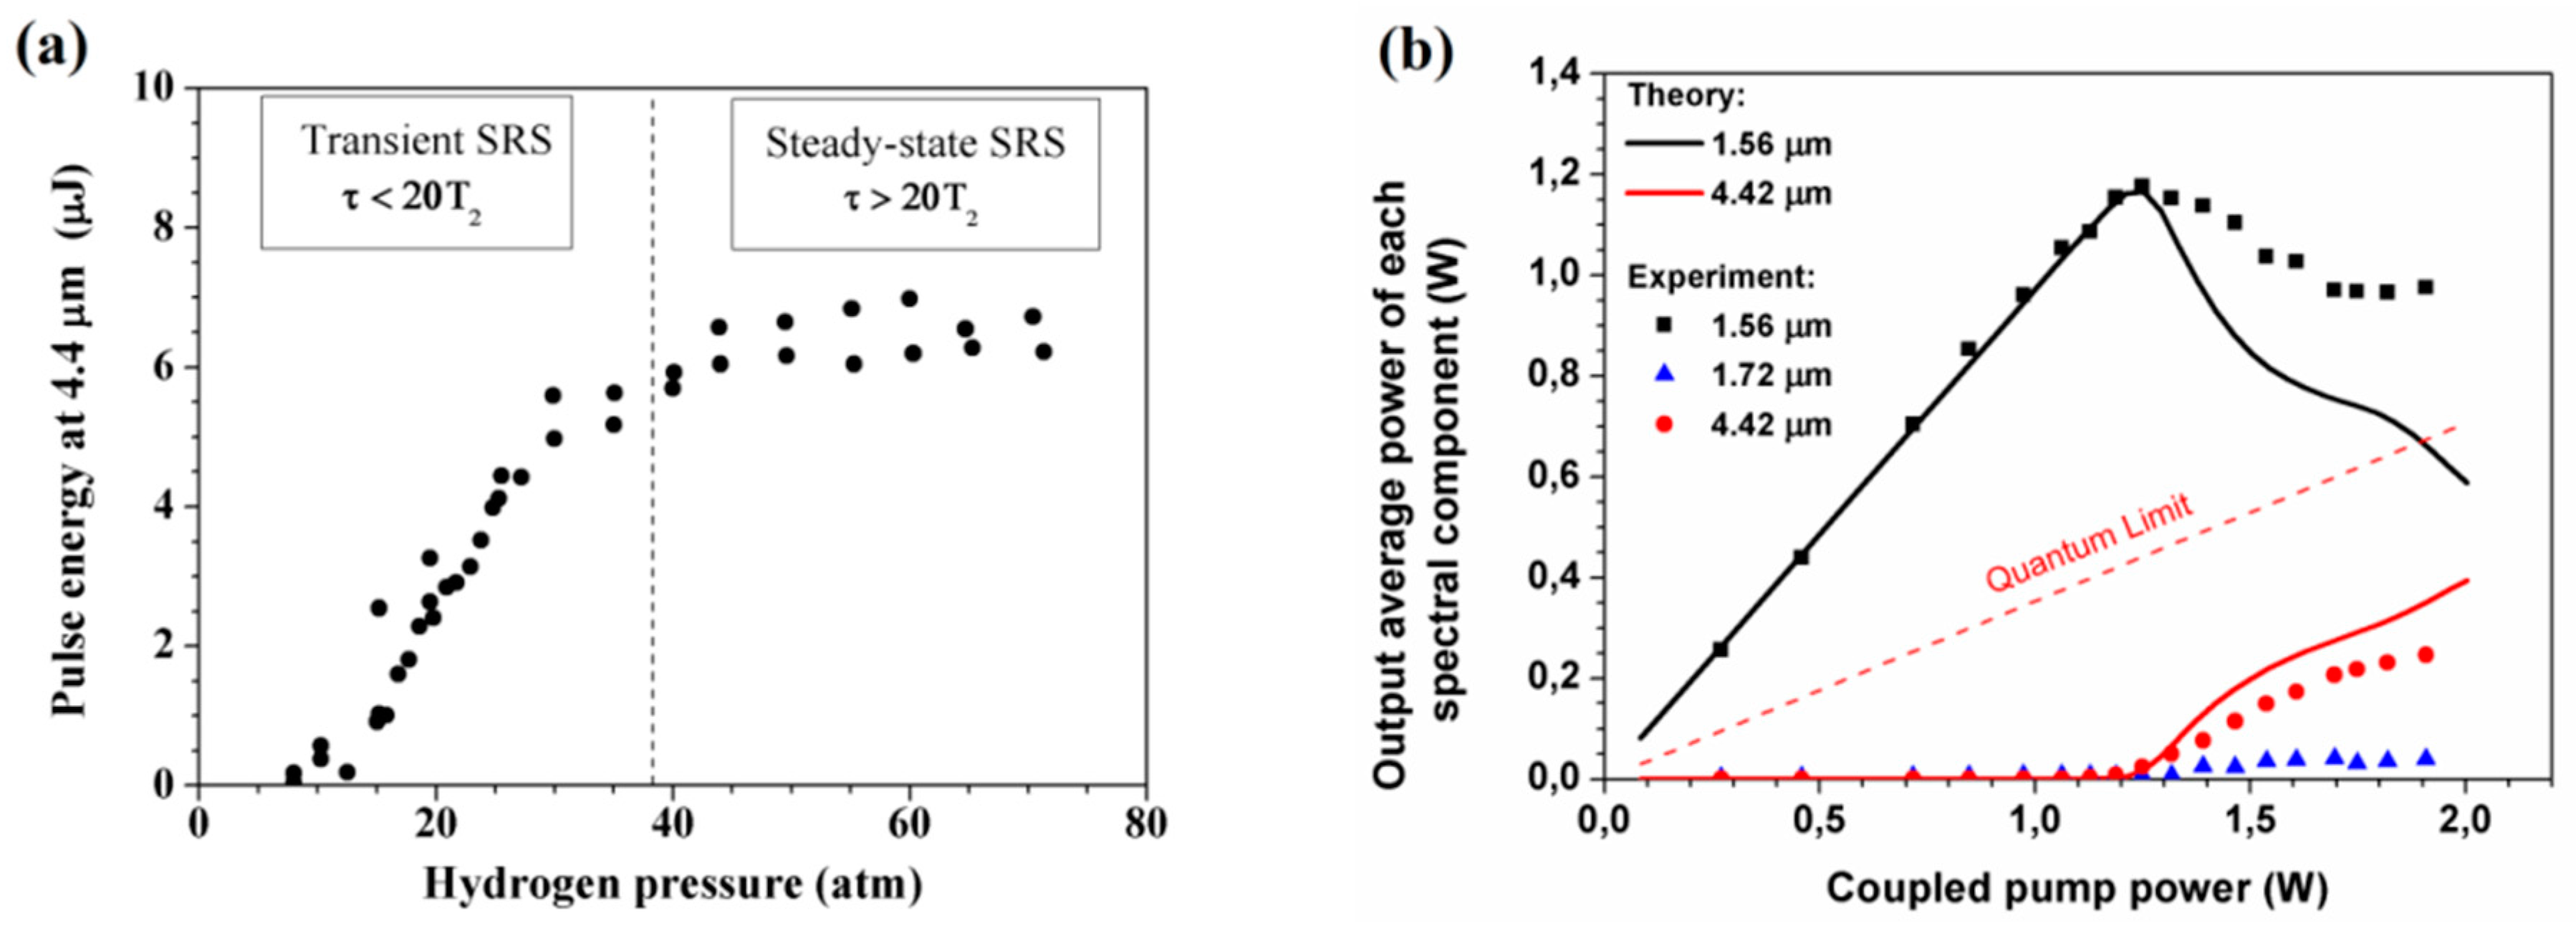
One interesting result that was obtained in [61] is the possibility of maintaining steady-state SRS when GFLs are pumped by nanosecond pulses. It is known [62] that, if the pump pulse duration (τp) and the dephasing time of optical phonons (Т2) meet the relationship τp ≤ 20∙Т2, SRS conversion is a transient process, in which the Raman gain coefficient decreases. However, Т2 can be easily controlled by varying the pressure of a gas, filling RF core, since the collision frequency of molecules grows with gas pressure, which leads to more frequent changes in the phase of molecular vibrations, and, therefore, to Т2 reduction. This effect was observed in [61], as the hydrogen pressure was varied in the range from 10 to 70 atm and ensured an increase in the output power of a Raman laser (Figure 14a) pumped by 3.5-ns pulses.
As a result of optimization of the fiber length and the hydrogen pressure in the hollow core, 4.4-µm Raman generation of nanosecond pulses was demonstrated with an average power that was as high as ~250 mW and quantum efficiency as high as 36%. In this process, the rotational component at wavelengths of 1.72 µm was significantly suppressed (Figure 14b) [61].
To date, the efficiency of the mid-IR Raman GFLs is limited by the level of optical losses at the Stokes wavelength (~1 dB/m). At the same time, it is seen in Figure 12a that the level of losses at wavelengths below 4 µm is an order of magnitude lower (0.1–0.2 dB/m). This spectral range is suitable for making more efficient Raman gas fiber lasers that are based on the already existing silica revolver fibers. The rise in optical losses at wavelengths above 4 µm is caused by the sharp increase in material absorption in silica glass (as well as by the reduction in its refractive index). New solutions, which are capable of further minimizing the overlap of the optical mode field with the silica cladding, are needed to reduce the optical loss in this spectral region. Note also that the use of higher peak power pump lasers may improve the efficiency of the mid-IR Raman GFLs because a shorter length of the hollow-core fibers can be used, thus reducing the detrimental effect of optical losses.
To date, the peak power of pulsed nanosecond Raman GFLs emitting in the range 3–5 µm has been demonstrated to reach ~2 kW [61]. This parameter is rather limited by the pump power that is achievable with erbium-doped fiber lasers than by any characteristics of a hollow-core revolver fiber. Recent works [65,66] have demonstrated Raman gas fiber lasers with an output peak power of 400 and 150 kW at wavelengths of 1.55 and 1.9 µm, respectively. The use of such lasers as pump sources for gas-filled hollow-core silica fibers paves the way to efficient Raman GFLs generating nanosecond pulses with a peak power of ~100 kW in the spectral range 3–5 µm. Moreover, such mid-IR lasers can be realized by means of two-stage SRS in a given revolver fiber segment that is filled with one or a few gases. First experimental demonstration of two-stage SRS (1.06 → 1.54 → 2.81 µm) in a revolver fiber has been recently demonstrated in [67], where picoseconds pulses at the wavelength of 2.81 µm was generated with a peak power of about 10 MW.
The near-IR (λ = 1.56 µm) to mid-IR (λ = 3–5 µm) SRS conversion is known to be accompanied by a large quantum defect, which may hinder obtaining a high average power at the Stokes wavelength. At the same time, in a recent study [55] that was related to the gas fiber lasers based on population inversion, efficient lasing at a wavelength of 3.1 µm was demonstrated under pumping at λp = 1.53 µm. Despite the large quantum defect, which is comparable to that in Raman lasers, they reached a CW output power above 1 W. This result suggests the possibility of high average power of gas fiber lasers, including Raman lasers, in the mid-IR spectral range.
6. High-Power Femtosecond Pulse Propagation in Air-Filled RF
High power ultra-short optical pulses (USP) of pico- and femtosecond durations are powerful tools for high precision material processing applications, such as micromachining, laser surgery, and micro-modification [68]. Moreover, a performance of USP source can be noticeably improved by means of a flexible and robust high power USP delivery option due to specially developed fiber with extremely low nonlinearity and dispersion also with acceptable attenuation and beam quality. It is evident that HCMF being capable of light localization in the large air-filled core is the best candidate for this purpose [69], since the Kerr nonlinear refractive index of air is three orders of magnitude lower than that of silica glass [70].
Moreover, HCMFs that are filled with air at atmospheric pressure are of particular interest for the creation of all-fiber systems for the transmission of high-power femtosecond pulses, since they do not have a sophisticated technology for pumping gas. Nevertheless, in the absence of evacuation at sufficiently long interaction lengths of the radiation with the gaseous medium, the nonlinear properties of the gas can exert a strong influence on the spectral-temporal characteristics of powerful ultrashort pulses [18,71,72,73,74,75].
The propagation of femtosecond pulses in a photonic crystal fiber with a hollow core filled with atmospheric air was studied in [74]. The 2.4 MW pulse with a spectrum shifted to the long-wavelength edge of the band was obtained at the fiber output, when a 110-fs pulse with 900-nJ energy at a wavelength of 1470 nm, was launched into a three-m-long fiber. In [75], the pulses were transmitted through a photonic crystal fiber with a hollow core filled with air at a wavelength of 800 nm. The Raman solitons at the output of the 5-m-long fiber had a peak power of 208 kW and 290 fs duration.
Pulses with 105 μJ energy and 844 fs duration were transmitted at a wavelength of 1550 nm through a Kagome-type HCF with 70 μm core diameter [76]. At the end of a 2.3-m-long fiber, the 300 fs pulses of 78-μJ energy (240 MW peak power) were obtained due to soliton compression. In the work [77], the Kagome HCF had a transmission band in the 900–1300 nm region, and loss figure of 200 dB/km at 1030 nm. A solitonic propagation regime was observed in a three-m-long air-filled fiber for pulse energies higher than 100 μJ.
Thanks to relatively simple design, the RF offers remarkable possibilities by means of accurately maintaining relationships between effective mode field diameter, dispersion, and transmission bandwidth in any wavelength region that is required for pulse delivery. In the RF, the propagation of femtosecond pulses was studied for a few wavelength bands [35,78,79,80].
6.1. Linear and Nonlinear Pulse Propagation Regimes
The linear propagation regime (without distortion of pulse spectrum) of femtosecond pulses in RF at a wavelength of 0.748 μm was demonstrated in [78]. A fiber with eight separate capillaries and a core diameter of 21 μm (Figure 15a) had a transmission band in the range 700–800 nm. Input pulses with an average power of 1.3 W, a repetition rate of 76 MHz, and a duration of 180 fs (95 kW peak power) passed through 10-m-long fiber without distortions of the spectrum and with a dispersion induced temporal broadening (≈2 times), in accordance with measured group velocity dispersion (GVD) value of 7.7 ps/nm/km.
Long-distance delivery through a low-loss RF of ~1 MW sub-picosecond pulses in the telecom spectral band was experimentally demonstrated in [35].
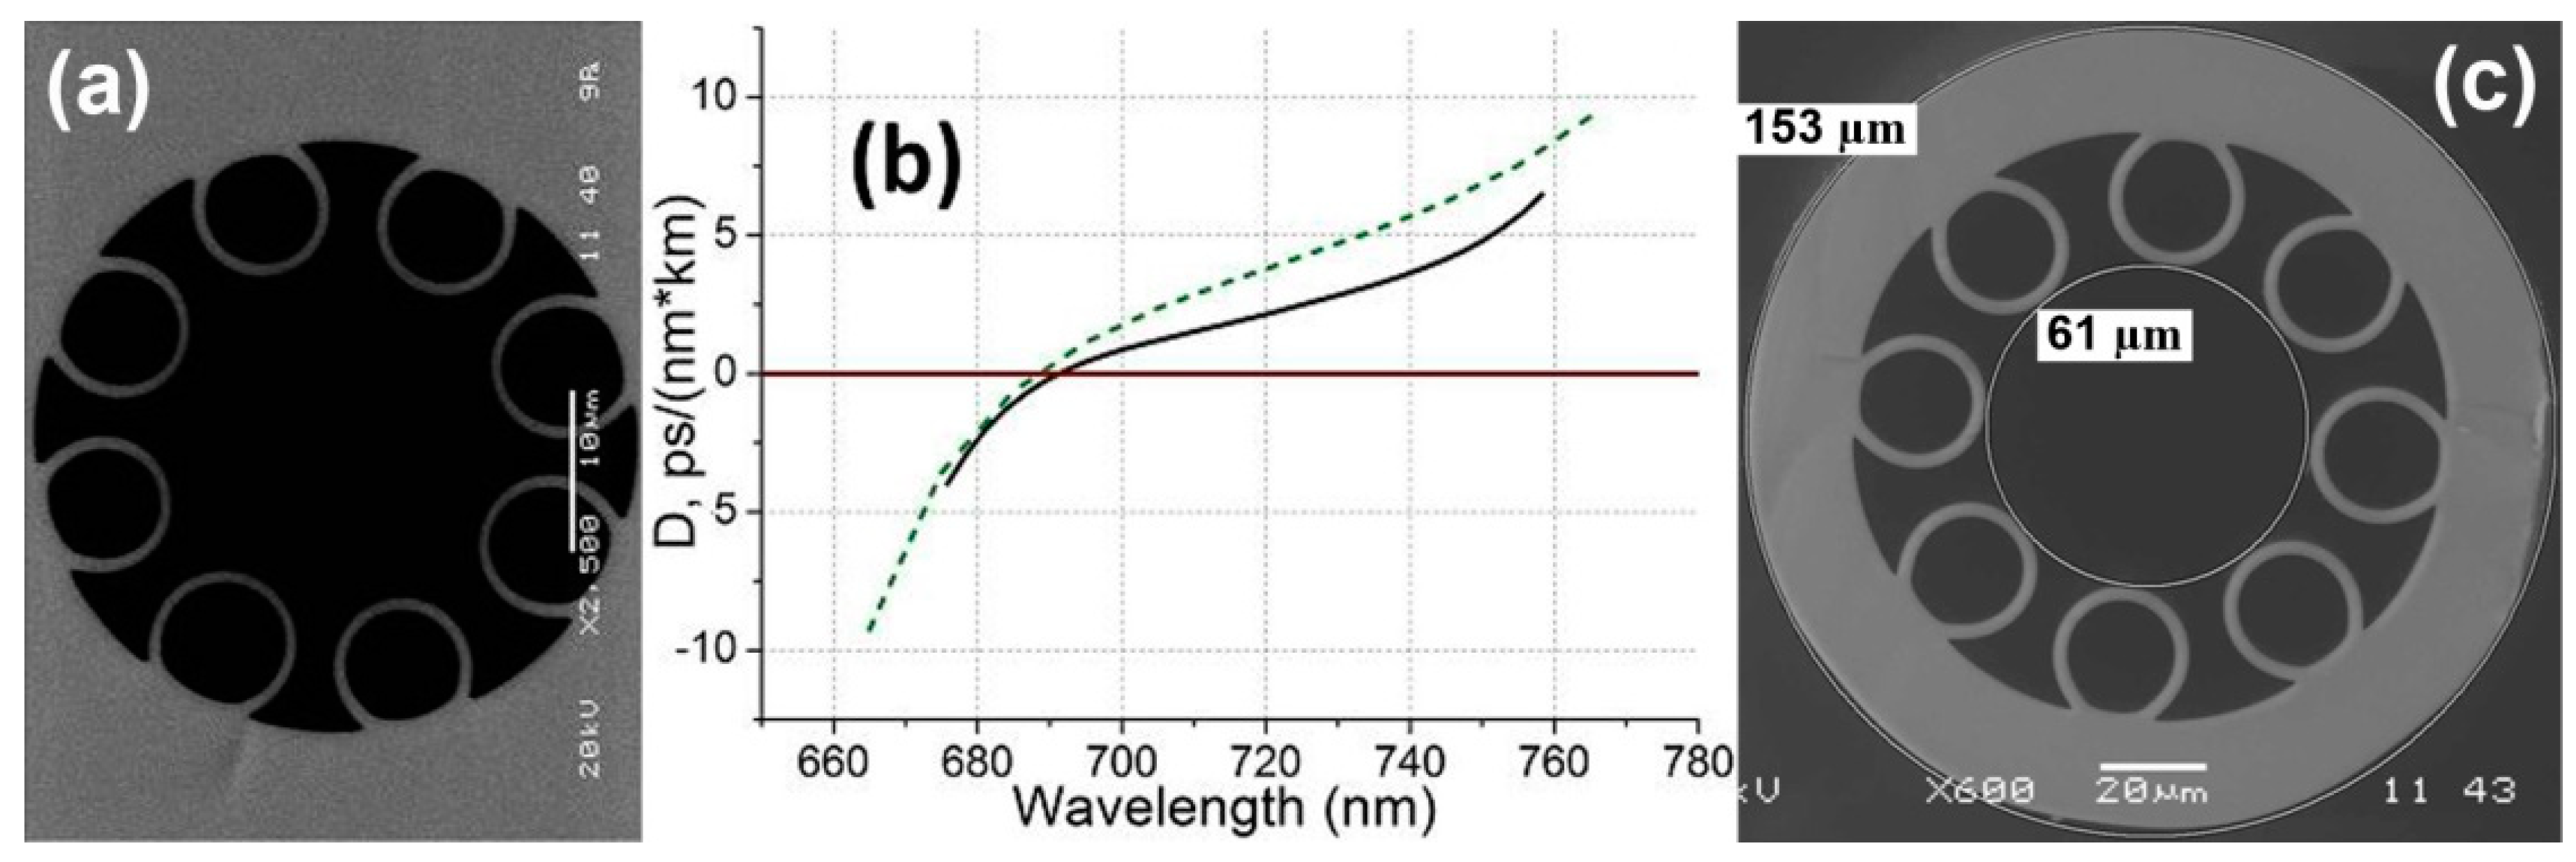
Sub-picosecond pulses with up to 530 nJ energy and 1.42 W average power at 1.56 µm central wavelength from the all-fiber erbium CPA (chirped pulse amplification) source [35] were launched to the 11.7-m-long air-filled RF coiled to a diameter of ≈30 cm, with ≈80% coupling efficiency.
The cross-section image of the RF is shown in Figure 15c. The RF cladding was formed from eight silica glass capillaries with ≈2.6 µm wall thickness. Core and outer cladding diameters are 61 µm and 153 µm, respectively. Optical loss measurement by means of the careful fundamental mode excitation at 1560 nm wavelength yields the attenuation of ≈27 dB/km being one of the best results being obtained for revolver HCFs. GVD for fundamental mode amounts to β2 = −1.42 ps2/km (D = 1.1 ps/nm/km), while the fiber nonlinearity coefficient γ has been estimated taking into account Kerr nonlinear refractive index of air n2 = 3 × 10⁻²³ m2/W [70], as γ ≈ 10−7 m−1·W−1 () at a wavelength of 1.56 µm.
If pulse energy at CPA source output was less than ≈380 nJ, the linear pulse propagation regime through RF was realized [79], with a spectrum at HCF output being almost the same as the corresponding spectrum of the CPA source.
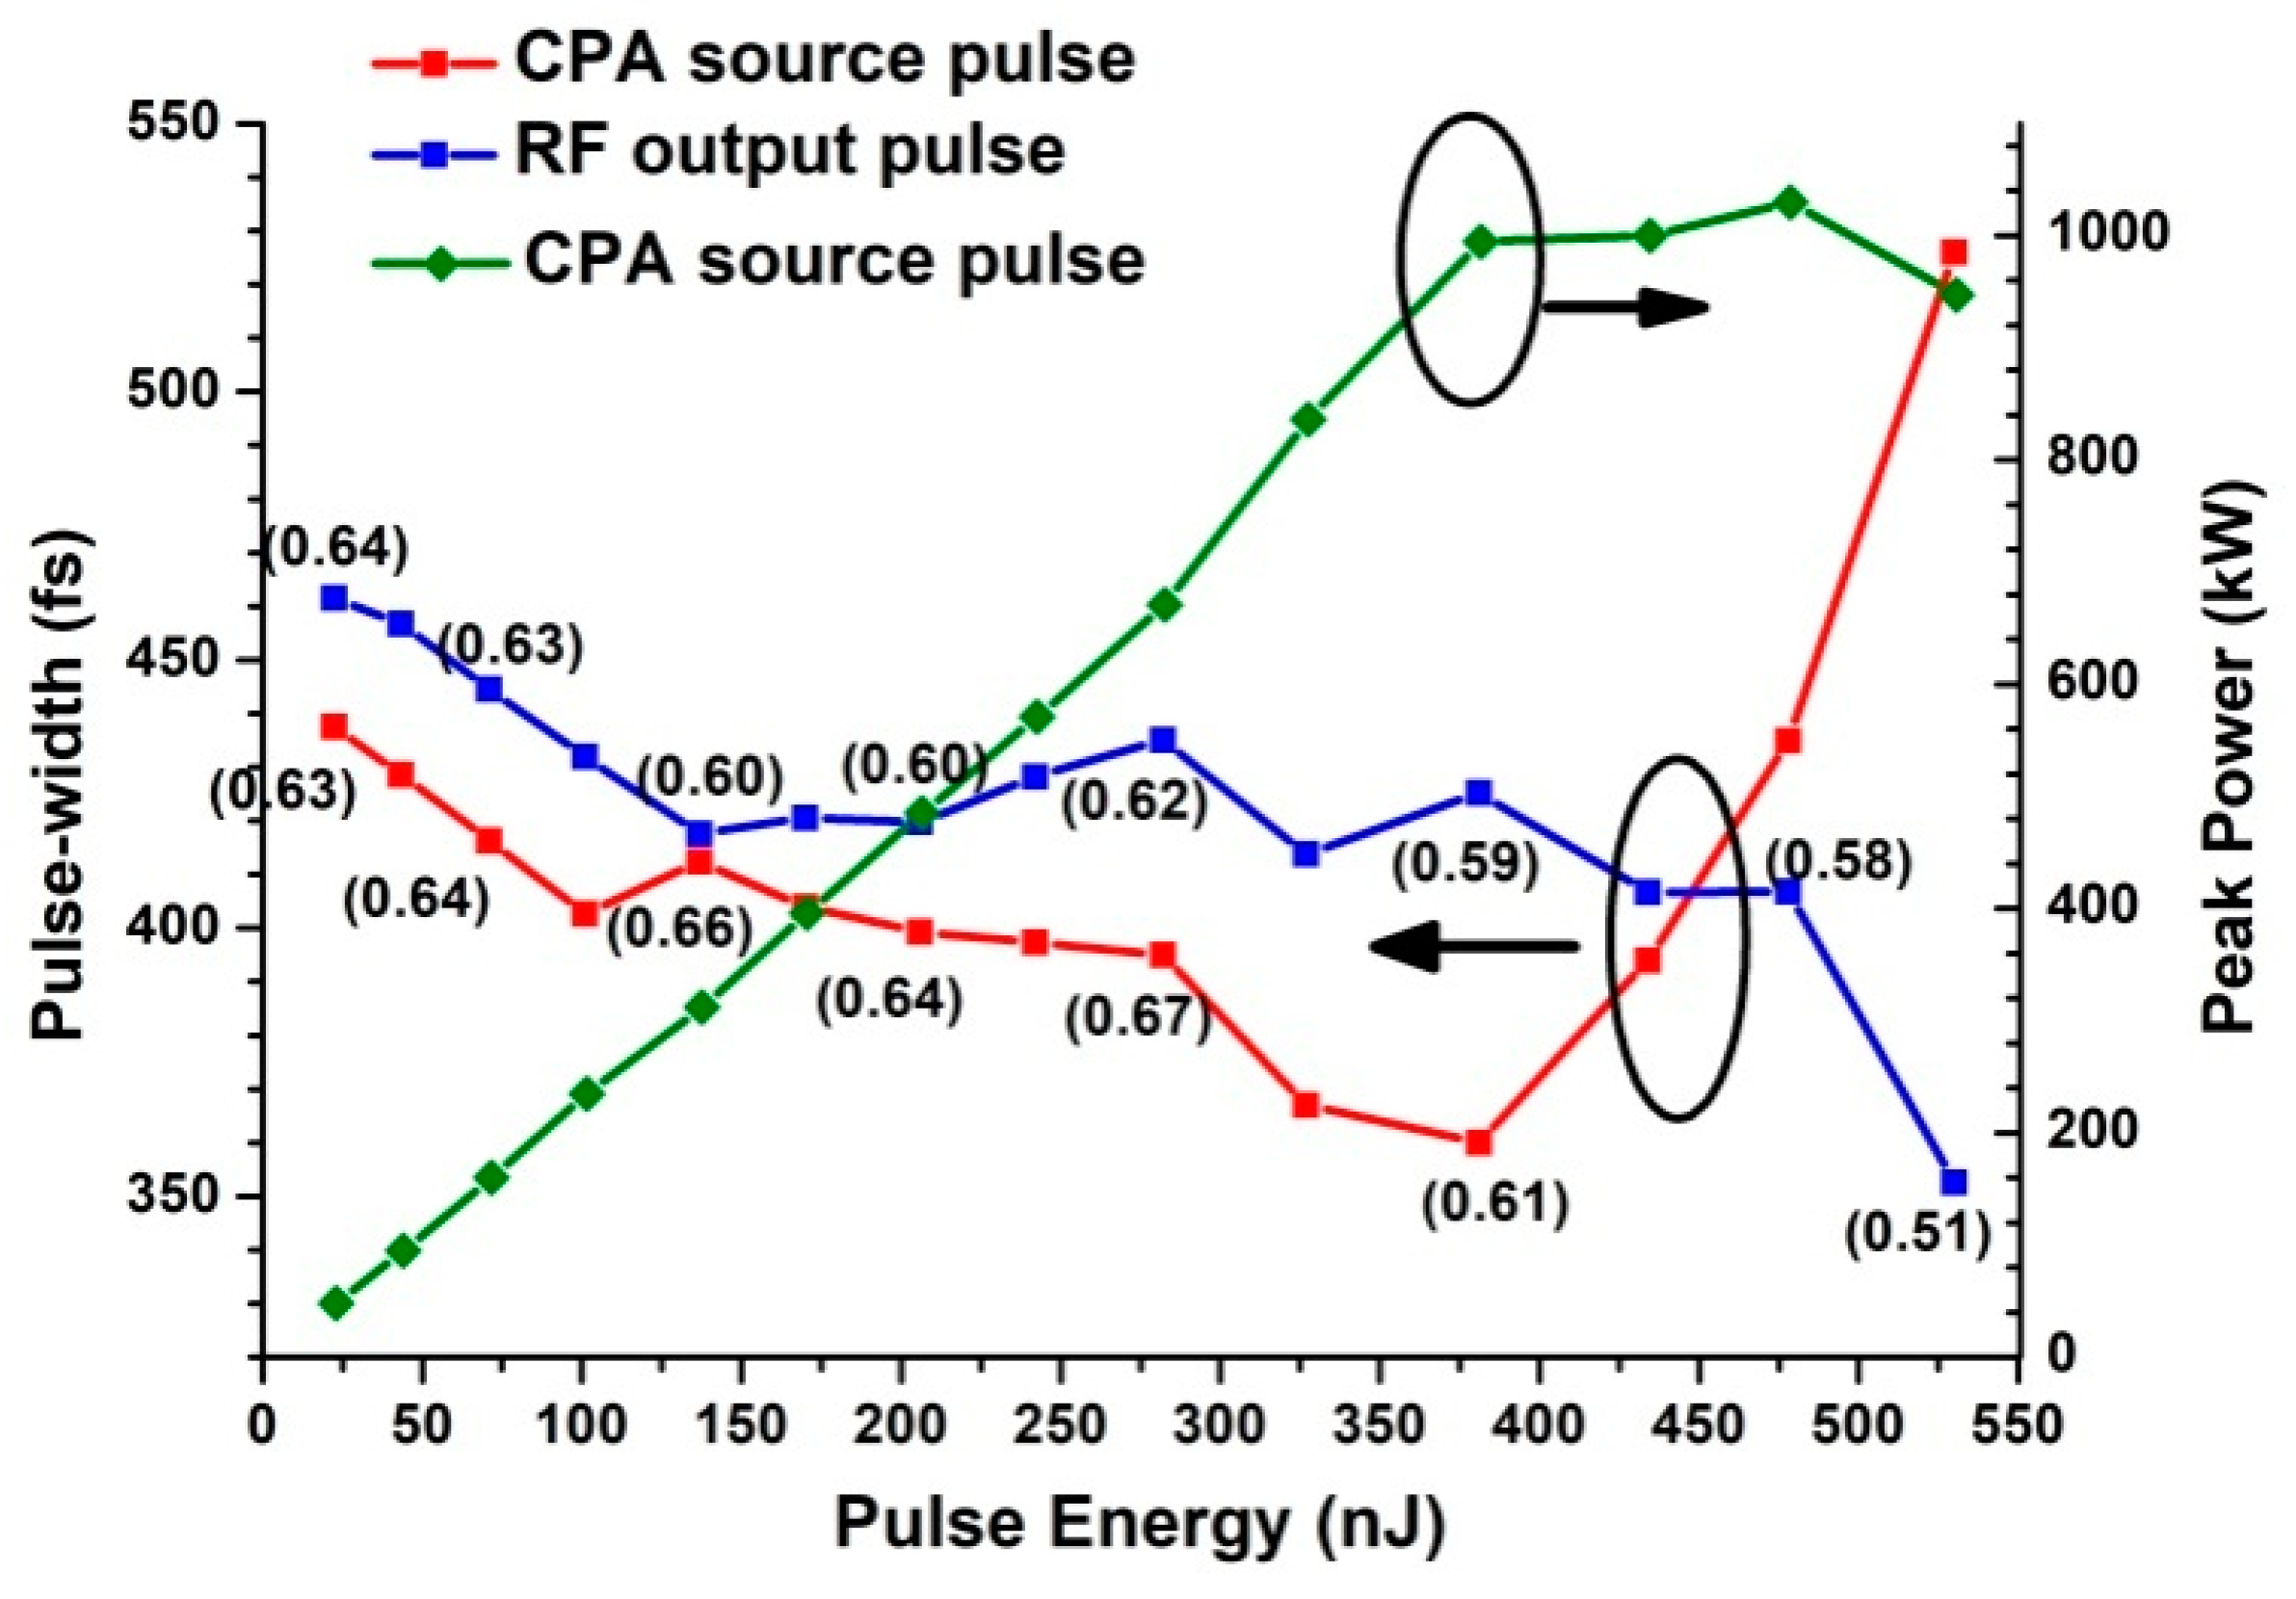
The CPA source and RF output pulse-widths together with CPA source pulse peak power are plotted on Figure 16 as a function of CPA source pulse energy. The highest CPA source pulse energy reaches 530 nJ at 1.42 W average power, while the shortest pulses (360 fs) are obtained at ≈380 nJ energy resulting in the ≈1 MW peak power. However, strong self-phase modulation (SPM) effect in the high-power amplification stage of the CPA source results in the broad spectrum wings origination after the pulse energy reaches ≈380 nJ (≈1.0 W average power).
Furthermore, the CPA source pulse-width has a clear minimum of 360 fs at 381 nJ energy and rapidly grows at higher pulse energies with simultaneous saturation of the peak power. As it has been mentioned above, strong SPM action in the amplification stage of the CPA source prevents further pulse shortening due to the excessive nonlinear pulse chirping that cannot be compensated by the grating pair compressor.
RF output pulse-width is almost monotonically decreased during pulse energy growth, as seen in Figure 16. Thus, as short as 353 fs Gaussian-type pulses have been obtained at 0.94 W maximum average power at RF output. Hence, nonlinear spectral wings inherent to higher pulse energies are filtered out at RF output, which is also accompanied by simultaneous pulse shortening. Here we suggest nonlinearity influence (SPM) in RF on high peak power pulse propagation that depends on the chirp sign and value of the input pulse, since pulse spectrum undergoes either broadening or narrowing under SPM influence depending on the initial chirp sign [81].
Finally, RF output beam quality have been examined by means of the beam profile scanning (in the X and Y planes) in the far field (at a distance of z = 50 mm from RF end face) with 105/125 µm multimode fiber. Taking into account a RF fundamental mode-field diameter of 45 µm, the M2 values have been estimated to be M2 ≈ 1.3 and M2 ≈ 1.4 at low and high output average power, respectively.
In work [79], the propagation of high-power 100-fs Gaussian pulses in RF with a transmission band in the region of 1.56 μm was investigated in a broad range of pump powers. The fiber had eight capillaries with a wall thickness of 2.5 μm, a core diameter of 55 μm, and an outer diameter of 140 μm, while the power attenuation in the fiber was 0.175 dB/m. The dispersion length for 100 fs Gaussian pulses at a wavelength of 1.56 μm was calculated to be = 2.54 m. The calculated fundamental mode field diameter at a wavelength of 1.56 μm was 40 μm. Taking into account the nonlinearity coefficient for air at 1 atm, = 9.65 × 10⁻⁸ m−1W−1, the linear propagation regime in this RF is limited to a peak power of about 300 ÷ 400 kW, in the case when a nonlinear length of a pulse exceeds the effective absorption length ≈ 25 m.
Propagation of pulses through the fiber at pulse powers such, that a nonlinear propagation regime is realized (), was investigated numerically using the generalized nonlinear Schrödinger equation for the complex spectral envelope of a pulse [82], taking into account the higher-order dispersion, the Kerr nonlinearity, and stimulated Raman scattering by rotational transitions of nitrogen [83,84].
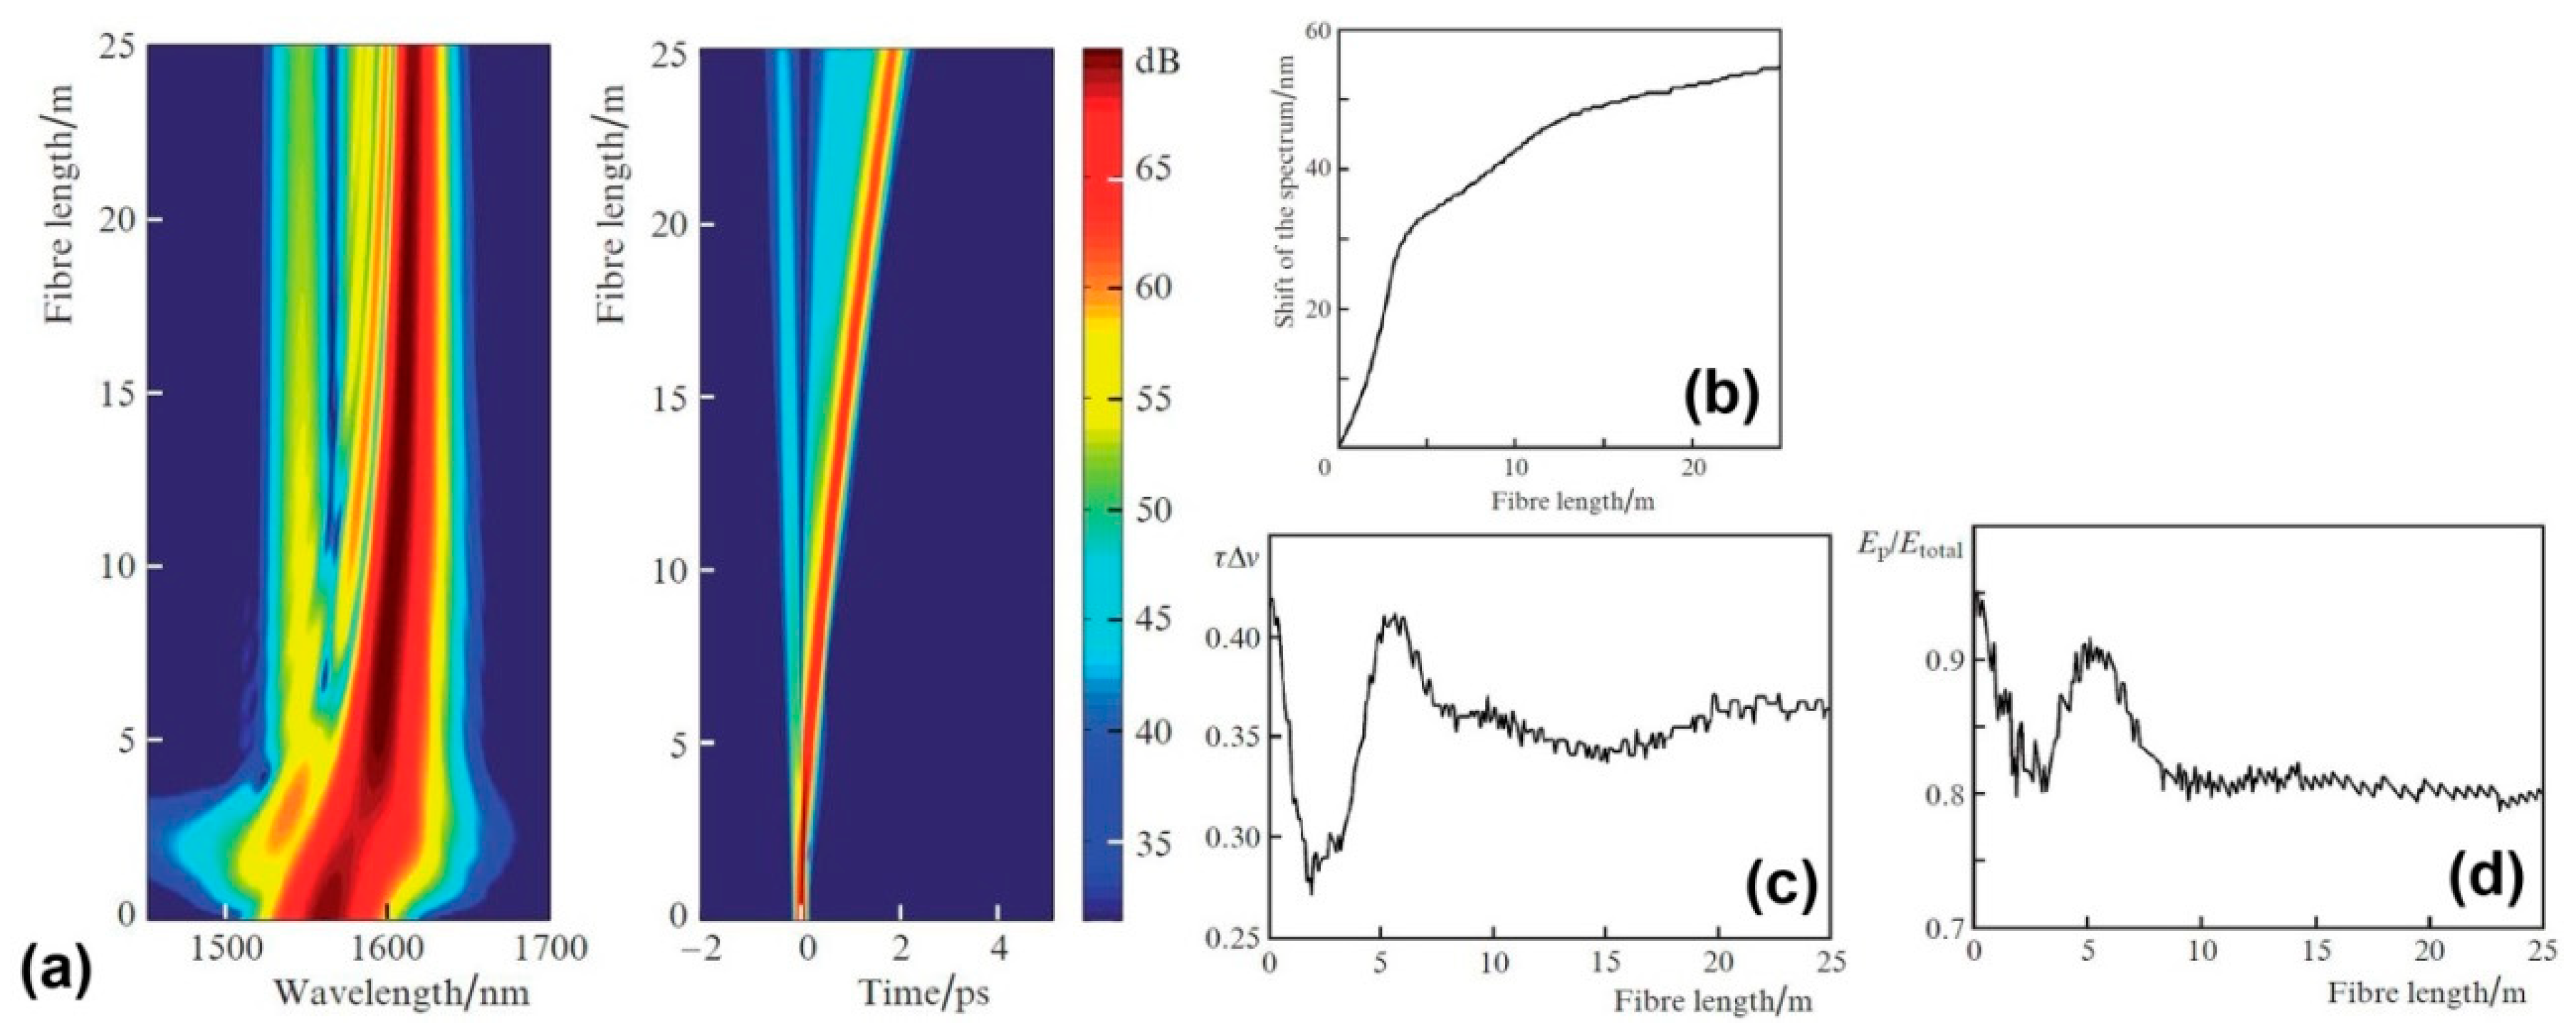
Figure 17 shows the results that were obtained for a pulse peak power of 10 MW, at which the Kerr nonlinear length is 2.5 times smaller than dispersion one for a 100-fs bandwidth-limited Gaussian pulse. The density plot (Figure 17a) demonstrates a shift of the spectrum at 54 nm to the Stokes region, in which the structure is much weaker than that in the anti-Stokes region, where several characteristic bands are clearly distinguishable. Figure 17b demonstrates the dependence of the spectral shift on the fiber length. The highest shift rate occurs at the first 4 m of the fiber, where the spectrum is strongly broadened due to self-phase modulation.
As follows from Figure 17c,d, the pulse preserves the time-bandwidth product and the ratio of the pulse energy at the half-maximum level to the total energy (within 1%) at fiber lengths between 8 m and 25 m. This behavior may be attributed to Raman soliton that sustains its shape when propagating along the fiber (in this case, the soliton order is = 1.6).
In the nonlinear propagation regime (), 160-fs pulse with a peak power of more than 12 MW (1.92 µJ pulse energy) can be retrieved from the 5-m-long RF, when 100-fs pulse with 40 MW peak power (4 μJ pulse energy) is launched into the fiber. Transmission of radiation in the form of Raman solitons with megawatt-level peak powers, without spreading into a supercontinuum, is possible within the entire effective absorption length of 25 m.
It is known that the creation and amplification of dispersion waves leads to the instability of a multisoliton pulse, transforming its spectrum into the supercontinuum. The aforementioned RF has a relatively narrow transmission window in the range 1450 ÷ 1700 nm, with a dispersion zero at 1.514 μm shifted to the short-wavelength edge of the RF transmission band. For a pulse at a wavelength of 1560 nm, phase matching, which ensures the efficient transfer of soliton energy to dispersion waves, is possible at wavelengths that are around 1442 nm located outside the transmission band. Thus, they cannot be amplified. The dominant process forming the structure of the spectrum is SRS, which can provide a power-dependent spectral shift of up to 130 nm under appropriate peak power of the input 100-fs pulse.
6.2. Multi-Band Supercontinuum Generation in RF
The most impressive results on supercontinuum generation were obtained in Kagome-type holy core fibers [18,71]. By varying gas pressure, the supercontinuum spanning more than three octaves from 124 to 1200 nm was obtained in [18]. The Kagome HCF used for supercontinuum generation in these studies had one or a few broad transmission bands, which, however, limited supercontinuum span.
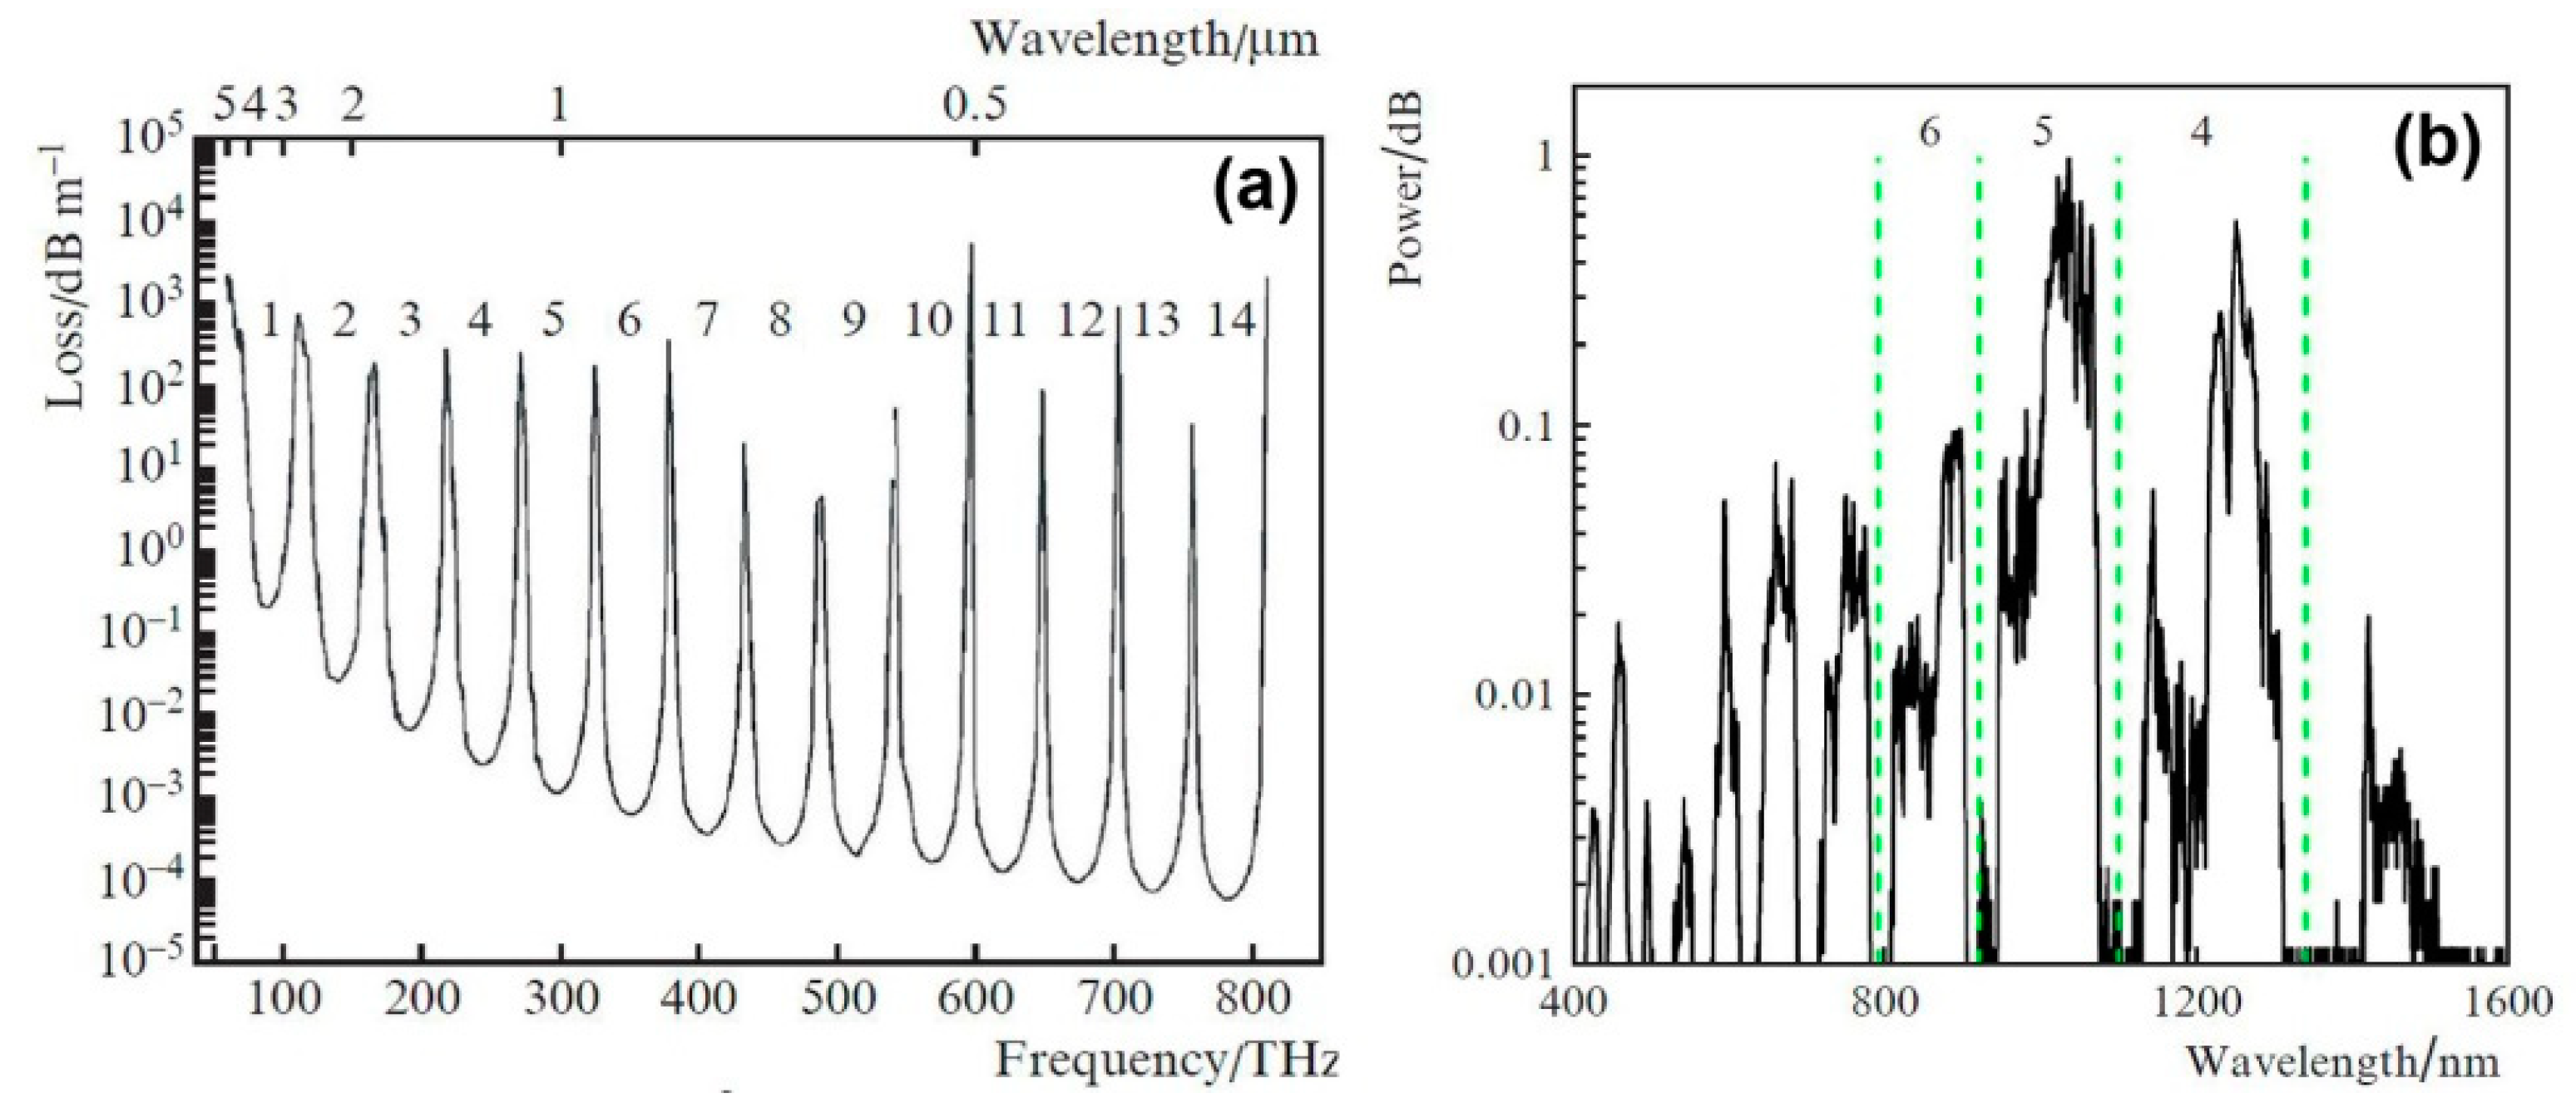
In the work [80], the possibility of a multi-band supercontinuum generation in the RF with separated capillaries and a core filled with atmospheric air was demonstrated. For these studies, eight-capillary RF with a core diameter of 61.5 μm, a capillary wall thickness of 2.7 μm, and an outer capillary diameter of 25 μm was fabricated. With this capillary thickness, the RF had a large number of transmission bands with slightly different spectral widths, extending from UV to middle IR spectral range (Figure 18a). Due to the low GVD of the atmospheric air, the dispersion characteristics for a fundamental mode in slightly different neighboring transmission bands also had a small difference. In particular, the presence of GVD zeros near the center of each band created favorable conditions for the efficient band-to-band transfer of radiation due to nonlinear effects.
A powerful femtosecond solid-state laser was used as a pump source emitting 205 fs pulses with up to 130 μJ energy at a central wavelength of 1028 nm. It should be noted that the pump laser generation wavelength lies in the center of the 5th transmission band, in accordance with the ARROW model, as it is depicted in Figure 18a. Figure 18b shows an experimentally obtained supercontinuum with a spectral range extending from 415 to 1593 nm wavelength that overlaps 11 transmission bands, when 205 fs pulses with 110 μJ energy are launched into the RF.
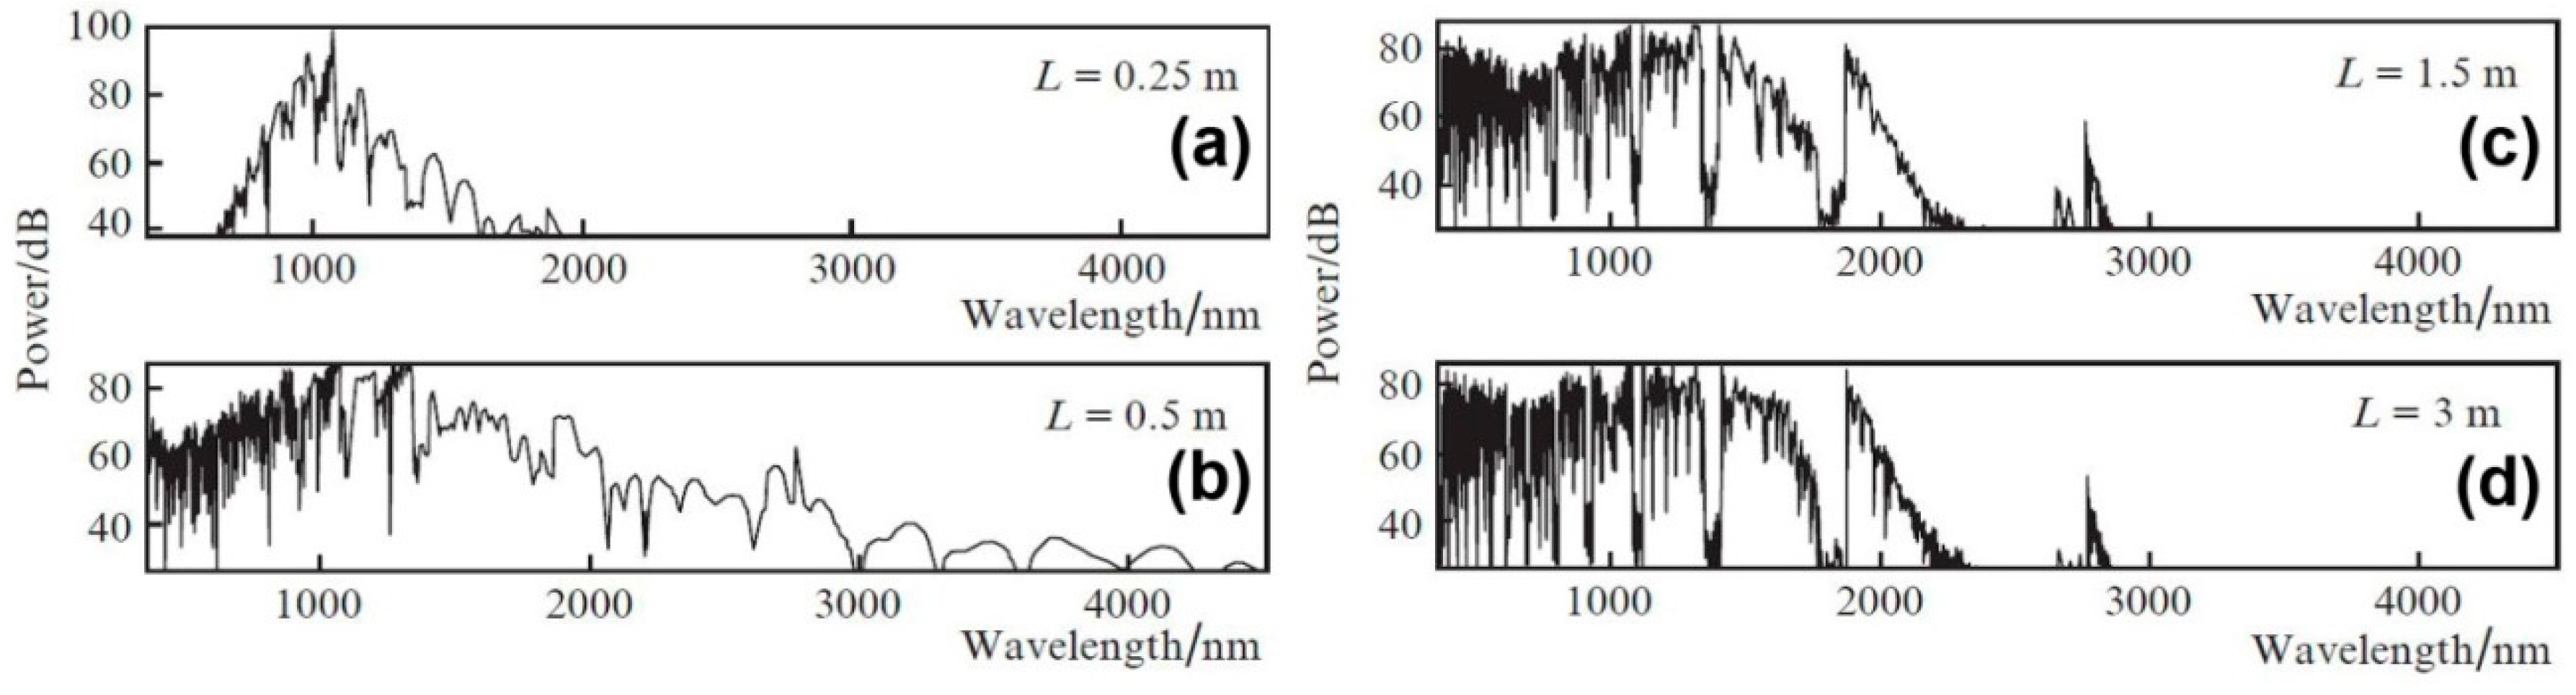
The multimode nature of the light propagation in this RF reduces the efficiency of nonlinear processes responsible for the supercontinuum generation, owing to a redistribution of energy between higher-order RF modes. Numerical analysis proved (Figure 19) that at a comparable input pulse power and a single-mode propagation, the expected supercontinuum can overlap 14 transmission bands, extending from 370 nm to 4200 nm. Such a spectral width (exceeding three octaves) can be obtained at fiber lengths of ~50 cm, while the pulse retains more than 50% of its energy.
Detailed analysis of the spectrum structure in various transmission bands made it possible to establish the main nonlinear processes that are responsible for transferring energy from one band to another, such as degenerate and non-degenerate four-wave mixing, and the generation of dispersion waves. It is necessary to emphasize that high efficiency of cascaded nonlinear processes in the RF filled with atmospheric air is accounted for the uniform distribution of zero dispersion wavelengths over a wide spectral range.
7. Conclusions
To conclude, revolver fibers are a versatile tool for transmission, generation, and nonlinear conversion of light in regimes that are not possible in solid-core fibers. Moreover, the design simplicity of the revolver fibers distinguishes them among other types of hollow-core fibers. At the same time, the RFs provide an extremely low overlap of an optical mode with a cladding material. As a result, the RFs can have low optical losses even in those spectral regions where the cladding material has strong fundamental absorption. In particular, silica glass can be applied to fabricate revolver fibers for UV and mid-IR spectral ranges. It was experimentally demonstrated that optical losses of the revolver silica fibers can be as low as ~1 dB/m at wavelength up to 200 nm in the UV and up to 4.4 µm in the mid-IR.
Recently, the implementation of the gas-filled revolver fibers enabled one to demonstrate mid-IR gas fiber lasers that are based on stimulated Raman scattering. Pumping molecular gases, such as light hydrogen 1H2 and deuterium D2, by nanosecond pulses of a 1.56 µm Er-doped fiber laser, Raman generation in the wavelength range of 2.9–4.4 µm has been demonstrated. In spite of high quantum defect for 1.56 → 4.4 µm conversion, the average output power as high as 250 mW was generated at the wavelength of 4.4 µm with quantum a conversion efficiency as high as 36%. We believe that the efficiency and output power of the Raman gas fiber lasers can be dramatically improved.
An extremely small overlap of the optical mode with the cladding material is also responsible for another useful property of the revolver fibers: such fibers can transmit intense ultrashort pulses without distortion. This fact is advantageous for pulse delivery in material processing applications. Nonlinear and dispersive properties of the cladding material have a limited effect on pulse propagation, as the intensity of light in the cladding is rather low. On the other hand, if optical pulses have high enough intensity, the nonlinearity of a gas inside the hollow core comes into play, enabling various nonlinear phenomena, such as Raman soliton propagation and supercontinuum generation. In particular, multiband supercontinuum generation has been demonstrated in an air-filled revolver fiber in the spectral range of 400–1500 nm. According to numerical simulations, such multiband supercontinuum can be extended up to ~4.5 µm in revolver fibers that are made of silica glass. Extension towards even longer wavelengths can be achieved using chalcogenide revolver fibers, which have already demonstrated optical transmission at the wavelength as long as 10.6 µm.
Finally, we believe that further development of the revolver fibers and devices based on them can make valuable contribution to numerous applications in biomedicine, spectroscopy, and material processing.
Author Contributions
A.F.K. fabricated revolver fibers, A.D.P., Y.P.Y., A.S.B. and I.A.B. made theoretical analysis and calculations, A.V.G., A.N.K. and A.A.K. carried out experiments. All the authors participated in discussion of the results and manuscript preparation.
Acknowledgments
This work was supported by the Presidium of the Russian Academy of Sciences (Program No 1.7: Topical Problems of Photonics, Probing of inhomogeneous Media and Materials).
Conflicts of Interest
The authors declare no conflict of interest.
References
- Pryamikov, A.D.; Biriukov, A.S.; Kosolapov, A.F.; Plotnichenko, V.G.; Semjonov, S.L.; Dianov, E.M. Demonstration of a waveguide regime for a silica hollow—Core microstructured optical fiber with a negative curvature of the core boundary in the spectral region > 3.5 μm. Opt. Express 2011, 19, 1441–1448. [Google Scholar] [CrossRef] [PubMed]
- Wang, Y.Y.; Couny, F.; Roberts, P.J.; Benabid, F. Low Loss Broadband Transmission in Optimized Core-Shape Kagome Hollow-Core PCF. In Proceedings of the CLEO’2010, San Jose, CA, USA, 16–21 May 2010. [Google Scholar]
- Yu, F.; Wadsworth, W.J.; Knight, J.C. Low loss silica hollow core fibers for 3–4 µm spectral region. Opt. Express 2012, 20, 11153–11158. [Google Scholar] [CrossRef] [PubMed]
- Kolyadin, A.N.; Kosolapov, A.F.; Pryamikov, A.D.; Biriukov, A.S.; Plotnichenko, V.G.; Dianov, E.M. Light transmission in negative curvature hollow core fiber in extremely high material loss region. Opt. Express 2013, 21, 9514–9519. [Google Scholar] [CrossRef] [PubMed]
- Gladyshev, A.V.; Kolyadin, A.N.; Kosolapov, A.F.; Yatsenko, Y.P.; Pryamikov, A.D.; Biryukov, A.S.; Bufetov, I.A.; Dianov, E.M. Efficient 1.9-μm Raman generation in a hydrogen-filled hollow-core fibre. Quantum Electron. 2015, 45, 807–812. [Google Scholar] [CrossRef]
- Kosolapov, A.F.; Alagashev, G.K.; Kolyadin, A.N.; Pryamikov, A.D.; Biryukov, A.S.; Bufetov, I.A.; Dianov, E.M. Hollow-core revolver fibre with a reflecting cladding consisting of double capillaries. Quantum Electron. 2016, 46, 10–14. [Google Scholar] [CrossRef]
- Belardi, W.; Knight, J.C. Hollow antiresonant fibers with reduced attenuation. Opt. Lett. 2014, 39, 1853–1856. [Google Scholar] [CrossRef] [PubMed]
- Alagashev, G.K.; Pryamikov, A.D.; Kosolapov, A.F.; Kolyadin, A.N.; Lukovkin, A.Y.; Biriukov, A.S. Impact of geometrical parameters on the optical properties of negative curvature hollow-core fibers. Laser Phys. 2015, 25, 055101. [Google Scholar] [CrossRef] [Green Version]
- Wei, C.; Weiblen, R.J.; Menyuk, C.R.; Hu, J. Negative curvature fibers. Adv. Opt. Photonics 2017, 9, 504–561. [Google Scholar] [CrossRef]
- Marcatili, E.A.J.; Schmeltzer, R.A. Hollow metallic and dielectric waveguides for long distance optical transmission and lasers. Bell Syst. Tech. J. 1964, 43, 1783–1809. [Google Scholar] [CrossRef]
- Miyagi, M.; Nishida, S. Transmission characteristics of dielectric tube leaky waveguide. IEEE Trans. Microw. Theory Tech. 1980, 28, 536–541. [Google Scholar] [CrossRef]
- Litchinitser, N.M.; Abeeluck, A.K.; Headley, C.; Eggleton, B.J. Antiresonant reflecting photonic crystal optical waveguides. Opt. Lett. 2002, 27, 1592–1594. [Google Scholar] [CrossRef] [PubMed]
- Zheltikov, A.M. Colors of thin films, antiresonant phenomena in optical systems, and the limiting loss of modes in hollow optical waveguides. Uspekhi Fiz. Nauk 2008, 178, 619–629. [Google Scholar]
- Landau, L.D.; Lifshitz, E.M. Electrodynamics of Continuous Media, 2nd ed.; Pergamon Press Ltd.: New York, NY, USA, 1984. [Google Scholar]
- Kosolapov, A.F.; Pryamikov, A.D.; Biriukov, A.S.; Vladimir, S.; Astapovich, M.S.; Snopatin, G.E.; Plotnichenko, V.G.; Churbanov, M.F.; Dianov, E.M. Demonstration of CO2-laser power delivery through chalcogenide-glass fiber with negative-curvature hollow core. Opt. Express 2011, 19, 25723–25728. [Google Scholar] [CrossRef] [PubMed]
- Setti, V.; Vincetti, L.; Argyros, A. Flexible tube lattice fibers for terahertz applications. Opt. Express 2013, 23, 3388–3399. [Google Scholar] [CrossRef] [PubMed]
- Kitamura, R.; Pilon, L.; Jonasz, M. Optical constants of silica glass from extreme ultraviolet to far infrared at near room temperature. Appl. Opt. 2007, 46, 8118–8133. [Google Scholar] [CrossRef] [PubMed]
- Belli, F.; Abdolvand, A.; Chang, W.; Travers, J.C.; Russell, P.S.J. Vacuum-ultraviolet to infrared supercontinuum in hydrogen-filled photonic crystal fiber. Optica 2015, 2, 292–300. [Google Scholar] [CrossRef]
- Humbach, O.; Fabian, H.; Grzesik, U.; Haken, U.; Heitmann, W. Analysis of OH absorption bands in synthetic silica. J. Non-Cryst. Solids 1996, 203, 19–26. [Google Scholar] [CrossRef]
- Tomashuk, A.L.; Golant, K.M. Radiation-resistant and radiation-sensitive silica optical fibers. In Proceedings of the SPIE, Moscow, Russia, 17 May 2000. [Google Scholar]
- Kryukova, E.B.; Plotnichenko, V.G.; Dianov, E.M. IR absorption spectra in high-purity silica glasses fabricated by different technologies. In Proceedings of the SPIE, Moscow, Russia, 17 May 2000. [Google Scholar]
- Roberts, P.; Couny, F.; Sabert, H.; Mangan, B.; Williams, D.; Farr, L.; Mason, M.; Tomlinson, A.; Birks, T.; Knight, J.; et al. Ultimate low loss of hollow-core photonic crystal fibres. Opt. Express 2005, 13, 236–244. [Google Scholar] [CrossRef] [PubMed]
- Fini, J.M.; Nicholson, J.W.; Windeler, R.S.; Monberg, E.M.; Meng, L.; Mangan, B.; DeSantolo, A.; DiMarcello, F.V. Low-loss hollow-core fibers with improved single-modedness. Opt. Express 2013, 21, 6233–6242. [Google Scholar] [CrossRef] [PubMed]
- Wheeler, N.; Heidt, A.; Petrovich, M.; Baddela, N.; Numkam-fokoua, A.; Hayes, J.; Sandoghchi, S.R.; Poletti, F.; Wheeler, N.V.; Heidt, A.M. Low-loss and low-bend-sensitivity mid-infrared guidance in a hollow-core-photonic-bandgap fiber. Opt. Lett. 2014, 39, 295–298. [Google Scholar] [CrossRef] [PubMed]
- Wang, Y.Y.; Wheeler, N.V.; Couny, F.; Roberts, P.J.; Benabid, F. Low loss broadband transmission in hypocycloid-core Kagome hollow-core photonic crystal fiber. Opt. Lett. 2011, 36, 669–671. [Google Scholar] [CrossRef] [PubMed]
- Février, S.; Beaudou, B.; Viale, P. Understanding origin of loss in large pitch hollow-core photonic crystal fibers and their design simplification. Opt. Express 2010, 18, 5142–5150. [Google Scholar] [CrossRef] [PubMed]
- Gérôme, F.; Jamier, R.; Auguste, J.-L.; Humbert, G.; Blondy, J.-M. Simplified hollow-core photonic crystal fiber. Opt. Lett. 2010, 35, 1157–1159. [Google Scholar] [CrossRef] [PubMed]
- Urich, A.; Maier, R.R.J.; Yu, F.; Knight, J.C.; Hand, D.P.; Shephard, J.D. Flexible delivery of Er: YAG radiation at 2. 94 µm with negative curvature silica glass fibers: A new solution for minimally invasive surgical procedures. Biomed. Opt. Express 2013, 4, 7139–7144. [Google Scholar] [CrossRef] [PubMed] [Green Version]
- Hartung, A.; Kobelke, J.; Schwuchow, A.; Wondraczek, K.; Bierlich, J.; Popp, J.; Frosch, T.; Schmidt, M.A. Double antiresonant hollow core fiber—Guidance in the deep ultraviolet by modified tunneling leaky modes. Opt. Express 2014, 22. [Google Scholar] [CrossRef] [PubMed]
- Pryamikov, A.D.; Kosolapov, A.F.; Alagashev, G.K.; Kolyadin, A.N.; Vel’miskin, V.V.; Biriukov, A.S.; Bufetov, I.A. Hollow-core microstructured “revolver” fibre for the UV spectral range. Quantum Electron. 2016, 46, 1129–1133. [Google Scholar] [CrossRef]
- Gladyshev, A.V.; Kosolapov, A.F.; Kolyadin, A.N.; Astapovich, M.S.; Pryamikov, A.D.; Likhachev, M.E.; Bufetov, I.A. Mid-IR hollow-core silica fibre Raman lasers. Quantum Electron. 2017, 47, 1078–1082. [Google Scholar] [CrossRef]
- Wang, Z.; Belardi, W.; Yu, F.; Wadsworth, W.J.; Knight, J.C. Efficient diode-pumped mid-infrared emission from acetylene-filled hollow-core fiber. Opt. Express 2014, 22, 21872–21878. [Google Scholar] [CrossRef] [PubMed]
- Michieletto, M.; Lyngsø, J.K.; Jakobsen, C.; Lægsgaard, J.; Bang, O.; Alkeskjold, T.T. Hollow-core fibers for high power pulse delivery. Opt. Express 2016, 24, 7103–7119. [Google Scholar] [CrossRef] [PubMed]
- Uebel, P.; Günendi, M.C.; Frosz, M.H.; Ahmed, G.; Edavalath, N.N.; Ménard, J.-M.; Russell, P.S.J. A broad-band robustly single-mode hollow-core PCF by resonant filtering of higher order modes. In Proceedings of the Frontiers in Optics 2015, San Jose, CA, USA, 18–22 October 2015. [Google Scholar]
- Krylov, A.A.; Senatorov, A.K.; Pryamikov, A.D.; Kosolapov, A.F.; Kolyadin, A.N.; Alagashev, G.K.; Gladyshev, A.V.; Bufetov, I.A. 1.56 µm sub-microjoule femtosecond pulse delivery through low-loss microstructured revolver hollow-core fiber. Laser Phys. Lett. 2017, 14, 035104. [Google Scholar] [CrossRef]
- Gauthier, J.-C.; Fortin, V.; Carrée, J.-Y.; Poulain, S.; Poulain, M.; Vallée, R.; Bernier, M. Mid-IR supercontinuum from 2.4 to 5.4 μm in a low-loss fluoroindate fiber. Opt. Lett. 2016, 41, 1756–1759. [Google Scholar] [CrossRef] [PubMed]
- Tang, Z.; Shiryaev, V.S.; Furniss, D.; Sojka, L.; Sujecki, S.; Benson, T.M.; Seddon, A.B.; Churbanov, M.F. Low loss Ge-As-Se chalcogenide glass fiber, fabricated using extruded preform, for mid-infrared photonics. Opt. Mater. Express 2015, 5, 1722–1737. [Google Scholar] [CrossRef]
- Sanghera, J.; Aggarwal, I.D. Infrared Fiber Optics; CRC Press: Boca Raton, FL, USA, 1998. [Google Scholar]
- Artyushenko, V.; Bocharnikov, A.; Sakharova, T.; Usenov, I. Mid-infrared fiber optics for 1–18 µm range. IR-fibers and waveguides for laser power delivery and spectral sensing. Opt. Photonik 2014, 4, 35–39. [Google Scholar] [CrossRef]
- Hassan Muhammad Rosdi, A.; Yu, F.; Wadsworth, J.W.; Knight, J.C. Cavity-based mid-IR fiber gas laser pumped by a diode laser. Optica 2016, 3, 218–221. [Google Scholar] [CrossRef]
- Uebel, P.; Günendi, M.C.; Frosz, M.H.; Ahmed, G.; Edavalath, N.N.; Ménard, J.-M.; Russell, P.S.J. Вroadband robustly single-mode hollow-core PCF by resonant filtering of higher-order modes. Opt. Lett. 2016, 41, 1961–1964. [Google Scholar] [CrossRef] [PubMed]
- Wei, C.; Hu, J.; Menyuk, C.R. Comparison of loss in silica and chalcogenide negative curvature fibers as the wavelength varies. Front. Phys. 2016, 4, 1–10. [Google Scholar] [CrossRef]
- Gladyshev, A.V.; Kosolapov, A.F.; Khudyakov, M.M.; Yatsenko, Y.P.; Kolyadin, A.N.; Krylov, A.A. 4.4 μm raman laser based on hydrogen-filled hollow-core silica fiber. In Proceedings of the CLEO’2017, San Jose, CA, USA, 14–19 May 2017. [Google Scholar]
- Gladyshev, A.V.; Kosolapov, A.F.; Khudyakov, M.M.; Yatsenko, Y.P.; Kolyadin, A.N.; Krylov, A.A.; Pryamikov, A.D.; Biriukov, A.S.; Likhachev, M.E.; Bufetov, I.A.; Dianov, E.M. 4.4-µm Raman laser based on hollow-core silica fibre. Quantum Electron. 2017, 47, 491–494. [Google Scholar] [CrossRef]
- Alharbi, M.; Bradley, T.; Debord, B.; Fourcade-Dutin, C.; Ghosh, D.; Vincetti, L.; Gérôme, F.; Benabid, F. Hypocycloid-shaped hollow-core photonic crystal fiber Part II: Cladding effect on confinement and bend loss. Opt. Express 2013, 21, 28609–28616. [Google Scholar] [CrossRef] [PubMed]
- Gao, S.-F.; Wang, Y.-Y.; Ding, W.; Wang, P. Hollow-core negative-curvature fiber for UV guidance. Opt. Lett. 2018, 43, 1347. [Google Scholar] [CrossRef] [PubMed]
- Denisov, A.N.; Kosolapov, A.F.; Senatorov, A.K.; Pal’tsev, P.E.; Semjonov, S.L. Fabrication of microstructured optical fibres by drawing preforms sealed at their top end. Quantum Electron. 2016, 46, 1031–1039. [Google Scholar] [CrossRef]
- Yakovlev, A.I.; Snetkov, I.L.; Dorofeev, V.V.; Motorin, S.E. Magneto-optical properties of high-purity zinc-tellurite glasses. J. Non. Cryst. Solids 2018, 480, 90–94. [Google Scholar] [CrossRef]
- Shiryaev, V.S.; Kosolapov, A.F.; Pryamikov, A.D.; Snopatin, G.E.; Churbanov, M.F.; Biriukov, A.S.; Kotereva, T.V.; Mishinov, S.V.; Alagashev, G.K.; Kolyadin, A.N. Development of technique for preparation of As2S3 glass preforms for hollow core microstructured optical fibers. J. Optoelectron. Adv. Mater. 2014, 16, 1020–1025. [Google Scholar]
- Gattass, R.R.; Rhonehouse, D.; Gibson, D.; McClain, C.C.; Thapa, R.; Nguyen, V.Q.; Bayya, S.S.; Weiblen, R.J.; Menyuk, C.R.; Shaw, L.B.; et al. Infrared glass-based negative-curvature anti-resonant fibers fabricated through extrusion. Opt. Express 2016, 24, 25697–25703. [Google Scholar] [CrossRef] [PubMed]
- Benabid, F.; Knight, J.C.; Antonopoulos, G.; Russell, P.S.J. Stimulated raman scattering in hydrogen-filled hollow-core photonic crystal fiber. Science 2002, 298, 399–402. [Google Scholar] [CrossRef] [PubMed]
- Gladyshev, A.V.; Kosolapov, A.F.; Astapovich, M.S.; Kolyadin, A.N.; Pryamikov, A.D.; Khudyakov, M.M.; Likhachev, M.E.; Bufetov, I.A. Revolver Hollow-Core Fibers and Raman Fiber Lasers. In Proceedings of the OFC’2018, San Diego, CA, USA, 11–15 March 2018. [Google Scholar]
- Wang, Z.; Yu, F.; Wadsworth, W.J.; Knight, J.C. Efficient 1.9 μm emission in H2-filled hollow core fiber by pure stimulated vibrational Raman scattering. Laser Phys. Lett. 2014, 11, 105807. [Google Scholar] [CrossRef]
- Benoit, A.; Beaudou, B.; Debord, B.; Gerome, F.; Benabid, F. High power Raman-converter based on H2-filled inhibited coupling HC-PCF. In Proceedings of the SPIE 10088, San Francisco, CA, USA, 28 January–2 February 2017. [Google Scholar]
- Xu, M.; Yu, F.; Knight, J. Mid-infrared 1W hollow-core fiber gas laser source. Opt. Lett. 2017, 42, 4055. [Google Scholar] [CrossRef] [PubMed]
- Couny, F.; Benabid, F.; Light, P.S. Subwatt threshold cw raman fiber-gas laser based on H2-filled hollow-core photonic crystal fiber. Phys. Rev. Lett. 2007, 99, 143903. [Google Scholar] [CrossRef] [PubMed]
- Bufetov, I.A.; Dianov, E.M. A simple analytic model of a cw multicascade fibre Raman laser. Quantum Electron. 2007, 30, 873–877. [Google Scholar] [CrossRef]
- Kolyadin, A.N.; Astapovich, M.S.; Gladyshev, A.V.; Kosolapov, A.F. The design optimization and experimental investigation of the 4.4 μm raman laser basedon hydrogen-filled revolver silica fiber. In VII International Conference on Photonics and Information Optics; KnE Energy & Physics: Moscow, Russia, 2018; Volume 2018, pp. 47–64. [Google Scholar]
- Gladyshev, A.V.; Kosolapov, A.F.; Khudyakov, M.M.; Yatsenko, Y.P.; Kolyadin, A.N.; Krylov, A.A. Raman generation in 2.9–3.5 μm spectral range in revolver hollow-core silica fiber filled by H2/D2 mixture. In Proceedings of the CLEO’2017, San Jose, CA, USA, 14–19 May 2017. [Google Scholar]
- Gladyshev, A.V.; Kosolapov, A.F.; Khudyakov, M.M.; Yatsenko, Y.P.; Kolyadin, A.N.; Krylov, A.A.; Pryamikov, A.D.; Biriukov, A.S.; Likhachev, M.E.; Bufetov, I.A.; et al. 2.9, 3.3, and 3.5 µm Raman lasers based on revolver hollow-core silica fiber filled by 1H2/D2 gas mixture. IEEE J. Sel. Top. Quantum Electron. 2018, 24, 0903008. [Google Scholar] [CrossRef]
- Astapovich, M.S.; Kolyadin, A.N.; Gladyshev, A.; Kosolapov, A.F.; Pryamikov, A.D.; Khudyakov, M.; Likhachev, M.E.; Bufetov, I.A. Efficient 4.4 μm Raman laser based on hydrogen-filled hollow-core silica fiber. arXiv, 2018; arXiv:1801.01729. [Google Scholar]
- Hanna, D.C.; Pointer, D.J.; Pratt, D.J. Stimulated raman scattering of picosecond light pulses in hydrogen, deuterium, and methane. IEEE J. Quantum Electron. 1986, 22, 332–336. [Google Scholar] [CrossRef]
- Weber, M.J. CRC Handbook of Laser Science and Technology Supplement 2: Optical Materials; CRC Press: Boca Raton, FL, USA, 1994. [Google Scholar]
- Bischel, W.K.; Black, G. Wavelength dependence of raman scattering cross sections from 200–600 nm. In AIP Conference Proceedings; American Institute of Physics: College Park, MD, USA, 1983. [Google Scholar]
- Chen, Y.; Wang, Z.; Gu, B.; Yu, F.; Lu, Q. Achieving a 1.5 μm fiber gas Raman laser source with about 400 kW of peak power and a 6.3 GHz linewidth. Opt. Lett. 2016, 41, 5118–5121. [Google Scholar] [CrossRef] [PubMed]
- Wang, Z.; Gu, B.; Chen, Y.; Li, Z.; Xi, X. Demonstration of a 150-kW-peak-power, 2-GHz-linewidth, 1.9-μm fiber gas Raman source. Appl. Opt. 2017, 56, 7657–7661. [Google Scholar] [CrossRef] [PubMed]
- Cao, L.; Gao, S.-F.; Peng, Z.-G.; Wang, X.-C.; Wang, Y.-Y.; Wang, P. High peak power 2.8 μm Raman laser in a methane-filled negative-curvature fiber. Opt. Express 2018, 26, 5609–5615. [Google Scholar] [CrossRef] [PubMed]
- Fermann, M.E.; Galvanauskas, A.; Sucha, G. Ultrafast Lasers: Technology and Applications; CRC Press: Boca Raton, FL, USA, 2002. [Google Scholar]
- Funck, M.; Wedel, B. Industrial fiber beam delivery system for ultrafast lasers. Laser Tech. J. 2016, 13, 42–44. [Google Scholar] [CrossRef]
- Nibbering, E.T.J.; Grillon, G.; Franco, M.A.; Prade, B.S.; Mysyrowicz, A. Determination of the inertial contribution to the nonlinear refractive index of air, N2, and O2 by use of unfocused high-intensity femtosecond laser pulses. J. Opt. Soc. Am. B 1997, 14, 650. [Google Scholar] [CrossRef]
- Travers, J.C.; Chang, W.; Nold, J.; Joly, N.Y.; Russell, P.S.J. Ultrafast nonlinear optics in gas-filled hollow-core photonic crystal fibers. J. Opt. Soc. Am. B 2011, 28, A11–A26. [Google Scholar] [CrossRef]
- Saleh, M.F.; Chang, W.; Hölzer, P.; Nazarkin, A.; Travers, J.C.; Joly, N.Y.; Russell, P.S.J.; Biancalana, F. Theory of photoionization-induced blueshift of ultrashort solitons in gas-filled hollow-core photonic crystal fibers. Phys. Rev. Lett. 2011, 107, 203902. [Google Scholar] [CrossRef] [PubMed]
- Saleh, M.F.; Biancalana, F. Tunable frequency-up/down conversion in gas-filled hollow-core photonic crystal fibers. J. Opt. 2015, 18, 13002. [Google Scholar] [CrossRef]
- Ouzounov, D.G.; Ahmad, F.R.; Müller, D.; Venkataraman, N.; Gallagher, M.T.; Thomas, M.G.; Silcox, J.; Koch, K.W.; Gaeta, A.L. Generation of megawatt optical solitons in hollow-core photonic band-gap fibers. Science 2003, 301, 1702–1704. [Google Scholar] [CrossRef] [PubMed]
- Luan, F.; Knight, J.C.; Russell, P.S.J.; Campbell, S.; Xiao, D.; Reid, D.T.; Mangan, B.J.; Williams, D.P.; Roberts, P.J. Femtosecond soliton pulse delivery at 800 nm wavelength in hollow-core photonic bandgap fibers. Opt. Express 2004, 12, 835–840. [Google Scholar] [CrossRef] [PubMed]
- Wang, Y.Y.; Peng, X.; Alharbi, M.; Dutin, C.F.; Bradley, T.D.; Gérôme, F.; Mielke, M.; Booth, T.; Benabid, F. Design and fabrication of hollow-core photonic crystal fibers for high-power ultrashort pulse transportation and pulse compression. Opt. Lett. 2012, 37, 3111–3113. [Google Scholar] [CrossRef] [PubMed]
- Debord, B.; Alharbi, M.; Vincetti, L.; Husakou, A.; Fourcade-Dutin, C.; Hoenninger, C.; Mottay, E.; Gérôme, F.; Benabid, F. Multi-meter fiber-delivery and pulse self-compression of milli-Joule femtosecond laser and fiber-aided laser-micromachining. Opt. Express 2014, 22, 10735–10746. [Google Scholar] [CrossRef] [PubMed]
- Kolyadin, A.N.; Alagashev, G.K.; Pryamikov, A.D.; Mouradian, L.; Zeytunyan, A.; Toneyan, H.; Kosolapov, A.F.; Bufetov, I.A. Negative curvature hollow-core fibers: Dispersion properties and femtosecond pulse delivery. Phys. Procedia 2015, 73, 59–66. [Google Scholar] [CrossRef]
- Yatsenko, Y.P.; Krylov, A.A.; Pryamikov, A.D.; Kosolapov, A.F.; Kolyadin, A.N.; Gladyshev, A.V.; Bufetov, I.A. Propagation of femtosecond pulses in a hollow-core revolver fibre. Quantum Electron. 2016, 46, 617–626. [Google Scholar] [CrossRef]
- Yatsenko, Y.P.; Pleteneva, E.N.; Okhrimchuk, A.G.; Gladyshev, A.V.; Kosolapov, A.F.; Kolyadin, A.N.; Bufetov, I.A. Multiband supercontinuum generation in an air-core revolver fibre. Quantum Electron. 2017, 47, 553. [Google Scholar] [CrossRef]
- Agrawal, G. Nonlinear Fiber Optics, 5th ed.; Academic Press: Cambridge, MA, USA, 2012. [Google Scholar]
- Dudley, J.M.; Taylor, J.R. Supercontinuum Generation in Optical Fibers; Cambridge University Press: Cambridge, MA, USA, 2010. [Google Scholar]
- Sprangle, P.; Peñano, J.R.; Hafizi, B. Propagation of intense short laser pulses in the atmosphere. Phys. Rev. E 2002, 66, 046418. [Google Scholar] [CrossRef] [PubMed]
- Peñano, J.R.; Sprangle, P.; Serafim, P.; Hafizi, B.; Ting, A. Stimulated Raman scattering of intense laser pulses in air. Phys. Rev. E 2003, 68, 056502. [Google Scholar] [CrossRef] [PubMed]
Figure 1.
Cross section images of revolver fibers (RF): (a) RF with single touching capillaries in the cladding [1]; (b) RF with single non-touching capillaries in the cladding [4]; (c) RF with double nested non-touching capillaries [6]; and, (d) The family of hollow-core optical fibers with negative curvature of the core boundary [7].

Figure 2.
(a) Cross-(1) and longitudinal (2) sections of the hollow waveguide [10]; (b) Cross-(1) and longitudinal (2) sections of the tube waveguide [11]; (c) Cross-section (1) of the RF [1], approximation of the part of the walls of the reflecting capillaries by the mirror sides of the angle α (2), a reflection scheme of a ray propagating along the RF, from a corner with mirror sides (a projection onto the cross section of the optical fiber) (3); and, (d) Calculated optical loss spectrum for silica fibers: hollow waveguide (HW), tube waveguide (TW) and RF. For all waveguides, the hollow core diameter is assumed to be 77 μm, and the thickness of the capillary wall (for TW and RF) is 1.15 μm.

Figure 3.
Optical loss in pure silica glass (F300, Heraeus, Hanau, Germany) (blue curves, 1–3) and the minimal optical loss obtained to date in different types of silica glass hollow-core fibers (HCFs). Data on RFs is highlighted in red. In the figure legend, the plotted experimental data are indexed by numbers in round brackets followed by references to literature in square brackets. More details are given in the text [19,20,21,22,23,24,25,26,27,28,29,30,31,32,33,34,35].

Figure 4.
(a) The calculated fundamental mode loss for a silica RF with capillaries in touch and non-touching capillaries in the cladding; (b,c) Schemes of cross sections of these RFs.
Figure 4.
(a) The calculated fundamental mode loss for a silica RF with capillaries in touch and non-touching capillaries in the cladding; (b,c) Schemes of cross sections of these RFs.

Figure 5.
(a) The measured loss (red); the loss measured with He-Ne laser at 3.39 µm (red asterisk); the material loss in fused silica (black); the calculated loss of the fundamental mode (green) of the RF; (b) the micrograph image of the RF cross section, Dcore = 110 μm and capillary wall thickness d = 6 µm.

Figure 6.
The experimentally measured intensity distributions of the hollow core modes arising at the bending of the RF; white lines show a RF cross-section contour. Intensity distributions are shown for: (a) RF bend diameter of 1.6 cm; (b) bend diameter of 3.6 cm; (c) bend diameter 5.6 cm; (d) The experimental dependence of the light intensity transmitted through the RF vs. bend diameter of the fiber [15].

Figure 7.
Cross sections of optical elements at the main stages of RF production: (a) Picture of the RF preform with single capillaries touched to each other; (b) Cross-section of the RF preform with silica elements between the double nested capillaries, Ø 25 mm; (c) SEM image of the RF cross section (drawn from the preform in Figure 7a); and, (d) SEM image of the RF cross section with double non-touching capillaries, Ø 110 μm (from the preform in Figure 7b).

Figure 8.
The scheme of RF drawing. Drawing with same pressure in all capillaries (on the top), drawing with sealed end (on the bottom).
Figure 8.
The scheme of RF drawing. Drawing with same pressure in all capillaries (on the top), drawing with sealed end (on the bottom).

Figure 9.
(a) The stacked perform of RF made of As30Se50Te20 glass, the tube outer diameter—16 mm, the tube inner diameter—11 mm, the capillaries outer diameter—3 mm, the capillaries inner diameter—2.4 mm; (b) SEM image of the As30Se50Te20 RF cleaved end face, the fiber diameter is 750 µm; (c) the CO2-laser radiation intensity (in a.u.) distribution over the As30Se50Te20 RF cross section. White lines show the cross section of the RF; and, (d) optical microscope image of the As2S3 RF cleaved end face, the fiber diameter is 820 µm.

Figure 10.
(a) The preform made by extrusion technique of As2S3 glass; and, (b) The drawn As2S3 RF [50].
Figure 10.
(a) The preform made by extrusion technique of As2S3 glass; and, (b) The drawn As2S3 RF [50].

Figure 11.
Scheme of the experimental setup: L1 and L2—aspheric fused silica lenses; RF—revolver hollow-core fiber; Al2O3—sapphire windows of the gas cells at the HCF ends; ZnSe—collimating lens made of zinc selenide; and, Ge—2-mm-thick germanium plate.
Figure 11.
Scheme of the experimental setup: L1 and L2—aspheric fused silica lenses; RF—revolver hollow-core fiber; Al2O3—sapphire windows of the gas cells at the HCF ends; ZnSe—collimating lens made of zinc selenide; and, Ge—2-mm-thick germanium plate.

Figure 12.
(a) Calculatedspectrum of optical losses for RF that was developed in [59,60] to realize Raman gas fiber lasers (GFL) for 2.9–3.5 µm spectral region; (b) Output spectrum of the Raman gas fiber laser [60]. Peak pump power at λ = 1.56 µm coupled into the RF was 14 kW. A mixture of light hydrogen and deuterium at partial pressures of 2 and 28 atm, respectively, was used as an active medium.

Figure 13.
(a) Calculated optical loss spectrum of a hollow-core revolver fiber (black dashed lines) [52]. Experimentally measured losses are also shown: near-IR loss spectrum was measured using a supercontinuum source (blue solid line), and optical losses at wavelength of 4.4 µm (asterisks) was measured using narrow-band laser source [61]; and, (b) Output emission spectrum of an RF filled with 1H2 at room temperature and a pressure of 30 atm. The launched peak pump power was 18 kW [43,52].

Figure 14.
(a) Experimentally determined output pulse energy at 4.4 µm as a function of 1H2 pressure in the hollow core [61]. The pump pulse duration was τp = 3.5 ns. The vertical dashed line represents a pressure at which the dephasing time of molecular hydrogen vibrations satisfies the relation τp = 20∙T2; and, (b) Calculated (lines) and measured (data points) average output power of spectral components as a function of average launched pump power for the Raman GFL. Different colors correspond to different spectral components: 1.56 µm (black), 1.72 µm (blue), and 4.42 µm (red). Dashed red line represents a quantum limit for 4.42 µm generation. The measurements and calculations were made at the optimal fiber length (3.2 m) and hydrogen pressure (50 atm) [61].

Figure 15.
(a) RF SEM cross section image [78]; (b) Measured (solid black line) and simulated (dashed green line) group velocity dispersion(GVD) of the fiber used in experiments at 748 nm wavelength [78]; and, (c) Cross-section image of RF used in experiments at 1560 nm [35].

Figure 16.
Chirped pulse amplification(CPA) source (red) and RF output (blue) pulse-width also with CPA source pulse peak power (green) versus CPA source pulse energy. (TBP values are given in parentheses) [35].
Figure 16.
Chirped pulse amplification(CPA) source (red) and RF output (blue) pulse-width also with CPA source pulse peak power (green) versus CPA source pulse energy. (TBP values are given in parentheses) [35].

Figure 17.
Propagation of a 100-fs transform-limited Gaussian pulse with an input power of 10 MW through the RF: (a) color density plot of pulse evolution; (b) red-shift of the pulse spectrum; and, (c,d) time-bandwidth product and pulse energy as functions of fiber length [79].
Figure 17.
Propagation of a 100-fs transform-limited Gaussian pulse with an input power of 10 MW through the RF: (a) color density plot of pulse evolution; (b) red-shift of the pulse spectrum; and, (c,d) time-bandwidth product and pulse energy as functions of fiber length [79].

Figure 18.
(a) Calculated losses for the fundamental mode in the spectral range corresponding to 14 transmission bands; and, (b) Laser emission spectrum measured at the output of the 3-m-long fiber at the input pulse energy of 110 μJ [80].
Figure 18.
(a) Calculated losses for the fundamental mode in the spectral range corresponding to 14 transmission bands; and, (b) Laser emission spectrum measured at the output of the 3-m-long fiber at the input pulse energy of 110 μJ [80].

Figure 19.
(a–d) Calculated supercontinuum spectra at different RF lengths for pure single-mode propagation at an input pulse energy of 110 μJ for various fiber lengths from 0.25 to 3 m [80].
Figure 19.
(a–d) Calculated supercontinuum spectra at different RF lengths for pure single-mode propagation at an input pulse energy of 110 μJ for various fiber lengths from 0.25 to 3 m [80].

© 2018 by the authors. Licensee MDPI, Basel, Switzerland. This article is an open access article distributed under the terms and conditions of the Creative Commons Attribution (CC BY) license (http://creativecommons.org/licenses/by/4.0/).
Share and Cite
MDPI and ACS Style
Bufetov, I.A.; Kosolapov, A.F.; Pryamikov, A.D.; Gladyshev, A.V.; Kolyadin, A.N.; Krylov, A.A.; Yatsenko, Y.P.; Biriukov, A.S. Revolver Hollow Core Optical Fibers. Fibers 2018, 6, 39. https://doi.org/10.3390/fib6020039
AMA Style
Bufetov IA, Kosolapov AF, Pryamikov AD, Gladyshev AV, Kolyadin AN, Krylov AA, Yatsenko YP, Biriukov AS. Revolver Hollow Core Optical Fibers. Fibers. 2018; 6(2):39. https://doi.org/10.3390/fib6020039
Chicago/Turabian StyleBufetov, Igor A., Alexey F. Kosolapov, Andrey D. Pryamikov, Alexey V. Gladyshev, Anton N. Kolyadin, Alexander A. Krylov, Yury P. Yatsenko, and Alexander S. Biriukov. 2018. "Revolver Hollow Core Optical Fibers" Fibers 6, no. 2: 39. https://doi.org/10.3390/fib6020039
Note that from the first issue of 2016, this journal uses article numbers instead of page numbers. See further details here.