Free Energy Profile of APOBEC3G Protein Calculated by a Molecular Dynamics Simulation

Abstract
:1. Introduction
2. Methods
- Step 1a. 2KEM and 3IR2 structures were energy-minimized, then subjected to a short-time MD simulation, which generated an equilibrium structure for each of 2KEM and 3IR2.
- Step 2a. Ten long-time (20 ns) MD simulations were performed with different initial velocities for the equilibrium structures of 2KEM and 3IR2. 20 trajectory structures were extracted from each 20-ns MD simulation.
- Step 3a. The average and deviation of free energy of the extracted trajectory structures were calculated by using the GBSA method.
- Step 1b. Method described in Step 1a.
- Step 2b. Targeted MD simulations from 2KEM to 3IR2 and from 3IR2 to 2KEM were calculated, which generated intermediate structures along each pathway [26]. Ten structures were sampled with similar intervals for Step 3.
- Step 3b. MD simulations (10 ns) were performed to generate the structural ensemble of each structure sampled in the Step 2b. The coordinates of main-chain atoms of each sampled structure were kept by using weak constraints in explicit solvent molecules. Two MD simulations were performed with different initial velocities for each sampled structure.
- Step 4b. Average GBSA energy was calculated based on its atomic coordinate trajectory found in the MD simulations performed in the Step 3b.
- Step 5b. The free energy profile was calculated based on the GBSA energy for each path of the targeted MD simulations.
2.1. Molecular Dynamics Simulation in Water Solvent
- Step 1a: An equilibrium structure was generated for 2KEM and 3IR2, and MD simulations performed in explicit water system. The atomic charges and force field originated from FUJI, which is a modified version of AMBER parm99 [29,30]. The systems were solvated in a water sphere with a radius of 40 Å. The protein structure was embedded in TIP3P [31] water with ion particles included Cl− to neutralize the total charge of the system. After a steepest descent (1000 steps) energy minimizations with positional restraints on the solute and to carry out an initial 100 ps simulation with the positions of the solute atoms restrained by a force constant of 10 kcal/mol Å2 to let the water diffuse around the molecule and for equilibration. The fast multipole method (FMM) [32] was used for the calculation of electrostatic contribution to non bonded interactions with a cut-off of 12 Å. The MD simulations were performed by using the cosgene/myPresto program [33,34].
- Step 2a: The NVT calculation (20 ns) at 300K was performed. The position restraint was not applied to any atom. The SHAKE algorithm was applied to the system and the time step was set to 2 fs [35]. Snap shot structures were obtained every 10 ps during the NVT run, obtaining 2000 snap shot structures for each initial structure. The solvent molecules were removed from these structures and free energy was calculated by using the GBSA method.
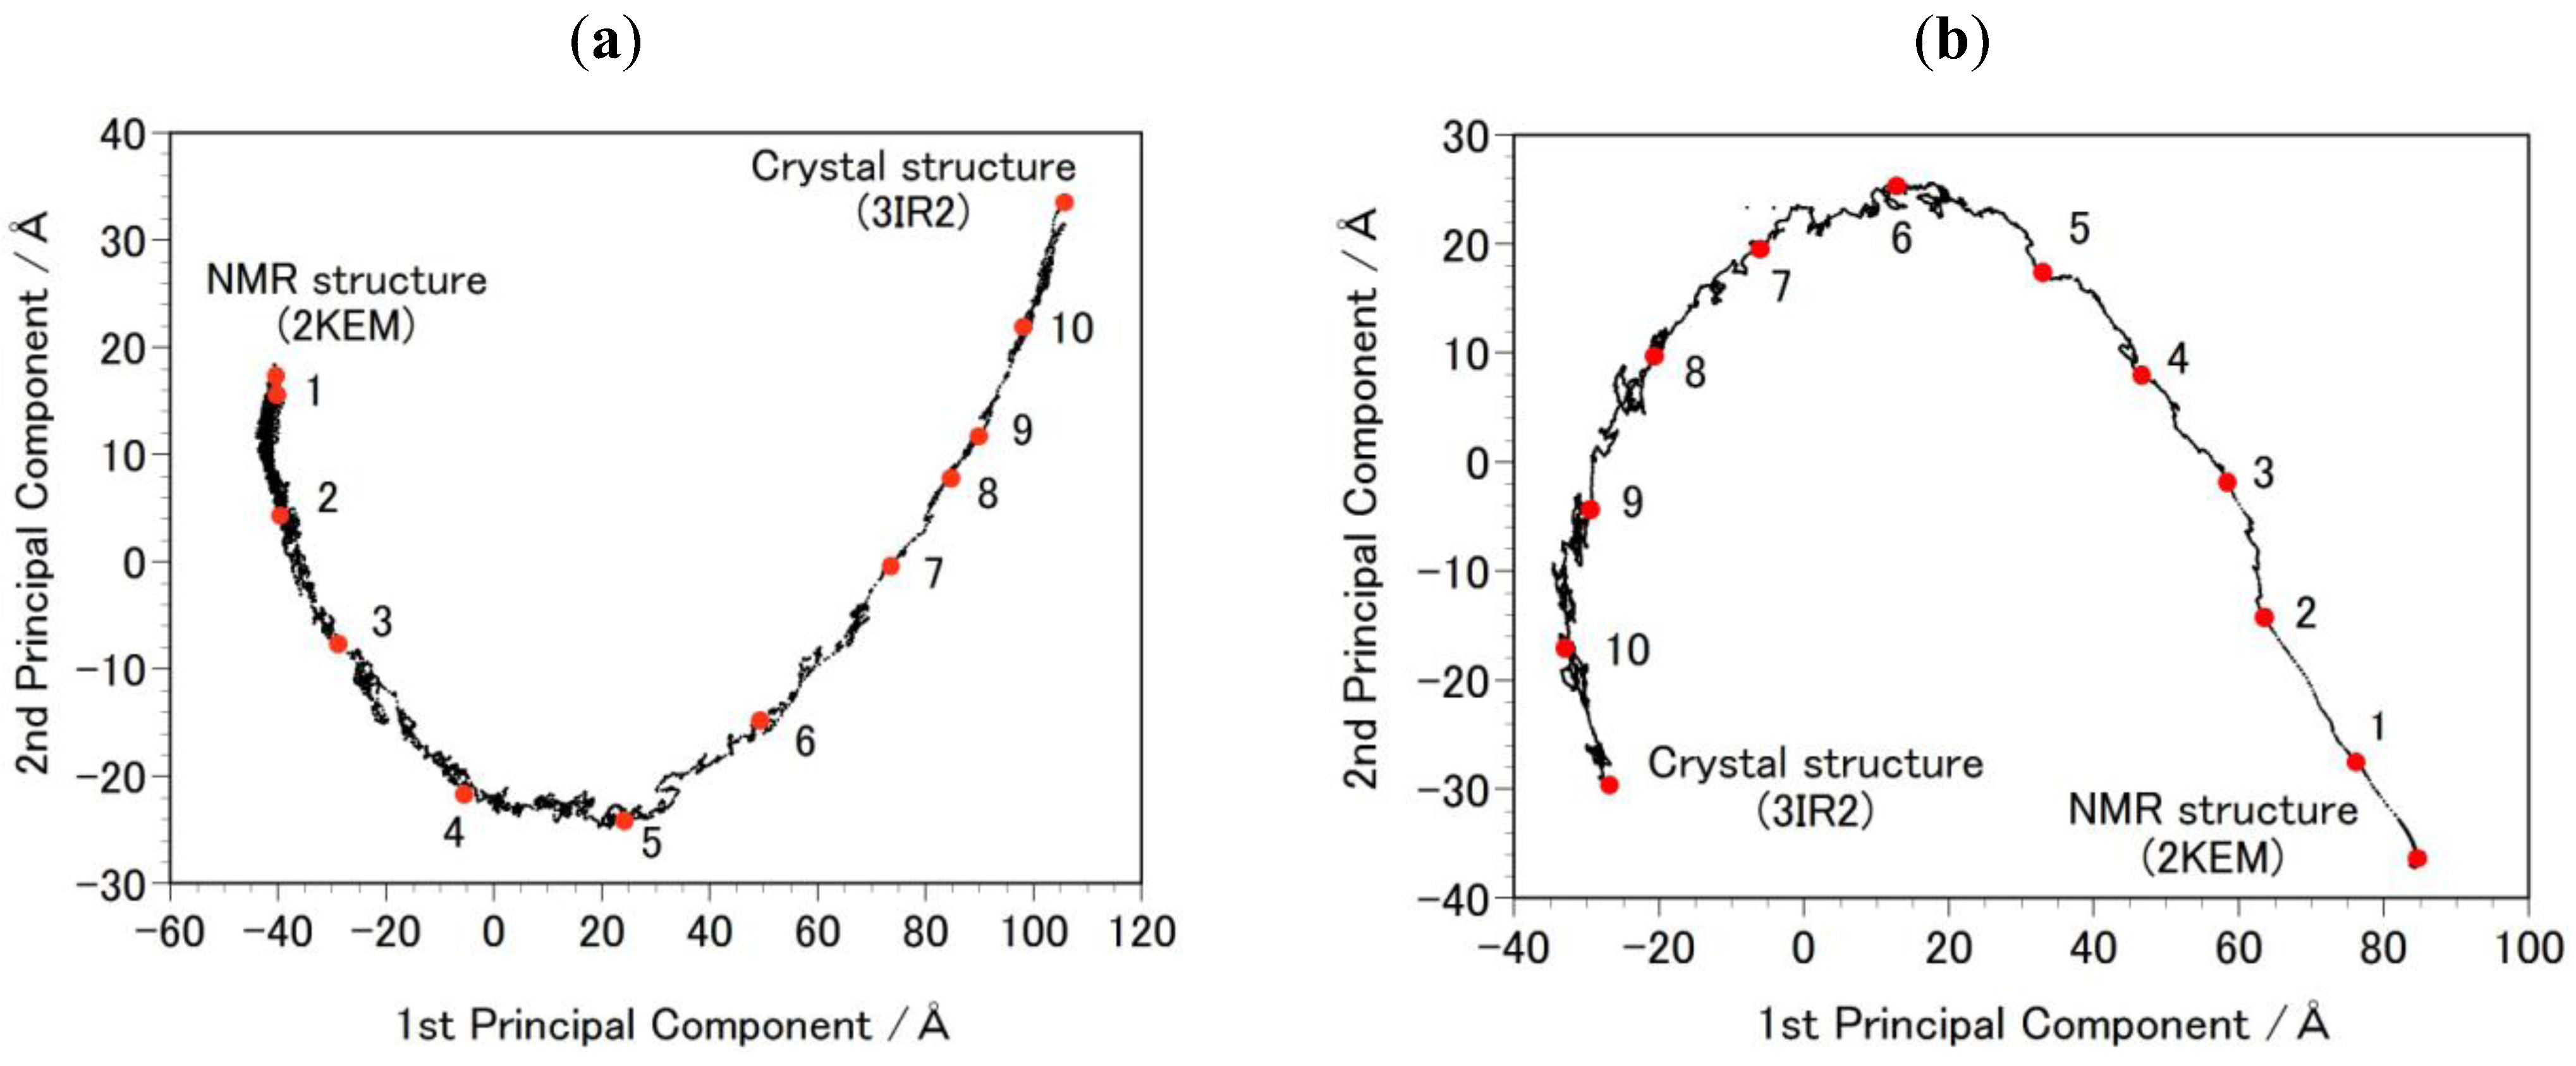
- Step 2b: Targeted MDs were performed to generate a free energy profile from the NMR structure (2KEM) to the crystal structure (3IR2) as well as a free energy profile from the crystal structure to the NMR structure [26]. Computational conditions were the same as that used for the Step 1a, except for an additional force pulling protein main-chain atoms from the initial structure to the final structure. The additional force was parabolic with a force constant of 0.01–0.15 kcal/mol/Å2. The total simulation time was 2 ns and the protein structures were sampled every 5 ps. The sampled structures were analyzed by the Principal Component Analysis (PCA) of the protein atomic coordinates. PCA extracts major structural changes of an ensemble of protein structures. Figure 2 shows PCA of the structures obtained from the targeted MDs. Each dot represents one structure and the averaged structure is set to the origin of the axes. The axis in PCA corresponds to the normal modes of the structural changes. The reaction pathways are continuous and smooth which indicates that there is no significant energy jump during the MD simulation, therefore the target MD has successfully shown a possible path of the structural changes between the NMR and the crystal structures. Ten structures were selected with the same intervals in order to calculate free energies in Step 3b.
- Step 3b: MD simulations of the sampled structures in Step 2b were performed in the solvent water as described in Step 1a. After the energy minimization and the equilibration run described in step1a, the NVT production run (1 ns) at 300 K was performed. To keep the protein structure, the position restraint was applied to the main-chain atoms with a force constant of 0.01 kcal/(mol Å2). The SHAKE algorithm was applied to the system and the time step was set to 2 fs [35]. Snap shot structures were obtained every 10 ps, which resulted in collecting 1000 snap shot structures for each sampled structure. The solvent molecules were removed from these snap shot structures and the GBSA method was applied to calculate free energy in Step 4b.
2.2. GBSA Calculation
2.3. Newly Developed Method to Calculate Protein Entropy


3. Results and Discussion
3.1. Stability of Structures

| No of MD simulation | MD simulation of the crystal structure | MD simulation of the NMR structure | ||||
|---|---|---|---|---|---|---|
| X-ray vs. X-ray a | X-ray vs. NMR b | No of ligand H2O | NMR vs. NMR b | NMR vs. X-ray a | No of ligand H2O | |
| 1 | 2.22 | 3.36 | 0.43 | 2.21 | 4.02 | 0.30 |
| 2 | 1.63 | 3.75 | 0.32 | 3.75 | 4.13 | 0.33 |
| 3 | 1.93 | 4.31 | 0.34 | 1.86 | 3.87 | 0.23 |
| 4 | 2.11 | 3.91 | 0.49 | 2.47 | 4.41 | 0.42 |
| 5 | 1.70 | 4.07 | 0.46 | 2.62 | 4.56 | 0.46 |
| 6 | 1.72 | 3.96 | 0.27 | 2.76 | 4.52 | 0.44 |
| 7 | 2.38 | 3.41 | 0.46 | 2.76 | 3.90 | 0.42 |
| 8 | 2.27 | 3.56 | 0.29 | 2.29 | 4.72 | 0.28 |
| 9 | 1.88 | 4.10 | 0.57 | 3.27 | 3.84 | 0.33 |
| 10 | 1.97 | 3.80 | 0.58 | 2.59 | 4.00 | 0.28 |
| Average | 1.98 | 3.82 | 0.42 | 2.66 | 4.20 | 0.35 |
| No of MD simulation | MD simulation of the crystal structure | MD simulation of the NMR structure | ||||
|---|---|---|---|---|---|---|
| X-ray vs. X-ray a | X-ray vs. NMR b | No of ligand H2O | NMR vs. NMR b | NMR vs. X-ray a | No of ligand H2O | |
| 1 | 1.85 | 3.59 | 0.43 | 2.21 | 4.02 | 0.30 |
| 2 | 1.96 | 4.09 | 0.32 | 3.75 | 4.13 | 0.52 |
| 3 | 2.23 | 4.29 | 0.34 | 1.86 | 3.87 | 0.22 |
| 4 | 2.13 | 4.34 | 0.50 | 2.28 | 4.05 | 0.49 |
| 5 | 1.80 | 3.85 | 0.46 | 2.62 | 4.56 | 0.25 |
| 6 | 2.48 | 3.78 | 0.27 | 2.76 | 4.52 | 0.33 |
| 7 | 2.77 | 3.64 | 0.46 | 2.76 | 3.90 | 0.32 |
| 8 | 1.82 | 3.82 | 0.30 | 2.29 | 4.72 | 0.31 |
| 9 | 1.58 | 4.13 | 0.57 | 3.27 | 3.84 | 0.32 |
| 10 | 1.82 | 4.18 | 0.58 | 2.59 | 4.00 | 0.31 |
| Average | 2.04 | 3.97 | 0.43 | 2.64 | 4.16 | 0.34 |
| Arginines | NMR vs. NMR a | NMR vs. X-ray b | X-ray vs. X-ray c | X-ray vs. NMR d |
|---|---|---|---|---|
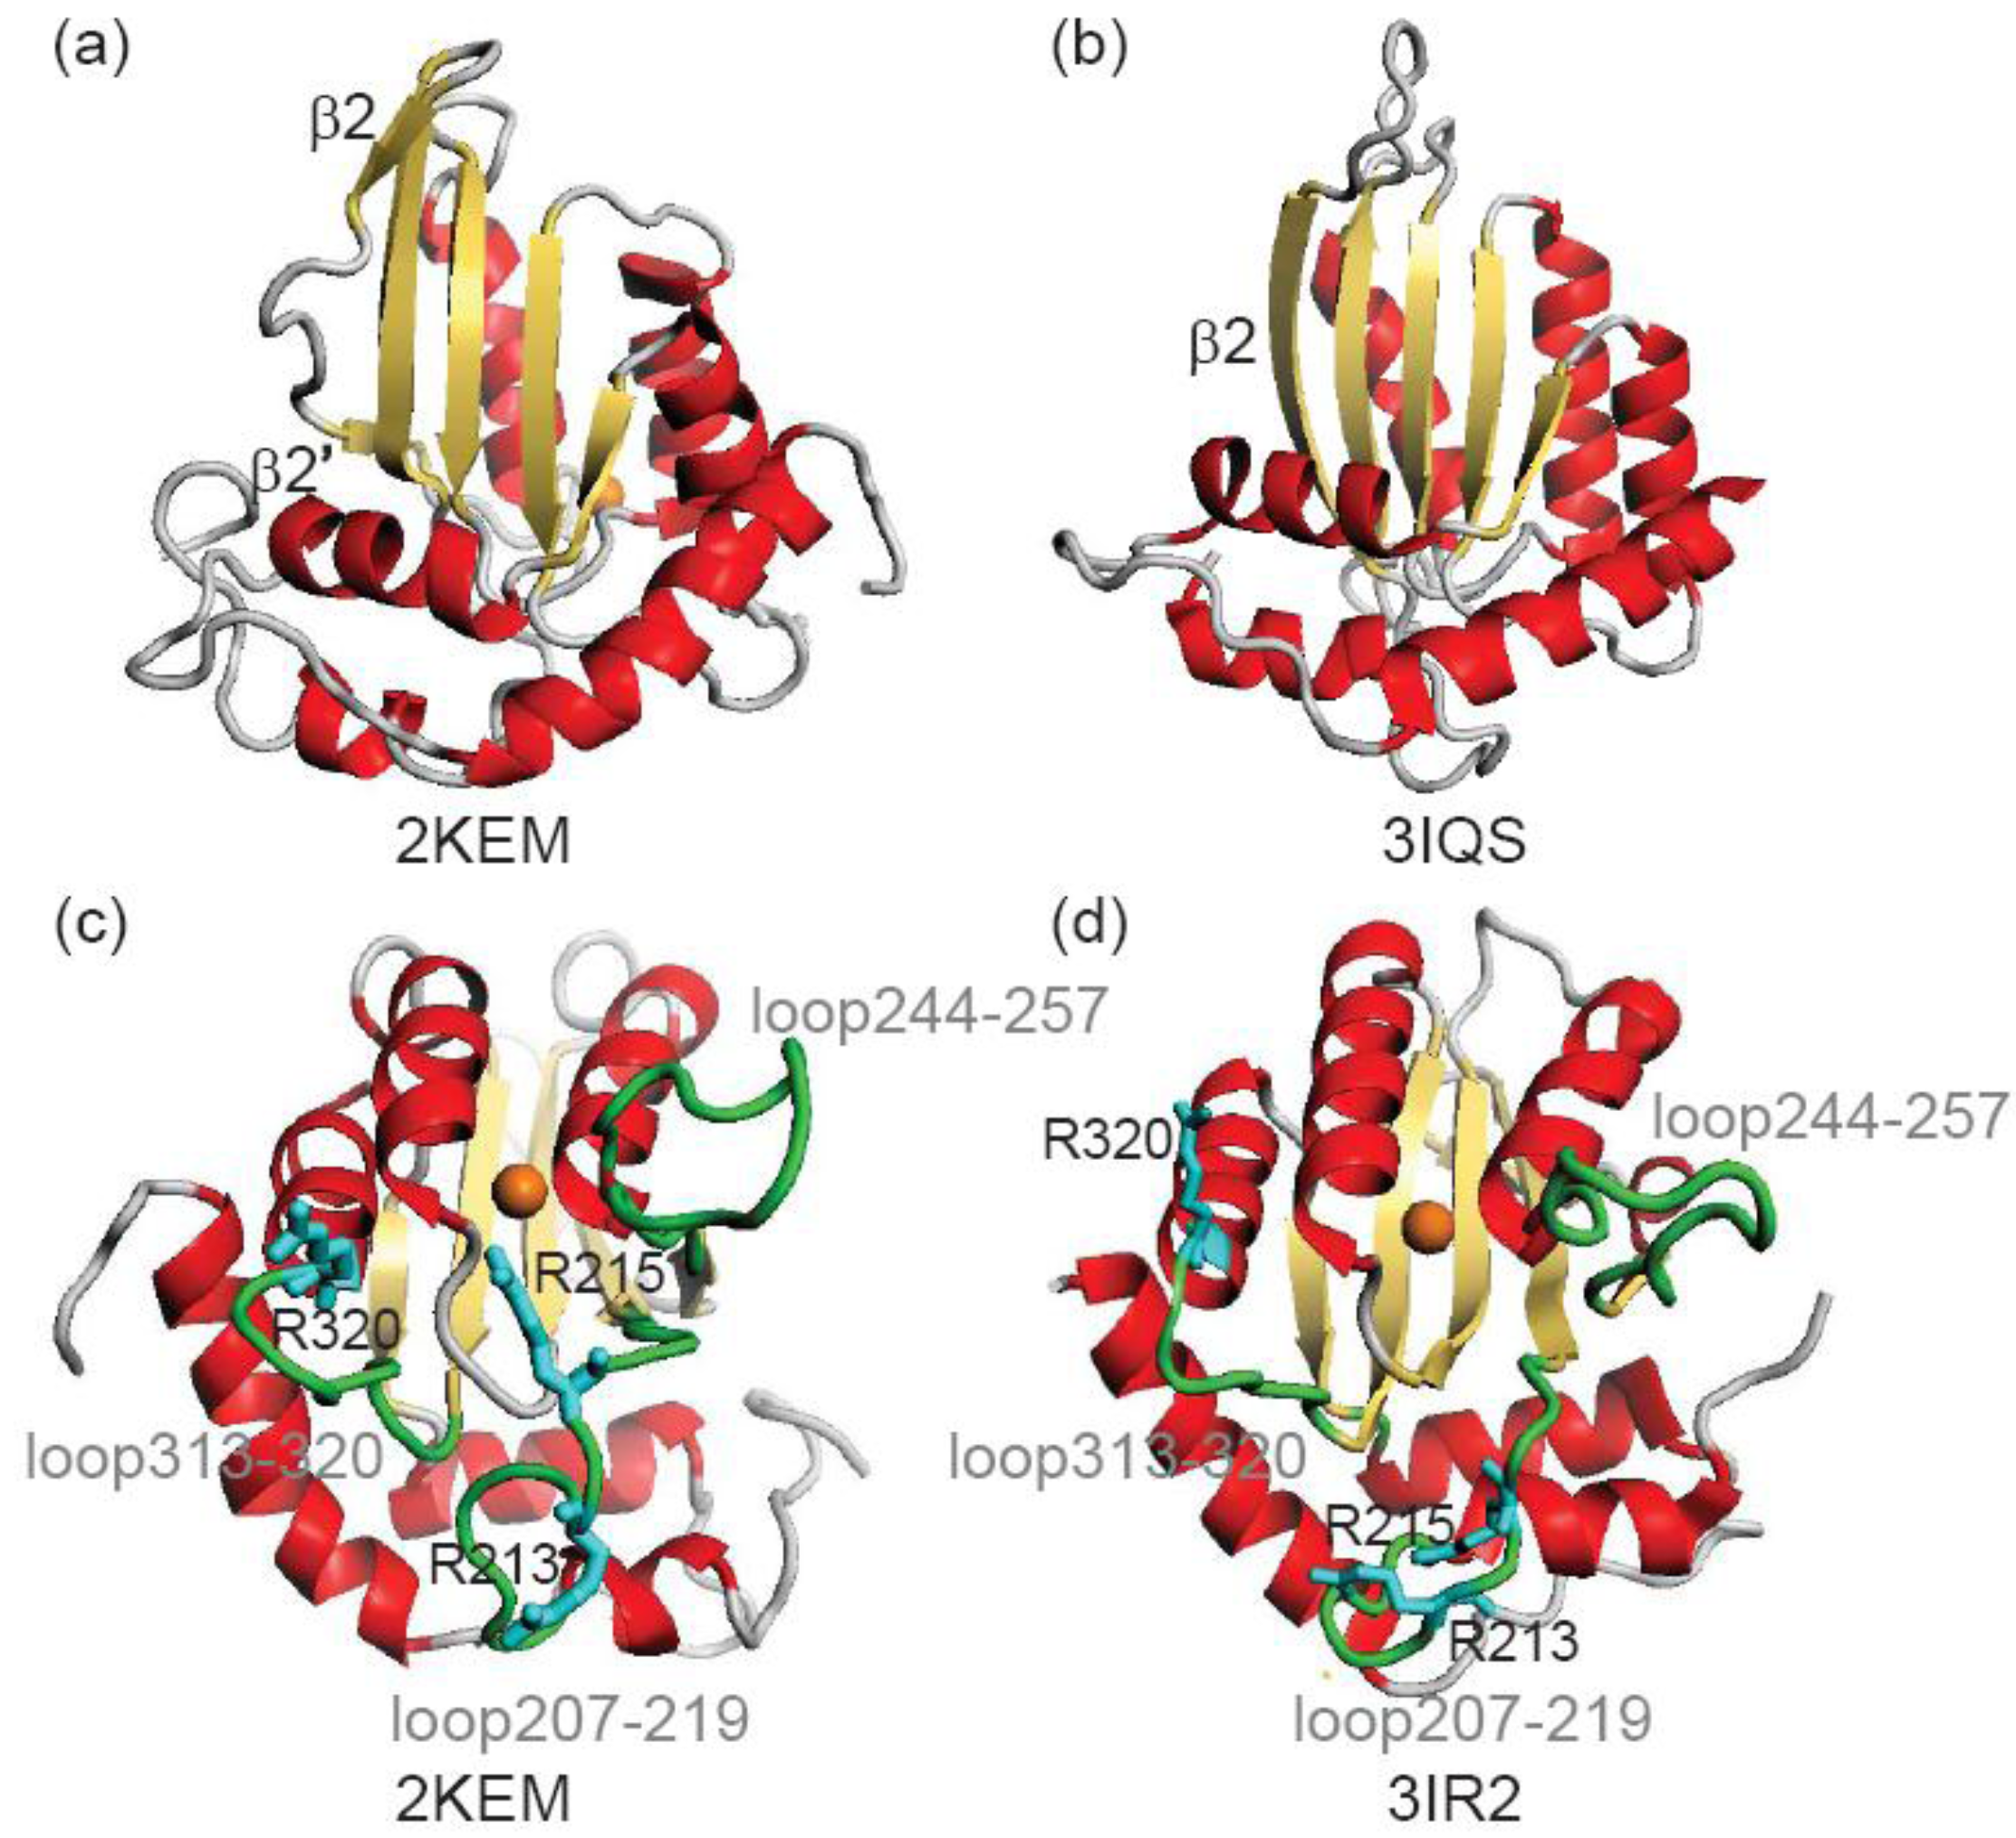
| Arg213 | 3.95 | 8.20 | 3.38 | 8.42 |
| Arg215 | 4.24 | 8.64 | 2.60 | 8.35 |
| Arg320 | 2.29 | 2.24 | 1.53 | 1.95 |
3.2. Free Energy Differences between the NMR and Crystal Structure
| No of MD simulation | Crystal structure 3IR2 | NMR structure 2KEM | ||||
|---|---|---|---|---|---|---|
| G2 | TS | G1 | G2 | TS | G1 | |
| 1 | −6043.13 | −6702.60 | −12745.74 | −5884.37 | −7027.53 | −12911.90 |
| 2 | −6036.39 | −6736.90 | −12773.30 | −5944.13 | −7121.26 | −13065.39 |
| 3 | −6044.5 | −6847.83 | −12892.33 | −5923.86 | −6868.51 | −12792.37 |
| 4 | −6047.56 | −6750.79 | −12798.36 | −5939.21 | −7080.32 | −13019.53 |
| 5 | −6024.11 | −6719.73 | −12743.84 | −5936.12 | −6916.54 | −12852.66 |
| 6 | −6065.13 | −6664.80 | −12729.94 | −5895.72 | −6944.52 | −12840.24 |
| 7 | −6034.97 | −6781.37 | −12816.35 | −5935.67 | −6947.93 | −12883.60 |
| 8 | −6040.02 | −6734.99 | −12775.01 | −5915.02 | −6966.65 | −12881.67 |
| 9 | −6026.65 | −6828.27 | −12854.92 | −5941.27 | −6922.34 | −12863.61 |
| 10 | −6036.85 | −6849.60 | −12886.46 | −5900.79 | −6926.11 | −12826.90 |
| Average | −6039.93 | −6761.69 | −12801.62 | −5921.62 | −6972.17 | −12893.79 |
| σ | 10.94 | 60.04 | 56.22 | 20.37 | 75.38 | 81.28 |
3.3. Reaction Mechanism
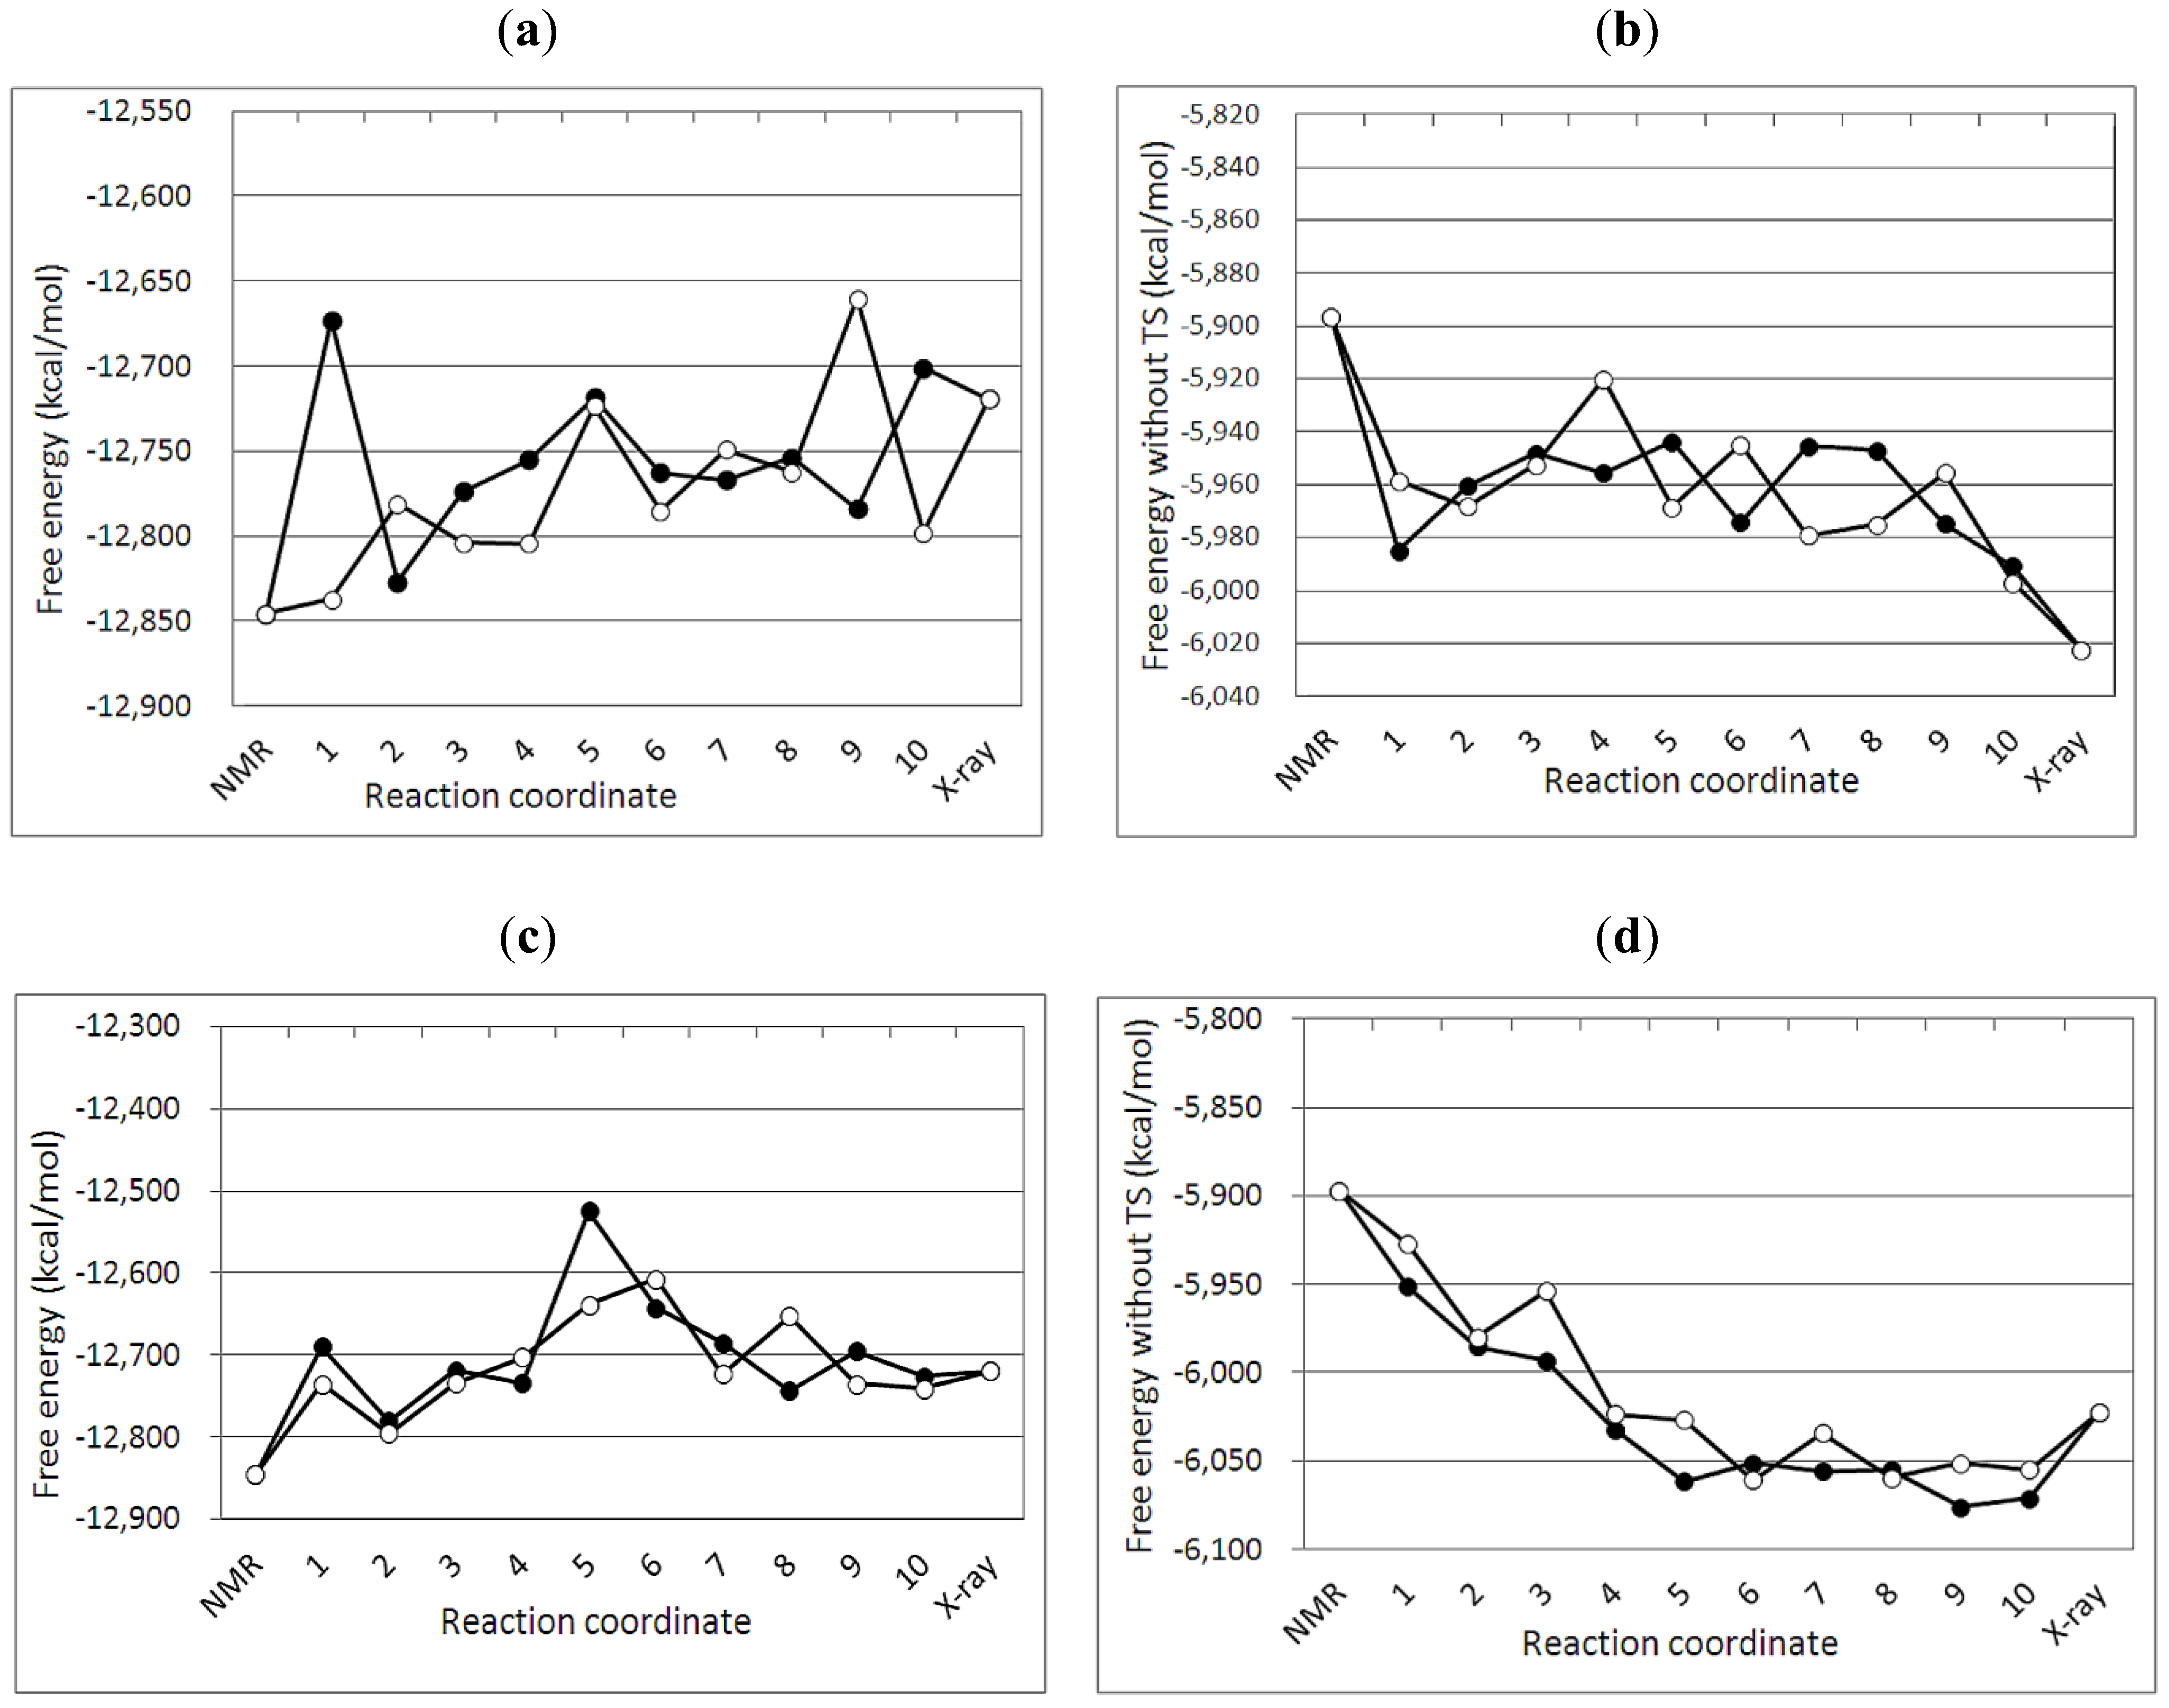
3.4. Free Energy Profile between the NMR and Crystal Structures
4. Conclusions
Acknowledgments
References
- Chiu, Y.L.; Greene, W.C. The APOBEC3 cytidine deaminases: An innate defensive network opposing exogenous retroviruses and endogenous retroelements. Annu. Rev. Immunol. 2008, 26, 317–353. [Google Scholar] [CrossRef]
- Goila-Gaur, R.; Strebel, K. HIV-1 Vif, APOBEC, and intrinsic immunity. Retrovirology 2008, 5, 51. [Google Scholar] [CrossRef]
- Malim, M.H.; Emerman, M. HIV-1 accessory proteins—Ensuring viral survival in a hostile environment. Cell Host Microbe 2008, 3, 388–398. [Google Scholar] [CrossRef]
- Sheehy, A.M.; Gaddis, N.C.; Choim, J.D.; Malim, M.H. Isolation of a human gene that inhibits HIV-1 infection and is suppressed by the viral Vif protein. Nature 2002, 418, 646–650. [Google Scholar] [CrossRef]
- Lecossier, D.; Bouchonnet, F.; Clavel, F.; Hance, A.J. Hypermutation of HIV-1 DNA in the absence of the Vif protein. Science 2003, 300, 1112–1112. [Google Scholar] [CrossRef]
- Harris, R.S.; Bishop, K.N.; Sheehy, A.M.; Craig, H.M.; Petersen-Mahrt, S.K.; Watt, I.N.; Neuberger, M.S.; Malim, M.H. DNA deamination mediates innate immunity to retroviral infection. Cell 2003, 113, 803–809. [Google Scholar] [CrossRef]
- Mangeat, B.; Turelli, P.; Caron, G.; Friedli, M.; Perrin, L.; Trono, D. Broad antiretroviral defence by human APOBEC3G through lethal editing of nascent reverse transcripts. Nature 2003, 424, 99–103. [Google Scholar] [CrossRef]
- Betts, L.; Xiang, S.; Short, S.A.; Wolfenden, R.; Carter, C.W., Jr. Cytidine deaminase. The 2.3 angstrom crystal structure of an enzyme: Transition-state analog complex. J. Mol. Biol. 1994, 235, 635–656. [Google Scholar] [CrossRef]
- Carter, C.W., Jr. The nucleoside deaminases for cytidine and adenosine: Structure, transition state stabilization, mechanism, and evolution. Biochimie 1995, 77, 92–98. [Google Scholar] [CrossRef]
- Xiang, S.; Short, S.A.; Wolfenden, R.; Carter, C.W., Jr. Transition-state selectivity for a single hydroxyl group during catalysis by cytidine deaminase. Biochemistry 1995, 34, 4516–4523. [Google Scholar]
- Chen, K.M.; Harjes, E.; Gross, P.J.; Fahmy, A.; Lu, Y.; Shindo, K.; Harris, R.S.; Matsuo, H. Structure of the DNA deaminase domain of the HIV-1 restriction factor APOBEC3G. Nature 2008, 452, 116–119. [Google Scholar] [CrossRef]
- Furukawa, A.; Nagata, T.; Matsugami, A.; Habu, Y.; Sugiyama, R.; Hayashi, F.; Kobayashi, N.; Yokoyama, S.; Takaku, H.; Katahira, M. Structure, interaction and real-time monitoring of the enzymatic reaction of wild-type APOBEC3G. EMBO J. 2009, 28, 440–451. [Google Scholar] [CrossRef]
- Harjes, E.; Gross, P.J.; Chen, K.M.; Lu, Y.; Shindo, K.; Nowarski, R.; Gross, J.D.; Kotler, M.; Harris, R.S.; Matsuo, H. An extended structure of the APOBEC3G catalytic domain suggests a unique holoenzyme model. J. Mol. Biol. 2009, 389, 819–832. [Google Scholar] [CrossRef]
- Shandilya, S.M.; Nalam, M.N.; Nalivaika, E.A.; Gross, P.J.; Valesano, J.C.; Shindo, K.; Li, M.; Munson, M.; Royer, W.E.; Harjes, E.; Kono, T.; Matsuo, H.; Harris, R.S.; Somasundaran, M.; Schiffer, C.A. Crystal structure of the APOBEC3G catalytic domain reveals potential oligomerization interfaces. Structure 2010, 18, 28–38. [Google Scholar] [CrossRef]
- Holden, L.G.; Prochnow, C.; Chang, Y.P.; Bransteitter, R.; Chelico, L.; Sen, U.; Stevens, R.C.; Goodman, M.F.; Chen, X.S. Crystal structure of the anti-viral APOBEC3G catalytic domain and functional implications. Nature 2008, 456, 121–124. [Google Scholar]
- Prochnow, C.; Bransteitter, R.; Klein, M.G.; Goodman, M.F.; Chen, X.S. The APOBEC-2 crystal structure and functional implications for the deamizase AID. Nature 2007, 445, 447–451. [Google Scholar]
- Autore, F.; Bergeron, J.R.C.; Malim, M.H.; Fraternali, F.; Huthoff, H. Rationalisation of the Differences between APOBEC3G Structures from Crystallography and NMR Studies by Molecular Dynamics Simulations. PLoS One 2010, 5, e11515. [Google Scholar]
- Still, W.C.; Tempczyk, A.; Hawley, R.C.; Hendrickson, T. Semianalytical treatment of solvation for molecular mechanics and dynamics. J. Am. Chem. Soc. 1990, 112, 6127–6130. [Google Scholar] [CrossRef]
- Schaefer, M.; Karplus, M.A. Comprehensive Analytical treatment of continuum electrostatics. J. Phys. Chem. 1996, 100, 1578–1599. [Google Scholar] [CrossRef]
- Onufriev, A.; Bashford, D.; Case, D.A. modification of the generalized born model suitable for macromolecules. J. Phys. Chem. B 2000, 104, 3712–3720. [Google Scholar]
- Cramer, J.C.; Truhlar, G.D. General parameterized SCF model for free energies of solvation in aqueous solution. J. Am. Chem. Soc. 1991, 113, 8305–8311. [Google Scholar] [CrossRef]
- Hawkins, D.G.; Cramer, J.C.; Truhlar, G.D. Pairwise solute descreening of solute charges from a dielectric medium. Chem. Phys. Lett. 1995, 246, 122–129. [Google Scholar] [CrossRef]
- Hawkins, D.G.; Cramer, J.C.; Truhlar, G.D. Parametrized models of aqueous free energies of solvation based on pairwise descreening of solute atomic charges from a dielectric medium. J. Phys. Chem. 1996, 100, 19824–19839. [Google Scholar]
- Watanabe, Y.S.; Fukunishi, Y.; Nakamura, H. Generation of a flexible loop structural ensemble and its application to induced-fit structural changes following ligand binding. Biophysics 2006, 2, 1–12. [Google Scholar] [CrossRef]
- Watanabe, Y.S.; Kim, J.G.; Fukunishi, Y.; Nakamura, H. Free energy landscapes of small peptides in an implicit solvent model determined by force-biased multicanonical molecular dynamics simulation. Chem. Phys. Lett. 2004, 400, 258–263. [Google Scholar] [CrossRef]
- Engels, M.; Krüger, P.; Jacoby, E.; Wollmer, A. Targetted molecular dynamics simulation of conformational change—Application to the T ↔ R transition in insulin. Mol. Simulat. 1993, 10, 291–308. [Google Scholar] [CrossRef]
- Standley, D.M.; Toh, H.; Nakamura, H. ASH structure alignmentpackage: Sensitivity and selectivity in domain classification. BMCBioinformatics 2007, 4, 116. [Google Scholar]
- Standley, D.M.; Toh, H.; Nakamura, H. GASH: an improved algorithm formazimizing the number of equivalent residues between two protein structures. BMCBioinformatics 2005, 6, 221. [Google Scholar]
- Fujitani, H.; Matsuura, A.; Sakai, S.; Sato, H.; Tanida, T. High-level ab initio calculations to improve protein backbone dihedral parameters. J. Chem. Theor. Comput. 2009, 5, 1155–1165. [Google Scholar] [CrossRef]
- Case, D.A.; Darden, T.A.; Cheatham, T.E., III.; Simmerling, C.L.; Wang, J.; Duke, R.E.; Luo, R.; Merz, K.M.; Wang, B.; Pearlman, D.A.; et al. AMBER 8; University of California: San Francisco, CA, USA, 2004. [Google Scholar]
- Jorgensen, W.L.; Chandrasekhar, J.; Madura, J.D.; Impey, R.W.; Klein, M.L. Comparison of simple potential functions for simulating lipid water. J. Chem. Phys. 1983, 79, 926–935. [Google Scholar]
- Rankin, W.T. DPMTA—Distributed Parallel Multipole Tree Algorithm; Duke University: Durham, NC, USA, 2002. [Google Scholar]
- Fukunishi, Y.; Mikami, Y.; Nakamura, H. The filling potential method: A method for estimating the free energy surface for protein-ligand docking. J. Phys. Chem. B 2003, 107, 13201–13210. [Google Scholar] [CrossRef]
- myPresto, version 4.207; Osaka University: Suita, Osaka, Japan. Available online: http://presto.protein.osaka-u.ac.jp/myPresto4/index_e.html (accessed on 7 July 2012).
- Ryckaert, J.P.; Ciccotti, G.; Berendsen, H.J.C. Numerical integration of the cartesian equations of motion of a system with constraints: Molecular dynamics of n-alkanes. J. Comp. Phys. 1997, 23, 327–341. [Google Scholar]
- Richmond, T.J. Solvent accessible surface area and excluded volume in proteins. Analytical equations for overlapping spheres and implications for the hydrophobic effect. J. Mol. Biol. 1984, 178, 63–89. [Google Scholar] [CrossRef]
- Iwatani, Y.; Takeuchi, H.; Strebel, K.; Levin, J.G. Biochemical acivities of highly purified, catalytically active human APOBEC3G: Correlation with antiviral effect. J. Virol. 2006, 80, 5992–6002. [Google Scholar] [CrossRef]
- Krzysiak, T.C.; Jung, J.; Thompson, J.; Baker, D.; Gronenborn, A.M. APOBEC2 is a monomer in solution: implications for APOBEC3G models. Biochemistry 2012, 51, 2008–2017. [Google Scholar]
© 2012 by the authors; licensee MDPI, Basel, Switzerland. This article is an open access article distributed under the terms and conditions of the Creative Commons Attribution license (http://creativecommons.org/licenses/by/3.0/).
Share and Cite
Fukunishi, Y.; Hongo, S.; Lintuluoto, M.; Matsuo, H. Free Energy Profile of APOBEC3G Protein Calculated by a Molecular Dynamics Simulation. Biology 2012, 1, 245-259. https://doi.org/10.3390/biology1020245
Fukunishi Y, Hongo S, Lintuluoto M, Matsuo H. Free Energy Profile of APOBEC3G Protein Calculated by a Molecular Dynamics Simulation. Biology. 2012; 1(2):245-259. https://doi.org/10.3390/biology1020245
Chicago/Turabian StyleFukunishi, Yoshifumi, Saki Hongo, Masami Lintuluoto, and Hiroshi Matsuo. 2012. "Free Energy Profile of APOBEC3G Protein Calculated by a Molecular Dynamics Simulation" Biology 1, no. 2: 245-259. https://doi.org/10.3390/biology1020245