Vulnerability to Climate Change of Mangroves: Assessment from Cameroon, Central Africa

Abstract
:
1. Introduction
2. Mangrove Vulnerability to Climate Change
3. Environmental Setting

4. Material and Methods

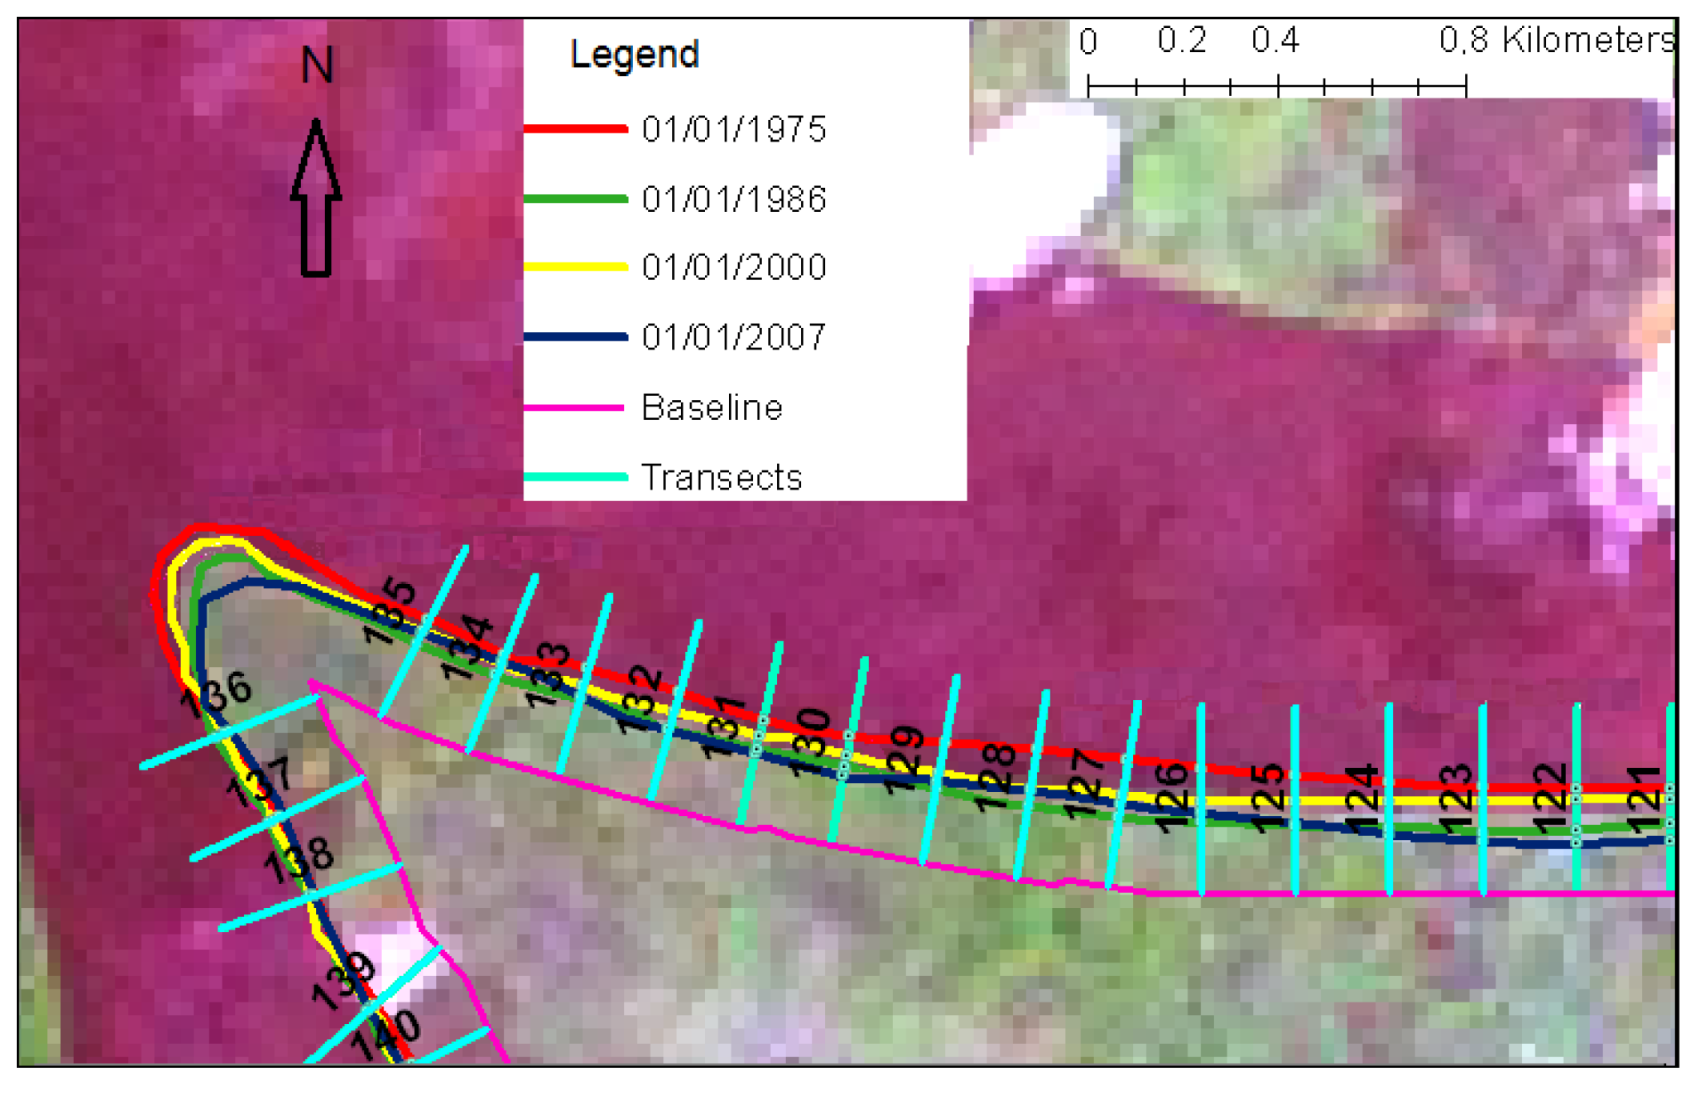
| Available image date | Image | Time interval (years) | Cumulative time relative to base (years) | Clear status |
|---|---|---|---|---|
| 1975 | Landsat MSS | base | base | Very clear |
| 1986 | LandsatTM | 11 | 11 | clear |
| 2000 | LandsatETM | 14 | 25 | Partially clouded |
| 2007 | LandsatETM+ | 7 | 32 | Clear but with gaps due to sensor’s scan line corrector mechanism failure |
| 2010 | 3 | 35 | Ground truthing |
5. Results
| Year | 1975 | 1986 | 2000 | 2007 |
|---|---|---|---|---|
| Mangroves | 18,258 | 17,190 | 17,580 | 17,279 |
| Settlements | 176 | 176 | 182 | 183 |
| Agriculture | 592 | 583 | 583 | 583 |
| Mudflat/sand | 613 | 308 | 303 | 265 |
| Lowland Forest | 21,662 | 20,504 | 21,927 | 22,183 |

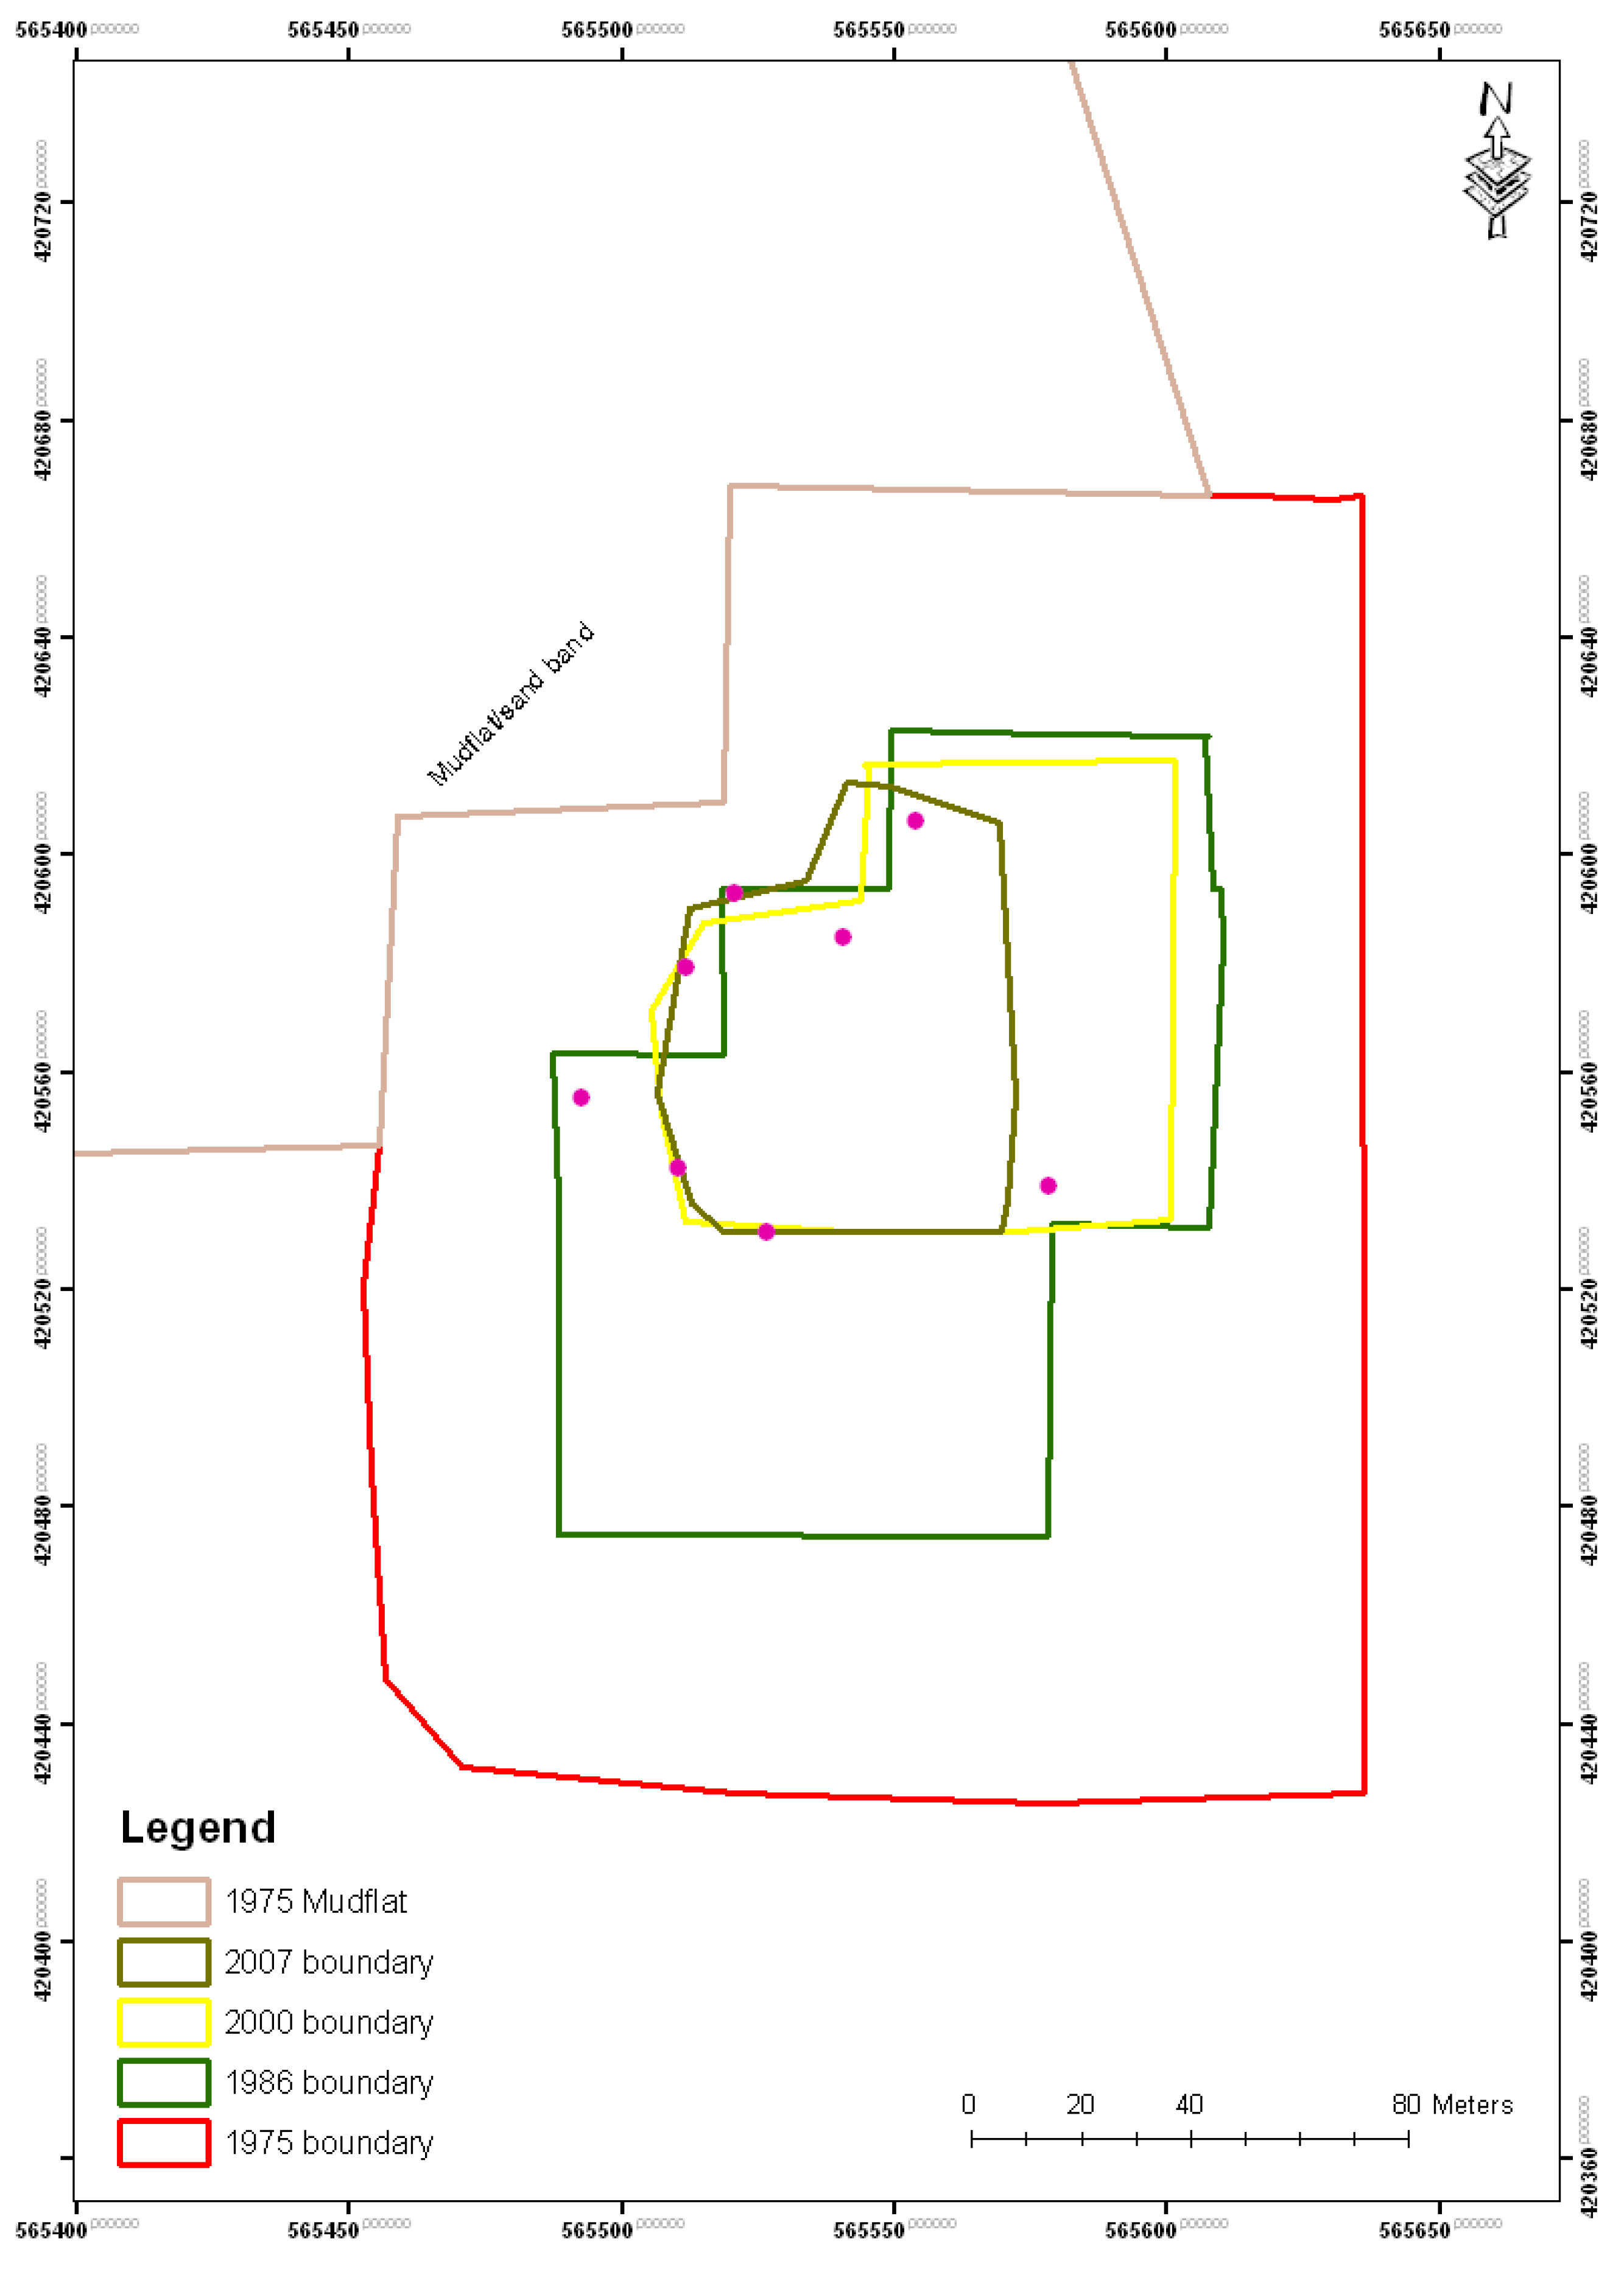
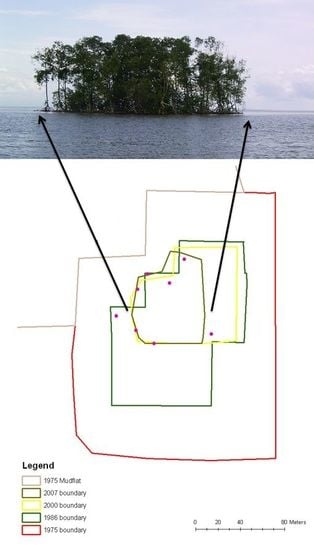
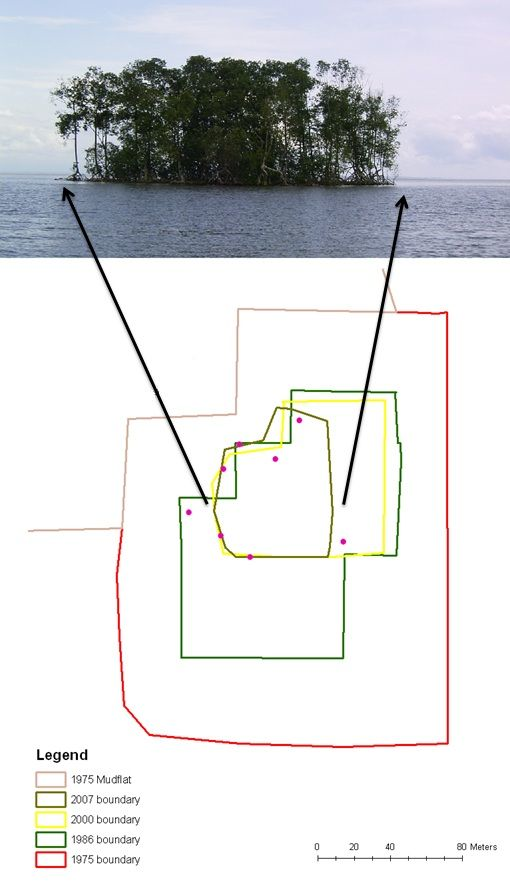
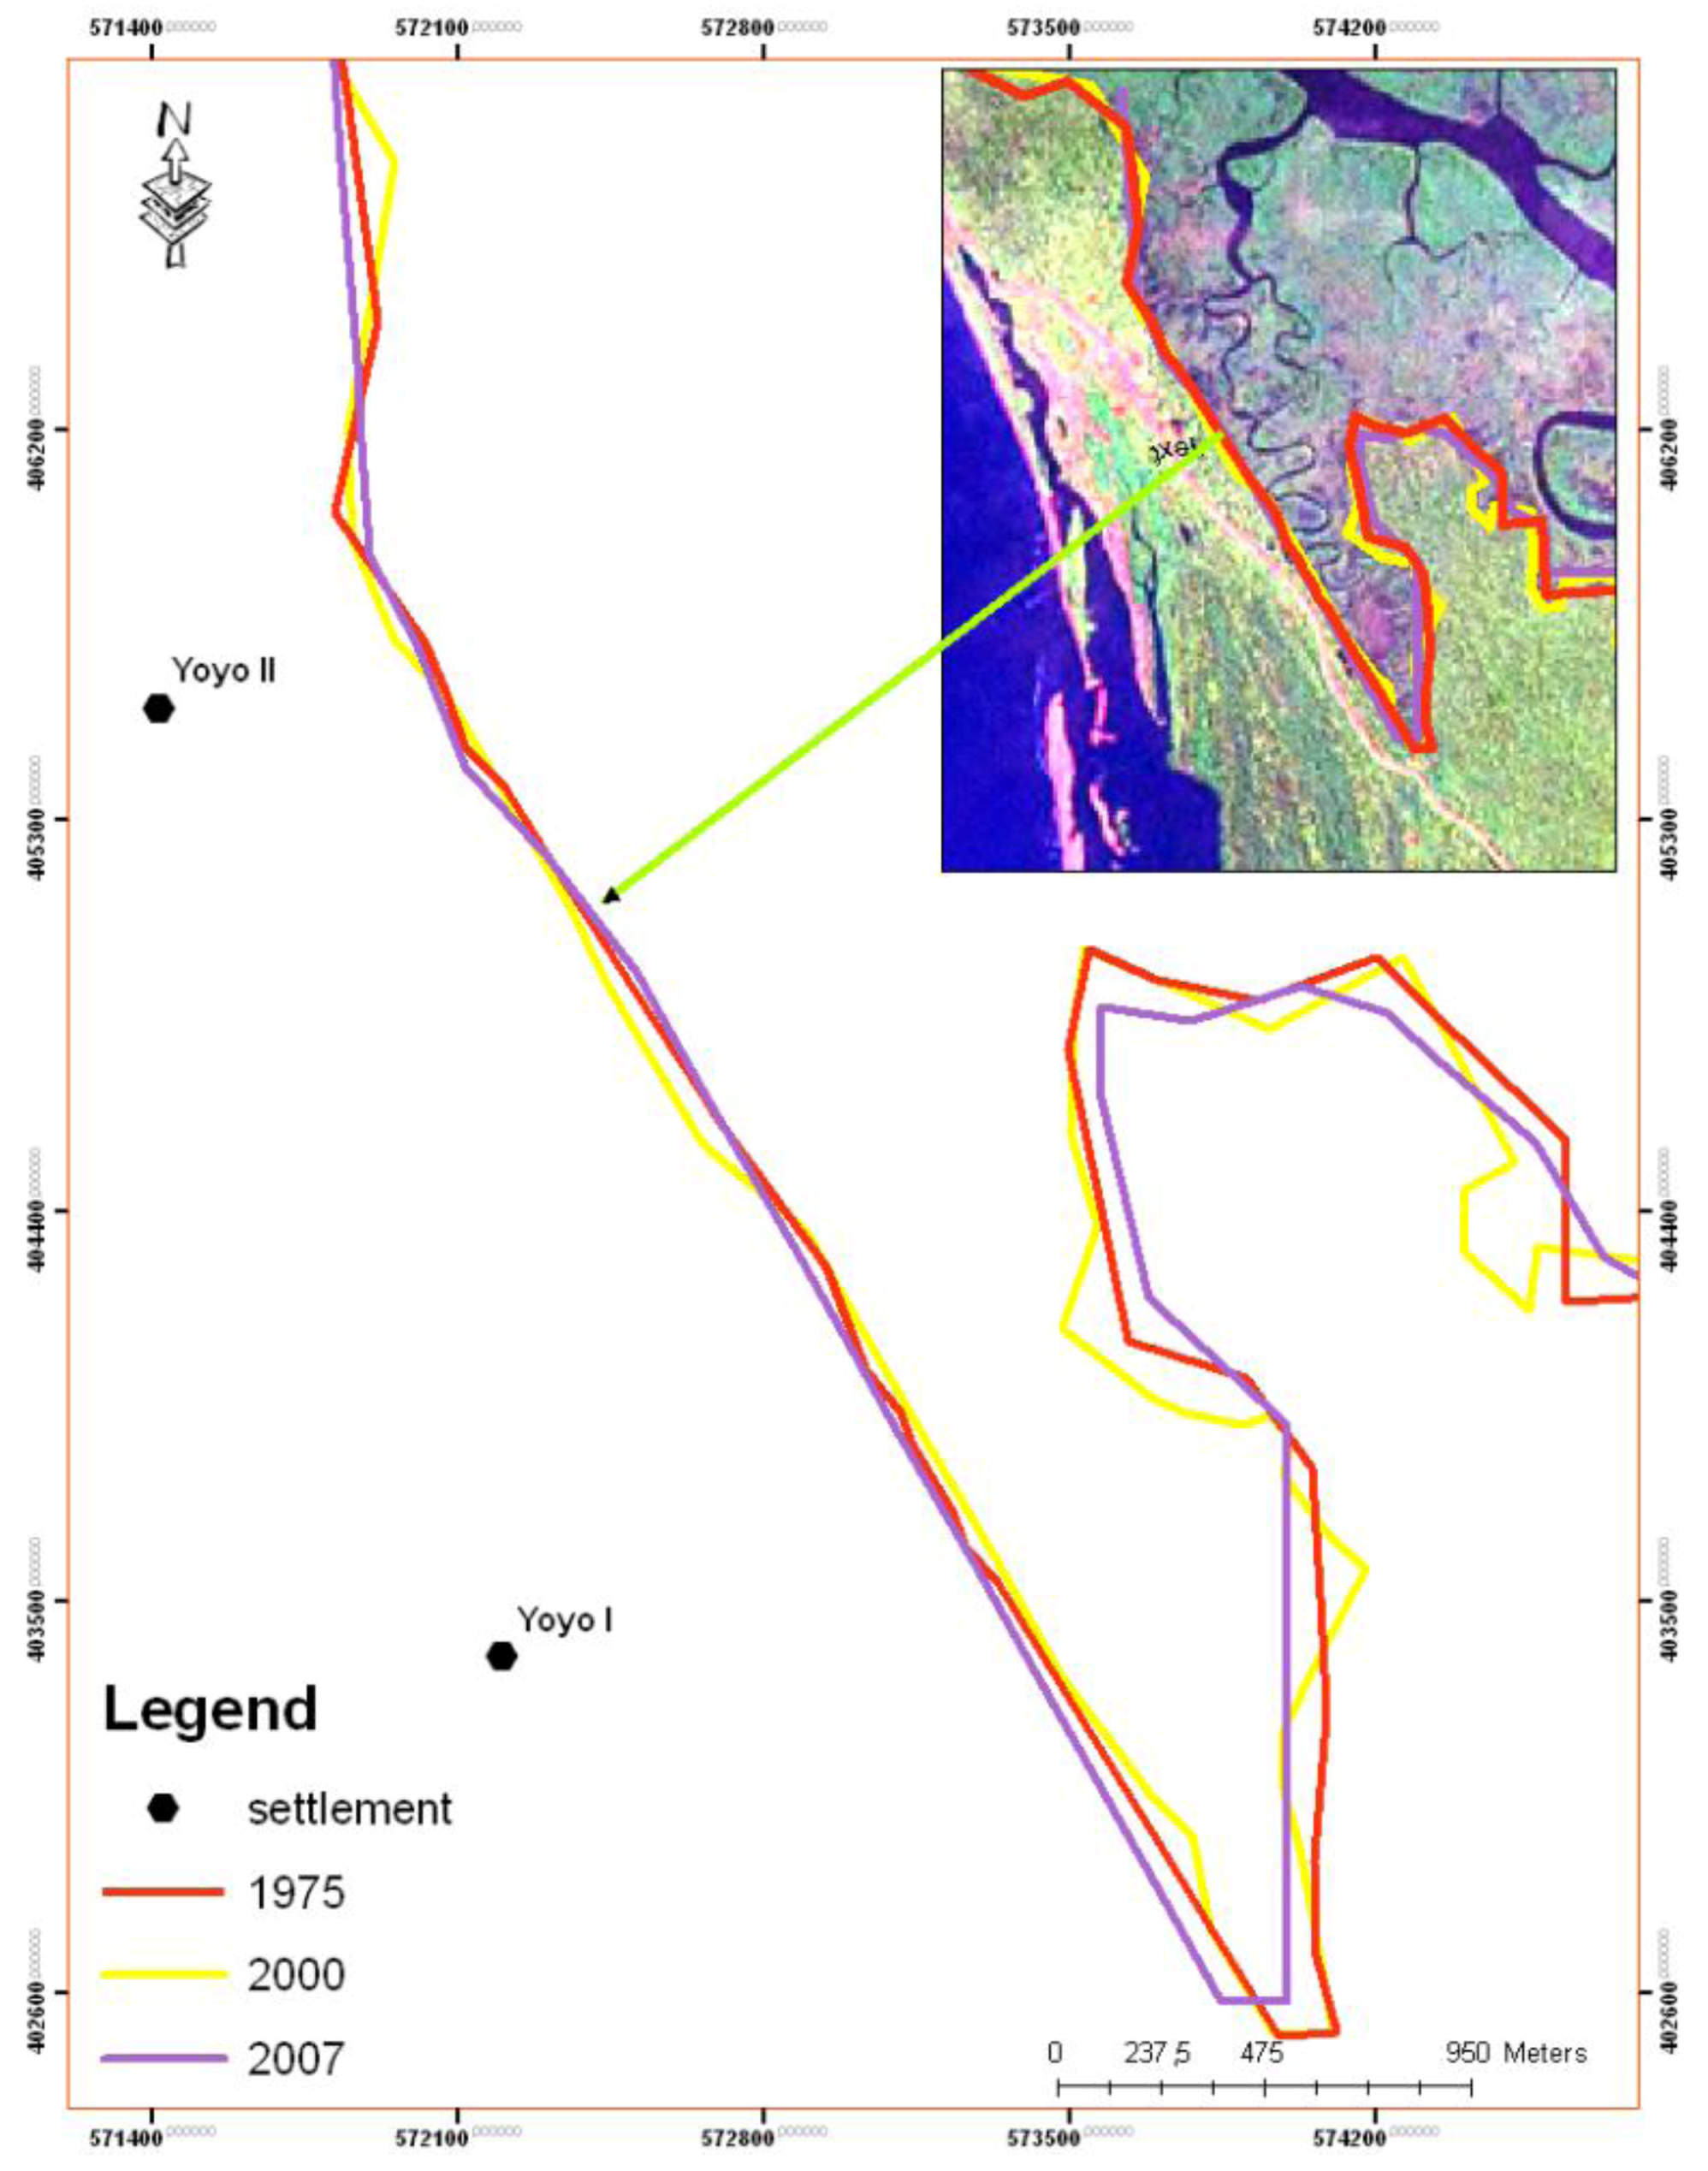
| Year | Island area (m2) |
|---|---|
| 1975 | 39,200 |
| 1986 | 17,300 |
| 2000 | 6,900 |
| 2007 | 4,400 |
| 2010 | 4,300 |

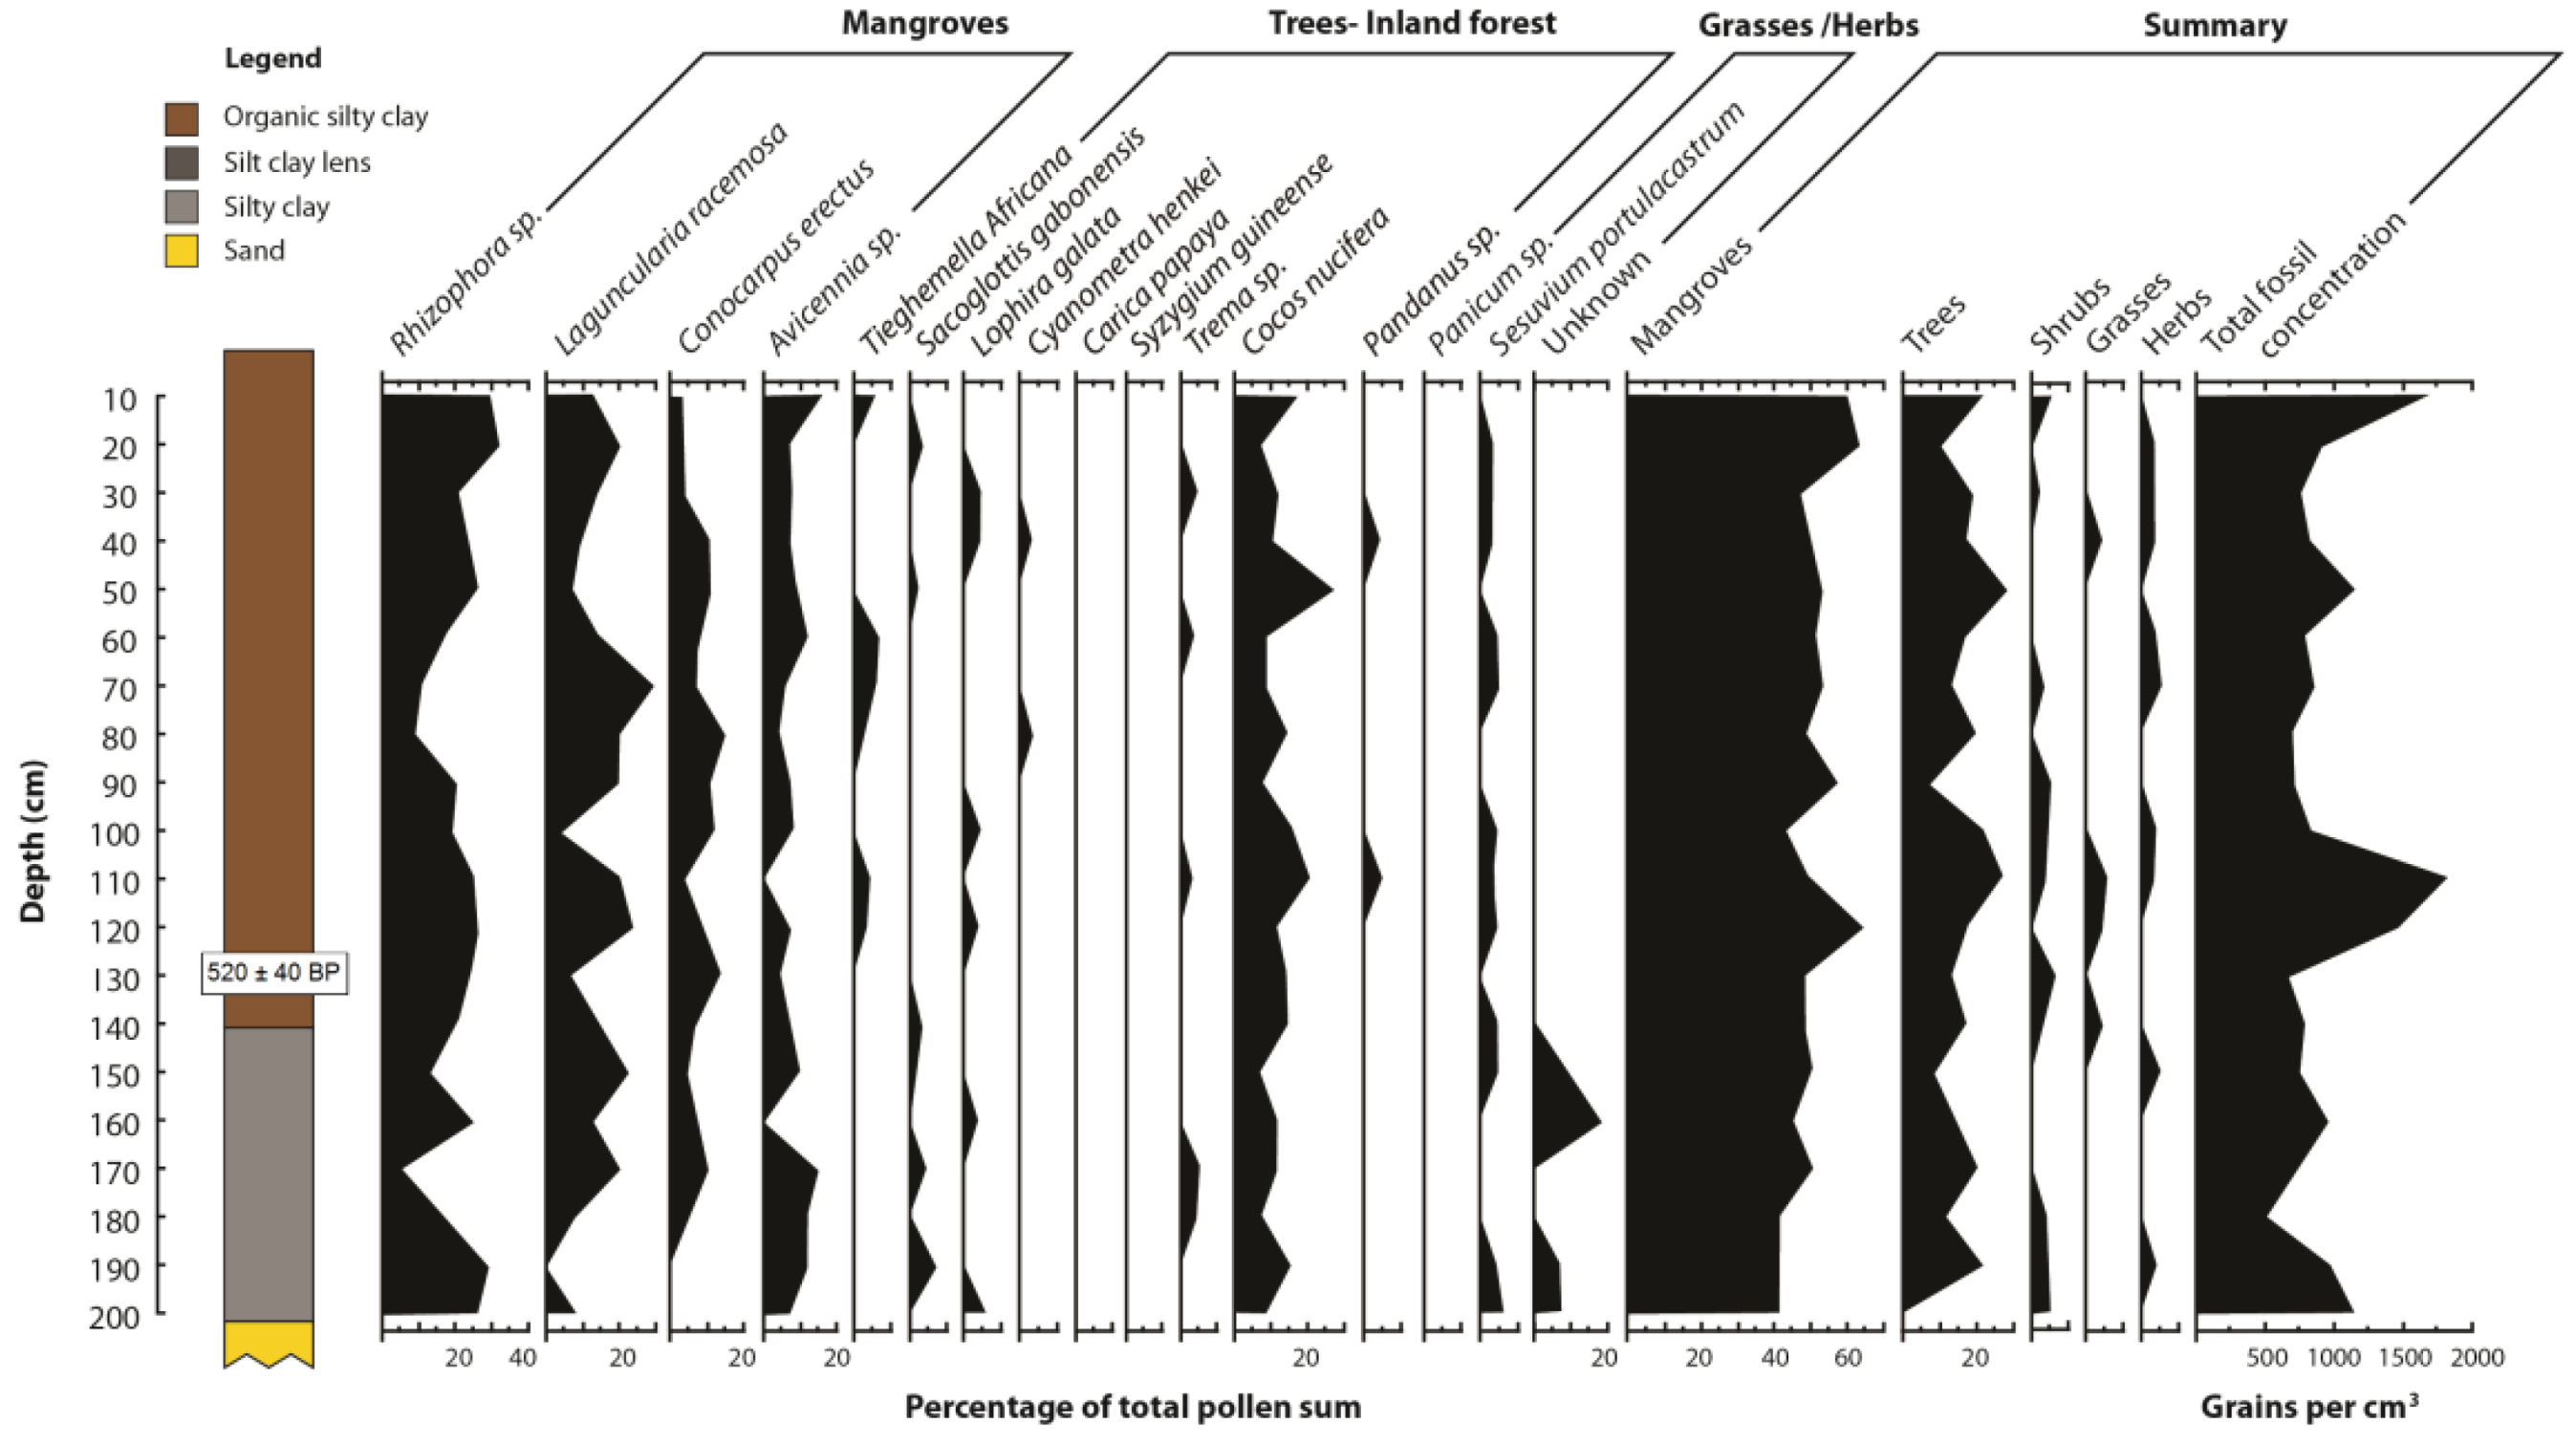
| Sample | Depth (mm) | δ13C | 14C age (year BP) | Calibrated years before present | Sedimentation rate (mm a −1) |
|---|---|---|---|---|---|
| Beta-261195 | 1,300 | −26.4 | 540 ±40 | 520 ± 40 | 2.5 |
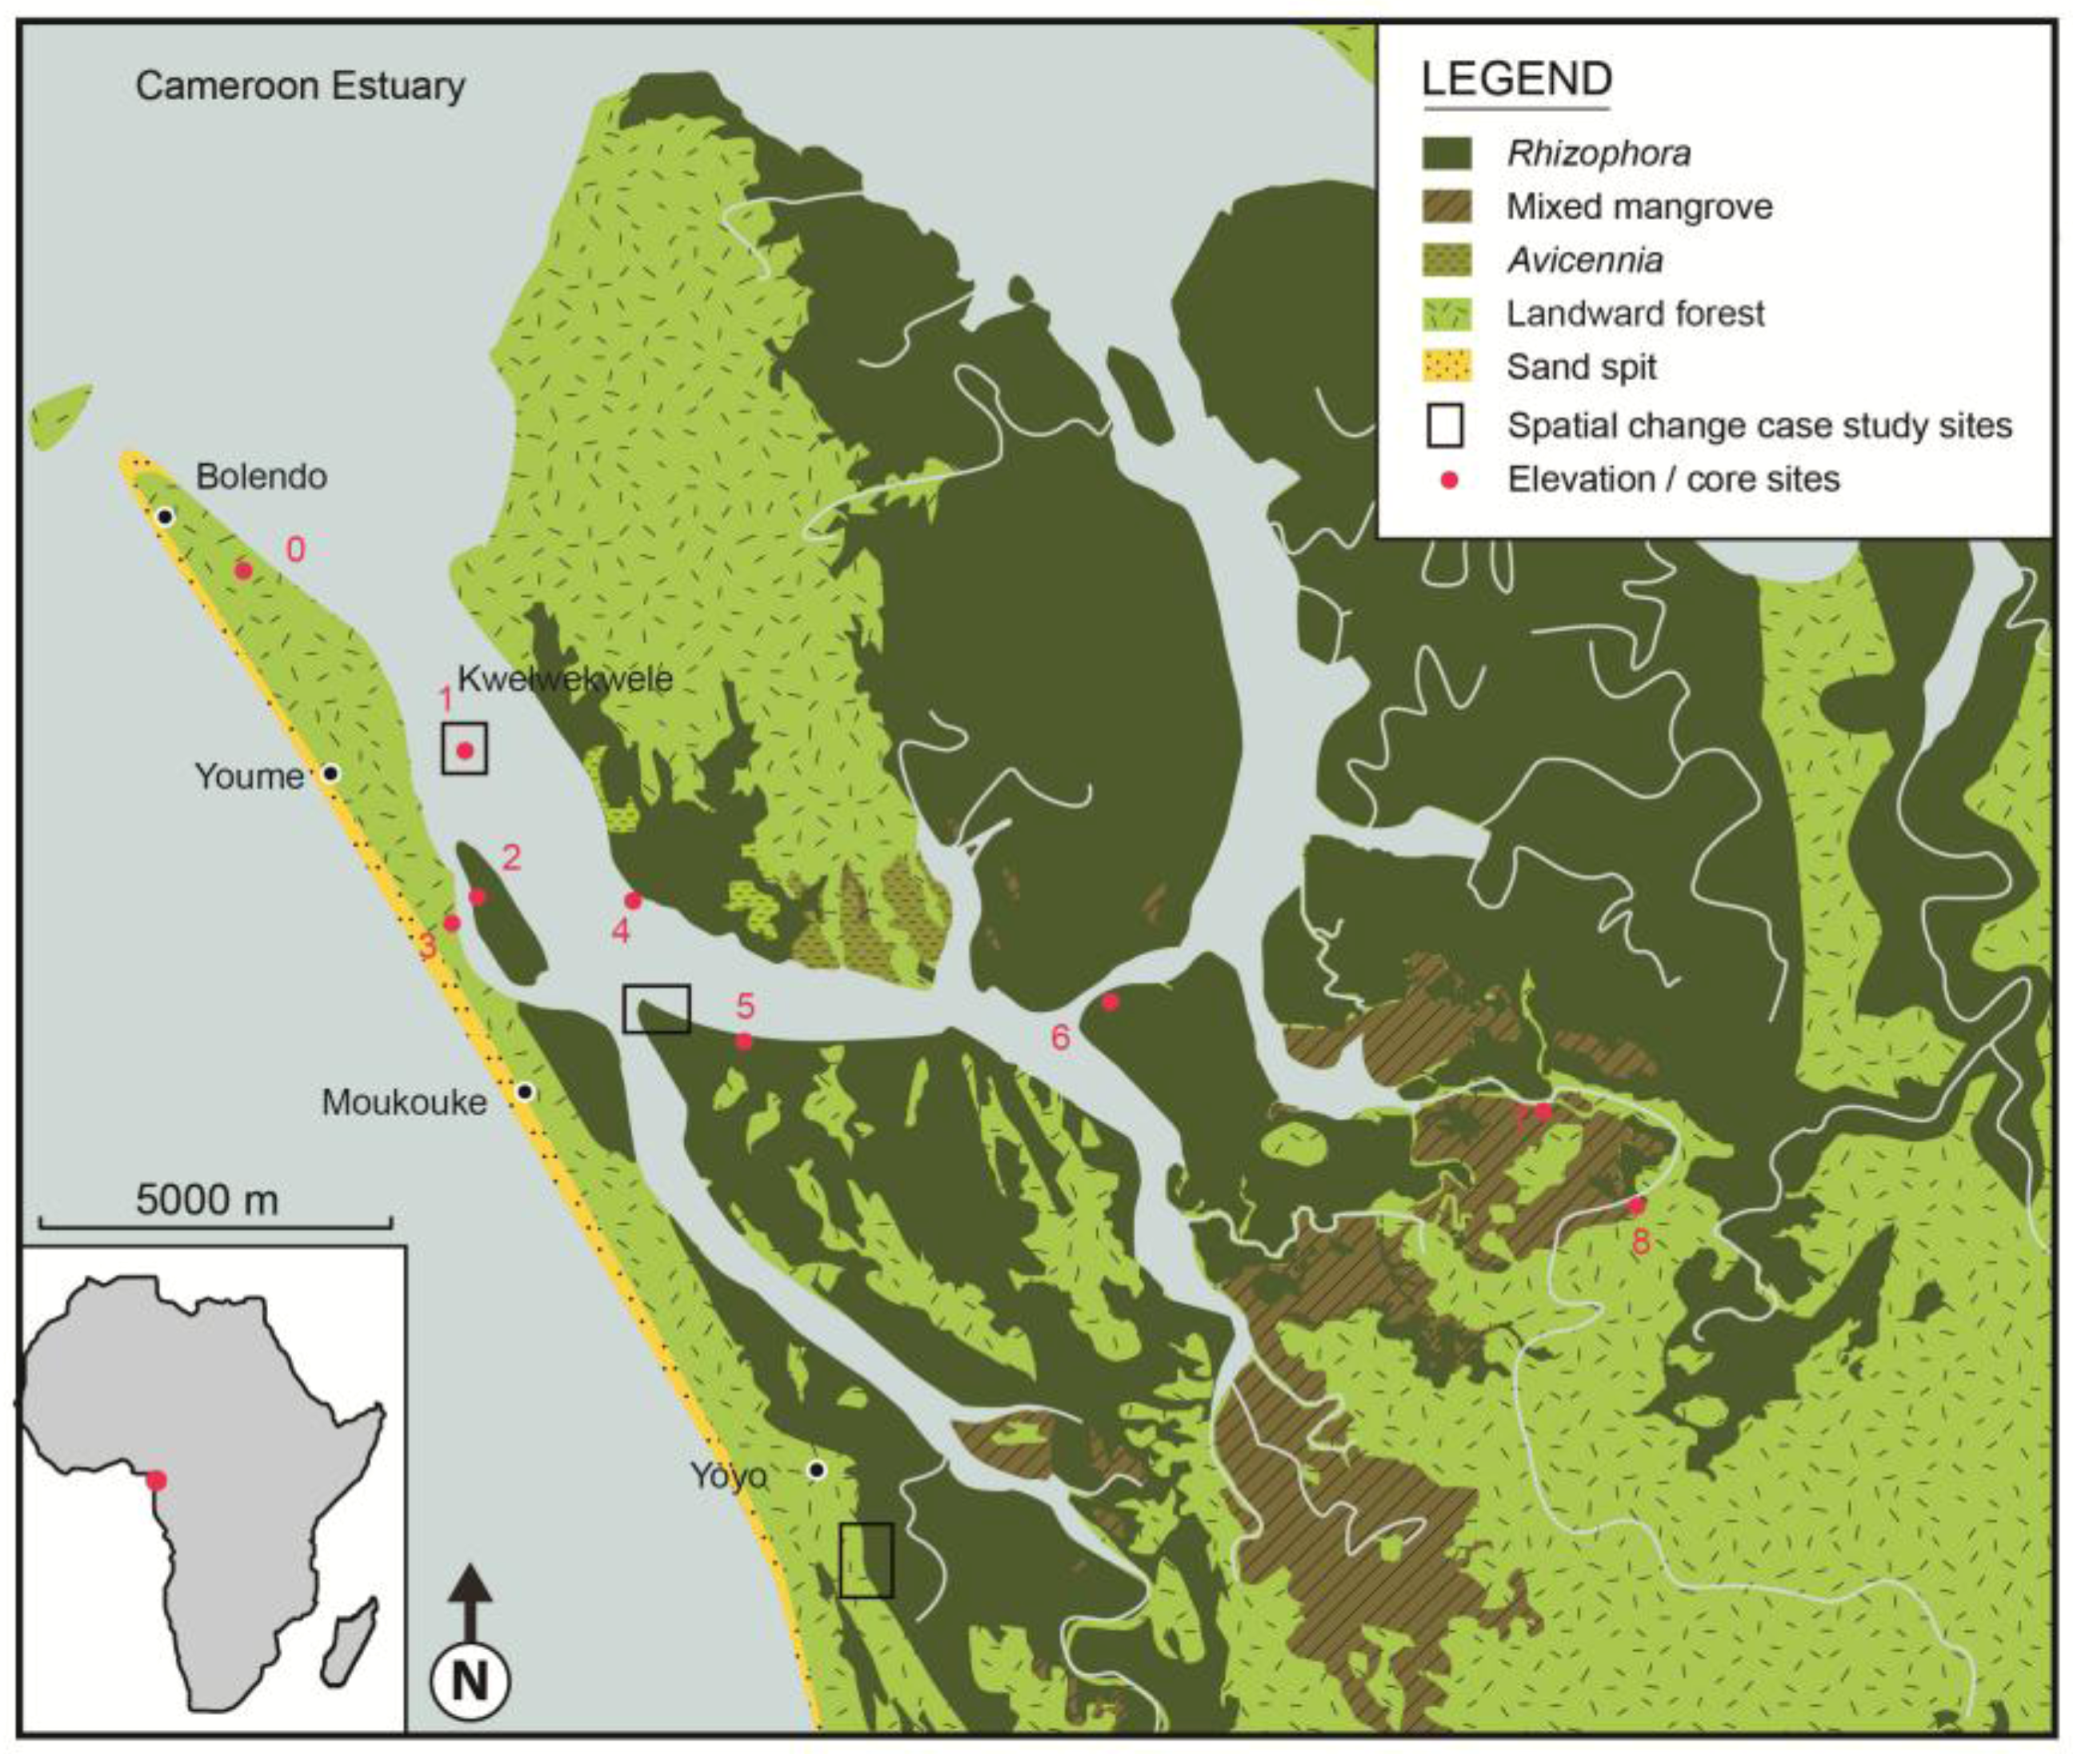
| Station | Location | GPS Position | Mangrove zone | Elevation (cm) |
|---|---|---|---|---|
| 0 | Reference station Jonathan Creek | 03° 48' 01.9" N 09° 34' 04.4" E | Seaward of mangroves | 0 |
| 1 | Kwelekwele Island | 03° 48' 17.6" N 09° 35' 24.0" E | Rhizophora racemosa | 6.8 |
| 2 | Moukouke Island core site | 03° 45' 54.9" N 09° 35' 40.4" E | Rhizophora | 47.0 |
| 3 | Seaward edge | 03° 45' 27.5" N 09° 35' 37.6" E | Rhizophora and Avicennia | 44.4 |
| 4 | Seaward edge | 03° 45' 35.1" N 09° 37' 09.0" E | Avicennia | 21.3 |
| 5 | Mid swamp | 03° 44' 31.9" N 09° 37' 52.6" E | R. mangle | 75.4 |
| 6 | Mid swamp-Nkamba | 03° 44' 46.7" N 09° 40' 41.42" E | R. racemosa | 54.1 |
| 7 | Landward edge | 03° 43' 58.6" N 09° 44' 02.2" E | Laguncularia with some Raphia palms | 73.1 |
| 8 | Landward edge | 03° 43' 05.6" N 09° 45' 09.0" E | Freshwater swamp | 75.2 |
6. Discussion
7. Conclusions
Acknowledgments
References and Notes
- Massel, S.R.; Furukawa, K.; Brinkman, R.M. Surface wave propagation in mangrove forests. Fluid Dyn. Res. 1999, 24, 219–249. [Google Scholar] [CrossRef]
- Dahdouh-Guebas, F.; Jayatissa, L.P.; di Nitto, D.; Bosire, J.O.; Lo Seen, D.; Koedam, N. How effective were mangroves as a defence against the recent tsunami? Curr. Biol. 2005, 15, R443–R447. [Google Scholar]
- Danielson, F.; Soerensen, M.; Olwig, M.; Selvam, V.; Parish, F.; Burgess, N.; Hiraishi, T.; Karunagaran, V.; Rasmussen, M.; Hansen, L.; et al. The Asian tsunami: A protective role for coastal vegetation. Science 2005, 310, 643. [Google Scholar]
- Katharesan, K.; Rajendran, N. Coastal mangrove forests mitigates tsunami. Estuar. Coast. Shelf Sci. 2005, 65, 601–606. [Google Scholar] [CrossRef]
- Hirashi, T. Effectiveness of coastal forests in mitigating tsunami hazards. In Proceedings of the Meeting and Workshop on Guidelines for the Rehabilitation of Mangroves and other Coastal Forests Damaged by Tsunamis and other Natural Hazards in the Asia-Pacific Region; Chan, H.T., Ong, J.E., Eds.; ITTO/ISME: Okinawa, Japan, 2008; pp. 65–73. [Google Scholar]
- Walters, B.B.; Ronnback, P.; Kovacs, J.M.; Crona, B.; Hussain, S.A.; Badola, R.; Primavera, J.H.; Barbier, E.; Dahdouh-Guebas, F. Ethnobiology, socio-economics and management of mangrove forests: A review. Aquat. Bot. 2008, 89, 220–236. [Google Scholar] [CrossRef]
- Robertson, A.I.; Duke, N.C. Recruitment, growth and residence times of fishes in a tropical Australian mangrove system. Estuar. Coast. Shelf Sci. 1990, 31, 725–745. [Google Scholar]
- Kimani, E.N.; Mwatha, G.K.; Wakwabi, E.O.; Ntiba, J.M.; Okoth, B.K. Fishes of a shallow tropical mangrove estuary, Gazi, Kenya. Mar. Freshw. Res. 1996, 47, 857–868. [Google Scholar] [CrossRef]
- Baran, E.; Hambrey, J. Mangrove Conservation and Coastal Management in Southeast Asia, What Impact on Fishery Resources? Mar. Pollut. Bull. 1999, 37, 431–440. [Google Scholar] [CrossRef]
- Mumby, P.J.; Edwards, A.J.; Arias-González, J.E.; Lindeman, K.C.; Blackwell, P.G.; Gall, A.; Gorczynska, M.I.; Harborne, A.R.; Pescod, C.L.; Renken, H.; et al. Mangroves enhance the biomass of coral reef fish communities in the Caribbean. Nature 2004, 427, 533–536. [Google Scholar]
- Chitaro, P.; Usseglio, P.; Sale, P.F. Variation in fish density, assemblage composition and relative rates of predation among mangrove, seagrass and coral reef habitats. Environ. Biol. Fishes 2005, 72, 175–187. [Google Scholar] [CrossRef]
- Ley, J.A.; McIvor, C.C. Linkages between estuarine and reef fish assemblages: Enhancement by the presence of well-developed mangrove shorelines. In The Everglades,Florida bay, and Coral Reefs of the Florida Keys. An Ecosystem Sourcebook; Porter, J.W., Porter, K.G., Eds.; CRC Press: Boca Raton, FL, USA, 2002; pp. 539–562. [Google Scholar]
- Donato, D.C.; Kauffman, J.B.; Murdiyarso, D.; Kurnianto, S.; Stidham, M.; Kanninen, M. Mangroves among the most carbon-rich forests in the tropics. Nat. Geosci. 2011, 4, 293–297. [Google Scholar] [CrossRef]
- Bouillon, S. Storage beneath mangroves. Nat. Geosci. 2011, 4, 282–283. [Google Scholar] [CrossRef] [Green Version]
- MacNae, W. A general account of the fauna and flora of mangrove swamps and forests in the Indo-West Pacific region. Adv. Mar. Biol. 1968, 6, 73–270. [Google Scholar] [CrossRef]
- Spalding, M.; Kainuma, M.; Collins, L. World Atlas of Mangroves; Earthscan: London, UK, Washington, DC, USA, 2010; pp. 1–261. [Google Scholar]
- Nfotabong-Atheull, A.; Din, N.; Essomè Koum, L.G.; Satyanarayana, B.; Koedam, N.; Dahdouh-Guebas, F. Assessing forest products usage and local residents’ perception of environmental changes in peri-urban and rural mangroves of Cameroon, Central Africa. J. Ethnobiol. Ethnomed. 2011, 7, 41. [Google Scholar] [CrossRef]
- Valiela, I.; Bowen, J.L.; York, J.K. Mangrove forests, one of the world’s threatened major tropical environments. BioScience 2001, 51, 807–815. [Google Scholar] [CrossRef]
- Wilkie, M.L.; Fortuna, S. Status and trends in mangrove area extent worldwide. For. Resour. Assess. Work. Pap. 2003, 63, J1533. [Google Scholar]
- Giri, C.; Ochieng, E.; Tieszen, L.L.; Zhu, Z.; Singh, A.; Loveland, T.; Masek, J.; Duke, N. Status and distribution of mangrove forests of the world using earth observation satellite data. Glob. Ecol. Biogeogr. 2011, 20, 154–159. [Google Scholar] [CrossRef]
- Food and Agriculture Organization, The World’s Mangroves 1980-2005: A Thematic Study Prepared in the Framework of the Global Resources Assessment 2005; Food and Agriculture Organization (FAO): Rome, Italy, 2007; pp. 1–77.
- Manhas, R.K.; Negi, J.D.S.; Kumar, R.; Chauhan, R. Temporal assessment of growing stock, biomass and carbon stock of Indian forests. Clim. Change 2006, 74, 191–221. [Google Scholar] [CrossRef]
- Duke, N.C.; Meynecke, J.-O.; Dittmann, S.; Ellison, A.M.; Anger, K.; Berger, U.; Cannicci, S.; Diele, K.; Ewel, K.C.; Field, C.D.; et al. A world without mangroves? Science 2007, 317, 41–42. [Google Scholar]
- Nicholls, R.J.; Wong, P.P.; Burkett, V.R.; Codignotto, J.O.; Hay, J.E.; McLean, R.F.; Ragoonaden, S.; Woodroffe, C.D. Coastal systems and low-lying areas. In Climate Change 2007: Impacts,Adaptation and Vulnerability. Contribution of Working Group II to the Fourth Assessment Report of the Intergovernmental Panel on Climate Change; Parry, M.L., Canziani, O.F., Palutikof, J.P., van der Linden, P.J., Hanson, C.E., Eds.; Cambridge University Press: Cambridge, UK, 2007; pp. 315–356. [Google Scholar]
- Ellison, J.C. Mangrove retreat with rising sea-level, Bermuda. Estuar. Coast. Shelf Sci. 1993, 37, 75–87. [Google Scholar] [CrossRef]
- Semeniuk, V. Predicting the Effect of Sea-Level Rise on Mangroves in Northwestern Australia. J. Coast. Res. 1994, 10, 1050–1076. [Google Scholar]
- Cahoon, D.; Hensel, P.; Spencer, T.; Reed, D.J.; McKee, K.L.; Saintilan, N. Coastal wetland vulnerability to relative sea-level rise: Wetland elevation trends and process controls. In Wetlands and Natural Resource Management; Verhoeven, J.T.A., Beltman, B., Bobbink, R., Whigham, D.F., Eds.; Springer-Verlag: Berlin, Germany, 2006; pp. 271–292. [Google Scholar]
- Gilman, E.; Ellison, J.C.; Duke, N.C.; Field, C.; Fortuna, S. Threats to mangroves from climate change and adaptation options: A review. Aquat. Bot. 2008, 89, 237–250. [Google Scholar] [CrossRef]
- Soares, M.L.G. A conceptual model for the responses of mangrove forests to sea level rise. J. Coast. Res. 2009, 56, 267–271. [Google Scholar]
- Clough, B.F.; Sim, R.G. Changes in gas exchange characteristics and water use efficiency of mangroves in response to salinity and vapour pressure deficit. Oecologia 1989, 79, 38–44. [Google Scholar] [CrossRef]
- Cheeseman, J.M.; Clough, B.F.; Carter, D.R.; Lovelock, C.E.; Eong, O.J.; Sim, R.G. The analysis of photosynthetic performance in leaves under field conditions, a case study using Bruguiera mangroves. Photosynth. Res. 1991, 29, 11–22. [Google Scholar]
- Cheeseman, J.M. Depressions of photosynthesis in mangrove canopies. In Photoinhibition of Photosynthesis, From Molecular Mechanisms to the Field; Baker, N.R., Bowyer, J.R., Baker, N.R., Bowyer, J.R., Eds.; Bios Scientific Publishers: Oxford, UK, 1994; pp. 377–389. [Google Scholar]
- Cheeseman, J.M.; Herendeen, L.B.; Cheeseman, A.T.; Clough, B.F. Photosynthesis and photoprotection in mangroves under field conditions. Plant Cell Environ. 1997, 20, 579–588. [Google Scholar]
- Duke, N.C.; Ball, M.C.; Ellison, J.C. Factors influencing biodiversity and distributional gradients in mangroves. Glob. Ecol. Biogeogr. Lett. 1998, 7, 27–47. [Google Scholar] [CrossRef]
- Rogers, K.; Saintilan, N.; Cahoon, D.R. Surface elevation dynamics in a regenerating mangrove forest at Homebush Bay, Australia. Wetlands Ecol. Manag. 2005, 13, 587–598. [Google Scholar]
- Rogers, K.; Saintilan, N.; Heijnis, H. Mangrove encroachment of salt marsh in Western Port Bay, Victoria, the role of sedimentation, subsidence, and sea level rise. Estuaries 2005, 28, 551–559. [Google Scholar] [CrossRef]
- Whelan, K.R.T.; Smith, T.J., III; Cahoon, D.R.; Lynch, J.C.; Anderson, G.H. Groundwater control of mangrove surface elevation, Shrink and swell varies with soil depth. Estuaries 2005, 28, 833–843. [Google Scholar] [CrossRef]
- Meehl, G.A.; Stocker, T.F.; Collins, W.; Friedlingstein, P.; Gaye, A.T.; Gregory, J.M.; Kitoh, A.; Knutti, R.; Murphy, J.M.; Noda, A.; et al. Global climate projections. In Climate Change 2007: The Physical Science Basis. Contribution of Working Group I to the Fourth Assessment Report of the Intergovernmental Panel on Climate Change; Solomon, S., Qin, W., Manning, M., Chen, Z., Marquis, M., Averyt, K.B., Eds.; Cambridge University Press: Cambridge, UK, 2007; pp. 747–846. [Google Scholar]
- Vermeer, M.; Rahmstorf, S. Global sea level linked to global temperature. Proc. Natl. Acad. Sci. USA 2009, 106, 21527–21532. [Google Scholar] [CrossRef]
- Grinsted, A.; Moore, J.C.; Jevrejeva, S. Reconstructing sea level from paleo and projected temperatures 200 to 2100 ad. Clim. Dyn. 2010, 34, 461–472. [Google Scholar] [CrossRef]
- Jevrejeva, S.; Moore, J.C.; Grinsted, A. How will sea level respond to changes in natural and anthropogenic forcings by 2100? Geophys. Res. Lett. 2010, 37. [Google Scholar] [CrossRef] [Green Version]
- McKee, K.L. Biophysical controls on accretion and elevation change in Caribbean mangrove ecosystems. Estuar. Coast. Shelf Sci. 2011, 91, 475–483. [Google Scholar] [CrossRef]
- Krauss, K.W.; Cahoon, D.R.; Allen, J.A.; Ewel, K.C.; Lynch, J.C.; Cormier, N. Surface Elevation Change and Susceptibility of Different Mangrove Zones to Sea-Level Rise on Pacific High Islands of Micronesia. Ecosystems 2010, 13, 129–143. [Google Scholar]
- Adger, W.N.; Agrawala, S.; Mirza, M.M.Q.; Conde, C.; O’Brien, K.; Pulhin, J.; Pulwarty, R.; Smit, B.; Takahashi, K. Assessment of adaptation practices, options, constraints and capacity. In Climate Change 2007: Impacts, Adaptation and Vulnerability. Contribution of Working Group II to the Fourth Assessment Report of the Intergovernmental Panel on Climate Change; Parry, M.L., Canziani, O.F., Palutikof, J.P., van der Linden, P.J., Hanson, C.E., Eds.; Cambridge University Press: Cambridge, UK, 2007; pp. 717–743. [Google Scholar]
- Intergovernmental Panel on Climate Change, Climate Change 2007: Synthesis Report. Contribution of Working Groups I, II and III to the Fourth Assessment; Intergovernmental Panel on Climate Change: Geneva, Switzerland, 2007; p. 28.
- Fonteh, M.; Esteves, L.S.; Gehrels, W.R. Mapping and valuation of ecosystems and economic activities along the coast of Cameroon: Implications of future sea level rise. Coastline Rep. 2009, 13, 47–63. [Google Scholar]
- Nfotabong-Atheull, A.; Din, N.; Longonje, S.N.; Koedam, N.; Dahdouh-Guebas, F. Commercial activities and subsistence utilization of mangrove forests around the Wouri estuary and the Douala-Edea reserve. J. Ethnobiol. Ethnomed. 2009, 5, 35. [Google Scholar] [CrossRef]
- Feka, N.Z.; Ajonina, G.N. Drivers causing decline of mangrove in West-Central Africa: A review. Int. J. Biodivers. Sci. Ecosyst. Serv. Manag. 2011, 7, 217–230. [Google Scholar] [CrossRef]
- Din, N.; Saenger, P.; Jules, P.R.; Siegried, D.D.; Blasco, F. Logging activities in mangrove forests: A case study of Douala Cameroon African. J. Environ. Sci. Technol. 2008, 2, 22–30. [Google Scholar]
- Lovelock, C.E.; Ellison, J.C. Vulnerability of mangroves and tidal wetlands of the Great Barrier Reef to climate change. In Climate Change and the Great Barrier Reef: A Vulnerability Assessment; Johnson, J.E., Marshall, P.A., Eds.; Great Barrier Reef Marine Park Authority and Australian Greenhouse Office: Townsville, Australia, 2007; pp. 237–269. [Google Scholar]
- Ellison, J.C. Climate Change Vulnerability Assessment and Adaptation Planning for Mangrove Systems; WWF US: Washington, DC, USA, 2012; pp. 12–85. [Google Scholar]
- Corcoran, E.; Ravilious, C.; Skuja, M. Mangroves of Western and Central Africa; UNEP-Regional Seas Programme,World Conservation Monitoring Centre: Cambridge, UK, 2007; p. 89. [Google Scholar]
- Ajonina, G.N.; Chuyong, P.D.; Nkanje, B.T. Developing a Generalizable Methodology for Assessing the Vulnerability of Mangroves and Associated Ecosystems in Cameroon: A Country Synthesis; WWF Central African Regional Programme Office: Yaoundé, Cameroon, 2011. [Google Scholar]
- Tomlinson, P.B. The Botany of Mangroves; Cambridge University Press: Cambridge, UK, 2008; pp. 40–61. [Google Scholar]
- Allersma, E.; Tilmans, W.M.K. Coastal conditions in West Africa: A review. Ocean Coast. Manag. 1993, 19, 199–240. [Google Scholar] [CrossRef]
- Romain, T. Sea Level Measurement and Analysis in the Cameroon Ocean and River (Wouri). National Report Cameroon; Intergovernmental Oceanographic Commission of UNESCO: Limbe, Cameroon, 2006; pp. 4–12. [Google Scholar]
- Thieler, E.R.; Danforth, W.W. Historical Shoreline Mapping (II): Application of the Digital Shoreline Mapping and Analysis Systems (DSMS/DSAS) to Shoreline Change Mapping in Puerto Rico. J. Coast. Res. 1994, 10, 600–620. [Google Scholar]
- Thieler, E.R.; Himmelstoss, E.A.; Zichichi, J.L.; Ergul, A. Digital Shoreline Analysis System (DSAS) Version 4.0-An ArcGIS Extension for Calculating Shoreline Change; Open-File Report for U.S. Geological Survey: Reston, VA, USA, 2009. [Google Scholar]
- Dolan, R.; Fenster, M.S.; Holme, S.J. Temporal analysis of shoreline recession and accretion. J. Coast. Res. 1991, 7, 723–744. [Google Scholar]
- Thien, S.J. A flow diagram for teaching texture by feel analysis. J. Agron. Edu. 1979, 8, 54–55. [Google Scholar]
- McKee, K.L.; Cahoon, D.R.; Feller, I.C. Caribbean mangroves adjust to rising sea levels through biotic controls on change in soil elevation. Glob. Ecol. Biogeogr. 2007, 16, 545–556. [Google Scholar] [CrossRef]
- Vogel, J.C.; Fuls, A.M.; Visser, E.; Becker, B. Pretoria Calibration Curve for Short-Lived Samples, 1930-3350 BC. Radiocarbon 1993, 35, 73–85. [Google Scholar]
- Erdtman, O.E.G. Handbook of Palynology: Morphology, Taxonomy, Ecology; Munksgaard: Copenhagen, The Netherlands, 1969; pp. 1–486. [Google Scholar]
- Faegri, K.; Iverson, J. Textbook of Pollen Analysis, 4th ed; John Wiley and Sons: New York, NY, USA, 1989; pp. 1–328. [Google Scholar]
- Ellison, J.C. Long-term retrospection on mangrove development using sediment cores and pollen analysis: A review. Aquat. Bot. 2008, 89, 93–104. [Google Scholar] [CrossRef]
- Behling, H.; Cohen, M.C.L.; Lara, R.J. Studies on Holocene mangrove ecosystem dynamics of the Bragança Peninsula in north-eastern Pará, Brazil. Palaeogeogr. Palaeoclimatol. Palaeoecol. 2001, 167, 431–440. [Google Scholar]
- Salard-Cheboldaeff, M. Palynologie Camerounaise II. Grains du pollen de la forêt littorale de basse altitude. Congr. Natl. Soc. Savantes 1981, 106, 125–136. [Google Scholar]
- Grimm, E. Data analysis and display. In Vegetation History; Huntley, B., Webb, T., Eds.; Klewer: Dordrecht, The Netherlands, 1988; pp. 43–76. [Google Scholar]
- Heiri, O.; Lotter, A.F.; Lemcke, G. Loss on ignition as a method for estimating organic and carbonate content in sediments: Reproducibility and comparability of results. J. Paleolimnol. 2001, 25, 101–110. [Google Scholar] [CrossRef]
- Woodroffe, C.D. Mangrove swamp stratigraphy and Holocene transgression, Grand Cayman Island, West Indies. Mar. Geol. 1981, 41, 271–294. [Google Scholar] [CrossRef]
- Ellison, J.C.; Stoddart, D.R. Mangrove ecosystem collapse during predicted sea level rise: Holocene analogues and implications. J. Coast. Res. 1991, 7, 151–165. [Google Scholar]
- English, S.; Wilkinson, C.; Baker, V. Manual for Survey of Tropical Marine Resources, 2nd ed; Australian Institute of Marine Science: Townsville, Australia, 1994; pp. 185–190. [Google Scholar]
- Healey, R.G.; Pye, K.; Stoddart, D.R.; Bayliss-Smith, T.P. Velocity variations in salt marsh creeks, Norfolk, England. Estuar. Coast. Shelf Sci. 1981, 13, 535–545. [Google Scholar] [CrossRef]
- French, J.R.; Stoddart, D.R. Hydrodynamics of salt marsh creek systems: Implications for marsh morphological development and material exchange. Earth Surf. Process. Landforms 1992, 17, 235–252. [Google Scholar] [CrossRef]
- Lawrence, D.S.L.; Allen, J.R.L.; Havelock, G.M. Salt marsh morphodynamics: An investigation of tidal flows and marsh channel equilibrium. J. Coast. Res. 2004, 20, 301–316. [Google Scholar]
- Kristensen, E.; Bouillon, S.; Dittmar, T.; Marchand, C. Organic carbon dynamics in mangrove ecosystems: A review. Aquat. Bot. 2008, 89, 201–219. [Google Scholar] [CrossRef]
- Willard, D.A.; Bernhardt, C.E. Impacts of past climate and sea level change on Everglades wetlands: Placing a century of anthropogenic change into a late-Holocene context. Clim. Change 2011, 107, 9–80. [Google Scholar]
- Lucas, R.M.; Ellison, J.C.; Mitchell, A.; Donnelly, B.; Finlayson, C.M.; Milne, A.K. Use of Stereo Aerial Photography for Assessing Changes in the Extent and Height of Mangrove Canopies in Tropical Australia. Wetlands Ecol. Manag. 2002, 10, 159–173. [Google Scholar] [CrossRef]
- Gilman, E.; Ellison, J.C.; Coleman, R. Assessment of mangrove response to projected relative sea-level rise and recent historical reconstruction of shoreline position, American Samoa. Environ. Monit. Assess. 2007, 124, 105–130. [Google Scholar] [CrossRef]
- Shearman, P.L. Recent change in the extent of mangroves in the Northern Gulf of Papua, Papua New Guinea. Ambio 2010, 39, 181–189. [Google Scholar] [CrossRef]
- Ellison, J.C. Holocene palynology and sea-level change in two estuaries in Southern Irian Jaya. Palaeogeogr. Palaeoclimatol. Palaeoecol. 2005, 220, 291–309. [Google Scholar] [CrossRef]
- Bindoff, N.L.; Willebrand, J.; Artale, V.; Cazenave, A.; Gregory, J.; Gulev, S.; Hanawa, K.; Le Quéré, C.; Levitus, S.; Nojiri, Y.; et al. Observations: Oceanic Climate Change and Sea Level. In Climate Change 2007: The Physical Science Basis. Contribution of Working Group I to the Fourth Assessment Report of the Intergovernmental Panel on Climate Change; Solomon, S., Qin, D., Manning, M., Chen, Z., Marquis, M., Averyt, K.B., Tignor, M., Miller, H.L., Eds.; Cambridge University Press: Cambridge, UK, 2007; pp. 355–382. [Google Scholar]
- Ellison, J.C. Geomorphology and sedimentology of mangrove swamps. In Coastal Wetlands: An Ecosystem Integrated Approach; Wolanski, E., Cahoon, D., Perillo, G.M.E., Eds.; Elsevier Science: Amsterdam, The Netherlands, 2009; pp. 564–591. [Google Scholar]
- Pomeroy, R.S.; Parks, J.E.; Watson, L.M. How is Your MPA Doing? A Guidebook of Natural and Social Indicators of Evaluating Marine Protected Area Management Effectiveness; IUCN: Gland, Switzerland, 2007; p. 46. [Google Scholar]
- Baron, J.S.; Allen, C.D.; Fleishman, E.; Gunderson, L.; McKenzie, D.; Meyerson, L.; Oropeza, J.; Stephenson, N. National Parks. In Preliminary Review of Adaptation Options for Climate-SensitiveEcosystems and Resources; Julius, S.H., West, J.M., Eds.; U.S. Environmental Protection Agency: Washington, DC, USA, 2008; pp. 95–130. [Google Scholar]
- Appeaning Addo, K. Changing morphology of Ghana’s Accra coast. J. Coast. Conserv. 2011, 15, 433–443. [Google Scholar] [CrossRef]
- Arthuron, R.; Korateng, K. Coastal and Marine Environments. In Africa Environment Outlook2-Our Environment, Our Wealth, 2nd; Mohamed-Katerere, J.C., Ed.; United Nations Environment Programme: Nairobi, Kenya, 2006; pp. 155–195. [Google Scholar]
- Langley, J.A.; McKee, K.L.; Cahoon, D.R.; Cherry, J.A.; Megonigala, J.P. Elevated CO2 stimulates marsh elevation gain, counterbalancing sea-level rise. Proc. Natl. Acad. Sci. USA 2009, 106, 6182–6186. [Google Scholar]
- Di Nitto, D.; Dahdouh-Guebas, F.; Kairo, J.G.; Decleir, H.; Koedam, N. Digital terrain modelling to investigate the effects of sea level rise on mangrove propagule establishment. Mar. Ecol. Prog. Ser. 2008, 356, 175–188. [Google Scholar] [CrossRef]
© 2012 by the authors; licensee MDPI, Basel, Switzerland. This article is an open access article distributed under the terms and conditions of the Creative Commons Attribution license (http://creativecommons.org/licenses/by/3.0/).
Share and Cite
Ellison, J.C.; Zouh, I. Vulnerability to Climate Change of Mangroves: Assessment from Cameroon, Central Africa. Biology 2012, 1, 617-638. https://doi.org/10.3390/biology1030617
Ellison JC, Zouh I. Vulnerability to Climate Change of Mangroves: Assessment from Cameroon, Central Africa. Biology. 2012; 1(3):617-638. https://doi.org/10.3390/biology1030617
Chicago/Turabian StyleEllison, Joanna C., and Isabella Zouh. 2012. "Vulnerability to Climate Change of Mangroves: Assessment from Cameroon, Central Africa" Biology 1, no. 3: 617-638. https://doi.org/10.3390/biology1030617