Microbial Analyses of Ancient Ice Core Sections from Greenland and Antarctica

Abstract
:
1. Introduction
2. Results and Discussion
2.1. Results
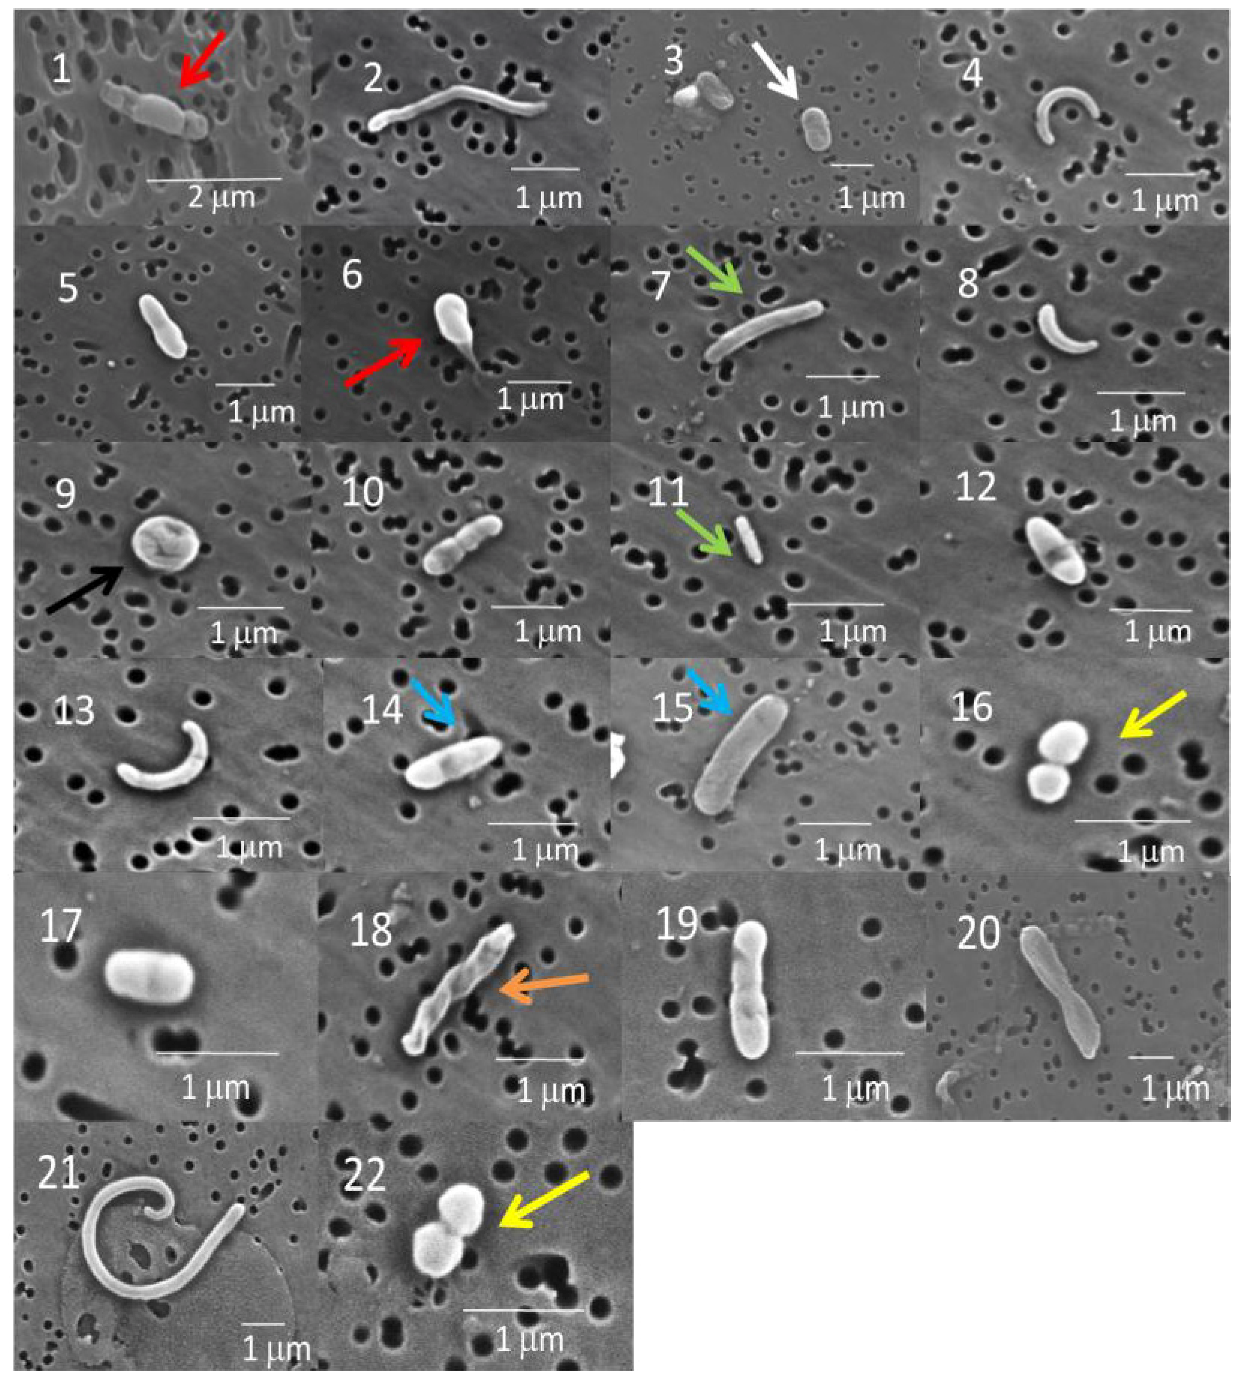
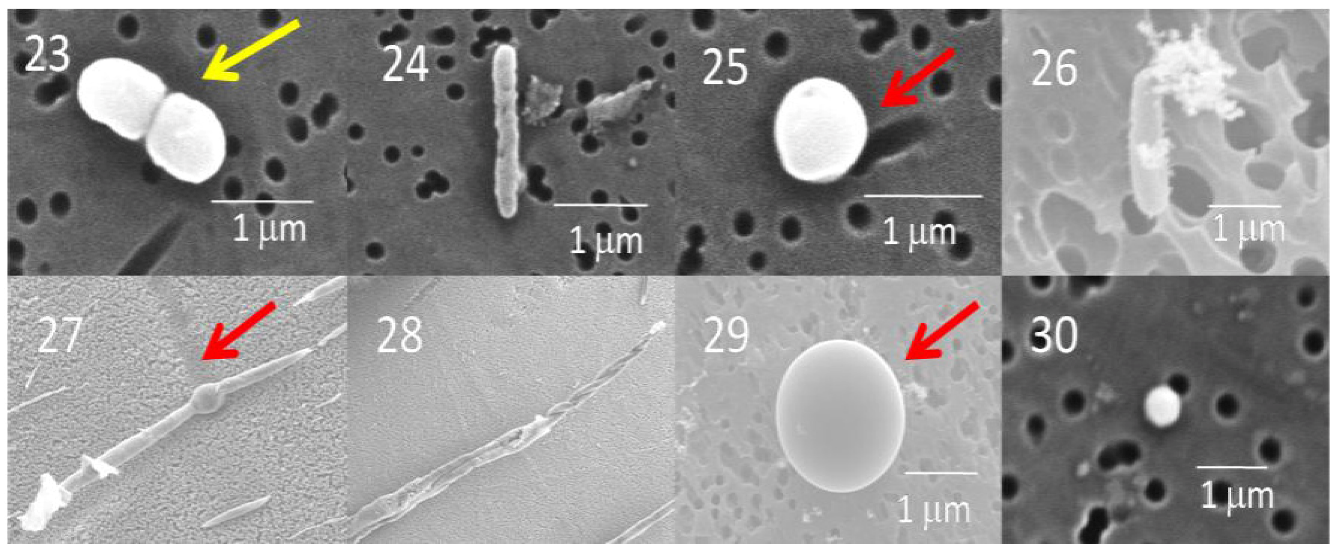
2.1.1. Scanning Electron Microscopy (SEM)
2.1.2. Revival and Molecular Identification of Glacial Isolates

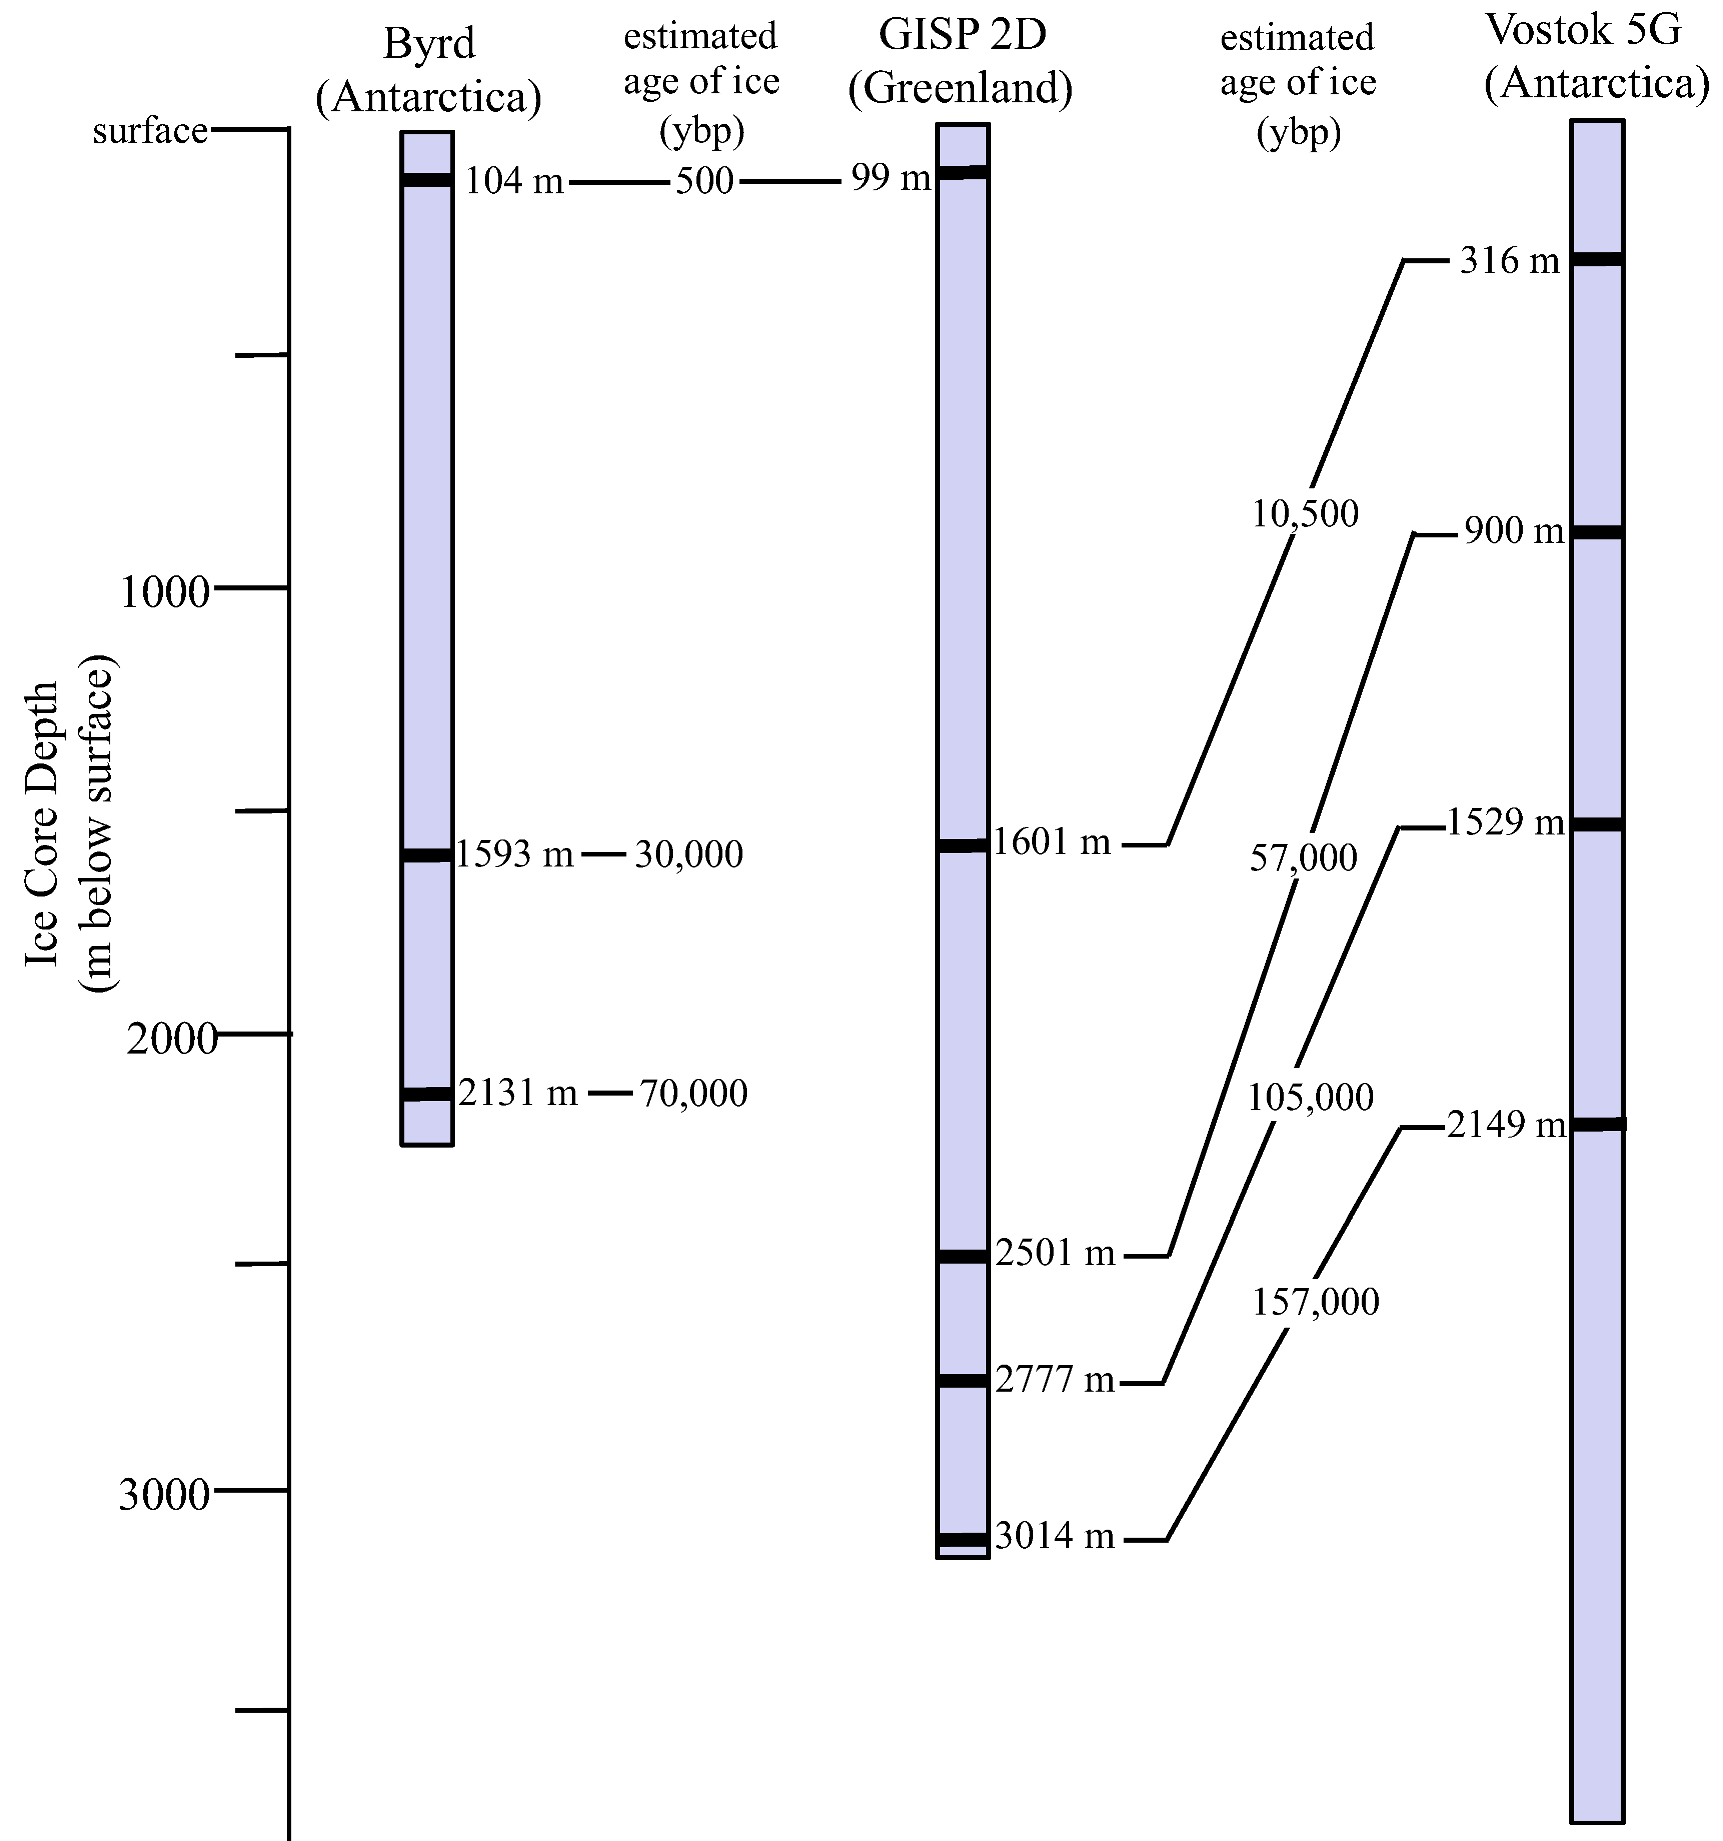
| Core | Depth (m) | Age (ybp) | Sequence number a | Accession number | Closest BLASTn match b | Phylum c | Identity(%) |
|---|---|---|---|---|---|---|---|
| Byrd | 99 | <500 | CULT C-2 | KC146580 | Alternaria sp. | As | 99 d |
| 1,593 | 30,000 | CULT C-8 | KC146581 | Alternaria alternata | As | 99 d | |
| CULT A-1 | KC146555 | Bacillus lichniformis | Fi | 99 d | |||
| 2,131 | 70,000 | CULT D-7 | KC146582 | Alternaria alternata | As | 99 d | |
| GISP 2D | 104 | <500 | CULT B-1 | KC146556 | Bacillus thioparans | Fi | 100 e |
| 1,601 | 10,500 | GI860 | KC206482 | Alternaria alternata | As | 100 d | |
| c2581 | KC155352 | Lactobacillus helveticus | Fi | 100 d | |||
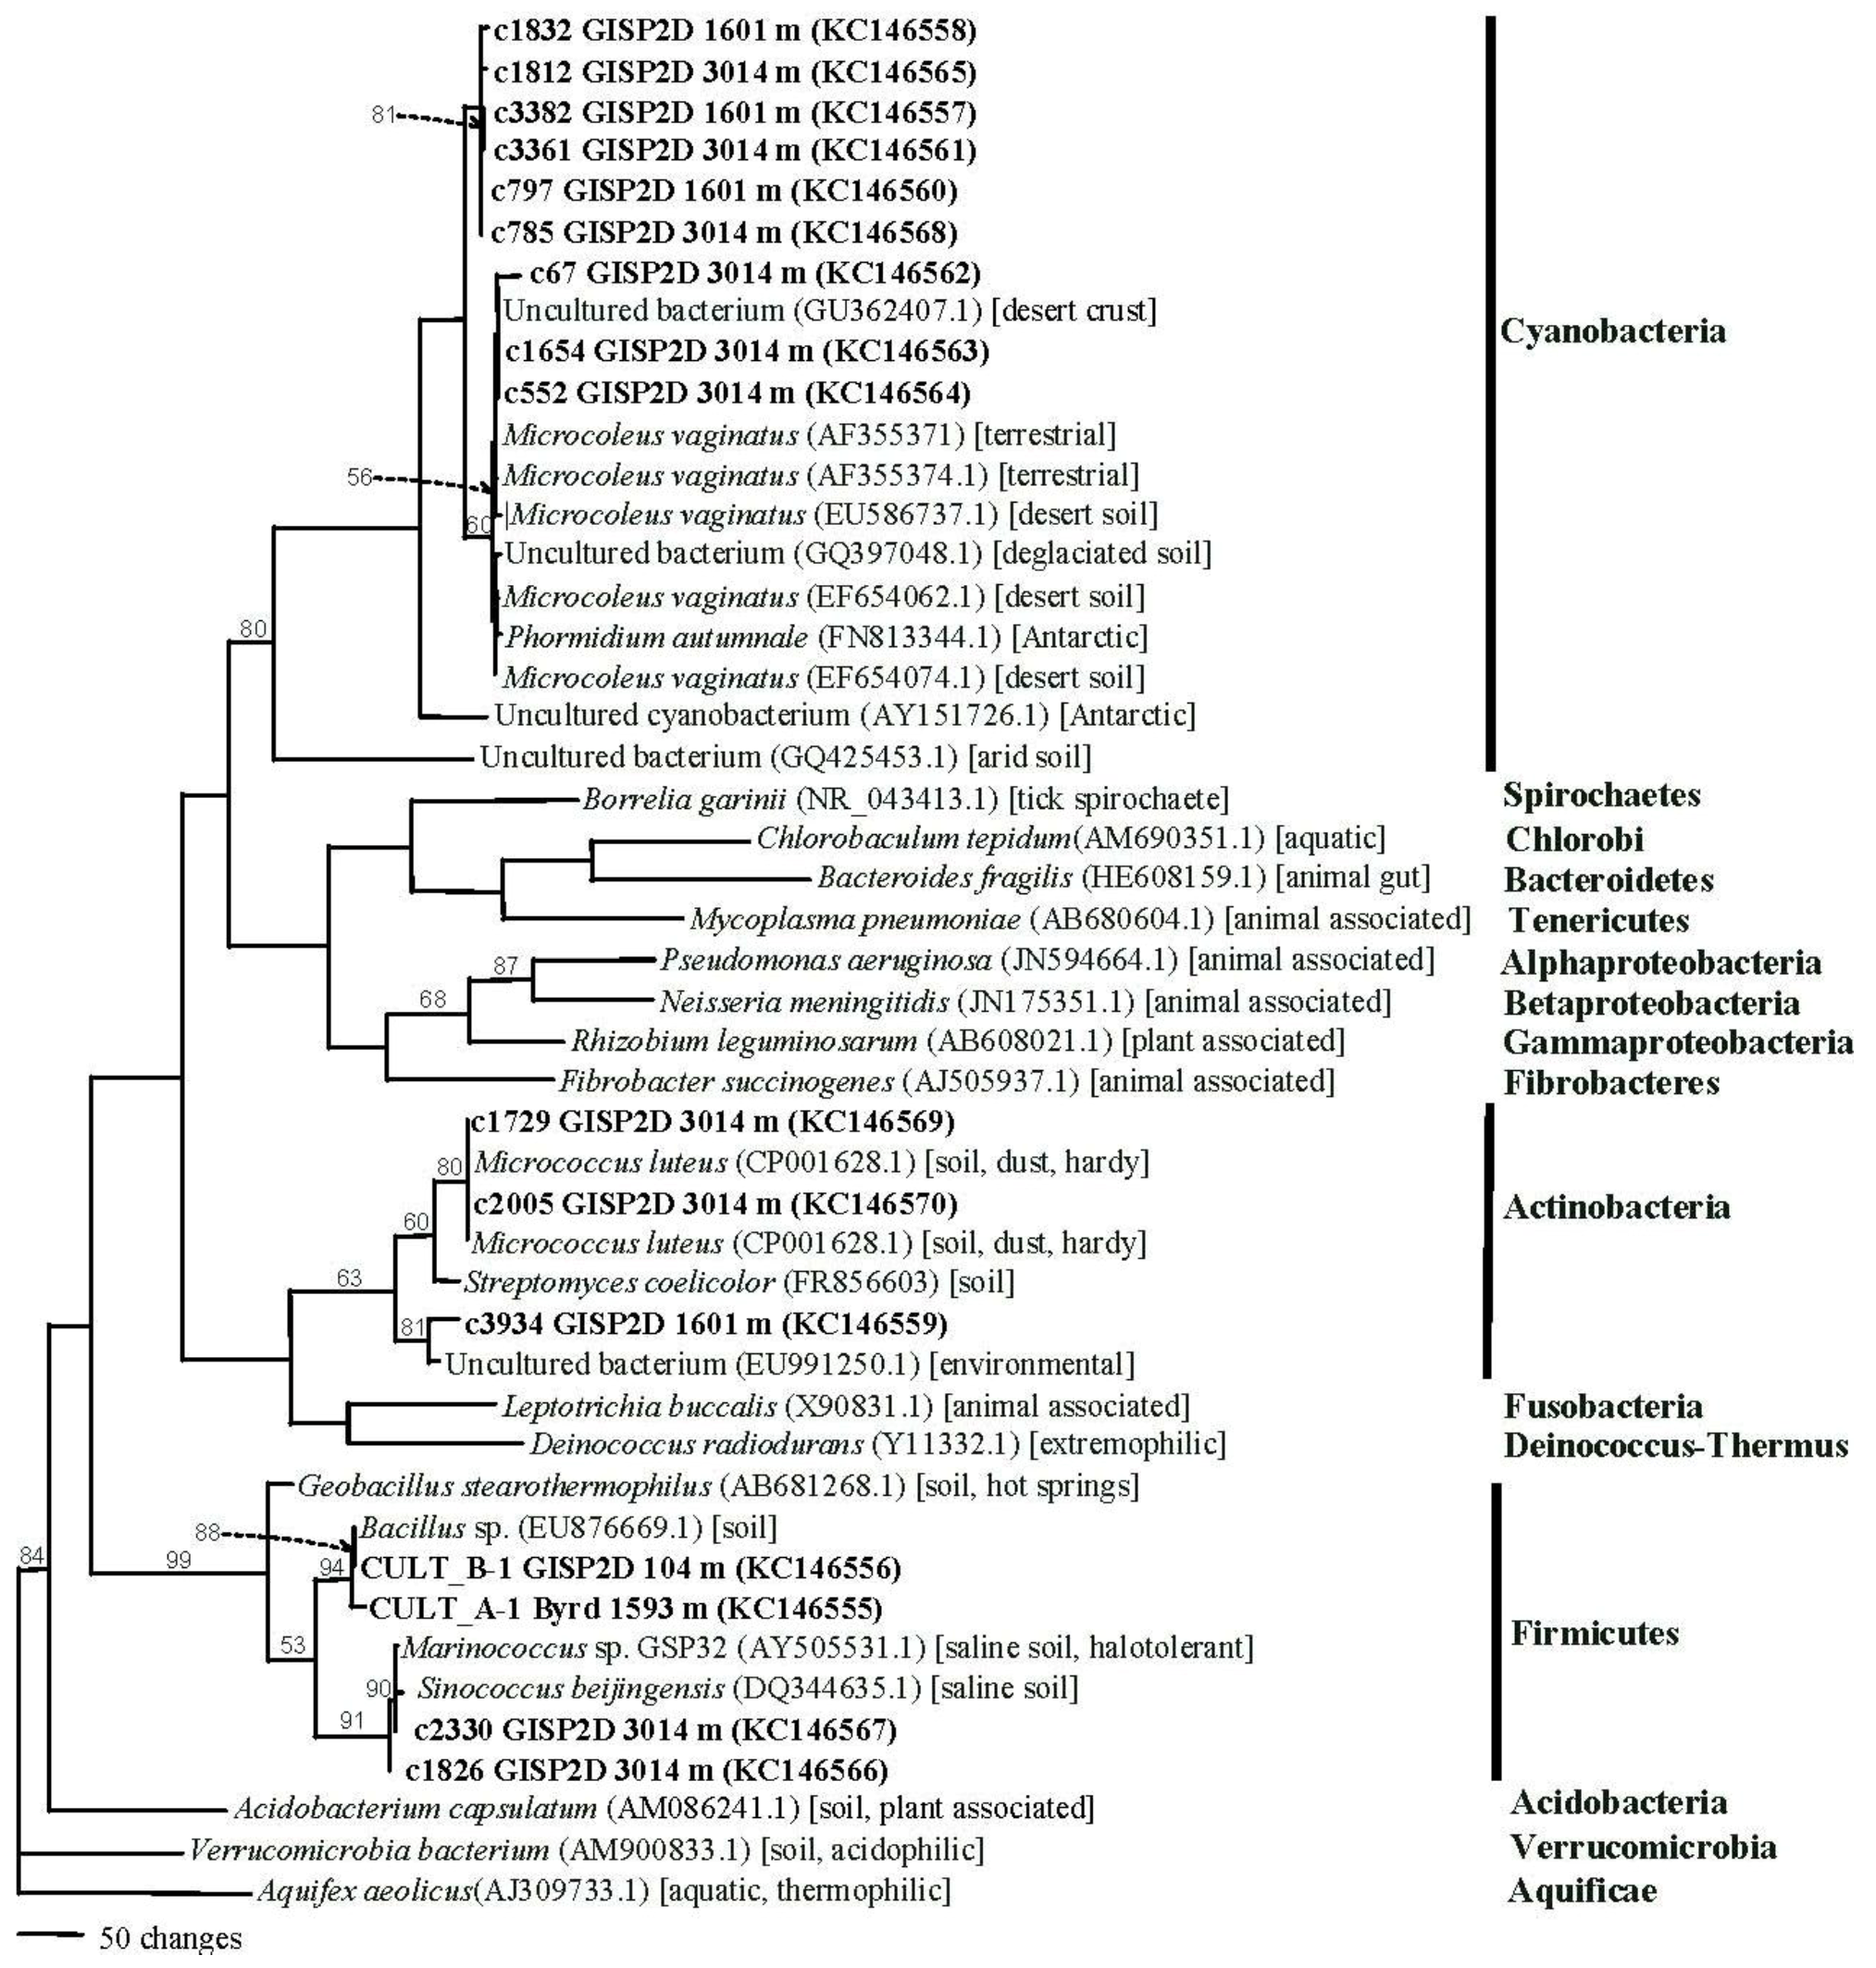
| s3382 | KC146557 | Microcoleus vaginatus | Cy | 99 e | |||
| c797 | KC146560 | Microcoleus vaginatus | Cy | 99 e | |||
| c1832 | KC146558 | Uncultured bacterium | Cy | 99 e | |||
| GI859 | KC206491 | Fusarium culmorum | As | 98 d | |||
| s1867 | KC155351 | Lactobacillus crispatus | Fi | 98 e | |||
| GI862 | KC206492 | Penicillium corylophilum | As | 98 d | |||
| GI867 | KC206485 | Rhodotorula mucilacinosa | Ba | 98 e | |||
| GI861 | KC206488 | Cladosporium tennuissimum | As | 97 d | |||
| GI866 | KC206494 | Rhodotorula mucilacinosa | Ba | 97 d | |||
| c2097 | KC146554 | Uncultured cyanobacterium | Cy | 95 e | |||
| GI865 | KC206477 | Caulobacter crescentus | Ap | 94 e | |||
| c4392 | KC146571 | Escherichia coli | Gp | 93 e | |||
| s3934 | KC146559 | Uncultured bacterium | Ac | 93 e | |||
| c3088 | KC146584 | Halomonas neptunia | Gp | 92 e | |||
| 2,501 | 57,000 | GI868 | KC206495 | Aspergillus restrictus | As | 99 d | |
| GI869 | KC206484 | Aureobasidium pullulans | Ba | 99 d | |||
| GI871 | KC206489 | Aspergillus conicus | As | 98 d | |||
| GI873 | KC206481 | Rhodotorula mucilacinosa | Ba | 98 d | |||
| GI872 | KC206478 | Caulobacter crescentus | Ap | 86 e | |||
| 2,777 | 105,000 | GI875 | KC206483 | Cryptococcus magnus | Ba | 99 d | |
| GI876 | KC206487 | Rhodotorula mucilacinosa | Ba | 99 d | |||
| GI874 | KC209502 | Bacillus subtilis | Fi | 98 e | |||
| 3,014 | 157,000 | c2575 | KC146576 | Lactobacillus helveticus | Fi | 100 f | |
| c4301 | KC146578 | Lactobacillus helveticus | Fi | 100 f | |||
| c1729 | KC146569 | Micrococcus luteus | Ac | 100 f | |||
| CULT E-5 | KC146583 | Cladosporium tenuissimum | As | 99 d | |||
| s3361 | KC146561 | Microcoleus vaginatus | Cy | 99 e | |||
| c1654 | KC146563 | Microcoleus vaginatus | Cy | 99 e | |||
| c552 | KC146564 | Uncultured bacterium | Cy | 99 e | |||
| c1812 | KC146565 | Uncultured bacterium | Cy | 99 e | |||
| c2330 | KC146567 | Uncultured bacterium | Fi | 99 e | |||
| c785 | KC146568 | Uncultured bacterium | Cy | 99 e | |||
| c3738 | KC146577 | Lactobacillus helveticus | Fi | 98 f | |||
| c833 | KC146573 | Lactobacillus helveticus | Fi | 98 e | |||
| c1018 | KC146574 | Lactobacillus helveticus | Fi | 98 f | |||
| GI855 | KC206493 | Penicillium chrysognum | As | 98 d | |||
| GI858 | KC206480 | Rhodotorula mucilacinosa | Ba | 98 d | |||
| c1826 | KC146566 | Uncultured bacterium | Fi | 98 e | |||
| c3135 | KC146552 | Uncultured cyanobacterium | Cy | 98 e | |||
| c3856 | KC146553 | Uncultured cyanobacterium | Cy | 98 e | |||
| s1137 | KC146575 | Lactobacillus helveticus | Fi | 97 e | |||
| c2005 | KC146570 | Micrococcus luteus | Ac | 97 e | |||
| c67 | KC146562 | Microcoleus vaginatus | Cy | 97 e | |||
| c3509 | KC146585 | Brevudimonas diminuta | Ap | 95 f | |||
| c3833 | KC146587 | Uncultured bacterium | Bp | 93 e | |||
| c2683 | KC146579 | Pseudomonas stutzeri | Gp | 91 f | |||
| c4709 | KC146572 | Bordetella petrii | Bp | 89 f | |||
| s3724 | KC146586 | Bordetella pertussis | Bp | 88 f | |||
| c2094 | KC146588 | Geobacillus sp. | Fi | 84 g | |||
| Vostok 5G | 316 | 10,500 | GI878 | Bacillus amyloliquifaciens | Fi | 100 e | |
| GI877 | Davidiella tassiana | As | 99 d | ||||
| 900 | 57,000 | None | ---------- | -- | ---------- | ||
| 1,529 | 105,000 | GI879 | Alternaria tenuissimum | As | 100 d | ||
| GI880 | Rhodotorula mucilacinosa | Ba | 99 d | ||||
| 2,149 | 157,000 | None | ---------- | -- | ---------- |
2.1.3. Metagenomic/metatranscriptomic Analyses
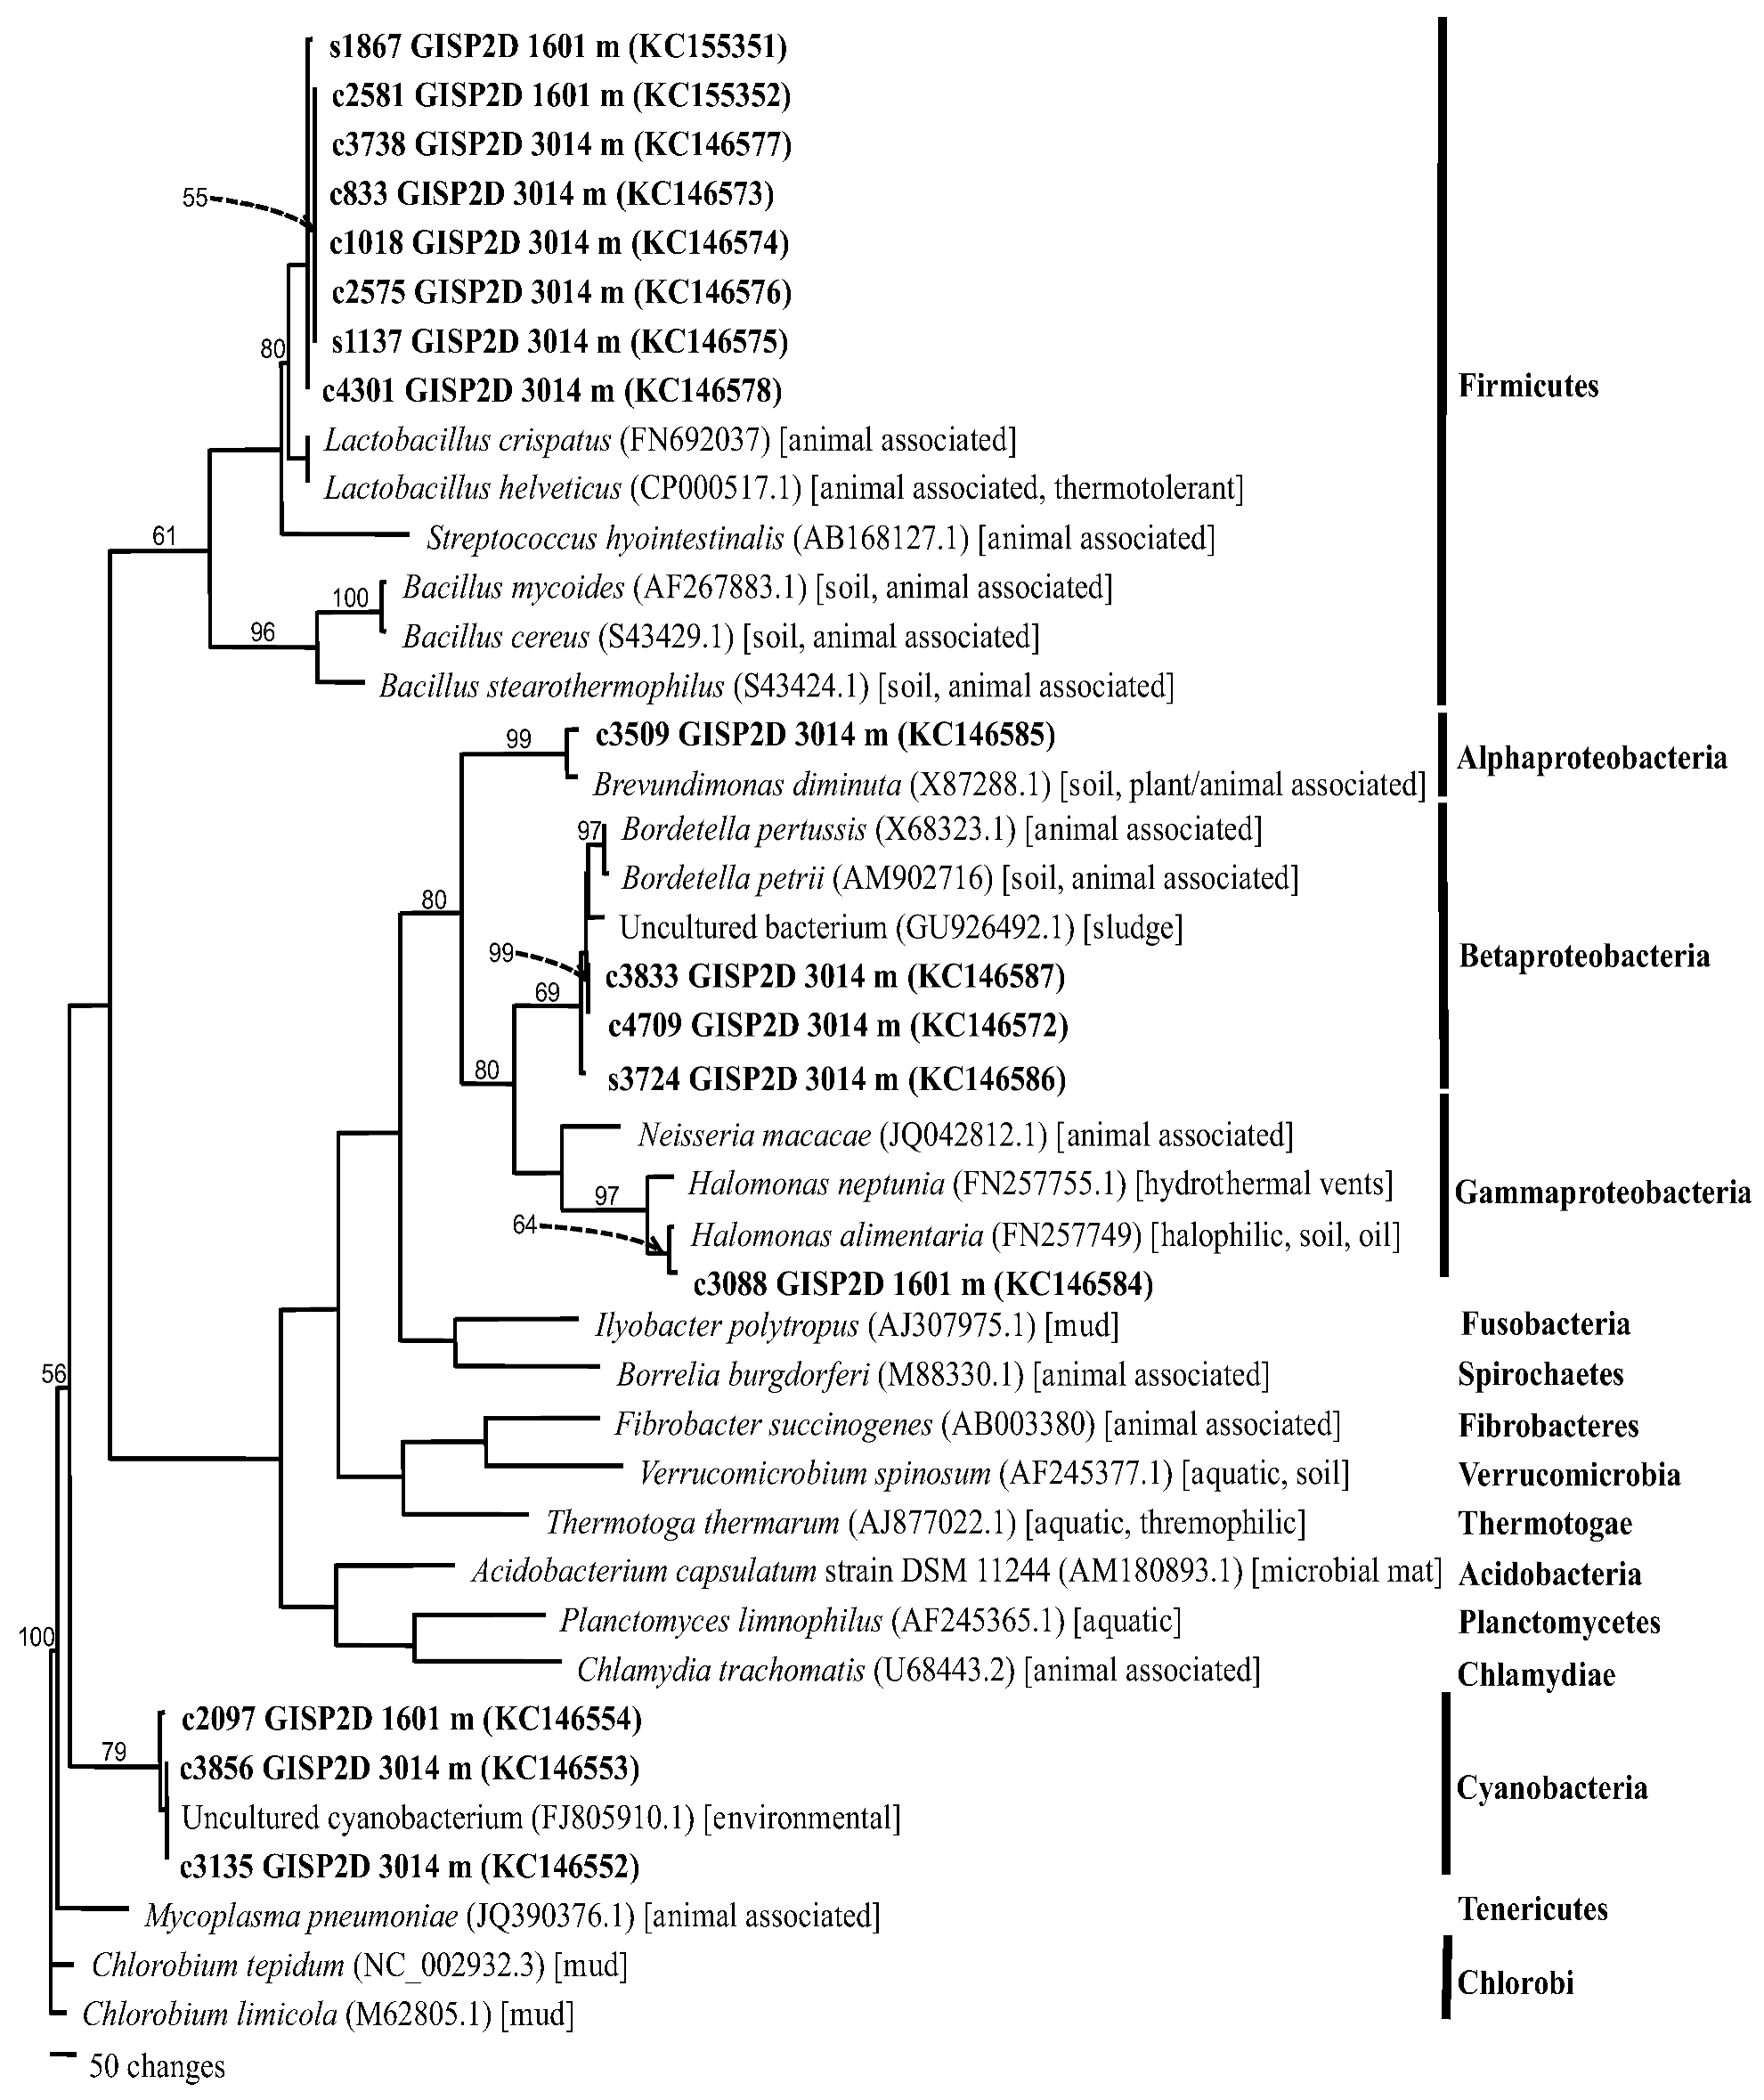
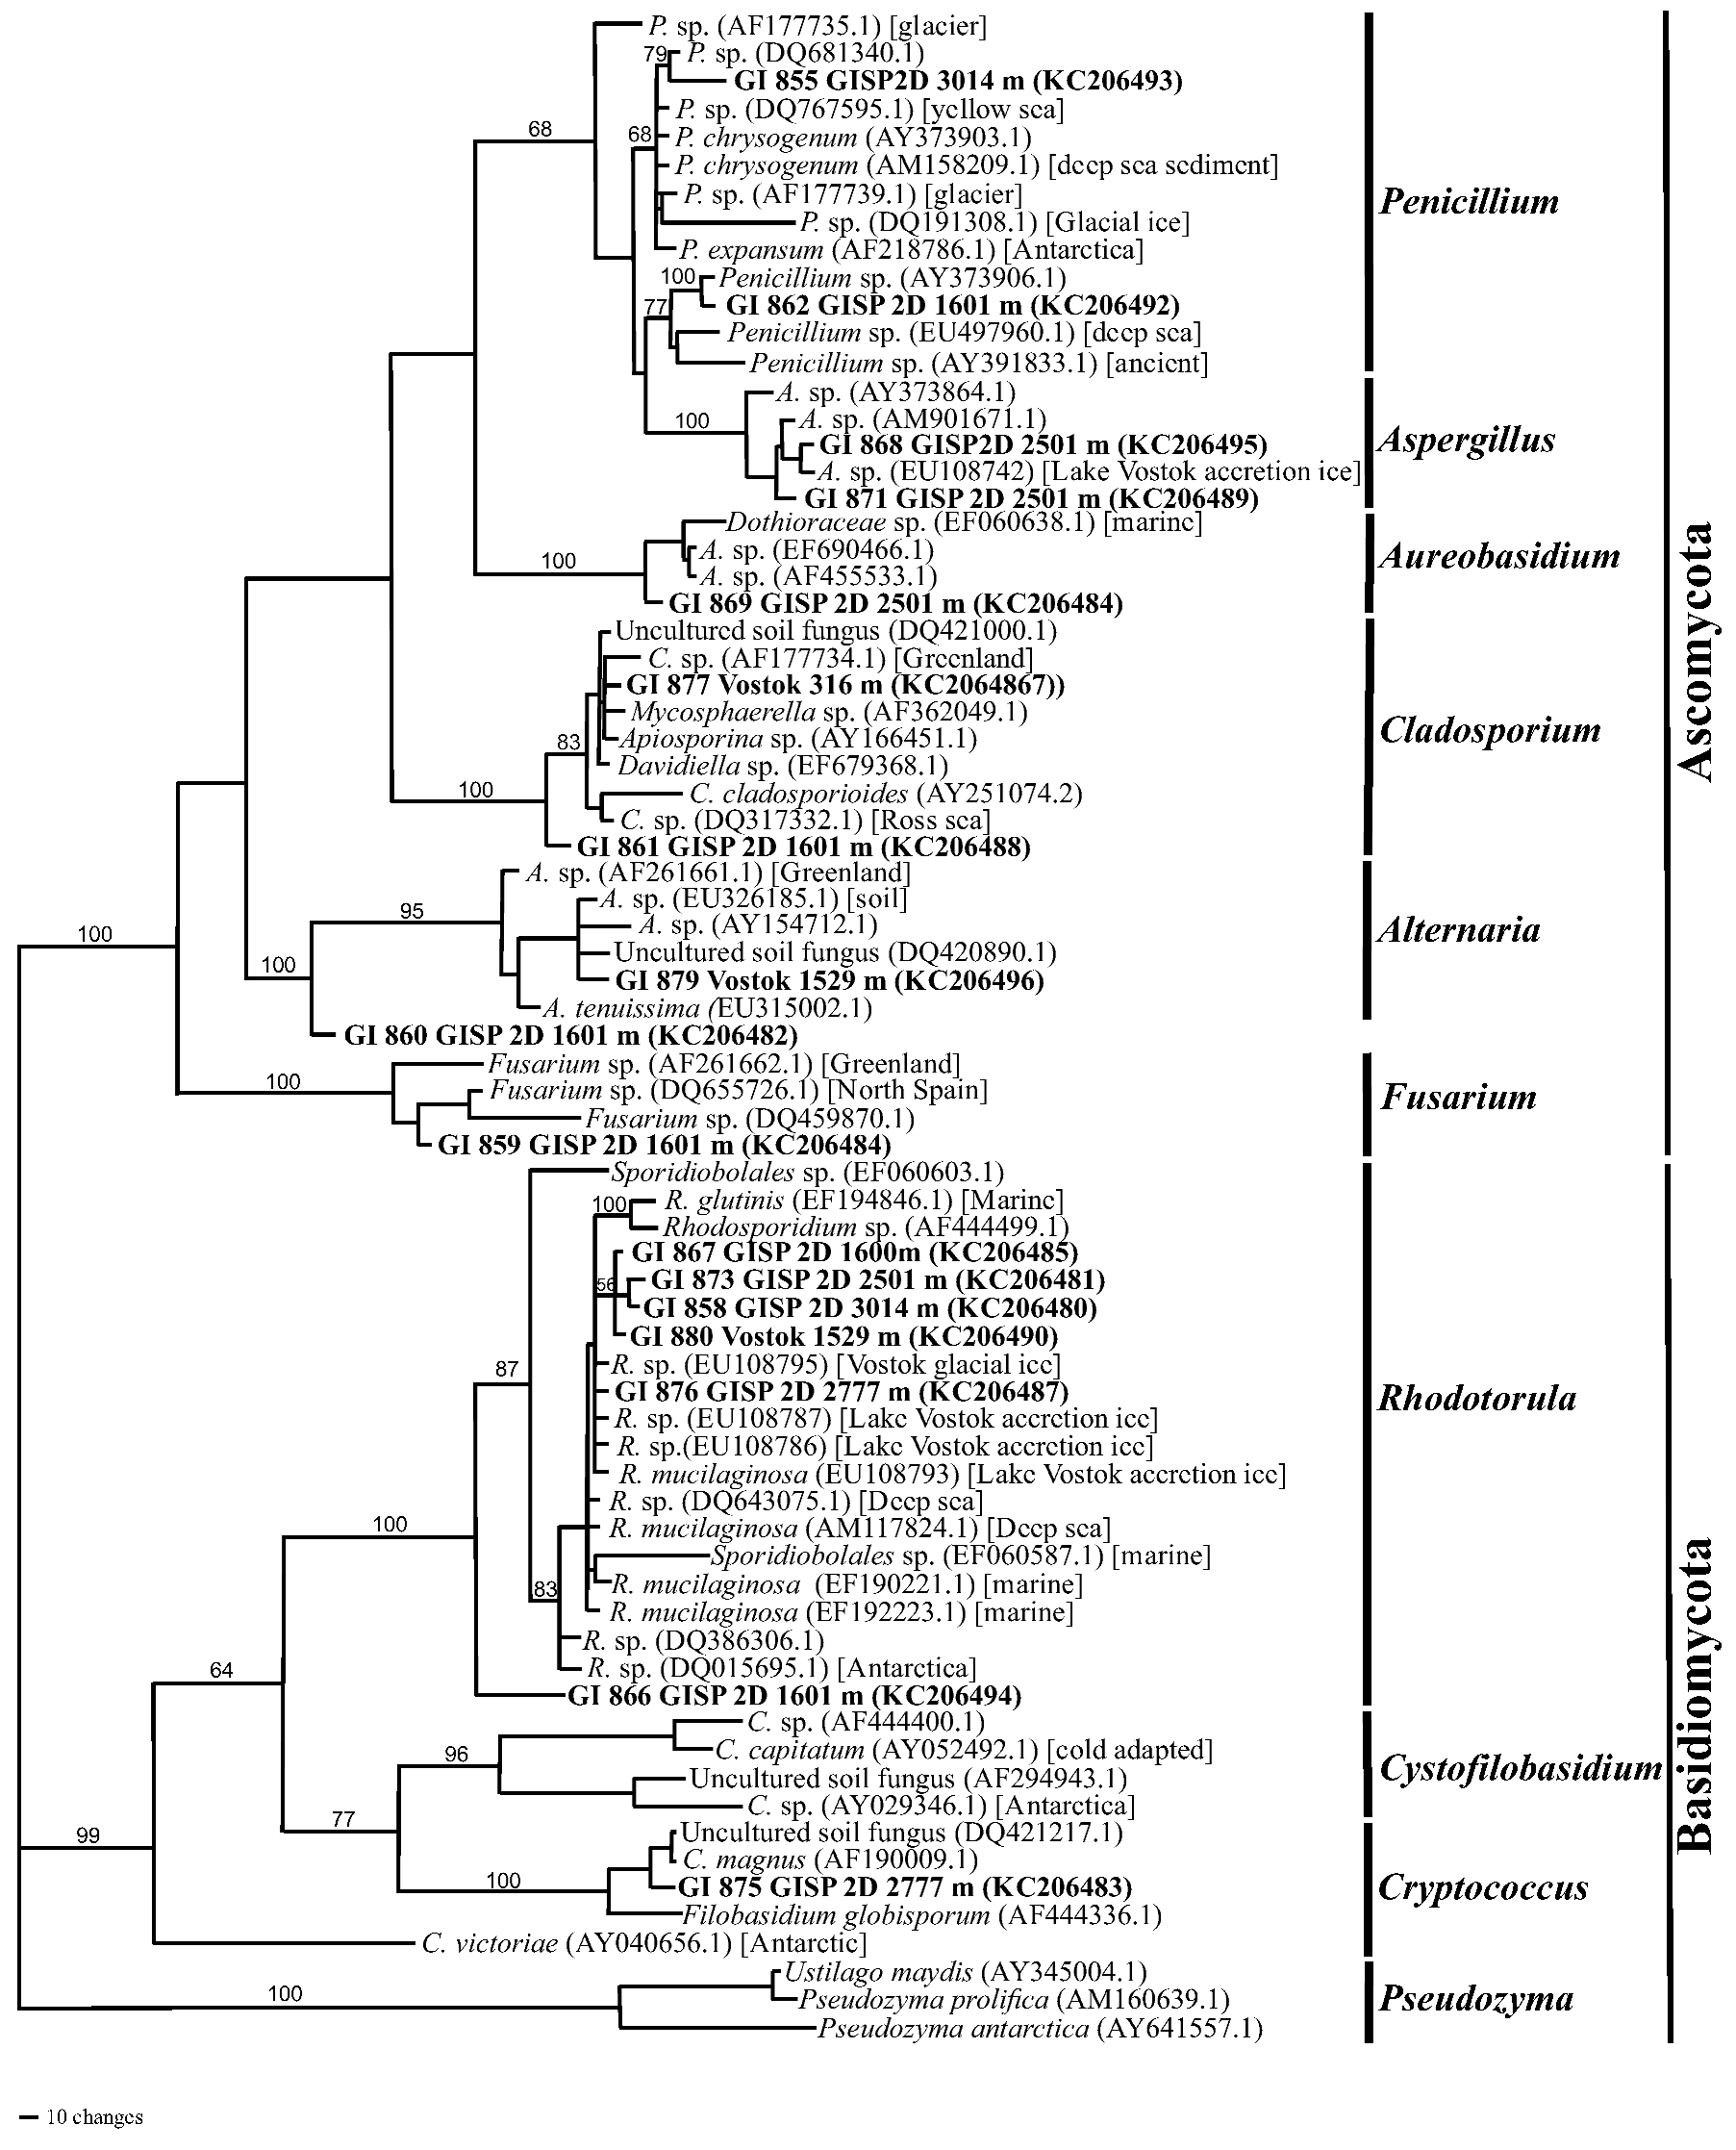
2.1.4. Phylogenetics
2.2. Discussion
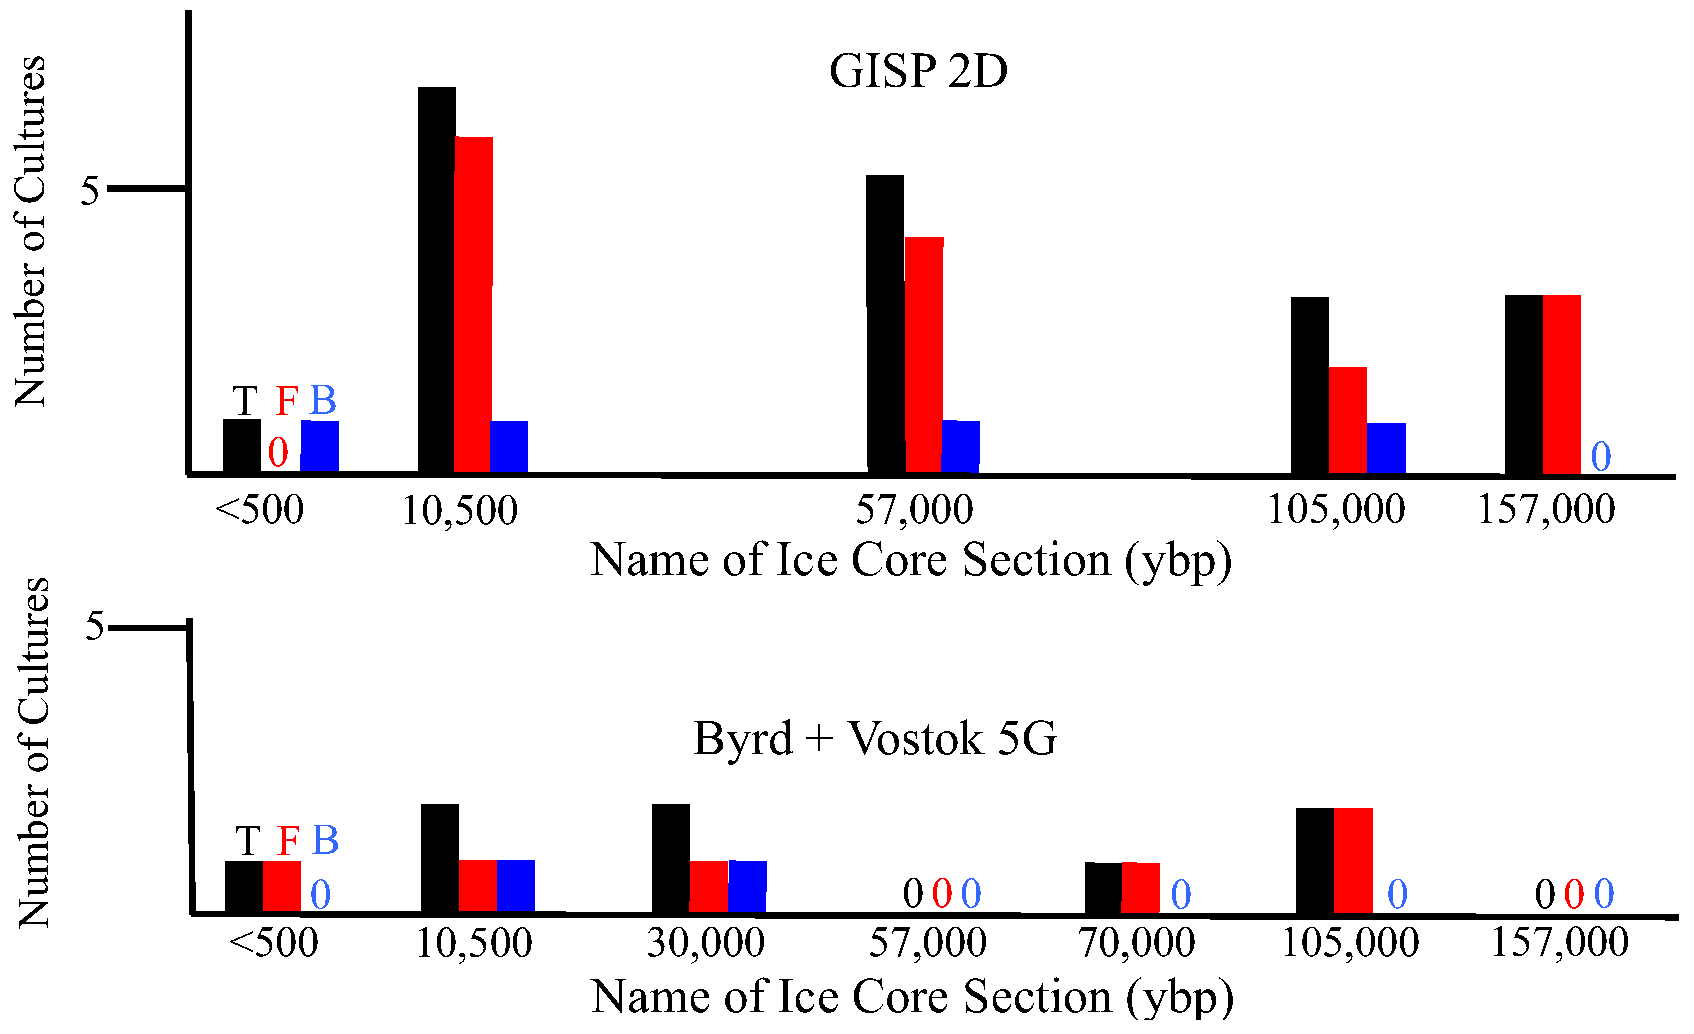
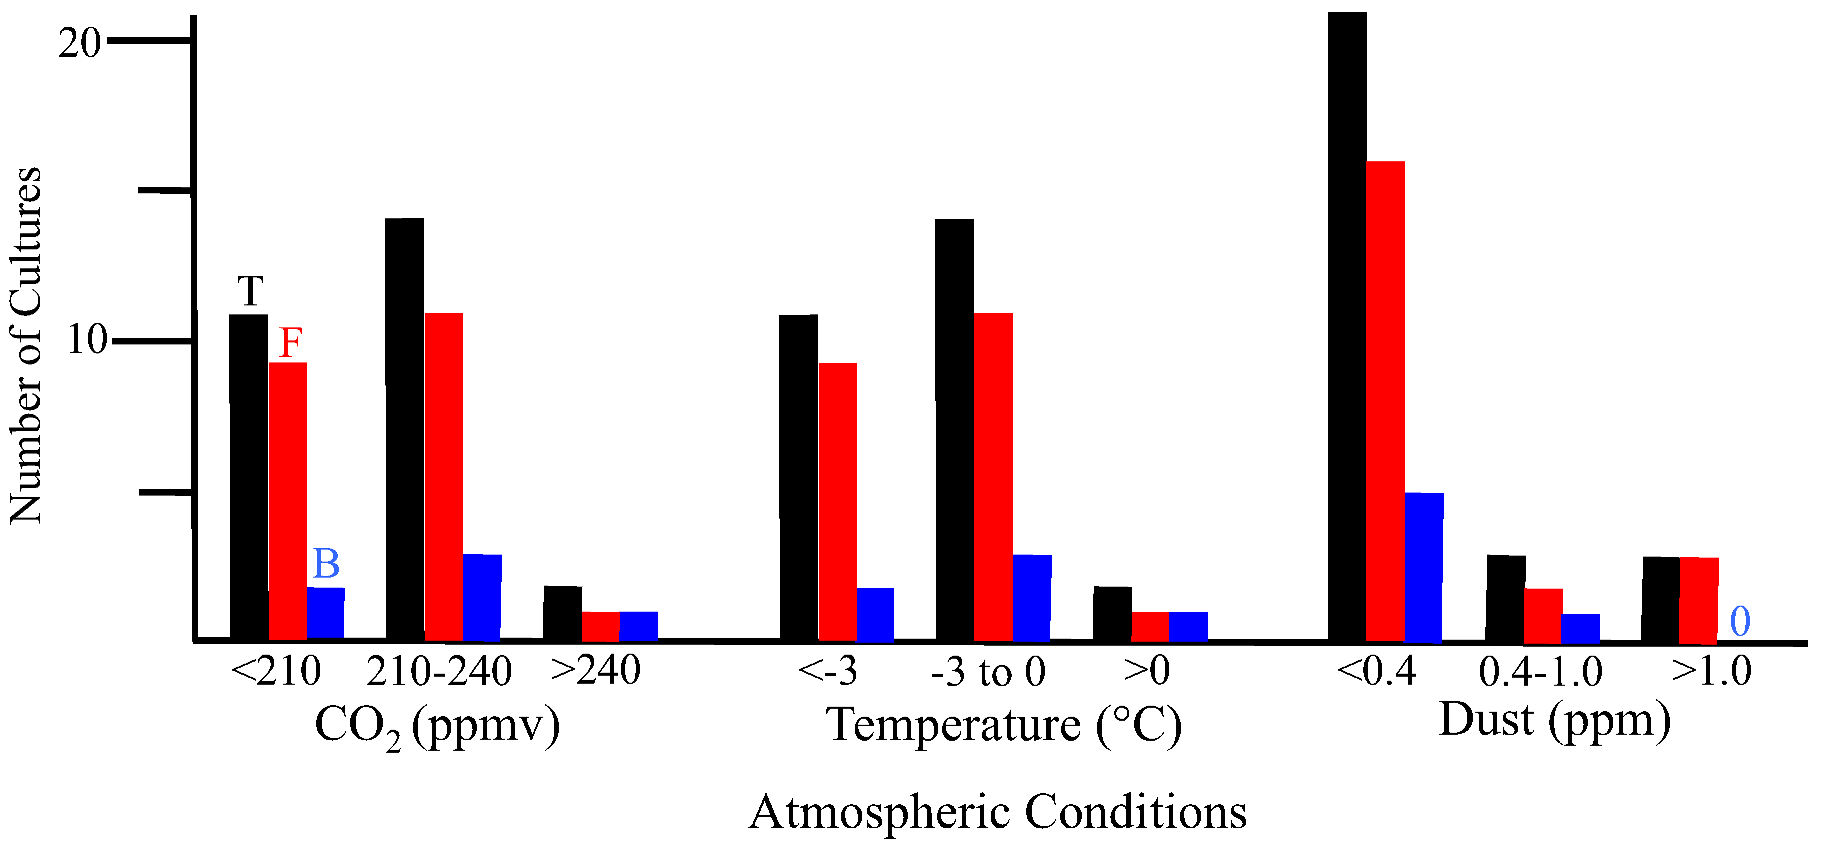
2.2.1. Atmospheric Conditions and Microbial Deposition
2.2.2. Isolated Fungi and Bacteria
2.2.3. Metagenomic/Metatranscriptomic Analysis
2.2.4. Global Mixing, Gene Flow and Genome Recycling
3. Experimental Section
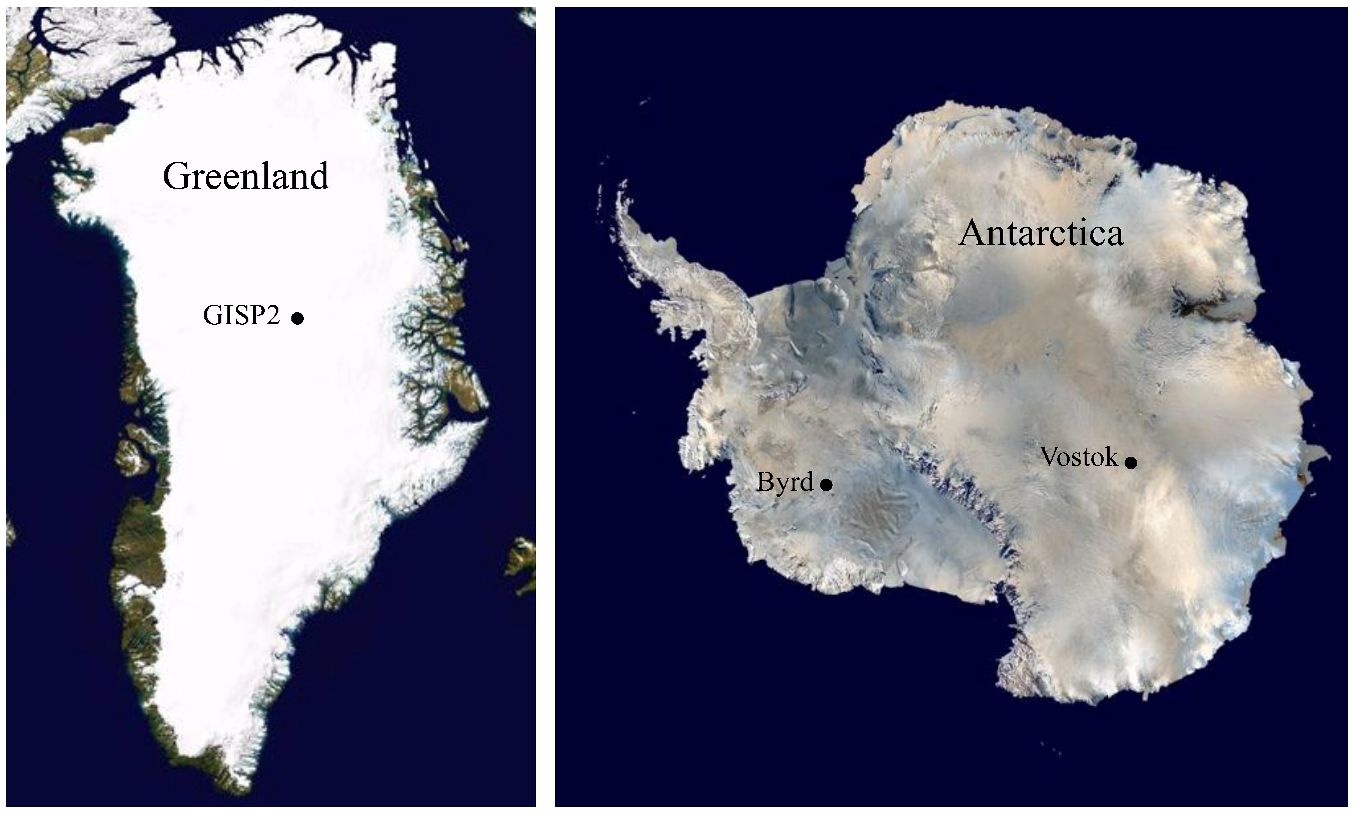
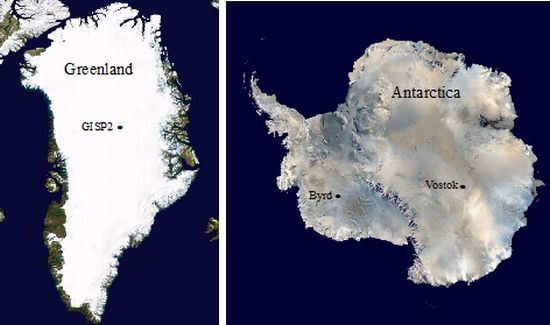
3.1. Ice Core Selection and Samples

3.2. Surface Sterilization and Melting
3.3. Scanning Electron Microscopy
3.4. Culturing
3.5. PCR Amplification
3.6. Cloning and Sequencing
3.7. Direct Sequencing of Cultures
3.8. Metagenomic/Metatranscriptomic Analyses
3.8.1. Ultracentrifugation
3.8.2. Isolation of Nucleic Acids
3.8.3. Preparation of Samples for Sequencing
3.8.4. Sequencing
3.8.5. Analysis of the Metagenomic/Metatranscriptomic Sequences
3.9. Phylogenetic Analysis for Fungal and Bacterial Sequences
4. Conclusions
Acknowledgments
References
- Abyzov, S.S.; Poglazova, M.N.; Mitskevich, J.N.; Ivanov, M.V. Common features of microorganisms in ancient layers of the Antarctic ice shee. In Life in Ancient Ice; Castello, J.D., Rogers, S.O., Eds.; Princeton University Press: Princeton, NJ, USA, 2005; pp. 240–250. [Google Scholar]
- Bell, R.; Studinger, M.; Tikku, A.; Castello, J.D. Comparative biological analyses of accretion ice from subglacial Lake Vostok. In Life in Ancient Ice; Castello, J.D., Rogers, S.O., Eds.; Princeton University Press: Princeton, NJ, USA, 2005; pp. 251–267. [Google Scholar]
- Castello, J.D.; Rogers, S.O.; Smith, J.E.; Starmer, W.T.; Zhao, Y. Plant and bacterial viruses in the Greenland ice shee. In Life in Ancient Ice; Castello, J.D., Rogers, S.O., Eds.; Princeton University Press: Princeton, NJ, USA, 2005; pp. 196–207. [Google Scholar]
- D’Elia, T.; Veerappaneni, R.; Rogers, S.O. Isolation of microbes from Lake Vostok accretion ice. Appl. Environ. Microb. 2008, 74, 4962–4965. [Google Scholar] [CrossRef]
- D’Elia, T.; Veerappaneni, R.; Theraisnathan, V.; Rogers, S.O. Isolation of fungi from Lake Vostok accretion ice. Mycologia 2009, 101, 751–763. [Google Scholar] [CrossRef]
- Kellogg, D.E.; Kellogg, T.B. Frozen in time: The diatom record in ice cores from remote drilling sites on the Antarctic ice sheets. In Life in Ancient Ice; Castello, J.D., Rogers, S.O., Eds.; Princeton University Press: Princeton, NJ, USA, 2005; pp. 69–93. [Google Scholar]
- Ma, L.J.; Catranis, C.; Starmer, W.T.; Rogers, S.O. Revival and characterization of fungi from ancient polar ice. Mycologist 1999, 13, 70–73. [Google Scholar] [CrossRef]
- Ma, L.J.; Rogers, S.O.; Catranis, C.; Starmer, W.T. Detection and characterization of ancient fungi entrapped in glacial ice. Mycologia 2000, 92, 286–295. [Google Scholar] [CrossRef]
- Ma, L.J.; Catranis, C.M.; Starmer, W.T.; Rogers, S.O. The significance and implications of the discovery of filamentous fungi in glacial ice. In Life in Ancient Ice; Castello, J.D., Rogers, S.O., Eds.; Princeton University Press: Princeton, NJ, USA, 2005; pp. 159–180. [Google Scholar]
- Nichols, D.S. The growth of prokaryotes in Antarctic sea ice: Implications for ancient ice communities. In Life in Ancient Ice; Castello, J.D., Rogers, S.O., Eds.; Princeton University Press: Princeton, NJ, USA, 2005; pp. 50–68. [Google Scholar]
- Rivkina, E.; Laurinavichyus, K.; Gilichinsky, D.A. Microbial life below the freezing point within permafrost. In Life in Ancient Ice; Castello, J.D., Rogers, S.O., Eds.; Princeton University Press: Princeton, NJ, USA, 2005; pp. 106–117. [Google Scholar]
- Starmer, W.T.; Fell, J.W.; Catranis, C.M.; Aberdeen, V.; Ma, L.J.; Zhou, S.; Rogers, S.O. Yeasts in the genus Rhodotorula recovered from the Greenland ice shee. In Life in Ancient Ice; Castello, J.D., Rogers, S.O., Eds.; Princeton University Press: Princeton, NJ, USA, 2005; pp. 181–195. [Google Scholar]
- Vishnivetskaya, T.A.; Erokhina, L.G.; Spirina, E.V.; Shatilovich, A.V.; Vorobyova, E.A.; Tsapin, A.I.; Gilichinsky, D.A. Viable phototrophs: Cyanobacteria and green algae from the permafrost darkness. In Life in Ancient Ice; Castello, J.D., Rogers, S.O., Eds.; Princeton University Press: Princeton, NJ, USA, 2005; pp. 140–158. [Google Scholar]
- Gilichinsky, D.A.; Khlebnikova, G.M.; Zvyagintsev, D.G.; Fedorov-Davydov, D.G.; Kudryavtseva, N.N. Microbiology of sedimentary materials in the permafrost zone. Int. Geol. Rev. 1989, 31, 847–858. [Google Scholar] [CrossRef]
- Gilichinsky, D.; Rivkina, E.; Bakermans, C.; Shcherbakova, V.; Petrovskaya, L.; Ozerskaya, S.; Ivanushkina, N.; Kochkina, G.; Laurinavichuis, K.; Pecheritsina, S.; et al. Biodiversity of cryopegs in permafrost. FEMS Microbiol. Ecol. 2005, 53, 117–128. [Google Scholar] [CrossRef]
- Abyzov, S.S. Microorganisms in Antarctic ice. In Antarctic Microbiology; Friedmann, E.I., Ed.; Princeton University Press: Princeton, NJ, USA, 1993; pp. 265–295. [Google Scholar]
- Gilichinsky, D.A.; Vorobyova, E.; Erokhina, L.G.; Fyordorov-Dayvdov, D.G.; Chaikovskaya, N.R. Long-term preservation of microbial ecosystems in permafrost. Adv. Space Res. 1992, 12, 255–263. [Google Scholar]
- Rogers, S.O.; Ma, L.J.; Zhao, Y.; Theraisnathan, V.; Shin, S.G.; Zhang, G.; Catranis, C.M.; Starmer, W.T.; Castello, J.D. Recommendations for elimination of contaminants and authentication of isolates in ancient ice cores. In Life in Ancient Ice; Castello, J.D., Rogers, S.O., Eds.; Princeton University Press: Princeton, NJ, USA, 2005; pp. 5–21. [Google Scholar]
- Willerslev, E.; Hansen, E.J.; Poinar, H.N. Isolation of nucleic acids and cultures from fossil ice and permafrost. Trends Ecol. Evol. 2004, 19, 141–147. [Google Scholar] [CrossRef]
- Bidle, K.J.; Lee, S.; Marchant, D.R.; Falkowski, P.G. Fossil genes and microbes in the oldest ice on Earth. Proc. Natl. Acad. Sci. USA 2007, 104, 13455–13460. [Google Scholar] [CrossRef]
- Lamb, H.H.; Woodroffe, A. Atmospheric circulation during the last ice age. Quat. Res. 1970, 1, 29–58. [Google Scholar] [CrossRef]
- Lüthi, D.; Floch, M.L.; Bereiter, B.; Blunier, T.; Barnola, J.M.; Siegenthaler, U.; Raynaud, D.; Jouzel, J.; Fischer, H.; Kawamura, K.; et al. High-resolution carbon dioxide concentration record 650,000-800,000 years before present. Nature 2008, 453, 379–382. [Google Scholar] [CrossRef] [Green Version]
- Petit, J.R.; Jouzel, J.; Raynaud, D.; Barkov, N.I.; Barnola, J.M.; Basile, I.; Bender, M.; Chappellaz, J.; Davis, M.; Delaygue, G.; et al. Climate and atmospheric history of the past 420,000 years from the Vostok ice core, Antarctica. Nature 1999, 399, 429–436. [Google Scholar] [CrossRef]
- Ahn, J.; Brook, E. Atmospheric CO2 and climate on millennial time scales during the last glacial period. Science 2008, 322, 83–85. [Google Scholar] [CrossRef]
- Fischer, H.; Siggaard-Andersen, M.; Ruth, U.; Röthlisberger, R.; Wolff, E. Glacial/interglacial changes in mineral dust and sea-salt records in polar ice cores: Sources, transport, and deposition. Rev. Geophys. 2007, 45, 1–26. [Google Scholar]
- Suwa, M.; Fischer, J.C.; Bender, M.L.; Landais, A.; Brook, E.J. Chronology reconstruction for the disturbed bottom section of the GISP2 and the GRIP ice cores: Implications for termination II in Greenland. J. Geophys. Res. 2006, 111, D02101. [Google Scholar] [CrossRef]
- Glikson, A. Milestones in the evolution of the atmosphere with reference to climate change. Aust. J. Earth Sci. 2008, 55, 125–139. [Google Scholar] [CrossRef]
- Miteva, V.I.; Sheridan, P.P.; Brenchley, J.E. Phylogenetic and physiological diversity of microorganisms isolated from a deep Greenland ice core. Appl. Environ. Microb. 2004, 70, 202–213. [Google Scholar] [CrossRef]
- Loveland-Curtze, J.; Miteva, V.I.; Brenchley, J.E. Herminiimonas glaciei sp. nov., a novel ultramicrobacterium from 3,042 m deep Greenland glacial ice. Int. J. Syst. Evol. Microbiol. 2009, 59, 1272–1277. [Google Scholar] [CrossRef]
- Swofford, D. PAUP: Phylogenetic Analysis Using Parsimony, Version 4.0b2a (PPC); Sinauer and Associates: Sunderland, MA, USA, 1999. [Google Scholar]
- Amato, P.; Parazols, M.; Sancelme, M.; Laj, P.; Mailhot, G.; Delort, A. Microorganisms isolated from the water phase of troposphericclouds at the Puy de Dôme: Major groups and growth abilitiesat low temperatures. FEMS Microbiol. Ecol. 2007, 59, 242–254. [Google Scholar] [CrossRef]
- Zachos, J.; Pagani, M.; Sloan, L.; Thomas, E.; Billups, K. Trends, rhythms, and aberrations in global climate change 65 Ma to present. Science 2001, 292, 686–693. [Google Scholar] [CrossRef]
- Utescher, T.; Bruch, A.A.; Micheels, A.; Mosbrugger, V.; Popova, S. Cenozoic climate gradients in Eurasia—A paleo-perspective on future climate change? Paleogeog. Paleoclim. Paleoecol. 2011, 304, 351–358. [Google Scholar] [CrossRef]
- Willerslev, E.; Cappellini, E.; Boomsma, W.; Nielsen, R.; Hebsgaard, M.B.; Brand, T.B.; Hofreiter, M.; Bunce, M.; Poinar, H.N.; Dahl-Jensen, D.; et al. Ancient biomolecules from deep ice cores reveal a forested southern Greenland. Science 2007, 317, 111–114. [Google Scholar] [CrossRef]
- Vincent, W.F. Evolutionary origins of Antarctic microbiota: Invasion, selection and endemism. Antarct. Sci. 2000, 12, 374–385. [Google Scholar]
- Franzmann, P.D. Examination of Antarctic prokaryotic diversity through molecular comparisons. Biodivers. Conserv. 1996, 5, 1295–1305. [Google Scholar] [CrossRef]
- Marshall, W.A. Seasonality in Antarctic airborne fungal spores. Appl. Environ. Microb. 1997, 63, 2240–2245. [Google Scholar]
- Sonjak, S.; Frisvad, J.C.; Gunde-Cimerman, N. Penicillium mycobiota in arctic subglacial ice. Microb. Ecol. 2006, 52, 207–216. [Google Scholar] [CrossRef]
- Tosi, S.; Casado, B.; Gerdol, R.; Caretta, G. Fungi isolated from Antarctic mosses. Polar Biol. 2002, 25, 262–268. [Google Scholar]
- Starkenburg, S.R.; Reitenga, K.G.; Freitas, T.; Johnson, S.; Chain, P.S.G.; Garcia-Pichel, F.; Kuske, C.R. Genome of the Cyanobacterium Microcoleus vaginatus FGP-2, a photosynthetic ecosystem engineer of arid land soil biocrusts worldwide. J. Bacteriol. 2011, 193, 4569–4570. [Google Scholar] [CrossRef]
- Belnap, J.; Gardner, J.S. Soil microstructure in soils of theColorado plateau: The role of the cyanobacterium Microcoleus vaginatus. Great Basin Nat. 1993, 53, 40–47. [Google Scholar]
- Boyer, S.L.; Johansen, J.R.; Flechtner, V.R.; Howard, G.L. Phylogeny and genetic variance in terrestrial Microcoleus species based on the sequence analysis of the 16S rRNA gene and associated 16S-23S ITS region. J. Phycol. 2002, 38, 1222–1235. [Google Scholar] [CrossRef]
- Goodrich, R.P.; Handel, T.M.; Baldeschwieler, J.D. Modification of lipid phase behaviour with membrane-bound cryoprotectants. Biochim. Biophys. Acta 1998, 938, 143–154. [Google Scholar]
- Snider, C.S.; Hsiang, T.; Zhao, G.; Griffith, M. Role of ice nucleation and antifreeze activities in pathogenesis and growth of snow molds. Phytopathology 2000, 90, 354–361. [Google Scholar] [CrossRef]
- Shtarkman, Y.M.; Koçer, Z.A.; Edgar, R.; Veerapaneni, R.; D’Elia, T.; Morris, P.F.; Rogers, S.O. Subglacial Lake Vostok (Antarctica) accretion ice contains a diverse set of sequences from aquatic and marine Bacteria and Eukarya. PLoS One 2012, in press. [Google Scholar]
- Simon, C.; Wiezer, A.; Strittmatter, A.W.; Daniel, R. Phylogenetic diversity and metabolic potential revealed in a glacier ice metagenome. Appl. Environ. Microb. 2009, 75, 7519–7526. [Google Scholar] [CrossRef]
- Miteva, V.; Teacher, C.; Sowers, T.; Brenchley, J. Comparison of the microbial diversity at different depths of the GISP2 Greenland ice core in relationship to deposition climates. Environ. Microbiol. 2009, 11, 640–656. [Google Scholar] [CrossRef]
- Christner, B.C.; Mosley-Thompson, E.; Thompson, L.G.; Reeve, J.N. Classification of bacteria from polar and nonpolar glacial ice. In Life in Ancient Ice; Castello, J.D., Rogers, S.O., Eds.; Princeton University Press: Princeton, NJ, USA, 2005; pp. 227–239. [Google Scholar]
- Rogers, S.O.; Starmer, W.T.; Castello, J.D. Recycling of pathogenic microbes through survival in ice. Med. Hypotheses 2004, 63, 773–777. [Google Scholar] [CrossRef]
- Smith, A.W.; Skilling, D.E.; Castello, J.D.; Rogers, S.O. Ice as a reservoir for pathogenic human viruses: Specifically, caliciviruses, influenza viruses, and enterovirus. Med. Hypotheses 2004, 63, 560–566. [Google Scholar] [CrossRef]
- Hamer, C.U.; Clausen, H.B.; Langway, C.C. Electrical conductivity method (ECM) stratigraphic dating of the Byrd Station ice core, Antarctica. Ann. Glaciol. 1994, 20, 115–120. [Google Scholar] [CrossRef]
- Rogers, S.O.; Theraisnathan, V.; Ma, L.J.; Zhao, Y.; Zhang, G.; Shin, S.G.; Castello, J.D.; Starmer, W.T. Comparisons of protocols for decontamination of environmental ice samples for biological and molecular examinations. Appl. Environ. Microb. 2004, 70, 2540–2544. [Google Scholar] [CrossRef]
- Rogers, S.O.; Bendich, A.J. Extraction of DNA from milligram amounts of fresh, herbarium and mummified plant tissues. Plant Mol. Biol. 1985, 5, 69–76. [Google Scholar] [CrossRef]
- Rogers, S.O.; Bendich, A.J. Extraction of total cellular DNA from plants, algae and fungi. In Plant Molecular Biology Manual, 2nd; Gelvin, S.B., Schilperoort, R.A., Eds.; Kluwer Academic Press: Dordrecht, The Netherlands, 1994; pp. D1–1. [Google Scholar]
- Rogers, S.O.; Rehner, S.; Bledsoe, C.; Mueller, G.J.; Ammirati, J.F. Extraction of DNA from Basidiomycetes for ribosomal DNA hybridizations. Can. J. Bot. 1989, 67, 1235–1243. [Google Scholar]
- White, T.J.; Bruns, T.; Lee, S.; Taylor, J. Amplification and direct sequencing of fungal ribosomal RNA genes for phylogenteics. In PCR Protocols, a Guide to Methods and Applications; Innis, M.A., Gelfand, D.H., Sninsky, J.J., White, T.J., Eds.; Academic Press, Inc. Harcourt Brace Janovich Publishers: New York, NY, USA, 1990; pp. 315–322. [Google Scholar]
- Kabadjova, P.; Dousset, X.; Le Cam, V.; Prevost, H. Differentiation of closely related Carnobacterium food isolates based on 16S-23S ribosomal DNA intergenic spacer region polymorphism. Appl. Environ. Microb. 2002, 68, 358–366. [Google Scholar]
- Katoh, K.; Misawa, K.; Kuma, K.; Miyata, T. MAFFT: A novel method for rapid multiple sequence alignment based on fast Fourier transform. Nucleic Acids Res. 2002, 30, 3059–3066. [Google Scholar] [CrossRef]
- Katoh, K.; Kuma, K.; Toh, H.; Miyata, T. MAFFT version 5: Improvement in accuracy of multiple sequence alignment. Nucleic Acids Res. 2005, 33, 511–518. [Google Scholar] [CrossRef]
- Chevreux, B.; Wetter, T.; Suhai, S. Genome Sequence Assembly Using Trace Signals and Additional Sequence Information. Comput. Sci. Biol. Proc. German Conf. Bioinform. 1999, 99, 45–56. [Google Scholar]
- MAFFT Version 7. Multiple Alignment Program for Amino Acid or Nucleotide Sequences. Available online: http://mafft.cbrc.jp/alignment/software/ (accessed on 25 August 2011).
- Gouy, M.; Guindon, S.; Gascuel, O. SeaView version 4: A multiplatform graphical user interface for sequence alignment and phylogenetic tree building. Mol. Biol. Evol. 2010, 27, 221–224. [Google Scholar]
- SeaView, at the Université Lyon, Villeurbanne, France. Available online: http://pbil.univ-lyon1.fr/software/seaview.html/ (accessed 8 October 2011).
© 2013 by the authors; licensee MDPI, Basel, Switzerland. This article is an open access article distributed under the terms and conditions of the Creative Commons Attribution license (http://creativecommons.org/licenses/by/3.0/).
Share and Cite
Knowlton, C.; Veerapaneni, R.; D'Elia, T.; Rogers, S.O. Microbial Analyses of Ancient Ice Core Sections from Greenland and Antarctica. Biology 2013, 2, 206-232. https://doi.org/10.3390/biology2010206
Knowlton C, Veerapaneni R, D'Elia T, Rogers SO. Microbial Analyses of Ancient Ice Core Sections from Greenland and Antarctica. Biology. 2013; 2(1):206-232. https://doi.org/10.3390/biology2010206
Chicago/Turabian StyleKnowlton, Caitlin, Ram Veerapaneni, Tom D'Elia, and Scott O. Rogers. 2013. "Microbial Analyses of Ancient Ice Core Sections from Greenland and Antarctica" Biology 2, no. 1: 206-232. https://doi.org/10.3390/biology2010206