Effects of Moringa oleifera Leaves Extract on High Glucose-Induced Metabolic Changes in HepG2 Cells

 , and
, and 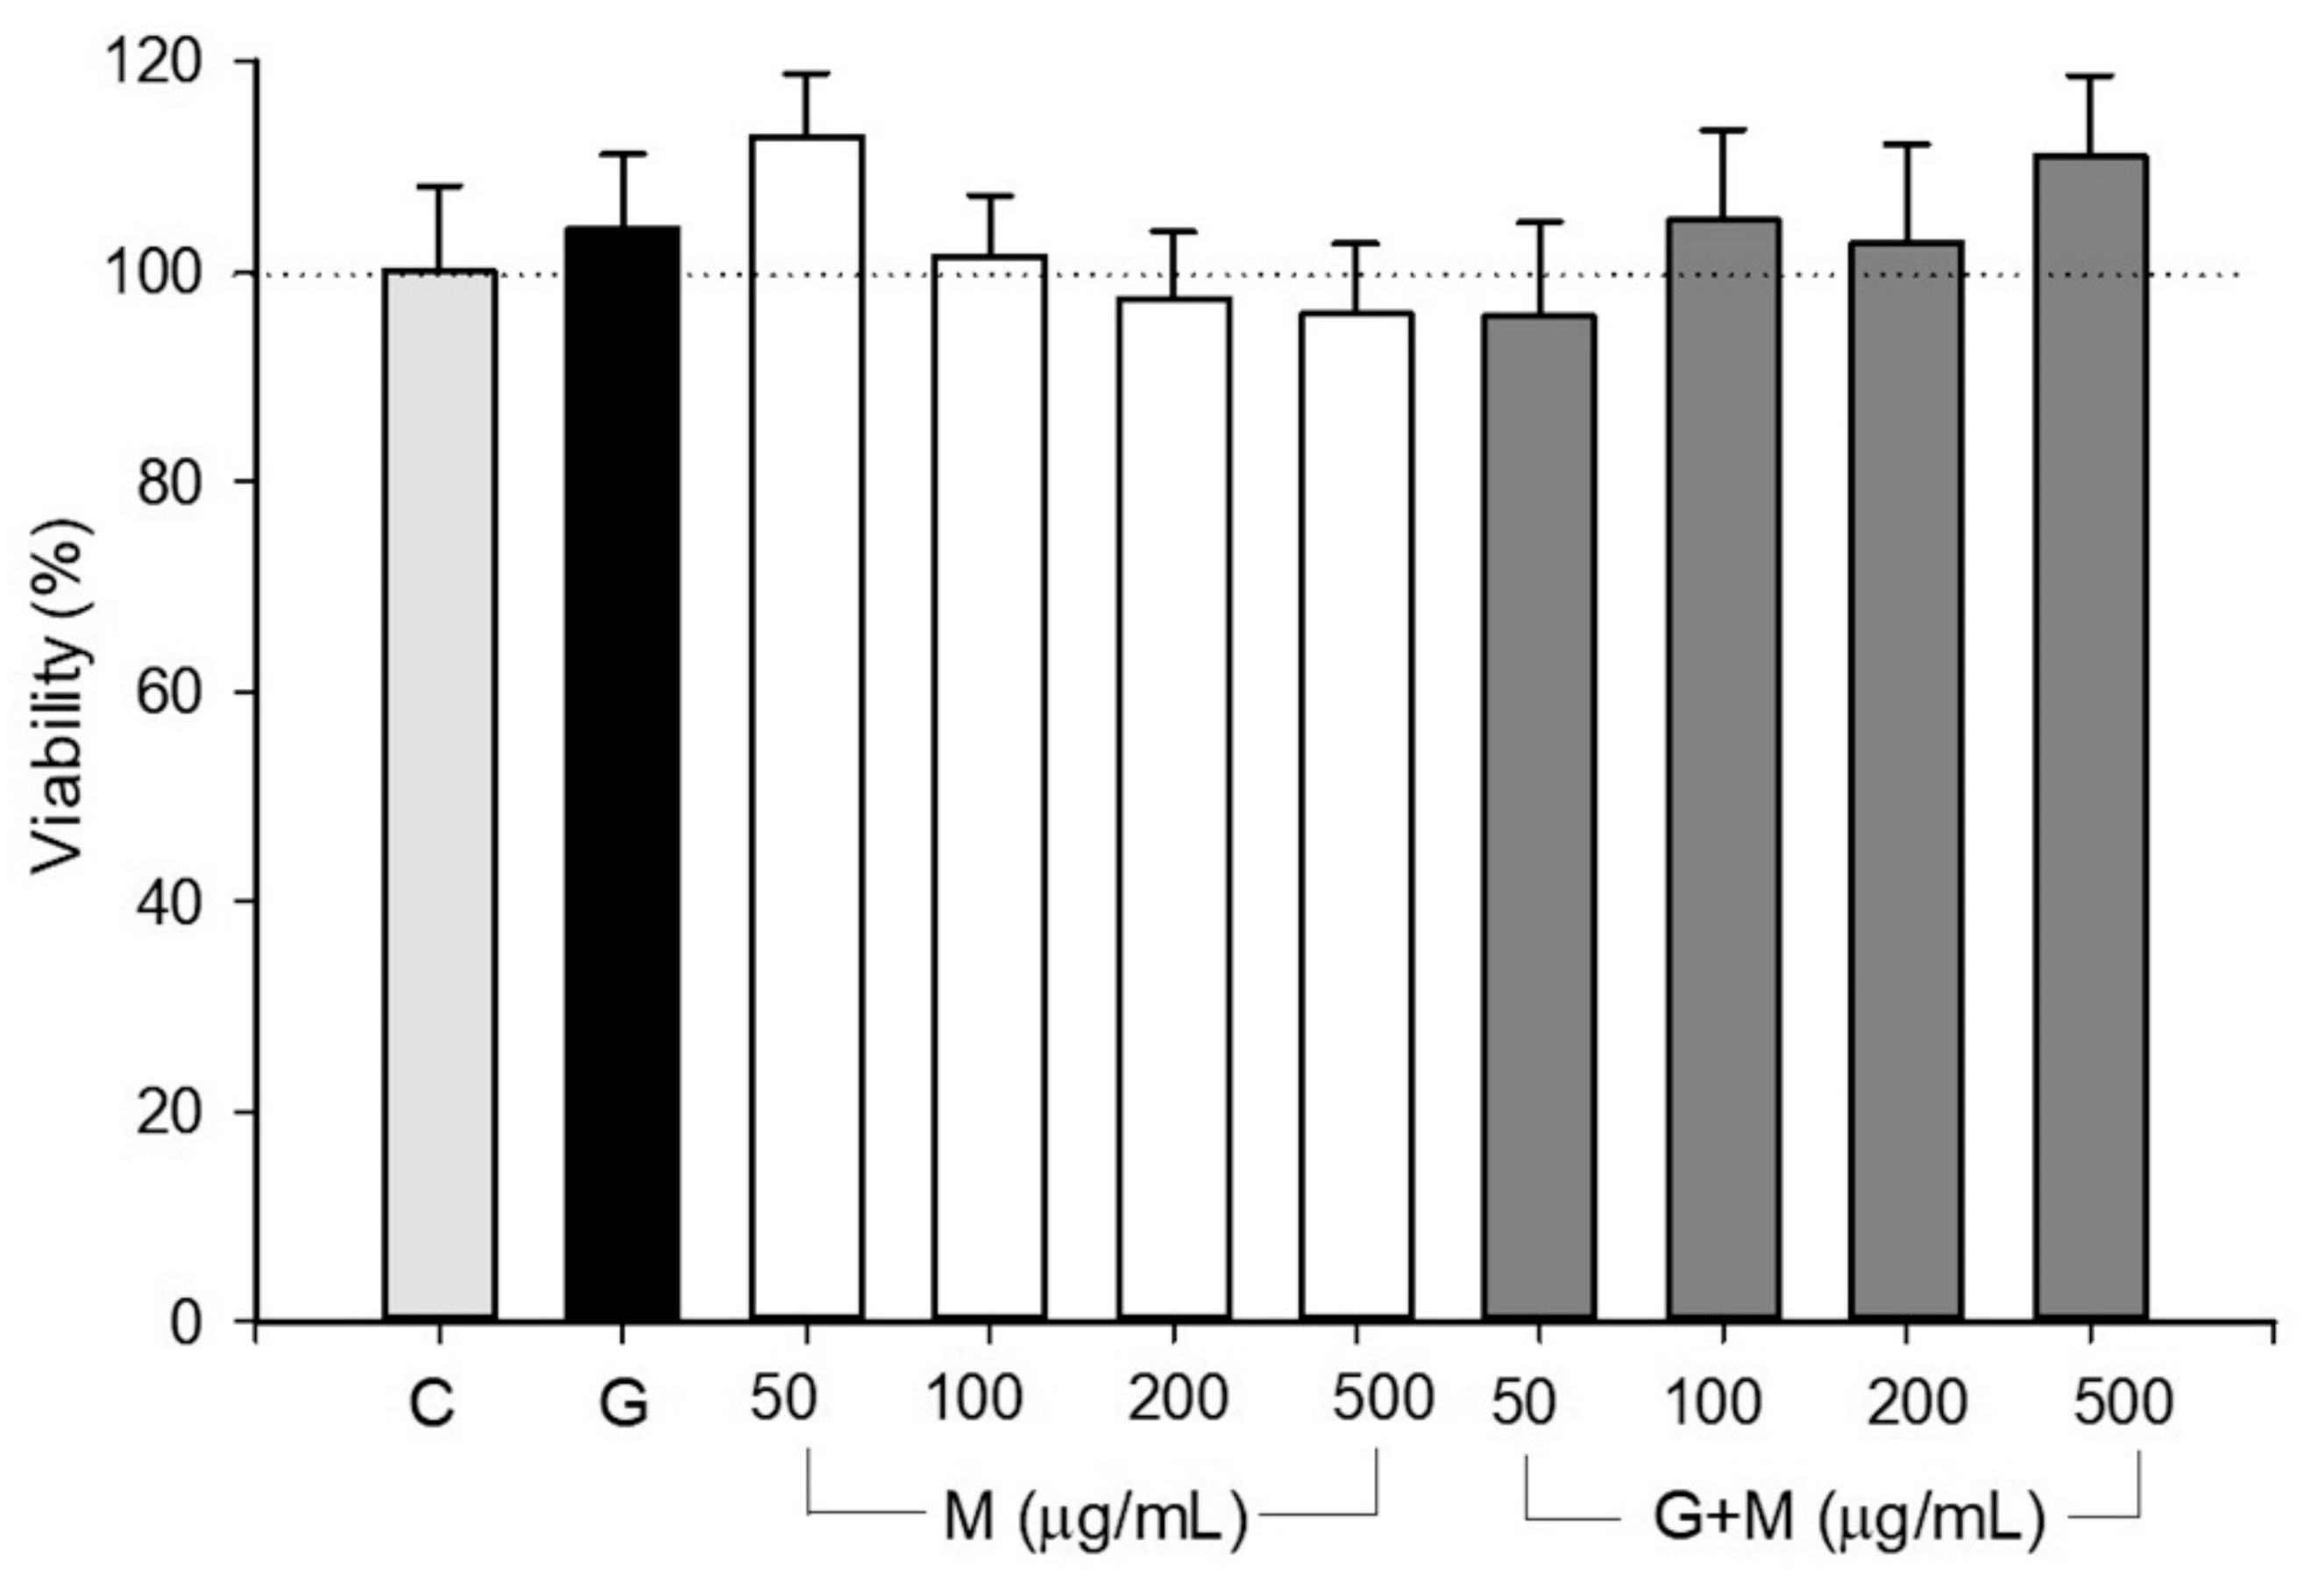
Abstract
:1. Introduction
2. Materials and Methods
2.1. Reagents
2.2. Moringa oleifera Extract Preparation
2.3. Cell Culture
2.4. Mitochondrial Isolation
2.5. Viability Assay
2.6. Oxygen Consumption Rate
2.7. Measurement of Reactive Oxygen Species Levels
2.8. SDS-PAGE and Western Blot Analysis
2.9. BN-PAGE
2.10. In-Gel CI and CIV Activities
2.11. Statistical Analysis
3. Results
3.1. Toxicity of the Extract and High Glucose
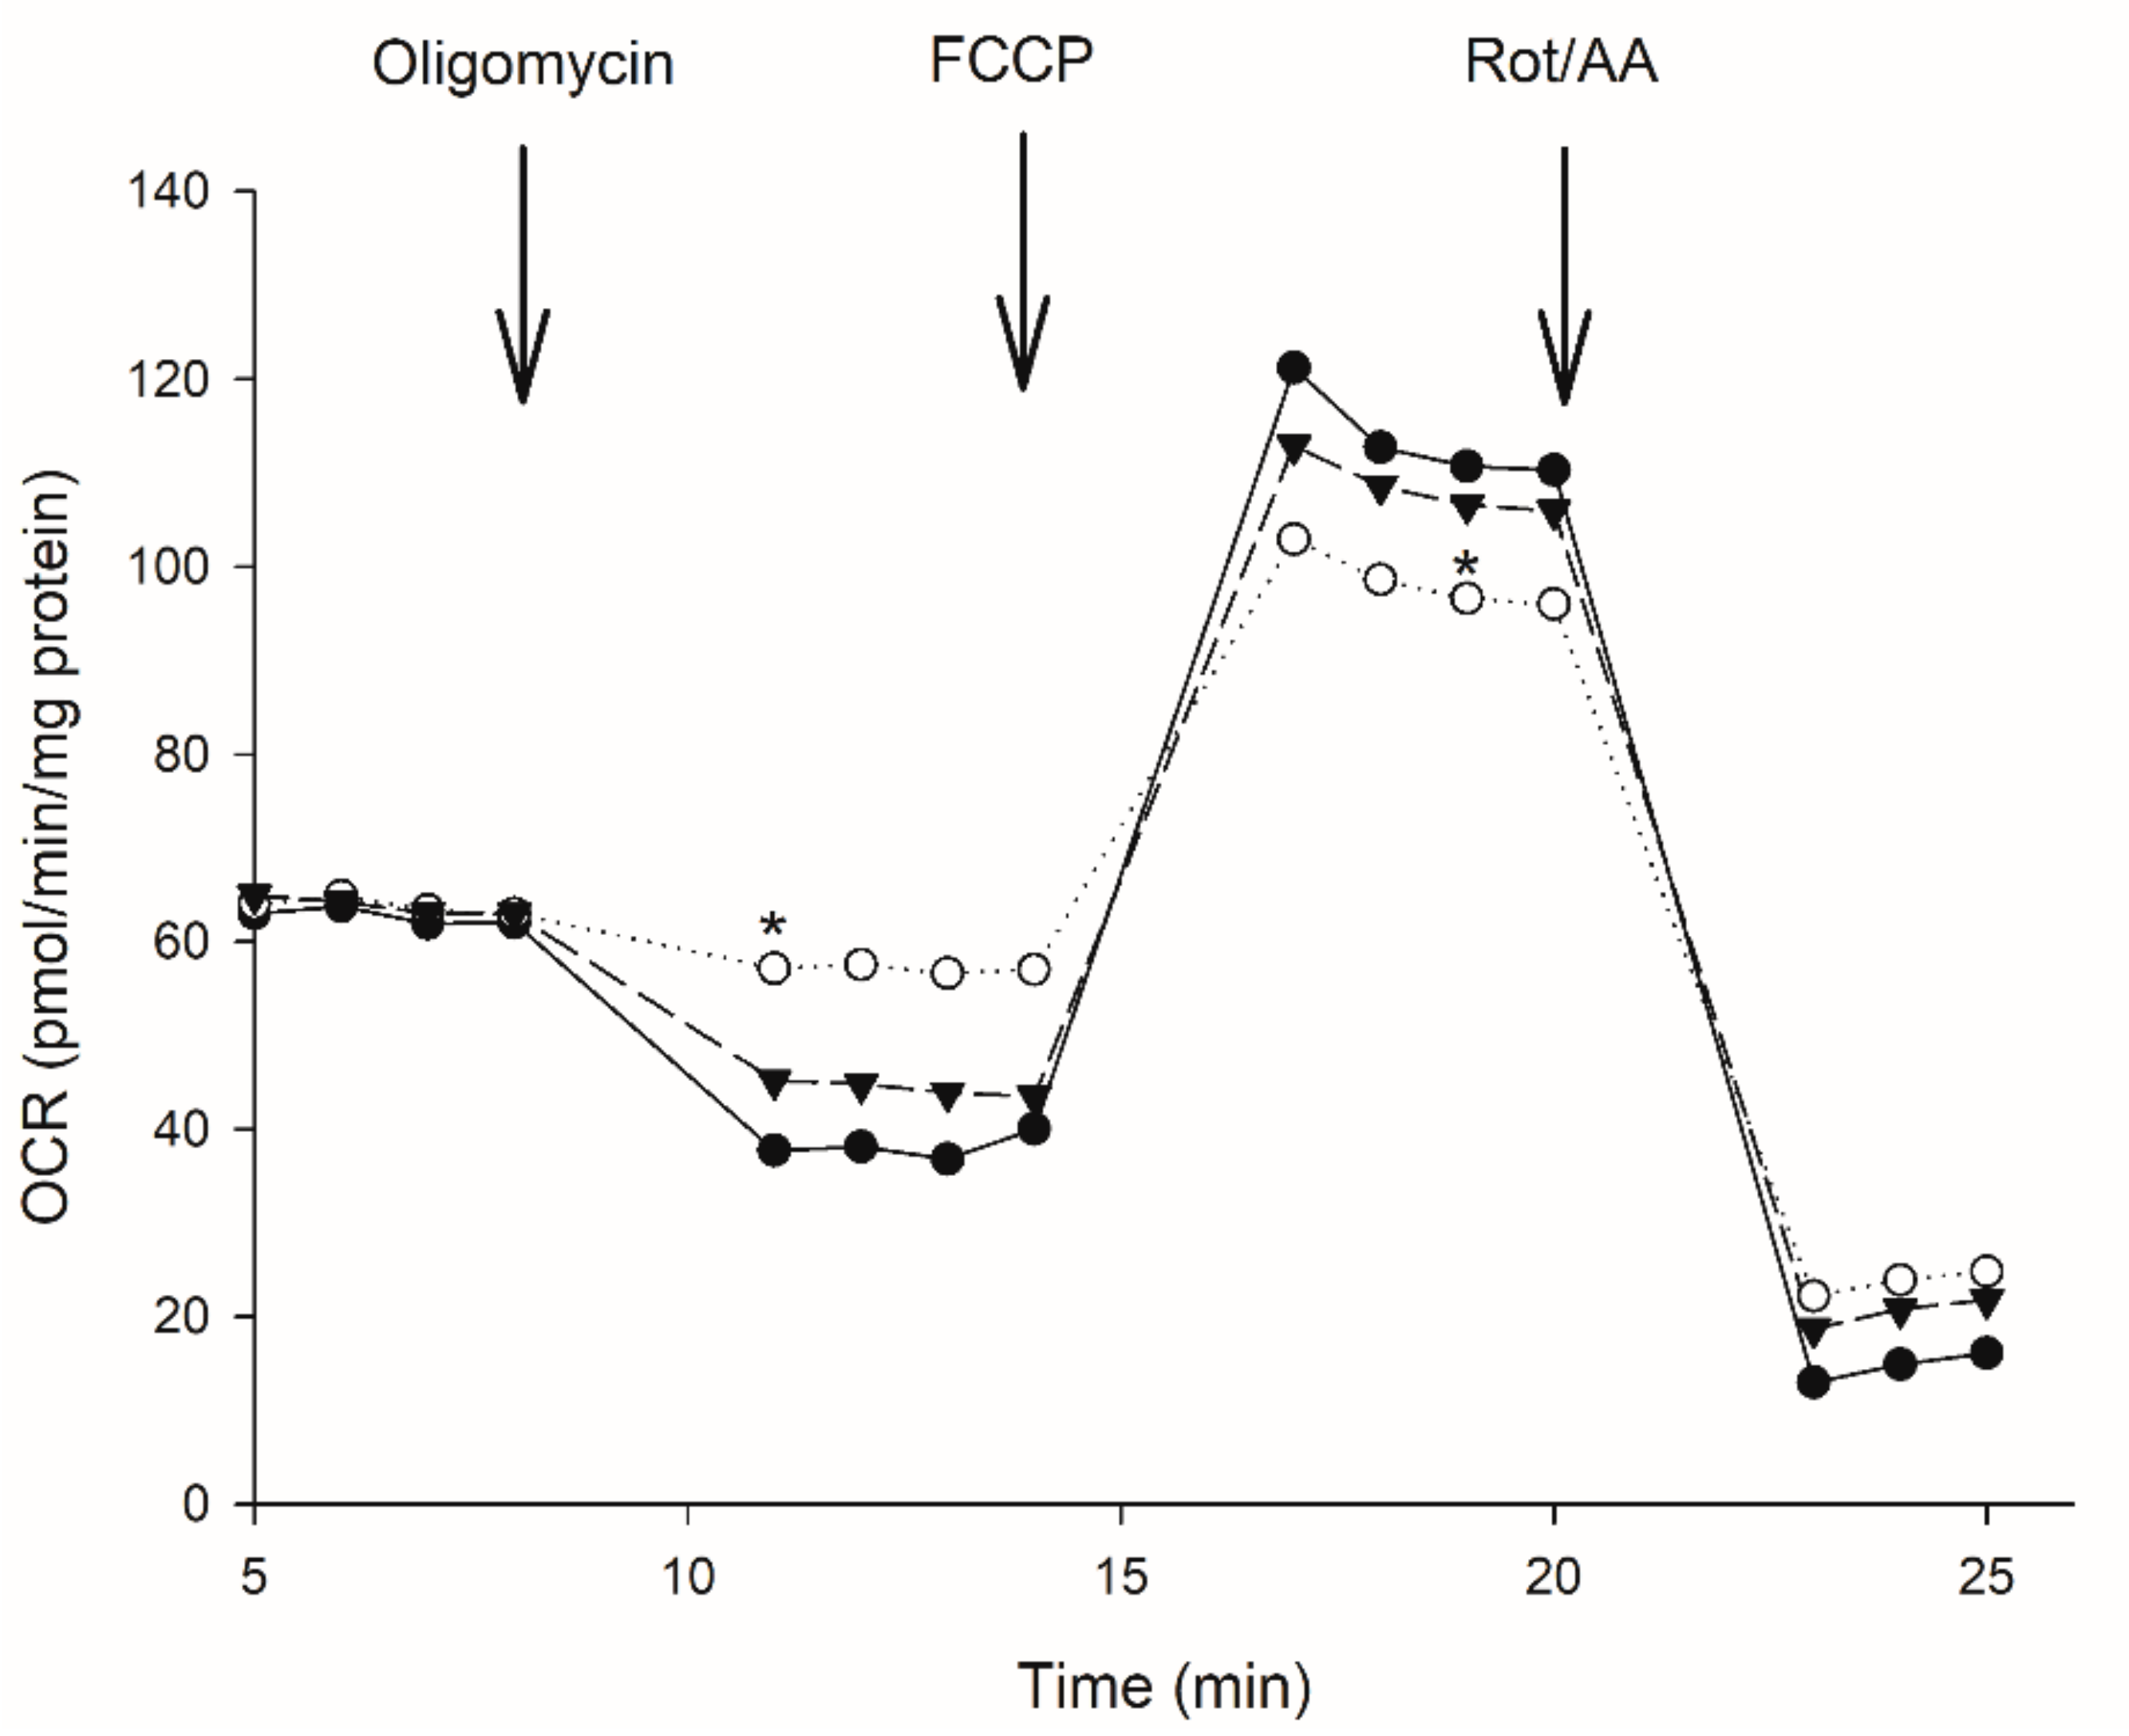
3.2. Effect of Moringa Extract on Mitochondrial OCR
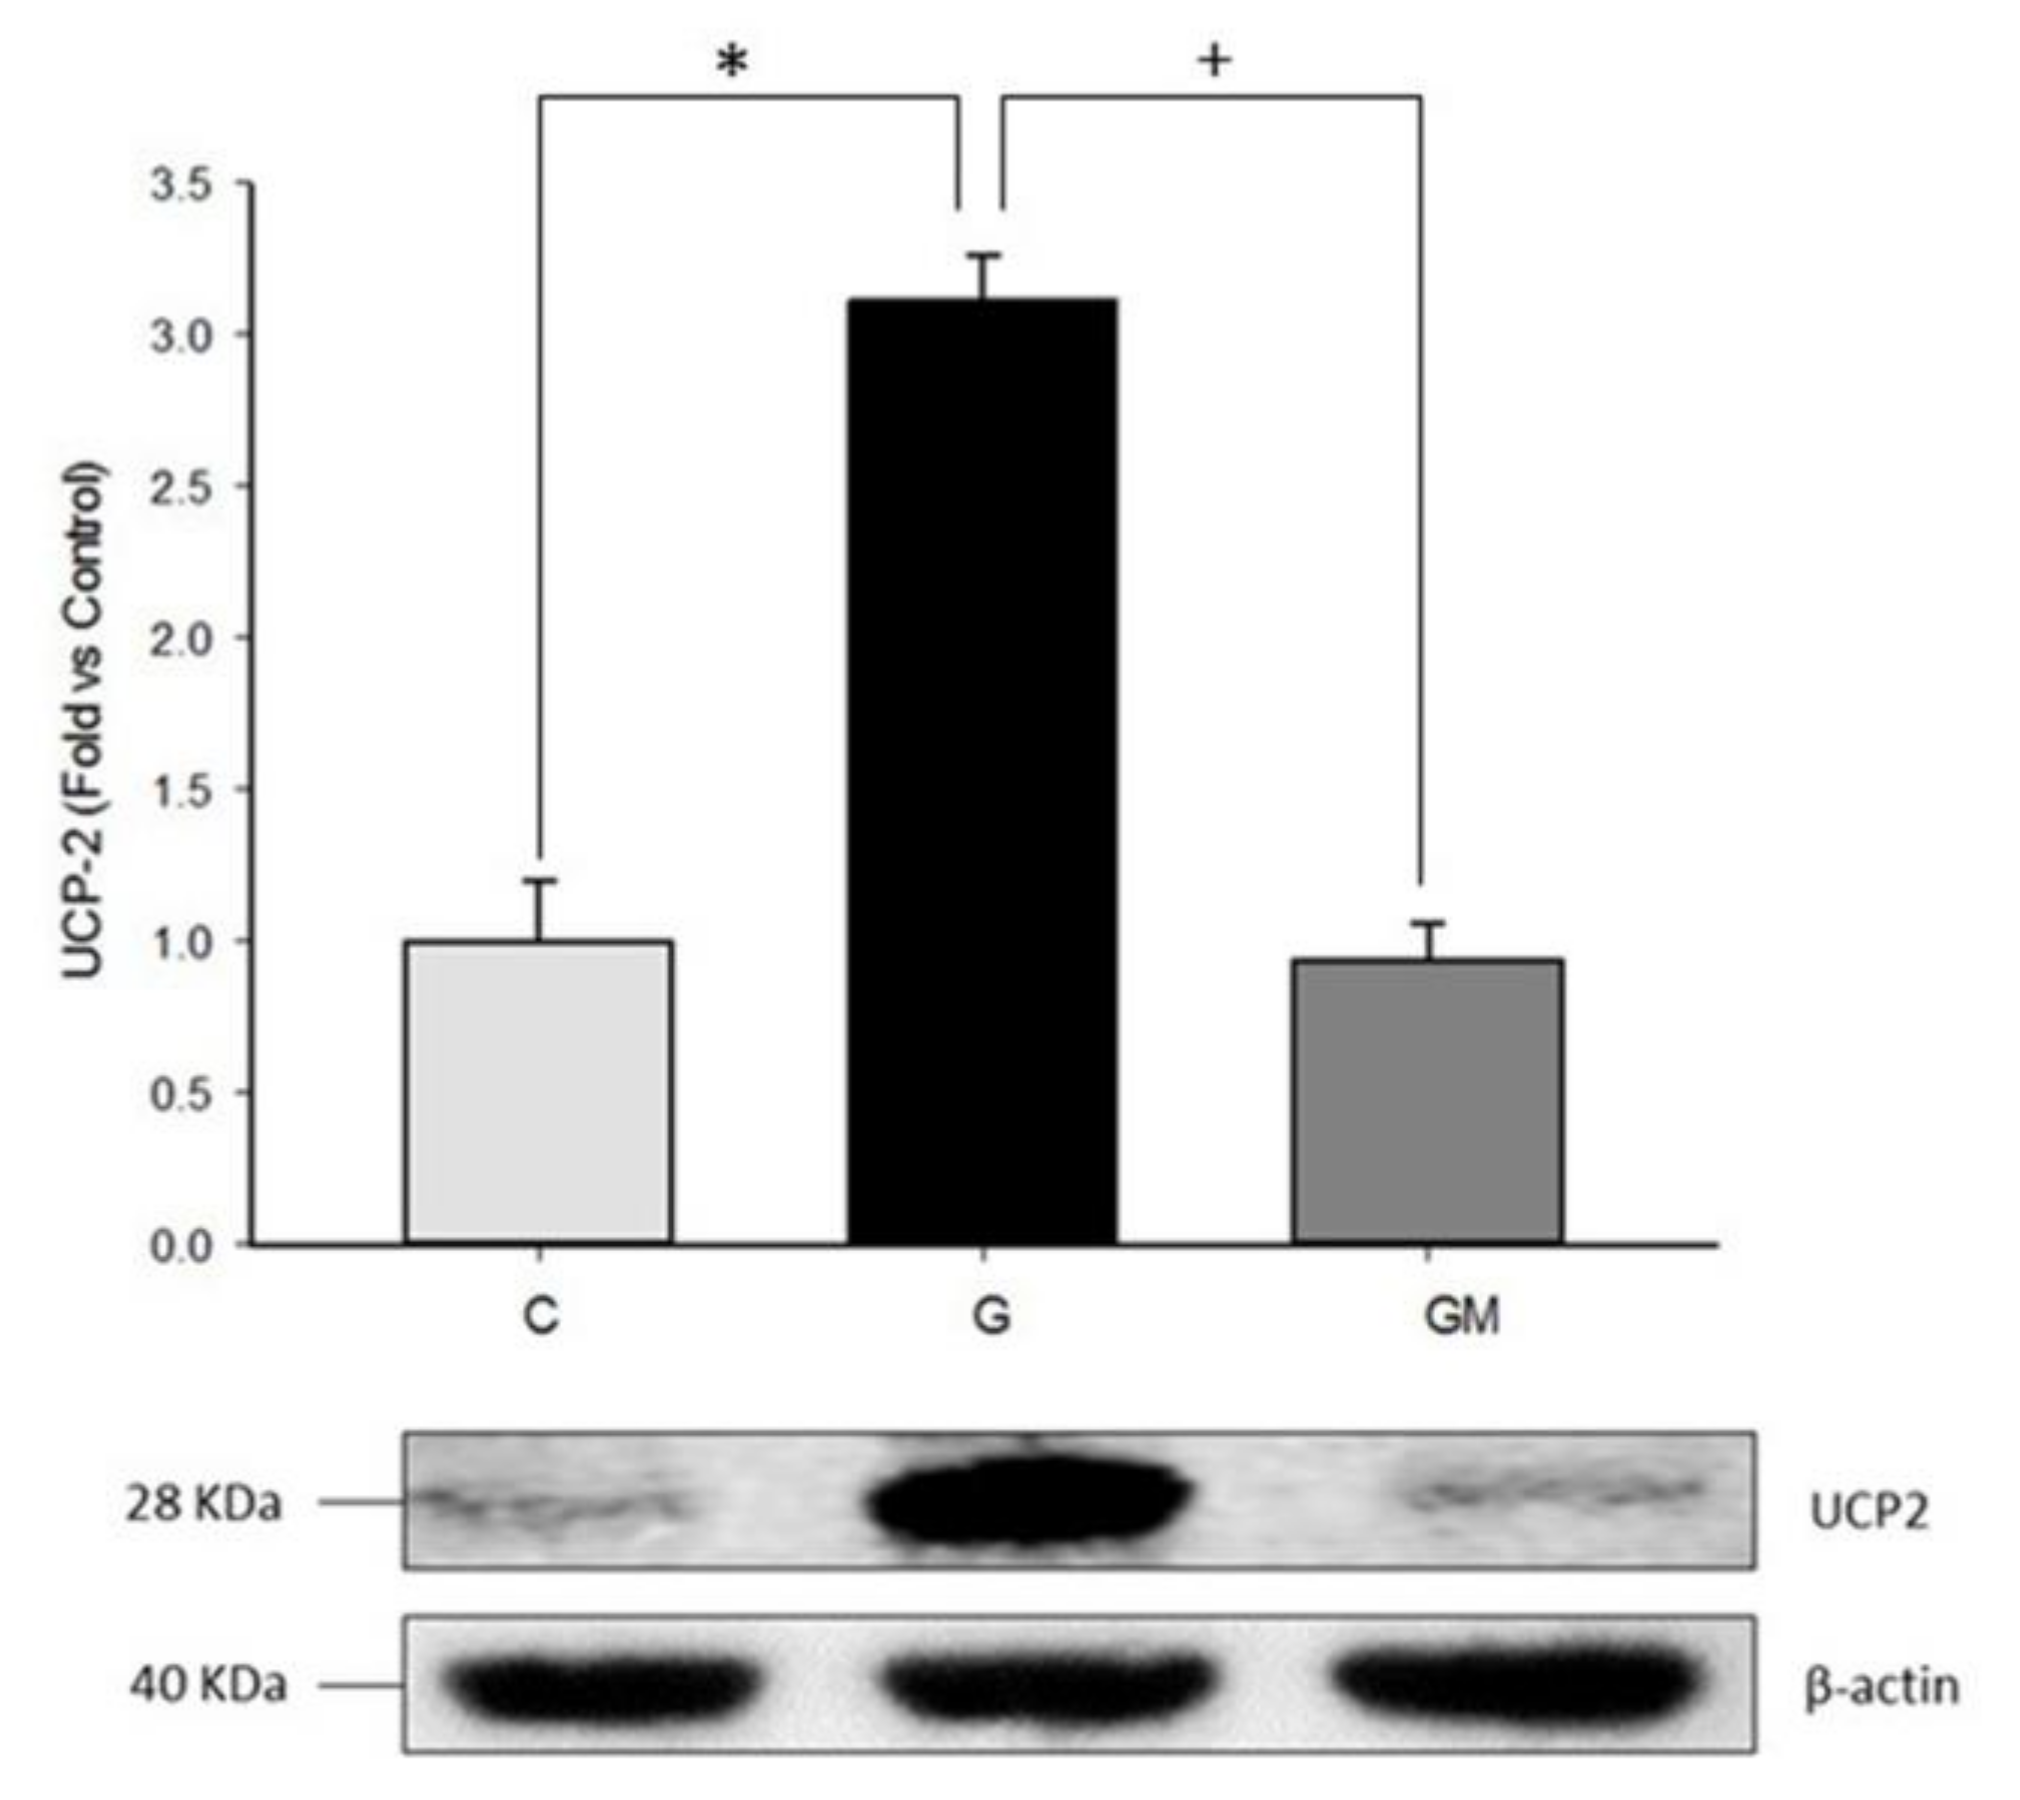
3.3. Uncoupling Protein Level (UCP2)
3.4. Reactive Oxygen Species Levels
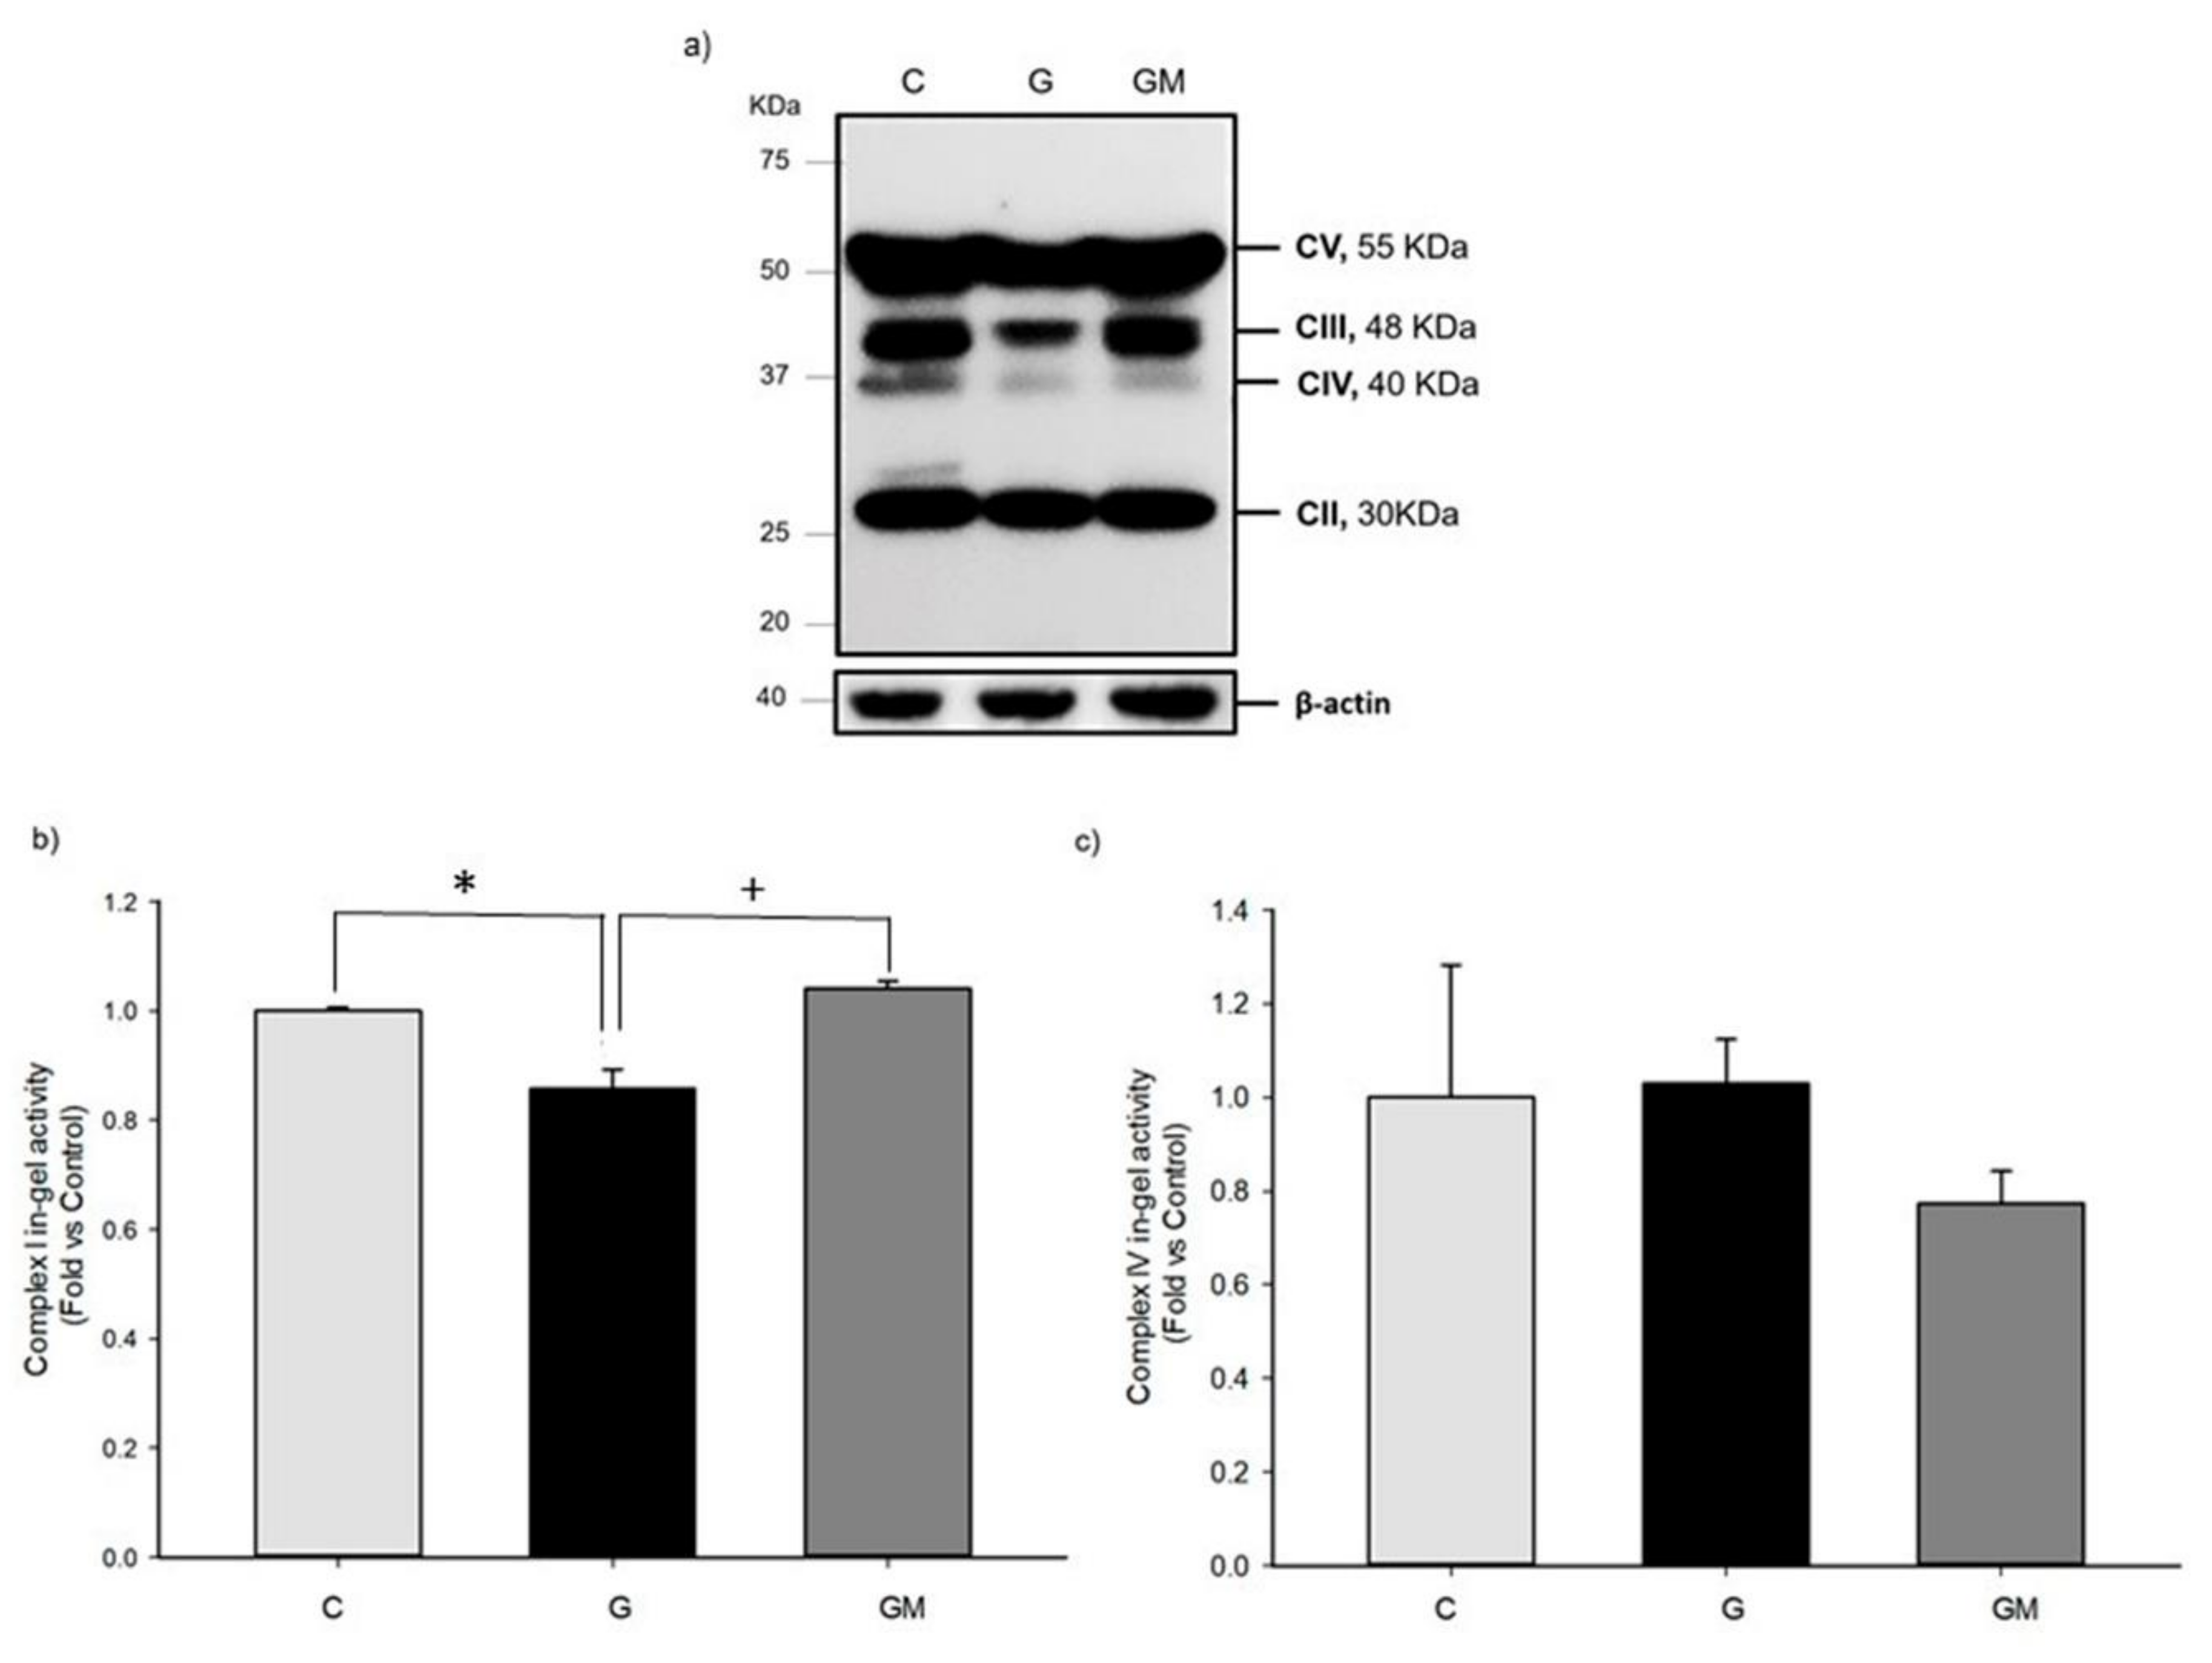
3.5. OXPHOS Activities
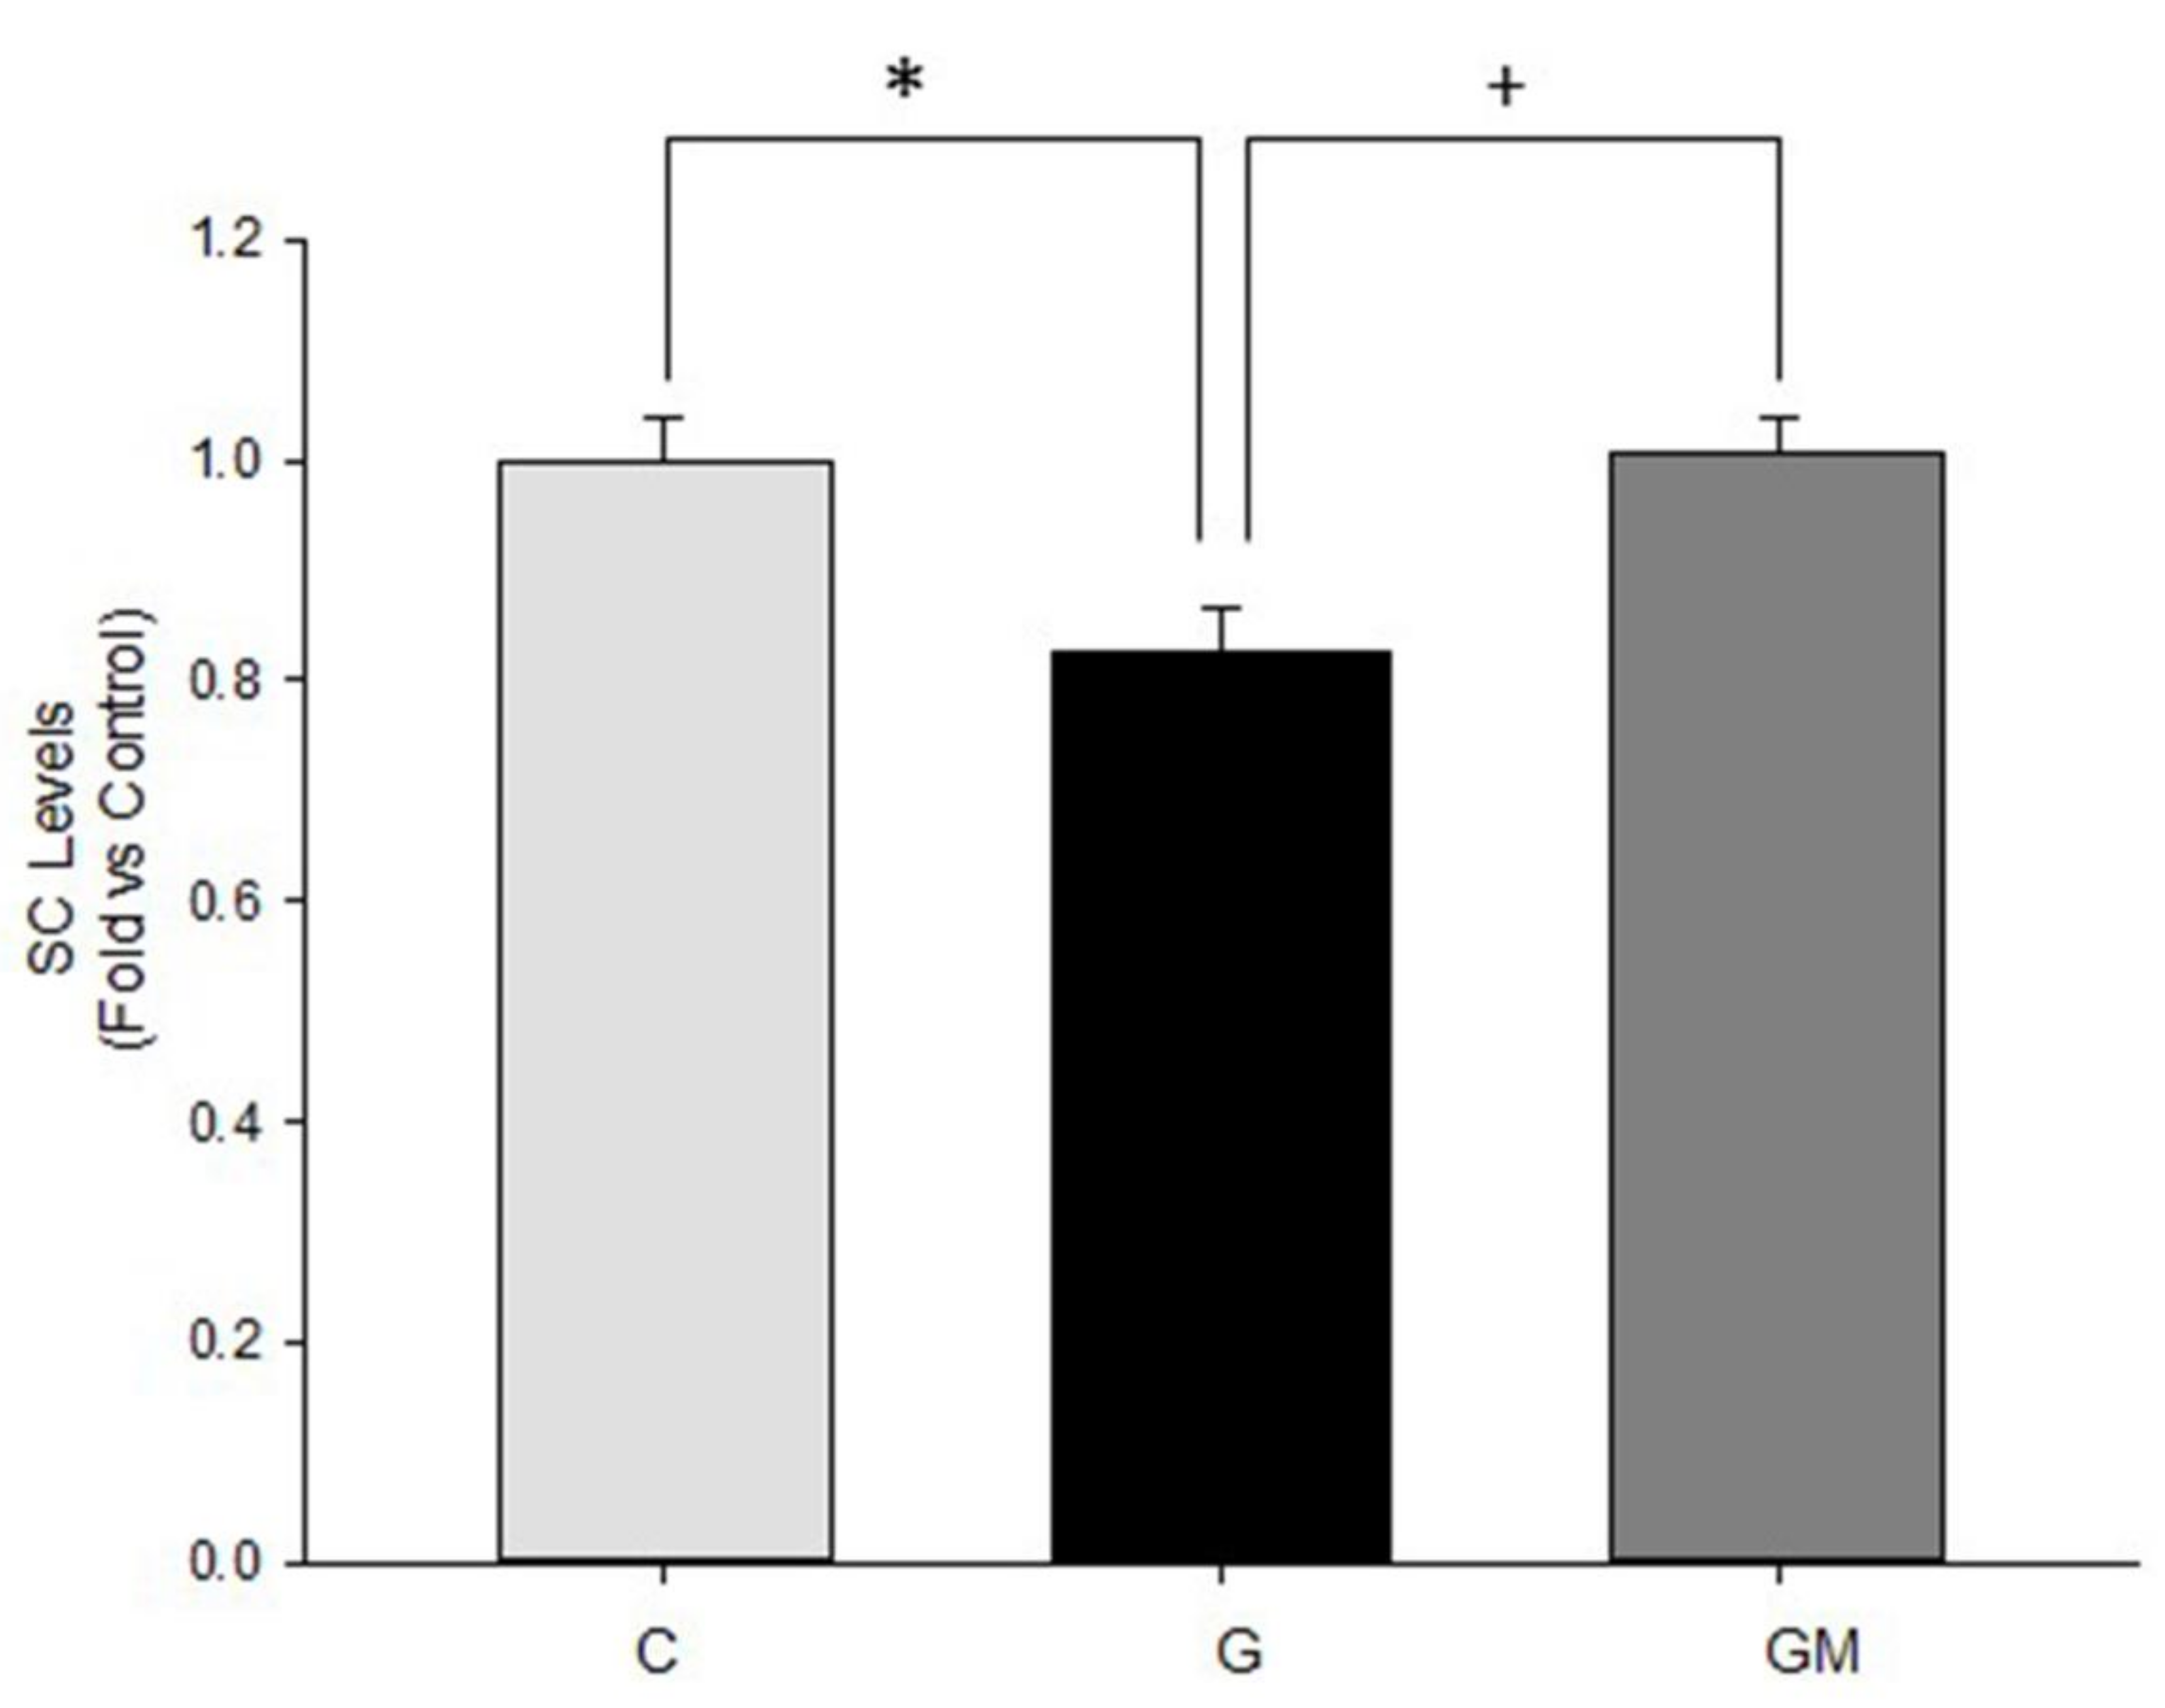
3.6. Mitochondrial Supercomplex Levels
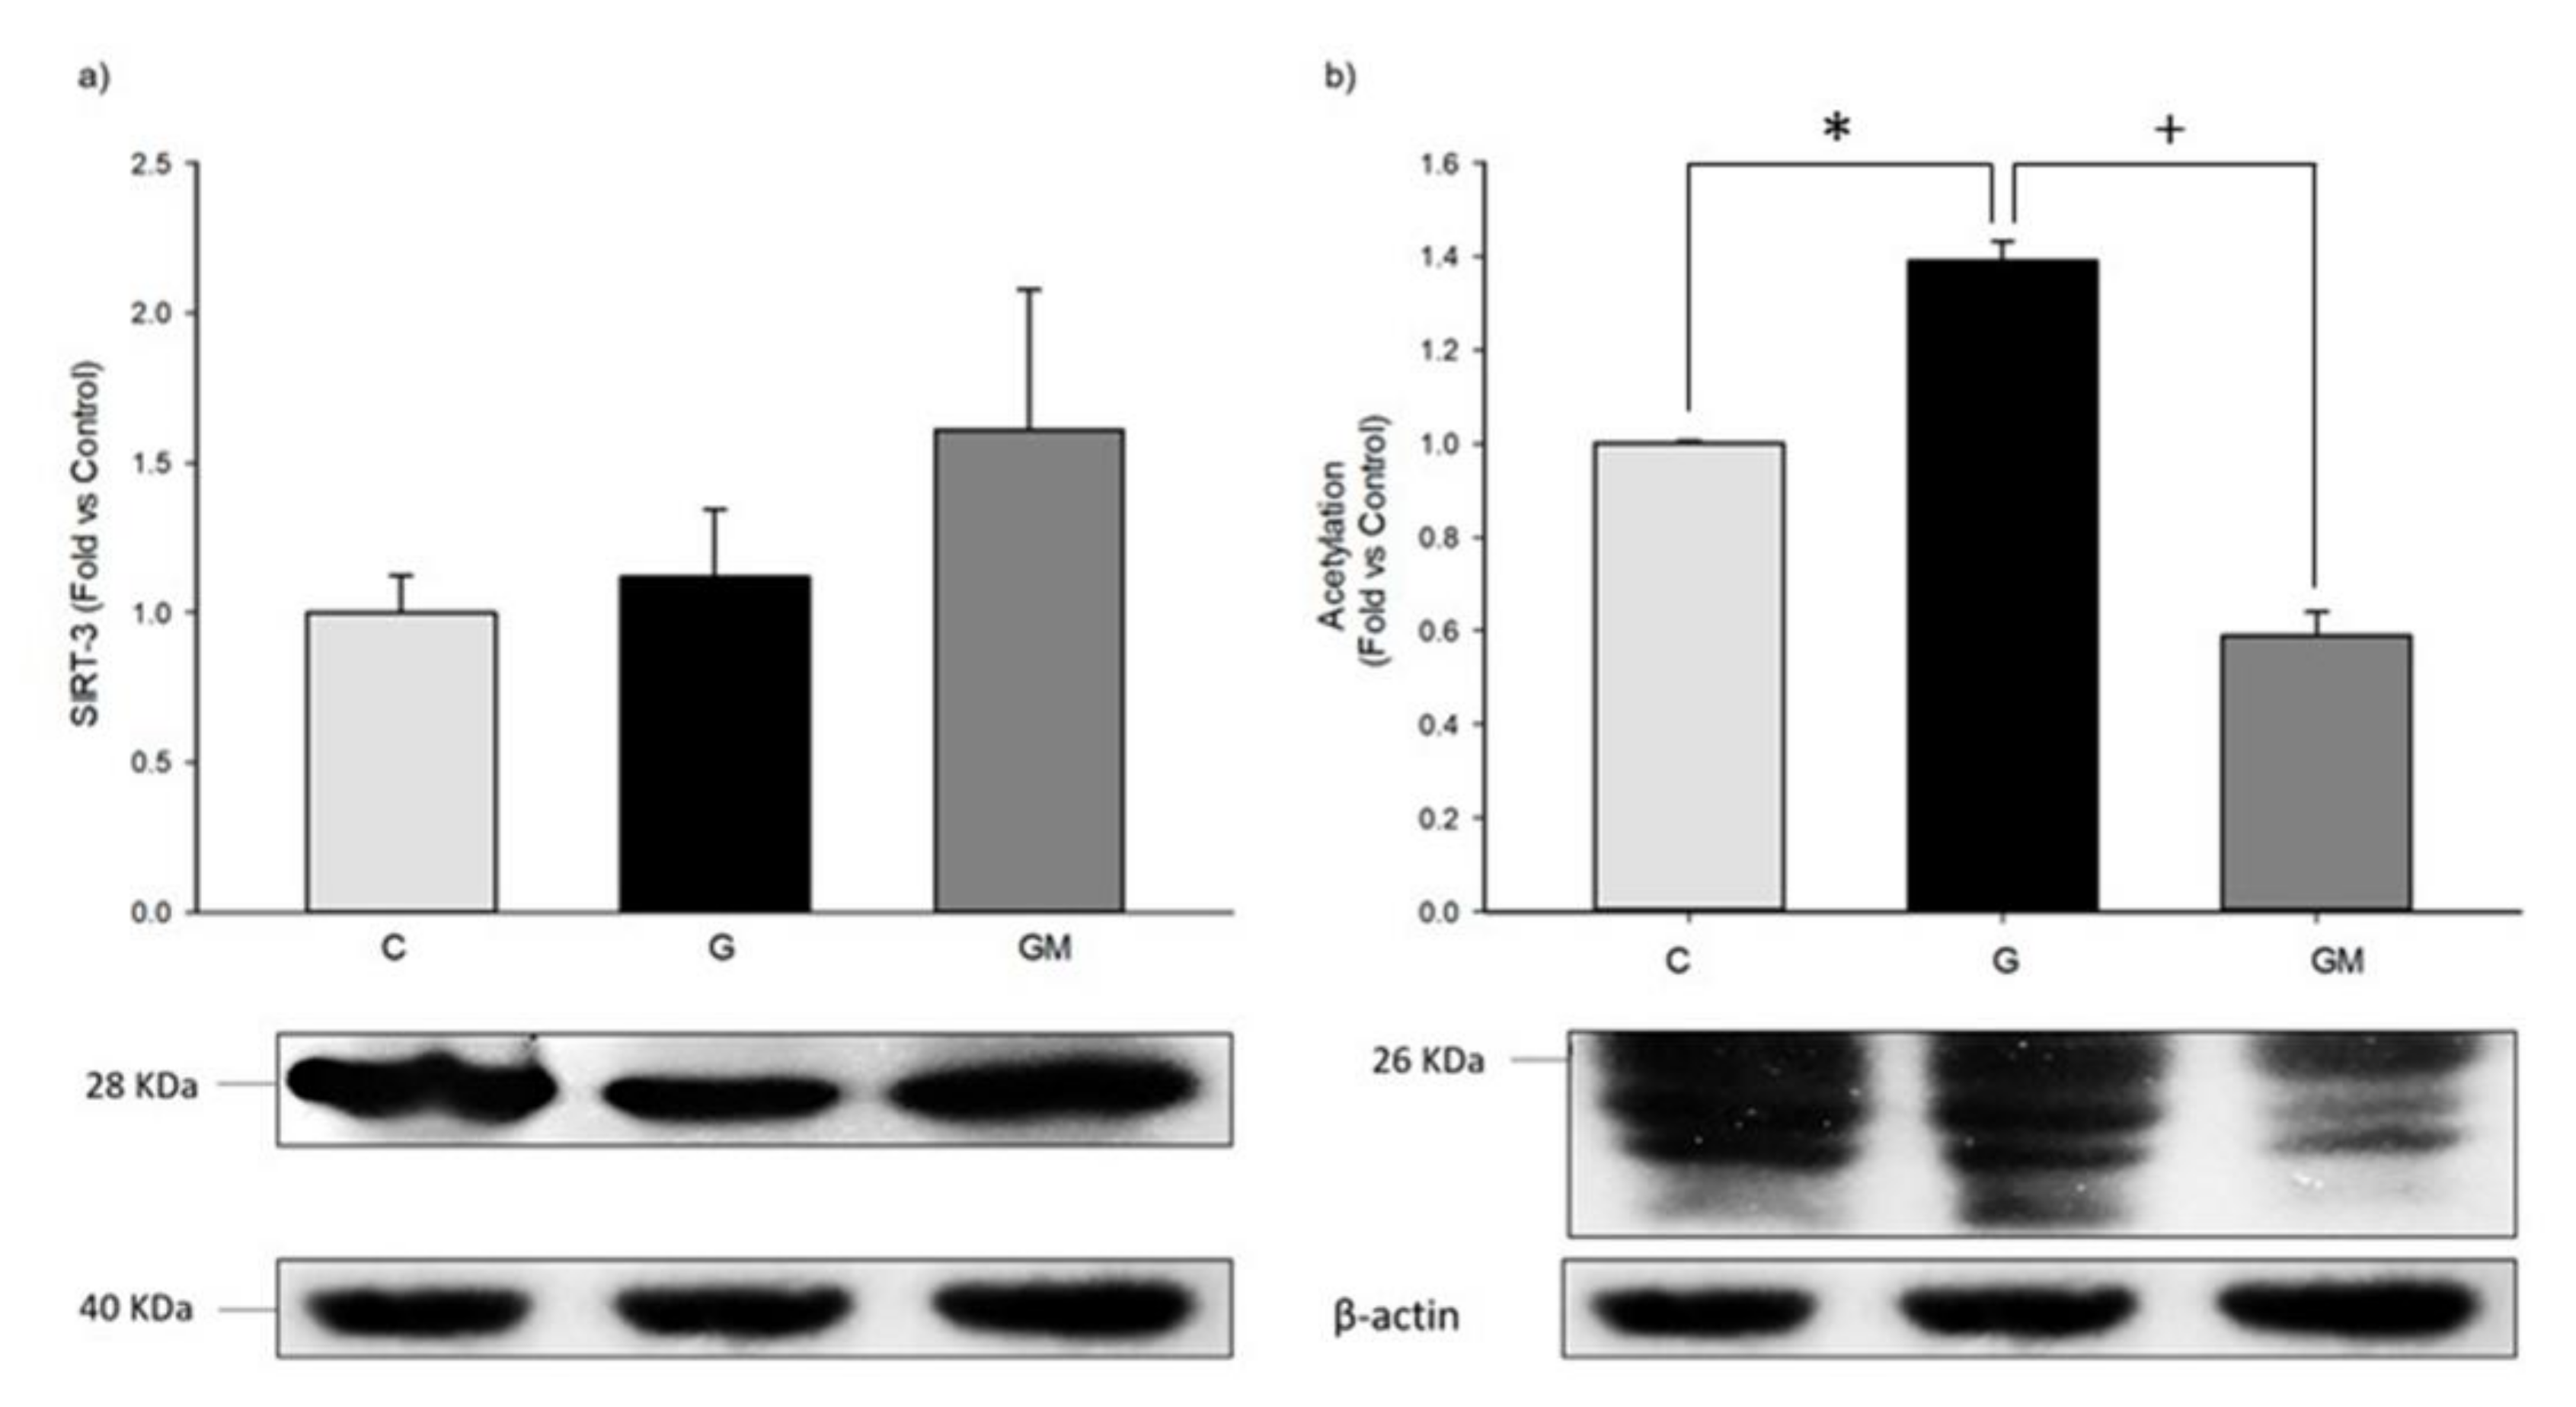
3.7. Acetylation Levels by SIRT3
4. Discussion
Author Contributions
Funding
Acknowledgments
Conflicts of Interest
References
- Abd Eldaim, M.A.; Shaban Abd Elrasoul, A.; Abd Elaziz, S.A. An aqueous extract from Moringa oleifera leaves ameliorates hepatotoxicity in alloxan-induced diabetic rats. Biochem. Cell Biol. 2017, 95, 524–530. [Google Scholar] [CrossRef] [PubMed]
- Aa, A.B.; Om, J.; Ts, E.; Ga, A. Preliminary phytochemical screening, antioxidant and antihyperglycaemic activity of Moringa oleifera leaf extracts. Pak. J. Pharm. Sci. 2017, 30, 2217–2222. [Google Scholar] [PubMed]
- Vergara Jimenez, M.; Almatrafi, M.M.; Fernandez, M.L. Bioactive Components in Moringa Oleifera Leaves Protect against Chronic Disease. Antioxidants 2017, 6, 91. [Google Scholar] [CrossRef] [PubMed]
- Makkar, H.P.S.; Becker, K. Nutrional value and antinutritional components of whole and ethanol extracted Moringa oleifera leaves. Anim. Feed Sci. Technol. 1996, 63, 211–228. [Google Scholar] [CrossRef]
- Tabbon, P.; Sripanidkulchai, B.; Sripanidkulchai, K. Hypocholesterolemic mechanism of phenolics-enriched extract from Moringa oleifera leaves in HepG2 cell lines. Songklanakarin J. Sci. Technol. 2016, 38, 155–161. [Google Scholar]
- Barbagallo, I.; Vanella, L.; Cambria, M.T.; Tibullo, D.; Godos, J.; Guarnaccia, L.; Li Volti, G. Silibinin Regulates Lipid Metabolism and Differentiation in Functional Human Adipocytes. Front. Pharmacol. 2015, 6, 309. [Google Scholar] [CrossRef] [PubMed]
- Brownlee, M. Biochemistry and molecular cell biology of diabetic complications. Nature 2001, 414, 813–820. [Google Scholar] [CrossRef] [PubMed]
- Cheng, J.; Nanayakkara, G.; Shao, Y.; Cueto, R.; Wang, L.; Yang, W.Y.; Yang, X. Mitochondrial Proton Leak Plays a Critical Role in Pathogenesis of Cardiovascular Diseases. Adv. Exp. Med. Biol. 2017, 982, 359–370. [Google Scholar] [PubMed]
- Sánchez Muñoz, A.; Valdez Solana, M.A.; Campos Almazán, M.I.; Flores Herrera, Ó.; Esparza Perusquía, M.; Olvera Sánchez, S.; Sierra Campos, E. Streptozotocin-Induced Adaptive Modification of Mitochondrial Supercomplexes in Liver of Wistar Rats and the Protective Effect of Moringa oleifera Lam. Biochem. Res. Int. 2018, 2018, 5681081. [Google Scholar] [CrossRef]
- D’Onofrio, N.; Vitiello, M.; Casale, R.; Servillo, L.; Giovane, A.; Balestrieri, M.L. Sirtuins in vascular diseases: Emerging roles and therapeutic potential. Biochim. Biophys. Acta 2008, 1852, 1311–1322. [Google Scholar] [CrossRef] [PubMed]
- Carrico, C.; Meyer, J.G.; He, W.; Gibson, B.W.; Verdin, E. The Mitochondrial Acylome Emerges: Proteomics, Regulation by Sirtuins, and Metabolic and Disease Implications. Cell Metab. 2018, 27, 497–512. [Google Scholar] [CrossRef] [PubMed]
- Singh, C.K.; Chhabra, G.; Ndiaye, M.A.; Garcia-Peterson, L.M.; Mack, N.J.; Ahmad, N. The Role of Sirtuins in Antioxidant and Redox Signaling. Antioxid. Redox Signal. 2018, 28, 643–661. [Google Scholar] [CrossRef] [PubMed]
- Weinberg, J.M. Mitochondrial biogenesis in kidney disease. J. Am. Soc. Nephrol. 2011, 22, 431–436. [Google Scholar] [CrossRef] [PubMed]
- Wu, Z.; Puigserver, P.; Andersson, U.; Zhang, C.; Adelmant, G.; Mootha, V.; Spiegelman, B.M. Mechanisms Controlling Mitochondrial Biogenesis and Respiration through the Thermogenic Coactivator PGC-1. Cell 1999, 98, 115–124. [Google Scholar] [CrossRef]
- Jing, E.; Emanuelli, B.; Hirschey, M.D.; Boucher, J.; Lee, K.Y.; Lombard, D.; Kahn, C.R. Sirtuin-3 (Sirt3) regulates skeletal muscle metabolism and insulin signaling via altered mitochondrial oxidation and reactive oxygen species production. Proc. Natl. Acad. Sci. USA 2011, 108, 14608–14613. [Google Scholar] [CrossRef] [PubMed] [Green Version]
- Hirschey, M.D.; Shimazu, T.; Jing, E.; Grueter, C.A.; Collins, A.M.; Aouizerat, B.; Verdin, E. SIRT3 Deficiency and Mitochondrial Protein Hyperacetylation Accelerate the Development of the Metabolic Syndrome. Mol. Cell 2011, 44, 177–190. [Google Scholar] [CrossRef] [PubMed]
- Ahn, B.-H.; Kim, H.-S.; Song, S.; Lee, I.H.; Liu, J.; Vassilopoulos, A.; Finkel, T. A role for the mitochondrial deacetylase Sirt3 in regulating energy homeostasis. Proc. Natl. Acad. Sci. USA 2008, 105, 14447–14452. [Google Scholar] [CrossRef] [PubMed] [Green Version]
- Yang, Y.; Cimen, H.; Han, M.-J.; Shi, T.; Deng, J.-H.; Koc, H.; Koc, E.C. NAD+-dependent deacetylase SIRT3 regulates mitochondrial protein synthesis by deacetylation of the ribosomal protein MRPL10. J. Biol. Chem. 2010, 285, 7417–7429. [Google Scholar] [CrossRef] [PubMed]
- Satoh, A.; Stein, L.; Imai, S. The role of mammalian sirtuins in the regulation of metabolism, aging, and longevity. Handb. Exp. Pharmacol. 2011, 206, 125–162. [Google Scholar] [PubMed]
- Leibiger, I.B.; Berggren, P.-O. Sirt1: A metabolic master switch that modulates lifespan. Nat. Med. 2006, 12, 34–36. [Google Scholar] [CrossRef] [PubMed]
- Milne, J.C.; Lambert, P.D.; Schenk, S.; Carney, D.P.; Smith, J.J.; Gagne, D.J.; Westphal, C.H. Small molecule activators of SIRT1 as therapeutics for the treatment of type 2 diabetes. Nature 2007, 450, 712–716. [Google Scholar] [CrossRef] [PubMed] [Green Version]
- Pacholec, M.; Bleasdale, J.E.; Chrunyk, B.; Cunningham, D.; Flynn, D.; Garofalo, R.S.; Ahn, K. SRT1720, SRT2183, SRT1460, and resveratrol are not direct activators of SIRT1. J. Biol. Chem. 2010, 285, 8340–8351. [Google Scholar] [CrossRef] [PubMed]
- Liu, J.; Li, J.; Li, W.J.; Wang, C.M. The role of uncoupling proteins in diabetes mellitus. J. Diabetes Res. 2013, 585897. [Google Scholar] [CrossRef] [PubMed]
- Howitz, K.T.; Bitterman, K.J.; Cohen, H.Y.; Lamming, D.W.; Lavu, S.; Wood, J.G.; Sinclair, D.A. Small molecule activators of sirtuins extend Saccharomyces cerevisiae lifespan. Nature 2003, 425, 191–196. [Google Scholar] [CrossRef] [PubMed]
- Purushotham, A.; Schug, T.T.; Xu, Q.; Surapureddi, S.; Guo, X.; Li, X. Hepatocyte-Specific Deletion of SIRT1 Alters Fatty Acid Metabolism and Results in Hepatic Steatosis and Inflammation. Cell Metab. 2009, 9, 327–338. [Google Scholar] [CrossRef] [PubMed] [Green Version]
- Kim, H.Y.; Kim, K. Regulation of signaling molecules associated with insulin action, insulin secretion and pancreatic β-cell mass in the hypoglycemic effects of Korean red ginseng in Goto-Kakizaki rats. J. Ethnopharmacol. 2012, 142, 53–58. [Google Scholar] [CrossRef] [PubMed]
- Pereira Caro, G.; Sarriá, B.; Madrona, A.; Espartero, J.L.; Goya, L.; Bravo, L.; Mateos, R. Alkyl Hydroxytyrosyl Ethers Show Protective Effects against Oxidative Stress in HepG2 Cells. J. Agric. Food Chem. 2011, 59, 5964–5976. [Google Scholar] [CrossRef] [PubMed] [Green Version]
- Martín, M.A.; Ramos, S.; Granado Serrano, A.B.; Rodríguez Ramiro, I.; Trujillo, M.; Bravo, L.; Goya, L. Hydroxytyrosol induces antioxidant/detoxificant enzymes and Nrf2 translocation via extracellular regulated kinases and phosphatidylinositol-3-kinase/protein kinase B pathways in HepG2 cells. Mol. Nutr. Food Res. 2010, 54, 956–966. [Google Scholar] [CrossRef] [PubMed] [Green Version]
- Kim, Y.; Choi, Y.; Ham, H.; Jeong, H.S.; Lee, J. Protective effects of oligomeric and polymeric procyanidin fractions from defatted grape seeds on tert-butyl hydroperoxide-induced oxidative damage in HepG2 cells. Food Chem. 2013, 137, 136–141. [Google Scholar] [CrossRef] [PubMed]
- Khetani, S.R.; Berger, D.R.; Ballinger, K.R.; Davidson, M.D.; Lin, C.; Ware, B.R. Microengineered liver tissues for drug testing. J. Lab. Autom. 2015, 20, 216–250. [Google Scholar] [CrossRef] [PubMed]
- Mordel, P.; Nowoczyn, M.; Joubert, M.; Coulbault, L.; Allouche, S. Effects of glucose fluctuations on cellular and mitochondrial functions in HL-1 cardiac cell line. Diabetes Metab. 2016, 42, 295. [Google Scholar] [CrossRef]
- Hou, Y.; Zhou, M.; Xie, J.; Chao, P.; Feng, Q.; Wu, J. High glucose levels promote the proliferation of breast cancer cells through GTPases. Breast Cancer Targets Ther. 2017, 9, 429–436. [Google Scholar] [CrossRef] [PubMed] [Green Version]
- Valdez Solana, M.A.; Mejía García, V.Y.; Téllez Valencia, A.; García Arenas, G.; Salas Pacheco, J.; Alba Romero, J.J.; Sierra Campos, E. Nutritional Content and Elemental and Phytochemical Analyses of Moringa oleifera Grown in Mexico. J. Chem. 2015, 2015, 860381. [Google Scholar] [CrossRef]
- Dranka, B.P.; Hill, B.G.; Darley-Usmar, V.M. Mitochondrial reserve capacity in endothelial cells: The impact of nitric oxide and reactive oxygen species. Free Radic. Biol. Med. 2010, 48, 905–914. [Google Scholar] [CrossRef] [PubMed] [Green Version]
- Brand, M.D.; Nicholls, D.G. Assessing mitochondrial dysfunction in cells. Biochem. J. 2011, 435, 297–312. [Google Scholar] [CrossRef] [PubMed] [Green Version]
- Domenis, R.; Bisetto, E.; Rossi, D.; Comelli, M.; Mavelli, I. Glucose-Modulated Mitochondria Adaptation in Tumor Cells: A Focus on ATP Synthase and Inhibitor Factor 1. Int. J. Mol. Sci. 2012, 13, 1933–1950. [Google Scholar] [CrossRef] [PubMed] [Green Version]
- Wittig, I.; Carrozzo, R.; Santorelli, F.M.; Schägger, H. Functional assays in high-resolution clear native gels to quantify mitochondrial complexes in human biopsies and cell lines. Electrophoresis 2007, 28, 3811–3820. [Google Scholar] [CrossRef] [PubMed]
- Jung, C.; Higgins, C.M.J.; Xu, Z. Measuring the Quantity and Activity of Mitochondrial Electron Transport Chain Complexes in Tissues of Central Nervous System Using Blue Native Polyacrylamide Gel Electrophoresis. Anal. Biochem. 2000, 286, 214–223. [Google Scholar] [CrossRef] [PubMed]
- Kamalian, L.; Chadwick, A.E.; Bayliss, M.; French, N.S.; Monshouwer, M.; Snoeys, J.; Park, B.K. The utility of HepG2 cells to identify direct mitochondrial dysfunction in the absence of cell death. Toxicol. In Vitro 2015, 29, 732–740. [Google Scholar] [CrossRef] [PubMed]
- Chandrasekaran, K.; Swaminathan, K.; Chatterjee, S.; Dey, A. Apoptosis in HepG2 cells exposed to high glucose. Toxicol. In Vitro 2010, 24, 387–396. [Google Scholar] [CrossRef] [PubMed]
- Abd-Rabou, A.A.; Zoheir, K.M.A.; Kishta, M.S.; Shalby, A.B.; Ezzo, M.I. Nano-Micelle of Moringa oleifera Seed Oil Triggers Mitochondrial Cancer Cell Apoptosis. West Asia Organ. Cancer Prev. (WAOCP) 2016, 17, 4929–4933. [Google Scholar]
- Madi, N.; Dany, M.; Abdoun, S.; Usta, J. Moringa oleifera’s Nutritious Aqueous Leaf Extract Has Anticancerous Effects by Compromising Mitochondrial Viability in an ROS-Dependent Manner. J. Am. Coll. Nutr. 2016, 35, 604–613. [Google Scholar] [CrossRef] [PubMed]
- Kim, G.J.; Chandrasekaran, K.; Morgan, W.F. Mitochondrial dysfunction, persistently elevated levels of reactive oxygen species and radiation-induced genomic instability: A review. Mutagenesis 2006, 21, 361–367. [Google Scholar] [CrossRef] [PubMed]
- Busik, J.V.; Mohr, S.; Grant, M.B. Hyperglycemia-induced reactive oxygen species toxicity to endothelial cells is dependent on paracrine mediators. Diabetes 2008, 57, 1952–1965. [Google Scholar] [CrossRef] [PubMed]
- Turko, I.V.; Murad, F. Quantitative protein profiling in heart mitochondria from diabetic rats. J. Biol. Chem. 2003, 278, 35844–35849. [Google Scholar] [CrossRef] [PubMed]
- Hwang, H.; Bowen, B.P.; Lefort, N.; Flynn, C.R.; De Filippis, E.A.; Roberts, C.; Mandarino, L.J. Proteomics Analysis of Human Skeletal Muscle Reveals Novel Abnormalities in Obesity and Type 2 Diabetes. Diabetes 2010, 59, 33–42. [Google Scholar] [CrossRef] [PubMed] [Green Version]
- Sparks, L.M.; Xie, H.; Koza, R.A.; Mynatt, R.; Hulver, M.W.; Bray, G.A.; Smith, S.R. A high-fat diet coordinately downregulates genes required for mitochondrial oxidative phosphorylation in skeletal muscle. Diabetes 2005, 54, 1926–1933. [Google Scholar] [CrossRef] [PubMed]
- Genova, M.L.; Lenaz, G. Functional role of mitochondrial respiratory supercomplexes. Biochim. Biophys. Acta (BBA)—Bioenerg. 2014, 1837, 427–443. [Google Scholar] [CrossRef] [PubMed] [Green Version]
- Letts, J.A.; Fiedorczuk, K.; Sazanov, L.A. The architecture of respiratory supercomplexes. Nature 2016, 537, 644–648. [Google Scholar] [CrossRef] [PubMed]
- Lopez-Fabuel, I.; Le Douce, J.; Logan, A.; James, A.M.; Bonvento, G.; Murphy, M.P.; Almeida, A.; Bolaños, J.P. Complex I assembly into supercomplexes determines differential mitochondrial ROS production in neurons and astrocytes. Proc. Natl. Acad. Sci. USA 2016, 113, 13063–13068. [Google Scholar] [CrossRef] [PubMed]
- Wittig, I.; Karas, M.; Schägger, H. High Resolution Clear Native Electrophoresis for In-gel Functional Assays and Fluorescence Studies of Membrane Protein Complexes. Mol. Cell. Proteom. 2007, 6, 1215–1225. [Google Scholar] [CrossRef] [PubMed] [Green Version]
- Porras, C.A.-M.; Bai, Y. Respiratory supercomplexes: Plasticity and implications. Front. Biosci. 2015, 20, 621. [Google Scholar]
- Wu, J.; Jin, Z.; Yan, L.J. Redox imbalance and mitochondrial abnormalities in the diabetic lung. Redox Biol. 2017, 11, 51–59. [Google Scholar] [CrossRef] [PubMed]
- Michan, S.; Sinclair, D. Sirtuins in mammals: Insights into their biological function. Biochem. J. 2007, 404, 1–13. [Google Scholar] [CrossRef] [PubMed]
- Wu, J.; Luo, X.; Thangthaeng, N.; Sumien, N.; Chen, Z.; Rutledge, M.A.; Yan, L.J. Pancreatic mitochondrial complex I exhibits aberrant hyperactivity in diabetes. Biochem. Biophys. Rep. 2017, 11, 119–129. [Google Scholar] [CrossRef] [PubMed]
- Saini, R.K.; Sivanesan, I.; Keum, Y.S. Phytochemicals of Moringa oleifera: A review of their nutritional, therapeutic and industrial significance. 3 Biotech 2016, 6, 203. [Google Scholar] [CrossRef] [PubMed]
- Al-Malki, A.L.; El Rabey, H.A. The antidiabetic effect of low doses of Moringa oleifera Lam. seeds on streptozotocin induced diabetes and diabetic nephropathy in male rats. BioMed Res. Int. 2015, 2015, 381040. [Google Scholar] [CrossRef] [PubMed]
- Gibellini, L.; Bianchini, E.; De Biasi, S.; Nasi, M.; Cossarizza, A.; Pinti, M. Natural compounds modulating mitochondrial functions. Evid.-Based Complement. Altern. Med. 2015, 2015, 527209. [Google Scholar] [CrossRef] [PubMed]
- Fiorani, M.; Guidarelli, A.; Blasa, M.; Azzolini, C.; Candiracci, M.; Piatti, E.; Cantoni, O. Mitochondria accumulate large amounts of quercetin: Prevention of mitochondrial damage and release upon oxidation of the extramitochondrial fraction of the flavonoid. J. Nutr. Biochem. 2010, 21, 397–404. [Google Scholar] [CrossRef] [PubMed]
- Lagouge, M.; Argmann, C.; Gerhart-Hines, Z.; Meziane, H.; Lerin, C.; Daussin, F.; Geny, B. Resveratrol improves mitochondrial function and protects against metabolic disease by activating SIRT1 and PGC-1α. Cell 2006, 127, 1109–1122. [Google Scholar] [CrossRef] [PubMed]
- Lim, H.W.; Lim, H.Y.; Wong, K.P. Uncoupling of oxidative phosphorylation by curcumin: Implication of its cellular mechanism of action. Biochem. Biophys. Res. Commun. 2009, 389, 187–192. [Google Scholar] [CrossRef] [PubMed]
- Ruiz, L.M.; Salazar, C.; Jensen, E.; Ruiz, P.A.; Tiznado, W.; Quintanilla, R.A.; Elorza, A.A. Quercetin Affects Erythropoiesis and Heart Mitochondrial Function in Mice. Oxid. Med. Cell. Longev. 2015, 2015, 836301. [Google Scholar] [CrossRef] [PubMed]
- Anedda, A.; Rial, E.; Gonzalez Barroso, M.M. Metformin induces oxidative stress in white adipocytes and raises uncoupling protein 2 levels. J. Endocrinol. 2008, 199, 33–40. [Google Scholar] [CrossRef] [PubMed] [Green Version]
- Lapuente Brun, E.; Moreno Loshuertos, R.; Acin Perez, R.; Latorre Pellicer, A.; Colas, C.; Balsa, E.; Enriquez, J.A. Supercomplex Assembly Determines Electron Flux in the Mitochondrial Electron Transport Chain. Science 2013, 340, 1567–1570. [Google Scholar] [CrossRef] [PubMed]
- Shiba, S.; Ikeda, K.; Horie-Inoue, K.; Nakayama, A.; Tanaka, T.; Inoue, S. Deficiency of COX7RP, a mitochondrial supercomplex assembly promoting factor, lowers blood glucose level in mice. Sci. Rep. 2017, 7, 7606. [Google Scholar] [CrossRef] [PubMed] [Green Version]
- Baeza, J.; Smallegan, M.J.; Denu, J.M. Mechanisms and Dynamics of Protein Acetylation in Mitochondria. Trends Biochem. Sci. 2016, 41, 231–244. [Google Scholar] [CrossRef] [PubMed] [Green Version]
- Kim, S.C.; Sprung, R.; Chen, Y.; Xu, Y.; Ball, H.; Pei, J.; Zhao, Y. Substrate and Functional Diversity of Lysine Acetylation Revealed by a Proteomics Survey. Mol. Cell 2006, 23, 607–618. [Google Scholar] [CrossRef] [PubMed]
- Zhao, S.; Xu, W.; Jiang, W.; Yu, W.; Lin, Y.; Zhang, T.; Guan, K.-L. Regulation of Cellular Metabolism by Protein Lysine Acetylation. Science 2010, 327, 1000–1004. [Google Scholar] [CrossRef] [PubMed] [Green Version]
- Brand, M.D. The proton leak across the mitochondrial inner membrane. Biochim. Biophys. Acta (BBA)-Bioenerg. 1990, 1018, 128–133. [Google Scholar] [CrossRef]
- Larrouy, D.; Laharrague, P.; Carrera, G.; Viguerie-Bascands, N.; Levi-Meyrueis, C.; Fleury, C.; Ricquier, D. Kupffer cells are a dominant site of uncoupling protein 2 expression in rat liver. Biochem. Biophys. Res. Commun. 1997, 235, 760–764. [Google Scholar] [CrossRef] [PubMed]
- Toda, C.; Diano, S. Mitochondrial UCP2 in the central regulation of metabolism. Best Pract. Res. Clin. Endocrinol. Metab. 2014, 28, 757–764. [Google Scholar] [CrossRef] [PubMed]
- Basu Ball, W.; Kar, S.; Mukherjee, M.; Chande, A.G.; Mukhopadhyaya, R.; Das, P.K. Uncoupling Protein 2 Negatively Regulates Mitochondrial Reactive Oxygen Species Generation and Induces Phosphatase-Mediated Anti-Inflammatory Response in Experimental Visceral Leishmaniasis. J. Immunol. 2011, 187, 1322–1332. [Google Scholar] [CrossRef] [PubMed] [Green Version]
- Ruiz Ramirez, A.; Chavez Salgado, M.; Peneda Flores, J.A.; Zapata, E.; Masso, F.; El-Hafidi, M. High-sucrose diet increases ROS generation, FFA accumulation, UCP2 level, and proton leak in liver mitochondria. Endocrinol. Metab. 2011, 301, E1198–E1207. [Google Scholar] [CrossRef] [PubMed]
- Castrejón Tellez, V.; Rodríguez Pérez, J.; Pérez Torres, I.; Pérez Hernández, N.; Cruz Lagunas, A.; Guarner Lans, V.; Rubio Ruiz, M. The Effect of Resveratrol and Quercetin Treatment on PPAR Mediated Uncoupling Protein (UCP-) 1, 2, and 3 Expression in Visceral White Adipose Tissue from Metabolic Syndrome Rats. Int. J. Mol. Sci. 2016, 17, 1069. [Google Scholar] [CrossRef] [PubMed]
- Bhatt, H.B.; Smith, R.J. Fatty liver disease in diabetes mellitus. Hepatobiliary Surg. Nutr. 2015, 4, 101–108. [Google Scholar] [PubMed]
- Baffy, G. Uncoupling protein-2 and non-alcoholic fatty liver disease. Front. Biosci. J. Virtual Libr. 2005, 10, 2082–2096. [Google Scholar] [CrossRef]
- Su, J.; Liu, J.; Yan, X.Y.; Zhang, Y.; Zhang, J.J.; Zhang, L.C.; Sun, L.K. Cytoprotective Effect of the UCP2-SIRT3 Signaling Pathway by Decreasing Mitochondrial Oxidative Stress on Cerebral Ischemia–Reperfusion Injury. Int. J. Mol. Sci. 2017, 18, 1599. [Google Scholar] [CrossRef]
- Serviddio, G.; Bellanti, F.; Tamborra, R.; Rollo, T.; Capitanio, N.; Romano, A.D.; Altomare, E. Uncoupling protein-2 (UCP2) induces mitochondrial proton leak and increases susceptibility of non-alcoholic steatohepatitis (NASH) liver to ischaemia-reperfusion injury. Gut 2008, 57, 957–965. [Google Scholar] [CrossRef] [PubMed]
- Paradies, G.; Paradies, V.; Ruggiero, F.M.; Petrosillo, G. Oxidative stress, cardiolipin and mitochondrial dysfunction in nonalcoholic fatty liver disease. World J. Gastroenterol. 2014, 20, 14205–14218. [Google Scholar] [CrossRef] [PubMed]
- Xu, J.; Li, N.; Wang, J.; Zhang, C.; Ding, S.; Jiao, Y.; Zhang, J. Effect of metformin on the expression of SIRT1 and UCP2 in rat liver of type 2 diabetes mellitus and nonalcoholic fatty liver. J. Cent. South Univ. Med. Sci. 2013, 38, 882–887. [Google Scholar]
- Yang, Q.; Hu, S.; Zhang, Y.; Xie, W.; Li, N.; Ji, G.; Liu, H. Effect of berberine on expressions of uncoupling protein-2 mRNA and protein in hepatic tissue of non-alcoholic fatty liver disease in rats. Chin. J. Integr. Med. 2011, 17, 205–211. [Google Scholar] [CrossRef] [PubMed]
- Rodriguez Ramiro, I.; Vauzour, D.; Minihane, A.M. Polyphenols and non-alcoholic fatty liver disease: Impact and mechanisms. Proc. Nutr. Soc. 2016, 75, 47–60. [Google Scholar] [CrossRef] [PubMed]
- Guo, Z.; Liao, Z.; Huang, L.; Liu, D.; Yin, D.; He, M. Kaempferol protects cardiomyocytes against anoxia/reoxygenation injury via mitochondrial pathway mediated by SIRT1. Eur. J. Pharmacol. 2015, 761, 245–253. [Google Scholar] [CrossRef] [PubMed]
- González-Castejón, M.; Rodriguez-Casado, A. Dietary phytochemicals and their potential effects on obesity: A review. Pharmacol. Res. 2011, 64, 438–455. [Google Scholar] [CrossRef] [PubMed]
- Rafiei, H.; Omidian, K.; Bandy, B. Comparison of dietary polyphenols for protection against molecular mechanisms underlying nonalcoholic fatty liver disease in a cell model of steatosis. Mol. Nutr. Food Res. 2017, 61, 1600781. [Google Scholar] [CrossRef] [PubMed]
- Softic, S.; Cohen, D.E.; Kahn, C.R. Role of dietary fructose and hepatic de novo lipogenesis in fatty liver disease. Dig. Dis. Sci. 2016, 61, 1282–1293. [Google Scholar] [CrossRef] [PubMed]
- Takanaga, H.; Chaudhuri, B.; Frommer, W.B. GLUT1 and GLUT9 as major contributors to glucose influx in HepG2 cells identified by a high sensitivity intramolecular FRET glucose sensor. Biochim. Biophys. Acta (BBA)-Biomembr. 2008, 1778, 1091–1099. [Google Scholar] [CrossRef] [PubMed]


© 2018 by the authors. Licensee MDPI, Basel, Switzerland. This article is an open access article distributed under the terms and conditions of the Creative Commons Attribution (CC BY) license (http://creativecommons.org/licenses/by/4.0/).
Share and Cite
Sosa-Gutiérrez, J.A.; Valdéz-Solana, M.A.; Forbes-Hernández, T.Y.; Avitia-Domínguez, C.I.; Garcia-Vargas, G.G.; Salas-Pacheco, J.M.; Flores-Herrera, O.; Téllez-Valencia, A.; Battino, M.; Sierra-Campos, E. Effects of Moringa oleifera Leaves Extract on High Glucose-Induced Metabolic Changes in HepG2 Cells. Biology 2018, 7, 37. https://doi.org/10.3390/biology7030037
Sosa-Gutiérrez JA, Valdéz-Solana MA, Forbes-Hernández TY, Avitia-Domínguez CI, Garcia-Vargas GG, Salas-Pacheco JM, Flores-Herrera O, Téllez-Valencia A, Battino M, Sierra-Campos E. Effects of Moringa oleifera Leaves Extract on High Glucose-Induced Metabolic Changes in HepG2 Cells. Biology. 2018; 7(3):37. https://doi.org/10.3390/biology7030037
Chicago/Turabian StyleSosa-Gutiérrez, Jorge A., Mónica A. Valdéz-Solana, Tamara Y. Forbes-Hernández, Claudia I. Avitia-Domínguez, Gonzalo G. Garcia-Vargas, José M. Salas-Pacheco, Oscar Flores-Herrera, Alfredo Téllez-Valencia, Maurizio Battino, and Erick Sierra-Campos. 2018. "Effects of Moringa oleifera Leaves Extract on High Glucose-Induced Metabolic Changes in HepG2 Cells" Biology 7, no. 3: 37. https://doi.org/10.3390/biology7030037