1. Introduction
Allometric relationships are generally assumed to be simple, linear (when both variables are log transformed), consistent across large ranges of species of different body masses and, thus, can be easily described using simple scaling equations [
1]. However, in practice, some allometric relationships are much more complex. In these cases, non-linearity (even under log transformation) can sometimes be the rule rather than the exception, and there may also be substantial differences existing between related taxonomic groups in terms of the underlying form (e.g., varying from linear to curvilinear and sigmoidal, even when the data are log transformed; e.g., [
2,
3,
4,
5]). When they exist, these complex allometric relationships can be difficult to model and to explain; however, their complexity also makes them some of the most interesting allometric relationships to explore. In this paper, I use an example of a complex allometric relationship, amniote testes mass allometry, as a case study and show how it can be explored by breaking it down into individual linear components that vary in terms of their level of allometric
vs. isometric scaling. This process is then used to develop hypotheses to explain both the complexity of its general form and to explore its highly variable nature in a limited number of unrelated taxonomic groups.
In the past, testes mass allometry (TMA) was assumed to be a relatively simple, linear relationship when both body mass and testes mass are log-transformed (e.g., [
6,
7,
8,
9,
10]), and most studies that have examined it have done so in order to control for allometry when studying the effects of other potential variables on relative investment in testes mass (e.g., [
6,
7,
8,
9,
10]). However, recent research has revealed TMA in amniotes to be one of the most complex allometric relationships identified to date, both in terms of it general form (which is has a high level of consistency across many orders of birds, reptiles and mammals) and in terms of how it varies dramatically in a small number of taxonomically distinct groups [
2,
11]. This makes controlling for TMA a much more complicated process than has previously been assumed and also highlights that TMA is something worth studying in its own right. Thus, understanding what factors drive this complexity in TMA is important if we are to understand why such complexity exists in the first place and why it only exists in some allometric relationships and not others.
In amniotes, body mass is the most important variable influencing interspecific variations in relative investment in testes mass [
2,
6,
7,
11]. For example, most amniote species conform to a single allometric relationship, where 81.9% of the interspecific variation in testes mass is explained by body mass alone [
2]. This general amniote testes mass allometric relationship (TMA
GA) is particularly interesting, as it is sigmoidal rather than linear, with the relationship being isometric in species smaller than approximately 30 g and greater than approximately 10 kg (
Figure 1). In contrast, between these two body masses, the relationship displays negative allometry. This makes modelling this allometric relationship more complex that a simple linear one. While it might be assumed that the sigmoidal nature of this relationship is driven by phylogenetic relatedness, there is no evidence to support this hypothesis. When 13 different orders of amniotes (two reptiles, six birds and five placental terrestrial mammals) were examined, no evidence was found that any of these groups conformed to significantly different allometric relationships [
2]. Similarly, small reptiles, birds and placental terrestrial mammals are more similar to each other in terms of their relatively investment in testes mass than they are to their larger relatives (within the same genus, family, order or class). Thus, the sigmoidal nature cannot be a result of the presence of disproportionate numbers of species from different taxonomic groups that conform to different allometric relationships in different body mass ranges.
In addition, while most amniotes conform to the TMA
GA, species in three groupings of mammals, marsupials, echolocating bats and cetaceans, are known to conform to very different relationships [
2]. While the testes mass allometry is still negative in these groups, in the first two, it is linear, and in the final, it is curvilinear. Currently, it is unclear why these groups differ in their TMAs from other amniotes, nor is it clear whether the same factors influence interspecific variations in relative investment in testes mass in relation to body mass in these groups as to other amniotes. Again, this does not appear to be driven simply by phylogeny. For example, recent research has suggested that echolocating bats are not necessarily a monophyletic group, and either their distinctive allometric relationship has evolved independently more than once or it evolved once in the order Chiroptera and was subsequently lost in the non-echolocating bats [
2]. Similarly, within the cetaceans, there is no evidence that different families conform to different allometric relationships [
11]. This means that in terms of their relative investment in testes mass in relation to body mass, small members of the family Delphinidae are more similar to cetaceans of a similar size in other families, such as the Phocoenidae, than larger relatives within their own family.
Finally, it is unclear why TMA is negative in all amniote groups, meaning that males of small species invest, on average, much more of their limited resources in their testes mass than males of large species, while in other vertebrate groups examined so far (e.g., frogs and teleost fish), TMA is positive, meaning males of larger species invest proportionately more than males of smaller species [
2].
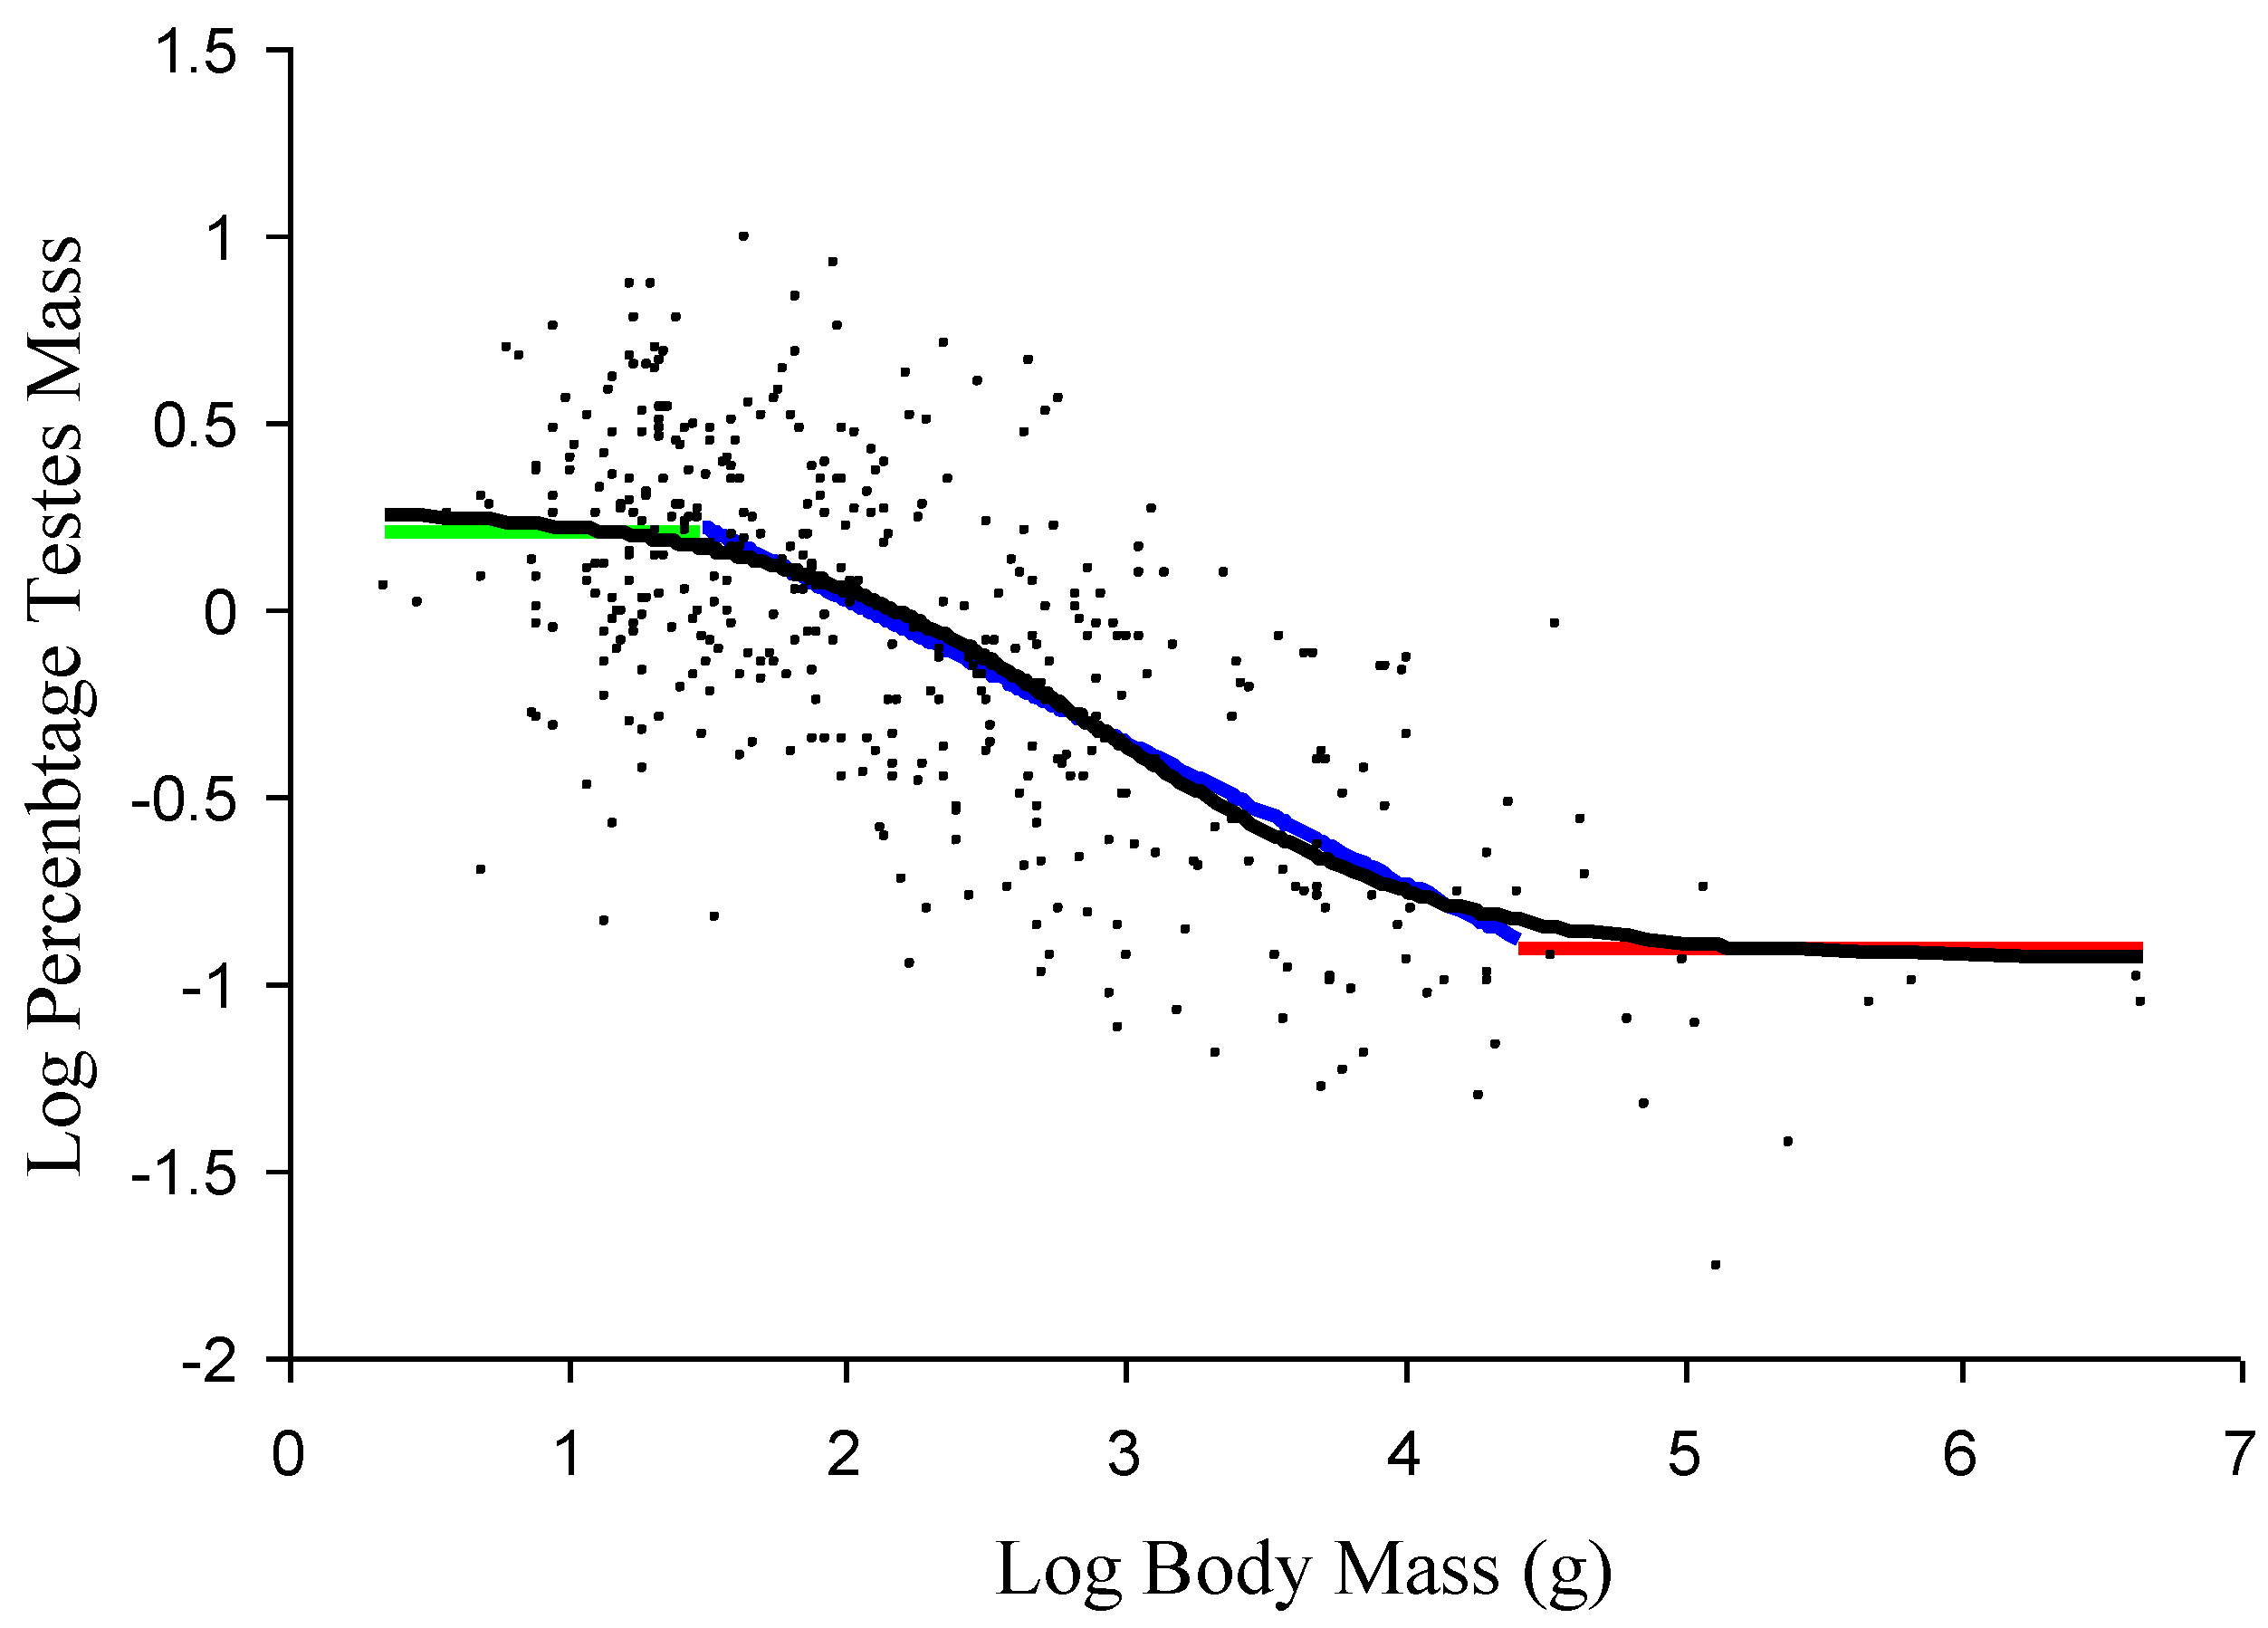
Figure 1.
A comparison of the relationship obtained from the quantification of the proposed model and an additive model (AM) using the general amniote data set (small black circles). Black: the fitted values from the AM for the general amniote testes mass allometric relationship (TMAGA); green: estimated value for the upper size-independent component; blue: estimated relationship for the size-dependent, linear component; red: estimated value for the lower size-independent component. The values are only plotted over the body mass ranges over which they are proposed to dominate.
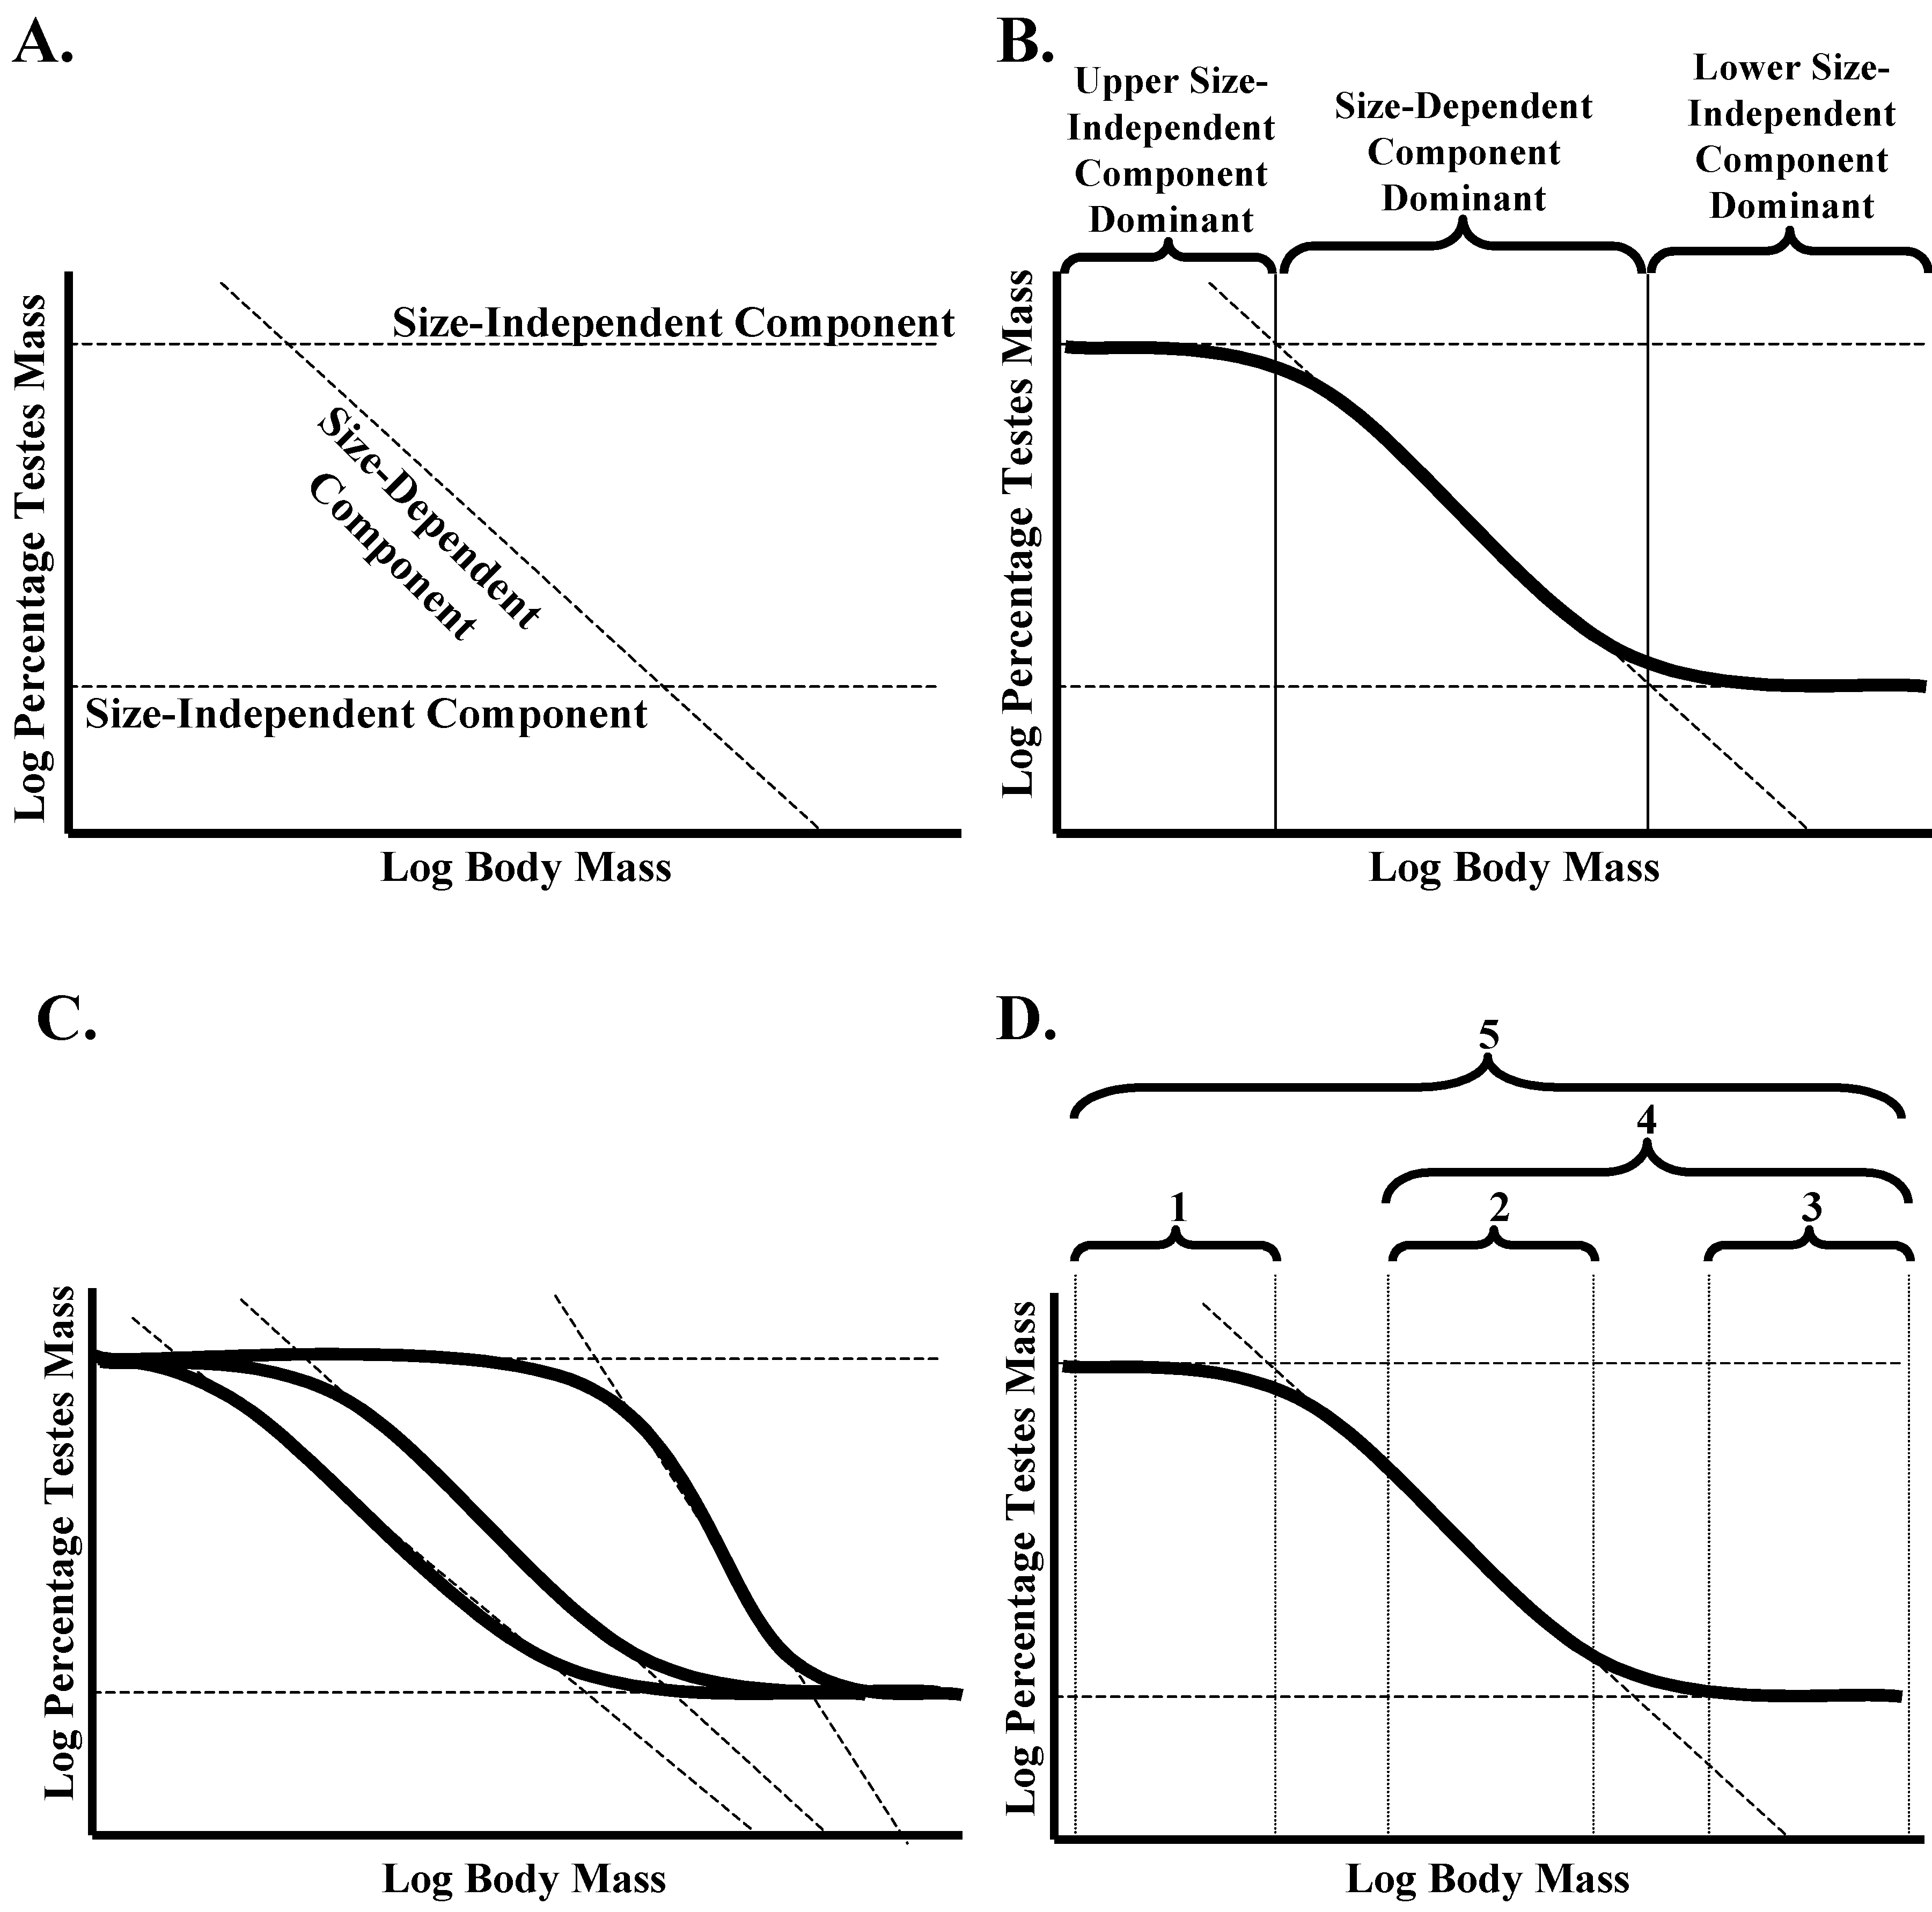
Here, it is proposed that the complex nature of the TMA in amniotes can best be explained by breaking it down into three separate linear components and examining how they interact to produce the overall sigmoidal relationship between log-transformed body mass and log-transformed testes mass. Two of these linear components are size-independent (
i.e., the same proportion of total mass is given over to testes mass, regardless of body mass; representing isometry), while the final one is size-dependent (
i.e., the proportion of total mass is given over to testes mass variation as a function of body mass, so representing true allometry;
Figure 2A). The two size-independent components set the upper and lower limits to the relative investment in testes mass, while the size-dependent component defines how it varies between these two limits (
Figure 2B). The dominance of these three components varies with body mass, and this interaction results in a sigmoidal relationship between body mass and relative investment in testes mass.
Figure 2.
(A) Proposed model of three interacting components to explain the sigmoidal general amniote testes mass allometric relationship (TMAGA) between body mass and relative investment in testes mass. These consist of two size-independent components that set the upper and lower limits to relative investment and a size-dependent component that determines how relative investment in testes mass varies between these two limits. (B) The sigmoidal relationship is the result of different components having a dominant impact on how body mass contributes to the relative investment in testes mass across different mass ranges. (C) While the size-independent upper and lower limits are predicted not to vary between amniote groups, the slope and intercept of the size-dependent relationship can vary. As a result, different amniote groups can potentially differ in the form of the sigmoidal relationship. (D) Within real datasets, the form of the relationship will depend on the body mass range of species within the data set in relation to the inflection points within the sigmoidal relationship for the specific grouping being investigated. 1,3, isometric relationship; 2, linear negative allometric relationship; 4, curvilinear negative allometric relationship; 5, sigmoidal negative allometric relationship.
![Systems 02 00379 g002]()
Further, it is proposed that while the size-independent components are consistent across all amniote taxa, the slope and the intercept of the size-dependent component varies. Thus, the slope and intercept followed by a specific grouping of amniotes for this size-dependent component will define the body mass range across which relative investment in testes mass follows a negative allometric relationship rather than an isometric relationship and, therefore, the form of the sigmoidal relationship in that grouping (
Figure 2C). When the range of body masses for species being analysed falls below this range, the TMA will be isometric and primarily set by the size-independent component that sets the upper limit; within this body range, the TMA will show negative allometry and will primarily be set by the size-dependent component; while above this range, the TMA will again be isometric, but this time primarily set by the size-independent component that sets the lower limit (
Figure 2B,D). When the body mass range of species being analysed crosses one end of this range, the TMA will be curvilinear rather than linear, while when they cross both ends of this range, the TMA will be sigmoidal (
Figure 2D). Therefore, this single model allows the TMA to take a variety of forms in different groupings depending on the slope and intercept of the linear, size-dependent component and the range of body masses in the species being analysed in a specific data set.
Here, data from a range of amniote species that conform to the TMAGA are used to quantify this proposed three-component model. This quantification of the model is then tested using data from marsupials, echolocating bats and cetaceans to see if it can explain why the relationship in these groupings is non-sigmoidal. Specifically, the model predicts that in groupings with a linear relationship (marsupials and echolocating bats), the slope and intercept of the size-dependent component will mean that it does not cross the average values for the two size-independent components for the given range of body masses within the datasets analysed for these species. Similarly, for the grouping with a curvilinear relationship (cetaceans), the model predicts that the slope and intercept of the size-dependent component will mean that it crosses at least one of the average values for size-independent components for the given range of body masses within the data set for these species. Through this, this study aims to increase the understanding of why testes mass allometry in amniotes is much more complex than many other allometric relationships.
2. Experimental Section
The data on body mass and testes mass used in this study were those analysed by [
2] and represent the average adult male testes mass and body mass during the breeding season. Data from general amniote species (all species, excluding marsupials, echolocating bats and cetaceans; these are the groups previously identified as conforming to very different allometric relationships by [
2]) were used to quantify the proposed model in the following manner. An additive model (AM) with a knot value of four was used to identify the approximate body mass values for the upper and lower inflection points in the sigmoidal relationship between log-transformed body mass and log-transformed percentage testes mass. Additive modelling was used rather than generalized additive modelling (GAMs), because there was a normal distribution of residuals around the smoothed allometric relationship (see Appendix 1 of [
2]), and a knot value of four was selected to provide a moderate level of linearity without risking over-fitting the line to the data (following the recommendations of [
12]). The species with body mass values between the two inflection points were used to quantify the linear, size-dependent component using linear regression. The average percentage testes mass values for species with body masses above and below the inflection points were used to quantify the size-independent components that set the upper and lower limits. These values for the each of the model components were then used to compare the modelled relationship with the actual sigmoidal relationship. Following MacLeod and MacLeod [
2] and MacLeod [
12], phylogenetic relatedness was not taken into account when modelling this or other relationships in this study. This was for three reasons. The first is that previous analyses suggest that phylogenetic relatedness does not drive the general shape of testes mass allometric relationships, at least when large numbers of individuals from diverse taxa are analysed together [
2]. Second, when investigating the topology of allometric relationships, rather than simply accounting for them, it is better to treat phylogenetic relatedness as a potential explanatory variable by comparing the relationships between taxonomic groups within a study data set rather than simply removing it [
12]. Thirdly, complete and definitive phylogenetic trees are not available for all species or groups of interest in this study, and those trees that are available may be subject to change based on new studies. Thus, excluding phylogenetic relatedness from this study potentially makes it more robust to future changes in our understanding of how species included in this study are related.
Once this model had been quantified, the upper and lower limits were applied to the remaining data sets (marsupials, echolocating bats and cetaceans) to identify the expected forms of the relationships in these groups (i.e., whether it would be predicted that these relationships would be sigmoidal, curvilinear or linear). An AM was then used to identify whether these predicted forms of the relationship are consistent with the actual relationships. AMs are particularly useful in such an analysis, as they make no a priori assumptions as to the form of the relationship. These AMs were also used to identify any inflection points in the relationship and, therefore, the body mass ranges where the linear, size-dependent component was predicted to apply. These data were then used to quantify the size-dependent component using linear regression for each group. The modelled relationships were then compared to the actual relationships within each grouping. Finally, models for each grouping were used to identify and compare the predicted values where the relationships change from being primarily determined by size dependence to being primarily determined by size independence.
In all analyses, log body mass was used as the independent variable and log percentage testes mass was used as the dependent variable. This is because this provides a clearer picture of where the relationship changed from being isometric to allometric, as this is indicated by a change from a non-significant relationship with body mass to a significant one, rather than by a change from a slope of one to a slope greater or less than one (as would be the case if log actual testes mass were used as the dependent variable). In addition, previous analysis has shown that the allometric relationship derived using log percentage testes mass as the dependent variable is topologically homologous to the one derived using the log of actual testes mass as the dependent variable (that is, when expressed in the same units, both provide identical expected testes masses for a given body mass [
2,
11,
12]). Therefore, the choice of dependent variable will not influence the results of this study.
3. Results and Discussion
Based on the inflection points of the AM smoother for log percentage testes mass against log body mass, the general amniote data were divided into three size ranges. These are species <30 g, species between 30 g and 10,000 g, and species >10,000 g. Within the proposed model, these three groups equate to the approximate size ranges where the upper size-independent component is the dominant influence on the relationship between testes mass and body mass, where the size-dependent component is the dominant influence and where the lower size-independent component is dominant, respectively. The average log percentage testes mass value for species <30 g was 0.205 (SD: 0.328) while the average value for species >10,000 g was −0.910 (SD: 0.352). Therefore, on average, the percentage testes mass of the smallest species is more than 10-times greater that of the largest species, but in both size ranges, the relationship is isometric. The size-dependent component, estimated from species with body masses between 30 g and 10,000 g, is given by the linear equation: log testes mass = −0.3808 × log body mass + 0.7865. Applying these values to a general amniote data set using the proposed model, the allometric relationship obtained closely matches the relationship obtained from the AM model, indicating a good fit between the model and the underlying data (
Figure 1).
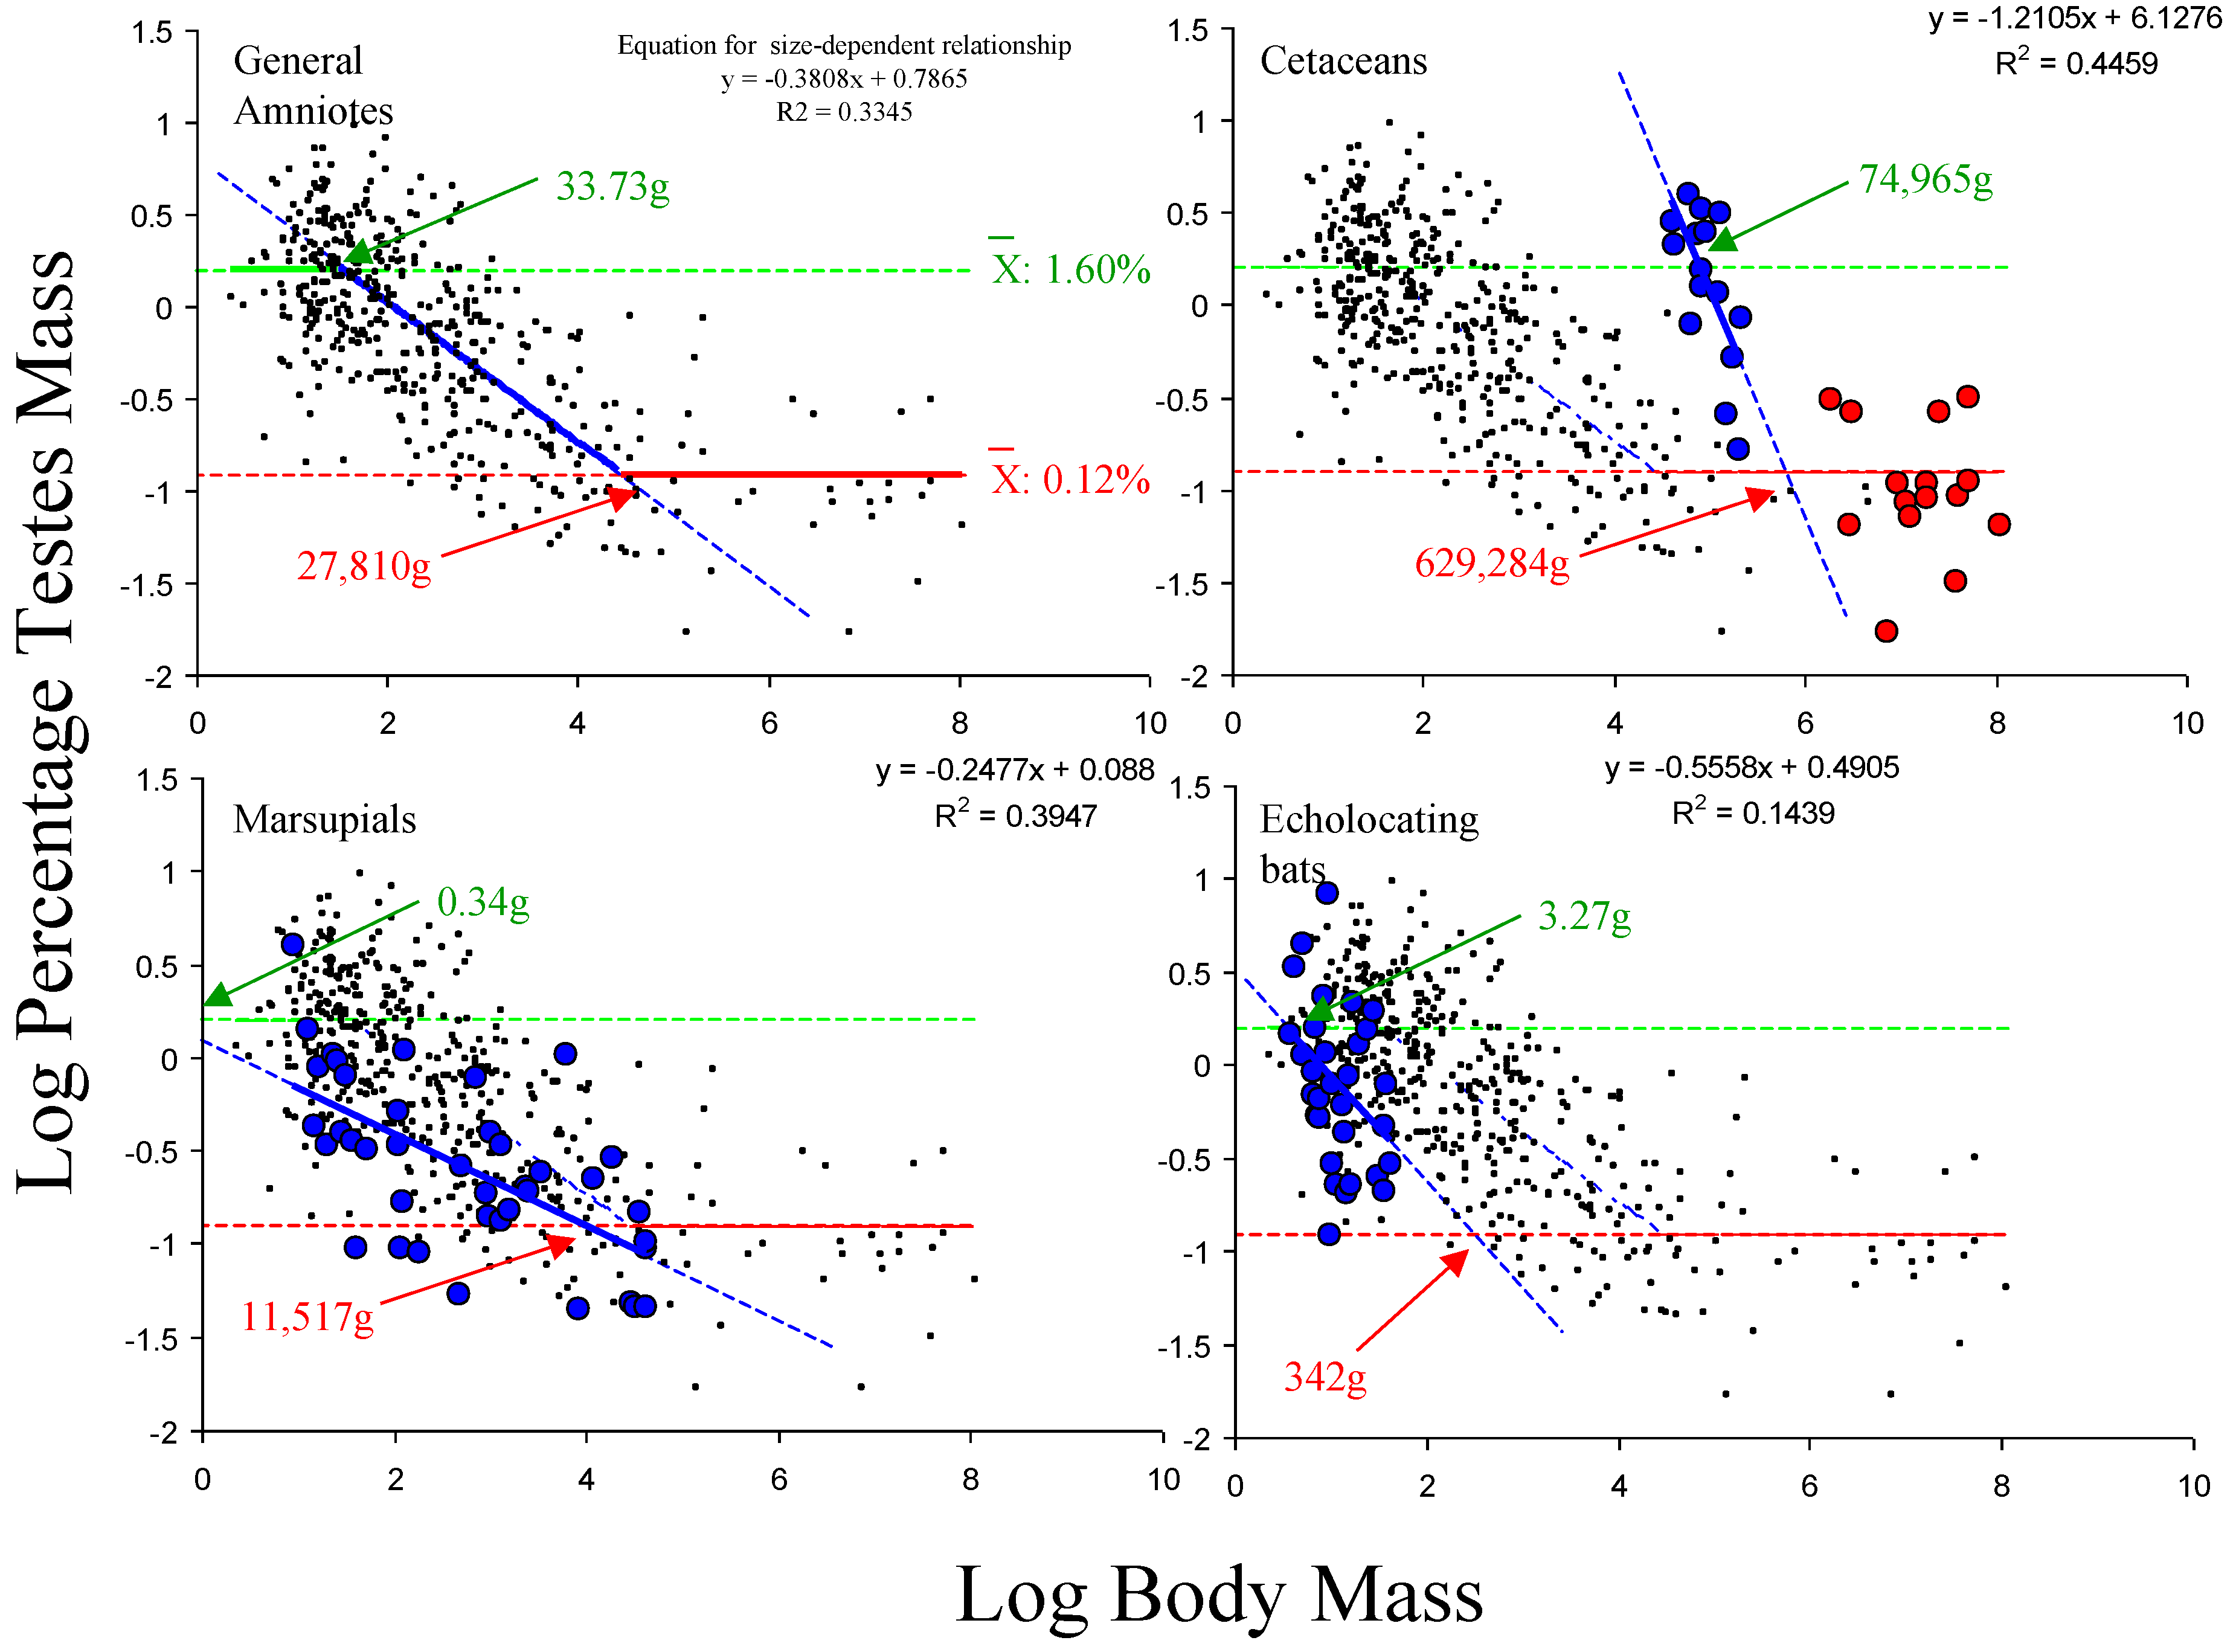
Applying the estimated values for the upper and lower size-independent components to the data sets for marsupials, echolocating bats and cetaceans, this model predicts that for the former two data sets, the functional relationship would be linear, as the slope and intercept of the linear size-dependent component mean that it does not intercept with either the upper or the lower size-independent component within the range of body masses analysed, while in cetaceans, it would be functionally curvilinear, as the linear size-dependent component only intercepts with the lower size-independent relationship and not the upper one (
Figure 3). This is consistent with the forms of these relationships obtained from the AM analyses. This means that the proposed model correctly predicts the forms of the relationship between testes mass and body mass given the size ranges of species in these data sets.
Thus, under this model, the differences in the form of the relationship between the four amniote groupings are driven by differences in the size-dependent component, with each data set having different values for the slope and intercept. This, in turn, results in different estimated body masses for the intercepts between the size-dependent and size-independent components (
Figure 3) and, therefore, different allometric relationships. These intercept values for the three components were estimated for the three additional data sets as for the general amniote data set and are provided in
Table 1.
Figure 3.
Data from amniotes (excluding echolocating bats, marsupials and cetaceans) suggest that the average values for the upper and lower size-independent limits are 1.60% (antilog 0.25) and 0.12% (antilog −0.91), respectively (top left). Given these average values for the size-independent components from the general amniote relationship, the model would predict that the relationship in cetaceans would be functionally curvilinear in the data set analysed here (top right), but that the relationship will be functionally linear in the marsupial (bottom left) and echolocating bat (bottom right) data sets analysed, due to the slope and intercept values for the linear, size-dependent component of the model for these groupings and the body mass ranges within these specific data sets. Red: lower size-independent component dominant; blue: size-dependent component dominant; green: upper size-independent component dominant. Numbers refer to predicted thresholds in dominance for each data set based the group-specific linear size-dependent component.
![Systems 02 00379 g003]()
Table 1.
Estimated body mass values for the intercepts between the different components in the proposed model and, therefore, in the form of the allometric relationship.
Table 1.
Estimated body mass values for the intercepts between the different components in the proposed model and, therefore, in the form of the allometric relationship.
| Grouping | Estimated Body Mass for Intercept with Upper Size-Independent Component (g) | Estimated Body Mass for Intercept with Lower Size-Independent Component (g) |
|---|
| General Amniotes | 33.73 | 27,801 |
| Cetaceans | 74,965 | 620,284 |
| Marsupials | 0.34 | 11,517 |
| Echolocating Bats | 3.27 | 342 |
The relationship between body mass and relative investment in testes mass in amniotes is much more complex than most allometric relationships. This complexity appears to be driven by the fact that it is composed of three separately linear components that differ in their interactions across different body mass ranges. Specifically, there appears to be upper and lower limits to the average proportional investment in testes mass, and this imposes limits to the range of body masses over which the relationship can be linear for any given slope and intercept value. As a result, in general, in amniote species <34 g and species >27.8 kg, the relationship is isometric rather than allometric. However, the average investment in the smaller grouping is more than ten-times that in the larger species. Between these two limits, the relationship is size dependent and linear, meaning that smaller species within this mass range invest proportionately more in their testes mass than larger species. While this upper and lower limit to the proportional investment in testes mass is consistent across all amniotes examined in this study, the size-dependent component can, and does, vary between groupings.
This raises the question as to what determines these upper and lower limits. I propose that the lower limit is set by two aspects of basic physiology that have long been linked to variations in testes mass between species of different sizes. These are that there is a minimum requirement of testes mass for any given body mass to allow them to fulfil their basic functions, such as producing sufficient sperm to ensure fertilization [
13], and the production of hormones, such as testosterone to maintain sexual functions, including spermatogenesis [
14,
15], the production and maintenance of “badges of status” [
16] and male aggression; and therefore, success in intrasexual competition [
17]. Similarly, the scaling of the female reproductive tract with body size may require more and/or larger sperm in larger amniotes to achieve the required numbers of sperm around the egg at the site of fertilization, and therefore, the proportion of testes tissues may, on average, remain constant over large size ranges (that is, when all else is equal, males of larger species need absolutely larger testes, but not proportionately larger testes to achieve the same level of fertilization success).
Such factors could apply in a similar manner to all amniotes, explaining the consistency in the average lower limit between groupings with different allometric relationships, such as general amniotes, marsupials and cetaceans, and between such distantly related groups, such as reptiles/birds and mammals. However, while this average may be similar across groups, individual species may have different minimum requirements for sperm production and/or testosterone production. In particular, varying levels of sperm competition may require different minimum levels. As a result, while this lower limit is size-independent, and therefore the interspecific TMA is isometric, there will also be size-independent variation around the average lower limit to relative testes mass. Finally, the minimum percentage testes masses recorded in the amniote species examined in this study were around 0.016% (found in the gorilla). I propose that this approximates the absolute minimum relative investment possible in male amniotes of a particular species to fulfil the minimum functions of the testes in the absence of sperm competition.
The upper limit may also be imposed by relatively basic physiological limits. Firstly, testes are metabolically-active tissues that are costly to construct and maintain. For example, Kenagy and Trombulak [
6] suggest that testes tissues have a similar basal metabolic rates (BMR) to other body tissues, and therefore, for a male with a percentage testes mass of 1%, 1% of BMR costs will be associated with testes maintenance. As a result, in the species with the largest testes masses (>5% during the breeding season), the potential energetic costs of maintaining proportionately large testes may be substantial, while even in species with much smaller percentage testes masses, it may be non-trivial.
In addition, within an individual’s body, the total amount of resources is limited. Therefore, any resources assigned to the maintenance and functioning of the testes will result in a trade-off with its use in other tissues. For example, in golden-mantled ground squirrels, energy expenditure during mating was only slightly higher than outside reproduction [
18]. As a result, much of the additional costs of mating must be borne by a reduction in energy expenditure on other costs. Similarly, yearling males that forgo testicular development expend four times as much energy on somatic growth as adult males [
19], indicating a trade-off of some kind between testicular development/maintenance and somatic growth. Given that many other tissues are essential for surviving long enough to reproduce (such as muscle mass, brain tissue and the digestive system) or other aspects of reproduction, such as mating searching, energetically-expensive displays and male-male aggressive competition, there may be a limit to the proportion of resources can be diverted from these towards the testes for maintenance and functioning, resulting in an upper limit to the proportional mass that testes can achieve within a given species. Such factors are likely to apply in a similar manner to all amniotes, potentially explaining the consistency in the average upper limit to the relative investment in testes mass as a proportion of body mass (as measured by percentage testes mass) between groupings with different allometric relationships, such as general amniotes (including reptiles, birds and mammals), marsupials, echolocating bats and cetaceans, despite the very large variations of body mass at which this limit is reached. However, its exact value in a given species will depend on the trade-off between the reproductive success provided by testes and the cost to other aspects of the body (e.g., [
8]). In particular, when levels of sperm competition are high, the trade-off may result in a greater proportion of resources being allotted to testes tissue in order to ensure reproductive success, even at the cost of reduced survival, due to the decreased proportional use of resources for other functions [
6,
8,
10]. In contrast, when it is low, the trade-off may be pushed in the opposite direction and select for relatively smaller tissues [
6,
8,
10]. In either case, body mass will not be a factor in this trade-off, so it will be size independent. As a result, when the upper size-independent component is dominant, the TMA is isometric with variation around it due to variations of other factors, such as the levels of sperm competition. Finally, there appears to be an absolute maximal value during the breeding season that is not exceeded within any of the amniote species examined in this study. This is ~9% of body mass, and I propose that this represents the absolute maximum proportion of resources that males of an amniote species can assign to their reproductive tissues without incurring unsupportably high levels of costs for other tissues, functions and survival. Even sperm competition does not appear to be a sufficiently strong selective pressure to breach this apparent maximum level of investment. This having been said, there is some debate as to whether such trade-offs between expensive tissues actually occur [
20] and, thus, whether this is a valid hypothesis to explain the consistent upper limit to testes mass in amniotes. As a result, this should be specifically tested to ensure that it is the case for amniote testes. If it is found not to be correct, an alternative hypothesis for this similar maximal limit to relative investment in testes mass across different amniote groups would need to be proposed.
While it is relatively easy to postulate factors that could set size-independent upper and lower limits to relative investment in testes mass, postulating factors that could explain the negative, linear size-dependent component of the proposed model is more difficult. However, in many ways, this is the most interesting. The average upper limit is more than 10-times greater than the average lower limit in terms of relative investment in testes mass, meaning that smaller species make significantly larger relative investments in their testes mass than larger species, regardless of the levels of sperm competition. MacLeod and MacLeod [
2] considered a number of possible explanations and could not identify any that are consistent with the similarities and differences between a number of amniote groups, and further research is still required to identify and test possible explanations.
However, the model proposed here at least provides some advancement towards answering this question. In particular, it provides an explanation of why the relative investment in testes mass does not get continually greater as species mass decreases below ~30 g or continue to decrease as species body mass increases above ~10 kg (identified as a key factor of any explanation on negative TMA by MacLeod and MacLeod [
2]). This also provides a testable prediction that could provide additional support for the proposed model for the sigmoidal allometric relationship in amniotes between body mass and testes mass. For those groupings where the relationship estimated from the data analysed was not sigmoidal (e.g., marsupials, echolocating bats and cetaceans), the proposed model predicts that this is only due to the body mass values of the species examined, and with a greater range of body masses, a sigmoidal relationship would be detected in these groups, as well. While it is not possible to obtain such a data set for cetaceans (the full range of extant body masses were included in the analysis [
11]), such data could potentially be obtained for echolocating bats and marsupials (see
Table 1 for the details of body mass ranges at which inflection points in the TMAs of these species are predicted to occur).
In addition, this model allows the quantification of the differences in TMAs between groups through the slope and intercept of the linear component. Therefore, it provides an approach for testing whether specific reproductive, taxonomic and/or ecological factors consistently influence variations in the slope and the intercept of the linear side-dependent component of the TMA in a similar manner across different groupings of species. As a result, this three-component model greatly increases the ability to explore what drives the negative allometric relationship in amniotes and why it is highly-conserved in most, but not all, amniote groupings. Finally, whatever this driving force turns out to be, its influence on testes mass may be modified by other factors, such as the level of sperm competition, resulting in a variance in actual values for any specific body mass around the average value indicated by the negative linear allometric relationship.
The variance around the TMA relationship identified using the quantifications of the three components in this study has a potentially interesting application. MacLeod and MacLeod [
2] noted that there is no specific aspect of sperm competition theory that requires or predicts that the level of sperm competition is influenced directly by body mass. That is, there is no innate requirement within the theory that the level of sperm competition and, therefore, the selective pressure it places on relative investment in testes mass should be related to body mass. Such an assertion would be supported if there were a similar variance in actual testes mass values around the average values of the three components in the model identified in this study. This is, indeed, what it seems to be, with no significant difference in the variance in testes mass in species that conform to the general amniote TMA between body mass ranges, where either of the size-independent components are the dominant factors influencing relative investment in testes mass (as indicated by variance in the actual percentage testes mass data), or whether it is the size-dependent component that is the dominant influence (as indicated by the variance in the residual testes mass values around the linear relationship): upper limit dominant (n = 121)
vs. size-dependent dominant (n = 289): F-Test: 0.81,
p = 0.197; upper limit dominant (n = 121)
vs. lower limit dominant (n = 15): F-Test: 0.70,
p = 0.302; size-dependent dominant (n = 289)
vs. lower limit dominant (n = 15): F-Test: 0.16,
p = 0.608. However, while this is consistent with there being no body mass-related component to sperm competition theory (at least for amniotes), there may be other factors that also influence the relative investment in testes mass, after the effects of body mass have been controlled for. Therefore, further research, taking these additional factors into account, would be needed to confirm this hypothesis.


