Identification of Sustainability Key Factors Based on Capturing Dominant Feedbacks of Behavioural Stereotypes in Socio-Economic Systems


1
Faculty of Informatics and Management, University of Hradec Králové, Rokitanského 62, 50003 Hradec Králové, Czech Republic
2
Department of Management, Vysoká škola Manažmentu/City University of Seattle, Panónska cesta 17, 851 04 Bratislava, Slovakia
*
Author to whom correspondence should be addressed.
Systems 2017, 5(2), 42; https://doi.org/10.3390/systems5020042
Submission received: 17 March 2017
/
Revised: 19 May 2017
/
Accepted: 13 June 2017
/
Published: 15 June 2017
(This article belongs to the Special Issue Leadership for Sustainable Socio-Ecological Systems)
Abstract
:Sustainability represents a system attribute that is widely investigated in many disciplines. System dynamics is mostly used for modelling specific issues. Not only can this methodology be used for this purpose, it can also be applied for the identification of behavioural stereotypes and consequent designation of variables that shape sustainability of the system. Based on the set of interviews with a sample of socio-economic system representatives, stereotypes are captured and modelled with the help of causal loop diagrams. After several modelling iterations that synchronised the acquired models with the obtained responses, four main key stereotypes were identified-quality, ego, competence, and motivation. Both dominant feedback loops and important multi-input and multi-output variables are used for their description. Thus, the models provide an endogenous explanation of their importance for sustainability and help to identify its key factors.
1. Introduction
In general, sustainability represents a concept that is a subject of investigation in many disciplines and is studied from various perspectives [1]. Sustainability has already been defined in many ways using a plethora of approaches. The concept is pretty general and thus applicable in various types of systems and domains such as ecology, economics, systems theory, public administration or security [2]. For the purpose of this study, the definition provided by Hodge [3], who states that sustainability represents persistence over an apparently indefinite future of certain necessary and desired characteristics of both the ecosystem and the human subsystem within, is employed. Thus, stereotypes represent the next main concept used in this study. Similar to sustainability, this term is quite general in its nature and is associated with plenty of issues originating from a variety of research disciplines, ranging from cultural and zoological studies to linguistics [4,5]. Contrary to sustainability, stereotypes have distinctive meanings. For instance, for biologists, stereotypes are a group of phenotypic behaviours that are repetitive and morphologically identical and which have no obvious goal or function. This study deals with behavioural stereotypes that can be defined similarly, but be slightly modified, in order to shift it from an application in socio-ecological systems to socio-economic systems. Thus, behavioural stereotypes are fundamental long-term patterns of behaviours, actions or relationships among system elements, which are mostly hidden, unintended and unaware [6]. These traits represent quite an important part of any socio-economic system which exists for a longer time. Apparently, stereotypes evolve continuously and are not an issue in newly established systems. Sooner or later, they will occur and influence the system. A system’s sustainability is not an exception. Therefore, stereotypes have a potential to serve as tools for investigating system sustainability.
Socio-economic systems are usually created with the intention to keep them running as long as they are relevant and meaningful. This statement can be successfully applied to various types of socio-economic systems, such as business units, public bodies, sports teams, communities of interests, etc. Thus, anybody who is in charge of leading the system has to take the sustainability of the system into consideration. Therefore, many studies focusing on basic assumptions or principles of sustainability of this type of system have been conducted and published. At the general level, various studies deal with principal approaches to sustainability. For instance, Pojasek [7] suggests a framework for business sustainability and Geels et al. [8] investigate three major research positions for sustainable consumption and production. Two basic positions are (a) reformist, which focuses on firms pursuing green eco-innovations and consumers buying eco-efficient products; (b) revolutionary, which is a radical critique of the mainstream, advocates the abolishment of capitalism, materialism, and consumerism, and promotes values, such as frugality, sufficiency, and localism. As both approaches are quite strict and rigid, authors suggest a third position-(c) reconfiguration, which focuses on transitions in socio-technical systems and daily-life practices and accommodates new conceptual frameworks. They analyse all three positions along several analytical dimensions and conclude that the reconfiguration position is the most productive. At a more specific level, studies focus on internal and external factors of sustainability. When focusing on external factors influencing sustainability, research studies mostly emphasise on the turbulent nature of contemporary economic environment as the main obstacle to sustainability [9]. From the internal point of view, innovation and its relationship to sustainability prevail in the published research. This relationship is investigated from two perspectives. First, sustainability is studied as a factor that enables innovation. Second, sustainable innovation and business models are explored [10,11]. Finance and investments are also studied with reference to sustainability. For instance, Corrado and Corrado [12] focus on inclusive growth. They emphasise that inclusive finance enables agents to make long-term consumption plans and drives economies on a sustainable growth trajectory. While several studies are focused on sustainability at a general level, some studies focus on specific socio-economic systems. For instance, Fang et al. [13] deal with water socio-economic systems as a part of water management system, in which effectivity of water consumption by companies and households is explored [14]. Ripoll-Bosch et al. [15] focus on farming systems and describe how self-sufficiency, productivity, and diversification influence their economic sustainability.
Although the list of research topics, fields of studies, or types of research stated above represents only a brief excerpt, it can serve as a good starting point for considering sustainability as a phenomenon that deserves attention and resources. That is the main rationale of this study. Apparently, leaders can focus on main sustainability drivers, variables, concepts, dimensions, or determinants in order to achieve sustainability in practice. Several research studies offer a list of them together with a detailed description. They are identified in diverse research disciplines and derived with the help of various methods. System size, profitability, leverage, or listing status can serve as examples of such determinants in the business domain identified by various studies [16,17]. Other drivers found by Fargani et al. [18] are, for instance, incentives, top management commitment, technology, pressure, or legislative framework. Lozano [19] applies a holistic perspective on corporate sustainability drivers. His findings show that internally, leadership and the business case are the most important drivers, whilst the most important external drivers are reputation, customer demands with their expectations, and regulation with legislation. As some items on these lists can be associated merely with business or an economic field of study, some of them can be used as general concepts applicable to the abstract realm of socio-economic systems. This study focuses on the socio-economic system as a specific class of social system in which economic and/or financial perspective on a system play significant roles and abstracts away from specifics tied to single industry sectors, cultural settings, or business-related particularities.
This study is grounded in one of the fundamental insights of the systemic movement; that the system’s structure and behaviour are mutually interrelated and influence each other [20]. Then, conducted research works on two assumptions. First, sustainability depends on a system’s structure (arrangement of elements and their relations), but this relationship is difficult to explore. Second, the system’s behaviour can be considered as a result of the system’s structure and its modification over time is a proper, direct indicator of sustainability. Hence, the main research question of this study is formulated as follows: what behavioural stereotypes and their key factors shaping a socio-economic system’s sustainability can be identified when system dynamics modelling is applied? Based on this research question, three main objectives are set: (1) to acquire a dataset consisting of insights, opinions and experience of systems’ insiders; (2) identification of main stereotypes and their variables; (3) transformation of stereotypes into causal loop diagrams in order to provide endogenous explanation of stereotypes and their key variables as main sustainability determinants.
The remainder of the manuscript is structured as follows. The introductory section defines the main context and research question of this study. The second section focuses on applied methodology. Details related to interviews and sampling techniques are explained. The next section presents acquired results in a form of causal loop diagrams depicting stereotypes and identification of dominant feedbacks and key variables. Then, results are discussed and interpreted. Existing limitations of this study and associated future research directions are depicted in the next section. Finally, the last section concludes the manuscript.
2. Methodology
The methodology used in this study is based on the unique research approach, as it applies system dynamics modelling to identify behavioural stereotypes and determine how their key factors influence the sustainability of socio-economic systems. The achievement of a set of objectives is built on the performance of the following stages: (1) data gathering grounded in interviews; (2) dataset processing and analysis, which results in the identification of main areas that could be described; (3) development of causal loop diagrams describing stereotypes and the identification of key factors; (4) clarification of how stereotypes and key factors are related to system sustainability.
2.1. Interview
An interview as a technique for gathering data represents a formal way of communication. There are several types of interviews available: structured, unstructured, semi-structured, direct, technology-supported, individual, group, etc. As the main topics were focused on behavioural stereotypes, archetypes and patterns, the individual, direct, semi-structured interview was selected as the most suitable alternative, the reason for which was a need to interact with the interviewees. Reducing the randomness of topics, increasing the willingness to attend and more open communication with the interviewer, and asking additional questions if needed was required. However, this approach was associated with quite a significant time demand. Only open questions were applied during the interviews. All respondents were ensured and agreed with anonymisation in order to suppress their identity. For the purposes of consequent analysis, single interviews were audio-recorded with the consent of all interviewees.
The set of interviews was separated into two runs. During the first one, only four respondents were interviewed in order to test and adjust the question set and the interview procedure. Acquired results were not included in the analysis. The second run was associated with the actual interviews.
The interview started with four questions related to aforementioned classifications and focused on items that could not have been acquired a priori or whose nature required confirmation (e.g., the number of employees or a specification of the exact number of finished career years). Consequently, the interview was conducted by asking seven questions focused on the identification of the stereotypes in the system. The interviewees had a chance to answer without any limitation (time, form, etc.). The only constraint was the necessity to focus on the selected topic in the question and keeping sustainability issues in mind. Each session lasted 120 min on an average, ranging from 105 to 130 min of duration. The stated questions were the following:
- Could you name some typical problems that have to be repeatedly solved in your organisation? Are there any formally established procedures applied for the solutions of these problems?
- Is there any type of behaviour of your employees that is identifiable in the long-term perspective? If yes, in which situation and under which circumstances does this behaviour happen?
- Have you noticed situations which provoke similar behaviour by your employees? If yes, describe it in detail.
- Do you artificially evoke situations in your organisations in order to obtain required behaviour or a specific state?
- Have you found out during your working experience that certain situations were very likely to produce a certain type of human behaviour demonstrated mostly with the same course?
- Which repeated behaviour of your colleagues are you able to describe and in which situations?
- Are there repeated or long-term tendencies to solve or avoid any kind of behaviours or situations?
Causal loop diagrams represent the main tool used for visualising links among main concepts and keywords identified in answers. Polarities are used at each link’s arrow head. Positive polarity (+) means that the two variables change in the same direction (if the value of the first one decreases, the value of the other variable also decreases; the same goes for value increase). Similarly, negative polarity (−) means that the two variables change in opposite directions (if the value of the first one increases, the value of the other variable decreases, and vice versa).
The analysis of the answers was based on principles presented by Cavana and Mares [21]. It started with the identification of the main keywords and concepts. The keywords were identified and gathered into groups that were later named by stereotypes identified in answers (e.g., competence was noticed in a number of answers; hence, a stereotype was identified). Variables that were related to an identified stereotype group were put together into a causal loop diagram that described variables, causalities and feedback loops amongst those selected variables. Causal loop diagrams were created by iteration when, first, all identified variables were selected and causalities amongst them identified. Later, some of the variables were left out to keep relevance, simplicity and understanding of projected diagrams. Some of the identified and described variances were also aggregated to a common one.
2.2. Sampling
Sampling represents a significant part of any research. Selection of the sampling method radically influences the quality of the acquired dataset. Mostly, the random selection technique is considered the best alternative. However, this can be associated with cardinal issues tied to the implementation in practice. Therefore, stratified sampling among Slovakian companies was applied. The reason was to minimise the specifics related to the Slovak economic and business environment and culture [22]. Multinational companies with subsidiaries in Slovakia were included this way as well (see Table 1). The first contact with the potential respondents was conducted either by email or a telephone call. Altogether, 62 institutions were contacted. The research purpose and aims were briefly introduced and requirements (e.g., time span) depicted. In case of three instances, personal direct addressing was used. The respondents did not receive interview questions in advance. This procedure resulted in a set of 26 organisations where selected individuals were interviewed. This selection was based on the criterion-based technique and the snowball technique in order to ensure various perspectives on the investigated topics. The snowball technique is a non-probability sampling strategy in which referrals from earlier participants are used to gather the required number of participants. It takes an inductive approach to “growing” the sample as the research progresses. Criterion-based techniques are used to yield as much information-rich data as possible. The data collected may take a variety of forms (field notes, observation, interview transcripts, photographs, videos, etc.) [23,24]. A minimum of five years’ working experience in the current organization was the only limitation. There are two reasons for it. First, respondents are more familiar with the procedures or specifics of the organisation. Second, as the main topics investigated are stereotypes and patterns, only responses that are fully absorbed by and involved in the organisational behaviours should be considered. Due to the aforementioned separation of gathering data into two runs, the test interviews were conducted with four respondents while 22 interviews represented the real process of data gathering. The final sample included both men and women. Every respondent was a representative of one organisation only; i.e., 22 organisations were included in the research. However, gender issues are not investigated in this research study. This sample was used twice during the research. The first task was to acquire a dataset that could be analysed. The second task was to help with the modification of developed diagrams in order to better describe the problem dynamics and suggest ways for improvement if the sustainability of the system were the only issue. Applied classifications are outlined in Table 1, Table 2, Table 3 and Table 4. The final sample is characterised in Table 5 in which additional data about career years in the current company are stated.
2.3. System Dynamics
Once the interview process offered outcomes that could be processed, the system dynamics approach was applied to acquire descriptions of stereotypes with their key factors that shape sustainability of investigated socio-economic systems; namely, modelling by means of causal loop diagrams was used, which means that qualitative system dynamics modelling was applied. Qualitative approaches often use causal loop diagrams to look at the feedback structure implicit within a system. Diagrams highlight the causes and effects of the system phenomenon but do not, in themselves, provide quantitative insights on system evolution. However, these can, in themselves, be useful as a means of mapping the system and its drivers. System dynamics is concerned with the dynamic behaviour of real-world systems. Some techniques have been developed specifically to take care of qualitative concepts and these include qualitative reasoning, soft systems methodology, and causal loop diagrams. Approaches like qualitative modelling allow scientists to create dynamic models able to cope with uncertainty and incomplete information through the use of latent constructs as the main unit of analysis. Not only does this allow for a flexible and relatively easy structuring of the modelled event, but the approach enables direct and intuitive interpretation of the results [25]. Qualitative modelling helps to construct a quantitative model, which consists of stocks, flows and diagrams. Qualitative models do not require mathematical formalism, but are used to represent ideas visually and perceived patterns or relationships between parts.
The decision to apply this methodology was grounded in a systematic literature review that revealed quite a significant methodological gap. Although sustainability has already been connected with systems thinking in general [26,27] or system dynamics modelling in particular [28,29,30], the identification of key sustainability factors based on an endogenous system dynamic model is quite surprisingly missing. Mostly, sustainability dimensions, determinants or key concepts were included in models based on various research methods from distinctive disciplines. As system dynamics modelling is being used in many fields of study in order to find explanations for various phenomena [31,32,33], we apply system dynamics as an analytical tool used for identification of main causalities and feedbacks in our study. The research methodology employ widely used causal loop diagrams [34,35] as tools for transformation of obtained interview results into the endogenous models. These models visualise stereotypes, capture the dynamics implicitly contained in interviewees’ answers and serve as a source of identification of key sustainability factors.
3. Results
The interviews resulted in various reactions, answers, emotions, insights and opinions. While some of them were sporadic, some answers occurred repeatedly in various forms. The following examples represent a brief excerpt.
Question 1—“Could you name some typical problems that have to be repeatedly solved in your organisation? Are there any formally established procedures applied for the solutions of these problems?”
- (a)
- Useless meetings organised purposefully in order to report an activity.
- (b)
- Focus on useless details, such as attendance monitoring, which enables to punish those who are not favourites.
- (c)
- Building power positions in order to control situation.
- (d)
- There is an instant need to deal with unintended consequences of wrong decisions. This leads to demotivation and disillusion.
- (e)
- Unwillingness to think about unpredictable situations regardless of their repeated emergence results, putting pressure on those who have to deal with it eventually.
- (f)
- Inappropriate communication with customers as a cause of repetitive complaints.
- (g)
- Inconsistency between intentions possessed by subsidiaries and headquarters.
- (h)
- Ability to keep experts.
- (i)
- Need to continuously control quality.
- (j)
- Necessity to identify the most proper corporate culture and ways of motivation.
Question 2—“Is there any type of behaviour of your employees that is identifiable in the long-term perspective? If yes, in which situation and under which circumstances does this behaviour occur?”:
- (a)
- Creation of an atmosphere in which fear and tension prevail. This results in negative attitudes associated with unfair behaviour, lies and excuses.
- (b)
- Necessity to delineate own space, in which ego can be pushed through.
- (c)
- Not thinking about how to solve a problem, but about how to avoid it.
- (d)
- Tendency to overload with work based on inability to refuse tasks or an effort to build an irreplaceability status.
- (e)
- Focus on tangible short-term objectives rather than intangible long-term ones.
- (f)
- Non-formal relationships that support productivity and relaxed atmosphere.
Question 3—“Have you noticed situations which provoke similar behaviour by your employees? If yes, describe it in detail.”:
- (a)
- Promotion of incompetent employees based on unprepared decisions. This has a negative impact on effectiveness and productivity.
- (b)
- Meaningless strong focus on risk minimisation instead of dealing with progress in development.
- (c)
- Ability to identify whether the anticipated chance can lead to improvement or deterioration.
- (d)
- Newcomers have the ability to make many changes if they are allowed.
- (e)
- Good results build trust. This results in pardoning mistakes.
- (f)
- Instant need to continuously monitor relaxed atmosphere as this can be easily abused.
- (g)
- Quality based on incessant control and standardisation.
- (h)
- Unwillingness to contact unknown people with requirements.
Question 4—“Do you artificially evoke situations in your organisations in order to obtain required behaviour or a specific state?”:
- (a)
- Every action causes a reaction, i.e., people react according to experience with their environment.
- (b)
- Top management tries to share visions, intentions and objectives which is perceived positively with a willingness to participate.
- (c)
- Brainstorming represents a powerful tool for problems with decision-making.
- (d)
- Positive motivation is better than a negative one.
- (e)
- Positive thinking can support the achievement of a seemingly unachievable objective.
- (f)
- Education based on examples and models.
- (g)
- “White lies” communicated in an appropriate way can result in motivation.
- (h)
- If manipulation is needed, it should not be recognised.
Question 5—“Have you found out during your working experience that certain situations very likely produce a certain type of human behaviour demonstrated mostly with the same course?”:
- (a)
- If people are not allowed to participate, they have a tendency for apathy or lethargy.
- (b)
- Information overload leads to uncertainty.
- (c)
- Uncertainty creates an atmosphere of fear and stress, which results in the decrease of motivation.
- (d)
- People prepare excuses in advance in order to avoid decision-making.
- (e)
- Personal contact improves understanding.
- (f)
- It is not an easy task to push through any change. However, when you persist, you will sooner or later succeed.
- (g)
- People have a tendency to make their work easier and reduce their duties if the control is insufficient.
- (h)
- Short-term solutions based on missing long-term objectives are always contra-productive.
- (i)
- Calling attention to existing problems is mostly considered as a failure. Then, people have a tendency not to accept it but they prefer conflict.
Question 6—“Which repeated behaviour of your colleagues are you able to describe and in which situations?”:
- (a)
- People mostly do what they think others expect them to do and thus anticipate consequent positive evaluation.
- (b)
- Reasons for certain types of behaviours are mostly different than that are presented.
- (c)
- Those who are not able to adapt will very likely leave the organisation.
- (d)
- If you achieve superior results continuously, then any small mistake can lead to your dismissal.
- (e)
- Keeping promises represents quite a sensitive aspect of work.
- (f)
- If managers want to be widely accepted, they need to play a fair game and be consistent.
- (g)
- Subordinates are afraid of complaining due to anticipation of retaliatory actions.
- (h)
- Implementation of changes based on the bottom-up principle is difficult.
- (i)
- Too frequent modifications of an objective lead to weaker cohesiveness.
- (j)
- More time is required to identify wrong decisions in case of managers with personal charm.
Question 7—“Are there repeated or long-term tendencies to solve or avoid any type of behaviour or situations?”:
- (a)
- Management communicate and cooperate merely with preferred group of subordinates.
- (b)
- If you want to solve an issue, you need to be calm.
- (c)
- Life is multi-colourful, not black and white.
- (d)
- Unsolved conflicts represent a time bomb that will certainly explode in the future.
- (e)
- Quality of any team is grounded in diversity.
- (f)
- It is not possible to adapt to every change.
- (g)
- You do not have to always choose the best ones, but the most appropriate ones.
- (h)
- Form is important as much as content from time to time.
- (i)
- System enables to work separately and with limited connections to others, which leads to the feeling of irreplaceability.
- (j)
- Process effectivity is only a reflection of effectivity of people involved in the process.
Apparently, all interviewees can identify and describe either of the causalities (A results in B) or the relationship, mostly between two phenomena. A holistic point of view was applied only occasionally. Interviewees did not identify any problem from the systemic point of view in terms of feedbacks, non-linearity or emergence. This leads to the necessity to synthesise acquired results and develop a systemic view on the described issues.
The analysis of the answers started with the identification of the main keywords and concepts. This led to a creation of diagrams presented below. The most important concepts represent the Multi-Input Multi-Output (MIMO) type of variables, i.e., variables with more than one input and more than one output simultaneously. These are considered as key sustainability factors included in a given stereotype. Although all variables are important in the systemic approach and have their own meaning in a model, one can state that the lesser the inputs or outputs, the lower is the relative significance of the concept in the model. Moreover, variables that are intensively used in feedback loops are also considered as key variables. Consequently, a diagram representing stereotypes was titled in order to emphasise its main topic: Quality, Competence, Egoism, and Motivation. The four most significant diagrams are presented below.
3.1. Quality
Quality represents a concept that is included in many answers or insights. Although its perception and meaning of the concept very likely differ among the interviewees (focus on outcome, process, management, etc.), its fundaments are grounded in principles shared by all of them. The development of the diagram was based on various answers; for instance, 1h, 1i, 2f, 2g, 5g, 7e, or 7j, to name examples from the list provided in paragraphs above. The diagram was created in several iterations in order to most properly capture causalities and feedbacks contained in interviewees’ reactions. The final version is presented in Figure 1.
The diagram comprises many feedback loops. However, from the sustainability perspective, there are three most important feedback loops identified. They are labelled B1, R1 and R2. Letters denote whether the feedback is negative (B—balancing) or positive (R—reinforcing). Below, causalities in the diagram are delineated by an arrow showing the direction and polarity in oval brackets.
The feedback loop B1 is the most complex one and consists of the following variables—Product quality -> (+) Satisfaction of customers with products -> (−) Amount of warranty claims -> (+) Resources needed for warranty claims -> (−) Resources dedicated to process controlling and standardisation -> (−) Resources for training of employees -> (+) Effectivity of output production -> (−) Amount of erroneous outcomes -> (+) Resources required for outcome controlling -> (+) Growth of total costs -> (−) Profitability of the organisation -> (+) Profit-based motivation of employees -> (+) Product quality. However, this complex balancing feedback partially overlap with the feedback loop R1 that comprises the following concepts—Product quality -> (−) Amount of warranty claims -> (+) Resources needed for warranty claims -> (−) Resources dedicated to process controlling and standardisation -> (+) Effectivity of output production -> (+) Product quality. Feedback loop R2 contains the following variables—Profitability of the organisation -> (+) Profit-based motivation of employees -> (+) Product quality -> (+) Satisfaction of customers with products -> (+) Repeated purchase of products -> (+) Profitability of the organisation.
3.2. Competence
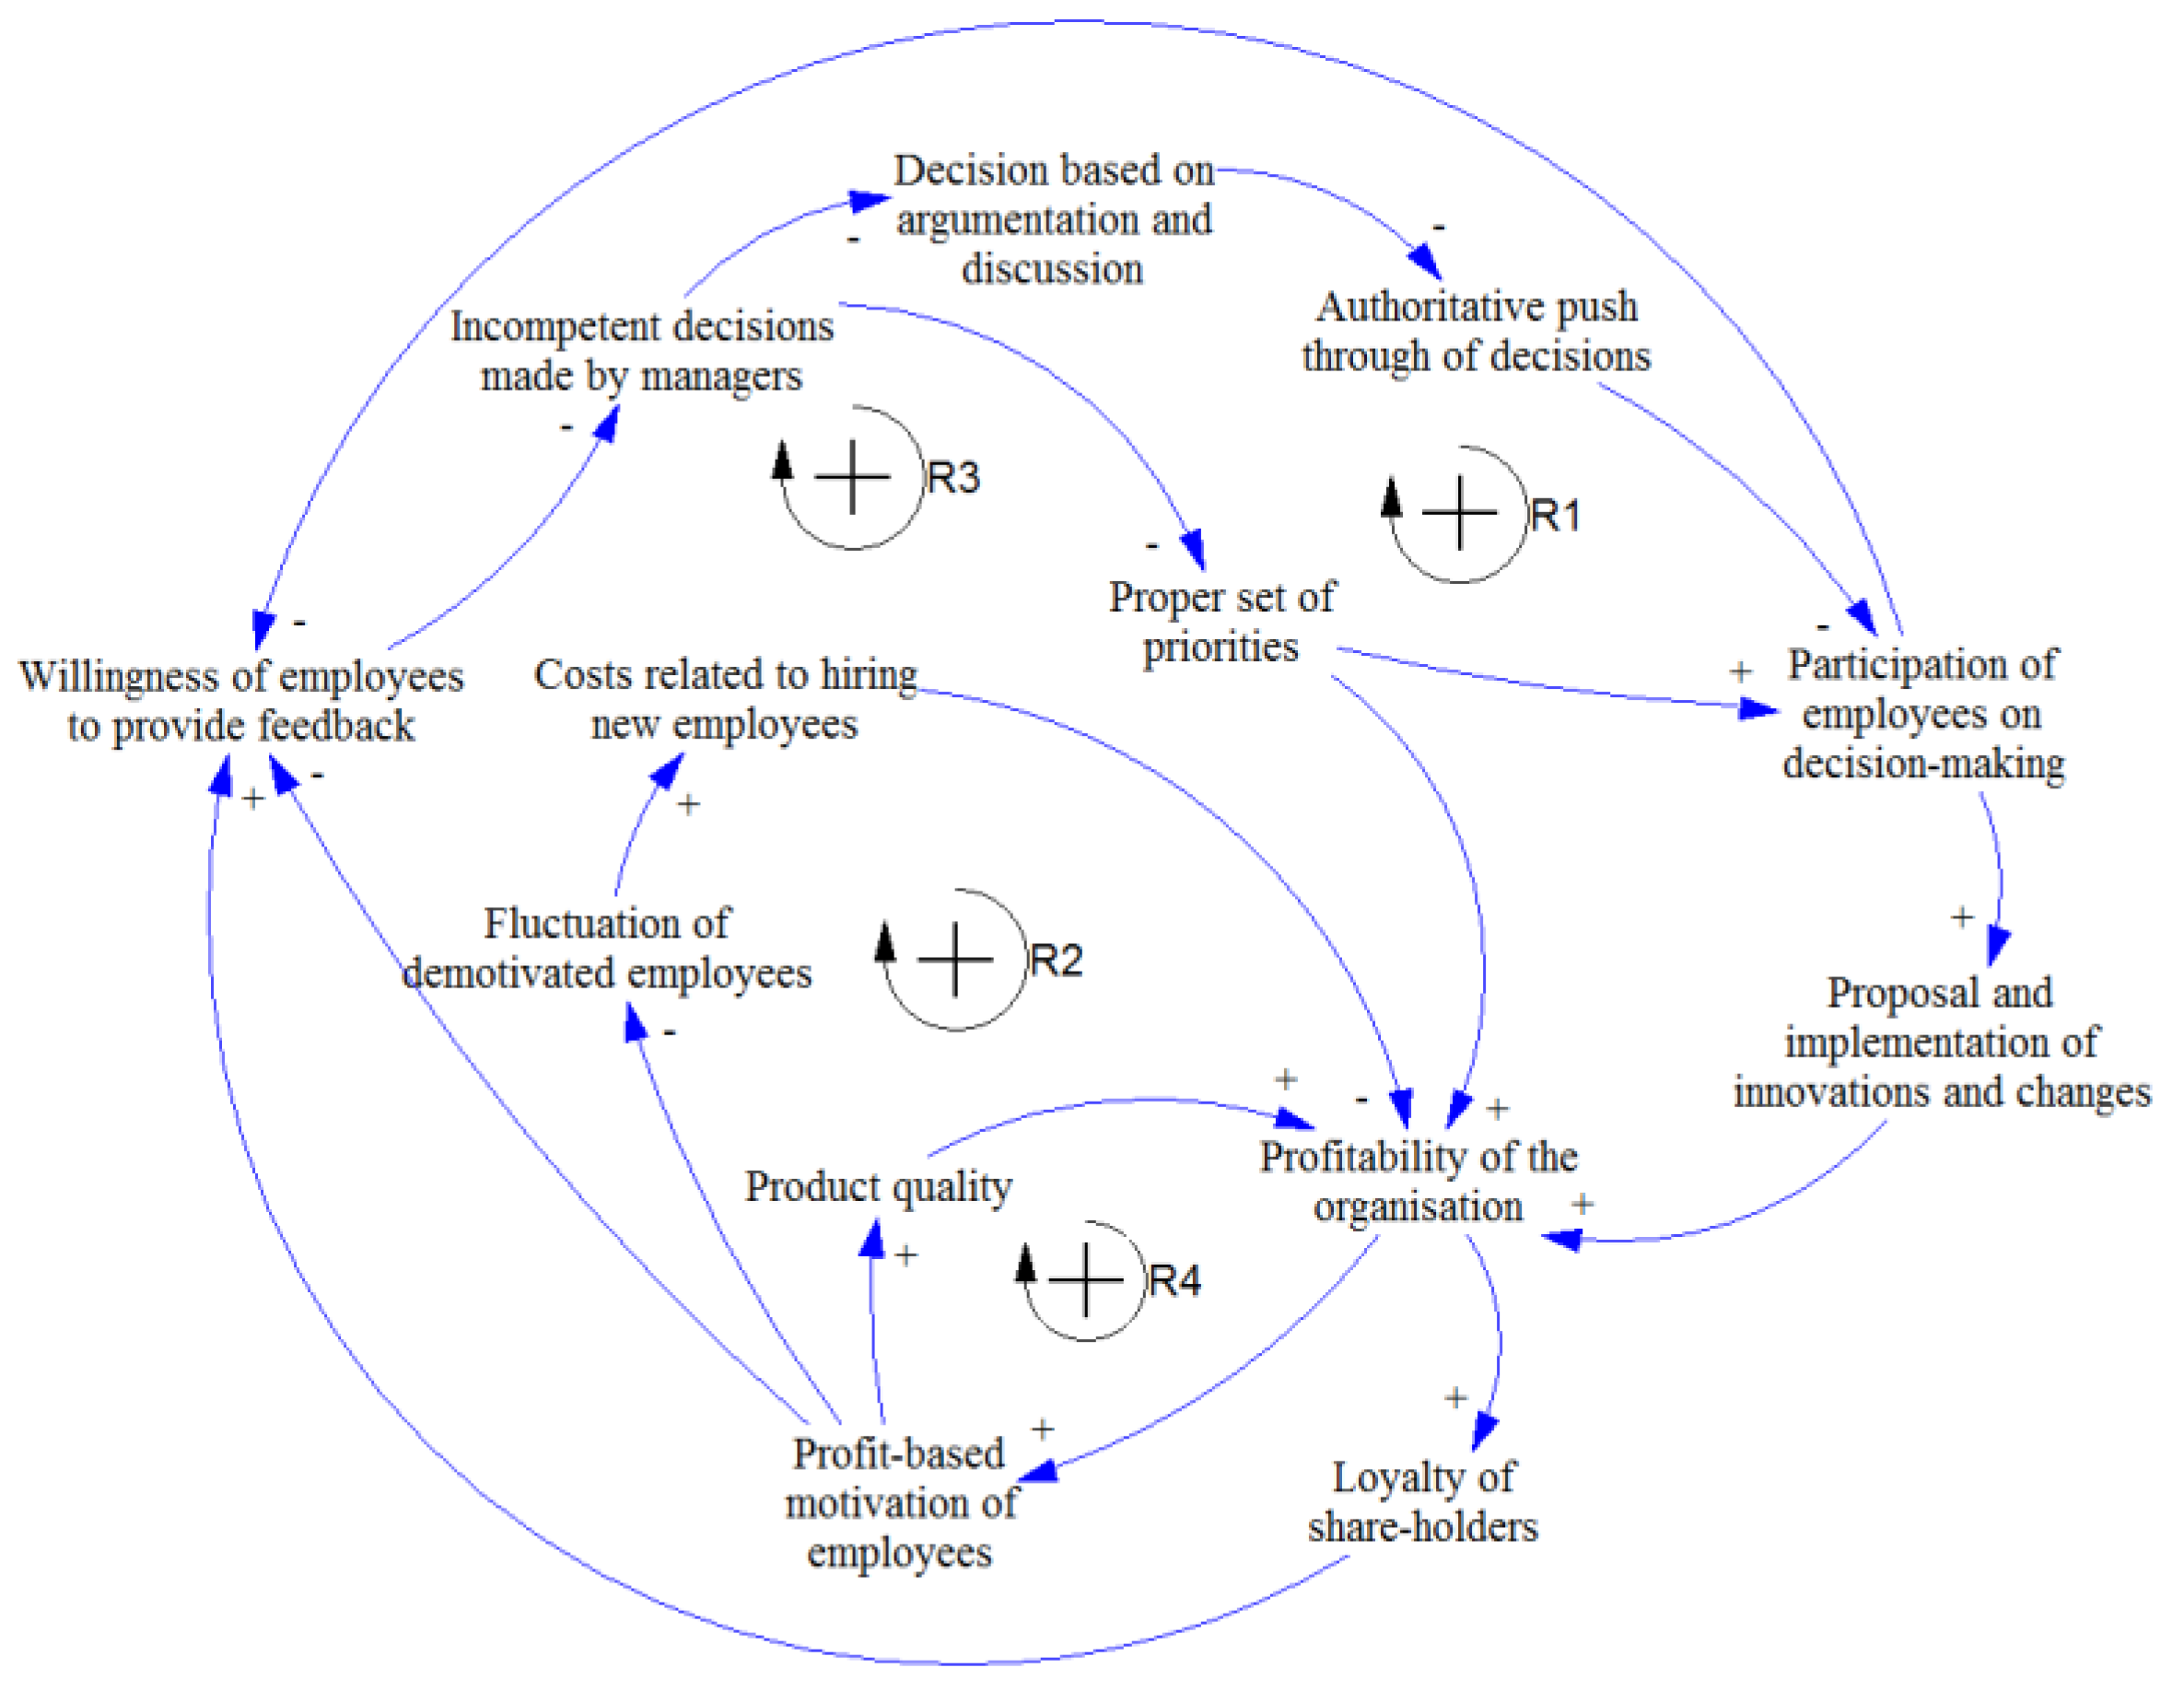
Competence is a subject of many research studies or training books [36]. Therefore, it is not surprising that competence belongs to one of the main important factors if the system needs to support sustainability. The diagram is again based on various answers, for instance, to questions 3a, 5a, 5h, 6g, 6j, or 7i. Again, several modelling iterations led to the final version of the diagram presented in Figure 2. The key variable here is the competency of management that influences many other concepts. As it can be seen in Figure 2, this stereotype consists of many important reinforcing feedbacks, namely R1, R2, R3 and R4.
The following feedback loops that are important for support of sustainability are identified. R1 represents the most complex feedback loop: Incompetent decisions made by managers -> (−) Decisions based on argumentation and discussion -> (−) Authoritative push through of decisions -> (−) Participation of employees on decision-making -> (+) Proposal and implementation of innovations and changes -> (+) Profitability of the organisation -> (+) Loyalty of shareholders -> (+) Willingness of employees to provide feedback -> (−) Incompetent decisions made by managers. The reinforcing feedback R2 consists of the following concepts—Profitability of the organisation -> (+) Profit-based motivation of employees -> (−) Fluctuation of demotivated employees - > (+) Costs related to hiring new employees -> (−) Profitability of the organisation. Reinforcing feedback R3 represents a shorter pathway presented in the feedback loop R1. It comprises the following concepts—Willingness of employees to provide feedback -> (−) Incompetent decisions made by managers -> (−) Proper set of priorities -> (+) Profitability of the organisation -> (+) Loyalty of shareholder -> (+) Willingness of employees to provide feedback. Reinforcing feedback loop R4 is quite identical to the feedback loop R1. The difference between these two feedback loops is that, while R1 is externally-oriented and relies on shareholders, R4 is an internal one which is based on the motivation of employees. Feedback loop R4 comprises the following variables—Incompetent decisions made by managers -> (−) Decisions based on argumentation and discussion -> (−) Authoritative push through of decisions -> (−) Participation of employees on decision-making -> (+) Proposals and implementation of innovations and changes -> (+) Profitability of the organisation -> (+) Profit-based motivation of employees -> (+) Willingness of employees to provide feedback -> (−) Incompetent decisions made by managers.
3.3. Egoism
Egoism represents a phenomenon that is related to many issues in an organisational behaviour domain [37,38]. Moreover, this approach is implicitly comprised in one of the main system archetypes—Tragedy of Commons [39]. It stresses the consequences of placing continuously growing demands and requirements on limited resources. Hence, it is necessary to avoid specific behavioural patterns in order the keep the system working in an effective way. The following diagram presented in Figure 3 is based on answers to various questions, for instance, 1b, 2b, 2c, 2d, 5g, 6j, or 11i.
There are following feedback loops that can be directly connected with system sustainability. The loop B1 contains the following concepts: Development of possibilities to limit others -> (+) Power building -> (+) Charisma of managers as a managerial tool -> (+) Authoritative decision-making -> (−) Willingness to process feedback -> (+) Proper set of priorities -> (+) Debate-based conflict-> (+) Looking for excuses -> (+) Monitoring of useless details -> (+) Development of possibilities to limit others. Reinforcing feedback R1 comprises the following variables: Monitoring of useless details -> (+) Development of possibilities to limit others -> (+) How to cheat the system -> (+) Looking for excuses -> (+) Monitoring of useless details. The next feedback loop B2 is balancing in nature. It contains these variables: Too many tasks and overworking -> (−) Willingness to delegate decisions -> (−) Giving preferences to individualism -> (−) Proper set of priorities -> (+) Debate-based conflict -> (+) Form is more important than content -> (+) Monitoring of useless details -> (+) Development of possibilities to limit others -> (+) Demarcation of private space -> (+) Building of irreplaceability status -> (+) Too many tasks and overworking. Finally, the feedback B3 consists of the following concepts: Willingness to process feedback -> (+) Proper set of priorities -> (+) Debate-based conflict -> (+) Looking for excuses -> (+) Monitoring of useless details -> (+) Development of possibilities to limit others -> (+) How to cheat the system -> (−) Willingness to process feedback.
3.4. Motivation
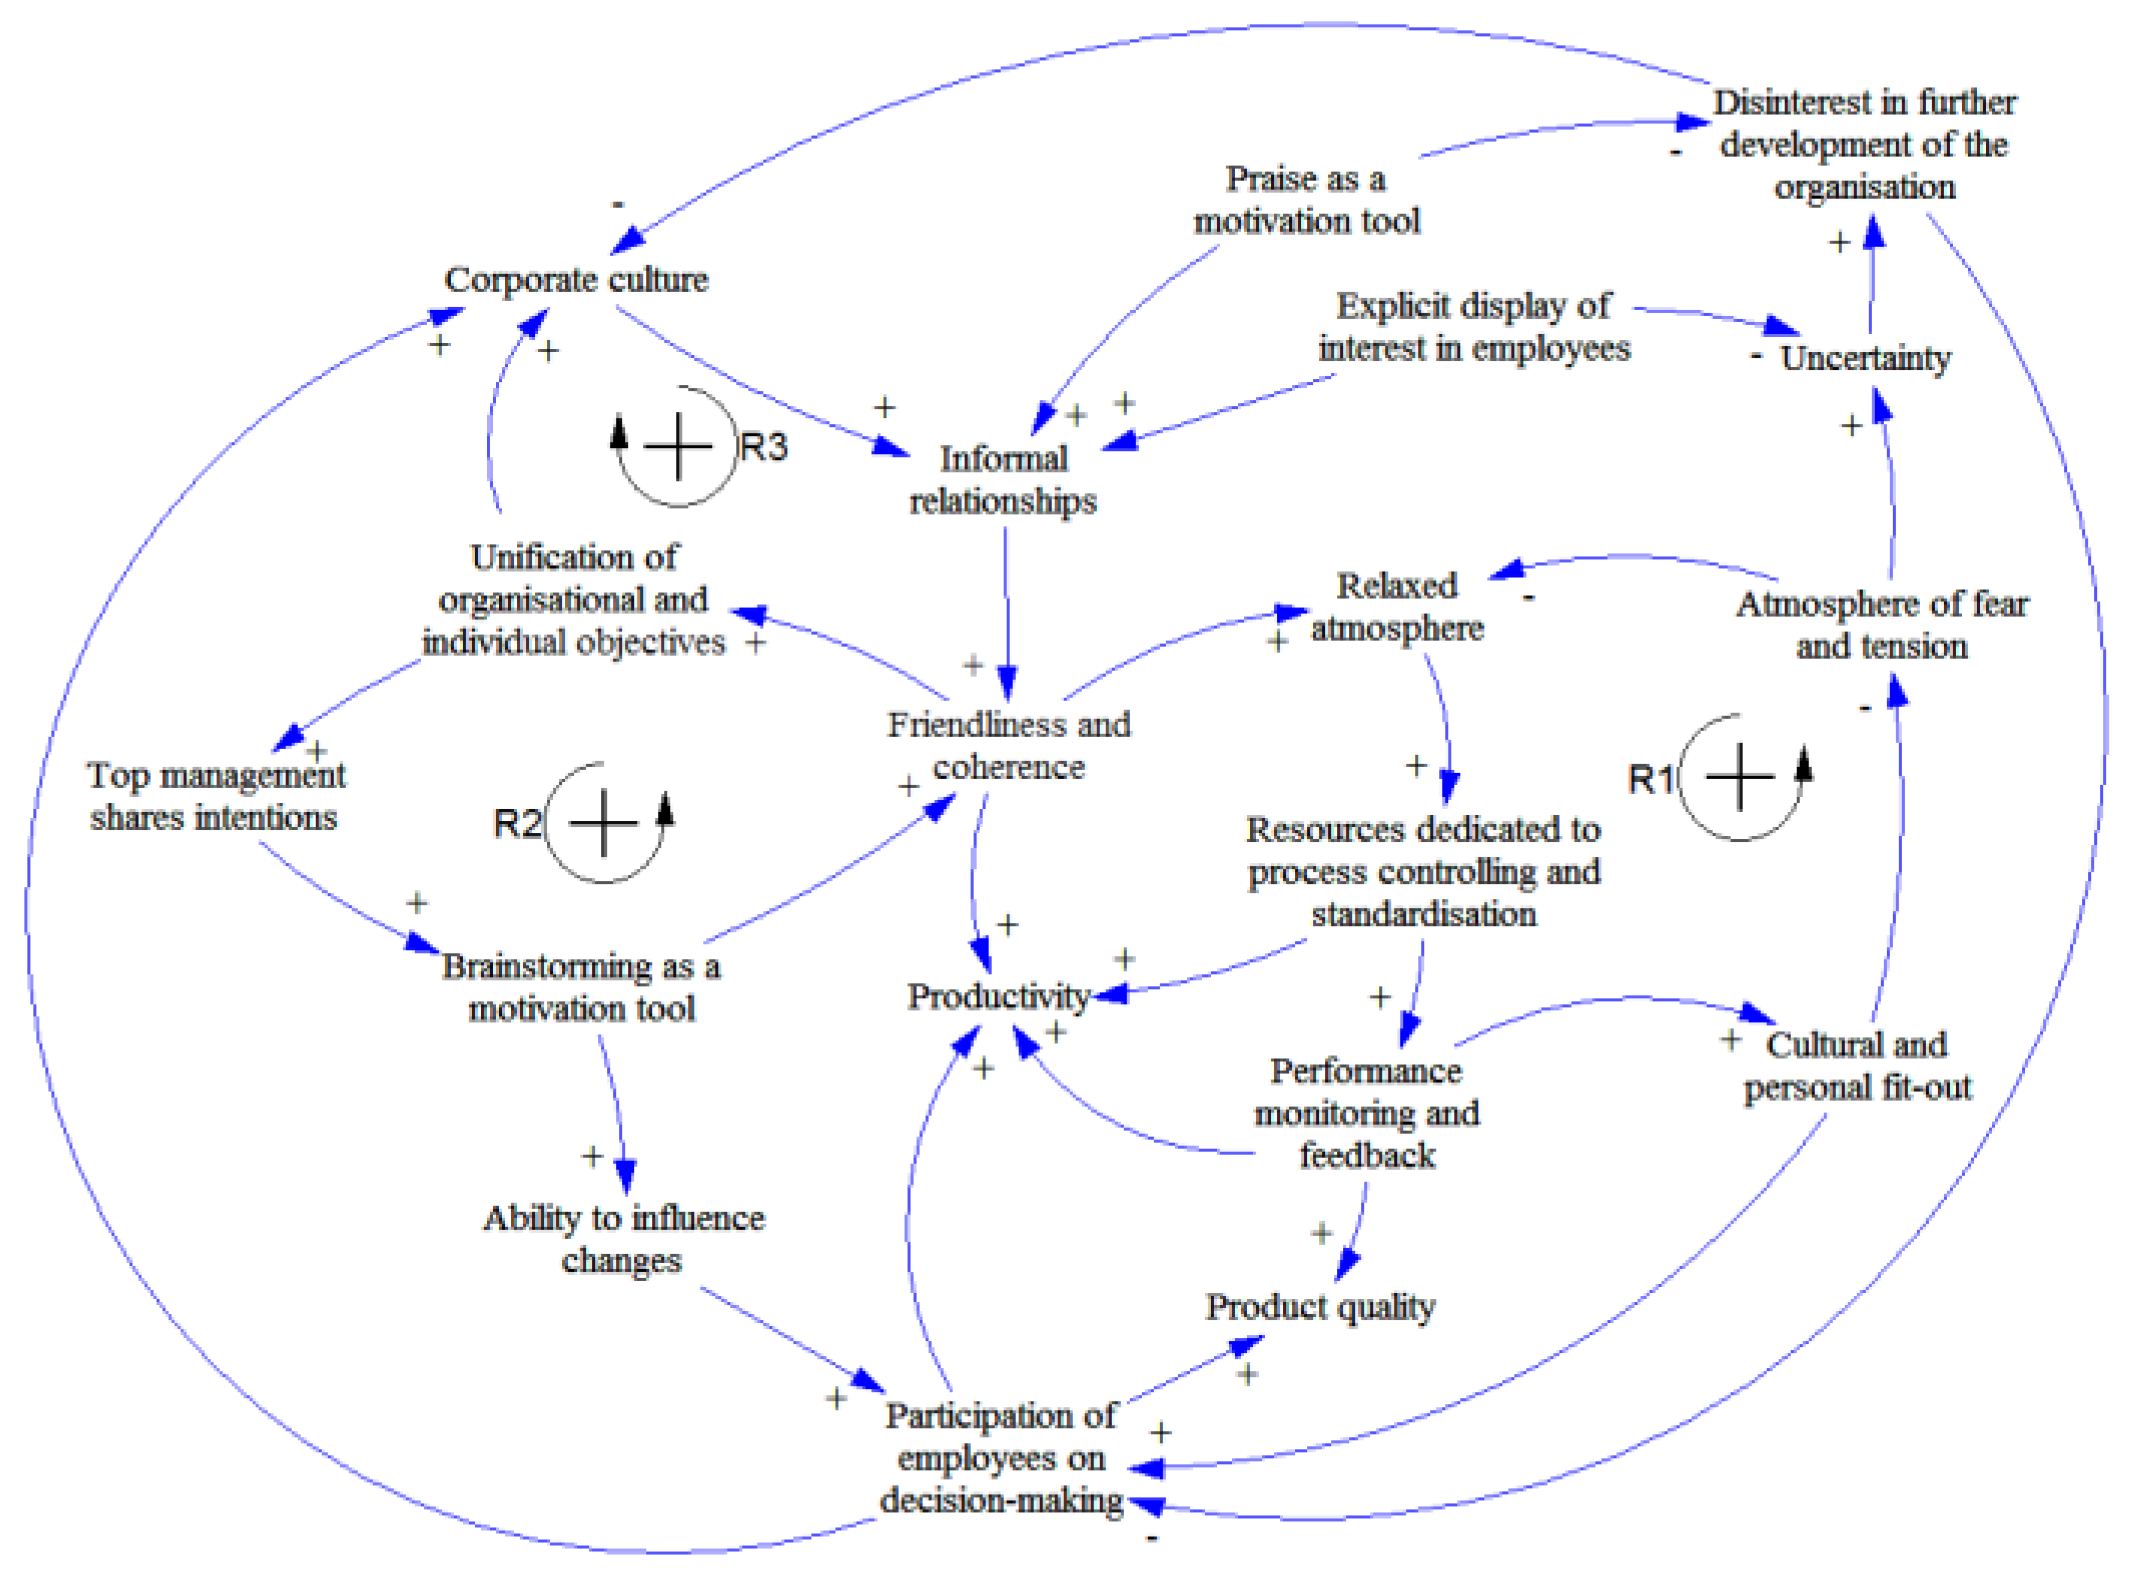
Not surprisingly, motivation was identified as one of the most important aspects of system sustainability. It is generally known that good motivation and a lack of it can have significant consequences [40]. Therefore, stereotypical behaviour associated with motivation came out as one from the most dominant topics. Examples of included questions and their answers are 1j, 2a, 2f, 3f, 4b, 4c, 4f, 4g, or 5a. The acquired diagram developed again in several iterations is presented in Figure 4.
The prevailing feedback loops contained in this diagram are the following. The reinforcing feedback loop R1 consists of the following variables: Friendliness and coherence -> (+) Relaxed atmosphere -> (+) Resources dedicated to process controlling and standardisation -> (+) Performance monitoring and feedback -> (+) Cultural and personal fit-out -> (−) Atmosphere of fear and tension -> (+) Uncertainty -> (+) Disinterest in further development of the organisation -> (−) Participation of employees on decision-making -> (+) Corporate culture -> (+) Informal relationships -> (+) Friendliness and coherence. The next reinforcing feedback R2 constitutes the following concepts: Top management shares intentions -> (+) Brainstorming as a motivation tool -> (+) Ability to influence changes -> (+) Participation of employees on decision-making -> (+) Corporate culture -> (+) Informal relationships -> (+) Friendliness and coherence -> (+) Unification of organisational and individual objectives -> (+) Top management shares intentions. Finally, the reinforcing feedback R3 comprises the following variables: Friendliness and coherence -> (+) Unification of organisational and individual objectives -> (+) Corporate culture -> (+) Informal relationships -> (+) Friendliness and coherence.
4. Discussion
The key issue in modelling system dynamics is tied to interpretation of obtained results [41]. The main problem is that there is no standardised procedure. The interpretation is thus necessarily subjective and mostly hard to replicate. In this study, no attention is paid to issues tied to relationships between concepts. For instance, friendliness and coherence can be determined as a part of the corporate culture or relaxed atmosphere, and atmosphere of fear and tension can be considered as antonyms, and thus, do not have to be modelled separately. However, in order to accurately transform obtained results into diagrams, similar issues were abstracted away. This study is grounded in the identification of dominant feedback loops and existing MIMOs that significantly shape the system behaviour. Many MIMOs are in concordance with drivers or enablers depicted in the literature review in the introductory section of this manuscript. If we put them into a context and look closer at their position in single diagrams, several insights about sustainability of socio-economic systems can be obtained.
From the perspective of quality, the sustainability is represented either by stability or by fluent growth. A decrease of quality results in a continuous decay of the system [42]. With respect to sustainability, the created diagrams stress both the outcome quality and the quality of the processes. Existing studies notice this quality perspective mostly implicitly or explore sustainability from a perspective opposite to this study—sustainability as an enabler of quality (of life, farming, etc.) [43]. Sustainability can thus be ensured by the proper combination of both reinforcing and balancing feedbacks. That is why any reinforcing feedback that would ensure growth, if properly set, needs to be included. There are two reinforcing feedback loops, R1 and R2, and one balancing feedback loop B1 is identified in this model. As the B1 is complex enough and integrates other loops, quality has a potential to support sustainability of the system if both reinforcing feedbacks are under control, or if only one reinforcing feedback is both under control and stronger than the second reinforcing feedback. This condition is fundamental because R1 and R2 can also cause a rapid decay of the system. These scenarios can be derived from Figure 1. Thus, sustainability of the socio-economic system can be supported by paying attention to MIMOs and feedback-intensive variables (described also in the Number_of_Inputs-Number_of_Outputs format). The most significant key factors of sustainability in this stereotype are product quality (3-3), number of erroneous outcomes (2-3), and profitability of the organisation (2-1).
Competence is often related to stereotypes, and from the social perspective, it organises the content of stereotypes [44,45]. The existing studies mostly neglect competence. From the system dynamics point of view, it is apparent that the existence of four reinforcing feedbacks represents the most volatile stereotype from the sustainability perspective. With no dominant balancing feedback that could help to prevent or reverse negative development, regardless of the direction of the dynamics, the system has a tendency to rapidly grow or decay. Any combination of feedback dominance results in a quick change in either direction. Fortunately, even if feedbacks R1, R2, R3 and R4 support growth of competence, this apparently cannot last for a long period due to the Limits to Growth archetype [46]. Although it is not necessary to rely on this archetype if all required variables grow, this archetype represents the only help on how to keep the system running, if the sustainability is collapsing. However, in a case of decay, such limits can be represented by a termination of the system. Hence, sustainability should be supported by attention carefully paid to the main MIMOs and feedback-intensive variables—Profit-based motivation of employees (1-3), Profitability of the organisation (3-2), Willingness of employees to provide feedback (3-1), and Participation of employees on decision making (2-2).
In the case of egoism, the identified feedback loops deal with issues such as individual interest, attention paid to insignificant details, unwillingness to delegate or process evaluation based on feedback. At first glance, it may seem that egoism can support sustainability due to a tendency to a higher level of centrality [47]. One can assume that an individual usually intends to keep the system working as long as possible. On the other hand, this behaviour is not sustainable in the long term due to compensation feedbacks that strengthen the tension resulting in the need of a change. The existence of three feedback loops B1, B2 and B3 supports the statement about stability and consequent sustainability. Reinforcing feedback loop R1 is based on a completely inappropriate approach to leading the system. If it prevails, sustainability will be lost. Thus, a stereotype grounded in egoism represents a mechanism that supports sustainability. This stereotypical behaviour is associated with many MIMOs and feedback-intensive variables. These can be considered as key factors of sustainability: Development of possibilities to limit others (3-3), Monitoring of useless details (2-1), Looking for excuses (2-1), or How to cheat the system (2-2).
Identification of motivation as the key sustainability concept supports the findings presented by Fargani et al. [18], who list incentives as the main sustainability drivers. However, from the psychological point of view, incentives represent an external trigger that helps to achieve desired outcomes or behaviours. The motivation is focused more on internal forces. Although this does not have to seem significant, the opposite is true. For instance, if an external impulse is terminated, incentives no longer exist, and sustainability can be jeopardised. In the case of motivation, dependence on external incentives is limited. Thus, motivation can assure higher sustainability under more stable conditions. Stereotypical behaviour based on motivation consists of three dominant reinforcing feedbacks. This result highlights that, although motivation is required and needed, too much motivation can provoke reaction that can be out of control quite quickly [48]. From the sustainability point of view, motivation must take place, but to a certain level only. With motivation higher than a threshold (the size of which is individual in each system), the destructive consequence can be anticipated. Therefore, the system needs a dominant negative feedback loop that would prevent it. Otherwise, the general archetypal behaviour labelled Overshoot with Collapse, in which the growth of the system is traded off for its consequent ruining and perishing, will take place [49]. Again, as in the case of the competence stereotype, the system archetype Limits to Growth may play a significant role here. Significant MIMOs and feedback-intensive variables associated with this stereotype are Informal relationships (3-1), Friendliness and coherence (2-3), or Participation of employees on decision-making (3-3).
Acquired results are the only subject for discussion. As this study is based on quite a novel approach combining stereotypes and system dynamics modelling, the methodological point of view can be scrutinised as well. Based on the aforementioned analysis of socio-economic systems, one can ask a fundamental question whether it is possible to a priori decide if balancing and reinforcing feedbacks per se support sustainability of socio-economic systems or not [50]. There are two issues that need to be considered. First, the question can be answered separately for particular topics (diagrams); however, several iterations of the tracking of changes in single feedback loops need to be conducted. Only then, an estimation of dominant feedbacks can be performed. This is not a simple task and still represents an actual topic in the system dynamics research [51]. The problem is that this type of dynamic is not connected with the usage of exact values of constants or variables. Only the changes in terms of polarity are investigated. Thus, this behaviour cannot be both simulated and exactly measured. Therefore, dominance can be only estimated, not exactly determined. Second, as the stereotypes are interconnected, the diagrams mutually overlap. Although this does not have to be apparent at the first glance, all of them describe one system, and thus, if constructed appropriately, a mutual relationship has to be identified. The existing shared variables are mostly hidden due to semantics. One concept can be expressed in several ways or using various words. Without a unified vocabulary thesaurus or support from the ontological modelling, these intersections can be easily missed. Therefore, balancing and reinforcing feedbacks need to be considered, and their relation to sustainability has to be determined individually. However, this reflects only theoretical or potential influence. In practice, the significance and dominance of particular feedbacks cause the observed behaviour, regardless of its support to keep or ruin sustainability.
Although the discussed issues indicate that application of system dynamics in a form of causal loop diagram modelling is unhelpful, the opposite is true. Once the diagrams are developed, the users acquire endogenous explanation of a phenomenon, sustainability in this case, which is a quite valuable source of information [52]. Moreover, the identified concepts support a proper focus on further investigation. For instance, MIMOs can be used as new starting points for further model elaboration or adjustments. They can also enable to find the most proper candidates for merging diagrams and to acquire an even more complex view. For instance, as is apparent from the interpretation above, Quality and Competence diagrams have financial aspects (costs and profit) as shared variables. Competence and Motivation have an issue of participation of employees on organisational management as the main shared concept. While MIMOs mostly serve as representatives of the modelled topics, relationships among diagrams are mostly based on marginal concepts or variables.
5. Limitations and Further Research
The key added value of the applied methodology and the acquired results is that it can be applied to any social system (public administration bodies, family, sports teams, leisure time groups, or communities of practice). Quality, competence, egoism, and motivation are stereotypes that can take place in all of them, although their meaning or content may differ in specific types of systems. For instance, if high-quality training methods are used, a trainer is competent based on proper education and/or experience; his/her egoism drives the team performance, and if he/she can motivate the team and himself/herself, the football team sustainability will be at a pretty high level. Hence, if identified behavioural stereotypes and key variables are not properly treated, the sustainability of these systems can be jeopardised. However, this statement needs to be supported by a research based on a similar methodological approach and conducted by experts in the respective domains.
The endogenous explanation is based on the assumption that behaviour of the systems can be explained by its structure. It represents quite an understandable and meaningful approach that is successfully applied in system dynamics modelling. Nevertheless, sustainability is not always affected by internal variables [53]. Every socio-economic system is an open one. Thus, abstracting exogenous variables away enables a better understanding of the system while representing a gap that must be closed by another type of research focused on causalities between the system and its environment.
The weakest point of this study is grounded in the qualitative nature of applied methodology. Low external validity of acquired results denote that they are not as generalizable as needed. Therefore, similar research studies that would replicate this study and confirm, extend, or adjust the obtained results would be very beneficial.
6. Conclusions
Dealing with sustainability of any socio-economic system is a must for anybody who is in charge, regardless of her/his position title—leader, manager, director, chief officer, head of department, trainer, etc. Every responsible leader is obliged to take into consideration key variables of the socio-economic system and dominant feedbacks that influence system behaviour over time, and thus, its sustainability. This study offers a new approach to the identification of key factors of system sustainability. This approach is based on endogenous explanation of general stereotypes which take place in socio-economic systems.
Based on the results acquired from unstructured interviews, four causal-loop diagrams were developed in several iterations. Four key stereotypes associated with system sustainability were identified—Quality, Competence, Egoism, and Motivation. The main added value of this study is not associated merely with their identification. Although similar to other concepts described in relevant studies, these are explained in a dynamical manner, which provides a completely new perspective. Moreover, their decomposition to sustainability key factors or specifics, such as influence of egoism, is not clearly explained in contemporary studies. Some stereotypes can be considered as more abstract or contrarily specified versions of the already described concepts. Therefore, main MIMOs were identified in each stereotype. The interpretation of dominant feedback loops in all four stereotypes shed a light on sustainability from a new methodological perspective. Although grounded in the investigation of socio-economic systems, acquired results may be applied to other types of social systems. However, this merely represents research conjecture that needs to be verified by the upcoming research studies.
Acknowledgments
The financial support of the Specific Research Project “Autonomous Socio-Economic Systems” of FIM UHK is gratefully acknowledged. Authors would like to thank Petr Blecha for his responsiveness and help.
Author Contributions
V.B. conceived and designed the experiments; F.R. conducted the data gathering and developed causal loop diagrams; V.B. and F.R. interpreted results; V.B. and F.R. wrote the paper.
Conflicts of Interest
The authors declare no conflict of interest. The founding sponsors had no role in the design of the study; in the collection, analyses, or interpretation of data; in the writing of the manuscript, and in the decision to publish the results.
References
- De Olde, E.M.; Bokkers, E.A.M.; de Boer, I.J.M. The Choice of the Sustainability Assessment Tool Matters: Differences in Thematic Scope and Assessment Results. Ecol. Econ. 2017, 136, 77–85. [Google Scholar] [CrossRef]
- Pater, L.R.; Cristea, S.L. Systemic Definitions of Sustainability, Durability and Longevity. Procedia Soc. Behav. Sci. 2016, 221, 362–371. [Google Scholar] [CrossRef]
- Hodge, T. Toward a conceptual framework for assessing progress toward sustainability. Soc. Indic. Res. 1997, 40, 5–98. [Google Scholar] [CrossRef]
- Molinaro, N.; Su, J.J.; Carreiras, M. Stereotypes override grammar: Social knowledge in sentence comprehension. Brain Lang. 2016, 155–156, 36–43. [Google Scholar] [CrossRef] [PubMed]
- Driva, A.; Lührmann, M.; Winter, J. Gender differences and stereotypes in financial literacy: Off to an early start. Econ. Lett. 2016, 146, 143–146. [Google Scholar] [CrossRef]
- Irimas, E. Behavioural stereotypes in intercultural communication. Acta Univ. Sapientiae 2011, 3, 167–174. [Google Scholar]
- Pojasek, R.B. A framework for business sustainability. Environ. Qual. Manag. 2007, 17, 81–88. [Google Scholar] [CrossRef]
- Geels, F.W.; McMeekin, A.; Mylan, J.; Southerton, D. A critical appraisal of Sustainable Consumption and Production research: The reformist, revolutionary and reconfiguration positions. Glob. Environ. Chang. 2015, 34, 1–12. [Google Scholar] [CrossRef]
- Dudin, M.N.; Ljasnikov, N.V.; Kuznecov, A.V.; Fedorova, I.J. Innovative Transformation and Transformational Potential of Socio-Economic Systems. Middle East J. Sci. Res. 2013, 17, 1434–1437. [Google Scholar]
- Boons, F.; Montalvo, C.; Quist, J.; Wagner, M. Sustainable innovation, business models and economic performance: An overview. J. Clean. Prod. 2013, 45, 1–8. [Google Scholar] [CrossRef]
- Loorbach, D.; Wijsman, K. Business transition management: Exploring a new role for business in sustainability transitions. J. Clean. Prod. 2013, 45, 20–28. [Google Scholar] [CrossRef]
- Corrado, G.; Corrado, L. Inclusive finance for inclusive growth and development. Curr. Opin. Environ. Sustain. 2017, 24, 19–23. [Google Scholar] [CrossRef]
- Fang, D.; Fath, B.D.; Chen, B.; Scharler, U.M. Network environ analysis for socio-economic water system. Ecol. Indic. 2014, 47, 80–88. [Google Scholar] [CrossRef]
- Lele, S. Watershed services of tropical forests: From hydrology to economic valuation to integrated analysis. Curr. Opin. Environ. Sustain. 2009, 1, 148–155. [Google Scholar] [CrossRef]
- Ripoll-Bosch, R.; Joy, M.; Bernués, A. Role of self-sufficiency, productivity and diversification on the economic sustainability of farming systems with autochthonous sheep breeds in less favoured areas in Southern Europe. Animal 2014, 8, 1229–1237. [Google Scholar] [CrossRef] [PubMed]
- Branco, M.C.; Delgado, C.; Gomes, S.F.; Perera-Eugénio, T.C. Factors influencing the assurance of sustainability reports in the context of the economic crisis in Portugal. Manag. Audit. J. 2014, 29, 237–252. [Google Scholar] [CrossRef]
- Hahn, R.; Kühnen, M. Determinants of sustainability reporting: A review of results, trends, theory, and opportunities in an expanding field of research. J. Clean. Prod. 2013, 59, 5–21. [Google Scholar] [CrossRef]
- Fargani, H.; Cheung, W.M.; Hasan, R. An Empirical Analysis of the Factors That Support the Drivers of Sustainable Manufacturing. Procedia CIRP 2016, 56, 491–495. [Google Scholar] [CrossRef]
- Lozano, R. A holistic perspective on corporate sustainability drivers. Corp. Soc. Responsib. Environ. Manag. 2015, 22, 32–44. [Google Scholar] [CrossRef]
- Forrester, J.W.; Senge, P. Tests for building confidence in system dynamics models. TIMS Stud. Manag. Sci. 1980, 14, 209–228. [Google Scholar]
- Cavana, R.Y.; Mares, E.D. Integrating critical thinking and systems thinking: From premises to causal loops. Syst. Dyn. Rev. 2004, 20, 223–235. [Google Scholar] [CrossRef]
- Brunet-Thornton, R.; Koža, M.; Bureš, V. The Toyota Production System—Czech and Nippon Cultural Perspectives. E+M Ekon. Manag. 2016, 19, 142–156. [Google Scholar] [CrossRef]
- Pickard, A.J. Research Methods in Information, 2nd ed.; Facet Publishing: London, UK, 2013; ISBN 978-1-85604-813-2. [Google Scholar]
- Jason, L.A.; Glenwick, D.S. Handbook on Methodological Approaches to Community-Based Research; Oxford University Press: Oxford, UK, 2016; ISBN 978-0-19-024365-4. [Google Scholar]
- Fitkov-Norris, E.; Yeghiazarian, A. Use of measurement theory for operationalization and quantification of psychological constructs in systems dynamics modelling. J. Phys. Conf. Ser. 2016, 772, 012023. [Google Scholar] [CrossRef]
- Williams, A.; Kennedy, S.; Philipp, F.; Whiteman, G. Systems thinking: A review of sustainability management research. J. Clean. Prod. 2017, 148, 866–881. [Google Scholar] [CrossRef]
- Kuhmonen, T. Exposing the attractors of evolving complex adaptive systems by utilising futures images: Milestones of the food sustainability journey. Technol. Forecast. Soc. Chang. 2017, 114, 214–225. [Google Scholar] [CrossRef]
- Sudarto, S.; Takahashi, K.; Morikawa, K. Efficient flexible long-term capacity planning for optimal sustainability dimensions performance of reverse logistics social responsibility: A system dynamics approach. Int. J. Prod. Econ. 2017, 184, 179–192. [Google Scholar] [CrossRef]
- Nabavi, E.; Daniell, K.A.; Najafi, H. Boundary matters: The potential of system dynamics to support sustainability? J. Clean. Prod. 2017, 140, 312–323. [Google Scholar] [CrossRef]
- Capelo, C.; Ferreira Dias, J. A system dynamics-based simulation experiment for testing mental model and performance effects of using the balanced scorecard. Syst. Dyn. Rev. 2009, 25, 1–34. [Google Scholar] [CrossRef]
- Lu, Y.; Zhang, S.G.; Hao, L.; Huangfu, H.Y.; Sheng, H. System dynamics modeling of the safety evolution of blended-wing-body subscale demonstrator flight testing. Saf. Sci. 2016, 89, 219–230. [Google Scholar] [CrossRef]
- Liu, X.; Zeng, M. Renewable energy investment risk evaluation model based on system dynamics. Renew. Sustain. Energy Rev. 2017, 73, 782–788. [Google Scholar] [CrossRef]
- Timma, L.; Bariss, U.; Blumberga, A.; Blumberga, D. Outlining Innovation Diffusion Processes in Households Using System Dynamics. Case Study: Energy Efficiency Lighting. Energy Procedia 2015, 75, 2859–2864. [Google Scholar] [CrossRef]
- Iannone, R.; Martino, G.; Miranda, S.; Riemmma, S. Modeling Fashion Retail Supply Chain through Causal Loop Diagram. IFAC-PapersOnLine 2015, 48, 1290–1295. [Google Scholar] [CrossRef]
- Aikenhead, G.; Farahbakhsh, K.; Halbe, J.; Adamowski, J. Application of process mapping and causal loop diagramming to enhance engagement in pollution prevention in small to medium size enterprises: Case study of a dairy processing facility. J. Clean. Prod. 2015, 102, 275–284. [Google Scholar] [CrossRef]
- Ekrot, B.; Kock, A.; Gemünden, H.G. Retaining project management competence—Antecedents and consequences. Int. J. Proj. Manag. 2016, 34, 145–157. [Google Scholar] [CrossRef]
- Avolio, B.J.; Locke, E.E. Contrasting different philosophies of leader motivation: Altruism versus egoism. Leadersh. Q. 2002, 13, 169–191. [Google Scholar] [CrossRef]
- Jeon, G.; Newman, A.D.A. Equity sensitivity versus egoism: A reconceptualization and new measure of individual differences in justice perceptions. J. Vocat. Behav. 2016, 95–96, 138–155. [Google Scholar] [CrossRef]
- Villena, M.G.; Zecchetto, F. Subject-specific performance information can worsen the tragedy of the commons: Experimental evidence. J. Econ. Psychol. 2011, 32, 330–347. [Google Scholar] [CrossRef]
- Bear, G.G.; Slaughter, J.C.; Mantz, L.S.; Farley-Ripple, E. Rewards, praise, and punitive consequences: Relations with intrinsic and extrinsic motivation. Teach. Teach. Educ. 2017, 65, 10–20. [Google Scholar] [CrossRef]
- Desthieux, G.; Joerin, F.; Lebreton, M. Ulysse: A qualitative tool for eliciting mental models of complex systems. Syst. Dyn. Rev. 2010, 26, 163–192. [Google Scholar] [CrossRef]
- Heidari, F.; Loucopoulos, P. Quality evaluation framework (QEF): Modeling and evaluating quality of business processes. Int. J. Account. Inf. Syst. 2014, 15, 193–223. [Google Scholar] [CrossRef]
- Mathew, P.V.; Sreejesh, S. Impact of responsible tourism on destination sustainability and quality of life of community in tourism destinations. J. Hosp. Tour. Manag. 2017, 31, 83–89. [Google Scholar] [CrossRef]
- Klein, O.; Bernard, P. Stereotypes in social psychology. In International Encyclopedia of the Social & Behavioral Sciences; Wright, J.D., Ed.; Elsevier Science and Technology: Amsterdam, The Netherlands, 2015; pp. 446–452. [Google Scholar]
- Roussos, G.; Dunham, Y. The development of stereotype content: The use of warmth and competence in assessing social groups. J. Exp. Child Psychol. 2016, 141, 133–144. [Google Scholar] [CrossRef] [PubMed]
- Oliva, R.; Sterman, J.D.; Giese, M. Limits to growth in the new economy: Exploring the ‘get big fast’ strategy in e-commerce. Syst. Dyn. Rev. 2003, 19, 83–117. [Google Scholar] [CrossRef]
- Wayment, H.A.; Bauer, J.J. The Quiet Ego: Motives for Self-Other Balance and Growth in Relation to Well-Being. J. Happiness Stud. 2017, 1–16. [Google Scholar] [CrossRef]
- Strauss, K.; Parker, S.K.; O’Shea, D. When does proactivity have a cost? Motivation at work moderates the effects of proactive work behavior on employee job strain. J. Vocat. Behav. 2017, 100, 15–26. [Google Scholar] [CrossRef]
- Tainter, J.A. Archaeology of Overshoot and Collapse. Annu. Rev. Anthropol. 2006, 35, 59–74. [Google Scholar] [CrossRef]
- Jalili, Y.; Ford, D.N. Quantifying the impacts of rework, schedule pressure, and ripple effect loops on project schedule performance. Syst. Dyn. Rev. 2016, 32, 82–96. [Google Scholar] [CrossRef]
- Hayward, J.; Boswell, G.P. Model behaviour and the concept of loop impact: A practical method. Syst. Dyn. Rev. 2014, 30, 29–57. [Google Scholar] [CrossRef]
- Škraba, A.; Kljajić, M.; Leskovar, R. Group exploration of system dynamics models—Is there a place for a feedback loop in the decision process? Syst. Dyn. Rev. 2003, 19, 243–263. [Google Scholar] [CrossRef]
- Bureš, V.; Rácz, F. Application of System Archetypes in Practice: An Underutilised Pathway to Better Managerial Performance. J. Bus. Econ. Manag. 2016, 17, 1081–1096. [Google Scholar] [CrossRef]
Figure 1.
Causal loop diagram of the Quality stereotype.
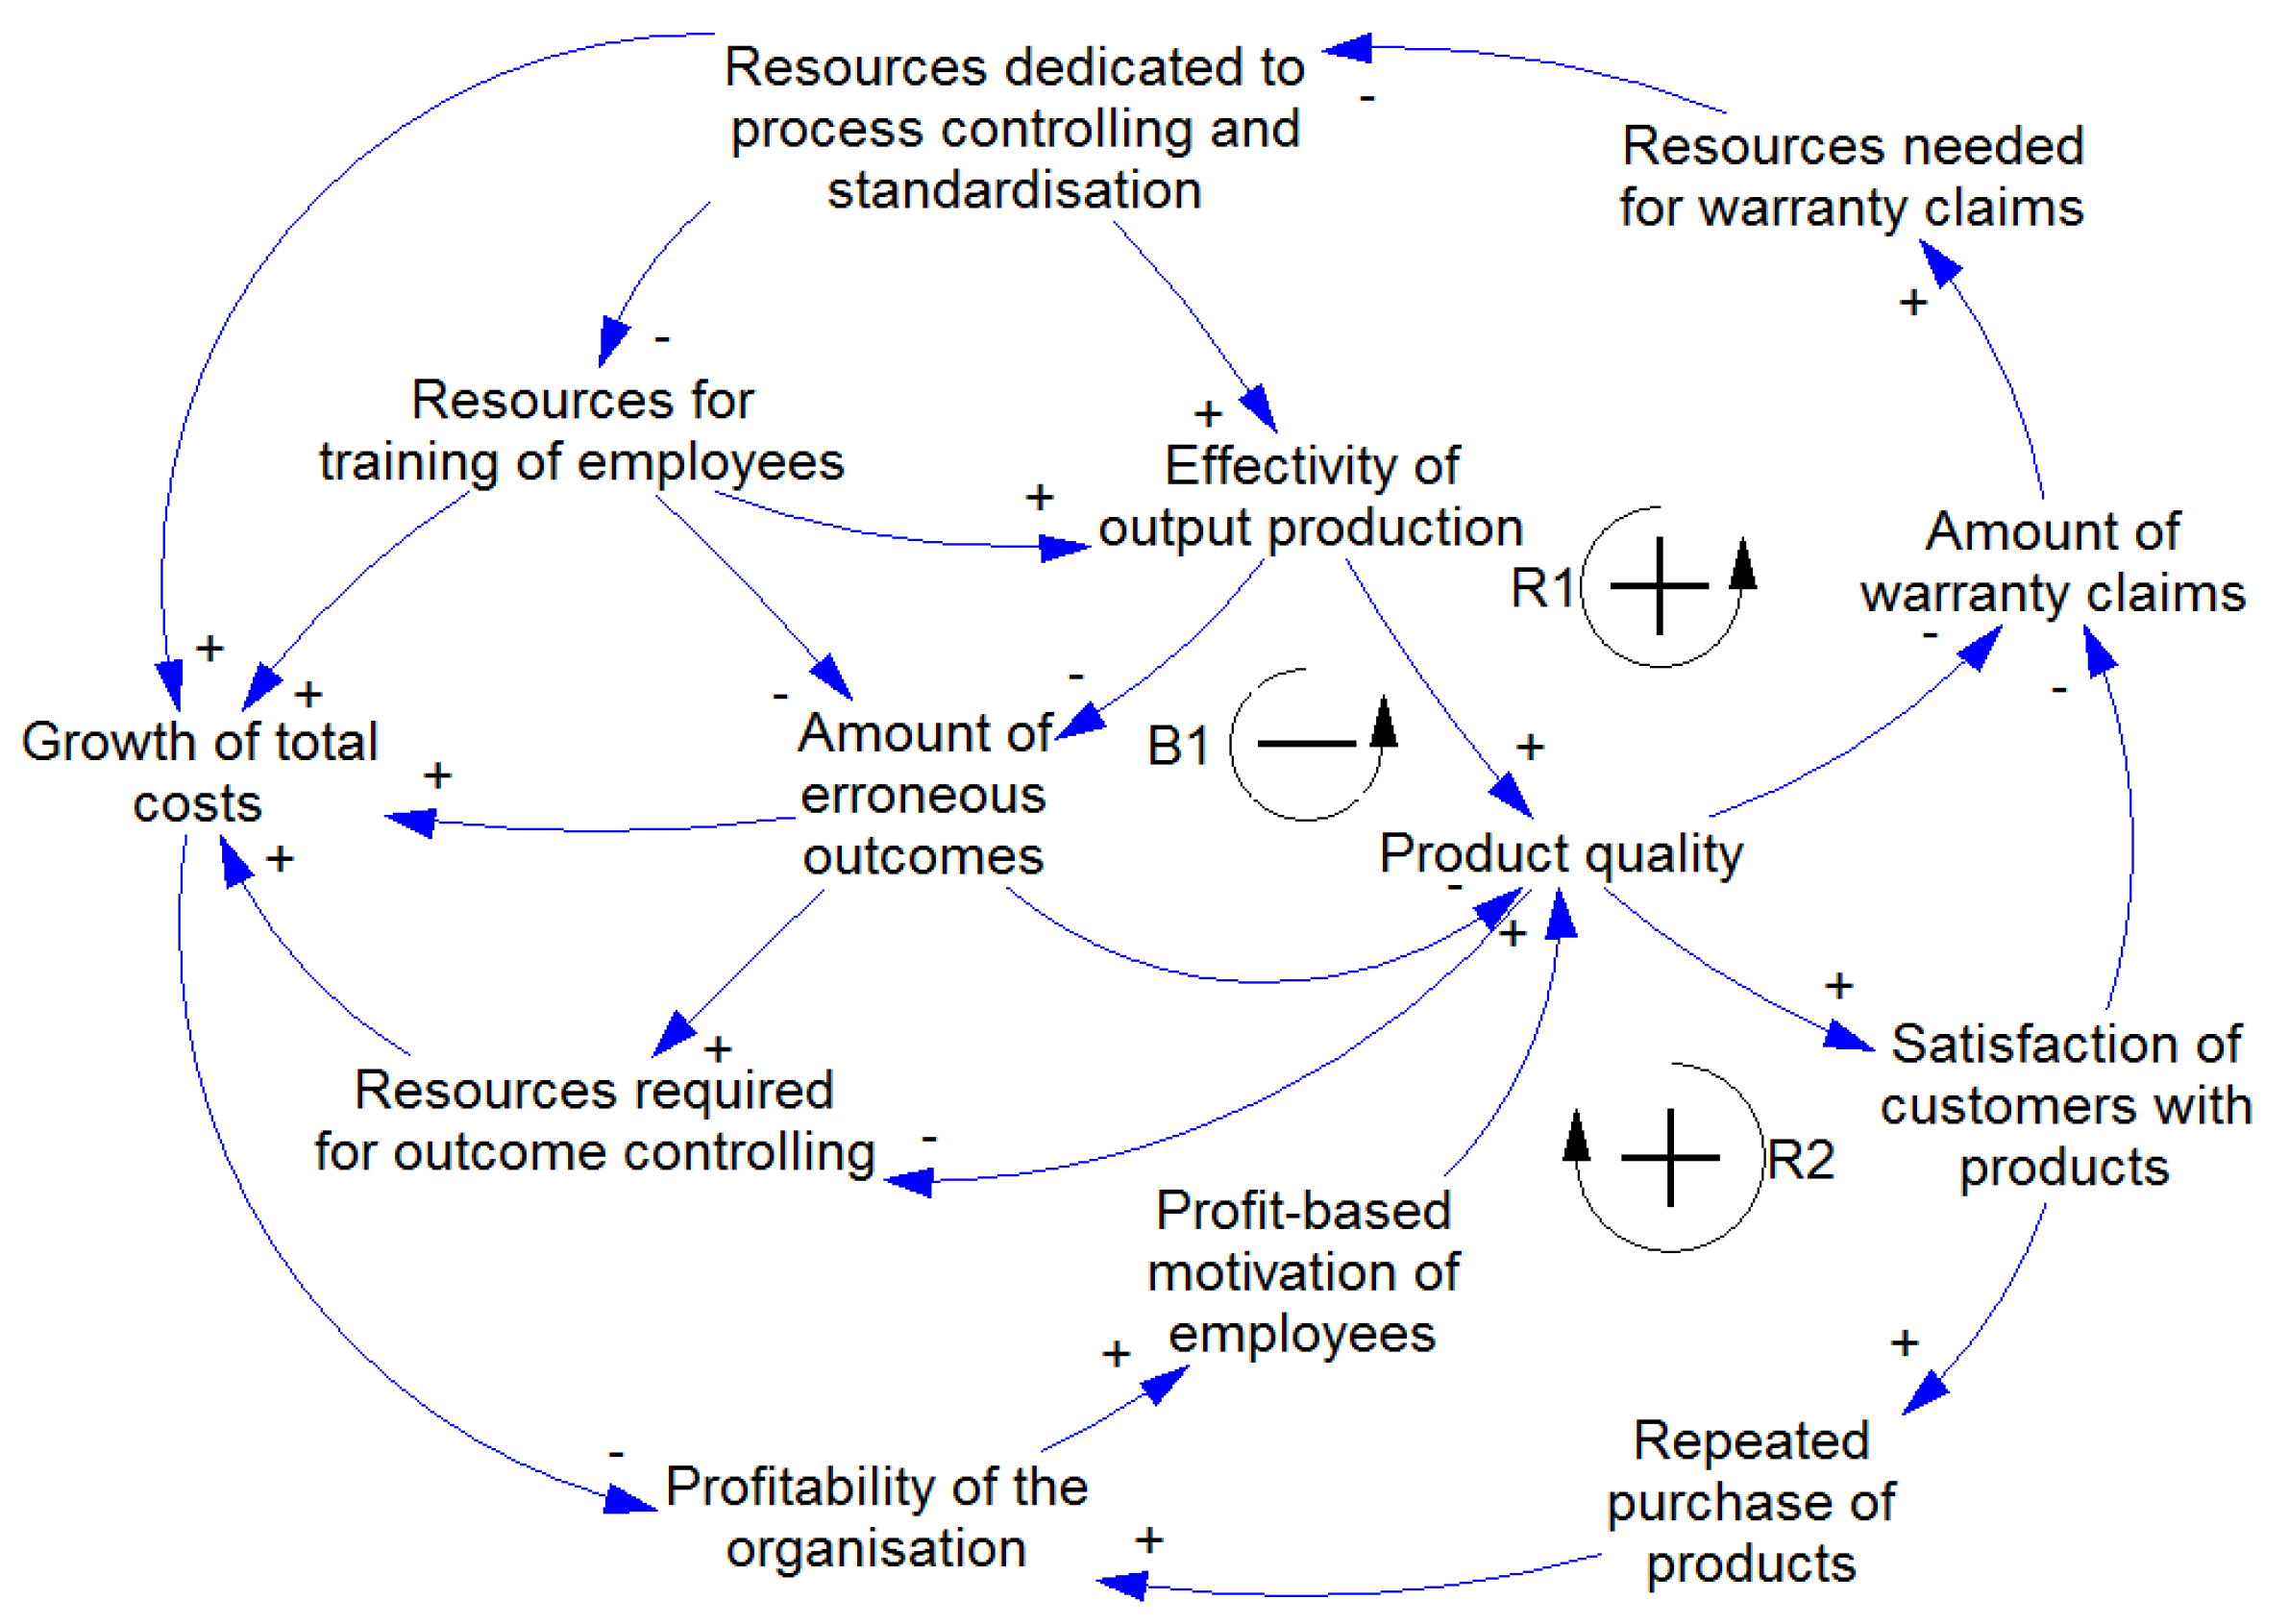
Figure 2.
Causal loop diagram of the Competence stereotype.

Figure 3.
Causal loop diagram of the Egoism stereotype.
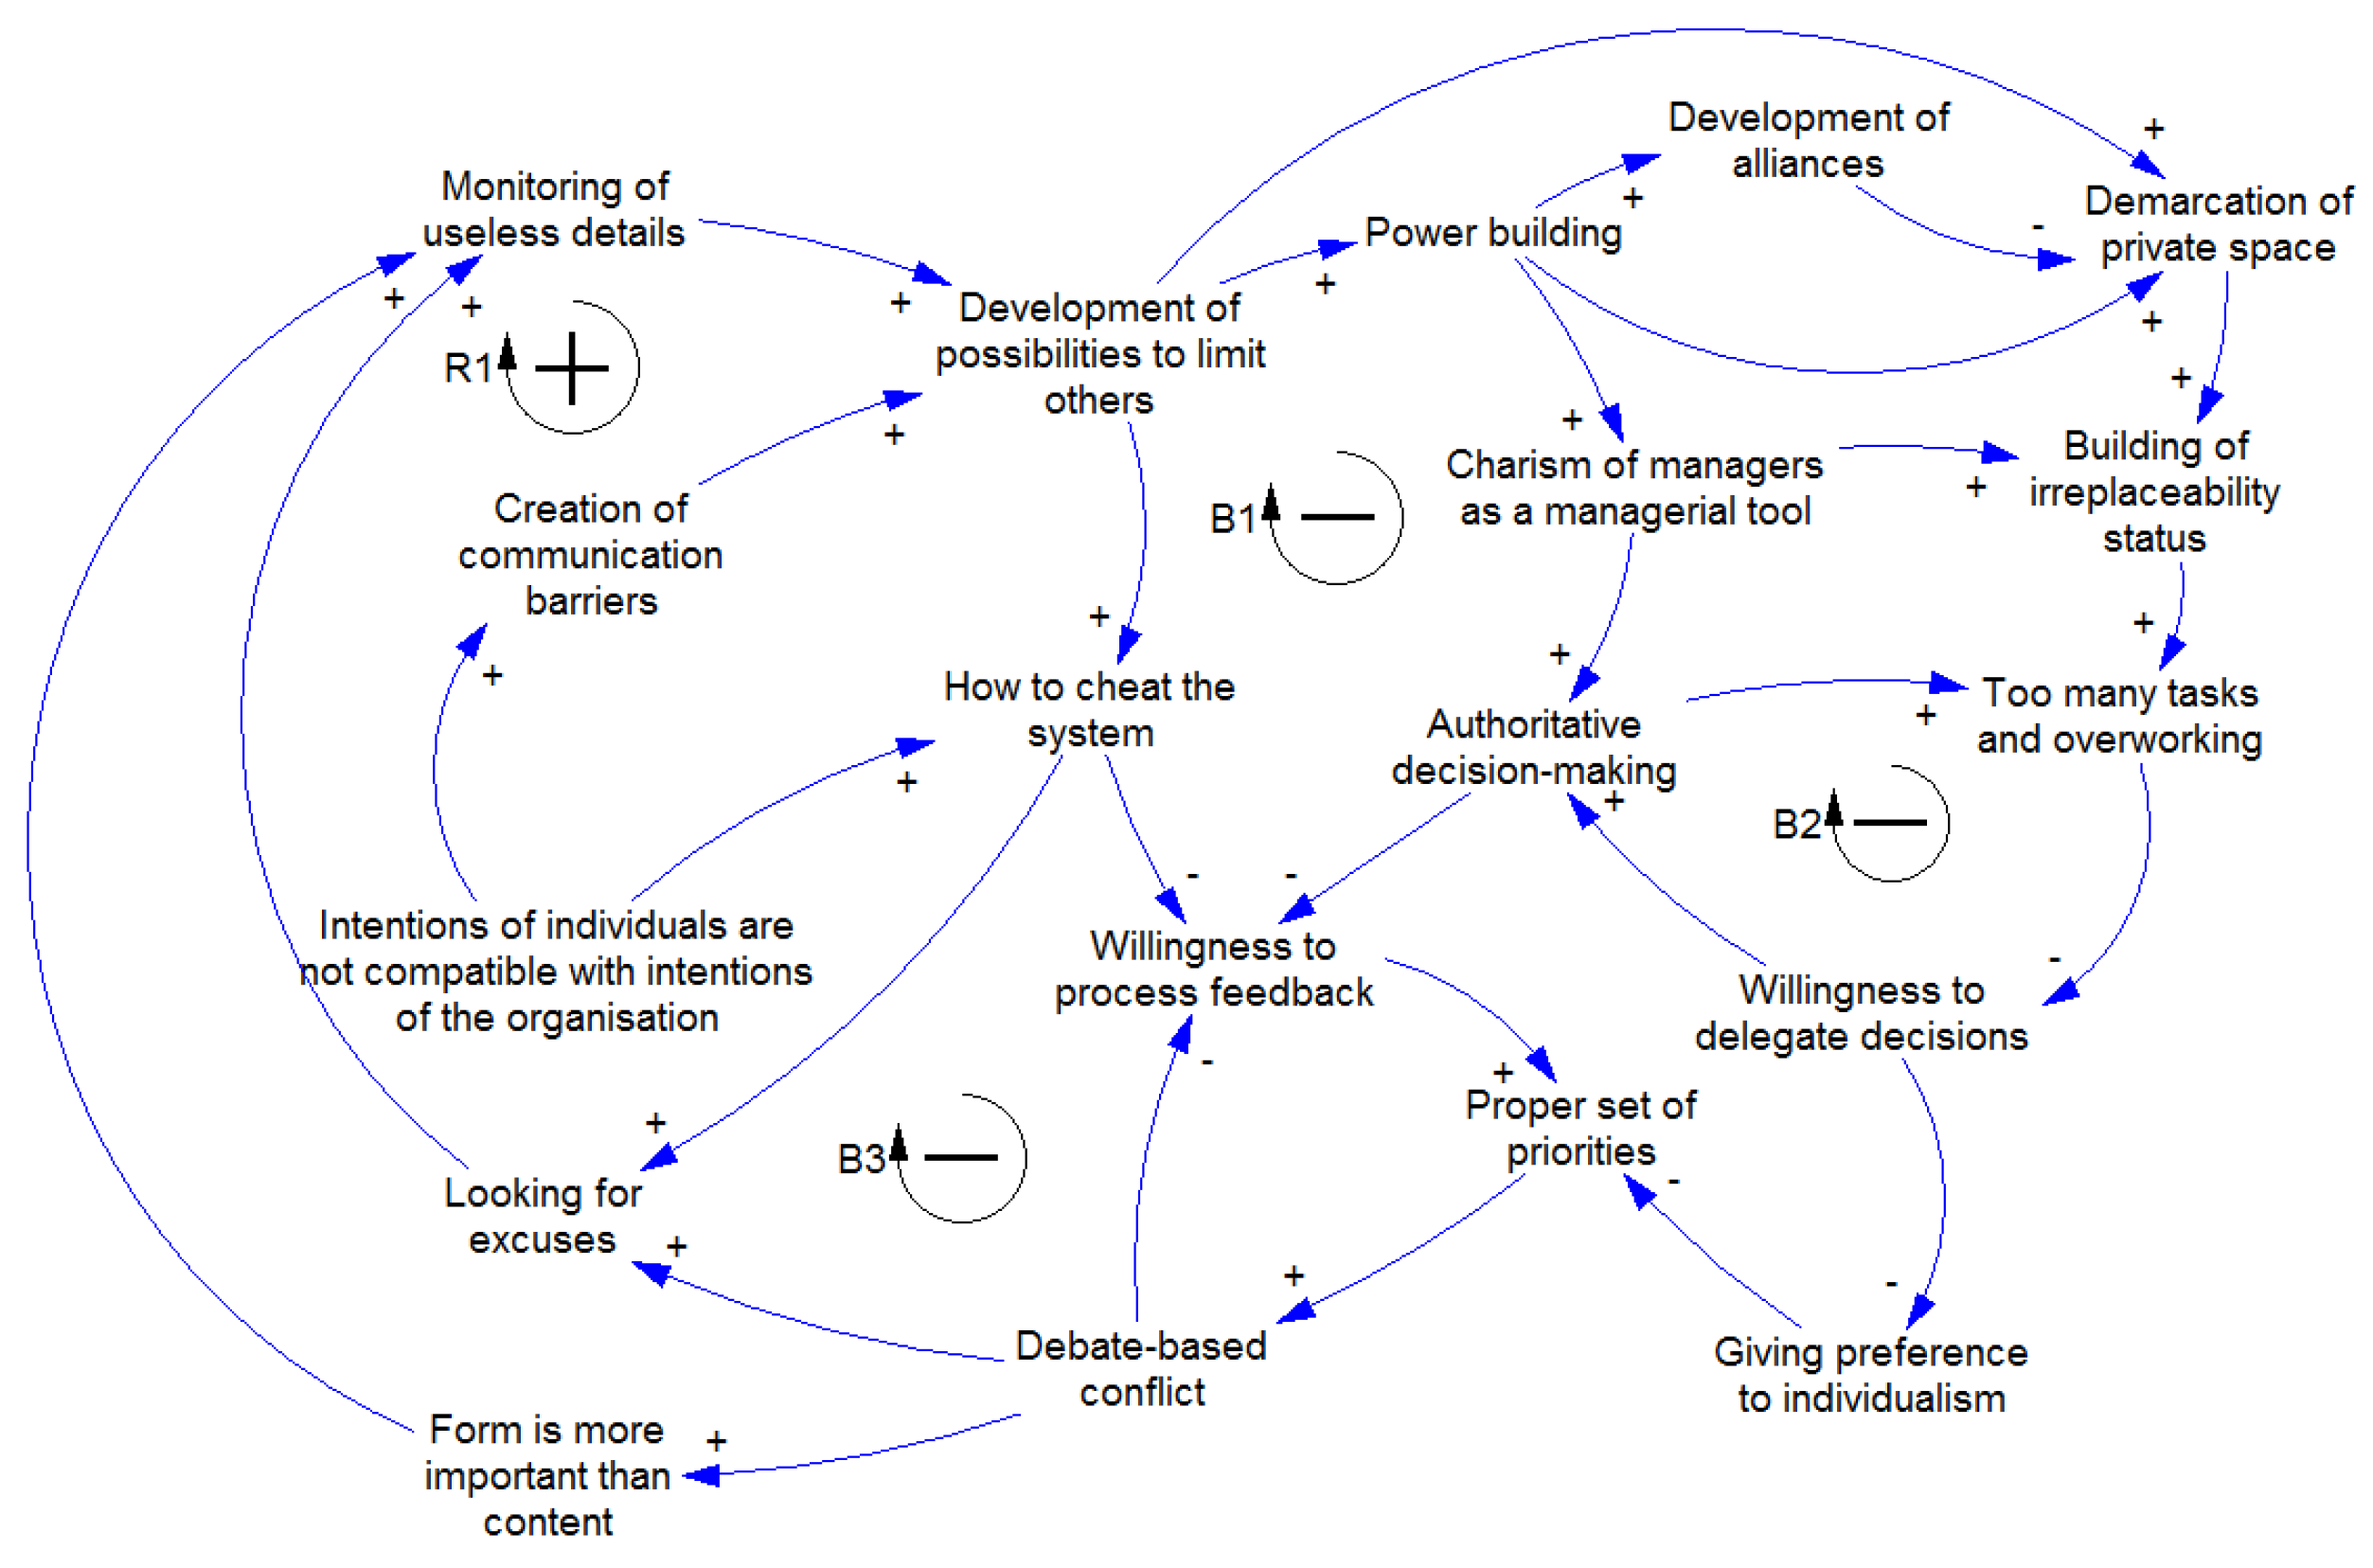
Figure 4.
Causal loop diagram of the Motivation stereotype.

Table 1.
Classification of organisations based on the economic segment.
| Value | Segment Type |
|---|---|
| 1 | Agriculture |
| 2 | Heavy industry |
| 3 | Light industry |
| 4 | Transportation, logistics |
| 5 | Education, research |
| 6 | Health care |
| 7 | Judiciary, army, police |
| 8 | Finance, insurance |
| 9 | Governmental bodies |
| 10 | Tourism |
| 11 | Services, consulting |
| 12 | Retail |
| 13 | Non-governmental organisations |
| 14 | Construction |
| 15 | Wholesales, distribution |
| 16 | Others |
Table 2.
Classification of organisations based on size (number of employees; classification taken from the European Statistical Office (EUROSTAT)).
Table 2.
Classification of organisations based on size (number of employees; classification taken from the European Statistical Office (EUROSTAT)).
| Value | Number of Employees (Min/Max) | |
|---|---|---|
| I | 1 | 10 |
| II | 11 | 49 |
| III | 50 | 249 |
| IV | 250 | |
Table 3.
Classification of respondents according to the management seniority.
| Value | Managerial Position |
|---|---|
| A | Owner, Partner |
| B | Supervisory level (e.g., Board of Directors) |
| C | Top management level (e.g., CEO, CFO or CIO) |
| D | Middle management level (e.g., Senior team leader) |
| E | First-line management level (e.g., Junior manager) |
Table 4.
Geographical classification of organisations (nested classification that reflects the location of the company‘s headquarters and direct cooperation with subsidiaries in other countries).
Table 4.
Geographical classification of organisations (nested classification that reflects the location of the company‘s headquarters and direct cooperation with subsidiaries in other countries).
| Value | Geographical Location |
|---|---|
| X | Slovakia |
| Y | X and another country of the European Union |
| W | Y and another country in Northern America |
| Z | Y or W or a country from another continent. |
Table 5.
Overall characteristics of the research sample.
| Male/Female Respondent | Segment | Size | Seniority | Career Years | Area |
|---|---|---|---|---|---|
| m | 10 | II | A | 19 | X |
| m | 11 | II | A | 9 | X |
| f | 5 | IV | E | 20 | X |
| m | 5 | IV | C | 27 | X |
| m | 1 | IV | C | 17 | X, Y, W, Z |
| f | 11 | III | D | 20 | X, Y, W, Z |
| m | 11 | III | B | 24 | X, Y |
| f | 6 | IV | C | 17 | X |
| m | 8 | IV | E | 9 | X, Y |
| f | 8 | IV | C | 21 | X, Y, W, Z |
| f | 11 | III | C | 9 | X, Y |
| m | 11 | III | B | 24 | X, Y |
| m | 14 | II | B | 10 | X, Y |
| m | 8 | IV | C | 24 | X, Y, W, Z |
| m | 11 | II | A | 25 | X |
| m | 8 | IV | C | 22 | X, Y |
| f | 11 | III | A | 25 | X, Y, W, Z |
| m | 15 | IV | D | 11 | X, Y, W, Z |
| m | 8 | IV | D | 23 | X, Y, W, Z |
| f | 8 | IV | C | 24 | X, Y |
| f | 4 | IV | B | 22 | X, Y |
| f | 9 | III | D | 24 | X |
© 2017 by the authors. Licensee MDPI, Basel, Switzerland. This article is an open access article distributed under the terms and conditions of the Creative Commons Attribution (CC BY) license (http://creativecommons.org/licenses/by/4.0/).
Share and Cite
MDPI and ACS Style
Bureš, V.; Rácz, F. Identification of Sustainability Key Factors Based on Capturing Dominant Feedbacks of Behavioural Stereotypes in Socio-Economic Systems. Systems 2017, 5, 42. https://doi.org/10.3390/systems5020042
AMA Style
Bureš V, Rácz F. Identification of Sustainability Key Factors Based on Capturing Dominant Feedbacks of Behavioural Stereotypes in Socio-Economic Systems. Systems. 2017; 5(2):42. https://doi.org/10.3390/systems5020042
Chicago/Turabian StyleBureš, Vladimír, and Fridrich Rácz. 2017. "Identification of Sustainability Key Factors Based on Capturing Dominant Feedbacks of Behavioural Stereotypes in Socio-Economic Systems" Systems 5, no. 2: 42. https://doi.org/10.3390/systems5020042
Note that from the first issue of 2016, this journal uses article numbers instead of page numbers. See further details here.