Review

Ultra Low-Power Algorithm Design for Implantable Devices: Application to Epilepsy Prostheses

by
Shriram Raghunathan
1,*,
Sumeet K. Gupta
2,
Himanshu S. Markandeya
2,
Pedro P. Irazoqui
1 and
Kaushik Roy
1,2
1
Center for Implantable Devices, Weldon School of Biomedical Engineering, Purdue University, West Lafayette, IN 47907, USA
2
School of Electrical and Computer Engineering, Purdue University, West Lafayette, IN 47907, USA
*
Author to whom correspondence should be addressed.
J. Low Power Electron. Appl. 2011, 1(1), 175-203; https://doi.org/10.3390/jlpea1010175
Submission received: 10 November 2010 / Revised: 11 April 2011 / Accepted: 14 April 2011 / Published: 12 May 2011
(This article belongs to the Special Issue Selected Topics in Low Power Design - From Circuits to Applications)

Abstract

:
Low-power circuit design techniques have enabled the possibility of integrating signal processing and feature extraction algorithms on-board implantable medical devices, eliminating the need for wireless transfer of data outside the patient. Feature extraction algorithms also serve as valuable tools for modern-day artificial prostheses, made possible by implantable brain-computer-interface systems. This paper intends to review the challenges in designing feature extraction blocks for implantable devices, with specific focus on developing efficacious but computationally efficient algorithms to detect seizures. Common seizure detection features used to construct algorithms are evaluated and algorithmic, mathematical as well as circuit-level design techniques are suggested to effectively translate the algorithms into hardware implementations on low-power platforms.

1. Introduction

Epilepsy affects over 1% of the world's population with over 10 million sufferers in the United States alone, making it the second most common neurological disorder after stroke [1]. Approximately one third of this patient population remains non-responsive to any known form of treatment today including pharmaceutical therapy or in certain cases, even resective surgery [2]. Electrical stimulation of deep brain targets has rapidly emerged as a promising alternate therapy for this large patient population, encouraging both commercial and academic interest in developing an implantable “neural pacemaker” [36]. While the side-effects of electrical stimulation of the brain are still debated, responsive or “on-demand” stimulation to abort a detected or predicted seizure is increasingly being preferred over continuous or non-responsive stimulation [7,8]. Osorio et al. report hypothesize that direct electrical stimulation of the epileptogenic focus may be more efficacious than indirect stimulation from results of their human clinical study, published in 2005 [9]. They further go on to speculate the relationship between the efficacy of the stimulation in suppressing electrographic activity and the time at which it was triggered, and conclude that stimulation may abate spontaneous seizures if delivered in close temporal proximity to its onset [9]. Critically, “on-demand stimulation” is expected to reduce neuronal desensitization by limiting the amount of charge delivered to when and where necessary, as opposed to continuous or periodic stimulation paradigms. There have been multiple reports of responsive stimulation being just as efficacious in suppressing epileptiform activity, if not better [10,11]. Studies in the past have reported an increased neuronal activation threshold associated with continuous electrical stimulation of neural tissue with time [12,13]. An increased activation threshold is usually countered by increasing the stimulation current with time to ensure that the efficacy of the therapy is not affected. Significant neuronal cell damage may be a consequence of high current stimulation, as evidenced from preliminary animal studies [14]. From a purely engineering viewpoint, triggering electrical stimulation only upon detection of an epileptic event increases the life-cycle of the battery, as each stimulation cycle consumes a significant amount of the total energy.
Effective seizure prediction or detection algorithms present the key to realize such “closed-loop” epilepsy treatment devices that deliver electrical stimulus upon detection of seizure activity. Algorithms to detect onset of electrographic seizures have been actively researched for the past two decades with mixed success. Even the few real-time detection algorithms reported are limited to non-portable bedside setups using one or more computers interfacing to recording electrodes implanted in the patient. Peters et al. developed one such early system involving an EEG collection system, two computers, two Grass Stimulators (Grass-Telefactor, RI) besides components to interface these blocks [15]. Later, Kossoff et al. reported an external neurostimulator that was triggered responsively, with promising initial human studies [16]. The Neuropace responsive neurostimulation device is the only known implantable device that uses cortical electrical stimulation triggered by seizure detection algorithms that run on-board a standard micro-controller in the device, and is currently under FDA investigation for efficacy [10]. Custom ASIC processors reported in the literature show far better energy efficacy for the same or better computational performance than micro-controllers and digital signal processing (DSP) chips, which are typically designed for much higher throughput applications [1719]. Advancements in neural recording technology along with low-power microchip design techniques have enabled the integration of signal processing algorithms to the neural recording amplifier hardware. Besides reducing the size of the implant, the integration of signal processing on the implant reduces the bandwidth of data to be transmitted outside wirelessly, reducing the major part of power consumption in the implant.
In the context of closed-loop epilepsy therapeutic devices, signal processing allows for integrating responsive seizure detection or prediction algorithms to analyze the recorded neural data and apply interventional therapy in a temporally specific manner. While there have been a number of different approaches proposed to both predict and detect seizures, barely a handful of these algorithms are employed into portable computing devices-implantable or hand-held. The computational limitations imposed by a battery powered platform limit most of the proposed real-time algorithms to purely theory or non-portable bedside applications for in-hospital monitoring. One proposed solution to this limitation is to use wireless schemes to transmit in real-time the data recorded from the patient on to an external device running the algorithms. Wireless transmitters often occupy a majority of area in the power consumption pie-chart of implantable medical devices- sometimes consuming more power than the rest of the system [18,20]. It is believed that high amounts of power dissipation in a small focal area could lead to heating of the tissue, causing neuronal damage to the implant area. Kim et al. (2007) analyzed the increase in temperature due to such implants, but there has been little work on the effects of such an increase in the temperature [21]. Using their numerical model based on the Utah electrode array, Kim et al. predict a linear increase of 0.051 °C/mW of power dissipation [21]. In the literature, a power consumption causing temperature increases of less than 1 °C is increasingly preferred for neural implants [22]. Moreover, larger power consumption implicitly requires batteries of larger capacity and physical size to ensure less recharges and replacements over time. Physical size of the devices is largely dominated by the size of the battery- deciding their feasibility in many implantable applications. In the past, general purpose micro-controllers and digital signal processors have been employed to implement seizure detection algorithms to make them feasible in implantable applications [10]. Low-power digital design techniques allow for customizable digital designs to implement the detection algorithms at a cost several times lower than employing standard micro-controllers or digital signal processors [17,18].
This article intends to highlight the challenges in realizing efficient feature extraction algorithms at a low computational cost, in order to retain implant feasibility. We review a set of techniques to translate mathematical models into computationally efficient hardware implementations so as to avoid the use of continuous transmission of data outside the implant. The next section overviews the major building blocks that go into a closed-loop epilepsy prosthesis. This is followed by an elaboration on digital feature extraction algorithms with specific reference to seizure detection. Low-power design techniques are then discussed with different levels of abstraction from mathematical to algorithmic, to improve the efficacy of the discussed seizure detection algorithms. It is our intention to involve the low-power circuit design community into developing novel solutions to this growing application space of medical implants, by using epilepsy treatment devices as an example.

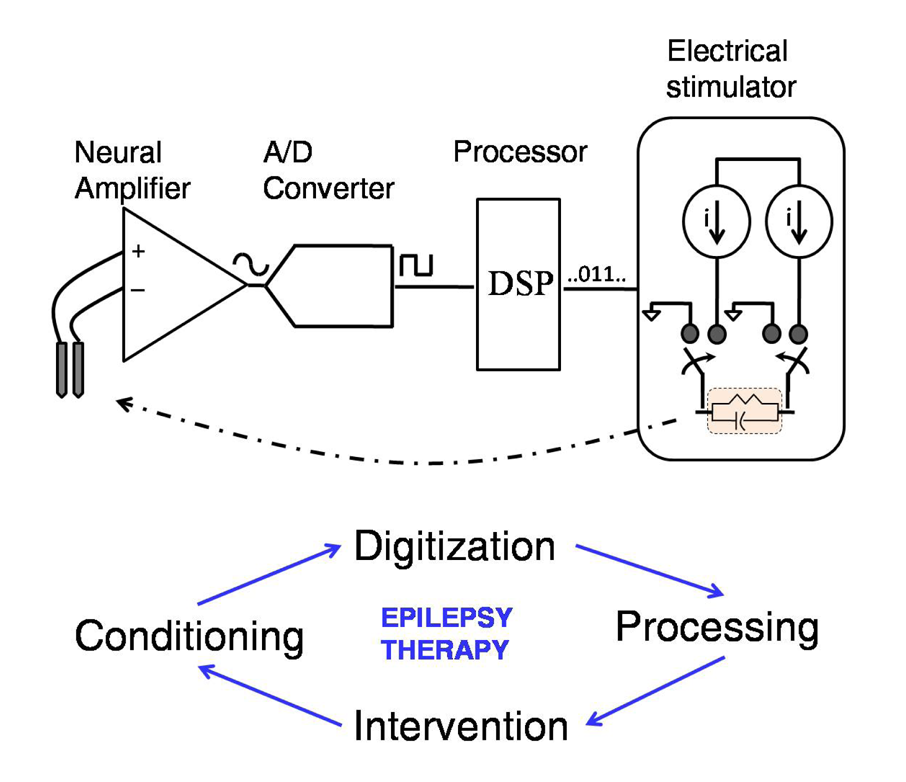
2. Components of a Closed-Loop Epilepsy Prosthesis

In order to develop closed-loop automated epilepsy treatment devices employing electrical stimulation, it is crucial to implement computationally efficient and highly specific seizure detection algorithms that trigger interventional therapy when necessary. The detection efficacy of the algorithm employed controls the overall power budget of the implanted system (by controlling the number of times a large electrical stimulus is applied) besides deciding the utility of responsive therapy. Typically, such systems consist of an analog low-noise front end which includes a neural recording amplifier with the necessary filtering and at least 40dB of gain [23,24]. The amplified neural signals are usually digitized before employing any feature extraction or seizure detection algorithms. Finally, the processed output is thresholded to determine seizure onset to trigger a constant-current or constant-voltage stimulator that delivers charge balanced cathodic and anodic pulses to suppress the detected seizure. An illustration of this processing chain is provided in Figure 1.
Historically, seizure detection algorithms have mostly been targeted at bedside patient monitoring and offline data sorting applications to easily identify seizure events from months of patient data [25,26]. These applications often employ computers and do not have stringent real-time operation requirements, thus simplifying the algorithm design process significantly. The advent of “closed-loop” treatment to seizures prompted the first devices to conceptualize an external patient-worn portable device that implemented the signal processing algorithms and communicated with an implant transmitting neural data wirelessly. Wireless transmission schemes are severely limited by the number of channels and bandwidth of data required by the detection algorithms and turn out to be the most power-consuming blocks of the battery powered implant. While external patient-worn devices prefer real-time implementation of the signal processing algorithms, they are not severely limited by memory, power consumption or physical size, within acceptable limits. The use of general purpose micro-controllers and digital signal processors to implement seizure detection algorithms caters to this application space [10,11]. More recently, there have been more reports of integrating signal processing features on the implant, thereby eliminating the need to transfer data continuously out of the device, and also reducing full bandwidth data to a set of useful features.

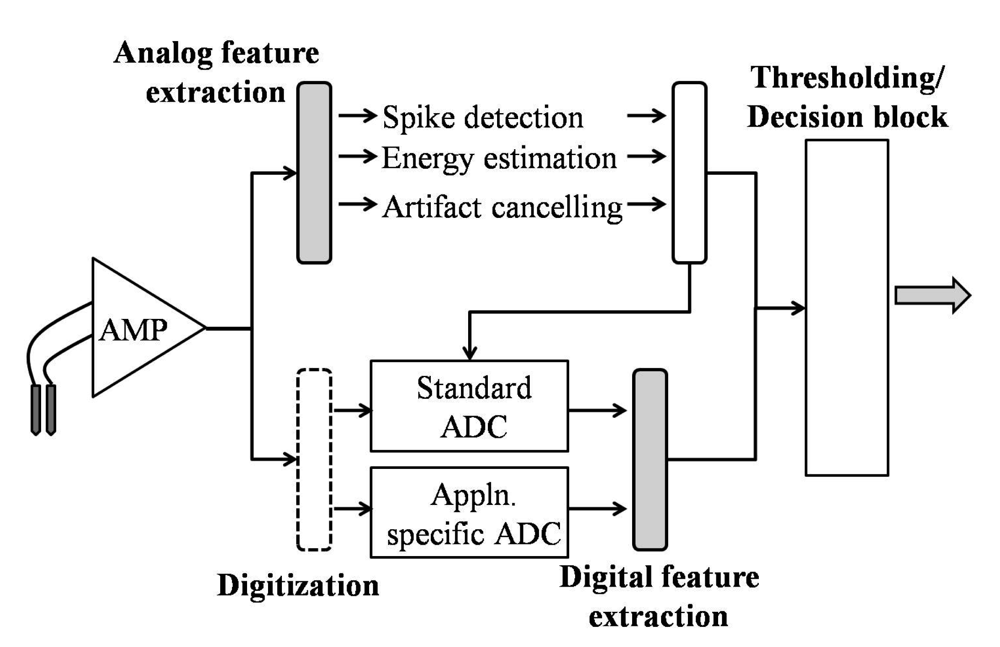
2.1. Feature Extraction/Signal Processing

Recently Verma et al., demonstrated that employing a custom feature extraction processor to transmit relevant markers of epileptic seizures would reduce the amount of time a wireless transmitter would need to be powered and estimated a 93% improvement in power when feature extraction was applied [18]. Similar results have been reported by other literature on this subject [20]. The RF components of the device consume the most power when operated—sometimes an order of magnitude more than the rest of the system. With the need to transmit through longer distances and through skin and tissue, RF transmission schemes are required to be more robust while still remaining low-power. For epilepsy prostheses, the possibility of integrating seizure detection or prediction algorithms on board the implant eliminates the need to transmit any data outside of the implant besides programming and housekeeping information during startup. There have been two broad methods to extract meaningful information from neural data- analog and digital. Traditionally, analog schemes are thought of to be more power hungry, although there have been low-power implementations of analog feature extraction circuits proposed lately [27,28]. Analog circuit techniques do not require an ADC to accurately digitize neural signals- a challenging design given the dynamic range of neural signals. Figure 2 shows a block diagram of the possible feature extraction schemes that are normally applied to implantable medical devices.
The most straightforward analog signal encoding schemes use a simple one-bit comparator to threshold (spike detect) data, reducing the neural signal to digital spike or threshold-crossings [27,29]. The value of the chosen amplitude threshold is critical in deciding the efficacy of this technique. This simple digitization scheme is justified by the fact that most neuroprosthetic applications only require timing information from spikes (action potentials) accurate to about 1-ms [20]. Harrison et al., proposed an adaptive neural spike detection circuit to reduce the data transmission rate of a 100-electrode neural recording system from 1.5 Mb/s to 100 kb/s by only transmitting a 1-bit threshold crossing per channel [20]. While the 100 channel system used a standard comparator with programmable threshold, the authors also proposed an adaptive automatic threshold setting comparator design [27]. The adaptive scheme works on the assumption that the background noise from neural recordings is accurately represented by a Gaussian distribution and can be described by its rms value, equivalent to its standard deviation. Figure 3 shows the block diagram proposed by Harrison et al., which uses two comparators and a servo feedback loop that ensures that the second comparator performs spike detection using a specific multiple of the background noise rms value.
Another analog feature extraction scheme aims to track the energy present in local field potential signals in a narrow range of frequencies (e.g., 20–40 Hz), with the idea that a slower ADC could then be used to digitize this specific band of information. The proposed implementation uses a leaky integrator with a band-pass filter and squaring circuit to estimate the LFP energy from raw neural data [28]. An example contrasting digital and analog implementations of a filter for a seizure detection algorithm concludes that the analog implementation was able to perform with comparable accuracy and lower power consumption than using FPGA based digital implementations [33]. In addition to these examples, there have also been continuous wavelet transform based filtering circuits implemented using analog circuits to eliminate artifacts from neural data such as heart beat, short spikes, DC offsets and motion.
Digital feature extraction algorithms assume the presence of an on-board ADC that provides sufficient resolution to capture the required information from raw data. Since most of the neural recording applications do not require high bandwidth (less than 10 KS/s per channel), standard Successive-Approximation ADCs remain a popular choice for this category [18,20]. These converters can be implemented to consume low-power while still providing over 10 bits of resolution. Delta-Sigma converters of low orders have also been reported as favorable candidates for biomedical applications [30]. Besides traditional converters, there have been application-specific bio-inspired ADCs mimicking the neuron's inherent pattern recognition abilities [31,32]. The authors report that this neuron-inspired ADC architecture can perform at speeds up to 45 KS/s with less than 1-μW of power consumption.
Digital schemes are the most widely applied and generic signal processing modules applied in medical implants. Digital signal processing comes at low hardware costs and can integrate maximal functionality per unit silicon area occupied especially with scaled technologies. Given that medical implants normally do not demand high clock-speed performance, the digital designs also allow for severe voltage scaling operating in near to sub-threshold regions of operation [33]. In the past, our group has reported a computationally efficient digital implementation of an event-based seizure detection algorithm that can be operated at a voltage as low as 300-mV with less than 350-nW of power consumption per channel [17] (Figure 4). This review intends to focus on digital feature extraction based algorithms besides reviewing hardware techniques to implement the algorithms with minimal computational effort. In epileptic seizure detection, a combination of markers extracted from raw neural data is often used to demarcate seizure from baseline states. The choice of features used to construct an algorithm often decides its feasibility in a battery-powered device. In the next section, we categorize some of the commonly used features to construct seizure detection algorithms based on their detection as well as hardware efficacy. A cost-table is then constructed to quantify the hardware costs of common mathematical operators when implemented using digital circuits. The table may be used as a reference to assign hardware costs based on number of operators used to implement the feature/algorithm, in order to compare two algorithms that may have comparable detection efficacies.

3. Digital Feature Extraction-Applied to Seizure Detection Algorithms
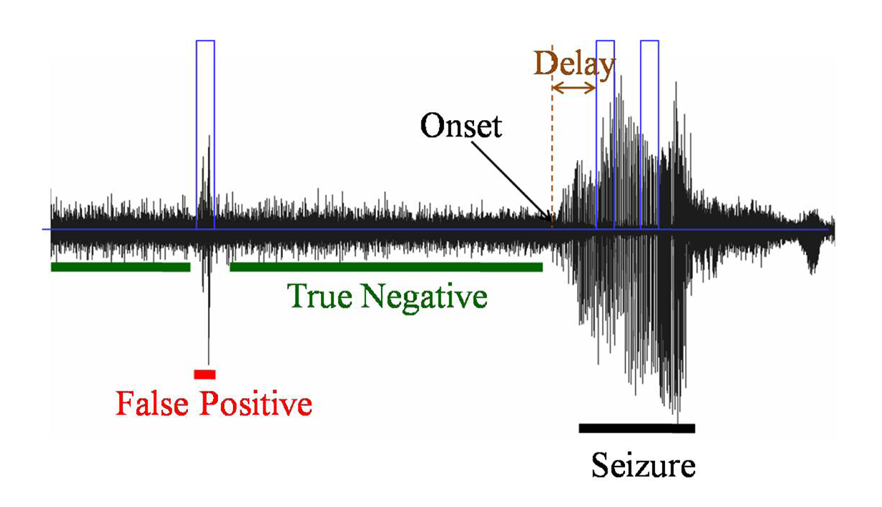
In this section, we review common features used to identify electrographic seizures from raw neural data. Seizure detection features usually rely on characteristic attributes in a seizure that are identified by mathematical differences from normal or “baseline” activity. These features could either be time or frequency based. Table 1 lists common seizure detection features used to construct algorithms based on their domain of operation.
Frequency based operators normally involve computationally intense feature extraction involving evaluation of FFTs, which reduce their viability as one of multiple features on board an implantable device. However, custom implementations of digital/analog circuits to extract an estimate of dominant frequency may be applied to approximate the mathematical feature, provided the detection efficacy validates this trade-off, as shown by our group in the past [17]. The “event-based” seizure detection algorithm described in the referenced paper uses the inter-event-interval (IEI) as a marker of dominant frequency or rhythm in the signal. The “events” are timestamps of amplitude threshold crossings, with the assumption that most frequency based feature extraction essentially intend to measure inter-spike interval rhythms. It is to be noted that the calculation of “half-waves” is another computationally efficient method to estimate changes in the dominant frequency and has been used in the past in applications that require computationally efficient signal processing [10]. In this section, we review some of the commonly used features to construct seizure detection algorithms in order to lead into the discussion of how algorithmic, mathematical as well as circuit level design techniques may be used to make the hardware implementations efficient.

3.1. Terminology

This subsection intends to review some of the basic terminology essential to understanding the issues in evaluating seizure detection algorithms designed for implantable devices. Typically, the detection efficacy of an algorithm or feature is defined by its ability to (i) accurately identify the onset of a seizure and (ii) reject any “seizure-like” short artifacts that could lead to unnecessary stimulation. The former is quantified by a measure of its sensitivity and the latter by specificity. Detection delay is defined as the amount of time after electrographic seizure onset that the algorithm identifies it. There exists uncertainty surrounding the definition of “onset”, and the only current gold-standard is visual inspection by electroencephalography experts trained in reading epileptic patterns. Figure 5 marks out some of these terms with an example algorithm output on animal data. In most cases, researchers use a team of epileptologists to review the data and mark out seizure onsets. Differences in marked onset times are settled by defining onset within a window, rather than a specific time. The uncertainty surrounding the exact temporal definition of seizure onset makes the computation of detection delay (as marked in Figure 5) of algorithms difficult. Literature on seizure spread indicates that seizures could spread to cortical regions from its focus in anywhere from 0–70 s [34]. While it is generally accepted that the efficacy of seizure abatement strategies is increased with an earlier detection, there is no consensus on an acceptable detection delay beyond which therapeutic intervention fails. In the retrospective analysis results discussed in Table 2, detection delay is not taken into account into analyzing the efficacy of the features. As a result of their definitions, false positives and false negatives (a missed seizure) have conflicting requirements, and most designers use an objective cost function to decide detection thresholds for algorithms [35,36].
Another distinction that is important to evaluate the efficacy of an algorithm is its performance in a real-time, look-ahead or prospective study. In other words, using a training set that is different than a testing set would allow for an unbiased evaluation of the algorithm's detection capabilities. Most detection algorithms use some variant of moving windows to average data points to extract features. The size of the window used has a direct implication on detection delay, trading off with false positives and negatives. Recently, Mormann et al. reviewed a comprehensive list of seizure prediction algorithms published in the literature and concluded that not one algorithm showed a performance better than statistical chance when subjected to a look-ahead, unbiased evaluation [37]. The authors encouraged researchers to report percent time spent in false warning, as opposed to absolute number of false positives- as this could be window size dependent. A detailed explanation of the trade-offs involved in setting thresholds, and how they relate to hardware power consumption can be found in [17] and [36].

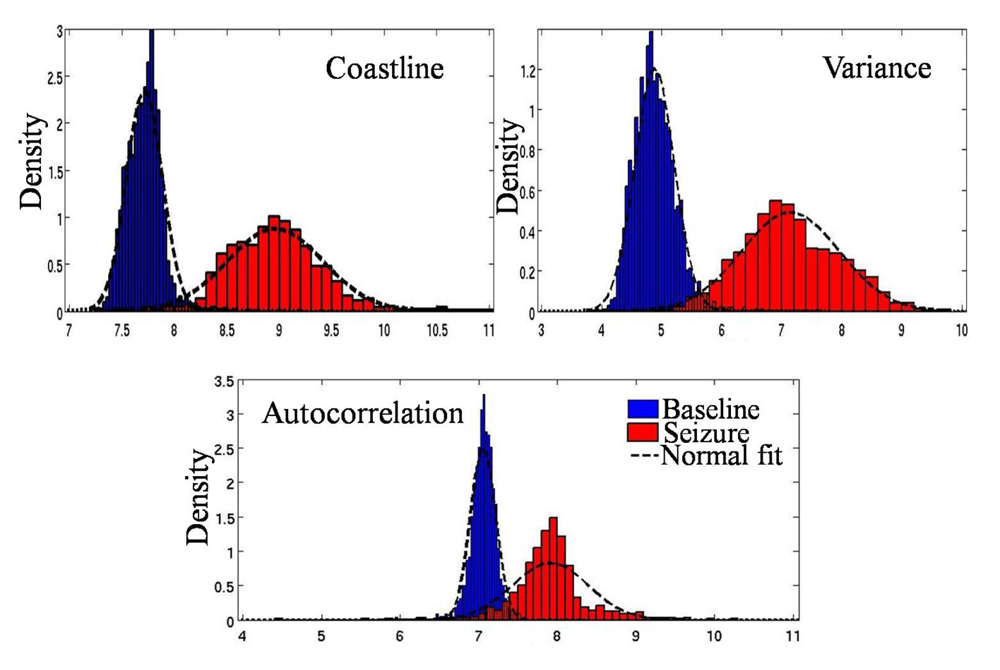
3.2. Seizure Detection Features

We compared a set of time and frequency based operators to quantify their ability as markers of electrographic seizure activity. The analysis performed was “retrospective”; without separate training and testing sets. The efficacy numbers obtained using such an analysis reflect the theoretical best case performance of these features and give the designer an idea of what features to select to construct an optimal seizure detection algorithm. Table 2 lists the features compared and the results of the comparison. Data from an animal model of human temporal lobe epilepsy (TLE) was used to test the features under study [38]. The features chosen in this comparison reflect a broad spectrum of common mathematical operators, both in time and frequency domains, used to construct detection algorithms. For details on the equations used to implement these features, the reader is referred to the cited publication for each of the features that uses them in an algorithm [25,26,3943].
For purposes of unbiased comparison, an equal window size of ∼1 s (1526 samples from data sampled at 1.5 KHz) was used to evaluate the features. The animal data was separated out into baseline and seizures (as identified by epileptologists at the IU School of Medicine) and the test intended to quantify the ability of the feature under study to distinguish these two states. It is to be noted that the seizures used were all electrographic-without consideration for whether there were clinical symptoms associated. The difference in mean values during baseline and seizure were calculated for each of the features under study, and the significance of this difference estimated using the t-test. The statistical power of the test was also reported to give the reader an idea of the significance of the difference in means, given the sample size and variance in each data. To help visualize the demarcation between seizure and baseline data for each feature, we fitted the values into a normal distribution, and calculated the area of overlap between the baseline and seizure fits. A smaller overlap indicates a better demarcation between the two states-indicating the ability of the feature to better separate these two states and vice-versa. Figure 6 shows an example of the normal fit curves for the autocorrelation feature, with the area of overlap shaded. Detection delay is not taken into account for the retrospective analysis, as this analysis is only intended to serve as a preliminary “best-case” indicator of the ability of a specific feature to demarcate baseline from seizure states. A detection algorithm is then constructed using a combination of one or more of the features, per the requirements of the application.
The results from the comparison (Table 2) do not indicate a strong advantage to using frequency based features to identify seizures. However, these features may prove to be powerful tools when used in combination with other time-based features, and have been successfully used to this effect in the past [31]. An important dimension that is not captured by this comparison is the hardware cost associated with each of each of the features. Given that designers often use a combination of features to construct an algorithm, it is important to consider the hardware costs of each feature and weigh the decision of choice of features based on a combination of detection and hardware efficacy. To address this gap, we recently compared a set of time-based detection features on a two-dimensional design space with both detection and hardware efficacies taken into account [36]. The hardware costs associated with each of the detection features was estimated by implementing their simplified mathematical functions using standard VHDL techniques on the IBM90nm CMOS process. This two dimensional space (shown in Figure 7) allows for designers to evaluate the pros and cons of each of the features to construct an algorithm for a battery-powered device. In the figure, a lower number for algorithm efficacy implies a better performance, per the definition of the term used. For details on the techniques used to obtain this design space and hardware implementations followed, the reader is referred to [36].
The features with higher detection efficacies also came with a higher associated hardware cost. Table 3 lists a set of common mathematical operators used to realize hardware implementations for seizure detection features, and a normalized estimate of average power consumption. The normalized power consumption numbers were obtained by implementing the architecture using standard digital circuits on the TSMC65 nm CMOS process. The cost table may be used to make back-of-the-envelope calculations to estimate the hardware cost of a digital feature under study based on the number of each of the listed operations required.
For example, an algorithm requiring using spectral analysis (any of the frequency based operators compared in Table 1) would require the hardware implementation of either FFT or DWT processors. If a DIF-FFT implementation were to be adapted, as reported by [44], the number of “multiplier” and “adder” blocks needed are described by Equation 1 for a radix-4 FFT operation.
Number of multipliers = 4 × log 4 ( N ) 1 Number of adders = 4 × log 4 ( N )
In the Equations 1, “N” represents the number of points over which the FFT is calculated. Using a window size of 1024 samples, an FFT operation can be estimated to use 19 multiplier and 20 addition blocks, amounting to ∼362× from the cost table.
On the other hand, implementing a discrete wavelet transform operator (DWT) allows for a much finer time and frequency resolution at a lower hardware cost than traditional FFT or STFT operations for large windows of data. Recently, we reported a DWT-based detection algorithm implemented on silicon with multiplier-less filters, that demonstrates for optimal detection performance at a low hardware cost [45,46]. There have also been numerous reports on the utility of using wavelet transforms (both discrete and continuous) for detection epileptiform activity [4749].

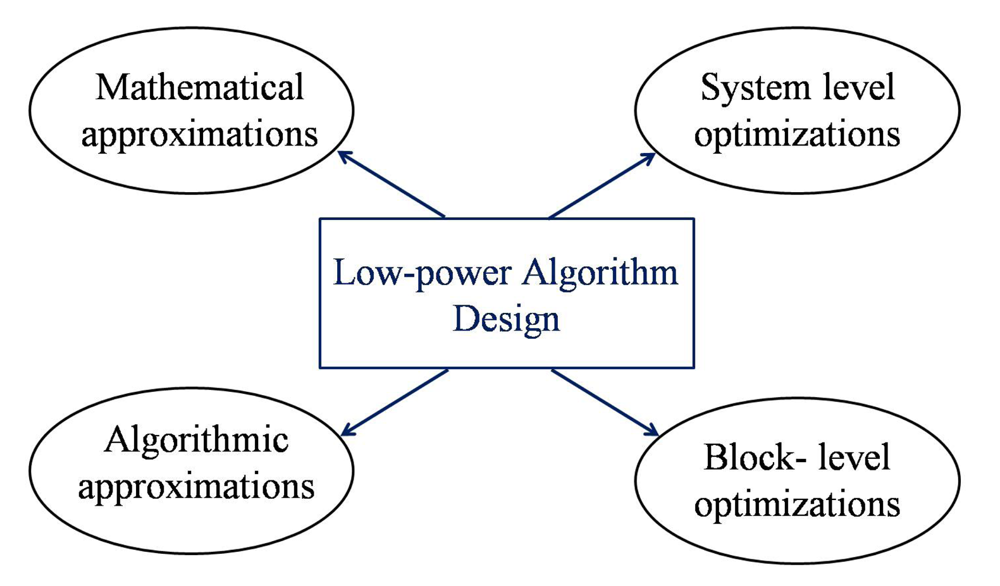
4. Low-Power Algorithm Design Techniques

This section reviews a set of design techniques in different levels of hierarchy that could be applied to make the hardware implementations of the digital features more power efficient. In the past, we have proposed specific algorithmic approximations to optimize combinations of a set of compared features, demonstrating its benefit over un-optimized or blind combination [36]. Although there have been numerous seizure detection algorithms published in the past few decades, there have been very few reports of the algorithms being used in a battery-powered platform. The Neuropace device is the only known responsive neurostimulation implant that is currently under FDA clinical trials [10]. The device can implement up to two computationally simple algorithms per channel- from line length estimate, area under the curve and half-wave based detection techniques, implemented on a standard microprocessor on-board the implant [10,50]. Custom circuit implementations allow for integrating more detection features at a fraction of the hardware cost of using standard microprocessors [1719,51]. The techniques outlined in this section are broadly applicable to optimization of algorithms for implantable devices, and are of particular interest to devices performing seizure detection. We focus on briefly reviewing design optimizations from various levels of abstraction as shown in Figure 8, giving examples from published literature where applicable.

4.1. Mathematical Approximation
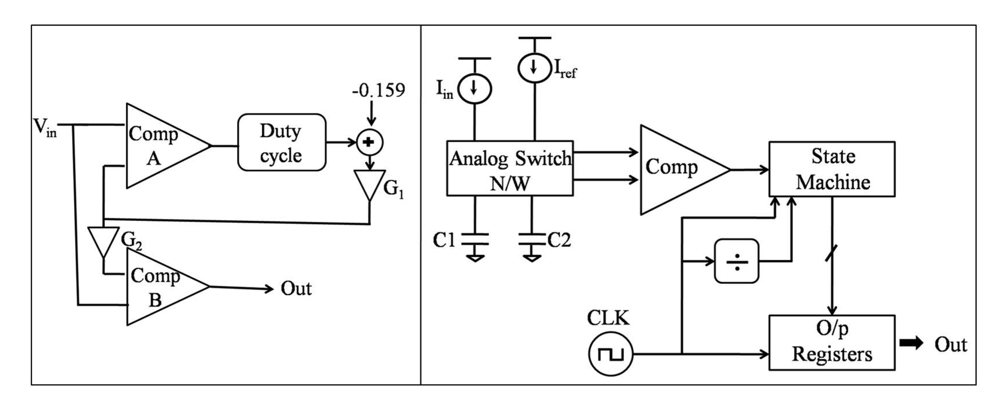
The data presented in Table 3 indicates the approximate hardware costs associated with common mathematical operators used in implementing seizure detection features/algorithms. In this section, we present examples of optimizations from the literature applied to mathematically simplify common operators to allow for low-power hardware implementation.

4.1.1. Division

Floating point division is one of the more computationally intense operators, and is commonly employed in realizing mathematical functions. While a floating point division operation takes 2911 clock cycles on the MC68HC11 processor(used by Medtronic for a number of implantable neurostimulators), a fixed point division operation only requires 41 clock cycles. Employing various division algorithms to reduce the number of clock cycles required to complete the operation has been widely researched in the past. Floating point division, for example, is commonly approximated using fixed point division with a number that has been “scaled” to account for precision retention. With specific reference to the implementation of seizure detection algorithms, most detection features use a form of averaging (moving window averaging) to ensure that short-term non-linearities in the raw signal do not affect the metric. Windowing involves accumulation and division by the window size. If the divisor (window size) can be approximated to a power of 2 (say 2m), the quotient can be computed by simply shifting the dividend towards the least significant bit by ‘m’ bits. If the number of samples in the window used to average each feature is large, such an approximation of the divisor would not significantly affect the performance of the algorithm. Alternately, the window size may be left unaltered and divisor could be approximated to the nearest power of two to get similar results. This design choice should be made based on the magnitude of the approximation error resulting from both these options.
Division approximations that can be implemented using simple microcontrollers or even custom digital logic would be highly preferred for applications such as multi-channel neural data acquisition systems, that deal with relatively higher speed clock operations imposed by high sampling rate and number of channels. Drew presents a division approximation along with its hardware implementation in the referenced disclosure which involves ratio estimation to determine the ratio of a numerator to a denominator as a result of a function of 2 raised to the power of the difference between the most significant set bit position (MSSB) of denominator to numerator [52]. Equation 2 depicts the calculation of this approximate ratio as detailed by Drew [52].
Ratio = 2 ( D M S S B N M S S B ) D M S S B , N M S S B = Number of left shifts to obtain set M S B
This is easily implemented in hardware using a single accumulator or binary counter that may be incremented up or down to obtain the desired ratio per Equation 2. It is to be noted that there have also been several circuit-level modifications proposed to the building blocks of a CMOS division algorithm that facilitate low-power operation at the cost of throughput or accuracy. We allude to some examples in the custom circuit design techniques sub-section later in this manuscript.

4.1.2. Windowing and Averaging

A number of detection features employ overlapped windows to accurately capture the effect of every sample on the mathematical feature. This is especially more important for features working on data sampled at lower frequencies. Equations 3 show a typical overlapped averaging window, which would require storing the first “k” elements for subsequent usage. “xi” represents the ith element of data “x” and “k” is the size of window used.
W n = 1 k x i : i + k W n + 1 = 1 k × ( x i : i + k x i + x i + k + 1 )
A “quasi-averaging” technique recently reported approximates this calculation by assuming that “the average of a window is a true representation of all the elements contained in it”, re-writing this equation as Equation 4 [45]. The authors also propose a hardware implementation of Equation 4 that is computationally more efficient than storing “k” terms in memory using either a dynamic register or static memory.
W n + 1 = 1 k × ( x i : i + k W n + x i + k + 1 )

4.1.3. Frequency Analysis

Frequency based features often involve implementing FIR or IIR filters in hardware. From a hardware perspective, ultra-low power FIR filters operating using sub-threshold circuits have been proposed for other medical applications such as hearing aids in the past [33]. In the past, our group has reported a “multiplier-less” filter using a computation sharing multiplier, or CSHM [46]. The multiplier is based on the principle that in vector scaling operations, any scalar can be decomposed into smaller alphabets, or bit sequences such that the original scalar can then be reconstructed using these alphabets using only shift and add operations. For example, the alphabets {1,3,7,11} may be used to represent filter coefficients {103,139} as shown in Table 4.
This approximation made to the coefficients shows negligible degradation in the filter response for applications such as epileptic seizure detection, as shown by the authors who implemented a discrete-wavelet-transform (DWT) based seizure detection algorithm using the above described CSHM filter [45]. Figure 9 shows a block diagram implementation of the described CSHM technique use to approximate filter coefficients.
From the results in Table 3, and per Equation 1 one might estimate the cost of a radix-4 FFT block to cost 392 times that of a shift operator on the same technology. There have been several low-power implementations of wavelet transform based spectral analysis blocks that provide comparable frequency resolution with better time resolution, at a much lower computational cost than employing traditional FFT [45,53]. While our group demonstrates the implementation of DWT with multiplier-less CSHM multipliers, Kamboh et al. document a wavelet processor based on “integer lifting” [53].

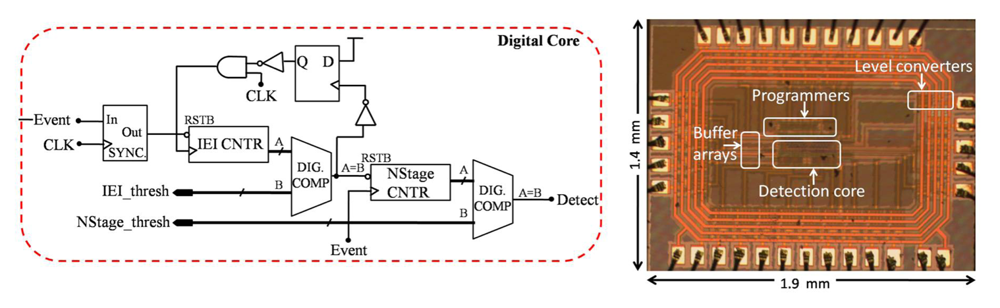
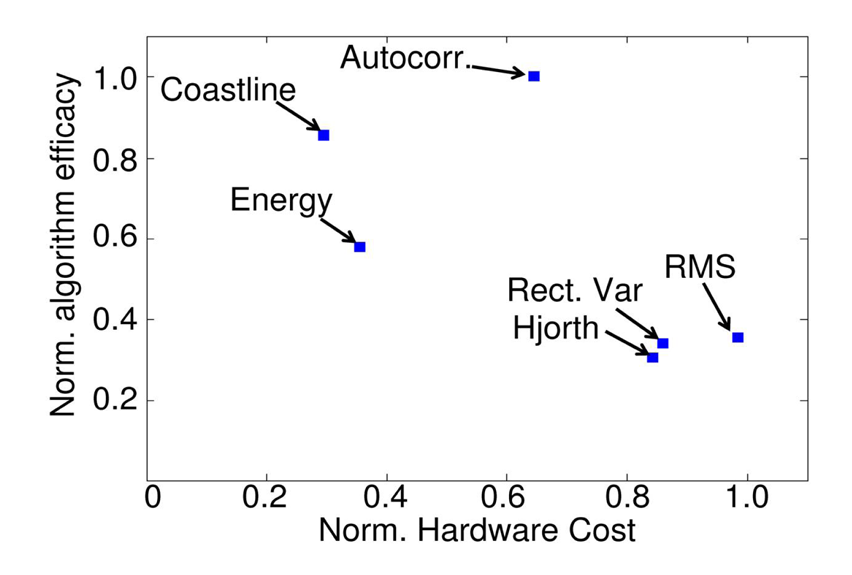
4.2. Algorithm-Specific Approximation

Approximations made to the algorithm or feature under study is another level of design abstraction that can reduce hardware costs of digital features. While this kind of design modification is very application specific and hard to generalize, there have been published reports in the past employing such techniques to minimize hardware power consumption. Reviewing the results of the two-dimensional comparison study presented earlier and in [36], it is evident that the features with higher detection efficacies also consumed higher power. In the study, a simple seizure detection algorithm was constructed by linearly combining the best performing feature (Hjorth variance) with the lowest-costing feature (Coastline/Line length) to study the impact of this combination on the same 2D space [36]. The Hjorth variance feature is mathematically described by Equation 5, and involves the application of two multiplier blocks in its architecture—one for evaluating (Σx)2 and another to evaluate x2. In the Equation 5, “i” refers to the index of the data point (x) in the kth window of size “W” with a mean “μ”.
Variance ( k ) = 1 W k x i = 1 W ( x [ i + ( k 1 ) x W ] μ k ) 2
The Equation 5 was modified to use the mean of the previous window “ μk−1” instead of the present window “μ” and it was observed that this change did not affect the detection efficacy of the feature significantly However, the hardware implementation required to realize this equation now only requires one multiplier (to evaluate square of differences) as opposed to two in the original implementation. The results indicate a 27% decrease in hardware power due to the approximation [36]. Figure 10 captures the location of the Hjorth variance feature before and after approximation on the 2D design space.
Another example of an algorithmic approximation to facilitate simple hardware implementation aims to estimate the dominant frequency of neural data by calculating the time between spike thresholds, or “events” [17]. Most frequency based operators aim to measure the dominant frequency or rhythms present in a window of data to use as a marker of electrographic seizures. The “event-based” seizure detection algorithm proposed in [17] approximates a measure of the dominant frequency by digitizing the time interval between two successive amplitude crossings, or spikes. In digital circuits, this is easily implemented by using a counter and combinational logic to control its clocking and resetting. Figure 11 shows a block diagram of the hardware used for conceptual extraction of dominant frequency from a spike train of data.
The approximation is subject to the correct amplitude threshold being set to ensure the spikes are not missed by the comparator- reducing its robustness and mathematical accuracy with any variations in this threshold with time. However, with adaptive spike thresholding techniques that have been proposed in the past, it is possible to constantly adapt the threshold with changing DC levels of raw neural data [24] (Figure 3). If the frequency of the clock used to increment the binary counter is known, it is possible to accurately estimate the dominant frequency present in the spike-train, and average the same over time to account for temporal instabilities or variations.

4.3. System-Level Design Techniques

Implantable medical devices usually do not have high impositions on throughput (typically operating under 1-MHz), allowing for aggressive supply voltage scaling (VDD). Figure 12 shows power versus throughput plot for a 5-tap finite impulse response (FIR) filter implemented on a predictive 90 nm technology, as reported by Raychowdhury et al. [54]. The plot quantitatively describes the choice of operating voltage depending on the application space, which is often set by the computational speed (throughput) requirements. As discussed earlier, it is well understood that a higher VDD results in higher dynamic and leakage power (Figure 14). In addition to VDD scaling, technology scaling also helps to achieve lower power, providing the benefit of smaller devices and hence, lower capacitance which results in lower dynamic power and area. Figure 13 shows the simulation results of an inverter driving another inverter, illustrating power scaling at iso-performance using scaled technologies. Contrary to common intuition, process scaling, in addition to aggressive voltage scaling also benefits low-frequency applications just as much as high-performance designs. The supply voltages used to quantitatively describe the benefit associated with technology scaling reflect the absolute minimum possible for operating a simple circuit (inverter-driving-inverter) chosen by the authors, it is to be noted that typical operating voltages chosen by designers for low-power digital systems may be higher than projected by the illustration. In traditional medical implants where the chip power is dominated by analog components (due to lack of significant signal processing on board), supply voltages of the order of 2.5 V and greater are commonly seen. The benefits of technology scaling are maximized when the supply voltage is also scaled, sometimes requiring designers to operate digital parts of the implant at near to sub-threshold supplies.
Operation in the sub-threshold region results in increased susceptibility of circuits to process variations, making it imperative to employ circuit techniques to counter the adverse effects of process variations on circuit functionality, power and performance. Moreover, due to the low frequency operation of the system, leakage energy becomes dominant over dynamic energy. Leakage reduction techniques need to be used to achieve overall reduction in the energy consumption of the system. In the subsequent sub-sections, we review such design techniques in detail. A discussion on the optimal VDD choice for the system for minimum power or energy operation is presented, with relevance to implantable biomedical applications. The following sub-section documents some important considerations for choosing the operating supply voltage for low-power medical applications.

4.3.1. Choice of Optimal VDD for Minimal Energy or Power

Figure 14 shows the dynamic and leakage power and energy per operation as a function of VDD, as adapted from [55]. It can be observed that for the lowest power, the optimal VDD is the lowest VDD that the system can operate at and is limited by performance and/or robustness requirements. On the other hand, for minimum energy, optimal VDD is in the near-threshold region. This is a result of the dynamic energy decreasing with VDD scaling and leakage energy subsequently increasing close to the sub-threshold region. With the scaling of VDD beyond the threshold voltage, there is an exponential increase in circuit delay which increases the time per operation over which the circuit leaks. Thus, depending on the minimum power or minimum energy requirements of the system, the choice of optimal VDD may be different.
In an example of a 5000 inverter chain implemented in TSMC65 nm, we discuss the simulation results showing leakage and dynamic power and energies at different VDD values. For the feature extraction block, the input frequency (1 kHz) is constant and is independent of VDD. It is to be noted that a number of real-time biomedical signal processing applications are also presented with a similar environment with a fixed input sampling frequency that is independent of supply voltage chosen. For example, in epilepsy prostheses, a full bandwidth neural signal is limited to a sampling rate less than 10-kHz. In this example, we assume that the input changes every 1-ms, irrespective of VDD. Figure 15 shows an illustration of the timing diagram of a system with two possible scenarios- the top one involving operating the system at a minimal supply voltage all the time (VDDL) and the bottom involving power-gating the system after computation while operating at an energy-optimal supply voltage (VDDopt).
The Table 5 shows results from the two cases—with and without power gating. When the circuit is power gated, leakage energy is expended only during the time of computation. However, without power gating, circuit leaks for the entire time. Let us first consider the case with power gating. It can be observed that as VDD is lowered, both dynamic and leakage power decrease. However, as the time for computation increases with decreasing VDD, leakage energy starts increasing close to the sub-threshold region. Thus, for minimum energy, the system should be designed to operate in the near-threshold region, completing the computation much before the arrival of the next sample. The system should then be power-gated for the rest of the time to save leakage energy. In the example circuit, it is observed that operating the system at a supply voltage of 0.6-V results in approximately 90% less total energy consumption as compared to operation at a supply voltage of 0.1-V, even with power gating. However, if power gating is not possible in the system, the optimal VDD for minimum energy would be the same as that for minimum power, as can be observed from the simulation results without power gating. Since the time per operation for which the circuit leaks becomes independent of VDD because of constant input sampling frequency, lowest VDD yields lowest power and energy, as is the case with a number of biomedical applications.

4.3.2. Adaptive Beta Ration Modulation (ABRM) for Enhanced System Robustness

Operation of circuits in the sub-threshold region leads to increased sensitivity to process variations [54,56]. The adverse effect of process variations is most critical when functional failures occur, especially at ultra-low voltages. Innovative circuit design techniques are required to counter the effects of process variations. In this section, we discuss one such reported method called Adaptive Beta Ratio Modulation (ABRM). This technique aims at reducing the spread of logic threshold voltage (VM) due to inter-die variations by dynamically changing the strength of pull-up or pull-down networks so that VM shifts towards the ideal value of VDD/2. Process corner of the chip is sensed by obtaining the logic threshold voltage (VM) of an inverter on the die. VM is compared against two reference voltages Vref1 and Vref2, Vref1 being smaller than Vref2. If VM < Vref1, implying weaker PMOS, forward bias is applied to the body of PMOS, increasing its strength. Similarly, if VM > Vref2, implying stronger PMOS, reverse body bias is applied to PMOS. If Vref1 < VM < Vref2, no body bias is applied. Measurement results on a chip fabricated in 130 nm CMOS technology show a 17% reduction in the spread of VM (Figure 16).It is to be noted, however that system-level design choices such as the implementation of ABRM are made based on careful analysis of the size and percent power consumption by the digital blocks, and may not be as useful for smaller analog-dominated systems. It is also worth noting that body-biasing is one possible technique to control the beta ration of devices, which has been widely used in both academic and industry-led research projects [57].

4.4. Block-Level Design Techniques

In this sub-section, we briefly review some of the block level circuit designs proposed to reduce either active or leakage energy consumption. While some of the techniques discussed also find broader application from a system-level design abstraction, others help in realizing low-power computational blocks optimized for lower throughput application platforms such as medical implants.

4.4.1. Leakage Reduction Using Stacking Effect

Transistors in series have been shown to expend lower leakage power [59]. The reason is two-fold. Consider a pull-down network of a CMOS circuit with two stacked transistors in the OFF state (VG = 0) (Figure 17. With a finite leakage current flowing, the source voltage of M1 is a small positive voltage VX. This results in (1) reduction in gate-to-source voltage and (2) increase in threshold voltage due to body effect [60], leading to reduction in leakage current. Analysis in [59] shows that two transistors in series yielded 35 to 90% reduction in leakage as compared to leakage reduction obtained by state dependence alone. This comes at the cost of circuit performance. Since the performance requirements for implantable digital signal processing blocks are low, judicious use of stacked transistors in the design is an effective method to achieve leakage reduction. An increase in the number of series transistors results in larger reduction in leakage. However, this incurs a large performance loss, brought up by the subsequent decrease in drive current of the circuit as well. Further, the stacking effect loses efficacy when operating at ultra-low supply voltages. For conventional designs, two stacked transistors have been shown to provide significant leakage reduction with nominal degradation in the circuit speed [59,61]. It is to be noted that transistors in series employing the stacking effect only reduce the leakage component of the total power leaving dynamic power unaffected. In order to impact both dynamic and leakage power consumption, “sleep” transistors have been used to power-gate blocks or sections of the system, as discussed using examples from the literature in the next sub-section.

4.4.2. Clock and Power Gating

One of the most common approaches to decrease the dynamic component of total power consumption is to disable the clock driving inactive circuit blocks. This approach is used in both low power [17] and high performance designs [62]. There is, however, overhead costs incurred in terms of the extra circuitry for generating the clock gating signal. In [62], clock gating in an 8-issue out-of-order superscalar processor resulted in 9.9% average power savings. With reference to implantable medical applications, clock-gating has also been reported to decrease power consumption in seizure detection algorithms. Our group has demonstrated the benefits of clock gating to attain power reduction of a seizure detection algorithm, as shown by its operation in Figure 18 [17]. Although this approach is easy to implement, it only reduces the dynamic component of the power. In order to reduce both leakage and dynamic components of power of inactive blocks, power gating is implemented using sleep transistors [63]. The same stacking effect described in the previous sub-section is employed to implement the “sleep” transistor. This technique may require pre-decoding of wake-up signals in order to activate the sleeping block in time for performing the required computations. As an example, in [63], for a system implemented using 26 ISCAS benchmark circuits, power gating resulted in 47% leakage energy and 5% dynamic energy savings. Low frequency operation of the feature extraction block and the dominance of leakage energy over dynamic energy are expected to enhance the benefits of power gating.
A fully programmable seizure-detection subsystem that incorporates four different hardware-optimized detection features from the study results reported by Raghunathan et al. [36] employs a power-gating methodology to only activate algorithms in use. Figure 19 shows a block diagram of the programmable seizure detection processor that is currently under design by our group on a 65 nm-CMOS process. From the results of [36], if maximal detection efficacy per unit power were desired, the Hjorth variance and Coastline algorithms would be operating in combination. Power-gating the other two algorithms resulted in a 48.1% decrease in total power consumption of the processor, assuming a negligible control-circuitry cost. The proposed processor allows for flexible modes of operation ranging from low-power (low detection efficacy, enabling only coastline) to high-efficacy (high power, enabling all algorithms).
The “Phoenix” processor proposed by researchers at the University of Michigan widely employs power gating to reduce leakage or “standby” power consumption [64]. In their research publication, the authors describe a sleep transistor design scheme where a medium-Vt device is used as a power gating switch contrary to a high-Vt switch that is more commonly used for higher operating voltage applications [64]. The authors also report using a narrow power-gating switch, justifying the penalty in active energy penalty for the large standby energy savings obtained by this application.

5. Conclusions

The design of low-power seizure detection algorithms would facilitate integration of responsive feedback therapy to suppress epileptic seizures in an implantable device. Given the number of mathematical models proposed to both predict and detect seizures in human and animal trials, translational research that adapts these algorithms into designing a clinical device to treat epilepsy would be the logical next step to realize clinical impact. There are several components that go into developing a long-term neural implant that can reliably sense, detect and stimulate a specific part of the brain in order to suppress electrographic seizures. One of the main goals of this paper is to perform a review of circuit and architecture based techniques to implement feature extraction algorithms on board an implantable device- specifically for the treatment of epilepsy by neurostimulation. The techniques reviewed in this paper and results presented allow for translation of the many mathematical models presented over the past few decades from computer or offline implementations to a practical, portable device that can be of use to a patient. Examples from literature have been analyzed, where applicable, and related back to its utility in low-performance, low-power application platforms such as the one under study.
In this review, we set the stage by reviewing the parts of a closed-loop epilepsy treatment device, and drive the need for on-board signal processing capabilities to increase the power efficiency of these implants. Broadly, such techniques are applicable for most implantable medical device designs that are battery limited. Specific feature extraction algorithms to detect seizures are then discussed, with an emphasis on key terminology and examples from literature. Finally, Section 4 intends to provide the designers with a set of design techniques from various level of abstraction to optimize the implementation of digital feature extraction algorithms on a low-power implant.
Feature extraction, or signal processing represents a key aspect to realizing fully-implantable, single chip solutions to treat chronic disorders such as epilepsy. On-board signal processing would eliminate the need to transmit any data, wired or wireless, outside the body and therefore reduce a significant part of the power consumption of the device. We review specific examples applied to seizure detection algorithms and propose a set of techniques that could enable low-power algorithm design for a broad range of implantable medical devices. A set of both time and frequency based seizure detection features, commonly reported in the literature are evaluated for their feasibility in implantable applications. Approximations proposed in mathematical, algorithmic and circuit levels of abstraction allow for optimally trading off detection efficacy with low-power hardware feasibility. With rapid developments in micro-electrode fabrication technology as well as low-power design methodologies, realizing a closed-loop implant that would provide a solution for a large part of the non-respondent epileptic population is closer to a reality. Interdisciplinary collaboration would encourage rapid development of the next generation of neural implants that could treat epilepsy and a number of other chronic medical disorders that plague our society today.
Figure 1. Illustration showing the blocks that constitute a closed-loop epilepsy prosthesis to detect and suppress seizures via electrical stimulation.
Jlpea 01 00175f1
Figure 2. Conceptual figure illustrating the different types of feature extraction schemes typically reported in literature to build implantable neural prostheses.
Jlpea 01 00175f2
Figure 3. (Left) Adaptive spike detection circuitry proposed by Harrison (2003) and (Right) Application specific neuron-inspired ADC proposed by Yang et al., (2006).
Jlpea 01 00175f3
Figure 4. (Left) System architecture of a digital seizure detection algorithm developed by our group, adapted from Raghunathan et al., (2009) and (Right) Micrograph of the fabricated chip with the low-power algorithm.
Jlpea 01 00175f4
Figure 5. Snapshot of algorithm output (in blue) on animal data (in black) with false positive (FP), true negative (TN) and detection delay marked out for the defined electrographic seizure.
Jlpea 01 00175f5
Figure 6. Normal fit of baseline and seizure data using example features “coastline”, “variance” and “autocorrelation” to calculate area of overlap.
Jlpea 01 00175f6
Figure 7. Two dimensional detection algorithm design space contrasting both algorithm and hardware efficacy on the same plot, adapted from Raghunathan et al., (2010).
Jlpea 01 00175f7
Figure 8. Classification of design optimizations for low-power hardware realization at different levels of abstraction discussed in this review.
Jlpea 01 00175f8
Figure 9. Block diagram of hardware implementation of a multiplier-less FIR filter proposed by Karakonstantis et al., (2007). The filters were used to realize a DWT based real-time seizure detection algorithm on a microchip Markandeya et al., (2010).
Jlpea 01 00175f9
Figure 10. Two-dimensional design space proposed by Raghunathan et al., (2010) reflecting the improvement made to hardware cost by approximation of Hjorth algorithm without affecting its detection efficacy.
Jlpea 01 00175f10
Figure 11. Event-based seizure detection algorithm hardware proposed by our group that extracts dominant frequency by digitizing the “inter-event-interval”, reproduced from [17].
Jlpea 01 00175f11
Figure 12. Figure adapted from [54] illustrating the effects of supply voltage and power scaling on the throughput of a system- in this case a 5-tap FIR filter.
Jlpea 01 00175f12
Figure 13. Figure reproduced from [54] depicting the benefits of technology scaling on power consumption of a simple circuit (inverter driving inverter).
Jlpea 01 00175f13
Figure 14. Figure adapted from [55] illustrating the scaling of energy and power with supply voltage.
Jlpea 01 00175f14
Figure 15. Timing diagram illustrating power-gating benefits in terms of energy per operation for a sample circuit (5000 inverter chain).
Jlpea 01 00175f15
Figure 16. The effect of adaptive beta ration modulation (ABRM) shown with a schematic and its resulting improvement in the distribution of logic threshold voltage, adapted from [58].
Jlpea 01 00175f16
Figure 17. Schematic illustrating the use of leakage control “stack” transistors, adapted from [59].
Jlpea 01 00175f17
Figure 18. Event-based seizure detection algorithm reported by Raghunathan et al., (2009) demonstrating a clock-gated mode of operation to put the system into a low-power “sleep” mode between events while detecting a seizure.
Jlpea 01 00175f18
Figure 19. Multi-algorithm seizure detection processor under development by our group based on results obtained from [36].
Jlpea 01 00175f19
Table 1. Classification of example seizure detection features.
Seizure detection features

Time domainFrequency domain
EnergyEdge frequency
Coastline/Line lengthSpectral power
Hjorth varianceDominant frequency
RMS amplitudeDominant bandwidth
Non-linear energyWavelet energy
Autocorrelation
Rectified variance energy
Table 2. Results of retrospective analysis of seizure detection features.
FeatureMean
Baseline
(X)
Mean
Seizure
(Y)
Average
Difference
(d = )
t ValuePr(|T| > t)
Ha: d! = 0
Area of
Overlap
(A)
Power
a = 0.05
(P)
Energy380.644990.474727.042.440.0710.430.698
Coastline2741.297192.264450.988.320.00110.160.999
Hjorth378.483702.973324.484.870.00820.090.996
RMS16.4360.1243.694.610.010.080.994
Autocorrelation1726.93934.82207.94.320.01250.310.9657
Abs. Variance1.44 × 1052.40 × 1062.25 × 1062.560.06260.650.7355
SEFa36.9236.940.010.050.95660.790.0502
SEFb72.2375.092.860.80.47050.580.0579
Sp Powera589.814486.43896.593.180.03350.160.8133
Sp Powerb1744.48509.66765.22.360.07820.150.4575
Dom Peak30.2729.72−0.560.460.67090.870.0664
Peak BW9.799.56−0.240.360.7380.870.0571
Table 3. Normalized hardware cost of common mathematical operations used to construct algorithms.
Mathematical OperationImplementationNorm. Hardware Cost
Barrel shift Addition10-bit
(a) RPL1.43 ×
(b) CLA1.05×
Subtraction(a) RPL1.53×
(b) CLA1.15×
Multiplication(a) CSA17.53×
(b) Wallace-tree21.35×
Division(a) RPL9.98 ×
(b) CLA9.33 ×
Square root(a) RPL15.06×
(b) CLA16.54×
Table 4. Co-efficient approximation using “Shift and Add”.
CoefficientsDecomposition
X0 = 103 = 0110011125 (0011)x + (0111)x
X1 = 139 = 1000101127 (0001)x + (1011)x
Table 5. Table with simulated results to quantify leakage and dynamic energy of a test circuit with and without power-gating in a biomedical application scenario. (Fixed input frequency).
Supply VoltageWith Power-GatingWithout Power-Gating

Leakage EnergyDynamic EnergyTotal EnergyLeakage EnergyDynamic EnergyTotal Energy
1.1-V0.53-pJ4.75-pJ5.28-pJ14000-pJ4.75-pJ14005-pJ
0.6-V0.27-pJ0.88-pJ1.15-pJ2610-pJ0.88-pJ2611-pJ
0.1-V10.9-pJ0.81-pJ11.31-pJ160-pJ0.81-pJ161-pJ

References

  1. Begley, C.E.; Famulari, M.; Annegers, J.F.; Lairson, D.R.; Reynolds, T.F.; Coan, S.; Dubinsky, S.; Newmark, M.E.; Leibson, C.; So, E.L.; Rocca, W.A. The cost of Epilepsy in the United States: An estimate from population-based clinical and survey data. Epilepsia 2000, 41, 342–351. [Google Scholar]
  2. Morrell, M.J. Antiepileptic medications for the treatment of epilepsy. Semin. Neuorol. 2002, 22, 247–258. [Google Scholar]
  3. Labar, D.; Murphy, J.; Tecoma, E. Vagus nerve stimulation for medication-resistant generalized epilepsy. Neurology 1999, 52, 1510–1512. [Google Scholar]
  4. Graves, N.M.; Fisher, R.S. Neurostimulation for epilepsy, including a pilot study of anterior nucleus stimulation. Clin. Neurosurg. 2005, 52, 127–34. [Google Scholar]
  5. Ghai, R.S.; Bikson, M.; Durand, D.M. Effects of applied electric fields on low-calcium epileptiform activity in the CA1 region of rat hippocampal slices. J. Neurophysiol. 2000, 84, 274–280. [Google Scholar]
  6. Velasco, M.; Velasco, F.; Velasco, A.L.; Boleaga, B.; Jimenez, F.; Brito, F.; Marquez, I. Subacute electrical stimulation of the hippocampus blocks intractable temporal lobe seizures and paroxysmal EEG activities. Epilepsia 2000, 41, 158–169. [Google Scholar]
  7. Psatta, D.M. Control of chronic experimental temporal lobe epilepsy by feedback caudatum stimulations. Epilepsia 1983, 24, 444–454. [Google Scholar]
  8. Nakagawa, M.; Durand, D.M. Effects of applied currents on spontaneous epileptiform activity induced by low calcium in the rat hippocampus. Brain Res. 1998, 806, 186–195. [Google Scholar]
  9. Osorio, I.; Frei, M.; Sunderam, S. Automated seizure abatement in humans using electrical stimulation. Ann. Neurol. 2005, 57, 258–268. [Google Scholar]
  10. Sun, F.T.; Morrell, M.J.; Wharen, R.E. Responsive Cortical Stimulation for the Treatment of Epilepsy. Neurotherapeutics 2008, 5, 68–74. [Google Scholar]
  11. Osorio, I.; Frei, M.G.; Manly, B.F.J.; Sunderam, S.; Bhavaraju, N.C.; Wilkinson, S.B. An Introduction to contingent (Closed-Loop) brain electrical stimulation for seizure blockage, to ultra-short-term clinical trials, and to multidimensional statistical analysis of therapeutic efficacy. J Clin. Neurophysiol. 2001, 18, 533–544. [Google Scholar]
  12. McCreery, D.B.; Yuen, T.G.H.; Agnew, W.; Bullara, L.A. A characterization of the effects on neuronal excitability due to prolonged microstimulation with chronically implanted microelectrodes. IEEE Trans. Biomed. Eng. 1997, 44, 931–939. [Google Scholar]
  13. McIntyre, E.J. Electrical stimulation of neural tissue to evoke behavioral responses. J. Neurosci. Methods 1996, 65, 1–17. [Google Scholar]
  14. McCreery, D.; Agnew, W.; Yuen, T.; Bullara, L. Charge density and charge per phase as cofactors in neural injury induced by electrical stimulation. IEEE Trans. Biomed. Eng. 1990, 37, 996–1001. [Google Scholar]
  15. Peters, T.; Bhavaraju, N.; Frei, M.; Osorio, I. Network system for automated seizure detection and contingent delivery of therapy. J. Clin. Neurophysiol. 2001, 18, 545–549. [Google Scholar]
  16. Kossoff, E.H.; Ritzl, E.K.; Politsky, J.M.; Murro, A.M.; Smith, J.R.; Duckrow, R.B.; Spencer, D.D.; Bergey, G.K. Effect of an external responsive neurostimulator on seizures and electrographic discharges during subdural electrode monitoring. Epilepsia 2004, 45, 1560–1567. [Google Scholar]
  17. Raghunathan, S.; Gupta, S.K.; Ward, M.P.; Worth, R.M.; Roy, K.; Irazoqui, P.P. The design and hardware implementation of a low-power real-time seizure detection algorithm. J. Neural. Eng. 2009, 6, 56005. [Google Scholar]
  18. Verma, N.; Shoeb, A.; Bohorquez, J.; Dawson, J.; Guttag, J.; Chandrakasan, A. A Micro-power EEG acquisition SoC with integrated feature extraction processor for a chronic seizure detection system. IEEE J. Solid-State Circuits 2010, 45, 804–816. [Google Scholar]
  19. Bhavaraju, N.C.; Frei, M.G.; Osorio, I. Analog Seizure Detection and Performance Evaluation. IEEE Trans. Biomed. Eng. 2006, 53, 238–245. [Google Scholar]
  20. Harrison, R.R.; Kier, R.J.; Chestek, C.A.; Gilja, V.; Nuyujikian, P.; Ryu, S.; Greger, B.; Solzbacher, F.; Shenoy, K.V. Wireless neural recording with single low-power integrated circuit. IEEE Trans. Neural. Syst. Rehabil. Eng. 2009, 17, 322–29. [Google Scholar]
  21. Kim, S.; Tathireddy, P.; Normann, R.; Solzbacher, F. Thermal impact of an active 3-d microelectrode array implanted in the brain. IEEE Trans. Neural. Syst. Rehabil. Eng. 2007, 15, 493–501. [Google Scholar]
  22. LaManna, J.C.; McCracken, K.A.; Patil, M.; Prohaska, O.J. Stimulus-activated changes in brain tissue temperature in the anesthetized rat. Metab. Brain Dis. 1989, 4, 225–237. [Google Scholar]
  23. Jochum, T.; Denison, T.; Wolf, P. Integrated circuit amplifiers for multi-electrode intracortical recording. J. Neural Eng. 2009, 6, 012001. [Google Scholar]
  24. Harrison, R.R. The design of integrated circuits to observe brain activity. Proc. IEEE 2008, 96, 1203–1216. [Google Scholar]
  25. White, A.M.; Williams, P.A.; Ferraro, D.J.; Clark, S.; Kadam, S.D.; Dudek, F.E.; Staley, K.J. Efficient unsupervised algorithms for the detection of seizures in continuous EEG recordings from rats after brain injury. J. Neurosci. Methods 2006, 152, 255–66. [Google Scholar]
  26. Greene, B.R.; Faul, S.; Marnane, W.P.; Lightbody, G.; Korotchikova, I.; Boylan, G.B. A comparison of quantitative EEG features for neonatal seizure detection. Clin. Neurophysiol. 2008, 119, 1248–1261. [Google Scholar]
  27. Harrison, R.R. A low-power integrated circuit for adaptive detection of action potentials in noisy signals. Proceedings of the 25th Annual International Conference of the IEEE Engineering in Medicine and Biology Society, Cancun, Mexico; 2003; pp. 3325–3328. [Google Scholar]
  28. Harrison, R.R.; Santhanam, G.; Shenoy, K.V. Local field potential measurement with low-power analog integrated circuit. Proceedings of the 26th Annual International Conference of the IEEE Engineering in Medicine and Biology Society, Vancouver, Canada; 2004; pp. 4067–4070. [Google Scholar]
  29. Harrison, R.R.; Kier, R.J.; Chestek, C.A.; Gilja, V.; Nuyujikian, P.; Ryu, S.; Greger, B.; Solzbacher, F.; Shenoy, K.V. Wireless neural recording with single low-powered integrated circuit. IEEE Trans. Neural. Syst. Rehabil. Eng. 2009, 17, 322–329. [Google Scholar]
  30. Aksenov, E.V.; Ljashenko, A.V.; Plotnikov, A.V.; Prilutskiy, D.A.; Selishchev, S.V.; Vetvetskiy, E.V. Biomedical data acquisition systems based on sigma-delta analogue-to-digital converters. Proceedings of the 23rd Annual International Conference of the IEEE Engineering in Medicine and Biology Society, Istanbul, Turkey; 2001; pp. 3336–3337. [Google Scholar]
  31. Yang, H.; Sarpeshkar, R. A time-based energy-efficient analog-to-digital converter. IEEE J. Solid-State Circuits 2005, 40, 1590–1601. [Google Scholar]
  32. Yang, H.; Sarpeshkar, R. A Bio-inspired ultra-energy-efficient analog-to-digital converter for biomedical applications. IEEE Trans. Circuit. Syst. 2006, 53, 2349–2356. [Google Scholar]
  33. Hyung-Il, K.; Roy, K. Ultra-Low Power DLMS Adaptive Filterfor Hearing Aid Applications. Proceedings of the International Symposium on Low Power Electronics and Design, Huntington Beach, CA, USA, 6–7 Auguest 2001; pp. 352–357.
  34. Spencer, S.S.; Williamson, P.D.; Spencer, D.D.; Mattson, R.H. Human hippocampal seizure spread studied by depth and subdural recording: The hippocampal commissure. Epilepsia 1987, 28, 479–489. [Google Scholar]
  35. Talathi, S.S.; Hwang, D.U.; Spano, M.L.; Simonotto, J.; Furman, M.D.; Myers, S.M.; Winters, J.T.; Ditto, W.L.; Carney, P.R. Non-parametric early seizure detection in an animal model of temporal lobe epilepsy. J. Neural Eng. 2008, 5, 85–98. [Google Scholar]
  36. Raghunathan, S.; Gupta, S.K.; Markandeya, H.S.; Roy, K.; Irazoqui, P.P. A hardware-algorithm co-design approach to optimize seizure detection algorithms for implantable applications. J. Neurosci. Methods 2010, 193, 106–117. [Google Scholar]
  37. Mormann, F.; Andrzejak, R.G.; Elger, C.E.; Lehnertz, K. Seizure prediction: The long and winding road. Brain 2007, 130, 314–33. [Google Scholar]
  38. Hellier, J.L.; Dudek, F.E. Chemoconvulsant model of chronic spontaneous seizures. Curr. Protoc. Neurosci. 2005, 9, 1911–1919. [Google Scholar]
  39. Hjorth, B. EEG analysis based on time domain properties. Electroencephalogr. Clin. Neurophysiol. 1970, 29, 306–310. [Google Scholar]
  40. Hjorth, B. The physical significance of time domain descriptors in EEG analysis. Electroencephalogr. Clini. Neurophysiol. 1973, 34, 321–325. [Google Scholar]
  41. Gotman, J.; Flanagan, D.; Zhang, J. Automatic seizure detection in the newborn: Methods and initial evaluation. Electroencephalogr. Clin. Neurophysiol. 1997, 103, 356–362. [Google Scholar]
  42. Hudson, R.J.; Stanski, D.R.; Saidman, L.J.; Meathe, E. A model for studying depth of anesthesia and acute tolerance to thiopental. Anesthesiology 1983, 59, 301–308. [Google Scholar]
  43. Fell, J.; Roschke, J.; Mann, K.; Schaffner, C. Discrimination of sleep stages: A comparison between spectral and nonlinear EEG measures. Electroencephalogr. Clin. Neurophysiol. 1996, 98, 401–410. [Google Scholar]
  44. He, S.; Torkelson, M. A new approach to pipeline FFT processor. Proceedings of IPPS ′96, The 10th International Parallel Processing Symposium, Honolulu, HI, USA, 15–19 April 1996; pp. 766–770.
  45. Markandeya, H.S.; Karakonstantis, G.; Raghunathan, S.; Irazoqui, P.P.; Roy, K. Low-Power DWT-Based Quasi-Averaging Algorithm and Architecture for Epileptic Seizure Detection. Proceedings of the 2010 ACM/IEEE International Symposium on Low Power Electronics and Design, Austin, TX, USA; 2010; pp. 301–306. [Google Scholar]
  46. Karakonstantis, G.; Roy, K. An Optimal Algorithm for Low Power Multiplierless FIR Filter Design using Chebychev Criterion. Proceedings of the International Conference on Acoustics, Speech and Signal Processing, Honolulu, HI, USA; 2007. [Google Scholar]
  47. Aziz, J.N.Y.; Karakiewicz, R.; Genov, R.; Bardakjian, B.L.; Derchansky, M.; Carlen, P.L. Towards Real-Time In-Implant Epileptic Seizure Prediction. Proceedings of the 28th IEEE EMBS Annual International Conference, New York, NY, USA, 30 Auguest–3 September 2006; pp. 5476–5479.
  48. Haas, S.M.; Frei, M.G.; Osorio, I. Strategies for adapting automated seizure detection algorithms. Med. Eng. Phys. 2007, 29, 895–909. [Google Scholar]
  49. Khan, Y.U.; Gotman, J. Wavelet based automatic seizure detection in intracerebral electroencephalogram. Clin. Neurophysiol. 2003, 114, 898–908. [Google Scholar]
  50. Litt, B.; D'Allesandro, M.; Esteller, R.; Echauz, J.; Vachtsevanos, G. Translating Seizure Detection, Prediction and Brain Stimulation Into Implantable Devices for Epilepsy. Proceedings of the 1st International IEEE EMBS Conference on Neural Engineering, Capri Island, Italy; 2003; pp. 485–488. [Google Scholar]
  51. Raghunathan, S.; Ward, M.P.; Roy, K.; Irazoqui, P.P. A low-power implantable event-based seizure detection algorithm. Proceeedings of the 4th International IEEE EMBS Conference on Neural Engineering, Antalya, Turkey; 2009; pp. 151–154. [Google Scholar]
  52. Drew, T. Division approximation for implantable medical devices. U.S. Patent US7526340, 28 April 2009. [Google Scholar]
  53. Kamboh, A.; Raetz, M.; Oweiss, K.; Mason, A. Area-power efficient VLSI implementation of multichannel DWT for data compression in implantable neuroprosthetics. IEEE Trans. Circuit. Syst. 2007, 1, 128–135. [Google Scholar]
  54. Raychowdhury, A.; Paul, B.C.; Bhunia, S.; Roy, K. Computing with subthreshold leakage: Device/circuit/architecture co-design for ultralow-power subthreshold operation. IEEE Trans. Very Large S. I. Syst. 2005, 13, 1213–1224. [Google Scholar]
  55. Calhoun, B.H.; Chandrakasan, A. Characterizing and Modeling Minimum Energy Operation for Subthreshold Circuits. Proceedings of the 2004 International Symposium on Low Power Electronics and Design, Newport Beach, CA, USA; 2004; pp. 90–95. [Google Scholar]
  56. Gupta, S.K.; Raychowdhury, A.; Roy, K. Digital computation in subthreshold region for ultralow-power operation: A device–circuit–architecture codesign perspective. Proc. IEEE 2010, 98, 160–190. [Google Scholar]
  57. Tschanz, J.; Narendra, S.; Ye, Y.; Bloechel, B.; Borkar, S.; De, V. Dynamic sleep transistor and body bias for active leakage power control of microprocessors. IEEE J. Solid-State Circuits 2003, 38, 1838–1845. [Google Scholar]
  58. Roy, K.; Kulkarni, J.P.; Hwang, M.E. Process Tolerant Ultralow Voltage Digital Sub-threshold Design. Proceedings of the IEEE Topical Meeting Silicon Monolithic Integrated Circuits in RF Systems, Orlando, FL, USA; 2008; pp. 2574–2577. [Google Scholar]
  59. Johnson, M.C.; Somasekhar, D.; Chiou, L.y.; Roy, K. Leakage Control With Efficient Use of Transistor Stacks in Single Threshold CMOS. IEEE Trans. Very Large Syst. Intergr. Syst. 2002, 10, 1–5. [Google Scholar]
  60. Rabaey, J. Digital Integrated Circuits: A Design Perspective; Prentice Hall: Duluth, GA, USA, 1996. [Google Scholar]
  61. Johnson, M.C.; Somasekhar, D.; Roy, K. Models and Algorithms for Bounds on Leakage in CMOS Circuits. IEEE Trans. Comput.-Aid. Des. Integr. Circuits Syst. 1999, 18, 714–725. [Google Scholar]
  62. Li, H.; Bhunia, S.; Chen, Y.; Vijaykumar, T.N.; Roy, K. Deterministic clock gating for microprocessor power reduction. Proceedings of The Ninth International Symposium on High-Performance Computer Architecture, Washington, DC, USA; 2003; pp. 113–122. [Google Scholar]
  63. Jiang, H.; Marek-Sadowska, M.; Nassif, S.R. Benefits and costs of power-gating technique. Proceedings of The IEEE International Conference on Computer Design: VLSI in Computers and Processors, Washington, DC, USA; 2005; pp. 559–566. [Google Scholar]
  64. Seok, M.; Hanson, S.; Lin, Y.S.; Foo, Z.; Kim, D.; Lee, Y.; Liu, N.; D, S.; Blaauw, D. Phoenix: An Ultra-low Power Processor for Cubic Millimeter Sensor Systems. Proceedings of the 46th Design Automation Conference, DAC 2009, San Francisco, CA, USA, 26–31 July 2009.

