Performance and Power Analysis of HPC Workloads on Heterogeneous Multi-Node Clusters †


1
Barcelona Supercomputing Center, Barcelona 08034, Spain
2
Department of Physics and Earth Sciences, University of Ferrara and INFN, Ferrara 44122, Italy
*
Author to whom correspondence should be addressed.
†
This paper is an extended version of our paper published in the Proceedings of the ParCo 2017: Mini-symposium on Energy Aware Scientific Computing on Low Power and Heterogeneous Architectures, Bologna, Italy, 12–15 September 2017.
J. Low Power Electron. Appl. 2018, 8(2), 13; https://doi.org/10.3390/jlpea8020013
Submission received: 31 March 2018
/
Revised: 29 April 2018
/
Accepted: 3 May 2018
/
Published: 4 May 2018
(This article belongs to the Special Issue Energy Aware Scientific Computing on Low Power and Heterogeneous Architectures)
Abstract
:Performance analysis tools allow application developers to identify and characterize the inefficiencies that cause performance degradation in their codes, allowing for application optimizations. Due to the increasing interest in the High Performance Computing (HPC) community towards energy-efficiency issues, it is of paramount importance to be able to correlate performance and power figures within the same profiling and analysis tools. For this reason, we present a performance and energy-efficiency study aimed at demonstrating how a single tool can be used to collect most of the relevant metrics. In particular, we show how the same analysis techniques can be applicable on different architectures, analyzing the same HPC application on a high-end and a low-power cluster. The former cluster embeds Intel Haswell CPUs and NVIDIA K80 GPUs, while the latter is made up of NVIDIA Jetson TX1 boards, each hosting an Arm Cortex-A57 CPU and an NVIDIA Tegra X1 Maxwell GPU.
1. Introduction and Related Works
Performance analysis tools allow application developers to identify and characterize the inefficiencies that cause performance degradation in their codes. Profiling and analysis is often the first step towards the optimization of an application. In addition, being able to observe and measure the behavior of parallel applications at scale, or at least in a multi-node context, can show unexpected pitfalls and insightful information about performance bottlenecks and/or opportunities for performance and energy-efficiency improvements.
The problem of improving energy efficiency of HPC technology has become increasingly relevant in recent years [1] and it is now listed as one of the hardest challenges for exa-scale systems, e.g., in the report about the top 10 systems by the US–DoE [2]. The HPC community has therefore developed a strong interest towards integrating power and energy aspects into application analysis, allowing developers to not only optimize their codes for performance, but also to investigate their energy-efficiency.
Several tools were developed to target this need. Survey studies like the one by S. Benedict [3] already provides an overview of the tools available on the market, but we want to complement it with the flexible and visual approach allowed by the Barcelona Supercomputing Center (BSC) performance analysis tools (https://tools.bsc.es). The Extrae instrumentation library collects performance traces of parallel applications with minimal overhead, while Paraver [4], a postmortem advanced trace visualizer, allows for the inspection of Extrae traces, enabling several kinds of advanced visual and numerical analysis on the collected metrics. The use of Extrae and Paraver to acquire and visualize power related information in the context of a parallel scientific application profiling, has been introduced in [5], but at the time external power meters were needed and a specific library had to be used. Moreover, instrumentation of the application code was required. In our work we aim to show how Extrae and Paraver can nowadays be used to perform performance and power/energy analysis on generic applications, both on architectures where hardware counters are available [6] and integrated in the PAPI library [7], but also where external sensors and power meters have to be used, without the need for manually instrumenting the application.
Schöne et al. in [8] recently introduced the possibility of extending ScoreP with plugins, an instrumentation library similar to Extrae. According to Figure 10 of [8], those extensions of ScoreP make possible analyses similar to the ones introduced in this work, however it is not clear if this approach has been tested on Arm architectures with custom power monitoring infrastructures like the one we present here in one of the clusters we analyze. TU Dresden in collaboration with ATOS/Bull are introducing the High Definition Energy Efficiency Monitoring (HDEEM) infrastructure in order to be able to monitor large HPC facilities [9,10]. This approach is complementary to the one we introduce in this paper, as it requires extra special purpose hardware for collecting HDEEM data. It is important to note that we are working together with ATOS/Bull within the Mont-Blanc 3 project in order to support HDEEM measurements in our infrastructure.
The European project READEX, also leveraging Mont-Blanc platforms, is collecting HDEEM and RAPL data that are then elaborated by the MERIC tool for tuning the most efficient configuration per application bases [11]. Our work focuses on the possibility of visualizing and correlating multi-node performance and power information, instead of single-node optimization of specific variables as proposed by READEX.
In agreement with the ideas proposed by C. Bekas et al. [12] we present in our work how to easily access metrics such FLOPS/Watt, but also how to derive metrics such as energy to solution and energy delay product from an application trace. Another promising approach towards energy-efficiency in HPC is the one of the EEHPCWG of N. Bates [13], trying to push an awareness action at the data center level. Part of this effort is the approach of optimizing the job scheduling using different power-aware policies presented by D. Tafani et al. [14] or adding hardware/software extensions for improving energy awareness as presented by W. A. Ahmad et al. [15]. Various attempts to take advantage of mobile technology for increasing energy efficiency of HPC systems have also been taken in the recent past. The closest to our work are the EU Mont-Blanc project [16,17] and the COSA project [18,19], but several other examples can be found in the literature [20,21,22,23].
Our work is complementary to all these efforts, as we aim to have an ecosystem of tools, allowing the analysis of performance and power/energy related metrics of large scale applications while running on both, classical high-end HPC clusters, as well as innovative and experimental setups. Such tools target the HPC application developers more than the data-center engineers, raising an “energy awareness” in application experts, and making it easier to compare different implementations and architectures.
As a representative of high-end clusters we adopted a GPU dense cluster hosted at the University of Ferrara & INFN (Italy) named COKA, embedding Intel Haswell CPUs and discrete NVIDIA K80 GPUs, while, as a representative of innovative and experimental low-power setups, we adopted a Jetson TX1 based cluster hosted at the Barcelona Supercomputing Center (Spain), featuring Arm-based SoCs with an integrated CUDA-capable GPU.
This paper is an extended version of [24], a proceedings paper presented at the Mini-symposium on energy aware scientific computing on low power and heterogeneous architectures, hold at the ParCo 2017 conference, by the same authors, in which early performance and power analysis on the same application were presented running exclusively on Intel and Arm CPUs. In the current paper we extend our methodology and performance tools in order to include the possibility of studying performance and power figures of parallel HPC applications running also on high-end and low power NVIDIA GPUs hosted in both clusters under consideration.
This document is organized as follows: in Section 2 we introduce the problem we want to tackle; in Section 3 we describe the hardware and software configuration in which we have performed our experiments, highlighting the details of the benchmarking application; and then in Section 4 we give examples of actual metrics which can be acquired, showing possible performance and power analysis exploiting them. Section 5 collects our final comments and future research steps.
2. Problem Analysis
The sensitivity of High-Performance Computing (HPC) towards energy efficiency has continued to grow in the scientific community in recent years. The number of Google Scholar hits for the key words “HPC energy efficiency” in 2016 is roughly the same as for the whole triennium 2013–2015. This is just a coarse metric that confirms the urgency of making HPC systems more energy efficient. As we believe that part of this efficiency can be obtained by fine tuning codes and system configurations, we focus in this work on addressing the question: How can we make parallel application developers and scientists embrace concepts like compute efficiency and energy consumption?
As the first corollary of this broad question, we address in this work the problem of studying in a graphical manner both performance and power figures of an application taken as representative of HPC workload. We selected as testbeds two different cluster configurations, based on relevant modern architectures: Intel and Arm CPUs and NVIDIA GPUs, used as accelerators.
As a second corollary of the general question, while it is relatively easy to have overall figures of performance and power (e.g., total number of floating point operation executed, total execution time, average power consumption, etc.), being able to analyze portions of the execution on multi-node cluster is not trivial. We believe that this last approach is relevant, since knowing and overcoming performance inefficiency at the microscopic level can lead to performance improvements and/or power optimizations. As an example, the identification of memory-bound phases, or in general, phases in which not all of the computational resources are exploited, would allow the application and assessment techniques such as Dynamic Voltage and Frequency Scaling (DVFS) to lower the processor frequency to save energy [25].
3. Proposed Methodology
To address the first corollary presented in Section 2, we consider in this work two HPC clusters based on different architectures. A high-end HPC cluster based on Intel CPUs and NVIDIA GPUs and a low-power cluster, made of NVIDIA Jetson TX1 boards:
- The High-end HPC cluster comprises 5 computing nodes, where every node embeds Intel Xeon E5-2630v3 CPUs and NVIDIA K80 dual-GPU boards, thus accounting for 16 CUDA devices per node. Each CUDA device is a GK210 GPUs (Kepler architecture), with 2496 cores. The nodes are interconnected with 56Gb/s FDR InfiniBand links and each node hosts Mellanox MT27500 Family [ConnectX-3] HCA. This cluster is named Computing On Kepler Architecture (COKA) and it is managed by INFN & University of Ferrara (Italy), providing a peak performance of ∼100 TFLOPs.
- The Embedded cluster comprises 15 nodes, each of them housing a NVIDIA Tegra X1 (http://www.nvidia.com/object/embedded-systems-dev-kits-modules.html) SoC, embedding a Quad Arm Cortex-A57, with 2 MB of L2 cache and 4 GB LPDDR4 (with a peak bandwidth of 25.6 GB/s). supported by a 16 GB eMMC storage device and accelerated with an embedded NVIDIA GPU (Maxwell architecture), with 256 CUDA cores. Node interconnection is performed using a single Gigabit Ethernet link per node. The cluster is installed at the Barcelona Supercomputing Center (Spain) and we refer to it as Jetson cluster in the rest of the text.
In this work we analyze the same application running on the CPUs and GPUs of these systems, adopting different implementations, targeting different architectures, but computing the same algorithm. Both clusters are handled using standard HPC/data-center software stack: the software configurations can be found respectively on the Mont-Blanc mini-cluster wiki (https://wiki.hca.bsc.es/dokuwiki/wiki:prototype) and on the COKA wiki (http://coka.unife.it). Both clusters use SLURM as job scheduler. For power measurements on the COKA cluster we rely on RAPL energy counters and NVML power counters, respectively, for the Intel CPUs and NVIDIA GPUs, both accessed via the PAPI library [26]. On the other side, for the nodes of the Jetson Cluster, we use an on-board embedded power meter, allowing the measurement of the whole Jetson TX1 module power drain, its CPU and its GPU power drain.
To address the second corollary of our problem, we selected the performance instrumentation tool, Extrae, and the visual performance analyzer, Paraver [4]. Extrae is a tool which uses different interposition mechanisms to inject probes into a generic target application in order to collect performance metrics. This tool makes extensive use of the PAPI interface to collect information regarding the microprocessor performance, allowing for the capture of such information when parallel programming calls happen, but also at the entry and exit points of instrumented user routines. In this work we leverage only automatic instrumentation of the binary without changing the source code of the application, highlighting the flexibility of the approach also in cases where recompilation is not possible (e.g., closed source applications, proprietary libraries, etc.). Manual instrumentation is possible anyway, including the extrae_user_events.h file during the application compilation, provided as part of the Extrae package, and marking code regions of interests with function calls to the Extrae API (see for example calls to Extrae_user_function(), and Extrae_event() in https://github.com/bsc-performance-tools/extrae/blob/master/example/LINUX/SEQ/pi_instrumented.c).
Extrae is the package devoted to generating Paraver trace-files. Paraver, on the other hand, is a visualization tool that obtains qualitative global perception of the behavior of an application previously run acquiring Extrae traces and to performs advanced quantitative studies, leveraging events, states and counters gathered by Extrae.
3.1. Lattice Boltzmann
As a benchmarking application, representative of a wider class of lattice based HPC applications, we adopt a Lattice Boltzmann simulation which has been highly optimized for several architectures.
Lattice Boltzmann methods (LB) are widely used in computational fluid dynamics, to describe flows in two and three dimensions. LB methods [27]—discrete in position and momentum spaces—are based on the synthetic dynamics of populations sitting at the sites of a discrete lattice. At each time step, populations propagate from lattice-site to lattice-site and then incoming populations collide among one another, that is, they mix and their values change accordingly. LB models in n dimensions with p populations are labeled as and in this work we consider a state-of-the-art model that correctly reproduces the thermo-hydrodynamical evolution of a fluid in two dimensions, and enforces the equation of state of a perfect gas () [28,29]; this model has been extensively used for large scale simulations of convective turbulence (e.g., [30,31]).
A Lattice Boltzmann simulation starts with an initial assignment of the populations and then iterates for each point in the domain, and for as many time-steps as needed, two critical kernel functions. The first kernel, called propagate, moves populations across lattice sites according to an appropriate stencil depending on the LB model used. It performs only a large number of sparse memory accesses, and for this reason is strongly memory-bound. The latter, called collide, uses as input the populations gathered by the propagate kernel, and performs all the mathematical steps associated to the computation of the new population values. This function is strongly compute-bound making heavy use of the floating-point units of the processor. These two kernels take most of the execution time of any LB simulation.
In the last years several implementations of this model were developed, which were used both for convective turbulence studies [30,31], as well as for a benchmarking application for programming models and HPC hardware architectures [32,33,34,35]. In this work we utilize three different implementations of the same model. Two of them target the two different CPU architectures, embedded respectively in the COKA and the Jetson clusters, while the third implementation targets the GPUs of both of the clusters, which have the same major architecture. Specifically: a first implementation has been developed for Intel CPUs [36]; a second one, derived from the former, has been ported to Armv7 architecture [37] and recently also to Armv8; while a third one has been developed for NVIDIA GPUs [38].
To fully exploit the high level of parallelism made available by the LB model, both of the implementations targeting the CPU architectures exploits Message Passing Interface (MPI) to divide computations across several processes and OpenMP to further divide them across threads. Furthermore, to exploit CPU vector units, they both use, respectively, AVX2 and NEON intrinsics. On the other hand, the third implementation, targeting NVIDIA GPUs, exploits MPI to divide computations across several processes and then each process manages one GPU device launching CUDA kernels [35] in it.
In particular, we simulate a 2-dimensional fluid described by a lattice of sites, where and when running on CPUs, while when running on GPUs we use half of the lattice sites due to memory limitations. When running on GPUs, in fact, the data domain initialized on the host memory gets duplicated in the accelerator memory and eventually is copied back at the end of the simulation. Each of the MPI processes handle a partition of the lattice of size and further divides it across CUDA threads (for the GPU implementation) or OpenMP threads (for the CPU implementations), which therefore on their turn will handle a sub-lattice of size . From the physical simulation point of view, MPI processes are logically arranged in a ring, thus simulating a 2-dimensional fluid shaped as the surface of a cylinder. Consequently, data exchange happens only between neighboring processes.
As already mentioned, for the CPU implementations, the sub-lattice handled by each process is further divided along the x-dimension across the spawned OpenMP threads. The two threads taking care of the leftmost and rightmost part of the sub-lattice (i.e., the first and the last) for each process, initiate the MPI communications with the left and right neighbors. Moreover, relieving these two threads from part of the propagate duties, while performing MPI transfers, allows to overlap MPI communications with computations. Concerning the GPU implementation, communications are handled by MPI processes, exploiting CUDA aware MPI capabilities [35] allowing us to fully overlap the communications with GPU computations [39].
4. Application Analysis with Extrae and Paraver
On the high-end HPC cluster, COKA, the use of SLURM Energy Accounting Plugin (https://slurm.schedmd.com/acct_gather_energy_plugins.html) already allowed the gathering of overall energy figures for the jobs scheduled on the cluster and custom tools were already developed to instrument generic codes on this system [40]. Despite this, these tools do not allow the easy correlation of these figures with other performance metrics and/or they require the manual instrumentation of applications. Then, we installed the Extrae instrumentation tool and recompiled it with support for OpenMPI and CUDA in order to allow Extrae, for a generic application, to add its probes whenever an MPI call is invoked, an OpenMP region is encountered, or a CUDA call is performed. Both Extrae and the SLURM Energy Accounting Plugin rely on the PAPI library for accessing the RAPL counters storing the energy measurements in the Intel CPUs or NVML power reading for NVIDIA GPUs.
On the Jetson cluster, we developed a set of SLURM prolog and epilog scripts that start/stop a power monitor daemon running with minimum overhead (measured below 2%), whenever a job is scheduled on the cluster. The daemon simply configures, reads and writes registers via I2C protocol into the Texas Instruments INA3221 device (http://www.ti.com/product/INA3221) embedded in the Jetson boards. The device is configured for monitoring three channels: (i) the power drain of the Arm CPU cores, (ii) the power drain of the embedded NVIDIA GPU, and (iii) the overall power drain of the Jetson compute module, including memories, but excluding the I/O devices on the carrier board of the development kit. It is important to note that the final result of this configuration mimics the behavior of the SLURM Energy Accounting plugin, but also generates an Extrae trace with the power data gathered while the job was running. In addition, with the due changes in the back end handling the power measurements, the same SLURM infrastructure has been extended in order to support other Arm based mini-clusters (https://wiki.hca.bsc.es/dokuwiki/wiki:prototype:power_monitor) installed at BSC.
An important issue in out-of-band measurements, such as for the Jetson cluster case, is of course the synchronization of collected data. In this setup we have in fact two independent agents, Extrae and the power monitor, gathering two traces that need to be synchronized in order to be properly accessed with Paraver. Events collected by both agents are timestamped using the same clock source as they both run on the same OS instance being monitored, however, Extrae uses an incremental timestamped system always starting from time zero. For this reason, we used two special Extrae events, recording absolute execution start and end time, in the power trace, allowing for synchronization with the Extrae one. This method allows us to have a relative deskew between traces always smaller than sampling intervals of the power trace. The sampling interval is configurable and we set it to 0.2 s (i.e., 5 measurements per second) in the measurement campaign for this work.
4.1. Metrics Visualization and Analysis with Paraver
After gathering performance and power traces on both clusters, using Extrae, we have been able to plot them and navigate them in the Paraver visualizer.
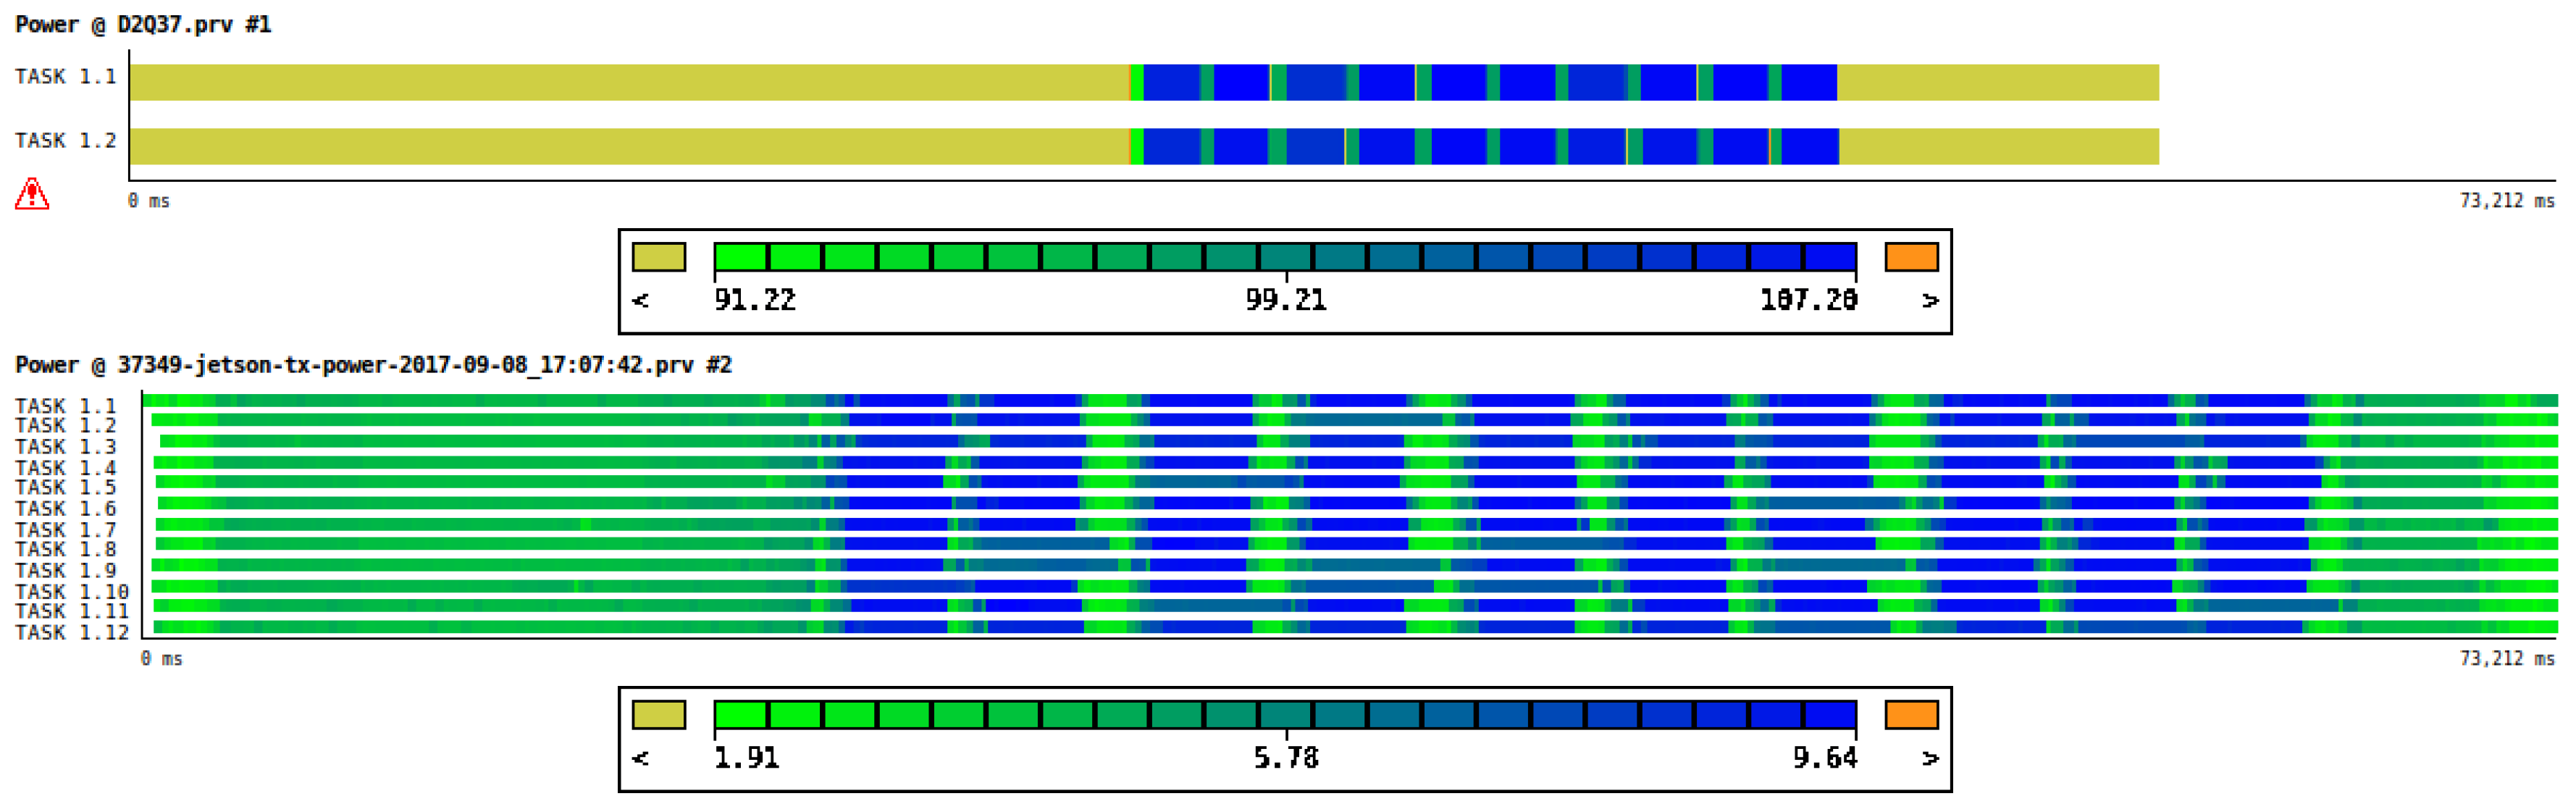
Figure 1 shows the instantaneous power consumption of one execution of 10 iterations of the LB application introduced in Section 3.1 running exclusively on the CPUs: on the top the power drain derived from the RAPL energy counters on COKA, while on the bottom the power drain as measured by the INA3221 device on Jetson. As on the COKA cluster, we run on a single dual socket node, and we see a timeline with two color-coded measurements: one for socket 0 and the other for socket 1. We see values exceeding the 85W TDP of these CPUs since we are summing CPU and DRAM power drains. On the Jetson cluster we run on 12 nodes, so we can see 12 color-coded lines, encoding the power consumption of each of the nodes, including the whole compute module power drain.
For both architectures we clearly see an initial phase of initialization on the left, the 10 iterations with visible different power drains for the alternating propagate and collide functions, and eventually on the right the final results check phase.
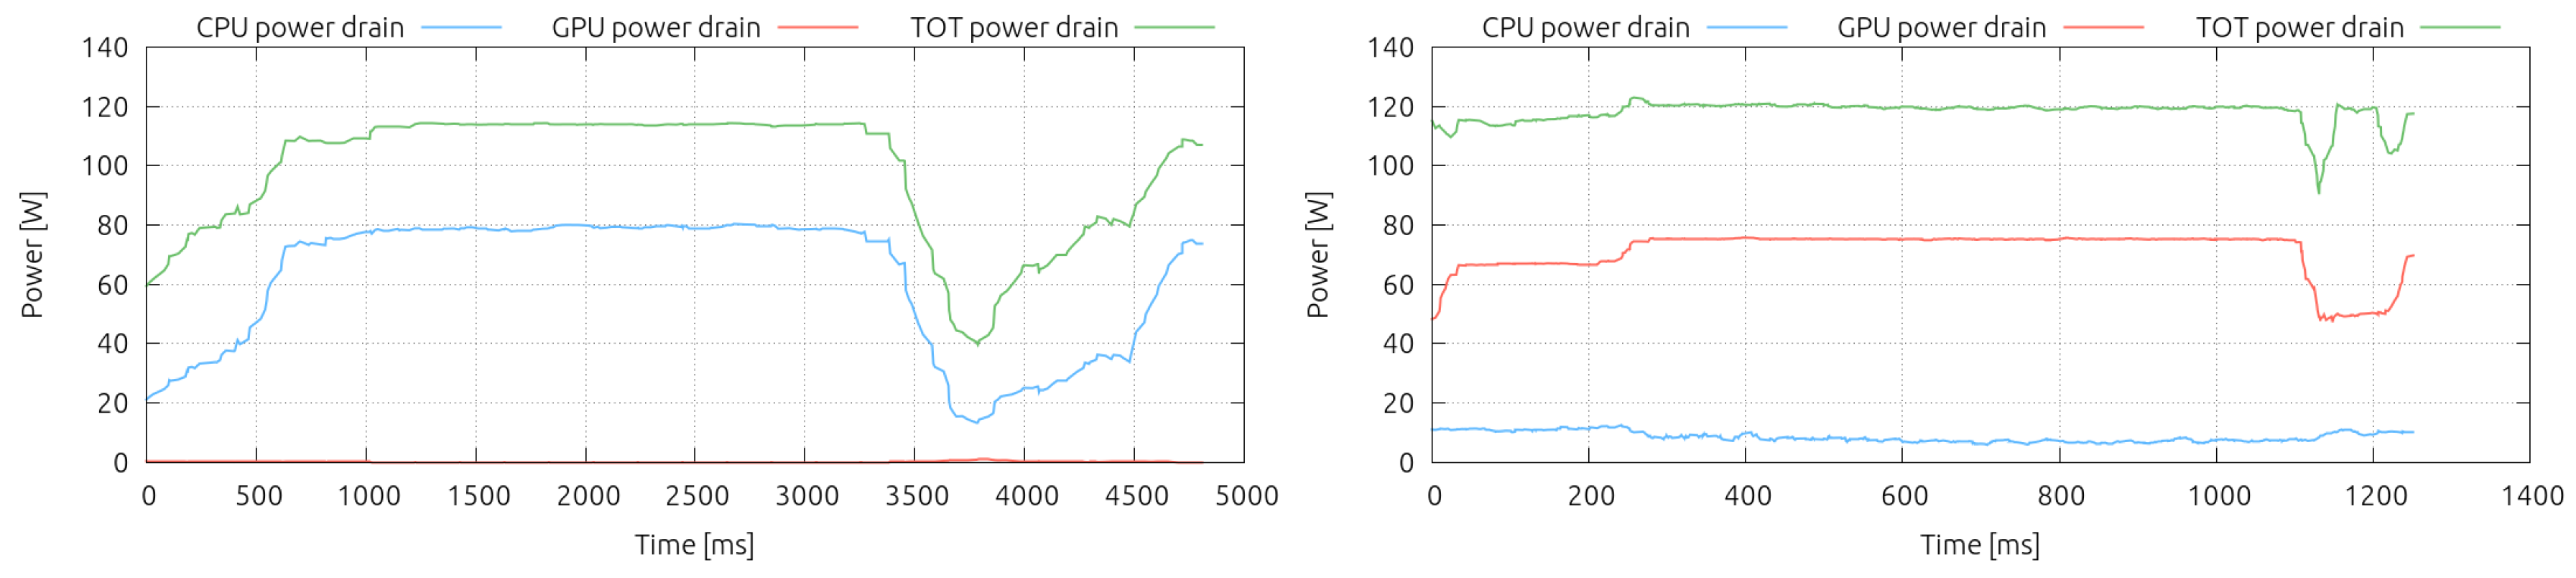
In Figure 2 we compare side by side the aggregate power drain of 12 Jetson nodes during the execution of one iteration of the CPU-only LB code (left) and the GPU-version of it (right). As already mentioned in Section 3.1, for the code running on the GPU we had to shrink the lattice size by a factor of two, due to the limited memory capacity of the GPUs, therefore the execution time on the x-axis needs to be scaled accordingly before to be compared. We can clearly detect the power drain close to zero of the GPU, when we run only in the CPU (red line, left). In addition, whenever we take advantage of the embedded GPU, we see the power drain of the GPU rising up to ∼6 W per compute node (red line, right), while the CPU power drain lowers (blue right), but never reaches zero, since it has to handle memory transactions to/from the GPU, due to communications, and all the OS duties.
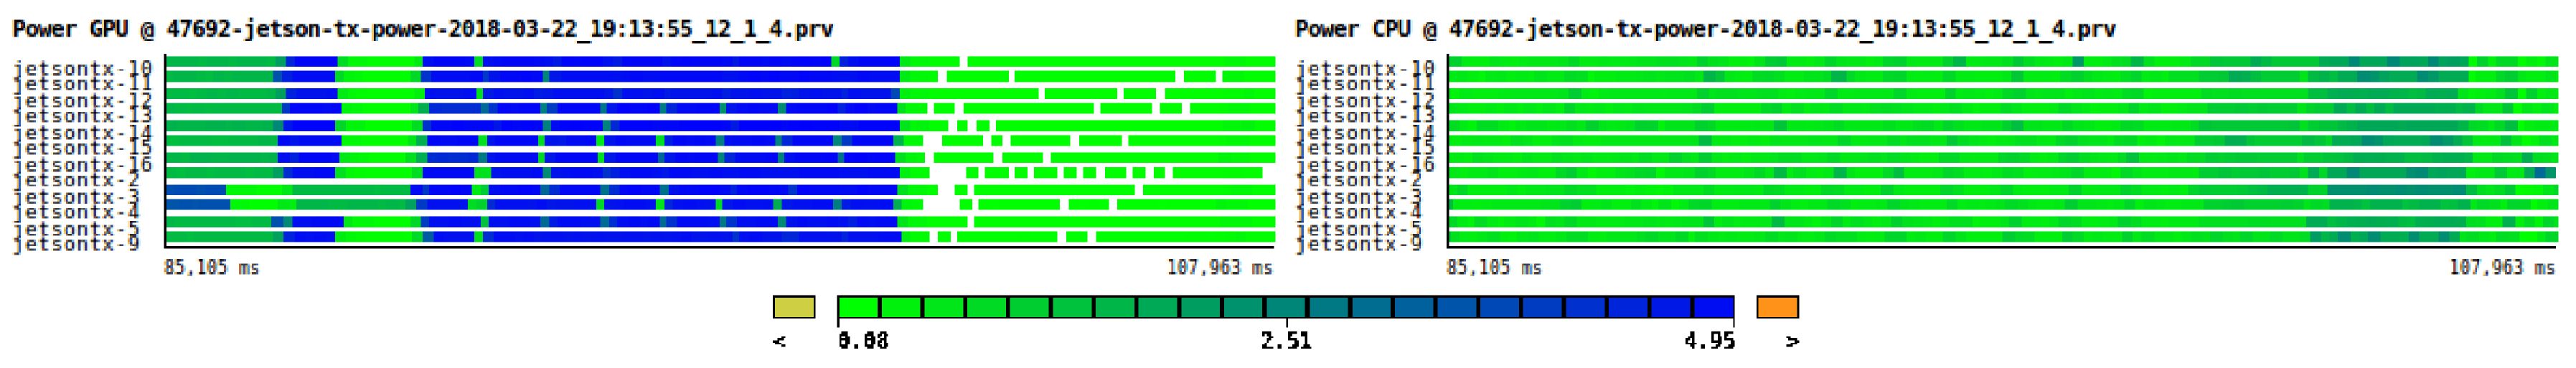
In Figure 3 we show a timeline similar to the one presented in Figure 1, but relative to a run performed using the GPUs on the Jetson cluster. It is clearly visible that whenever the GPUs are running (light blue on the left) the power drain of the CPU is lower (light green on the right) on all the compute nodes.
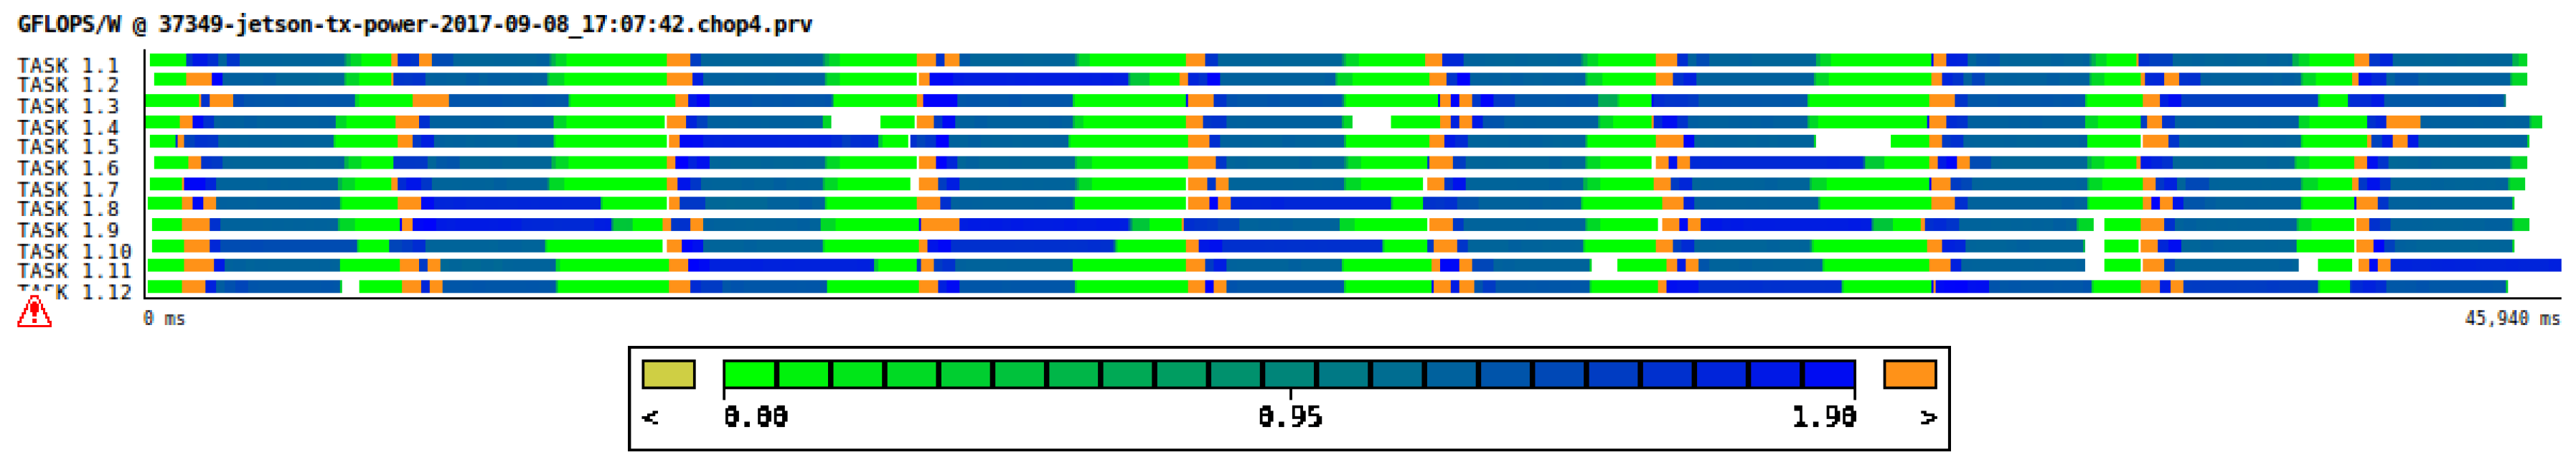
The flexibility of the Paraver analyzer allows us to combine performance and power figures. As an example of this, we show in Figure 4 the timeline of power efficiency, i.e., GFLOPS/W, for the Jetson cluster while executing the CPU-only version of the LB application. This figure has been obtained by simply plotting the timeline of the PAPI event accounting for vectorized instructions and dividing it by the power timeline of Figure 1.
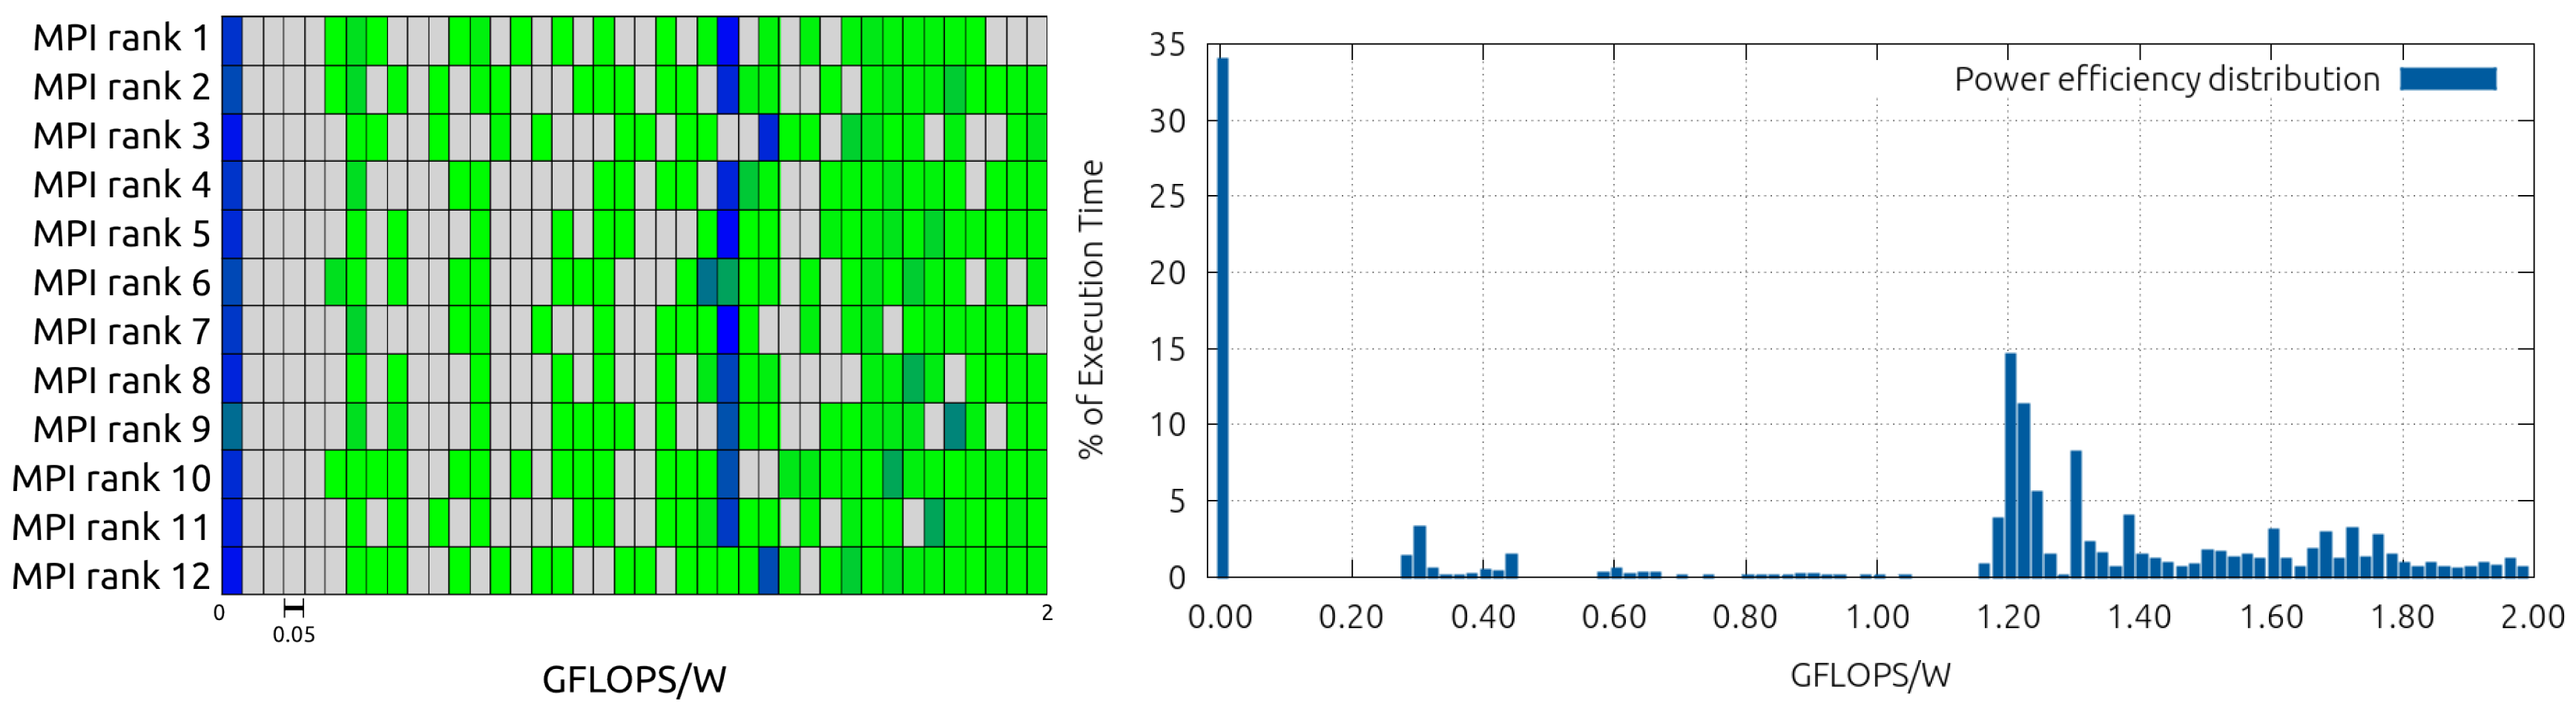
Another feature of the Paraver tool is the possibility of generating histograms for easily inspecting distribution of variables over time. In Table 1 we can see the histogram data of the power efficiency: in each column we have a bin of power efficiencies (in GFLOPS/W), while in each row we show each of the 12 processes, one for each node involved in the computation.
As the inspection of numerical data like the ones presented in Table 1 is not intuitive, Paraver allows the user both to color code the data of the histogram, as depicted in Figure 5 (left), and to export them, in order to plot aggregate figures like the average power efficiency, shown in Figure 5 (right). Analysing Figure 5 (right), we can clearly see two tendencies: the first one around 0 GFLOPS/W, corresponding to the propagate phase of the code (which is a memory-bound phase), plus communications/synchronization phases; and then a second tendency around GFLOPS/W, corresponding to the collide. As a comparison, on the COKA cluster the collide reaches ∼1.1 GFLOP/W when executing on CPUs, deriving the power drain from RAPL energy measurements.
Apart from visualizing and analyzing instantaneous and global metrics, Paraver could also be used to visually correlate changes in power related metrics and the different application phases.
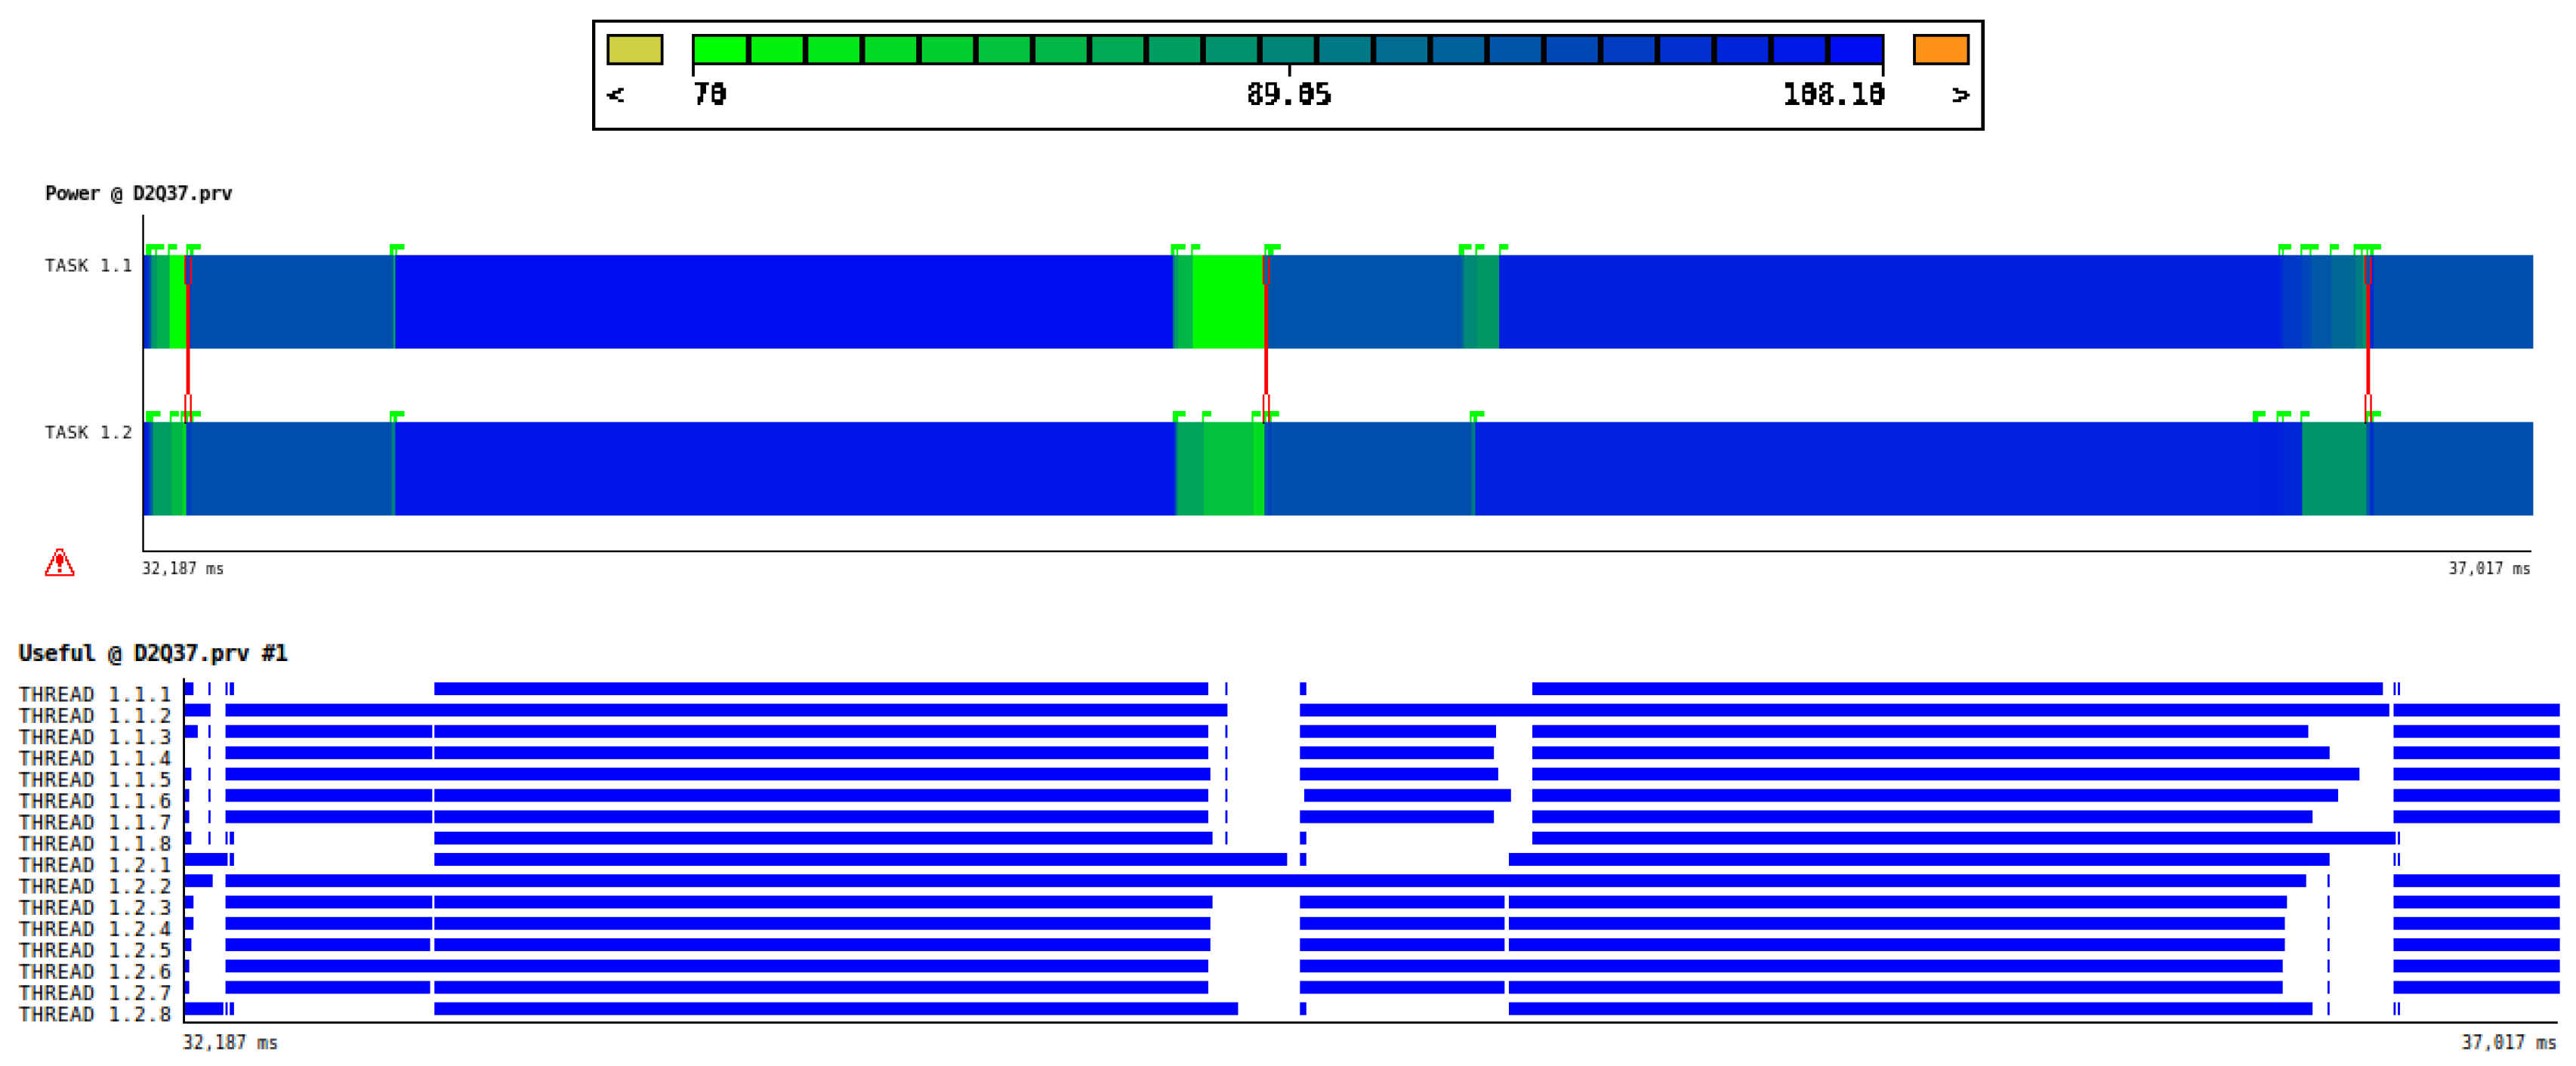
As an example, in Figure 6 we show just two iterations of the LB simulation, where we plot the power drain of the two CPUs plus DRAMs contribution (using a color-code spanning between 70 and 110 Watt), on top of a view of the 16 OpenMP threads executing. This view gives a good perception of where the major computational phases are, and their balance across cores. Looking at the bottom plot, we can spot a non negligible amount of time (white parts) of about 150 ms, where most of the threads are waiting (for synchronizations or communications). Interestingly, in correlation with these phases, we can see in the upper plot a lower power drain (green areas correspond to ∼70 Watt). We can also appreciate the fact that during the propagate phase the average power drain is ∼97 Watt, while during collide is ∼107 Watt.
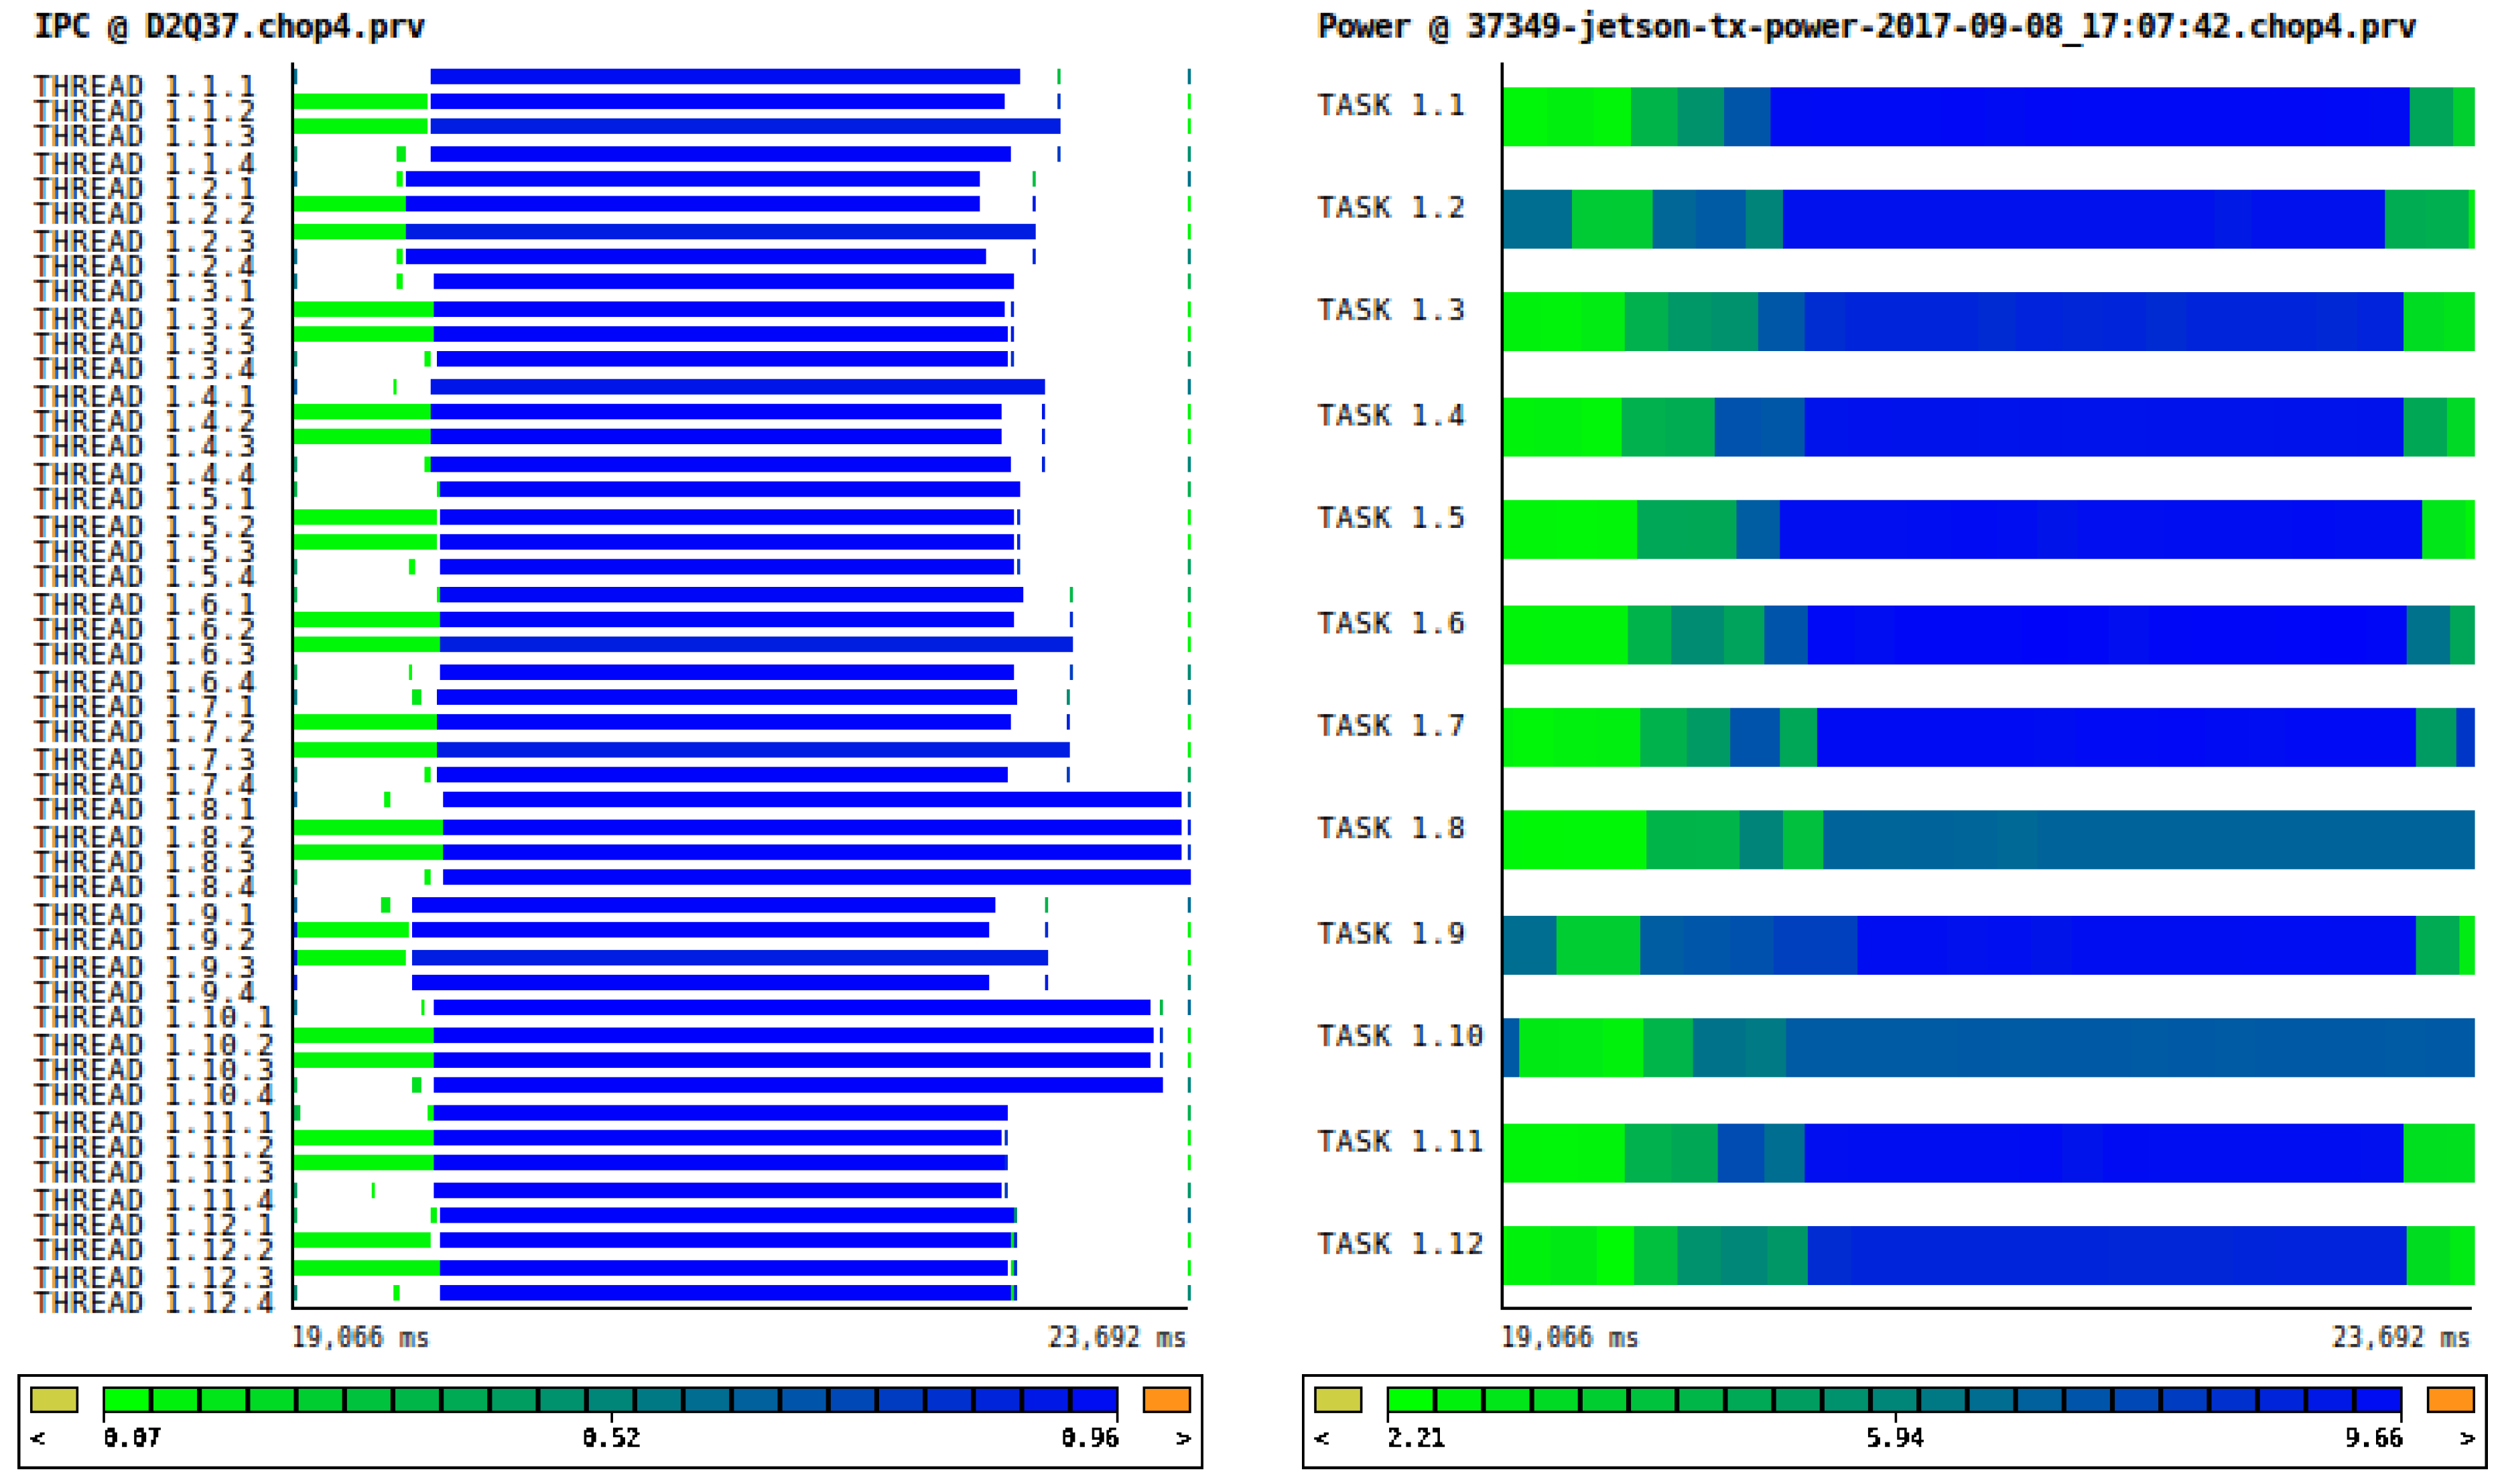
In Figure 7 we show a similar case, but in the Jetson cluster: on the left we can see the Instruction Per Clock cycle, IPC, of one iteration and on the right the corresponding power drain.
For both cases, we want to highlight here that an easy visual inspection can highlight the portion of the code where optimizations could be applied. All these are useful hints, not only for possible performance optimizations, but also from the energy-efficiency point of view. In [34] we show in fact that a careful selection of the CPU frequency can reduce the overall energy consumption of the same code by ∼10% on the CPUs of the COKA cluster.
4.2. Performance and Power Comparisons
As mentioned by Curioni et al. in [12], metrics like GFLOPS/W, even if relevant for worldwide ranking like Green500, are not sufficient indicators of global efficiency of a complex HPC application running on a large HPC cluster. For this reason we show in Table 2 that the energy to solution and energy delay product can also be easily computed taking advantage of the Paraver analyzer, highlighting the interesting possibility of comparing different implementations, running on different architectures.
As a first result concerning our application, we can appreciate from Table 2:
- the MPI+OpenMP+Intrinsics implementation for CPUs—12 Jetson nodes are equivalent to one COKA node from the Energy to solution point of view, although the former are less power hungry, while the latter is faster. This highlights the fact that a trade-off could be found between “low-powerness” and performance, without impacting the overall energy to be spent, selecting one architecture or the other.
- the MPI+CUDA implementation on GPUs—one NVIDA K80 board of the COKA cluster is faster than the 12 GPUs of the Jetson cluster, but also more power hungry. Furthermore, concerning the energy-efficiency, in order to reach the same result, the Jetson cluster uses more energy than a single K80 board of the COKA cluster. This difference can be justified by the architecture of the GPU housed in the Jetson SoC. Even if it is similar to the K80 (Kepler), the Maxwell architecture favors single and half precision floating point performance, delivering less performance in the presence of double precision workload, as for the case of our LB application [41]. Moreover, using 12 hundreds-of-cores GPUs, instead of a single K80 board (hosting 2 thousands-of-cores GPUs), requires more and slower communications, which, although overlapped with computations, represents an overhead.
4.3. Limitations
We know the presented methodology still has some limitations, in particular, we cannot be sure about the fact of whether power metrics derived by RAPL counters on Intel CPUs and NVML counters on GPUs can be directly compared with the ones acquired on Jetson boards. Several third party studies [7,42,43] investigated the reliability of the available counters, also with external meters, but little information is available on their comparability.
Moreover, NVML power counters, used for the high-end K80 GPUs, present a very coarse granularity, allowing a sampling in the order of 10Hz [40]. This allowed us to use them to obtain the average power drain reported in Table 2, but is not enough to distinguish the different code phases and correlate them with other performance counters.
Another limitation is given by the fact that power figures presented in this work only take into account CPUs, GPUs and memories, so they do not include the power drain due to network, storage and other passive/active components in the clusters, nor the cooling. To fairly compare the energy consumption of one COKA node with 12 Jetson nodes, as shown in Table 2, we should take into account that in order for the 12 Jetson nodes to share a workload, they would also need a network, which would consume an amount of energy which could be in the order of of the total. Furthermore, this latter limitation could be solved monitoring by also monitoring the wall socket power drain with supplementary external meters, or through motherboard embedded meters where available. Fortunately, hardware manufacturers and integrators are already moving along this direction [15], and also at the data center level; in the near future, a high amount of power related metrics should be made available to HPC users [44], also allowing for better support to the kind of application profiling we presented in this work.
In summary, Table 2 should be interpreted in view of these caveats and used as an example of the prospective use of the presented profiling and analysis tools and not as an actual hardware benchmark.
5. Conclusions and Future Work
In this paper we have shown how performance and energy/power related metrics could be extracted and correlated from very different hardware architectures, exploiting freely available software tools. We have used an actual HPC application running on CPUs and GPU accelerators of very different clusters, demonstrating the possibility of studying complex applications in actual HPC environments.
Considering the ubiquitous presence of hardware counters and sensors able to monitor performance, power and other environment parameters in modern computational elements, we see our contribution helping in the first exploratory step for graphical and quantitative analysis. With our work we show good support for a wide range of devices, both from HPC and embedded market, for Intel, Arm and NVIDIA architectures. In addition, an added value of our contribution lies in the possibility of fine grained study of performance and power figures at scale, on different compute nodes of a cluster.
As further applications of this methodology, we envision the use of Paraver to spot code regions where computing resources are underutilized in order to apply energy-efficiency optimizations such us Dynamic Voltage and Frequency Scaling (DVFS). Knowing the time overhead for a CPU frequency change with DVFS, we can consider isolating the cases where lowering the frequency can result in an overall benefit for the energy to solution without impacting the time to solution. Moreover, for applications that do not present distinct memory- and compute-bound phases, we could attempt to create these regions with compiler techniques, such as the one introduced in [45], where a technique is described at the compiler level aiming at improving performance and power efficiency increasing the reordering window of memory accesses. Combining this technique with our approach may allow for the easy creation of wider memory-bound regions to later be profiled and analyzed with the tools presented in this work; energy-efficiency optimizations can eventually be applied.
Author Contributions
F.M. and E.C. designed and performed the experiments; and they both wrote the paper.
Acknowledgments
The research leading to these results has received funding from the European Community’s Seventh Framework Programme [FP7/2007-2013] and Horizon 2020 under the Mont-Blanc projects [17], grant agreements n. 288777, 610402 and 671697. E.C. was partially founded by “Contributo 5 per mille assegnato all’Università degli Studi di Ferrara-dichiarazione dei redditi dell’anno 2014”. We thank the University of Ferrara and INFN Ferrara for the access to the COKA Cluster. We warmly thank the BSC tools group, supporting us for the smooth integration and test of our setup within Extrae and Paraver.
Conflicts of Interest
The authors declare no conflict of interest.
References
- Feng, W.; Cameron, K. The green500 list: Encouraging sustainable supercomputing. Computer 2007, 40. [Google Scholar] [CrossRef]
- Lucas, R.; Ang, J.; Bergman, K.; Borkar, S.; Carlson, W.; Carrington, L.; Chiu, G.; Colwell, R.; Dally, W.; Dongarra, J.; et al. Top Ten Exascale Research Challenges; DOE ASCAC Subcommittee Report; 2014; pp. 1–86. Available online: https://science.energy.gov/~/media/ascr/ascac/pdf/meetings/20140210/Top10reportFEB14.pdf (accessed on 4 May 2018).
- Benedict, S. Energy-aware performance analysis methodologies for HPC architectures—An exploratory study. J. Netw. Comput. Appl. 2012, 35, 1709–1719. [Google Scholar] [CrossRef]
- Pillet, V.; Labarta, J.; Cortes, T.; Girona, S. Paraver: A tool to visualize and analyze parallel code. In Proceedings of the 187th World Occam and Transputer User Group Technical Meeting, Transputer and Occam Developments, WoTUG-18, Manchester, UK, 9–13 April 1995; Volume 44, pp. 17–31. [Google Scholar]
- Alonso, P.; Badia, R.M.; Labarta, J.; Barreda, M.; Dolz, M.F.; Mayo, R.; Quintana-Ortí, E.S.; Reyes, R. Tools for Power-Energy Modelling and Analysis of Parallel Scientific Applications. In Proceedings of the 2012 41st International Conference on Parallel Processing (ICPP), Pittsburgh, PA, USA, 10–13 September 2012; pp. 420–429. [Google Scholar]
- Servat, H.; Llort, G.; Giménez, J.; Labarta, J. Detailed and simultaneous power and performance analysis. Concurr. Comput. Pract. Exp. 2016, 28, 252–273. [Google Scholar] [CrossRef]
- Dongarra, J.; London, K.; Moore, S.; Mucci, P.; Terpstra, D. Using PAPI for hardware performance monitoring on Linux systems. In Proceedings of the Conference on Linux Clusters: The HPC Revolution, Linux Clusters Institute, Urbana, IL, USA, 26–27 June 2001; Volume 5. [Google Scholar]
- Schöne, R.; Tschüter, R.; Ilsche, T.; Schuchart, J.; Hackenberg, D.; Nagel, W.E. Extending the functionality of score-P through plugins: Interfaces and use cases. In Tools for High Performance Computing 2016; Springer: Berlin, Germany, 2017; pp. 59–82. [Google Scholar]
- Hackenberg, D.; Ilsche, T.; Schuchart, J.; Schöne, R.; Nagel, W.E.; Simon, M.; Georgiou, Y. HDEEM: High definition energy efficiency monitoring. In Proceedings of the 2nd International Workshop on Energy Efficient Supercomputing, New Orleans, LA, USA, 16 November 2014; pp. 1–10. [Google Scholar]
- Ilsche, T.; Schöne, R.; Schuchart, J.; Hackenberg, D.; Simon, M.; Georgiou, Y.; Nagel, W.E. Power measurement techniques for energy-efficient computing: reconciling scalability, resolution, and accuracy. Comput. Sci. Res. Dev. 2017, 1–8. [Google Scholar] [CrossRef]
- Schuchart, J.; Gerndt, M.; Kjeldsberg, P.G.; Lysaght, M.; Horák, D.; Říha, L.; Gocht, A.; Sourouri, M.; Kumaraswamy, M.; Chowdhury, A.; et al. The READEX formalism for automatic tuning for energy efficiency. Computing 2017, 99, 727–745. [Google Scholar] [CrossRef]
- Bekas, C.; Curioni, A. A new energy aware performance metric. Computer Comput. Sci. Res. Dev. 2010, 25, 187–195. [Google Scholar] [CrossRef]
- Scogland, T.R.; Steffen, C.P.; Wilde, T.; Parent, F.; Coghlan, S.; Bates, N.; Feng, W.c.; Strohmaier, E. A power-measurement methodology for large-scale, high-performance computing. In Proceedings of the 5th ACM/SPEC International Conference On Performance Engineering, Dublin, Ireland, 22–26 March 2014; pp. 149–159. [Google Scholar]
- Rajagopal, D.; Tafani, D.; Georgiou, Y.; Glesser, D.; Ott, M. A Novel Approach for Job Scheduling Optimizations under Power Cap for ARM and Intel HPC Systems. In Proceedings of the 24th IEEE International Conference on High Performance Computing, Data, and Analytics (HiPC 2017), Jaipur, India, 18–21 December 2017. [Google Scholar]
- Ahmad, W.A.; Bartolini, A.; Beneventi, F.; Benini, L.; Borghesi, A.; Cicala, M.; Forestieri, P.; Gianfreda, C.; Gregori, D.; Libri, A.; et al. Design of an Energy Aware Petaflops Class High Performance Cluster Based on Power Architecture. In Proceedings of the 2017 IEEE International Parallel and Distributed Processing Symposium Workshops (IPDPSW), Lake Buena Vista, FL, USA, 29 May–2 June 2017; pp. 964–973. [Google Scholar]
- Rajovic, N.; Carpenter, P.; Gelado, I.; Puzovic, N.; Ramirez, A.; Valero, M. Supercomputing with commodity CPUs: Are mobile SoCs ready for HPC? In Proceedings of the International Conference on High Performance Computing, Networking, Storage and Analysis, Denver, Colorado, 17–21 November 2013; pp. 1–12. [Google Scholar]
- Rajovic, N.; Rico, A.; Mantovani, F.; Ruiz, D.; Vilarrubi, J.O.; Gomez, C.; Backes, L.; Nieto, D.; Servat, H.; Martorell, X.; et al. The Mont-blanc Prototype: An Alternative Approach for HPC Systems. In Proceedings of the International Conference for High Performance Computing, Networking, Storage and Analysis, Salt Lake City, UT, USA, 13–18 November 2016; IEEE Press: Piscataway, NJ, USA, 2016. [Google Scholar]
- Cesini, D.; Corni, E.; Falabella, A.; Ferraro, A.; Morganti, L.; Calore, E.; Schifano, S.; Michelotto, M.; Alfieri, R.; De Pietri, R.; et al. Power-Efficient Computing: Experiences from the COSA Project. Sci. Program. 2017. [Google Scholar] [CrossRef]
- Cesini, D.; Corni, E.; Falabella, A.; Ferraro, A.; Lama, L.; Morganti, L.; Calore, E.; Schifano, S.; Michelotto, M.; Alfieri, R.; et al. The INFN COSA Project: Low-Power Computing and Storage. Adv. Parallel Comput. 2018, 32, 770–779. [Google Scholar] [CrossRef]
- Nikolskiy, V.P.; Stegailov, V.V.; Vecher, V.S. Efficiency of the Tegra K1 and X1 systems-on-chip for classical molecular dynamics. In Proceedings of the 2016 International Conference on High Performance Computing Simulation (HPCS), Innsbruck, Austria, 18–22 July 2016; pp. 682–689. [Google Scholar]
- Ukidave, Y.; Kaeli, D.; Gupta, U.; Keville, K. Performance of the NVIDIA Jetson TK1 in HPC. In Proceedings of the 2015 IEEE International Conference on Cluster Computing (CLUSTER), Chicago, IL, USA, 8–11 September 2015; pp. 533–534. [Google Scholar]
- Geveler, M.; Ribbrock, D.; Donner, D.; Ruelmann, H.; Höppke, C.; Schneider, D.; Tomaschewski, D.; Turek, S. The ICARUS White Paper: A Scalable, Energy-Efficient, Solar-Powered HPC Center Based on Low Power GPUs. In Euro-Par 2016: Parallel Processing Workshops, Proceedings of the Euro-Par 2016 International Workshops, Grenoble, France, 24–26 August 2016; Desprez, F., Dutot, P.F., Kaklamanis, C., Marchal, L., Molitorisz, K., Ricci, L., Scarano, V., Vega-Rodríguez, M.A., Varbanescu, A.L., Hunold, S., et al., Eds.; Springer International Publishing: Berlin, Germany, 2017; pp. 737–749. [Google Scholar]
- Durand, Y.; Carpenter, P.M.; Adami, S.; Bilas, A.; Dutoit, D.; Farcy, A.; Gaydadjiev, G.; Goodacre, J.; Katevenis, M.; Marazakis, M.; et al. Euroserver: Energy efficient node for european micro-servers. In Proceedings of the 2014 17th Euromicro Conference on Digital System Design (DSD), Verona, Italy, 27–29 August 2014; pp. 206–213. [Google Scholar]
- Mantovani, F.; Calore, E. Multi-Node Advanced Performance and Power Analysis with Paraver. In Parallel Computing is Everywhere; Advances in Parallel Computing; IOS Press Ebooks: Amsterdam, The Netherlands, 2018; Volume 32. [Google Scholar]
- Etinski, M.; Corbalán, J.; Labarta, J.; Valero, M. Understanding the future of energy-performance trade-off via DVFS in HPC environments. J. Parallel Distrib.Comput. 2012, 72, 579–590. [Google Scholar] [CrossRef]
- Weaver, V.; Johnson, M.; Kasichayanula, K.; Ralph, J.; Luszczek, P.; Terpstra, D.; Moore, S. Measuring Energy and Power with PAPI. In Proceedings of the 2012 41st International Conference on Parallel Processing Workshops (ICPPW), Pittsburgh, PA, USA, 10—13 September 2012; pp. 262–268. [Google Scholar]
- Succi, S. The Lattice-Boltzmann Equation; Oxford University Press: Oxford, UK, 2001. [Google Scholar]
- Sbragaglia, M.; Benzi, R.; Biferale, L.; Chen, H.; Shan, X.; Succi, S. Lattice Boltzmann method with self-consistent thermo-hydrodynamic equilibria. J. Fluid Mech. 2009, 628, 299–309. [Google Scholar] [CrossRef]
- Scagliarini, A.; Biferale, L.; Sbragaglia, M.; Sugiyama, K.; Toschi, F. Lattice Boltzmann methods for thermal flows: Continuum limit and applications to compressible Rayleigh-Taylor systems. Phys. Fluids 2010, 22, 055101. [Google Scholar] [CrossRef]
- Biferale, L.; Mantovani, F.; Sbragaglia, M.; Scagliarini, A.; Toschi, F.; Tripiccione, R. Second-order closure in stratified turbulence: Simulations and modeling of bulk and entrainment regions. Phys. Rev. E 2011, 84, 016305. [Google Scholar] [CrossRef] [PubMed]
- Biferale, L.; Mantovani, F.; Sbragaglia, M.; Scagliarini, A.; Toschi, F.; Tripiccione, R. Reactive Rayleigh-Taylor systems: Front propagation and non-stationarity. EPL 2011, 94, 54004. [Google Scholar] [CrossRef]
- Biferale, L.; Mantovani, F.; Pivanti, M.; Pozzati, F.; Sbragaglia, M.; Scagliarini, A.; Schifano, S.F.; Toschi, F.; Tripiccione, R. A Multi-GPU Implementation of a D2Q37 Lattice Boltzmann Code. In Parallel Processing and Applied Mathematics, Proceedings of the 9th International Conference on PPAM 2011, Lecture Notes in Computer Science, Torun, Poland, 11–14 September 2012; Springer: Berlin/Heidelberg, Germany; pp. 640–650.
- Calore, E.; Schifano, S.F.; Tripiccione, R. On Portability, Performance and Scalability of an MPI OpenCL Lattice Boltzmann Code. In Euro-Par 2014: Parallel Processing Workshops; LNCS; Springer: Berlin, Germany, 2014; pp. 438–449. [Google Scholar]
- Calore, E.; Gabbana, A.; Kraus, J.; Schifano, S.F.; Tripiccione, R. Performance and portability of accelerated lattice Boltzmann applications with OpenACC. Concurr. Comput. Pract. Exp. 2016, 28, 3485–3502. [Google Scholar] [CrossRef]
- Calore, E.; Gabbana, A.; Kraus, J.; Pellegrini, E.; Schifano, S.F.; Tripiccione, R. Massively parallel lattice-Boltzmann codes on large GPU clusters. Parallel Comput. 2016, 58, 1–24. [Google Scholar] [CrossRef]
- Mantovani, F.; Pivanti, M.; Schifano, S.F.; Tripiccione, R. Performance issues on many-core processors: A D2Q37 Lattice Boltzmann scheme as a test-case. Comput. Fluids 2013, 88, 743–752. [Google Scholar] [CrossRef]
- Calore, E.; Schifano, S.F.; Tripiccione, R. Energy-Performance Tradeoffs for HPC Applications on Low Power Processors. In Euro-Par 2015: Parallel Processing Workshops, Proceedings of the Euro-Par 2015 International Workshops, Vienna, Austria, 24–25 August 2015; Springer: Berlin, Germany, 2015; pp. 737–748. [Google Scholar]
- Biferale, L.; Mantovani, F.; Pivanti, M.; Pozzati, F.; Sbragaglia, M.; Scagliarini, A.; Schifano, S.F.; Toschi, F.; Tripiccione, R. An optimized D2Q37 Lattice Boltzmann code on GP-GPUs. Comput. Fluids 2013, 80, 55–62. [Google Scholar] [CrossRef]
- Calore, E.; Marchi, D.; Schifano, S.F.; Tripiccione, R. Optimizing communications in multi-GPU Lattice Boltzmann simulations. In Proceedings of the 2015 International Conference on High Performance Computing Simulation (HPCS), Amsterdam, The Netherlands, 20–24 July 2015; pp. 55–62. [Google Scholar]
- Calore, E.; Gabbana, A.; Schifano, S.F.; Tripiccione, R. Evaluation of DVFS techniques on modern HPC processors and accelerators for energy-aware applications. Concurr. Comput. Pract. Exp. 2017. [Google Scholar] [CrossRef]
- Smith, R.; Ho, J. Tegra X1’s GPU: Maxwell for Mobile. Available online: https://www.anandtech.com/show/8811/nvidia-tegra-x1-preview/2 (accessed on 28 April 2018).
- Hackenberg, D.; Ilsche, T.; Schone, R.; Molka, D.; Schmidt, M.; Nagel, W. Power measurement techniques on standard compute nodes: A quantitative comparison. In Proceedings of the 2013 IEEE International Symposium on Performance Analysis of Systems and Software (ISPASS), Austin, TX, USA, 21–23 April 2013; pp. 194–204. [Google Scholar]
- Hackenberg, D.; Schone, R.; Ilsche, T.; Molka, D.; Schuchart, J.; Geyer, R. An Energy Efficiency Feature Survey of the Intel Haswell Processor. In Proceedings of the 2015 IEEE International Parallel and Distributed Processing Symposium Workshop (IPDPSW), Hyderabad, India, 25–29 May 2015; pp. 896–904. [Google Scholar]
- Beneventi, F.; Bartolini, A.; Cavazzoni, C.; Benini, L. Continuous Learning of HPC Infrastructure Models Using Big Data Analytics and In-memory Processing Tools. In Proceedings of the Conference on Design, Automation & Test in Europe, Lausanne, Switzerland, 27–31 March 2017; pp. 1038–1043. [Google Scholar]
- Tran, K.A.; Carlson, T.E.; Koukos, K.; Själander, M.; Spiliopoulos, V.; Kaxiras, S.; Jimborean, A. Clairvoyance: Look-ahead compile-time scheduling. In Proceedings of the 2017 International Symposium on Code Generation and Optimization, Austin, TX, USA, 4–8 February 2017; pp. 171–184. [Google Scholar]
Figure 1.
Color-coded timelines of the power drain (in Watts) of the CPUs (Intel and Arm respectively) on one node with two sockets of the COKA cluster (top) and 12 nodes of the Jeston cluster (bottom), while running ten iterations of the LB model introduced in Section 3.1 exclusively on CPUs.
Figure 1.
Color-coded timelines of the power drain (in Watts) of the CPUs (Intel and Arm respectively) on one node with two sockets of the COKA cluster (top) and 12 nodes of the Jeston cluster (bottom), while running ten iterations of the LB model introduced in Section 3.1 exclusively on CPUs.

Figure 2.
Aggregate power profile of two different executions involving 12 compute nodes of the Jetson cluster: on the left the code running only on the 12 CPUs (4-cores each), on the right the code running on the 12 embedded GPUs. The run on the left is running a lattice 2 times larger than the one on the right.

Figure 3.
Timeline of the power drain of the GPU (left) and the CPU (right) during the execution on 12 compute nodes of the Jetson cluster running the GPU version of the Lattice Boltzmann code.
Figure 3.
Timeline of the power drain of the GPU (left) and the CPU (right) during the execution on 12 compute nodes of the Jetson cluster running the GPU version of the Lattice Boltzmann code.

Figure 4.
Timeline of the efficiency (GFLOPS/W), for each of the 12 MPI processes while running 10 iterations of the LB model on the Arm CPUs of the Jetson cluster.
Figure 4.
Timeline of the efficiency (GFLOPS/W), for each of the 12 MPI processes while running 10 iterations of the LB model on the Arm CPUs of the Jetson cluster.

Figure 5.
Histogram of the percentage of execution time spent in each interval of efficiency per MPI process (left) and on average for the whole execution (right).
Figure 5.
Histogram of the percentage of execution time spent in each interval of efficiency per MPI process (left) and on average for the whole execution (right).

Figure 6.
Two iterations of the LB simulation on the two CPUs of one COKA node. In the upper part, using a color-code spanning between 70 and 110 Watt, we see the power drain of the two CPUs (plus DRAMs contribution), while in the bottom part, in solid blue, we see the corresponding OpenMP threads executing in the respective CPU cores.

Figure 7.
Timeline of one iteration of the LB code. On the left we show the Instruction per Clock cycle (IPC), low IPC corresponds to the propagate phase, i.e., the memory-bound phase. On the right is the power drain during the same iteration. It is important to note that during the memory bound phase the power consumption is lower (light green) than during the compute bound phase (dark blue).


Table 1.
Percentage of execution time spent in each interval of efficiencies, for each of the 12 MPI processes while running 10 iterations of the LB model on the Arm CPUs of the Jetson cluster.
Table 1.
Percentage of execution time spent in each interval of efficiencies, for each of the 12 MPI processes while running 10 iterations of the LB model on the Arm CPUs of the Jetson cluster.
| [0.00;0.20) | [0.20;0.40) | [0.40;0.60) | [0.60;0.80) | [0.80;1.00) | [1.00;1.20) | [1.20;1.40) | [1.40;1.60) | [1.60;1.80) | [1.80;2.00] | |
|---|---|---|---|---|---|---|---|---|---|---|
| MPI rank 1 | 33.85% | 5.48% | 0.00% | 2.23% | 0.76% | 1.12 % | 42.14% | 7.45 % | 6.35 % | 0.62% |
| MPI rank 2 | 30.13% | 6.43% | 0.93% | 0.86% | 0.26% | 0.00 % | 39.81% | 2.26 % | 15.76% | 3.54% |
| MPI rank 3 | 39.05% | 0.94% | 0.00% | 1.05% | 0.14% | 0.04 % | 36.28% | 12.84% | 4.56 % | 5.10% |
| MPI rank 4 | 33.58% | 5.54% | 0.00% | 0.49% | 0.09% | 0.00 % | 46.46% | 3.22 % | 7.52 % | 3.10% |
| MPI rank 5 | 35.37% | 0.72% | 0.20% | 0.17% | 0.13% | 0.00 % | 40.82% | 5.06 % | 13.83% | 3.70% |
| MPI rank 6 | 30.22% | 6.20% | 1.83% | 0.27% | 0.13% | 23.28% | 16.58% | 5.70 % | 11.61% | 4.17% |
| MPI rank 7 | 33.18% | 7.18% | 0.00% | 1.04% | 0.25% | 0.00 % | 42.87% | 8.44 % | 3.58 % | 3.46% |
| MPI rank 8 | 36.48% | 0.73% | 0.22% | 0.08% | 0.14% | 3.63 % | 34.18% | 2.57 % | 18.92% | 3.04% |
| MPI rank 9 | 24.24% | 5.23% | 2.93% | 0.66% | 0.62% | 0.00 % | 30.08% | 4.71 % | 27.47% | 4.05% |
| MPI rank 10 | 35.14% | 0.65% | 0.34% | 0.16% | 0.20% | 0.08 % | 33.29% | 6.67 % | 18.07% | 5.41% |
| MPI rank 11 | 37.26% | 0.43% | 0.14% | 0.13% | 0.16% | 3.02 % | 33.42% | 4.38 % | 17.29% | 3.77% |
| MPI rank 12 | 39.36% | 0.89% | 0.11% | 0.11% | 0.13% | 0.02 % | 32.73% | 9.75 % | 10.88% | 6.02% |
Table 2.
Time to solution (), average power drain, Energy to solution () and Energy Delay Product EDP, of the LB application running respectively on: (i) 12 Arm CPUs of the Jetson cluster; (ii) 2 Intel CPUs of the COKA Cluster; (iii) 12 GPUs of the Jetson Cluster; (iv) 1 GPU of the COKA cluster. All values normalized per lattice site.
| [ns/site] | [W] | [J/site] | EDP [/site] | |||
|---|---|---|---|---|---|---|
| CPUs | Jetson Nodes | 93.38 | 89.92 | 8.29 | ||
| COKA Node | 42.32 | 206.78 | 8.74 | |||
| GPUs | Jetson Nodes | 50.47 | 66.46 | 3.35 | ||
| COKA K80 | 7.15 | 290.18 | 2.09 |
© 2018 by the authors. Licensee MDPI, Basel, Switzerland. This article is an open access article distributed under the terms and conditions of the Creative Commons Attribution (CC BY) license (http://creativecommons.org/licenses/by/4.0/).
Share and Cite
MDPI and ACS Style
Mantovani, F.; Calore, E. Performance and Power Analysis of HPC Workloads on Heterogeneous Multi-Node Clusters. J. Low Power Electron. Appl. 2018, 8, 13. https://doi.org/10.3390/jlpea8020013
AMA Style
Mantovani F, Calore E. Performance and Power Analysis of HPC Workloads on Heterogeneous Multi-Node Clusters. Journal of Low Power Electronics and Applications. 2018; 8(2):13. https://doi.org/10.3390/jlpea8020013
Chicago/Turabian StyleMantovani, Filippo, and Enrico Calore. 2018. "Performance and Power Analysis of HPC Workloads on Heterogeneous Multi-Node Clusters" Journal of Low Power Electronics and Applications 8, no. 2: 13. https://doi.org/10.3390/jlpea8020013
Note that from the first issue of 2016, this journal uses article numbers instead of page numbers. See further details here.