Recycling of Coking Plant Residues in a Finnish Steelworks—Laboratory Study and Replacement Ratio Calculation

Abstract
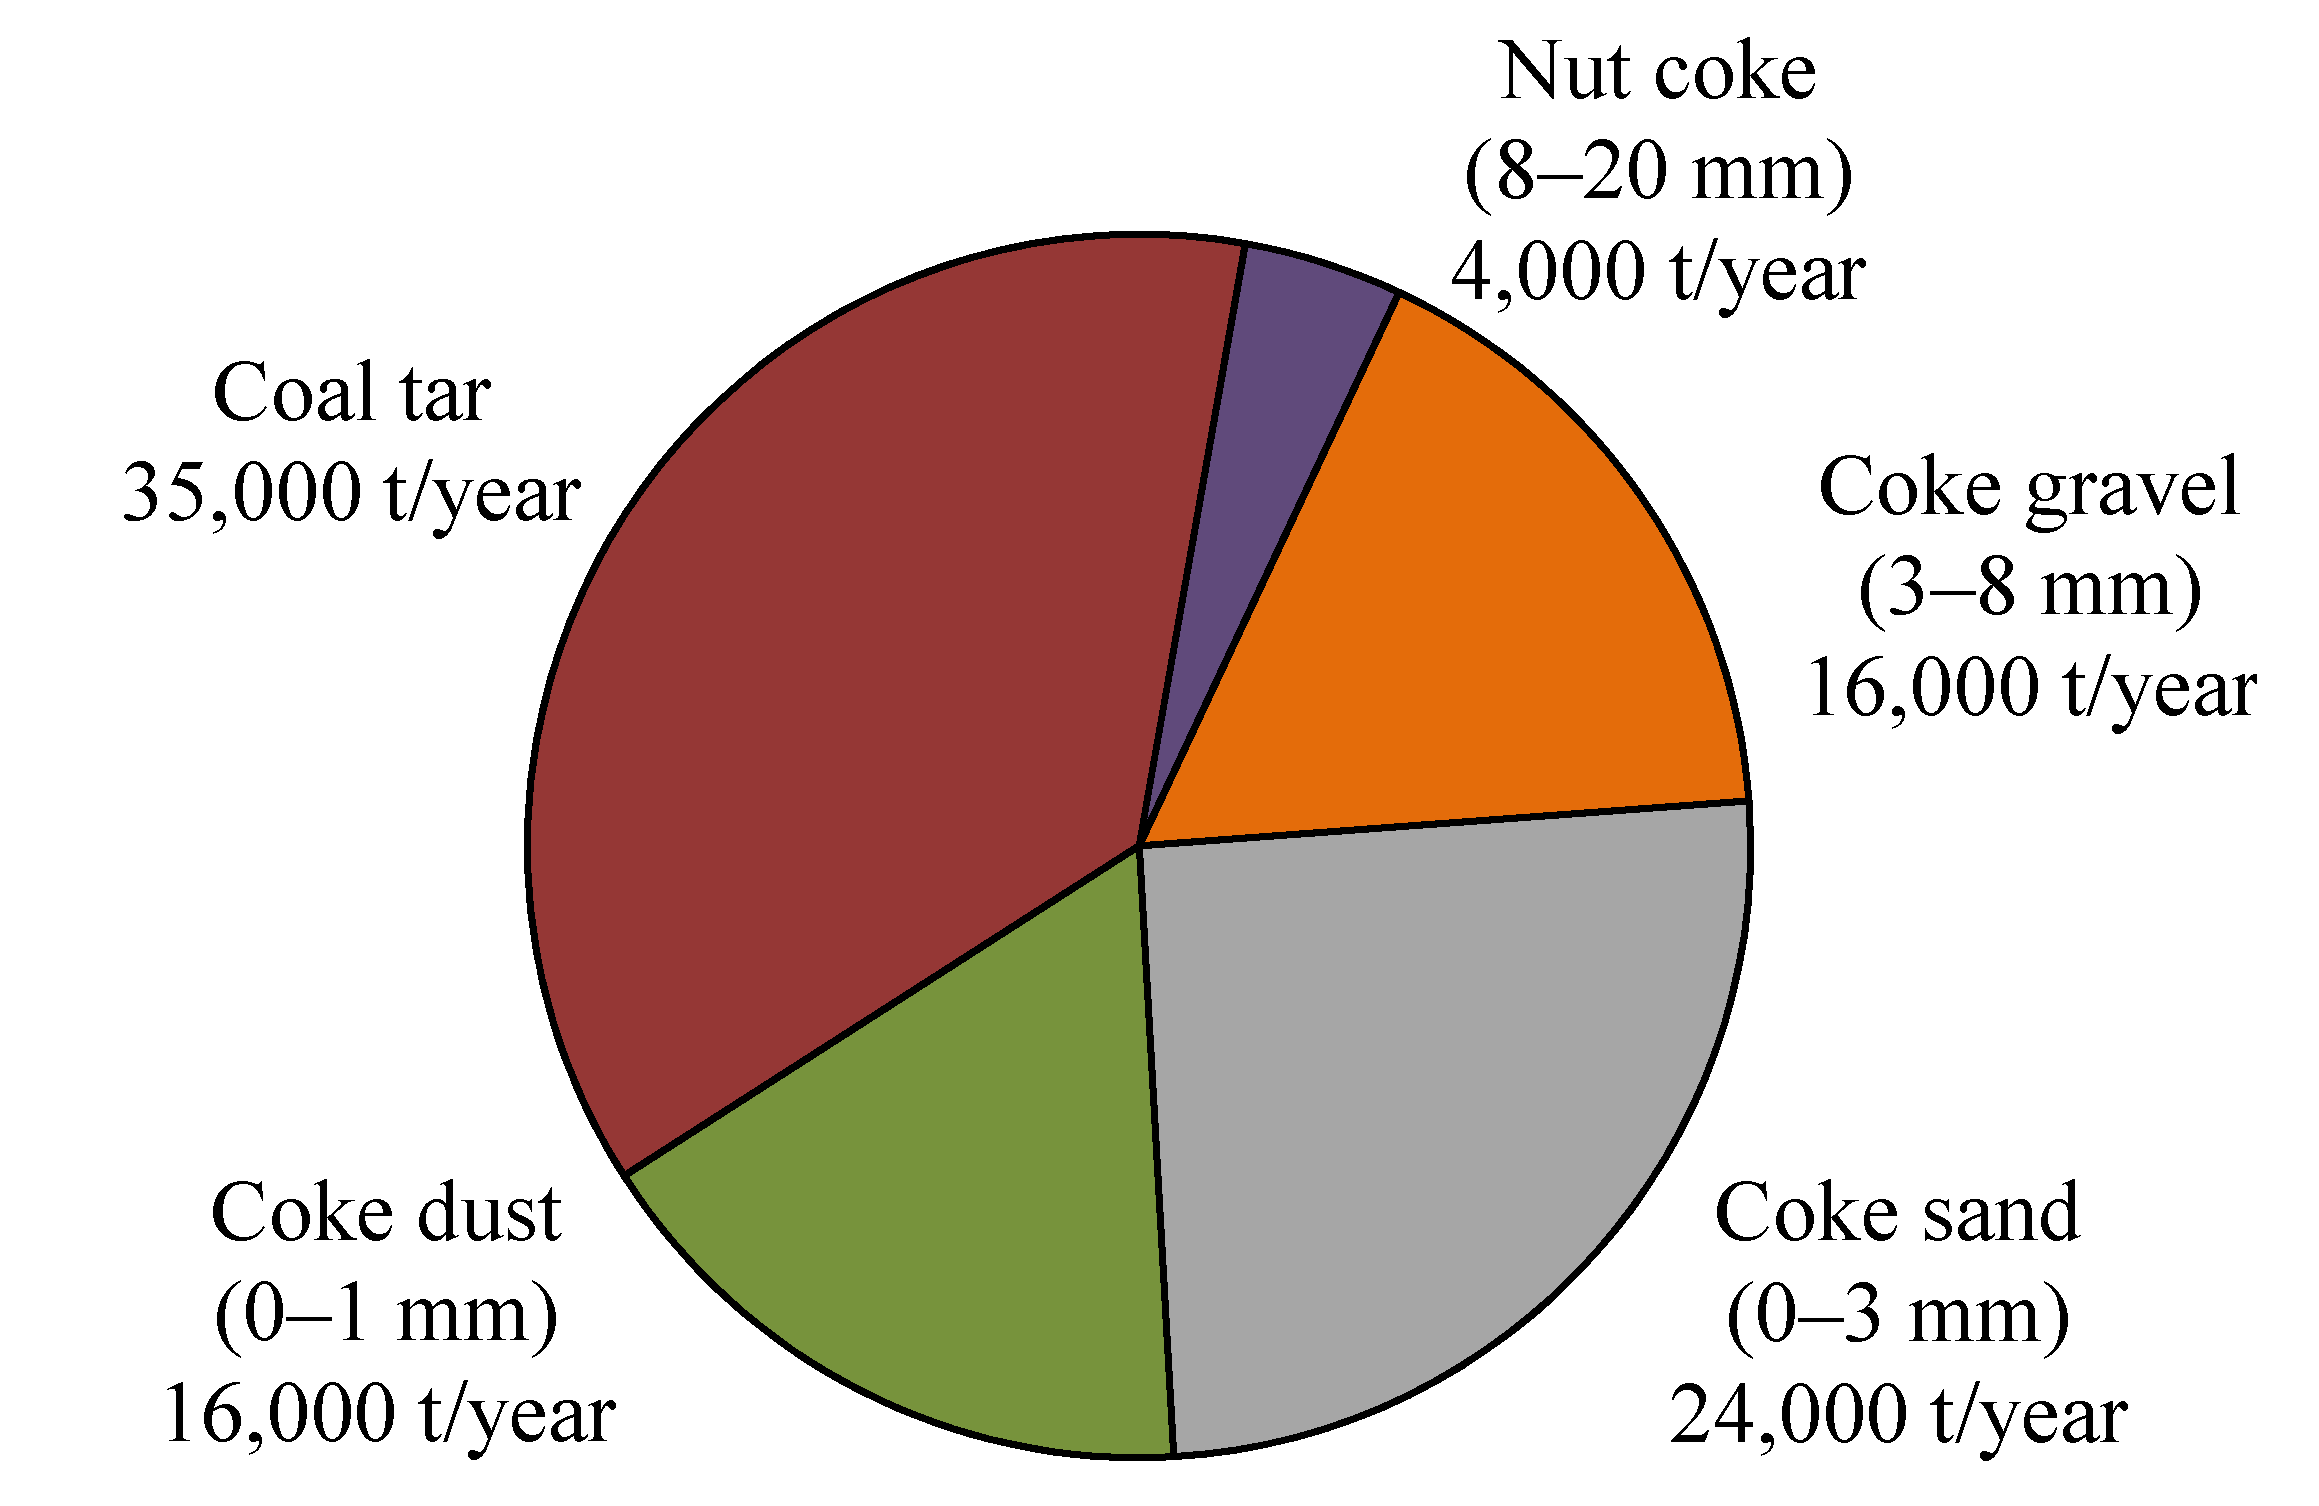
:1. Introduction
2. Methods
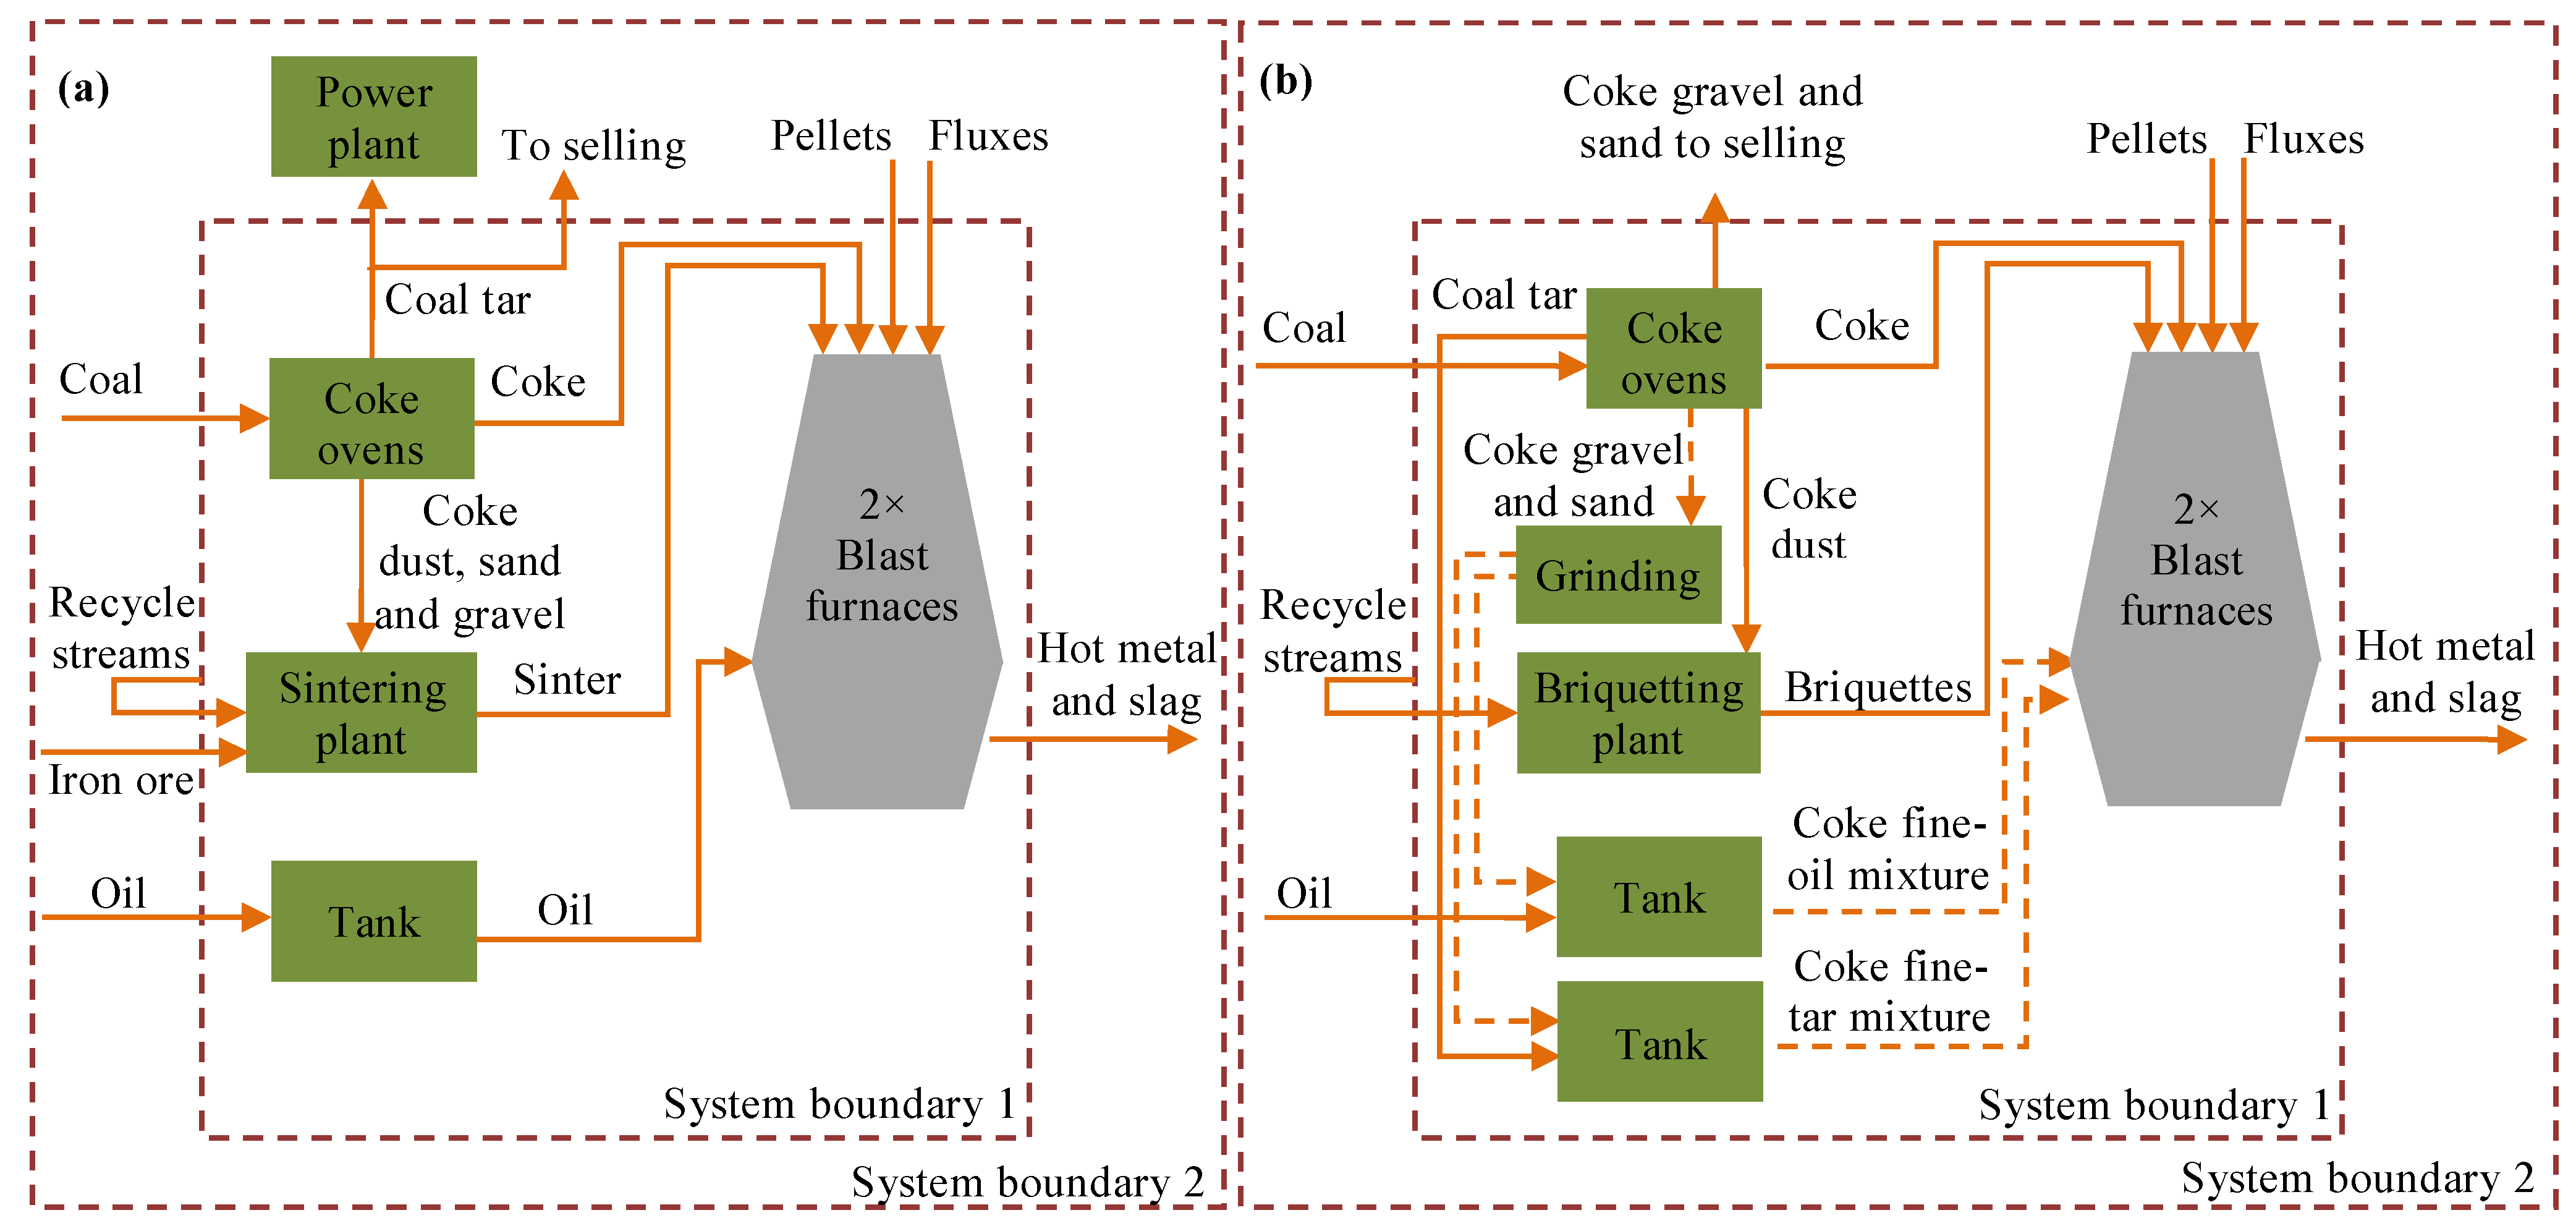
2.1. System Boundaries

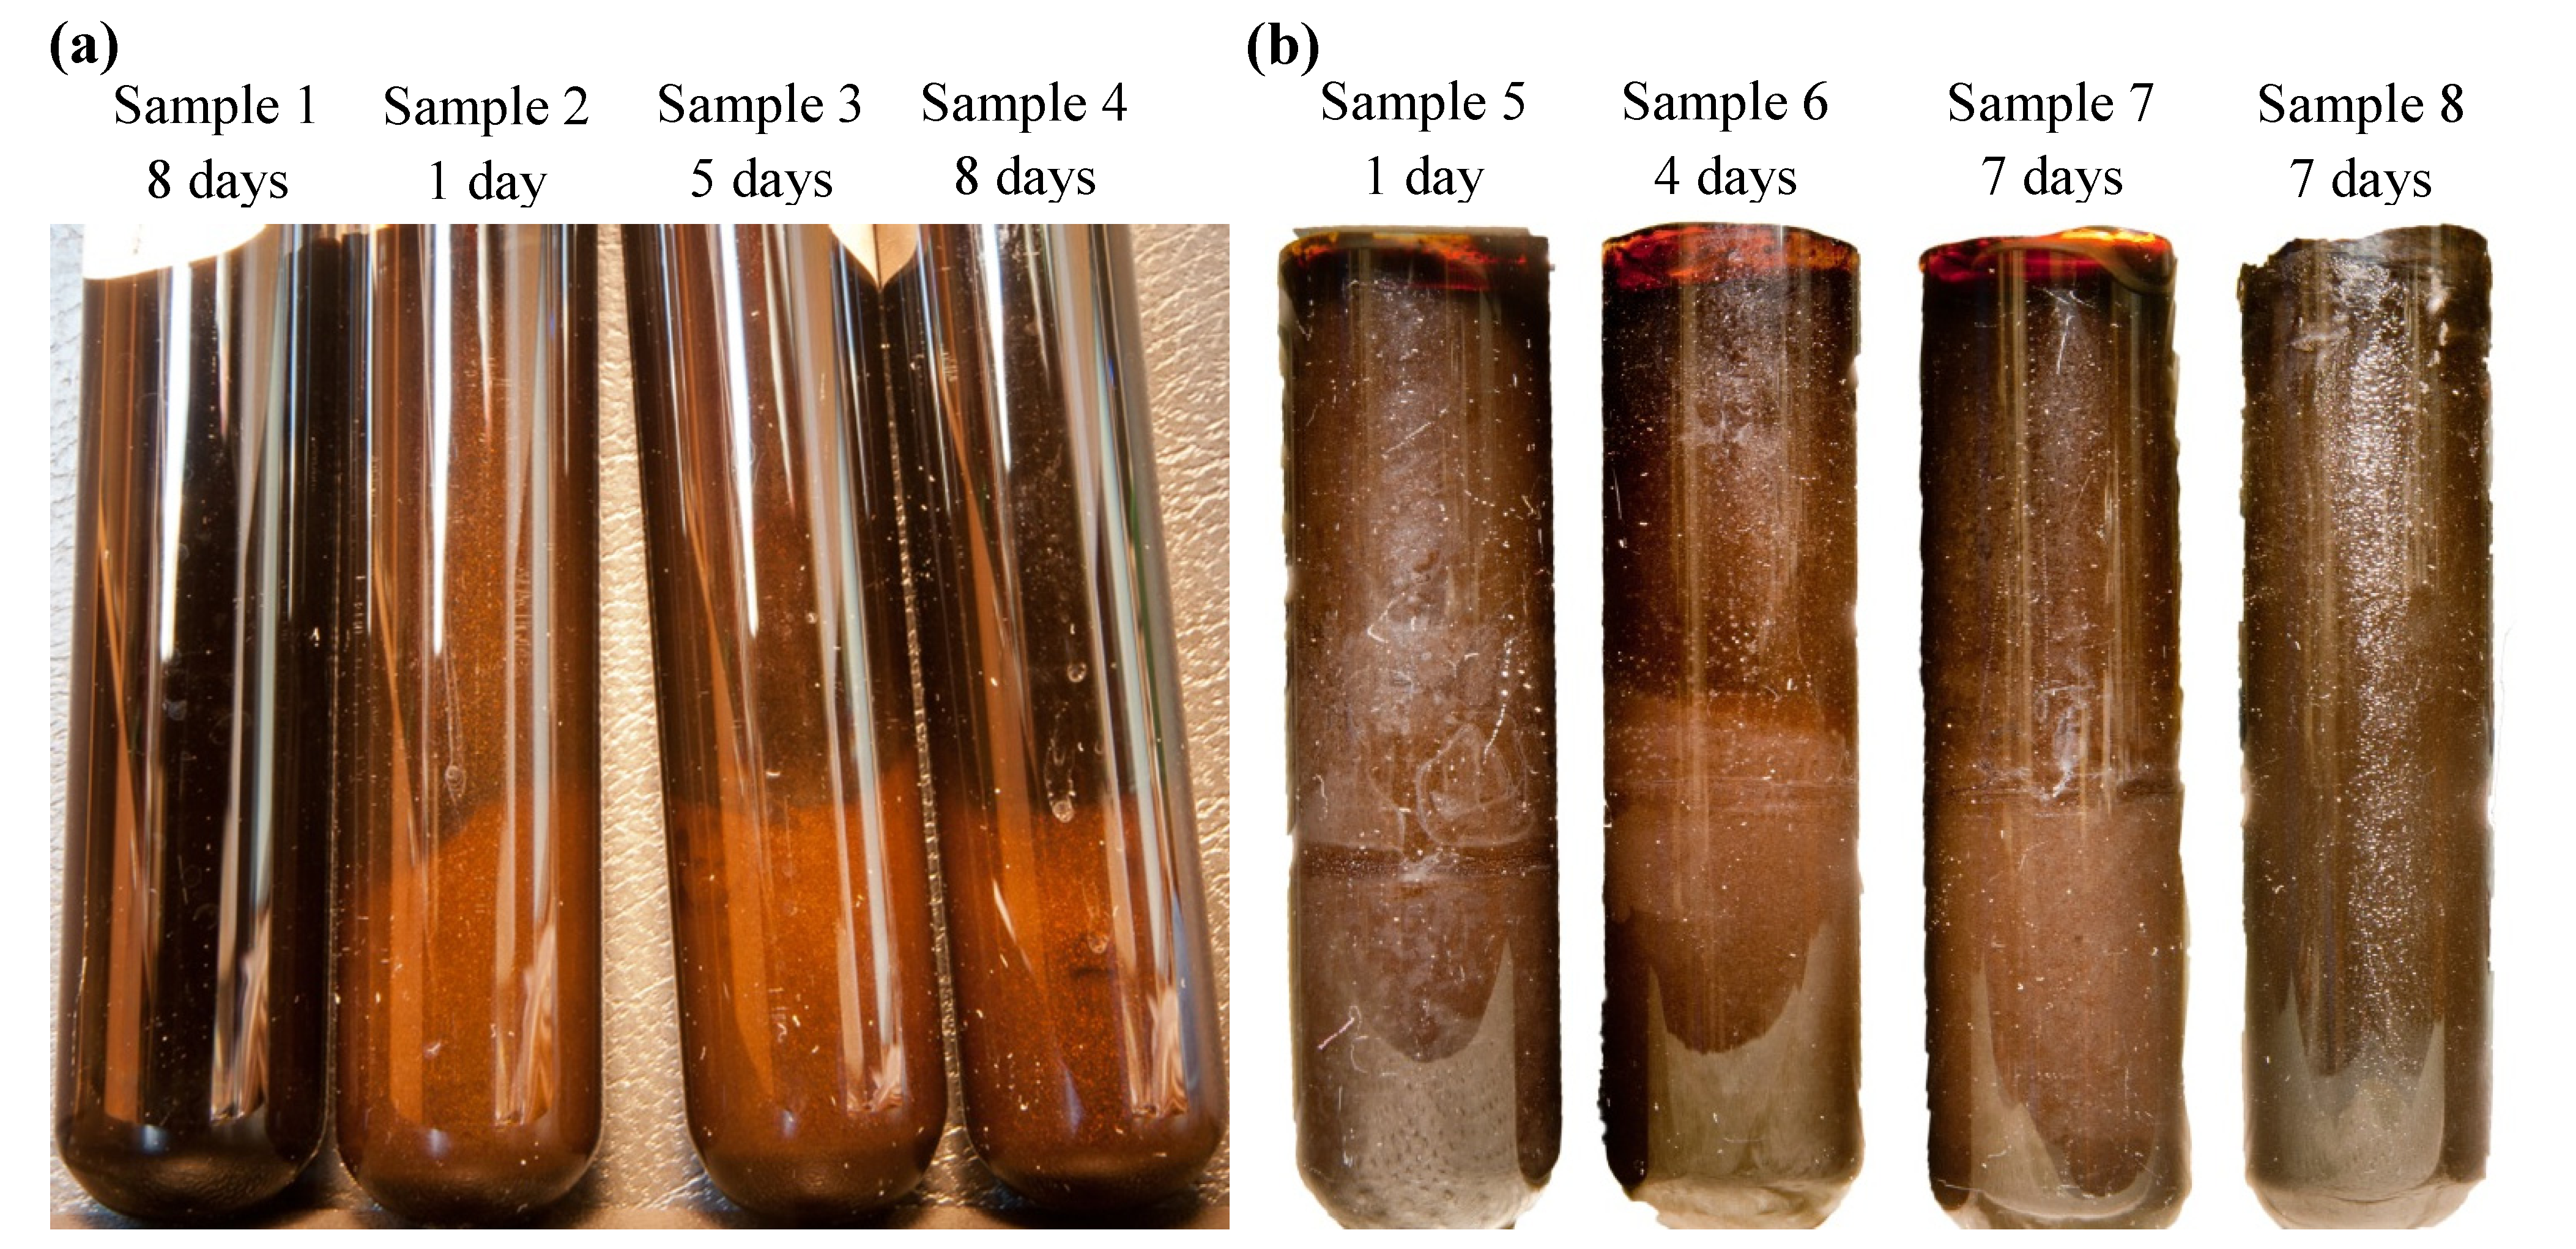
2.2. Viscosity Measurement and Stability of the Liquid-Solid Mixture

| Carbon-bearing material | Chemical analysis (wt %) | Ash analysis (% in ash) | |||||
|---|---|---|---|---|---|---|---|
| Cfixed | Volatile matter | S | Ash | SiO2 | CaO | Al2O3 | |
| Coke gravel | 86.0 | 0.24 | 0.72 | 12.6 | 59.7 | 2.8 | 25.7 |
| Coke sand | 88.0 | 0.23 | 0.78 | 11.7 | 55.6 | 4.6 | 25.5 |
| Coke dust | 88.6 | 0.23 | 0.81 | 11.1 | 53.3 | 6.2 | 25.3 |
| Coke | 88 | ND | 0.6 | 9.6 | 56.3 | 2.4 | ND |
| PC 1 | ND | 30.4 | 0.3 | 7.5 | ND | ND | ND |
| PC 2 | ND | 8.6 | 0.4 | 10.3 | ND | ND | ND |
2.3. Effect of Using Internal By-Products in Blast Furnace


3. Results
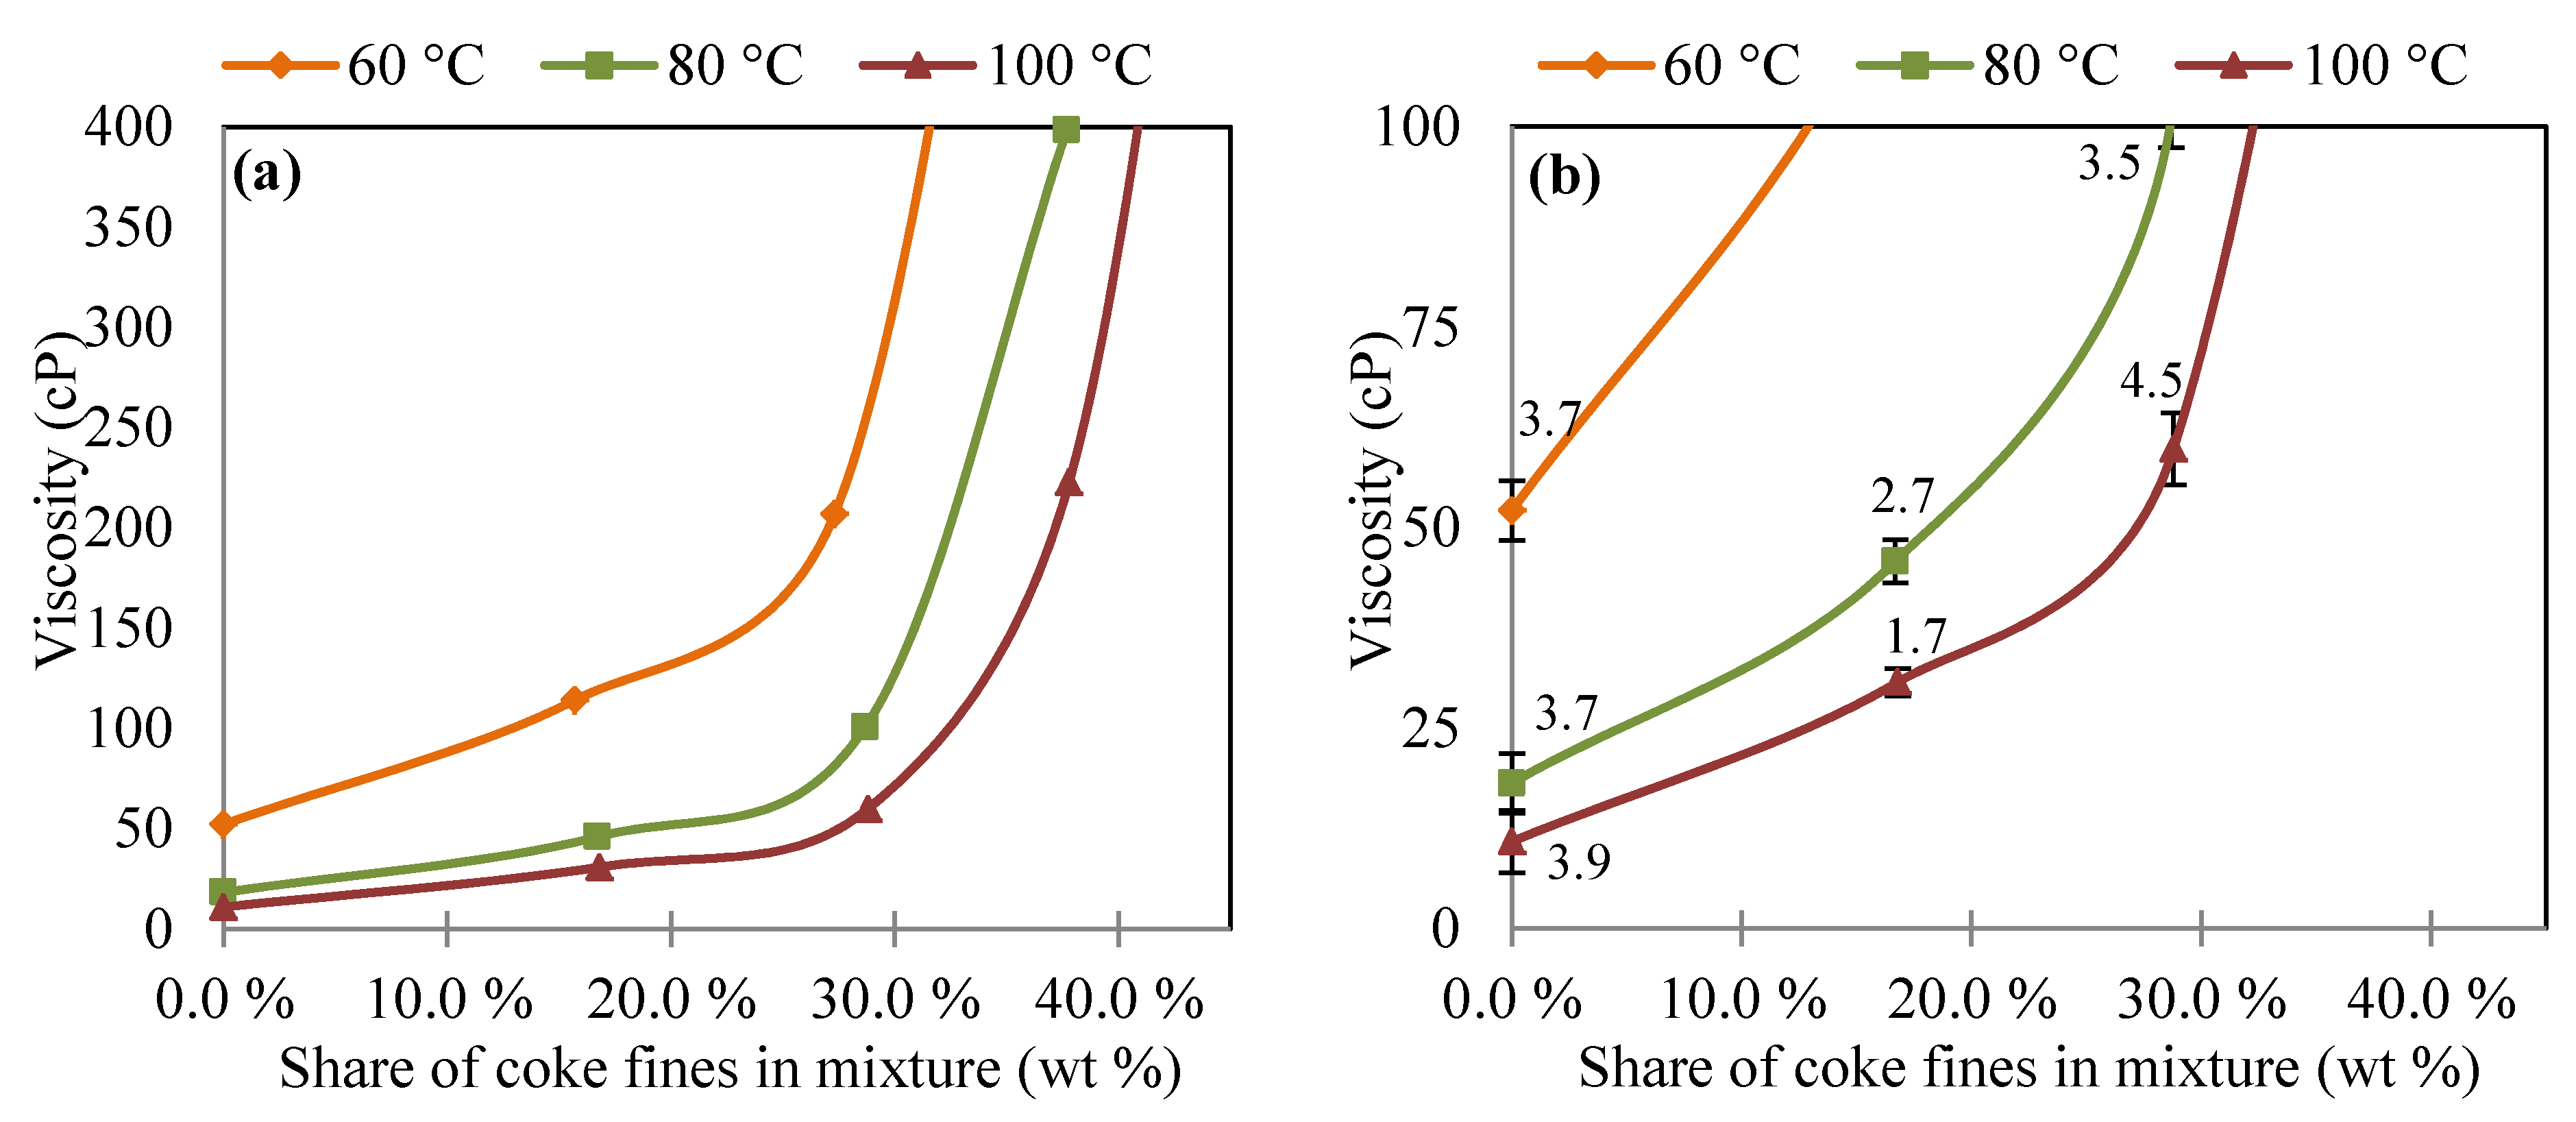
3.1. Viscosity of Oil and Coke Fines Mixture

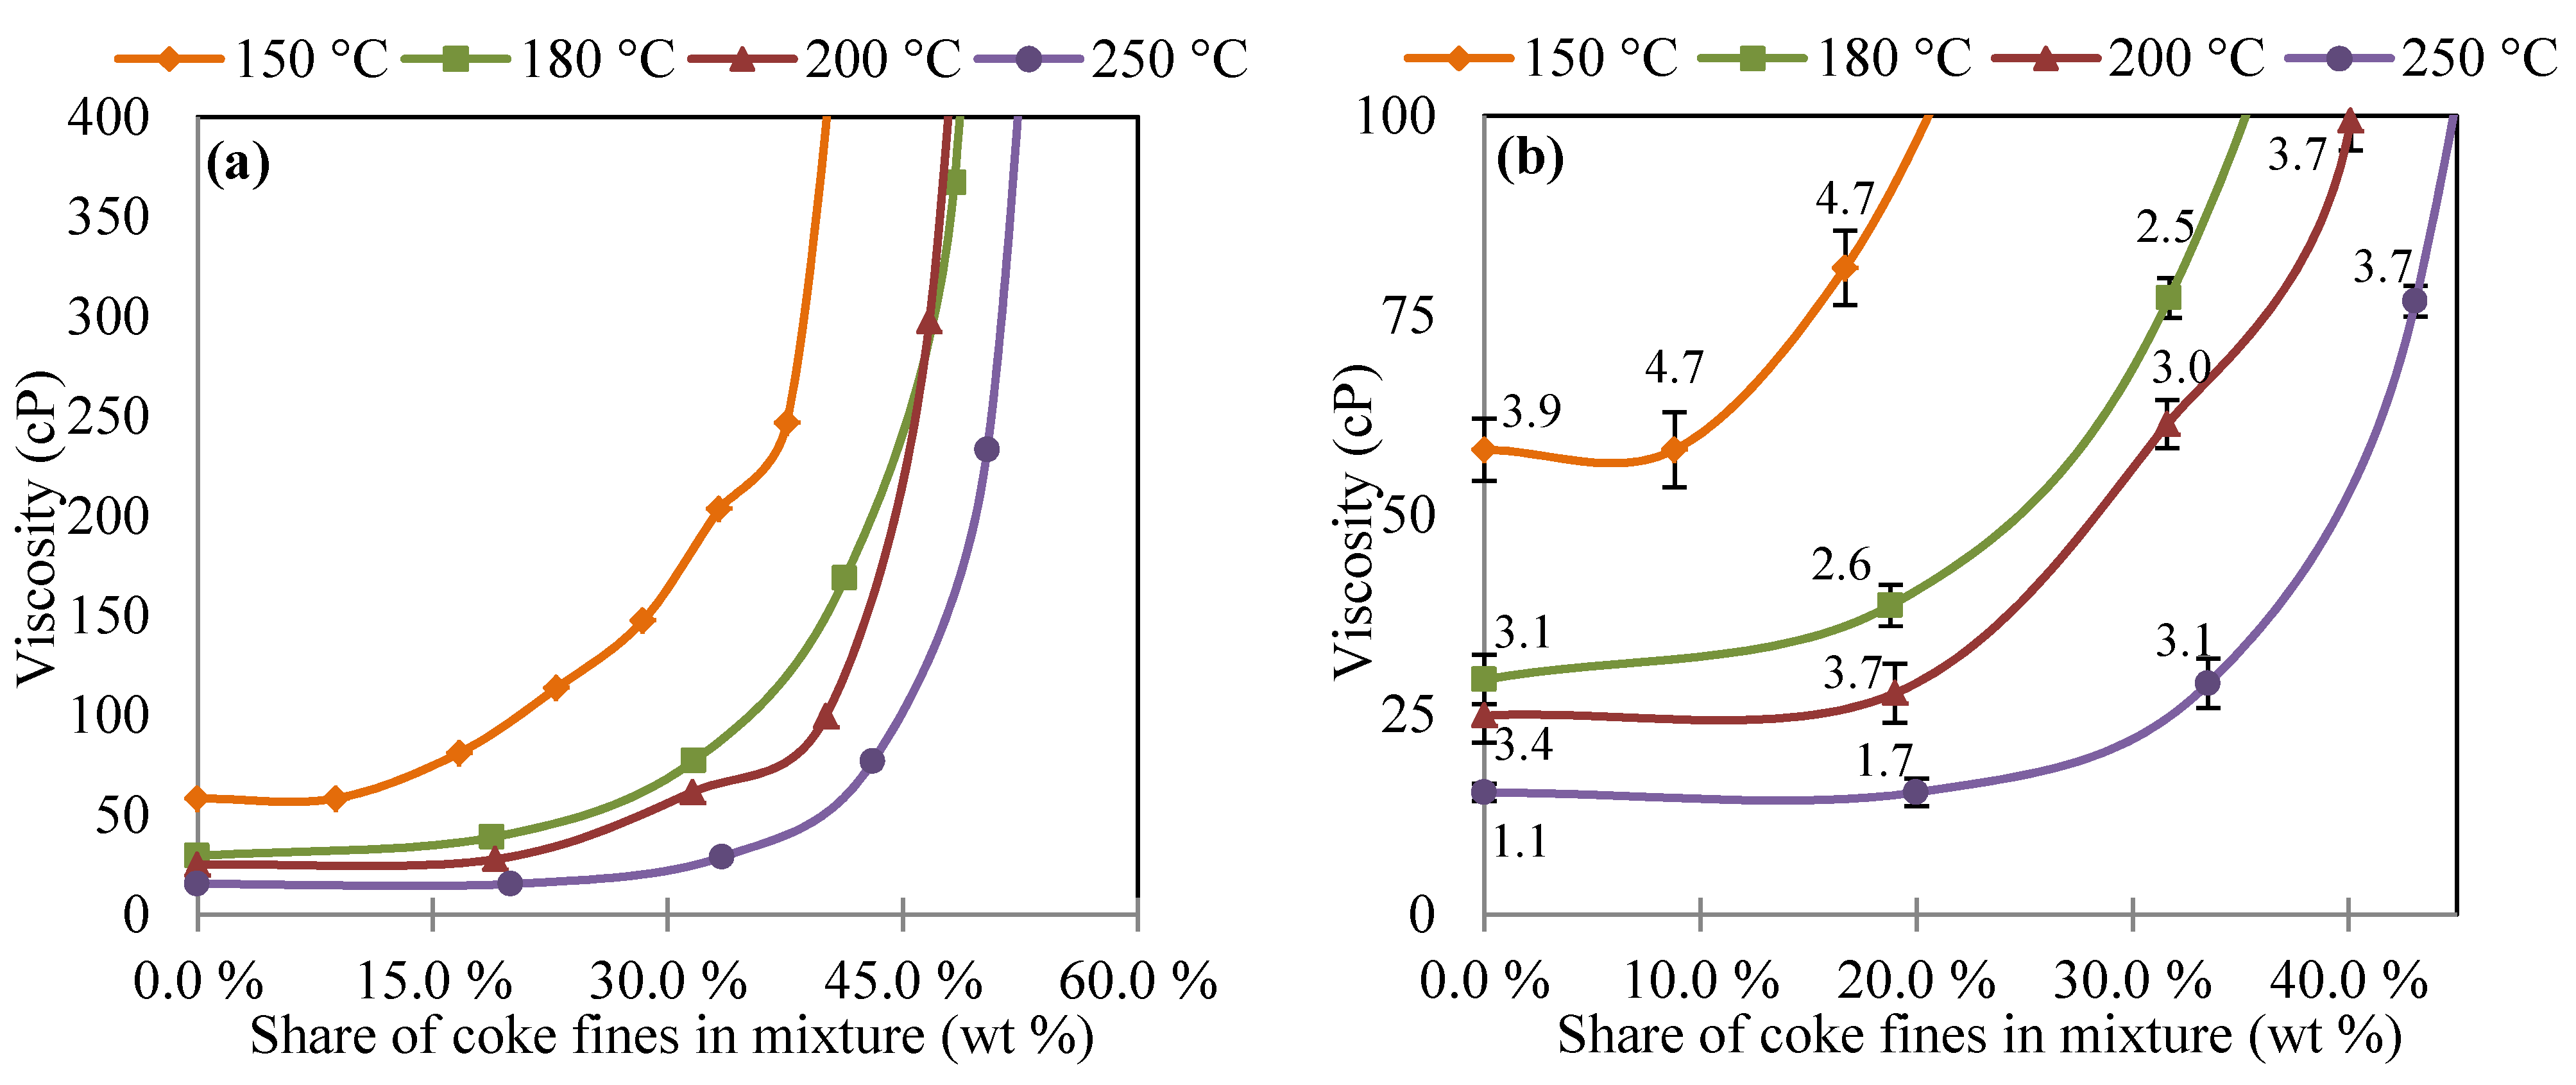
3.2. Viscosity of Coal Tar and Coke Fines Mixture

3.3. Injection Amounts of Coke Fines according to Viscosity Measurements
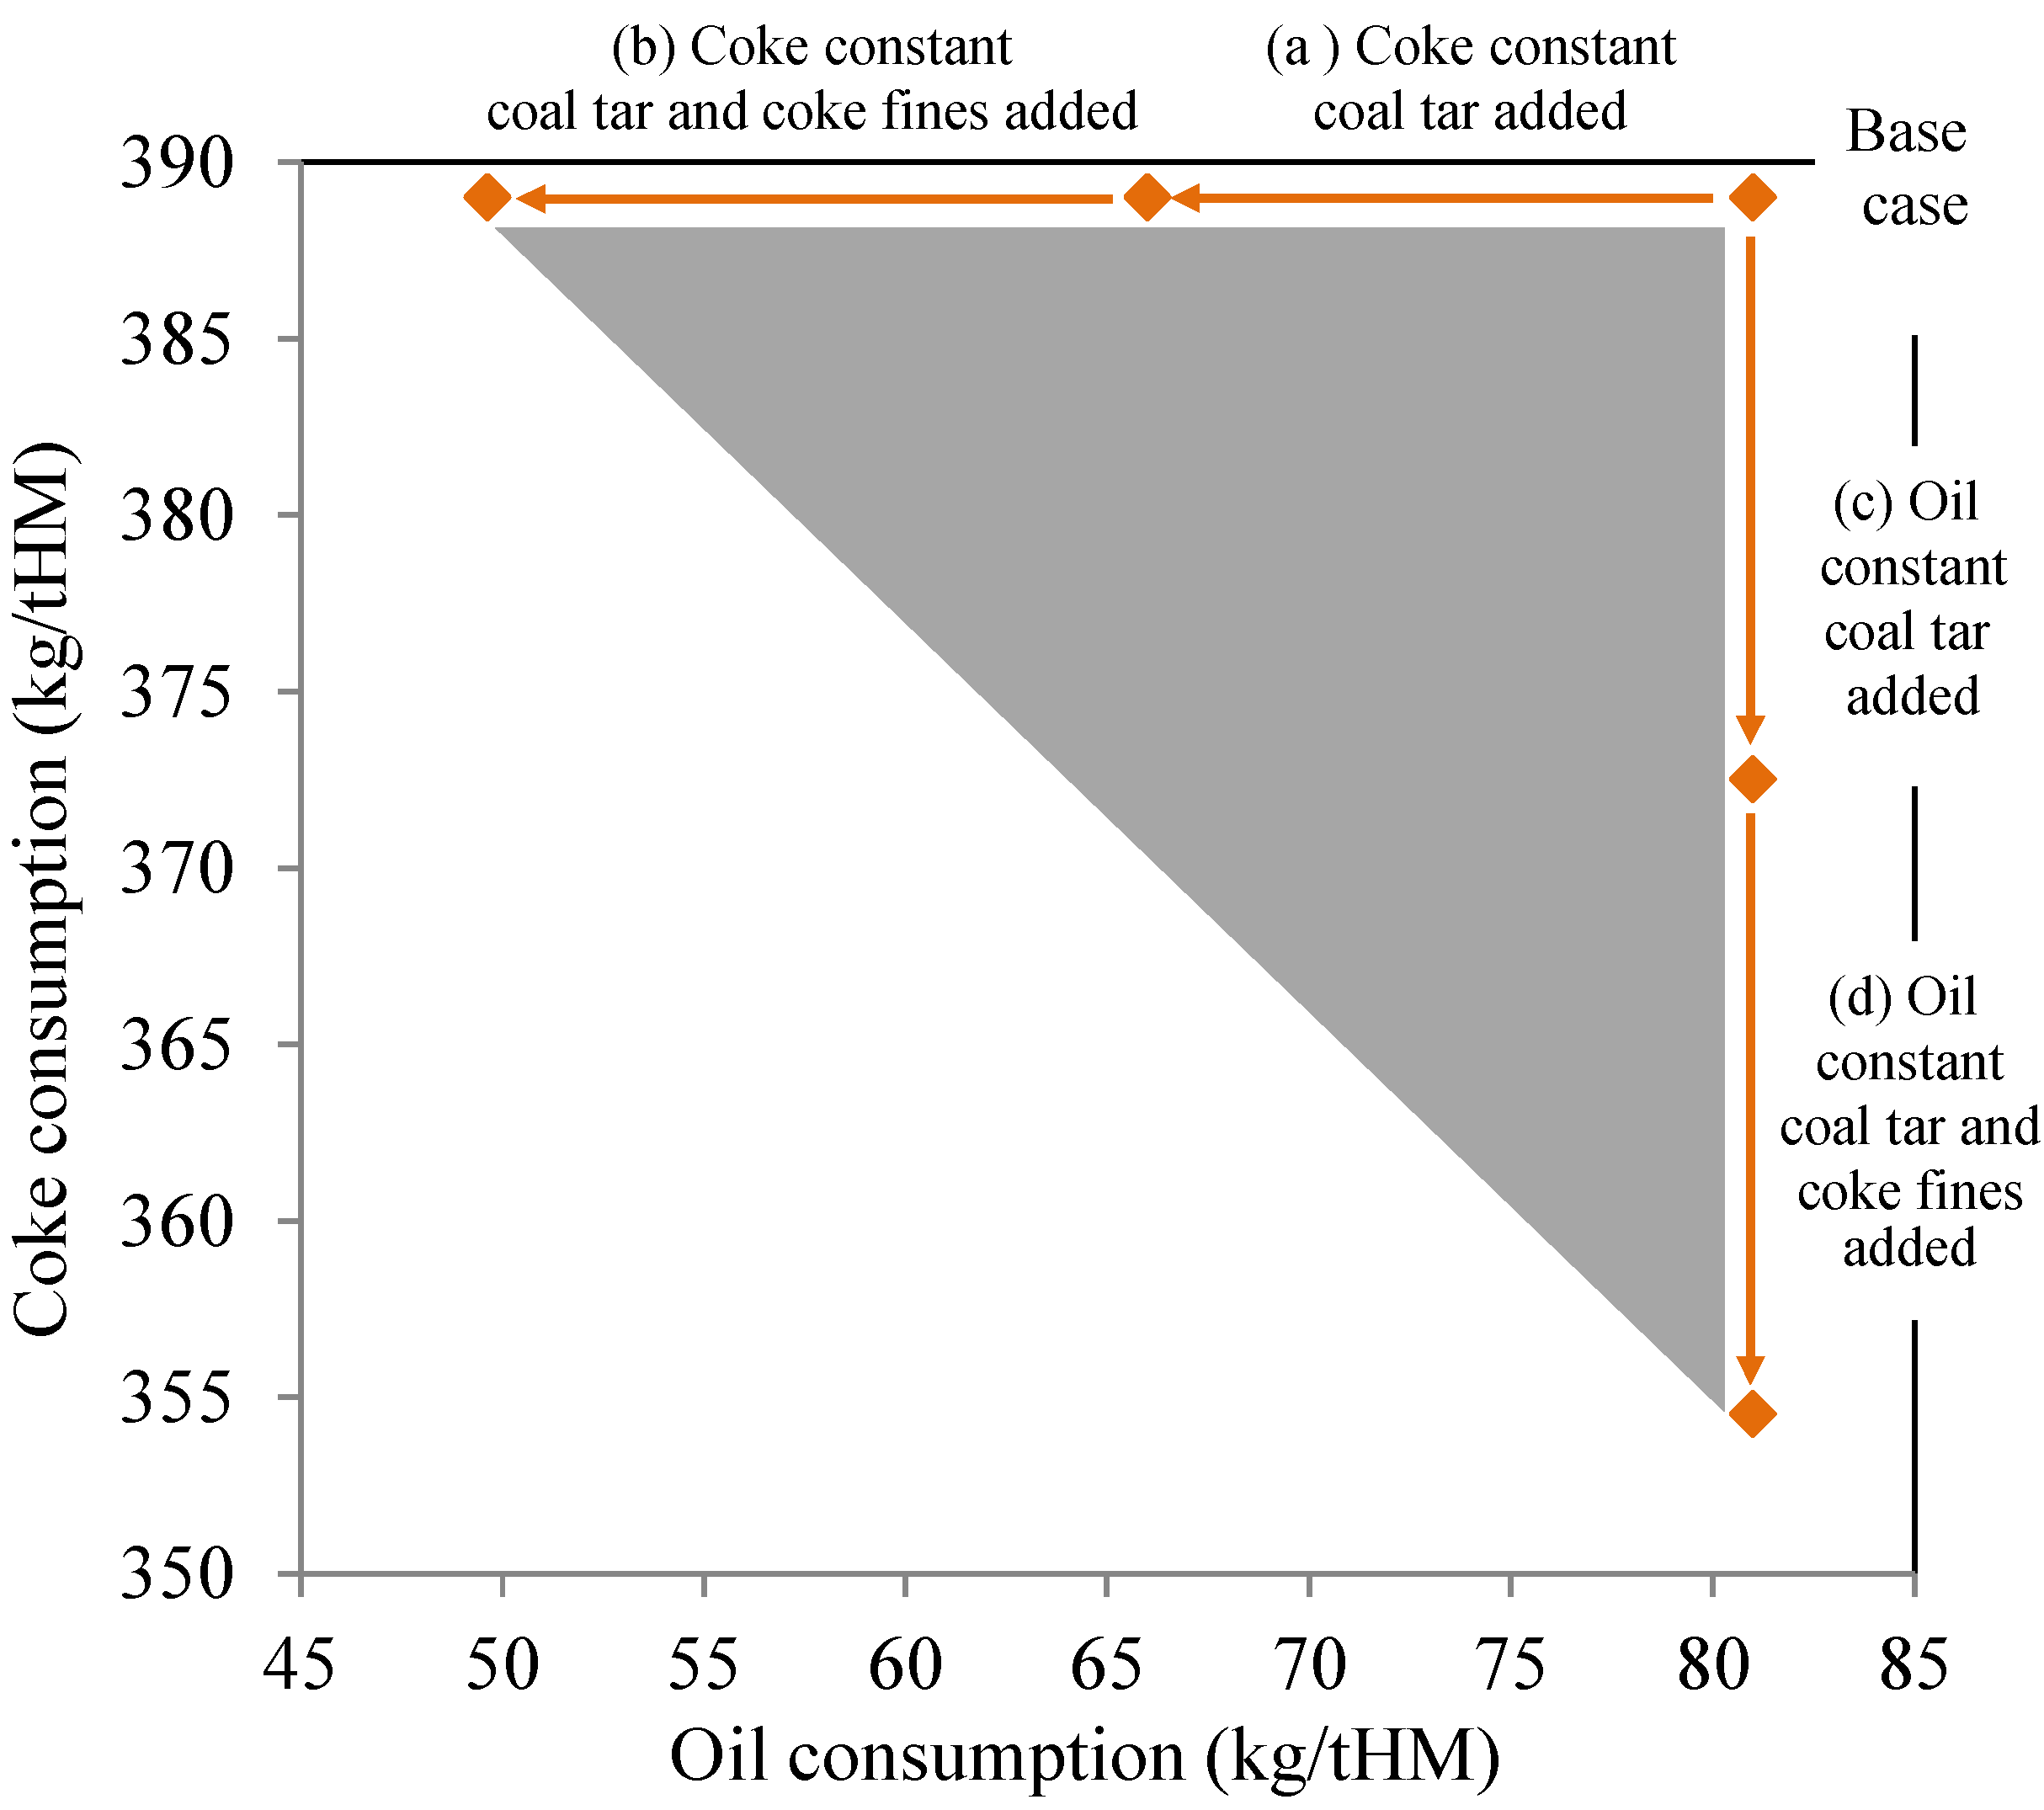
3.4. Blast Furnace Reducing Agent Consumption
| Reducing agent use scenario | Coal tar (kg/tHM) | Coke fines (kg/tHM) | Oil (kg/tHM) | Coke (kg/tHM) | Total (kg/tHM) | Coke (t/a) | IRRA-% |
|---|---|---|---|---|---|---|---|
| Base scenario | 0.00 | 0.00 | 81 | 389 | 470 | 778,000 | 0.00 |
| Coal tar added | 15 | 0.00 | 81 | 373 | 469 | 745,000 | 3.2 |
| Coal tar and coke fines added | 15 | 20 | 81 | 355 | 471 | 709,000 | 7.4 |
| Reducing agent use scenario | Coal tar (kg/tHM) | Coke fines (kg/tHM) | Oil (kg/tHM) | Coke (kg/tHM) | Total (kg/tHM) | Oil (t/a) | IRRA-% |
|---|---|---|---|---|---|---|---|
| Base scenario | 0.00 | - | 81 | 389 | 470 | 162,000 | 0.00 |
| Coal tar added | 15 | - | 66 | 389 | 470 | 132,000 | 3.2 |
| Coal tar and coke fines added | 15 | 20 | 49.6 | 389 | 474 | 99,300 | 7.4 |
3.5. Direct and Indirect Impacts of Recycling Solid Coking Plant By-Products inside Steel Plant System
4. Conclusions
Acknowledgments
References and Notes
- World Steel Association, Steel Statistical Yearbook 2012; World Steel Association: Brussels, Belgium, 2012; Available online: http://www.worldsteel.org/dms/internetDocumentList/bookshop/Steel-Statistical-Yearbook-2012/document/Steel%20Statistical%20Yearbook%202012.pdf (accessed on 5 January 2013).
- Das, B.; Prakash, S.; Reddy, P.S.R.; Misra, V.N. An overview of utilization of slag and sludge from steel industries. Resour. Conserv. Recycl. 2007, 50, 40–57. [Google Scholar]
- Shatokha, V.I.; Gogenko, O.O.; Kripak, S.M. Utilising of the oiled rolling mills scale in iron ore sintering process. Resour. Conserv. Recycl. 2011, 55, 435–440. [Google Scholar]
- Singh, M.; Björkman, B. Effect of processing parameters on the swelling behaviour of cement-bonded briquettes. ISIJ Int. 2004, 44, 59–68. [Google Scholar] [CrossRef]
- Doronin, I.E.; Svyazhin, A.G. Commercial methods of recycling dust from steelmaking. Metallurgist 2011, 54, 673–681. [Google Scholar] [CrossRef]
- Remus, R.; Aguado Monsonet, M.A.; Roudier, S.; Sancho, L.D. Best Available Techniques (BAT) Reference Document for Iron and Steel Production: Industrial Emissions Directive 2010/75/EU (Integrated Pollution Prevention and Control); Publications Office of the European Union: Luxembourg, 2013. [Google Scholar]
- Yabe, S.; Iba, T.; Miyazaki, T.; Satoh, K.; Kojima, M.; Aminaga, Y. COM and CTM injection into all tuyeres of Kashima No.3 blast furnace. Ironmak. Proc. Metall. Soc. AIME 1983, 42, 541–547. [Google Scholar]
- Makkonen, H.T.; Heino, J.; Laitila, L.; Hiltunen, A.; Pöyliö, E.; Härkki, J. Optimisation of steel plant recycling in Finland: Dusts, scales and sludge. Resour. Conserv. Recycl. 2002, 35, 77–84. [Google Scholar] [CrossRef]
- Diemer, P.; Killich, H.J.; Knop, K.; Lüngen, H.B.; Reinke, M.; Schmöle, P. Potentials for utilization of coke oven gas in integrated iron and steel works. In Second International Meeting on Ironmaking; First International Symposium on Iron Ore: Espírito Santo, Brazil, 2004. [Google Scholar]
- Babich, A.; Senk, D.; Fernandez, M. Charcoal behavior by its injection into the modern blast furnace. ISIJ Int. 2010, 50, 81–88. [Google Scholar] [CrossRef]
- Andahazy, D.; Slaby, S.; Löffler, G.; Winter, F.; Feilmayr, C.; Bürgler, T. Governing processes of gas and oil injection into the blast furnace. ISIJ Int. 2006, 46, 496–502. [Google Scholar]
- Parikh, J.; Channiwala, S.A.; Ghosal, G.K. A correlation for calculating HHV from proximate analysis of solid fuels. Fuel. 2005, 84, 487–494. [Google Scholar] [CrossRef]
- Geerdes, M.; Toxopeus, H.; van der Vliet, C. Modern Blast Furnace Ironmaking—An Introduction, 2nd ed; IOS Press: Amsterdam, The Netherlands, 2009; pp. 47–57. [Google Scholar]
- Ariyama, T.; Murai, R.; Ishii, J.; Sato, M. Reduction of CO2 emissions from integrated steel works and its subjects for a future study. ISIJ Int. 2005, 45, 1371–1378. [Google Scholar] [CrossRef]
- Ruukki Web Page. Environmental Data Monitor. Available online: http://www.ruukki.com/Corporate-responsibility/Environment/Environmental-data-monitor (accessed on 5 January 2013).
- Kinnunen, K.; Paananen, T.; Lilja, J. Modelling and simulation of Blast Furnace Process for switch from Sinter to Pellet Operation. In Proceedings of 4th International Conference on Modelling and Simulation of Metallurgical Processes in Steelmaking, Düsseldorf, Germany, 27 June–1 July 2011.
- Salo, A. The Viscosity Measurements of Blast Furnace Injectants [in Finnish]. Master’s Thesis, University of Oulu, Oulu, Finland, 5 April 2012. [Google Scholar]
- Mertdogan, A.; Marlin, L.A.; Beaucair, V.D.; Jansto, S.G. Production and use of coal-oil mixture as blast furnace auxiliary fuel. Ironmak. Proc. Metall. Soc. AIME 1983, 42, 593–606. [Google Scholar]
- It is assumed that all the carbon entering to blast furnace is transformed into CO2. In practice hot metal has C-content of 4.5%, which is decreased close to zero in basic oxygen furnace. Carbon content of coke, oil, coal tar and coke fines are assumed to be 88%, 87%, 88% and 87% respectively.
- Esteban, L.S.; Carrasco, J.E. Evaluation of different strategies for pulverization of forest biomasses. Powder Technol. 2006, 166, 139–151. [Google Scholar] [CrossRef]
- The average Finnish emission factor for electricity is 210 kg/MWh.
- Ditsele, O.; Awuah-Offei, K. Effect of mine characteristics on life cycle impacts of US surface coal mining. Int. J. Life Cycle Assess. 2012, 17, 287–294. [Google Scholar] [CrossRef]
- Mangena, S.J.; Brent, A.C. Application of a Life Cycle Impact Assessment framework to evaluate and compare environmental performances with economic values of supplied coal products. J. Clean. Prod. 2006, 14, 1071–1084. [Google Scholar] [CrossRef]
- Wikström, J.O.; Grip, G.E.; Larsson, M.; Ångström, S. Ways to Reduce CO2 Emissions at SSAB Luleå Works. In Proceedings of 2nd International Conference on New Developments in Metallurgical Process Technology, Riva del Garda, Italy, 19–21 September 2004.
- Seppälä, J.; Koskela, S.; Melanen, M.; Palperi, M. The Finnish metals industry and the environment. Resour. Conserv. Recycl. 2002, 35, 61–76. [Google Scholar] [CrossRef]
© 2013 by the authors; licensee MDPI, Basel, Switzerland. This article is an open access article distributed under the terms and conditions of the Creative Commons Attribution license (http://creativecommons.org/licenses/by/3.0/).
Share and Cite
Suopajärvi, H.; Salo, A.; Paananen, T.; Mattila, R.; Fabritius, T. Recycling of Coking Plant Residues in a Finnish Steelworks—Laboratory Study and Replacement Ratio Calculation. Resources 2013, 2, 58-72. https://doi.org/10.3390/resources2020058
Suopajärvi H, Salo A, Paananen T, Mattila R, Fabritius T. Recycling of Coking Plant Residues in a Finnish Steelworks—Laboratory Study and Replacement Ratio Calculation. Resources. 2013; 2(2):58-72. https://doi.org/10.3390/resources2020058
Chicago/Turabian StyleSuopajärvi, Hannu, Antti Salo, Timo Paananen, Riku Mattila, and Timo Fabritius. 2013. "Recycling of Coking Plant Residues in a Finnish Steelworks—Laboratory Study and Replacement Ratio Calculation" Resources 2, no. 2: 58-72. https://doi.org/10.3390/resources2020058