1. Dematerialisation and MIPS
About 20 years ago, one of the authors of this article had the opportunity of breathing in the air of the Wuppertal Institute hallways and meeting rooms. It was an exciting time of discovery, when the writings and words of Friedrich Schmidt-Bleek inspired an original approach to the environmental sustainability problem, which we will call the “material flows” or “dematerialisation” approach. One of the main concepts in this approach is Material Input per Service unit (MIPS), which connects the social benefits deriving from products used and the extraction of materials required in order to realise the products [
1]. The latter quantity is seen in this approach as the main target for sustainability policy, as it represents the potential of human activity in disrupting the natural environment.
From our ecological economists’ point of view, several fundamental reflections converge to support the dematerialisation prescription, i.e., the idea that without a drastic diminution in use of natural resources for generating material wealth by technical means, it will not be possible to attain sustainability. The dematerialisation approach straightforwardly applies the precaution principle and throughout draws upon the consequences of the lessons taught by Kenneth Boulding, Nicholas Georgescu-Roegen, William Kapp and the other fathers of scientifically sound thinking about the relations between the physical (natural) environment and the socio-economic system, as well as Herbert Simon’s bounded rationality.
In the last two decades, this paradigm has been developed to reach great maturity and complexity. However, disappointingly to those who participated in developing the approach, this conceptual revolution still has to be fully understood and—more importantly—adopted in the policy-making process. The material flows approach influence on European policy has no doubt been essential. Nevertheless, its champions have not succeeded in radically changing the dominant point of view. Policy has so far only marginally adopted the tools offered by this school of thought.
The dematerialisation approach, indeed, is normative in its very nature, as it is intended to guide action aimed at giving a structural answer to the ecological crisis. This structural solution is based on acknowledging the deep connection between the two ends of the stream of the materials flowing through the socio-economic process. These two ends—the removal of material resources from their natural sites on the one hand, and the restitution to nature of transformed matter on the other hand—are actually two sides of the same coin. Indeed, the use of material resources plays a crucial role in the generation of environmental pressures, not only because pressures are caused immediately by primary activities (agricultural biomass cultivation, timber extraction from forests, minerals extraction) but also, and mainly, because the use of materials is a prerequisite for air and water emissions and other dissipative flows, i.e., for the environmental pressures that consist in materials released into the natural environment, as well as for land occupation by invasive man-made structures such as communication and transport infrastructures, plants, buildings and landfills. Ultimately, any pressure on the natural environment and human health presumes the extraction of materials and transformation.
No matter how different the materials are before and after transformation, the overall quantity of the materials given back to nature is nearly equal to the quantity taken, at least in the medium run. As long as the input of materials into the socio-economic process is not reduced in its overall quantity, problems can only be transferred from one matter’s “exit” point to another—
i.e., between environmental media, points in time, and places—but not prevented in general [
2].
Until just a short while ago, emissions seemed to be practically the sole focus of environmental policy. Whatever attention had been devoted to material inputs before the MIPS concept was developed, it had been mostly in connection to the scarcity of natural resources—an exquisitely economic issue, not an environmental one—and even scarcity had not been considered to be worthy of too much reflection, as long as substitutes could be found for the scarce or unavailable materials.
The conceptual and normative separation of residuals from resource use and the imbalance of attention in favour of end-of-pipe pressures have made structural solutions to the environmental sustainability problem hard to conceive, let alone put into practice.
In conclusion, the quantity of materials taken from nature by humans must be reduced as a whole. Within this reduction, sustainability may be pursued more or less efficiently, but it will be no mean feat if active dematerialisation policies are not in place.
Among the material flows school tenets, a couple of them must certainly be examined here. These are formulated with reference to individual products, but they can be extended, by analogy or aggregation, to economic systems.
One tenet is about
efficiency of the use of materials in human needs fulfilment. Pursuing efficiency is part of the dematerialisation programme, as it is supposed to be for any sensible normative programme aimed at sustainability. However, efficiency is not defined in the MIPS approach, as opposed to standard (economic) thinking, in relation to a product’s market value. Instead, any given product’s material requirement must be seen in relation to the services that the product delivers throughout its lifetime. It does not matter how little material goods require or how much money they are worth, if they can be used only once: another product may satisfy the same needs and be used several times, and therefore be more efficient. Indeed, even if it requires more resources and has a lower value, it may employ fewer materials
per service unit. Goods are seen as
service-delivery machines [
1], and should be evaluated as such. We will not dwell further on this fundamental aspect, as our article here deals with other aspects. It is enough here to underline that monetary value is a rather poor and often misleading representation of the social benefits actually deriving from products. Monetary value is, as a matter of fact, faintly and ambiguously related to service units.
Another dematerialization school tenet is that, in order to evaluate a product’s sustainability, it is always necessary to consider all the materials used during the whole production process chain, and not just at the final product weight. It does not matter that goods are light and will eventually create little waste if in their entire manufacturing process a lot of residues (emissions, waste,
etc.) have been produced. We may refer to this as the “life-cycle principle”. A corollary of this principle is that, since sustainability is basically a global long-run issue, policies, even when implemented at the local level, must contribute to easing the burden on the earth as a whole and in a lasting way. “On the earth as a whole” means that transferring problems from one country to another does not belong to true dematerialisation. Problems are only moved, but not lessened. For example, this happens whenever production delocalisation takes place and goods formerly produced in country A are subsequently produced in country B and then imported into country A anyway. So, even if country A has no more waste and emissions directly deriving from that good’s production, country B does in its place [
3].
2. MIPS and Resource Productivity
To be sure, the calculation of indicators based on the MIPS concept is still an open issue under many respects. The main difficulty is about the definition of service units. Services and service units may be well defined and measurable at the level of individual products. It is much more difficult to think of them as aggregates at the level of the entire economy or even at the level of industries. The lack of suitable aggregate indicators may be a simple reason why MIPS is not explicitly and widely used in policy-making, in which one mainly refers to macro and industry level indicators.
Among the currently popular policy-relevant concepts, the nearest one to MIPS is that of Resource Productivity (RP), which points to the efficiency with which materials are used in production. This normative concept currently guides some important policy-making processes, especially at the European level and in Japan where it is used in the Resource Conservation Policy [
4]. The RP concept may be made operational in a number of ways [
5]. It is defined within the EU Sustainable Development Strategy as the ratio between Gross Domestic Product (GDP) and Domestic Material Consumption (DMC) [
6]. This ratio and its changes through time are meant to provide a clear indication of economic growth’s decoupling from material resource use. In particular, it is the headline indicator for the Sustainable Consumption and Production (SCP) theme. This is encouraging, because the traditional separation, between the environmental consequences of the use of materials on the one hand, and resource scarcity on the other, tends to be overcome in this context. Indeed, by definition the SCP theme looks at the entire economic life cycle of goods and services. Material flows are looked at in their indivisible unity from source (cradle) to end-of-pipe emissions or waste (grave).
Lately, RP has garnered more and more attention as the focus is currently shifting towards natural resources. One of the seven flagship initiatives within the “
Europe 2020 Strategy for Smart, Sustainable and Inclusive Growth” is devoted to reaching “
A resource-efficient Europe” [
7]. This initiative provides the current framework for EU resource policies. It also is in line with the recent proposal by the European Commission concerning the new environment action programme entitled “
Living well, within the limits of our planet” [
8].
However, the RP concept falls significantly short of the MIPS idea, as it violates the first essential tenet of the dematerialisation school highlighted above; while the indicator adopted in the EU to represent the concept violates the second tenet.
As for the RP
concept, it evaluates efficiency considering production’s monetary value as the policy goal to be pursued. Indeed, this concept stems from a mechanical extension of the usual economic productivity concepts. As such, under a well-being beyond-GDP perspective [
9], its adequateness in face of the present world’s policy challenges may be questioned [
10]. Although the present paper focuses mainly on specific issues concerning the measurement of RP, it is important, before going into technicalities, to stress this general limit of the RP concept—which clearly emerges by comparing it with the MIPS concept—as this limit defines the framework within which the issues we tackle are relevant. As for the European RP
indicator, besides sharing the RP concept’s philosophy, it lacks a great deal in life-cycle perspective, at least in the way it is currently defined. The good news is that the latter shortcoming can be corrected. As a matter of fact, this paper’s main purpose is to show and discuss one possible correction. This can fill RP’s main inadequacy with respect to the environmental pressure transfer issue,
i.e., the transferring abroad of the environmental burden (the material flows), due to the changing international division of labour.
To be precise, compared to MIPS, the RP indicator that has so far been used in EU policies has another major drawback too: the so-called unused materials are not considered at all in its numerator (other categories covered by the MIPS concept,
i.e., air, water and mechanical earth movement or erosion [
11] are beyond the scope of the RP indicator we refer to). The evidence shows that the unused material flows volume is as important as the flow volume of the used ones. Moreover, the unused-to-used ratios tend inevitably to increase, as the best (high-concentration of usable materials—easy accessibility) reserves are usually exploited first. In the present paper we do not deal with this issue, because the possible solutions to RP’s lack in life-cycle perspective that we want to discuss are those currently under consideration within the European statistical system and research institutions. These are based on the concept of “Raw Material Equivalents”, which we will deal with at length below, and this concept excludes unused extraction. However, at a later stage, this aspect should also be tackled. With regards to the Italian case, which we analyse in
Section 4, introducing the flows of unused materials in the picture could only strengthen the conclusion that Italy’s efficiency in natural resource use is in reality lower than it appears when considering only GDP/DMC, because Italy imports the majority of products that imply huge unused material flows,
i.e., metal ores.
3. Use and Misuse of DMC
Knowing about material resources’ used amounts, their quality (material type), their origin (place of extraction), and their use (different final demands satisfied and products satisfying them), is useful for the dematerialization approach to steer the system towards a less unsustainable path. Measuring natural resource inputs to socio-economic metabolism is therefore essential to the “material flows” research programme. Indeed, many efforts of those who have contributed to this development have followed this lead. In this respect, Economy-Wide Material Flow Accounting’s (EW-MFA) adoption in official statistics, especially in the EU, has undoubtedly been one of the successes of this school of thought [
12,
13]. However, as a consequence of dematerialisation’s imperfect reception, this success has also been partial.
The normative relevance of dematerialisation with respect to the environmental and sustainability issues has often been unnecessarily overstretched and mechanically transposed to EW-MFA-based aggregate indicators, up to the point of considering them as good proxies for the stress (pressures) actually put on the natural environment. At the opposite end, the very significance, in environmental terms, of the mass-balance-based metrics has equally often been questioned, by emphasising the importance of the quality and handling methods of materials [
14]. This results in an irrational and counterproductive opposition between dematerialisation on the one hand and control of specific materials or substances on the other hand, when these two objectives should in reality be recognised as mutually reinforcing parts of a unitary strategy.
EW-MFA provides a whole family of holistic material throughput indicators. Each indicator has its own characteristics and properties, and is therefore suited for representing different concepts [
5,
15]. At the moment the most used indicator is DMC, adopted, as seen above, by the EU for RP’s calculation. DMC is calculated as the sum of Domestic Extraction (DE) and the Physical Trade Balance (PTB). The latter represents the net material inputs coming from abroad, being given by the difference between imports and exports, both expressed in physical terms (tonnes per year). The material resources physically embodied in exported products are therefore explicitly excluded from DMC. This makes it a doubtful measure for a country’s overall material resource needs.
Indeed, the material resources included in a country’s DMC correspond neither to those required for generating that country’s GDP, nor to those physically embodied in the products whose value is measured by that GDP. This is the case for whichever relevant National Accounting monetary aggregate one may want to take into account: total end uses (consumption plus investments plus exports), domestic end uses (consumption plus investments), end uses of domestic production (the part of total end uses coming from domestic production), and domestic end uses of domestic production.
Another way to describe this shortcoming is to say that DMC is not neutral to the localisation of activities but is distorted by the environmental pressure transfer issue described above. This is due to its components’ inherent asymmetry: while DE is measured in tonnes of raw materials actually extracted, trade data are measured in tonnes of product weight crossing the border. The upstream indirect material flows of traded products, also referred to as the “ecological rucksack” [
1], are not included in the picture. As a consequence DMC falls when—
ceteris paribus—a country’s activity mix changes in favour of activities at the production chain’s end.
This is especially relevant for metals. While the DE records gross ores, the trade data include concentrates, refined metals and metal products. This makes a big difference, since a lot of matter is removed from the ores to get concentrates (waste from metal refinement), and then refined metals. Moreover, the energy materials burnt in the transformation processes (ending up in air emissions), are not included in the traded products. In general, traded products are more processed—sometimes much more—than the natural resources they derive from, and they leave behind residual matter. The bulk of the residue is generated in the first transformation phases, which therefore tend to be located near the extraction sites so that transport costs are minimised.
It is no wonder, therefore, that resource-poor countries, some of which are big importers not only of raw materials but also of intermediate and final products, tend to rank high in RP. Symmetrically, the use of DMC for RP’s calculation disadvantages resource-rich countries in which the initial and most waste- and pollution-intensive transformation phases take place. It should also be noted that the importance of foreign trade—and consequently indirect flows—is ever growing:
“Recent studies conducted for the EU and its Member States, the USA and Japan [...] have shown that an increasing share of resource requirement and associated environmental burden is shifted abroad. The resource requirement of national economies is thus systematically and to an increasing extent underestimated”.
It may well be, given these premises, that a country’s observed RP high level or growing trend be in part or even totally the result of its changing production structure,
i.e., of a drift towards the final stages of product transformation or even of a giving up the production of goods (deindustrialisation and delocalisation such as those seen in the UK and ongoing in Italy). As Steinberger and Krausmann [
17] show, RP—measured as GDP output per resource input—is to a significant extent correlated with income, which is what one would expect as a consequence.
All this should by no means lead us to refrain from using DMC, but only from using it uncritically and to be aware of its limitations as a resource use indicator. DMC has, on the contrary, an important meaning which should be acknowledged, and to which reference should always be made when using it. First, let us draw a distinction between the environmental pressures that the human system exerts at the material input side—i.e., those immediately due to resources extraction—on the one hand, and those it exerts at the material output side—i.e., those immediately connected to the form taken by the materials at the end of the annual production and consumption cycles—on the other hand. If we look at the materials’ economic cycle from the latter perspective, we see that DMC is equal to the sum of net addition to stocks, emissions and wastes, products’ dissipative uses and dissipative losses. In other words, DMC comprises all the used materials that contribute to a country’s environmental pressures on the material output side, regardless of whether the materials were extracted domestically or imported. It is important not to be misled with regards to DMC’s meaning by the way it is calculated. This quantity’s real meaning, in fact, is connected to the output side even if it is calculated as a sum of inputs. This connection of the two sides is granted by the law of matter conservation.
For these reasons, DMC would be more correctly interpreted as a holistic potential pressure indicator than as a resource use indicator, even though the latter interpretation currently prevails. Using the GDP/DMC ratio in a sustainability monitoring context is not at all wrong in itself, but it is not appropriate to call it an RP indicator. Rather it should be called something along the lines of “productivity of potential pollution”.
4. Evidence from the Italian Case. To What Extent is Italy Dematerializing?
4.1. Some Context and Trend Figures
In 2008, in the entire world, used materials flows reached 68.1 billion tonnes, with a 79% increase with respect to 1980. Resource consumption was about 10 tonnes per capita, 1.6 tonnes more than in 1980. Large differences exist between world regions: the proportion between those with the highest and lowest material consumption is 11 to 1. Extraction nearly doubled from 1980 in Africa, Latin America and Australia; Europe is the biggest net importer of materials, while Asia extracts, exports, imports and consumes around half of all materials used in the world. At the same time, more and more economic output has been produced per unit of materials used. Between 1980 and 2000, income grew faster than material extraction, but the decoupling was only relative and the global material productivity did not even double. Since 2000, indeed, material productivity is stagnating on a global level [
18].
Table 1 compares the 2000 RP (GDP/DMC) level for Italy and other countries with the 2009 level (2008 for non-EU countries). In the period considered, Italy holds the fourth rank as for RP level and features the best RP growth together with Japan and UK. With the exception of Japan, EU member states in
Table 1 perform generally better than non-EU countries. As pointed out above, this is not surprising, as Japan and most European countries are poor in natural resources. Besides this, the differences are due to the different economic dynamics: RP is influenced by the importance of services and construction sectors, by the industrial structure, by consumption levels and patterns, by the kind of energy sources used in the country, and many other factors.
Table 1.
Resource Productivity (Gross Domestic Property/Domestic Material Consumption) in selected EU and non-EU countries, 2000 and 2008 or 2009 (GDP in 2011 US$ converted to 2011 price level with updated 2005 EKS PPPs per kg DMC).
Table 1.
Resource Productivity (Gross Domestic Property/Domestic Material Consumption) in selected EU and non-EU countries, 2000 and 2008 or 2009 (GDP in 2011 US$ converted to 2011 price level with updated 2005 EKS PPPs per kg DMC).
| Countries | 2000 | 2008 or 2009 | 2008 or 2009/2000 |
|---|
| EU countries | EU27 | 1.83 | 2.15 | 1.17 |
| France | 2.31 | 2.81 | 1.21 |
| Germany | 1.96 | 2.43 | 1.24 |
| Italy | 1.98 | 2.74 | 1.38 |
| Spain | 1.75 | 2.24 | 1.28 |
| United Kingdom | 2.73 | 3.70 | 1.36 |
| non-EU countries | Australia* | 0.75 | 0.95 | 1.27 |
| Canada* | 1.37 | 1.71 | 1.24 |
| Chile* | 0.32 | 0.34 | 1.07 |
| Japan* | 2.37 | 3.28 | 1.38 |
| Mexico* | 1.20 | 1.30 | 1.08 |
| New Zealand* | 0.85 | 1.03 | 1.21 |
| OECD average* | 1.64 | 1.92 | 1.17 |
| South Korea* | 1.41 | 1.80 | 1.28 |
| United States* | 1.60 | 1.89 | 1.18 |
A rather important comparison is the one between RP and Labour Productivity (LP) dynamics. Indeed, if the labour input does not change, in order to have absolute decoupling of GDP from DMC (
i.e., decreasing DMC notwithstanding economic growth), RP must grow more quickly than LP [
10].
Table 2 compares the Italian Labour, Energy and Resource Productivities in the 1991–2010 period. Italy’s long-term RP rising trend is confirmed. The rise of RP as represented by GDP/DMC has been indeed much faster than the rise of Labour Productivity and of Energy Productivity.
Table 2.
Resource, Labour and Energy Productivity in Italy, 1991–2010 (GDP in chain-linked volumes, reference year 2005). Indexes 2000 = 100.
Table 2.
Resource, Labour and Energy Productivity in Italy, 1991–2010 (GDP in chain-linked volumes, reference year 2005). Indexes 2000 = 100.
| Productivity | 1991 | 1995 | 2000 | 2005 | 2010 |
|---|
| Labour (a) | 85.7 | 96.0 | 100 | 100.8 | 100.8 |
| Energy (b) | 98.2 | 99.4 | 100 | 97.7 | 104.6 |
| Resource (c) | 95.9 | 109.5 | 100 | 114.8 | 143.6 |
What these indicators seem to show is that Italy is moving in the right direction, in line with “
the need to put a drastic increase in natural resource use efficiency among the primary societal goals, and to assign a very high priority level to this goal, even higher than that currently attached to Labour Productivity’s growth” [
10]. However, if more comprehensive indicators of a country’s resource use are adopted, Italy’s RP proves neither to be as high as it seems, nor to grow as fast as it seems.
4.2. Indicators in Raw Material Equivalents
In order to derive more comprehensive material use and RP measures, overcoming the environmental burden transferring issue, it is necessary to introduce into the picture the raw materials extracted abroad in order to satisfy the demand for imported products. On this point, let us quote the EU Commission:
“It is recognised […] that over time a better candidate than DMC could be found. For this purpose the Commission estimates that monitoring material use in Raw Material Equivalents would be appropriate as is done for the Raw Material Consumption indicator.”.
Indicators in Raw Material Equivalents (RME) [
15] express imports and exports in terms of the virgin materials that it is necessary to extract from the natural environment in order to produce the traded goods and services. Such indicators are not affected by DMC components’ asymmetry and therefore do not suffer from the consequent methodological inconsistency. A product’s RME indicates the raw materials needed throughout that product’s entire production chain. The materials required are included in the RME irrespective of whether they were extracted from the domestic environment or from the rest of the world environment. Also, it does not matter where the materials used to realise an imported product reach their final state: whether they become waste or emissions abroad or are incorporated into the product, they “belong” to the product and “follow” it as it passes from one economy to another. This approach allows focussing on a much more complete subset of the potential environmental pressures associated to a country’s final purchases, by including waste and emission flows generated abroad from used extraction, to the extent that they are functional to national final consumption expenditure, gross capital formation and exports.
We calculate indirect material resource use associated with imports, exports and final domestic uses, and then EW-MFA indicators in RME, on the basis of a model whose ongoing development is promoted by Eurostat [
21]. This model consists of a hybrid Input-Output (I-O) application, carried out using conveniently detailed I-O tables of the EU-27, integrated with physical data on metal imports indirect flows. As for the Italian application, imports in RME are calculated by using the average EU coefficients provided by this model, using the import or export coefficients from the Eurostat model according to the affinity between the Italian and the EU trade patterns. Italian imports are split into their intra-EU and extra-EU components, and EU level import coefficients are applied in the RME estimation for the Italian extra-EU trade, while EU level export coefficients are applied in the RME estimation for the Italian intra-EU trade [
21]. Exports and other Italian final uses’ RME are estimated by a subsequent modelling application based on Italian I-O tables (59 × 59 product groups), made hybrid on the basis of Eurostat’s methodology [
21] which has been conveniently integrated by using additional data such as physical energy accounts and Material Flow Accounts. This approach provides a methodologically advanced and suitable answer to the shortcomings of the Domestic Technology Approach, usually adopted for indirect flows calculations, e.g., in the so-called carbon footprint context. See for instance [
22], where the effects of production displacement on GHG emissions are studied by means of an IO application.
The RME of domestic final uses,
i.e., Raw Material Consumption (RMC), and Exports’ RME, refer to “vertically integrated” activities. The notion of vertical integration, explained by Pasinetti in 1973 [
23], greatly fits the MIPS perspective. It refers, for any given product, to the set of all the activities that are directly and indirectly necessary to obtain the output delivered to final demand. The focus is for each product delivered to final uses on the whole production cycle behind it. The vertically integrated activities from which the individual final products stem are broad process chains, which include all of the production system. Therefore, although vertically integrated activities take their names from the respective final products, they are very different from the “standard” activities by the same names. In fact, each of them is an ideal collection of very diverse activities. Each of the vertically integrated activities resulting from the application of the model is completely autonomous (disjointed) from the rest of the production system, since it encompasses all the phases of the production cycle, starting with the extraction of virgin materials from nature and ending with the final products, through the production of all intermediate inputs, including all ancillary activities connected to commodity transformation and service production. The total raw material equivalents of the vertically integrated products are calculated by cumulating the direct resource requirements of all parts of the economy contributing to the final result. They are not directly observable but result from a hypothetical reattribution to final products of direct resource requirements. In order to calculate final uses’ total flows through the environmentally extended Leontief model [
24], it is necessary to know the quantity of materials directly extracted from the domestic or foreign environment. The production costs structure, the knowledge of which is also necessary for the application, is provided by national accounts’ monetary supply and use tables system.
According to the notion of vertical integration, as well as to the MIPS perspective, capital goods should not be considered final products. As for the capital goods produced in the reference year of the analysis, it should however be kept in mind when interpreting the results of RME applications like the one illustrated here that the material flows attributed to Gross Capital Formation represent current environmental costs for the future production of goods or the fruition of services. Correspondingly, the capital goods used during the reference year of the analysis should in principle be quantified (e.g., by taking amortization rates, or better physical wearing indicators) and then “reduced” to their raw material equivalents (possibly by using information on the techniques in use when they were produced). This should be done recursively, since in the past when the capital goods currently used were produced, not only natural resources but also other capital goods were requested in turn. Subsequently, the RMEs of the capital goods currently used, thus calculated, should be allocated to the individual goods and services currently delivered to final consumers and to current gross capital formation, according to the vertically integrated requirements in capital goods of the final demand. All this is—to the best of the author’s knowledge—never done in practice, and surely it is not done in RME calculations, including those presented in this paper. However, it is clear that the past environmental costs of current production are not represented in any way in RME estimates.
EW-MFA indicators for the Italian economy, expressed in RME, are synthetically shown in
Table 3, next to the corresponding ‘traditional’ indicators (including direct flows only). These indicators describe the material flows associated to different monetary aggregates.
Table 3.
Domestic and global resource use associated with Italian production and consumption, by materials origin and type, and by materials use purpose (final demand). Italy, 2000–2010 (million tonnes). ((a): Estimates based on aggregate data).
Table 3.
Domestic and global resource use associated with Italian production and consumption, by materials origin and type, and by materials use purpose (final demand). Italy, 2000–2010 (million tonnes). ((a): Estimates based on aggregate data).
| Aggregates | 2000 | 2001 | 2002 | 2003 | 2004 | 2005 | 2006 | 2007 | 2008 | 2009 | 2010 |
|---|
| Materials’ origin and type |
| Domestic natural environment (Direct Used Extraction) | 699.5 | 682.8 | 615.7 | 528.4 | 577.7 | 606.4 | 598.8 | 573.6 | 560.3 | 510.3 | 463.4 |
| Biomass | 138.2 | 131.5 | 134.3 | 116.3 | 138.4 | 140.2 | 126.3 | 122.4 | 124.2 | 117.2 | 115.2 |
| Metal ores | 0.4 | 0.2 | 0.3 | 0.2 | 0.0 | 0.0 | 0.0 | - | 0.7 | 0.3 | 0.7 |
| Non-metallic minerals | 543.8 | 536.0 | 465.2 | 396.4 | 423.0 | 449.9 | 458.1 | 437.5 | 422.7 | 381.2 | 334.6 |
| Fossil energy resources | 17.1 | 15.1 | 15.9 | 15.5 | 16.4 | 16.3 | 14.4 | 13.7 | 12.7 | 11.6 | 12.8 |
| Foreign natural environment (Imports in RME) | 737.5 | 745.0 | 745.3 | 751.6 | 756.1 | 747.1 | 804.0 | 833.3 | 789.5 | 661.4 | 765.3 |
| Biomass | 117.8 | 109.8 | 112.6 | 108.4 | 108.7 | 103.8 | 106.6 | 113.1 | 107.8 | 110.7 | 119.5 |
| Metal ores | 201.9 | 208.9 | 209.0 | 210.2 | 217.0 | 213.5 | 249.9 | 251.7 | 242.5 | 173.2 | 223.3 |
| Non-metallic minerals | 93.3 | 100.4 | 100.7 | 101.7 | 96.9 | 96.7 | 106.0 | 117.5 | 104.9 | 86.7 | 105.0 |
| Fossil energy resources | 324.5 | 325.9 | 322.9 | 331.3 | 333.5 | 333.2 | 341.4 | 351.0 | 334.4 | 290.9 | 317.6 |
| Total Input in RME (RMI) | 1437 | 1428 | 1361 | 1280 | 1334 | 1354 | 1403 | 1407 | 1350 | 1172 | 1229 |
| of which direct flows (DMI) | 1033.9 | 1018.3 | 955.4 | 877.6 | 943.8 | 973.4 | 980.1 | 957.3 | 929.4 | 822.6 | 808.2 |
| of which actually embodied in Imports (direct Imports) | 334.4 | 335.4 | 339.7 | 349.2 | 366.0 | 366.9 | 381.4 | 383.7 | 369.1 | 312.4 | 344.8 |
| Materials’ use purpose (final demand) |
| Raw Material Consumption (RMC) | 975.1 | 960.3 | 926.3 | 868.3 | 894.0 | 899.8 | 911.1 | 893.2 | 858.5 | 738.9(a) | 731.8(a) |
| Final consumption expenditure | 604.5 | 605.1 | 586.1 | 560.4 | 569.4 | 575.1 | 563.3 | 552.6 | 543.7 | | |
| • households | 547.7 | 543.4 | 526.0 | 502.3 | 510.6 | 514.4 | 503.8 | 493.7 | 484.0 | | |
| • government and non-profit organizations serving households | 56.8 | 61.7 | 60.1 | 58.2 | 58.8 | 60.8 | 59.5 | 58.9 | 59.8 | | |
| Gross capital formation | 370.6 | 355.3 | 340.3 | 307.8 | 324.6 | 324.7 | 347.8 | 340.6 | 314.7 | | |
| Exports in RME | 461.9 | 467.2 | 434.4 | 411.5 | 439.7 | 453.7 | 491.4 | 513.5 | 491.4 | 432.8(a) | 496.9(a) |
| RMC + EXPRME = RMI | 1437 | 1428 | 1361 | 1280 | 1334 | 1354 | 1403 | 1407 | 1350 | 1172(a) | 1229(a) |
| of which direct flows (DMC) | 910.2 | 890.6 | 832.3 | 751.3 | 810.1 | 833.0 | 836.7 | 796.7 | 773.2 | 689.5 | 657.2 |
| of which actually embodied in Exports (direct Exports) | 123.7 | 127.7 | 123.1 | 126.3 | 133.6 | 140.4 | 143.4 | 160.6 | 156.3 | 133.1 | 151.0 |
| Other indicators: |
| Physical trade balance | 210.7 | 207.8 | 216.6 | 222.9 | 232.4 | 226.5 | 237.9 | 223.1 | 212.9 | 179.3 | 193.8 |
| Physical trade balance in RME | 275.6 | 277.8 | 310.9 | 340.1 | 316.4 | 293.4 | 312.6 | 319.8 | 298.2 | 228.6(a) | 268.4(a) |
The indicators are presented in this table within a consistent and systematic origin-purpose framework, which allows for consideration of the relationships between different indicators. We can see in this table’s top and bottom halves, respectively:
Materials used to satisfy Italy’s final demand, by extraction, origin and kind of resources (the materials supply side). Imports in RME as reported here are, for each year, the synthesis of a table stemming from the application of the Eurostat coefficients mentioned above. The latter table, not shown here, includes the requirement of each of 52 materials by 166 distinct product groups (goods and services);
The same materials, re-attributed to their final use purpose (the materials ‘demand’ side). Final uses are classified here only by final demand category (final consumption expenditure, gross capital formation and exports) and not by product group. However, the model results’ dataset comprises, for each year, 59 product groups, and for each of these, 52 different materials. Moreover, for each material of each product group, the data are further split by origin of the virgin material (domestic or foreign). This side of the account stems from the reallocation of the materials in the supply side to final demand by category and of product, i.e., from the application of the Italian hybrid Leontievian I-O model.
As already pointed out, both sides of the account derive from a methodology whose development was promoted by Eurostat [
21].
4.3. Materials Extracted to Fulfil Italy’s Needs: Origin, Kind, Ultimate Demand Sources
The Italian DE clearly has a long term reduction trend. In 2010 it amounts to 463.4 million tonnes (Mt), recording a 33.8% fall from 2000. However, it is not clear how stable this trend is, because we are witnessing the temporary effects of the current profound crisis. As a matter of fact, this indicator has a very strong cyclic component [
25], so the choice of the beginning and ending years in an inter-temporal comparison is quite important. For instance, Eurostat estimates a rise of the Italian DE in 2011, up to 513.1 Mt, which is only 40 Mt lower than the 1994 level.
In 2000–2010 the composition of the Italian DE remains relatively unchanged. The main materials extracted and further used domestically are non-metallic minerals and biomass (around 75% and 22% of the total, respectively). Fossil energy carriers and metal ores represent on average only 2.6% of the total, and almost entirely consist of fossil energy resources. This composition of the DE is connected to Italy’s dependence from abroad on strategic resources like fossil fuels and metal ores. The latter, as highlighted above, entail the biggest indirect flows.
The materials actually embodied in Italian imports, on the whole, show the opposite trend. They have grown by 3.1% from 2000 to 2010, notwithstanding the current crisis. The rise was of almost 15% in 2007, when imports reached their highest peak (383.7 Mt). Due to its economy’s foreign dependence on the raw materials, Italy, like most European countries, is a net importer of natural resources. The extent of this imbalance between domestic supply and demand of natural resources is more clearly shown by the indicators expressed in RME.
The total of the resources used by the Italian economy are measured by the Raw Material Input (RMI) indicator, given by DE plus imports expressed in RME. The RMI indicator significantly decreases from 2000 to 2010 (minus 14.5%). This is exclusively due to the domestic component, while imports in RME show a rather opposite pattern. Their already significant share in RMI in 2000—approximately 50%—surged up to 62% in 2010. In 2000–2010, imports in RME grew by 3.8%. Over the entire period, metal ores and fossil energy resources constituted more than 70% of total Imports in RME. In 2010, about half of the biomass and almost one fourth of the non-metallic minerals required by the Italian economy was extracted abroad. Both these shares increase in 2000–2010. Metal ores and fossil energy resources are totally imported.
Table 3 also shows the Italian Physical Trade Balance, both of direct flows (PTB) and in RME (PTB
RME),
i.e., including the upstream indirect material flow ‘embodied’ in foreign trade. The latter aggregate is very important: the balance between imports in RME and exports in RME provides information on the role played by the country in the international resource extraction landscape. Indeed, the PTB
RME shows to what extent the material resources directly and indirectly used by a country are required for final products used within the country, or for goods and services exported to other economies. e.g., a positive PTB in RME means that the country has a “resource debt” towards the rest of the world.
Exports in RME follow roughly the same trend and cycle of Imports in RME, though at a lower level. The difference between the two indicators shows that, on average, around 300 Mt material resources are extracted abroad in order to satisfy the Italian domestic final demand which cannot be satisfied by using domestic natural resources.
The sum of DE and PTB
RME gives the RMC indicator. This indicator deserves special attention, as it is very often designated as DMC’s desired substitute, especially for use in the sustainability indicators context and for RP calculation [
26,
27].
The RMC indicator, shown in the bottom half of
Table 3, is derived from a Leontievian re-attribution of domestic and global resource extraction. The underlying I-O model provides a link between the final uses of products and economic production and consumption activities. This link is essential for embedding the material flow indicator into an appropriate environmental-economic analysis context. Only in such a perspective, indeed, demand for raw materials and economic driving forces can be correctly put in relation to each other.
For the period 2000–2010,
Table 3 shows a fall of the Raw Material Equivalents allocated to final domestic uses (minus 243.3 Mt). On the contrary, exports in RME have increased (35 Mt). This highlights that more and more material resources are required by the Italian economic system in order to satisfy the foreign demand for goods and services produced in Italy. The share of exports expressed in RME in the total Raw Material Input of the Italian economy, indeed, has risen, gradually but steadily, from 32% to 40%.
5. RP as an Indicator for Policy-Making: Possible Alternative Formulations
Table 4 shows four possible alternative formulations of the RP indicator. They all express an average “value per unit material flow”, but interpret the RP concept in different ways.
Table 4.
Alternative indicators for Resource Productivity (RP).
Table 4.
Alternative indicators for Resource Productivity (RP).
| | Denominator |
| Domestic Material Consumption (DMC) | Raw Material Input (RMI) | Raw Material Consumption (RMC) |
| Numerator | Gross Domestic Product (GDP) | Productivity of potential pollution: GDP per unit of potential pressures on the economy’s output side from the direct (domestic) material consumption | | Productivity of Raw Material Consumption, as would result by a simple substitution of DMC with RMC in the GDP/DMC formula (no consistency between numerator and denominator): GDP per unit of the used resources that are needed at the global level for the production of the goods and services delivered to domestic final uses (Final consumption + Gross capital formation) |
| Total economic resources available for final uses (GDP + IMP) | | Productivity of Raw Material Input: economic resources available for all uses of final domestic production per unit of resource use needed at the global level | |
| Total economic resources available for domestic final uses (GDP + IMP − EXP) | | | Productivity of Raw Material Consumption (with consistent numerator and denominator): Total economic resources available for domestic final uses per unit of the resources needed at the global level for their production |
We do not calculate and discuss all the possible combinations of numerator and denominator in the table but only the ones that we deem most relevant, i.e., the one currently used by the EU (GDP/DMC), its version using RMEs with regards to the material flows, and two other ones who have the characteristic that the numerator and the denominator are formally coherent with each other. By “formally coherent” we mean that for each value component of the numerator (GDP, IMP, EXP), a corresponding physical flow in RME is represented (with the same sign) in the denominator (DE, imports in RME, exports in RME). The latter ratios express a relationship between the two ends of the production chains: the natural resources extracted from the environment and used, at one end; the net value of production emerging from the production chain, i.e., the value of the products delivered to final demand, at the other end (the reader should keep in mind that GDP + Imports = Final Consumption + Gross Capital Formation + Exports). The very reasoning by “vertically integrated sectors” that leads to RME figures for imports and exports makes this coherence something more than just a matter of form, as it guarantees that there is a clear functional relationship between the two ends.
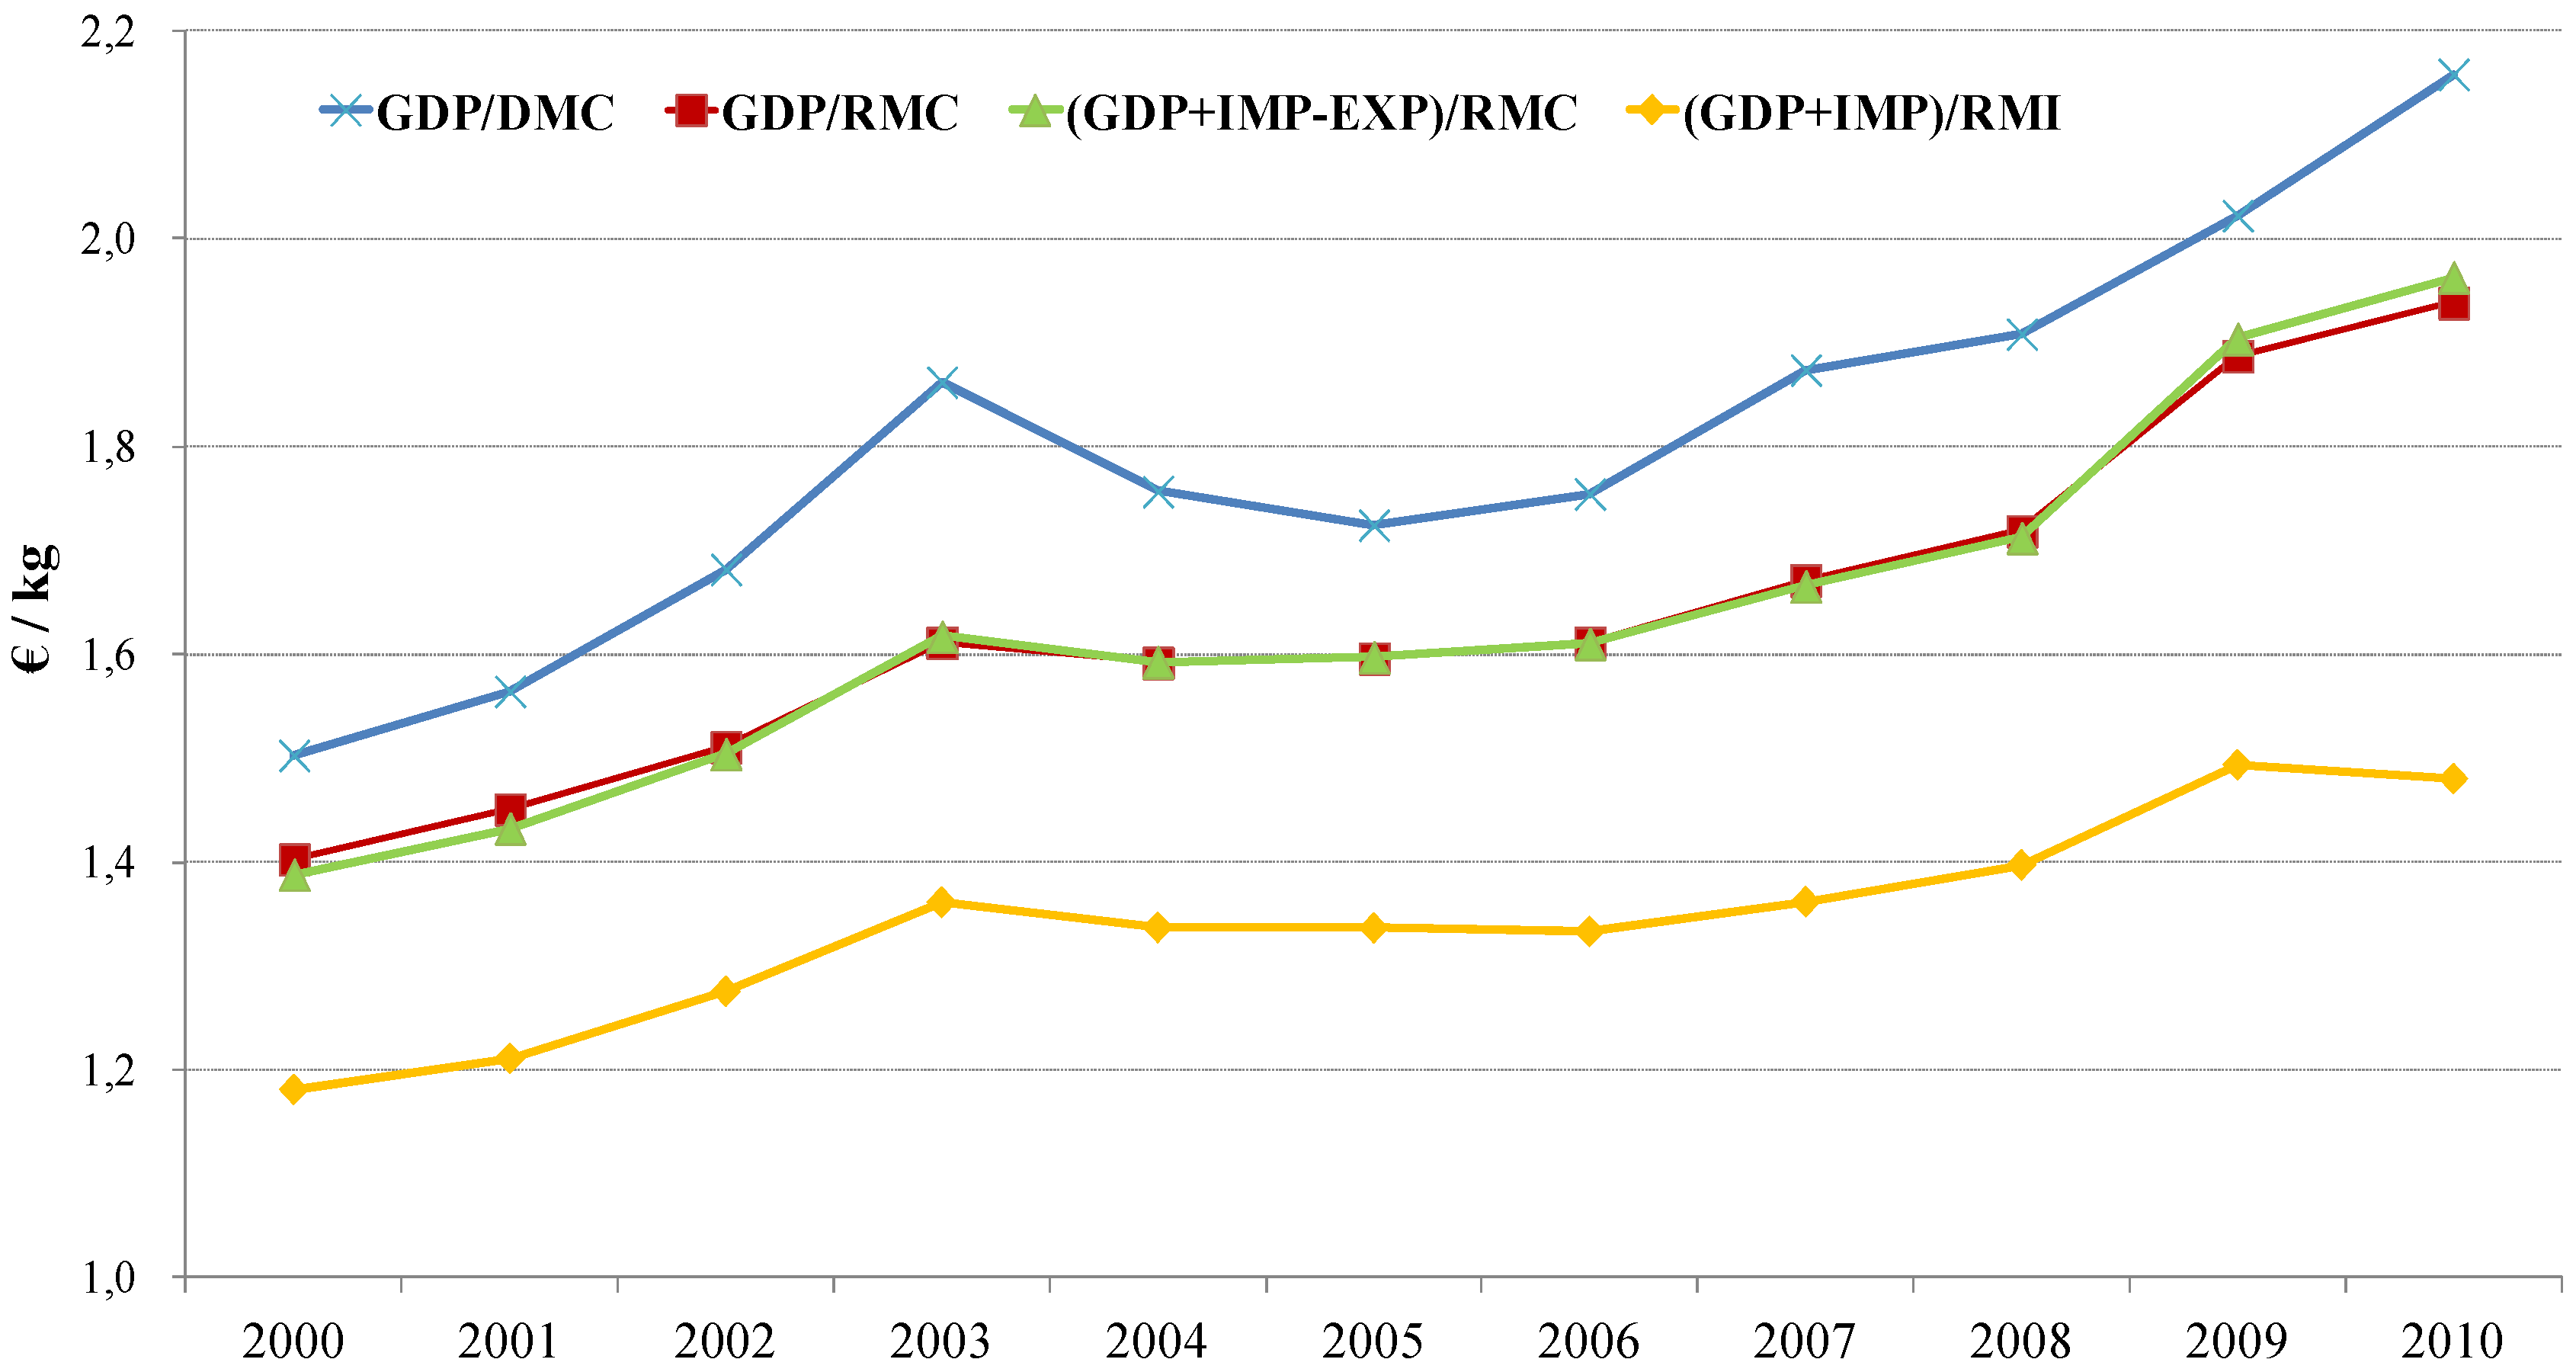
Figure 1 shows the values taken by these indicators over the 2000–2010 period in the Italian case. All these four versions have an upward trend. Their levels, however, are quite different. The version with the highest values is GDP/DMC,
i.e., the currently used RP indicator. This version gives an optimistic estimate of RP in comparison to the other versions shown in the graph. In the middle range, we find GDP/RMC.
It is obvious, in the Italian case, that in any given year GDP/RMC is smaller than GDP/DMC, since the PTB is higher when expressed in RME than when it is expressed in terms of direct flows. If Italy were a net resource exporter, then the picture would be the reverse. The same would happen for all countries with a similar economic structure and natural resources endowment.
The RP indicator having RMC at the denominator and total economic resources available for domestic final uses (GDP plus the value of imports minus the value of exports) at the numerator shows almost the same level and year-on-year changes of GDP/RMC. Using total economic resources available for domestic final uses for the numerator seems to be a more correct choice than using GDP, since it corresponds to RMC more closely than GDP. As a matter of fact, RMC represents the material inputs necessary to satisfy the domestic final demand. The similar behaviour of (GDP + IMP − EXP)/RMC and GDP/RMC is—at least in the Italian case—no great wonder, as Italy’s trade balance is, on average, more or less in equilibrium. However, this might not be the case for other countries, and in other cases interesting differences between the two indicators could emerge.
Figure 1.
Alternative indicators for Italian RP (GDP, imports and exports in chain-linked volumes, reference year 2005).
Figure 1.
Alternative indicators for Italian RP (GDP, imports and exports in chain-linked volumes, reference year 2005).
The picture introduces another variant of the RP indicator. It is a variant which we think should be taken into serious consideration by policy-makers that are looking for a better economy-wide RP measure than GDP/DMC. This new version comprises, as for the denominator, not only domestic final uses’ RME (i.e., RMC) but also exports in RME. In order to keep the two terms of the RP ratio consistent with each other, the numerator includes imports’ value, without subtracting exports’ value from GDP. So, its numerator is GDP plus imports’ value rather than GDP alone as in GDP/DMC. Had we not included imports’ value, the numerator would be lower and the indicator would be structurally distorted and would systematically underestimate RP and also its possible growth, since the denominator would grow as physical imports grow, while the numerator would not be affected by imports’ value.
However, why should this new version of RP be better than the others?
To begin with, it is worth stressing the following point, which we already hinted at above: once RME indicators are considered for inclusion in the policy-making toolbox, the issue cannot be reduced to simply substituting DMC in its current use by its RME version (i.e., RMC). When going from the current “direct material-flow” type of indicators to RME indicators, a change of meaning of the indicators must be explicitly acknowledged and dealt with.
It should be noted instead that, in the current debate, the fact that RMC overcomes DMC components’ asymmetry seems to be automatically considered sufficient to substitute DMC, wherever it appears, with RMC [
26,
27]. However, it is not at all granted that RMC should replace DMC in all its uses. The point is that, while DMC has its own meaning as a holistic potential (domestic) pressure indicator, RME indicators are comprehensive resource use indicators for entire national economies. The latter comprise sectors and activities which produce for domestic demand as well as sectors producing for foreign demand. There is no self-evident reason why the exporting part of the economy should be excluded, when it comes to measuring the economy’s resource requirements and productivity. Exports’ value is indeed included in GDP. Why should exports’ RME be excluded from RP’s denominator, then?
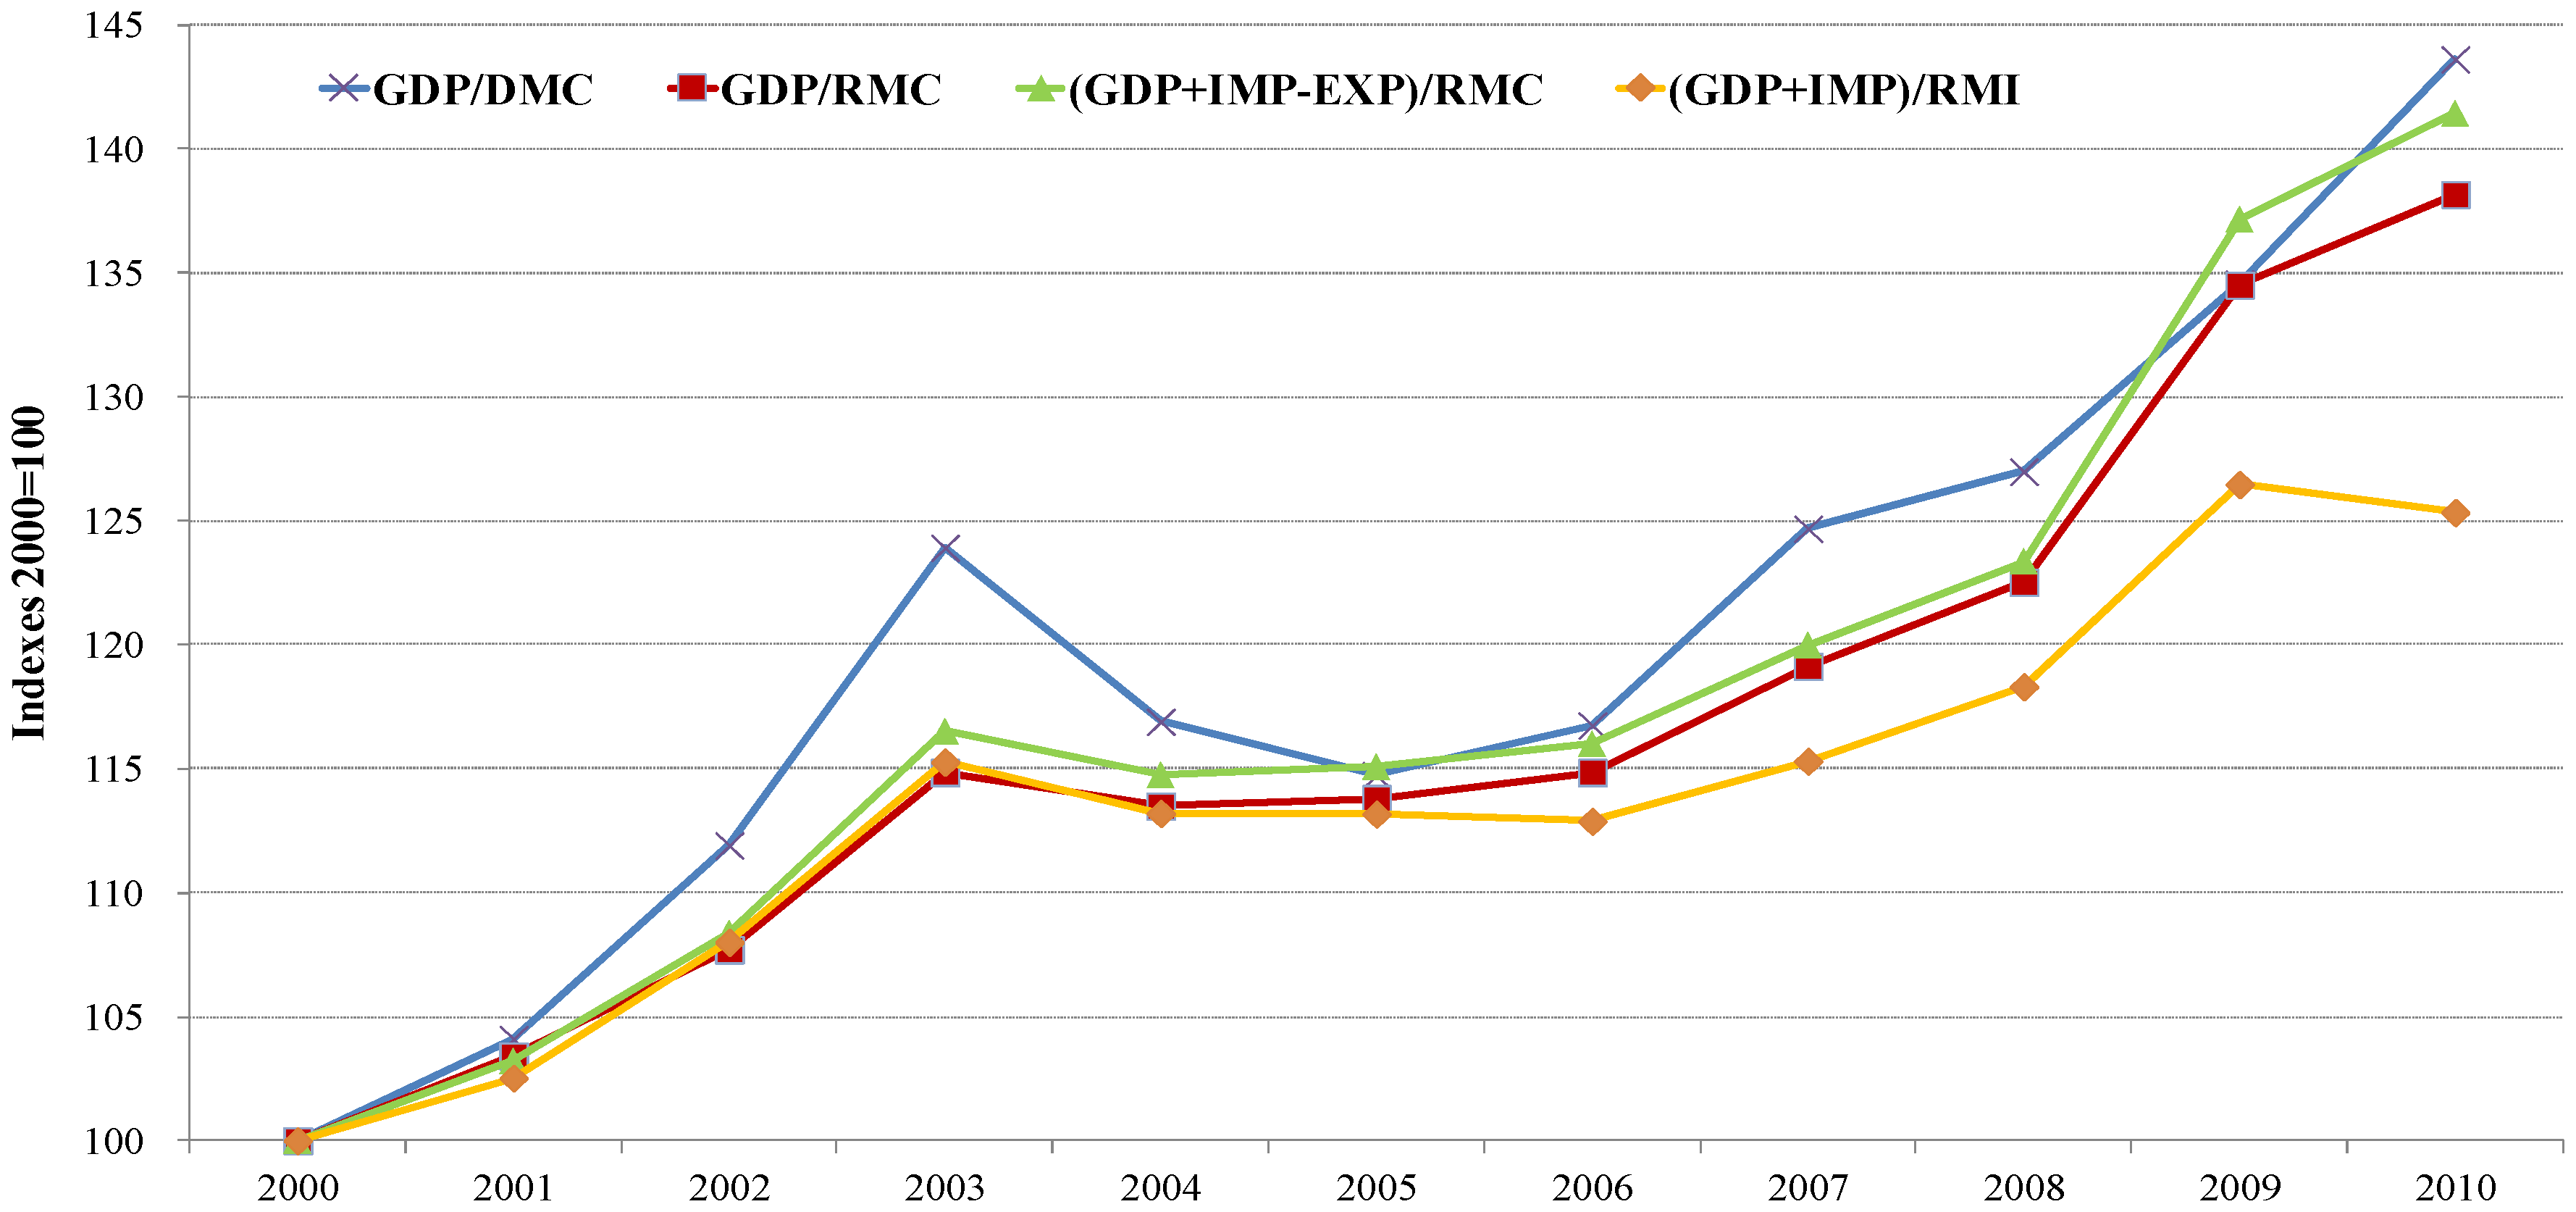
Figure 1 shows that, in the Italian case, RP’s level is quite different depending on the formulation chosen for the RP indicator, while no big difference seems to emerge from this graph with regards to the trend. Indeed, all versions show an upward trend,
i.e., a tendency to relative dematerialisation. However, differences in the extent of this tendency emerge from
Figure 2, where we show the same information as in
Figure 1, but in terms of each indicator’s ratio to its 2000 level.
Figure 2.
Alternative indicators for Italian RP (GDP, imports and exports in chain-linked volumes, reference year 2005). Indexes 2000 = 100.
Figure 2.
Alternative indicators for Italian RP (GDP, imports and exports in chain-linked volumes, reference year 2005). Indexes 2000 = 100.
The difference is evident especially between the version of the RP indicator we introduced above—(GDP + IMP)/RMI—and the other three, with the former leading to a much less optimistic evaluation of our economy’s ability to raise RP than the others. Again, GDP/DMC is the one that most emphasises the changes in RP (both upwards and downwards), while GDP/RMC (the pole-position candidate as GDP/DMC substitute), as well as its analogous domestic final demand/RMC, stay somewhere in the middle. Clearly, including or excluding exports’ value and their RME makes a big difference. This is due to the fact that in the Italian case the value per RME unit is much lower for exports than for domestic final demand. For domestic final demand, indeed, it is more than double than for exports. The 2000–2010 average of the latter is around 0.8 thousand euros per tonne. Moreover, the value per unit RME of exports is growing only slightly, while it is rising steadily for the Domestic Final Demand, as
Figure 2 shows (GDP + IMP − EXP)/RMC.
6. Conclusions
This paper illustrates the results of an application on a EW-MFA methodologically very advanced tool, which allows accurate estimates of the material resource use of a country (in our application, Italy’s). In these estimates, the material resource use is expressed in RME. We also propose an in-depth analysis of the possible use of these estimates in the derivation of RP indicators suitable for use in a policy setting where indirect flows are not neglected. In such a policy setting, raising RP by transferring abroad of potential environmental burden is recognised as not being environmentally effective, i.e., as not leading to a reduction of pressures on a global scale. Moreover, we argued that the indicators used to measure RP should use figures from the National Accounts and from Satellite Accounts for the environment in a consistent way.
RME estimates provide a valuable methodological improvement with respect to the current EW-MFA aggregate indicators, as they overcome the asymmetry between the heterogeneous parts by which make up the indicators currently in use. In order to derive such estimates, the environmental-economic framework provided by Environmental Accounts is fully exploited. The link between the direct and indirect demand for raw materials, on the one hand, and the final use of products, on the other hand, is established through Leontief’s inter-industry interdependence model.
In the RP analysis part, we stress the need for a clear distinction between meanings and roles of different RP indicators, in relation to different policy targets. On this point, we argue that a holistic potential pressure indicator, such as DMC, should not be mistaken for a comprehensive resource use indicator. Overcoming the asymmetry between DMC’s components is not sufficient to construct a better sustainability indicator; DMC’s formal analogue in RME terms, i.e., RMC, is not automatically DMC’s best substitute for RP calculation. In fact, on the one hand DMC’s significance does not suffer from the asymmetry, because DMC is not a resource use measure. On the other hand, RMC excludes a substantial part of a nation’s material resource requirements, namely those of its exporting activities.
RP still remains far from MIPS, which is an ideal reference for policy-relevant indicators of the efficiency with which natural resources are used to satisfy human needs. This remains true even when rather comprehensive material resource use measures are adopted, such as indicators of resource use expressed in RME and RP indicators having RMEs at the denominator. One reason is that unused materials, disregarded in the present paper, are at least as important as the used ones: introducing unused materials into the picture would increase its significance. Another reason is that the monetary value of any given product is a long way off from representing such products’ real usefulness in terms of services delivered. Nevertheless, defining and constructing better measures of material resource use and RP is an important step forward. Finally, the one thing that should never be ignored is that RP should not be seen as a target in itself, but as part of a more general sustainability strategy, in which absolute dematerialisation must play a key role.


