1. Introduction
The European Union has set ambitious targets regarding the percentage of electricity consumption to be served by renewable energy sources by 2020. However, the two major drawbacks of renewable energy sources are their variability and limited predictability. Without the technology for large‑scale storage of electricity, the volatility of production will have an impact on the dimensioning and management of the future power system. Traditional forms of thermal generation, like coal and gas plants, can be built close to load centers and their production controlled to follow demand. By contrast, large-scale renewable sources may be located far from load centers. This is particularly true of (offshore) wind power plants with high capacity factors. This may make it necessary to transport electricity over long distances, which represents a challenge for future power systems and cannot be treated only at the national level. This development will require a higher level of cooperation between the European countries and their national transmission system operators. An example of this international cooperation is the North Sea Offshore Grid, as proposed in [
1,
2,
3]. It implies that the Netherlands, Germany, Denmark, Norway, Great Britain and Belgium will work together on the creation of an offshore grid to efficiently harvest the wind energy resources available in the North Sea and transport it to shore. This requires massive investments and a complex coordinated planning exercise among the North Sea states [
3]. Various alternative configurations for the offshore grid are surveyed in [
4]. To integrate large-scale offshore wind, the transmission networks of all coastal states have to be expanded both offshore and onshore [
3,
5].
This work maps out the wind power variability resulting from a 2030 scenario of 81-GW offshore wind capacity in the North Sea. It also investigates the consequences for the onshore power systems of the North Sea countries in terms of the extra flexibility requirements for the conventional generation sources and storage. The wind speed data set used in this work was based on historical data for the years 1994, 2003 and 2007. According to an ensemble of national indices [
6], these years corresponded to high, low and average wind speeds in North-Western Europe. Modeled meteorological data with 10 min and 9 km × 9 km resolution were obtained from Sander + Partner Gmbh [
7] and included virtual potential temperatures and gradients, wind speed and direction, pressures at 90 and 120 m heights, Monin–Obuhkov length, friction velocity and boundary layer height. These variables are derived based on a meso-scale regional re-analysis. The term “meso” is used to describe the range of meteorological phenomena with a horizontal range between 2 and 2000 km. A detailed representation of the atmosphere above the North Sea cannot be obtained from weather stations, which are sparsely located and record data at different sampling rates, varying from continuously, up to twice a day. Instead, numerical weather models initialized with daily weather data can produce synthetic data with a higher spatial and temporal resolution. Information about any time and location in the covered range becomes available for the simulation of wind power plant output. An approach based on statistical interpolation of weather station data, focusing only on offshore and onshore wind power development in the Netherlands, has been followed in [
8].
2. Analysis of Wind Power Variability
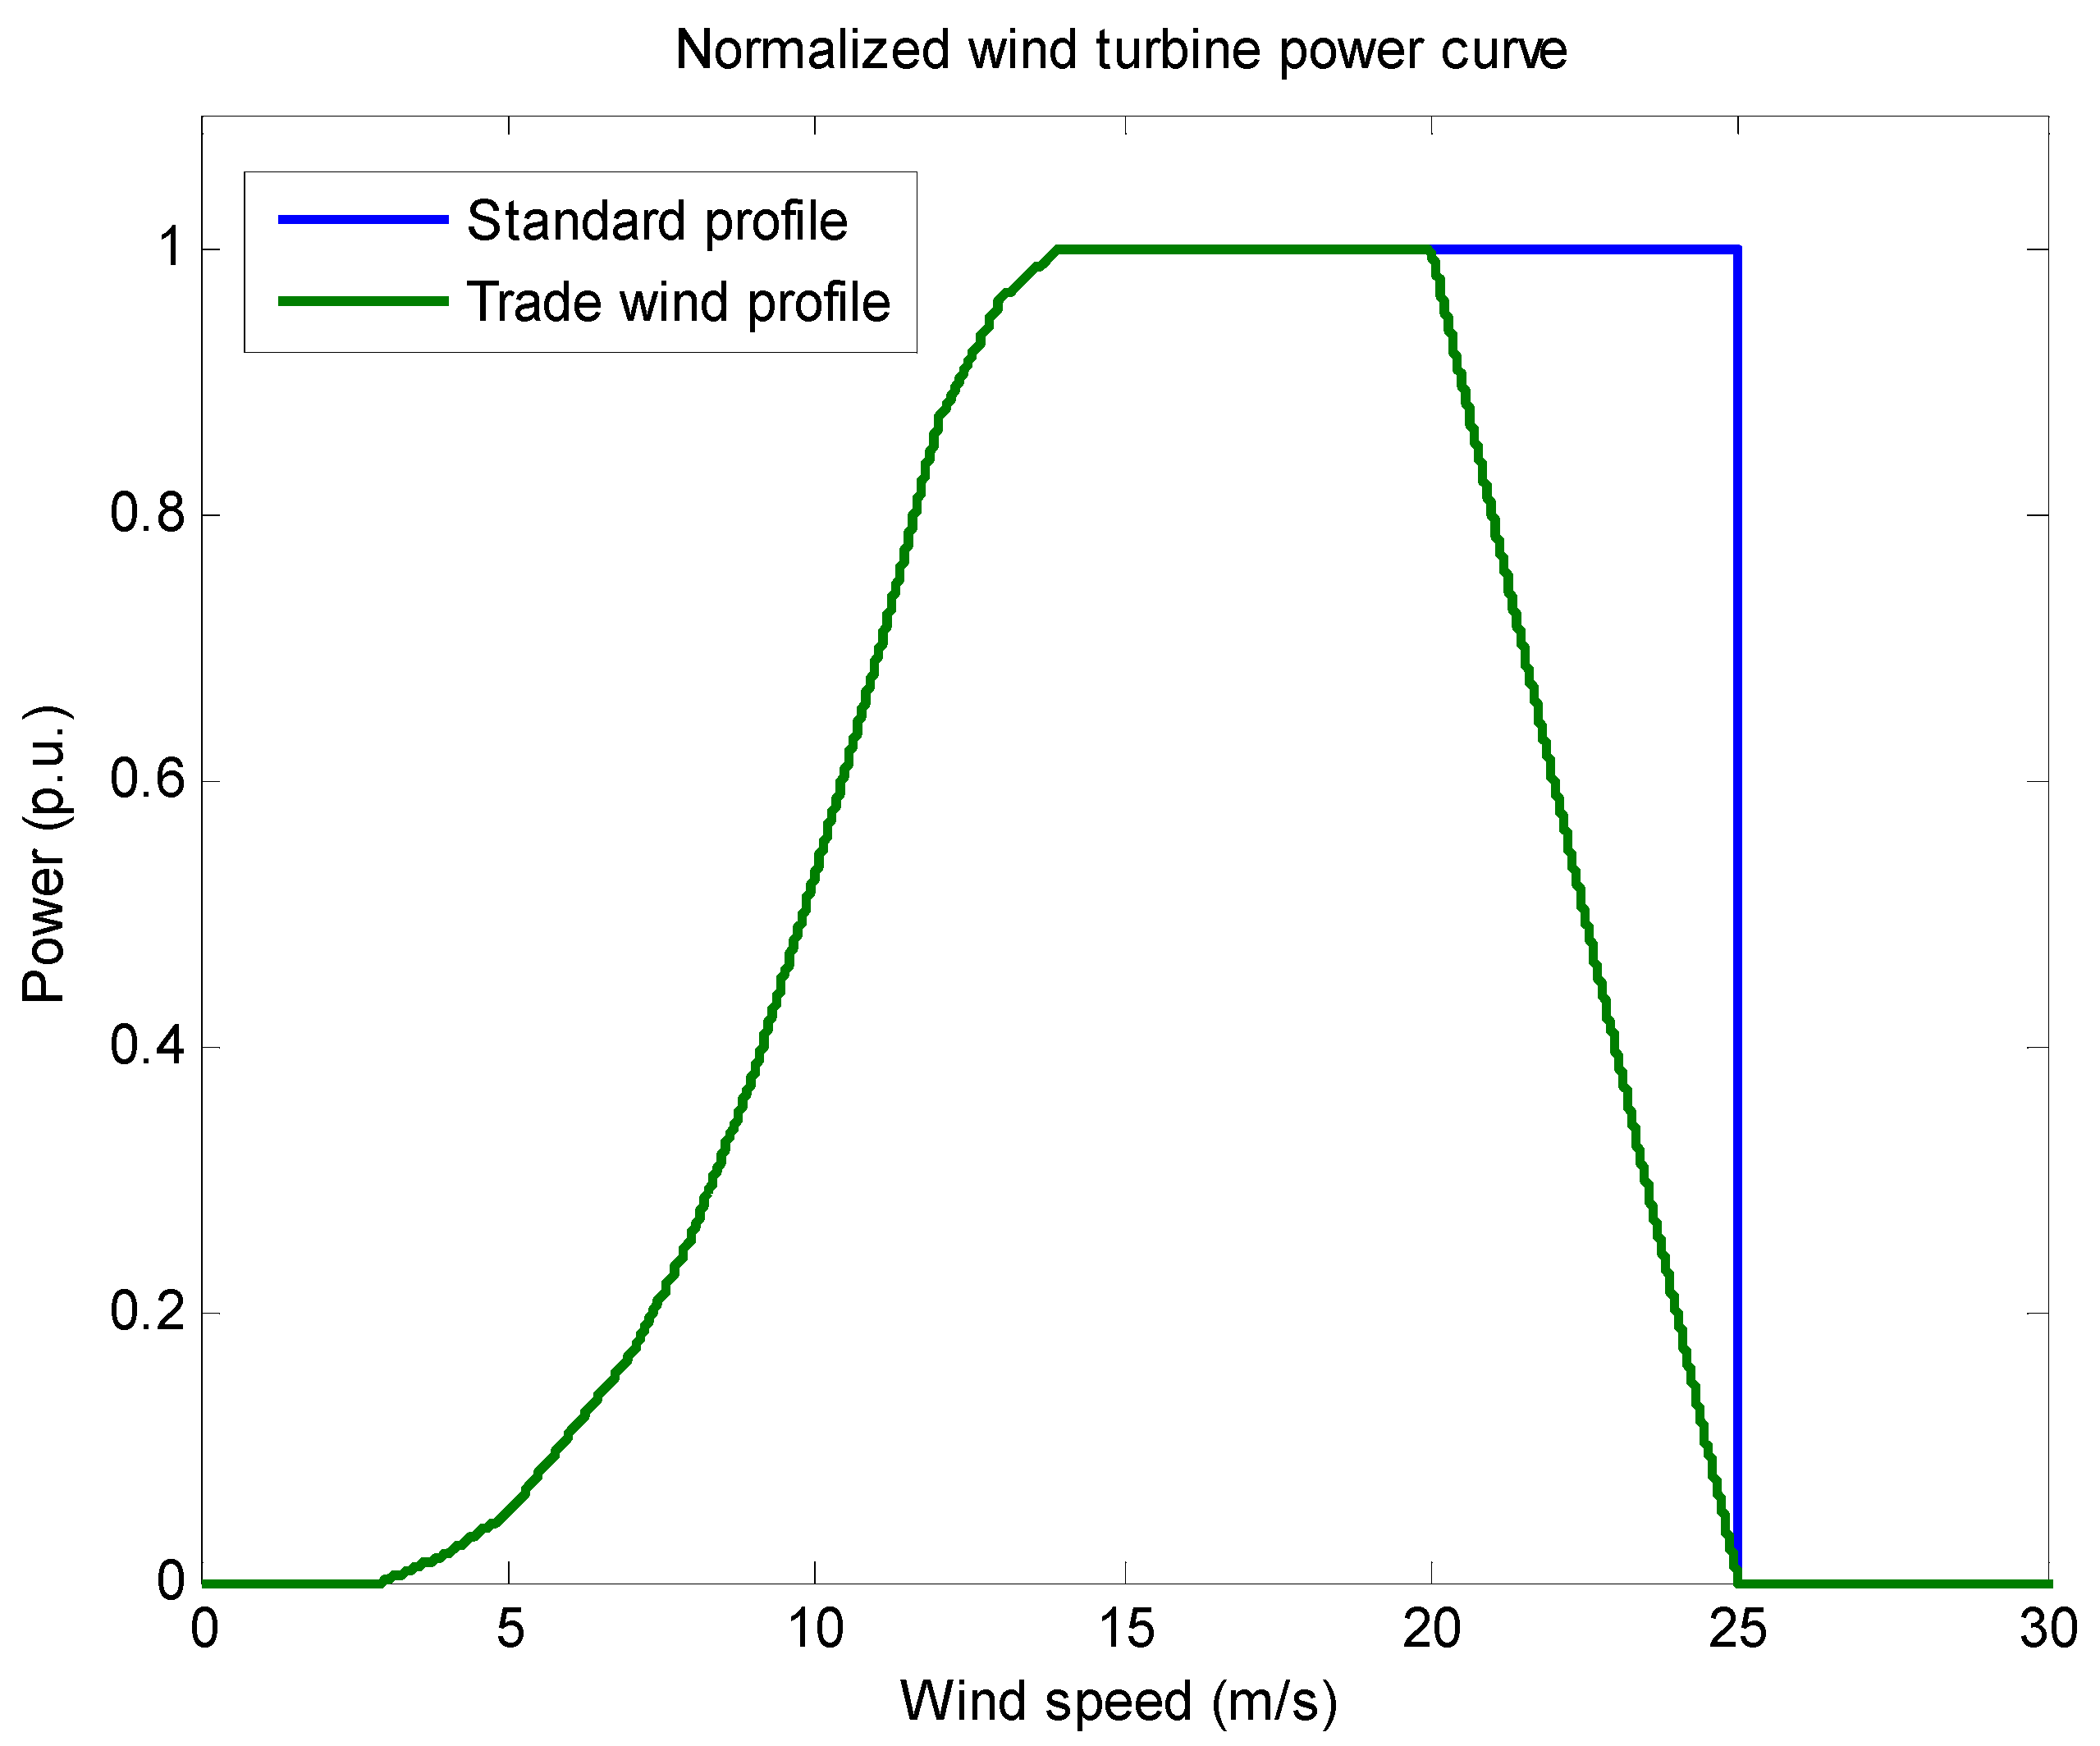
The normalized multi-turbine speed-power conversion curve proposed by the TradeWind study [
9] was used. A list of 177 existing and foreseen wind farms was created, based on information available from the database of 4C Offshore Limited [
10]. The wind speed time series at a 90-meter height for the selected locations are converted to electrical power time series via the power curve shown in
Figure 1. The selected wind farms are expected to be operational in a 2030 scenario and would have a cumulative rated power of 81 GW [
11].
The difference between the TradeWind and the standard P-v (speed-power) curve is apparent in wind speeds between 20 and 25 m/s. While the standard curve has an abrupt cut-off at 25 m/s, the TradeWind curve has a slope from full power at 20 m/s falling to zero at 25 m/s. This offers the advantage of being more representative of the cut-out process observed in the case of large wind farms, where significant dispersion exists in the speeds experienced by individual wind turbines.
Figure 1.
Normalized multi-turbine speed-power conversion curve based on [
9].
Figure 1.
Normalized multi-turbine speed-power conversion curve based on [
9].
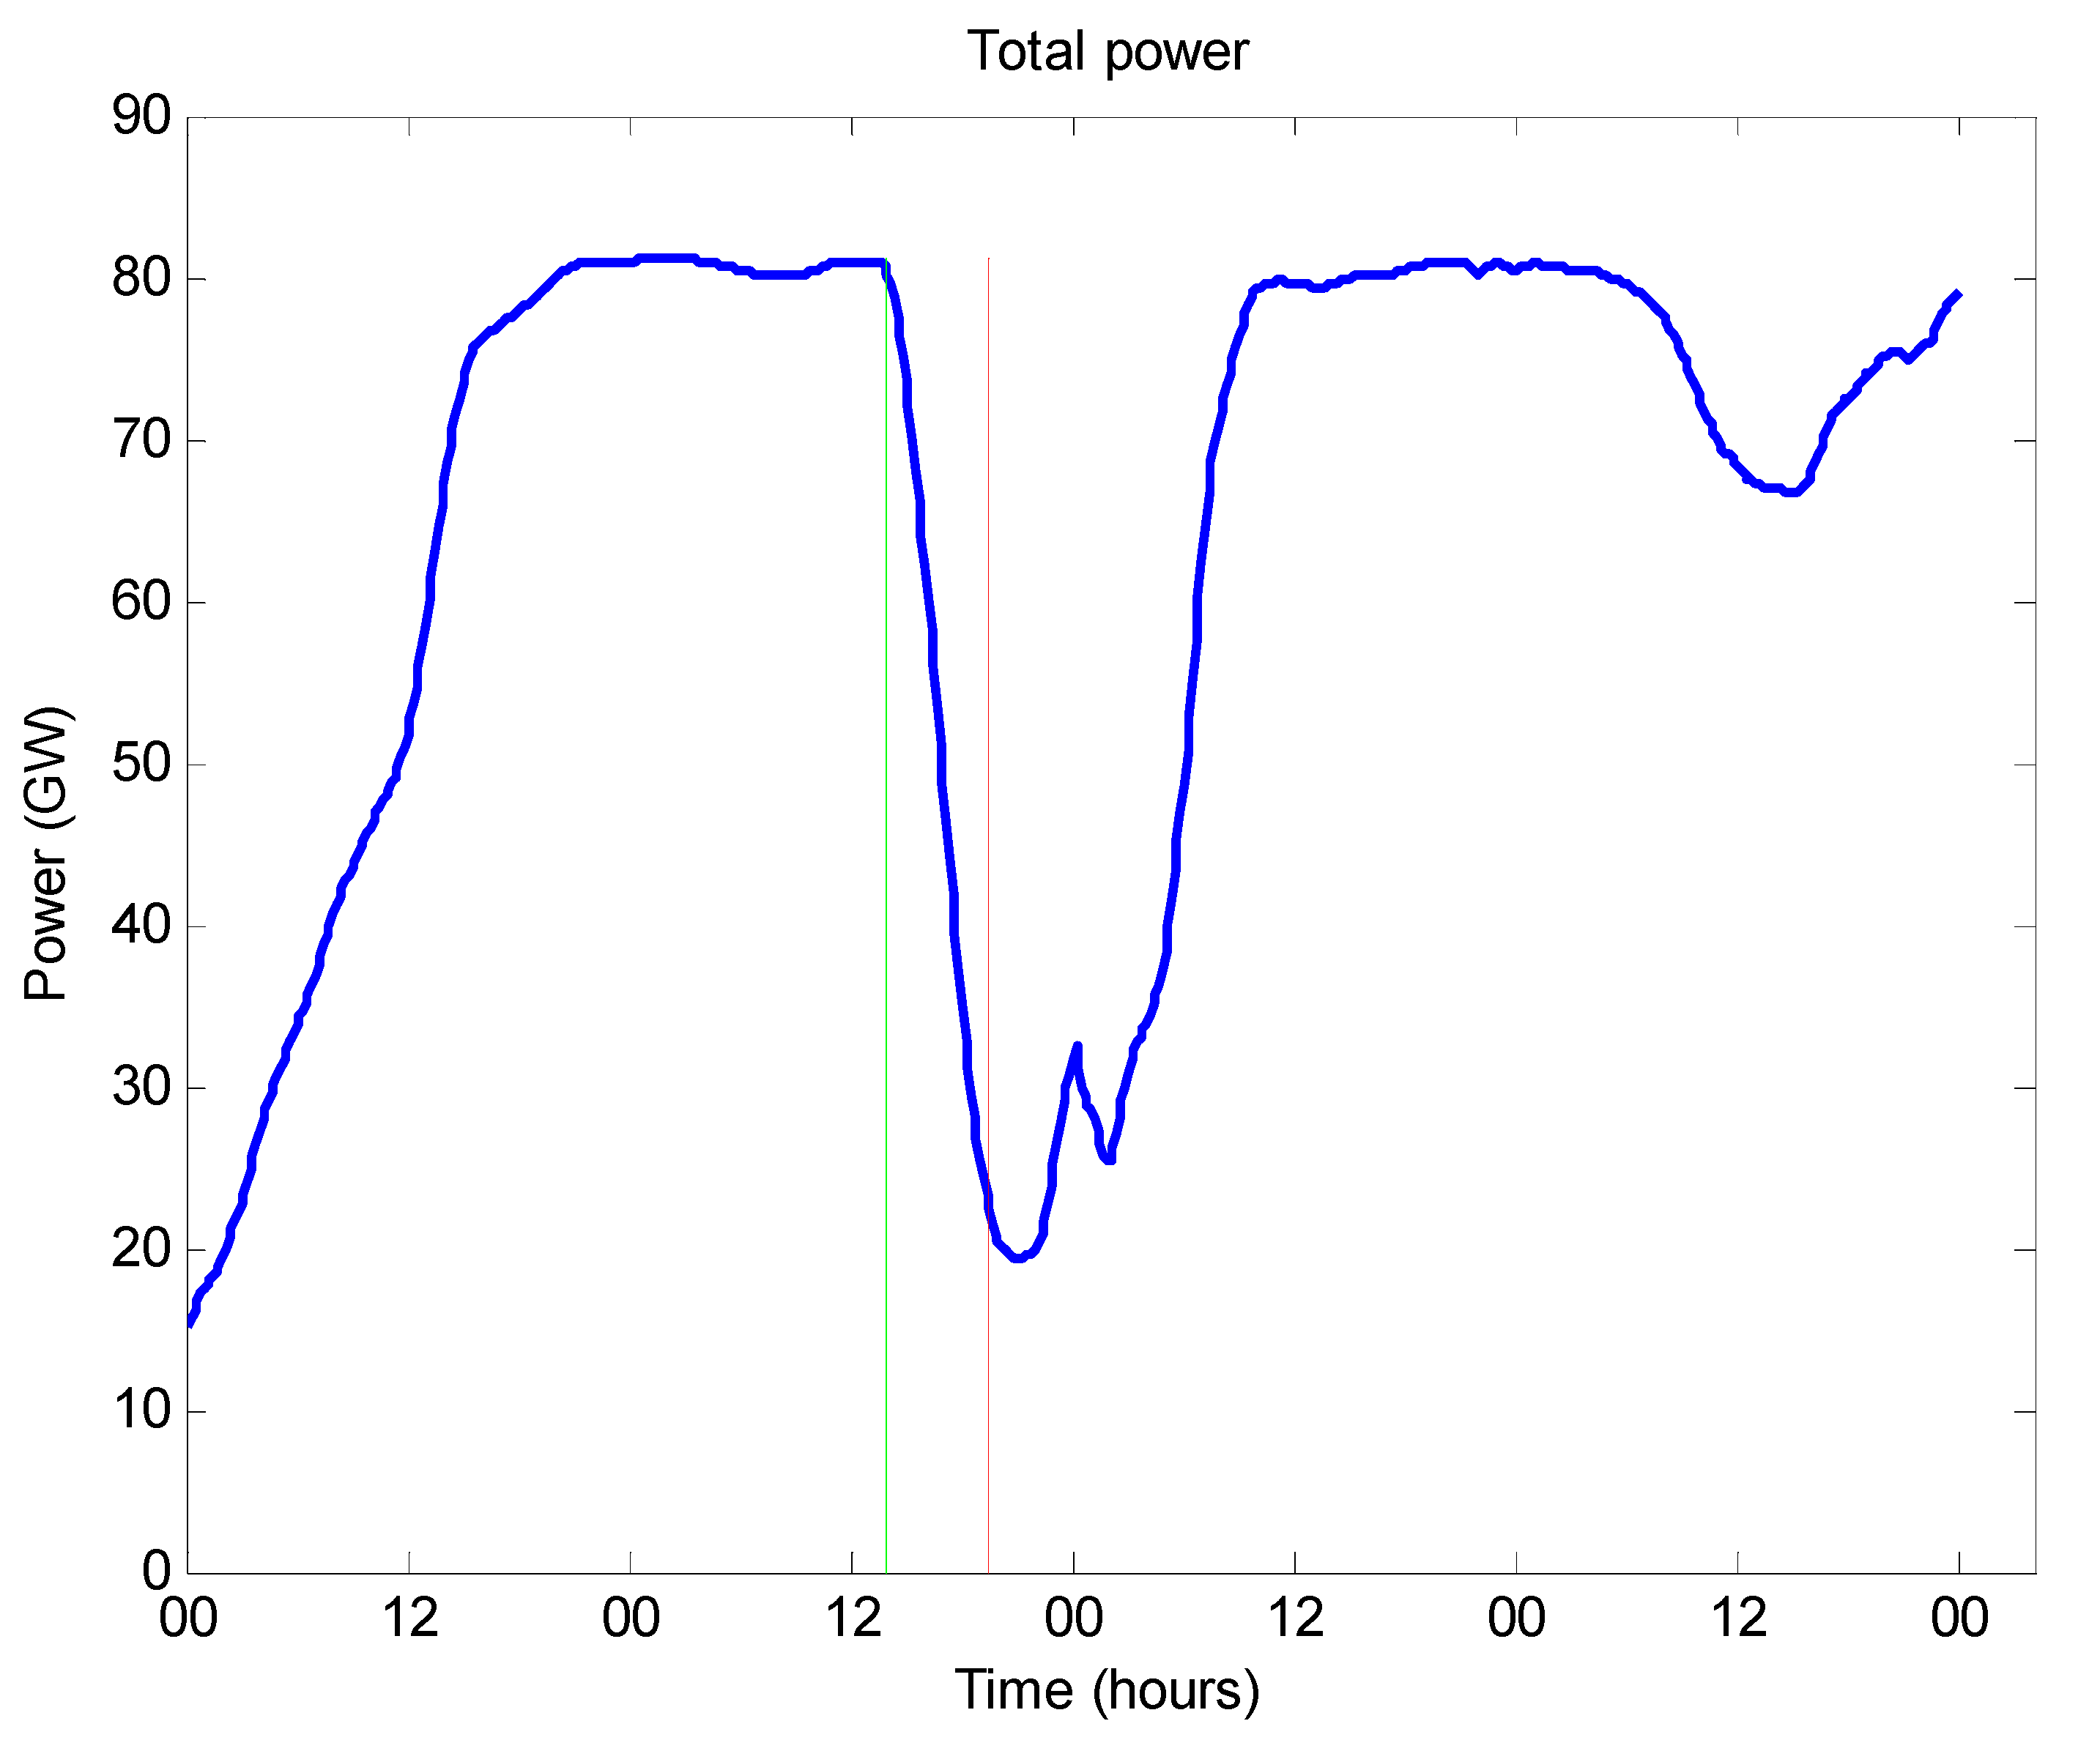
The aggregated power generated by the selected offshore wind farms is computed and its first derivative studied to identify the largest ramping events. It is found that the most severe event is 23 March 1994 between 13:40 (
Figure 2a) and 19:20 (
Figure 2b) with the power dropping from 81 GW (
Figure 3, green line) to 20 GW (
Figure 3, red line). This power variation is not due to a sudden decrease in the wind speed, but to an increase of the wind speed due to a storm occurring throughout a large southern area of the North Sea. The increase in wind speed causes the wind farms to cut-off and reduces their production to zero. This production reduction amounts to a power variation of 61 GW in 340 min, which is equivalent to an average drop of 10.7 GW per hour or 179 MW per minute. This is further illustrated in
Table 1, where the total of 177 North Sea offshore wind farms are grouped by wind speed ranges experienced before and during the wind gust. During the gust, there is a shift in the number of wind farms (about 93%) experiencing speeds in the gradual shut-down range (20–25 m/s) or above cut-out (>25 m/s), as compared to the situation before the wind gust.
Figure 2.
Wind speeds at offshore wind farm fleet locations before and during the wind gust of 23 March 1994 (a) at 13:40; (b) at 19:20.
Figure 2.
Wind speeds at offshore wind farm fleet locations before and during the wind gust of 23 March 1994 (a) at 13:40; (b) at 19:20.
Figure 3.
Total wind power from the offshore wind farm fleet before (green line, 81 GW) and during (red line, 20 GW) the wind gust, using data of 23 March 1994.
Figure 3.
Total wind power from the offshore wind farm fleet before (green line, 81 GW) and during (red line, 20 GW) the wind gust, using data of 23 March 1994.
Figure 2 and
Figure 3 are extracted from a video [
12], created to illustrate the evolution of this large cut-out event. These two figures each depict a point in time, respectively the maximum of production before the wind gust (
Figure 2a and
Figure 3 green line) and the minimum production when the gust reaches its temporary peak (
Figure 2b and
Figure 3 red line).
Figure 2 presents two wind speed maps in m/s. Each white cross represents a planned wind farm location for the 2030 scenario.
Figure 3 shows the total power generated from the offshore farms, the red vertical line marking the point in time at the end of the storm shut-down.
The wind speed map of
Figure 2b shows a large red area with values above 20 m/s or even 25 m/s covering the southern portion of the North Sea, where most of the wind farms are installed. This demonstrates the importance of having a gradual controlled shut-down of the wind turbines when wind speed increases above the cut-out speed. The cut-off properties and the concentration of wind farms contributes to the characteristics of these potentially large variations (see
Table 1).
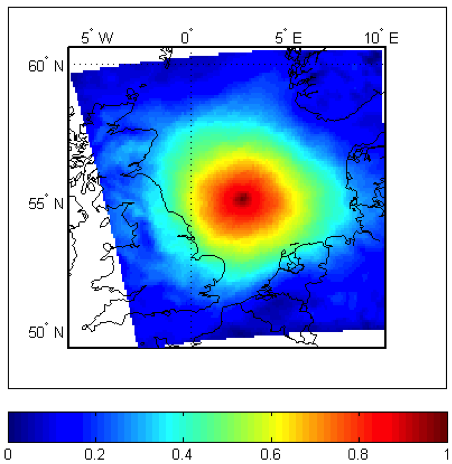
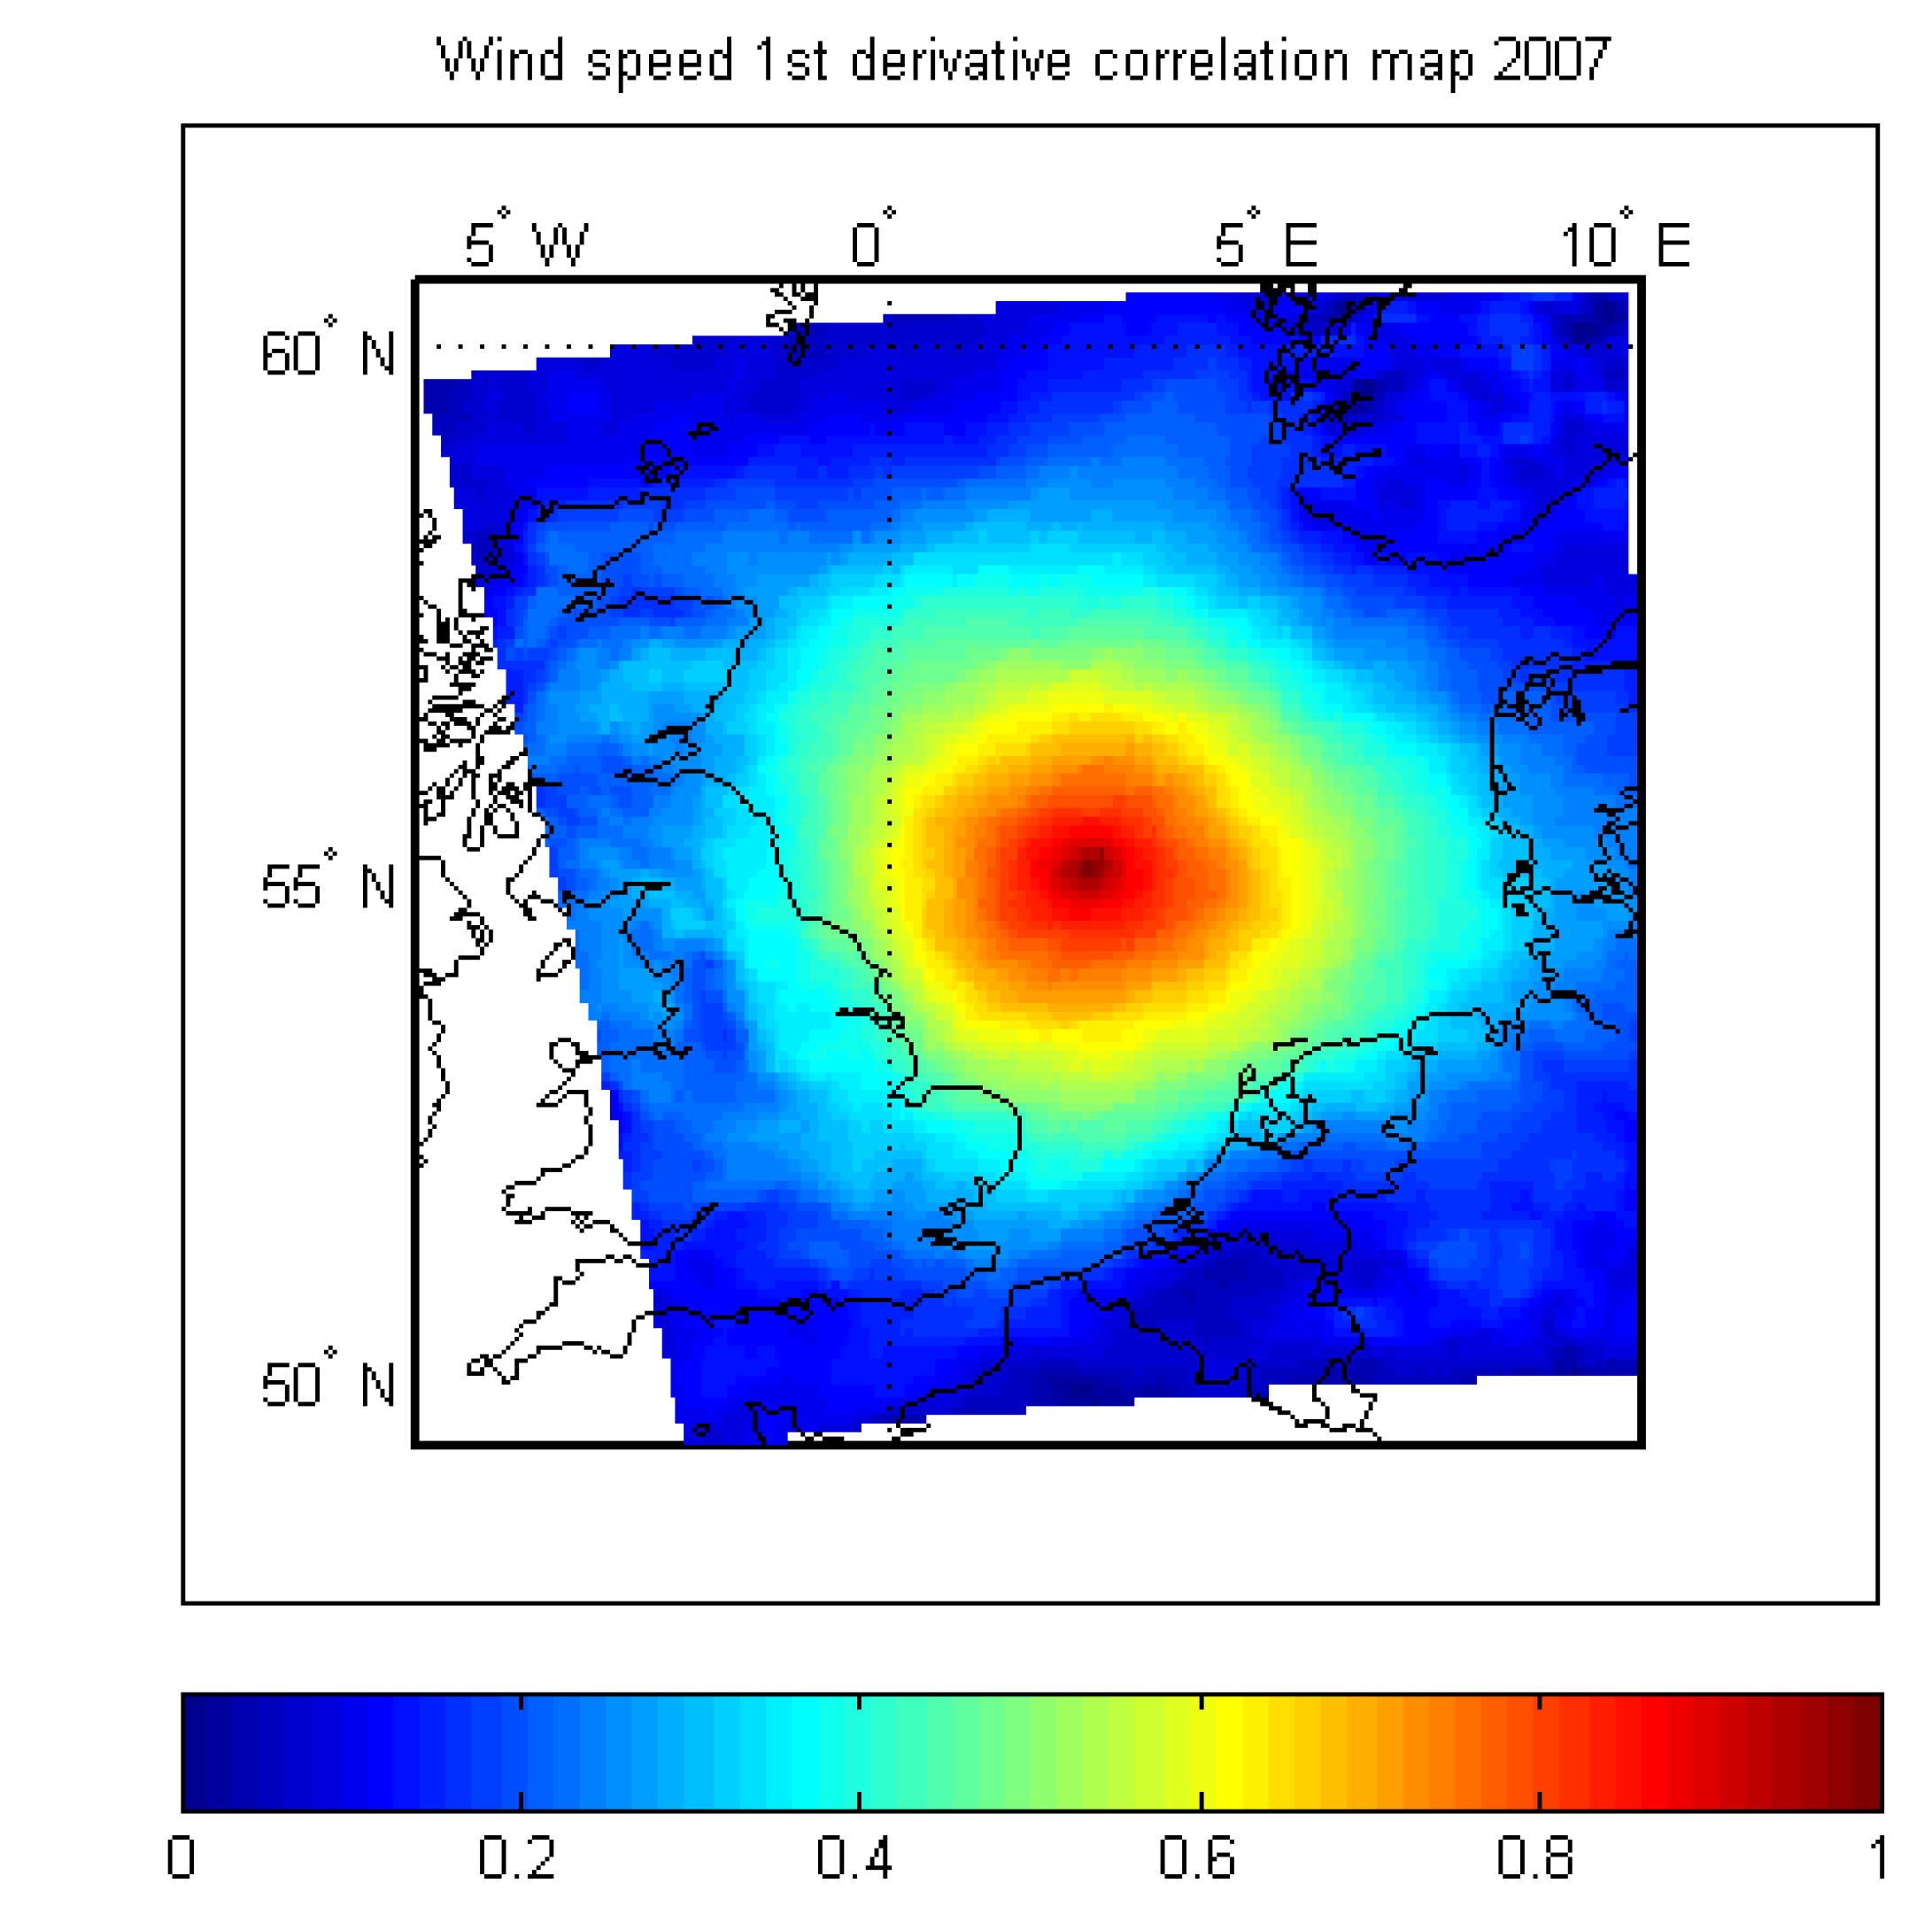
From this result, the correlation between location distances and wind speed variation is investigated. It is done by computing the first derivative of the wind speed vectors. Then, the correlation between the center of the map and any other point is computed. The result for the year 2007 is displayed in
Figure 4. The years 1994 and 2003 are showing similar results. If the correlation value is above or equal to 0.5, it is considered as strong; the wind speeds in both locations increase and decrease simultaneously. On the other hand, if the correlation is low (between zero and 0.5), the wind speeds may vary independently of each other.
Table 1.
Number of wind farms and wind speed ranges before and after the wind gust.
Table 1.
Number of wind farms and wind speed ranges before and after the wind gust.
| Number of wind farms | Wind speeds (v in m/s) |
|---|
| v ≤ 20 | 20 < v ≤ 25 | 25 < v |
|---|
| Before gust | 146 | 31 | 0 |
| During gust | 13 | 112 | 52 |
Figure 4.
Correlation of the first derivative of wind speeds for the year 2007.
Figure 4.
Correlation of the first derivative of wind speeds for the year 2007.
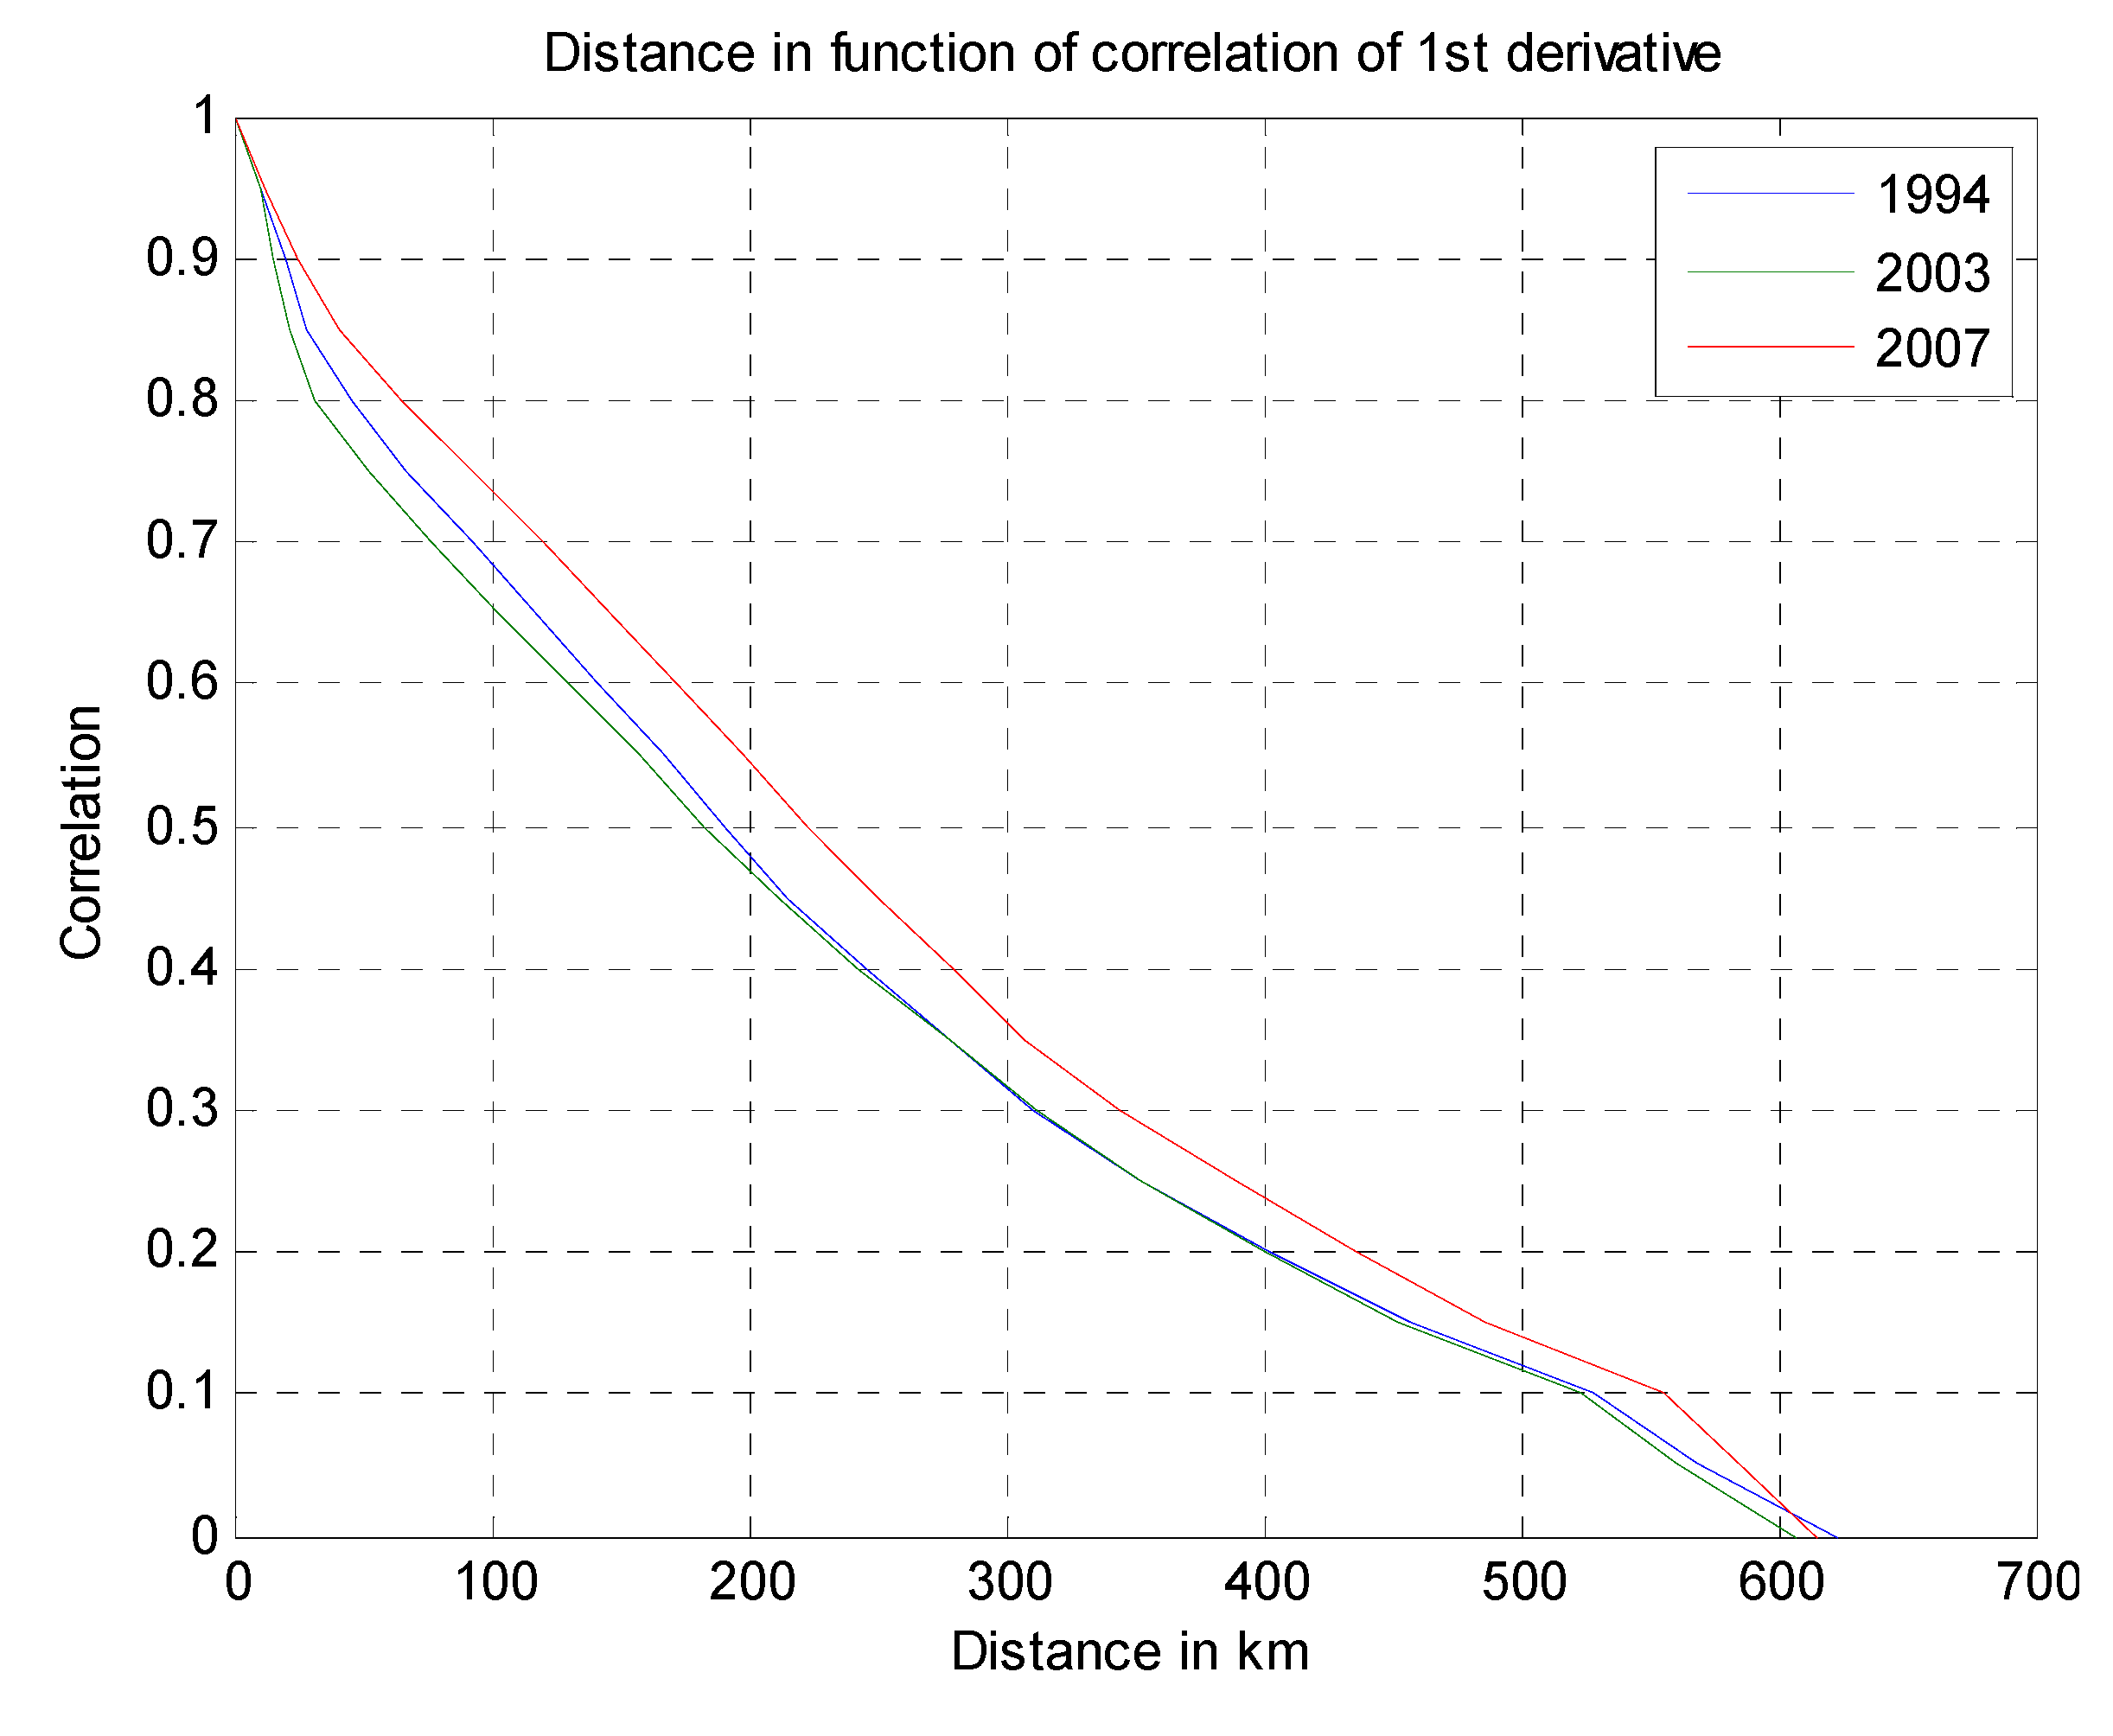
From the three-year map, the average distance between the center and any point with a given correlation value is computed. The result is plotted in
Figure 5.
Figure 5.
Average distance and correlation coefficient for the first derivative of wind speed.
Figure 5.
Average distance and correlation coefficient for the first derivative of wind speed.
For the three-year data set available, the correlation among wind speed variations is strong up to a distance of 200 km from the reference point, where the correlation coefficient reaches 50%.
Figure 5 shows that in general, wind speeds in the North Sea can simultaneously vary even when locations are as distant as 200 km from each other. Since our three-year data set only contains a handful of extreme events, it is difficult to draw statistically significant conclusions about the correlation among the first derivative of wind speeds specifically for high wind speeds. Although rare, such extreme storm events do occur at least once per year, and they are relevant for the calibration of the ramp rate response capabilities of the conventional generation fleet. The maximum ramp rates encountered were 14.23 GW/h for 1994, 12.63 GW/h for 2003 and 14.16 GW/h for 2007. The 1994 example in this paper confirms that large ramp rates from a North Sea offshore wind farm fleet, even if rare, exceed the currently experienced ramp rates (derived from normal variations in demand) and may warrant concern from transmission system operators. Consequently, a model is required that can estimate the probable size of net load variations (
i.e., from the combination of wind power and load) on a system-by-system basis for countries surrounding the North Sea. This will be discussed in
Section 3 and
Section 4.
3. Grid Model for a 2030 Scenario
The synthetic wind speed time series previously described, the normalized P-v curve and a list of expected wind farms for a 2030 scenario provide information about wind power input. With further data and assumptions regarding the power system characteristics of neighboring countries, we can evaluate the influence of the power injected by the North Sea offshore wind farms on the onshore AC grids. The motivation for this type of analysis is provided, e.g., in [
13], which contains an extensive survey of the consequences of large-scale wind power on power system operation, including intra-day recommitment of conventional units, faster ramp rates and increasing amounts of operating reserves, which should be dynamically allocated. Various wind integration solutions have been compared in [
14], in the context of the Dutch power system and its interconnections with neighboring systems, including storage and intra-day rescheduling of cross-border exchange. A consensus has been achieved in the literature and among European TSOs (Transmission System Operators) that international cooperation in terms of wholesale market exchanges and sharing of balancing reserves is key for dealing with the variability and limited predictability of wind power.
Section 3 and
Section 4 of this paper provide the methodology and quantitative assessment of balancing reserve needs due to large-scale wind power in the North Sea region.
3.1. Onshore Power Plants and Loads
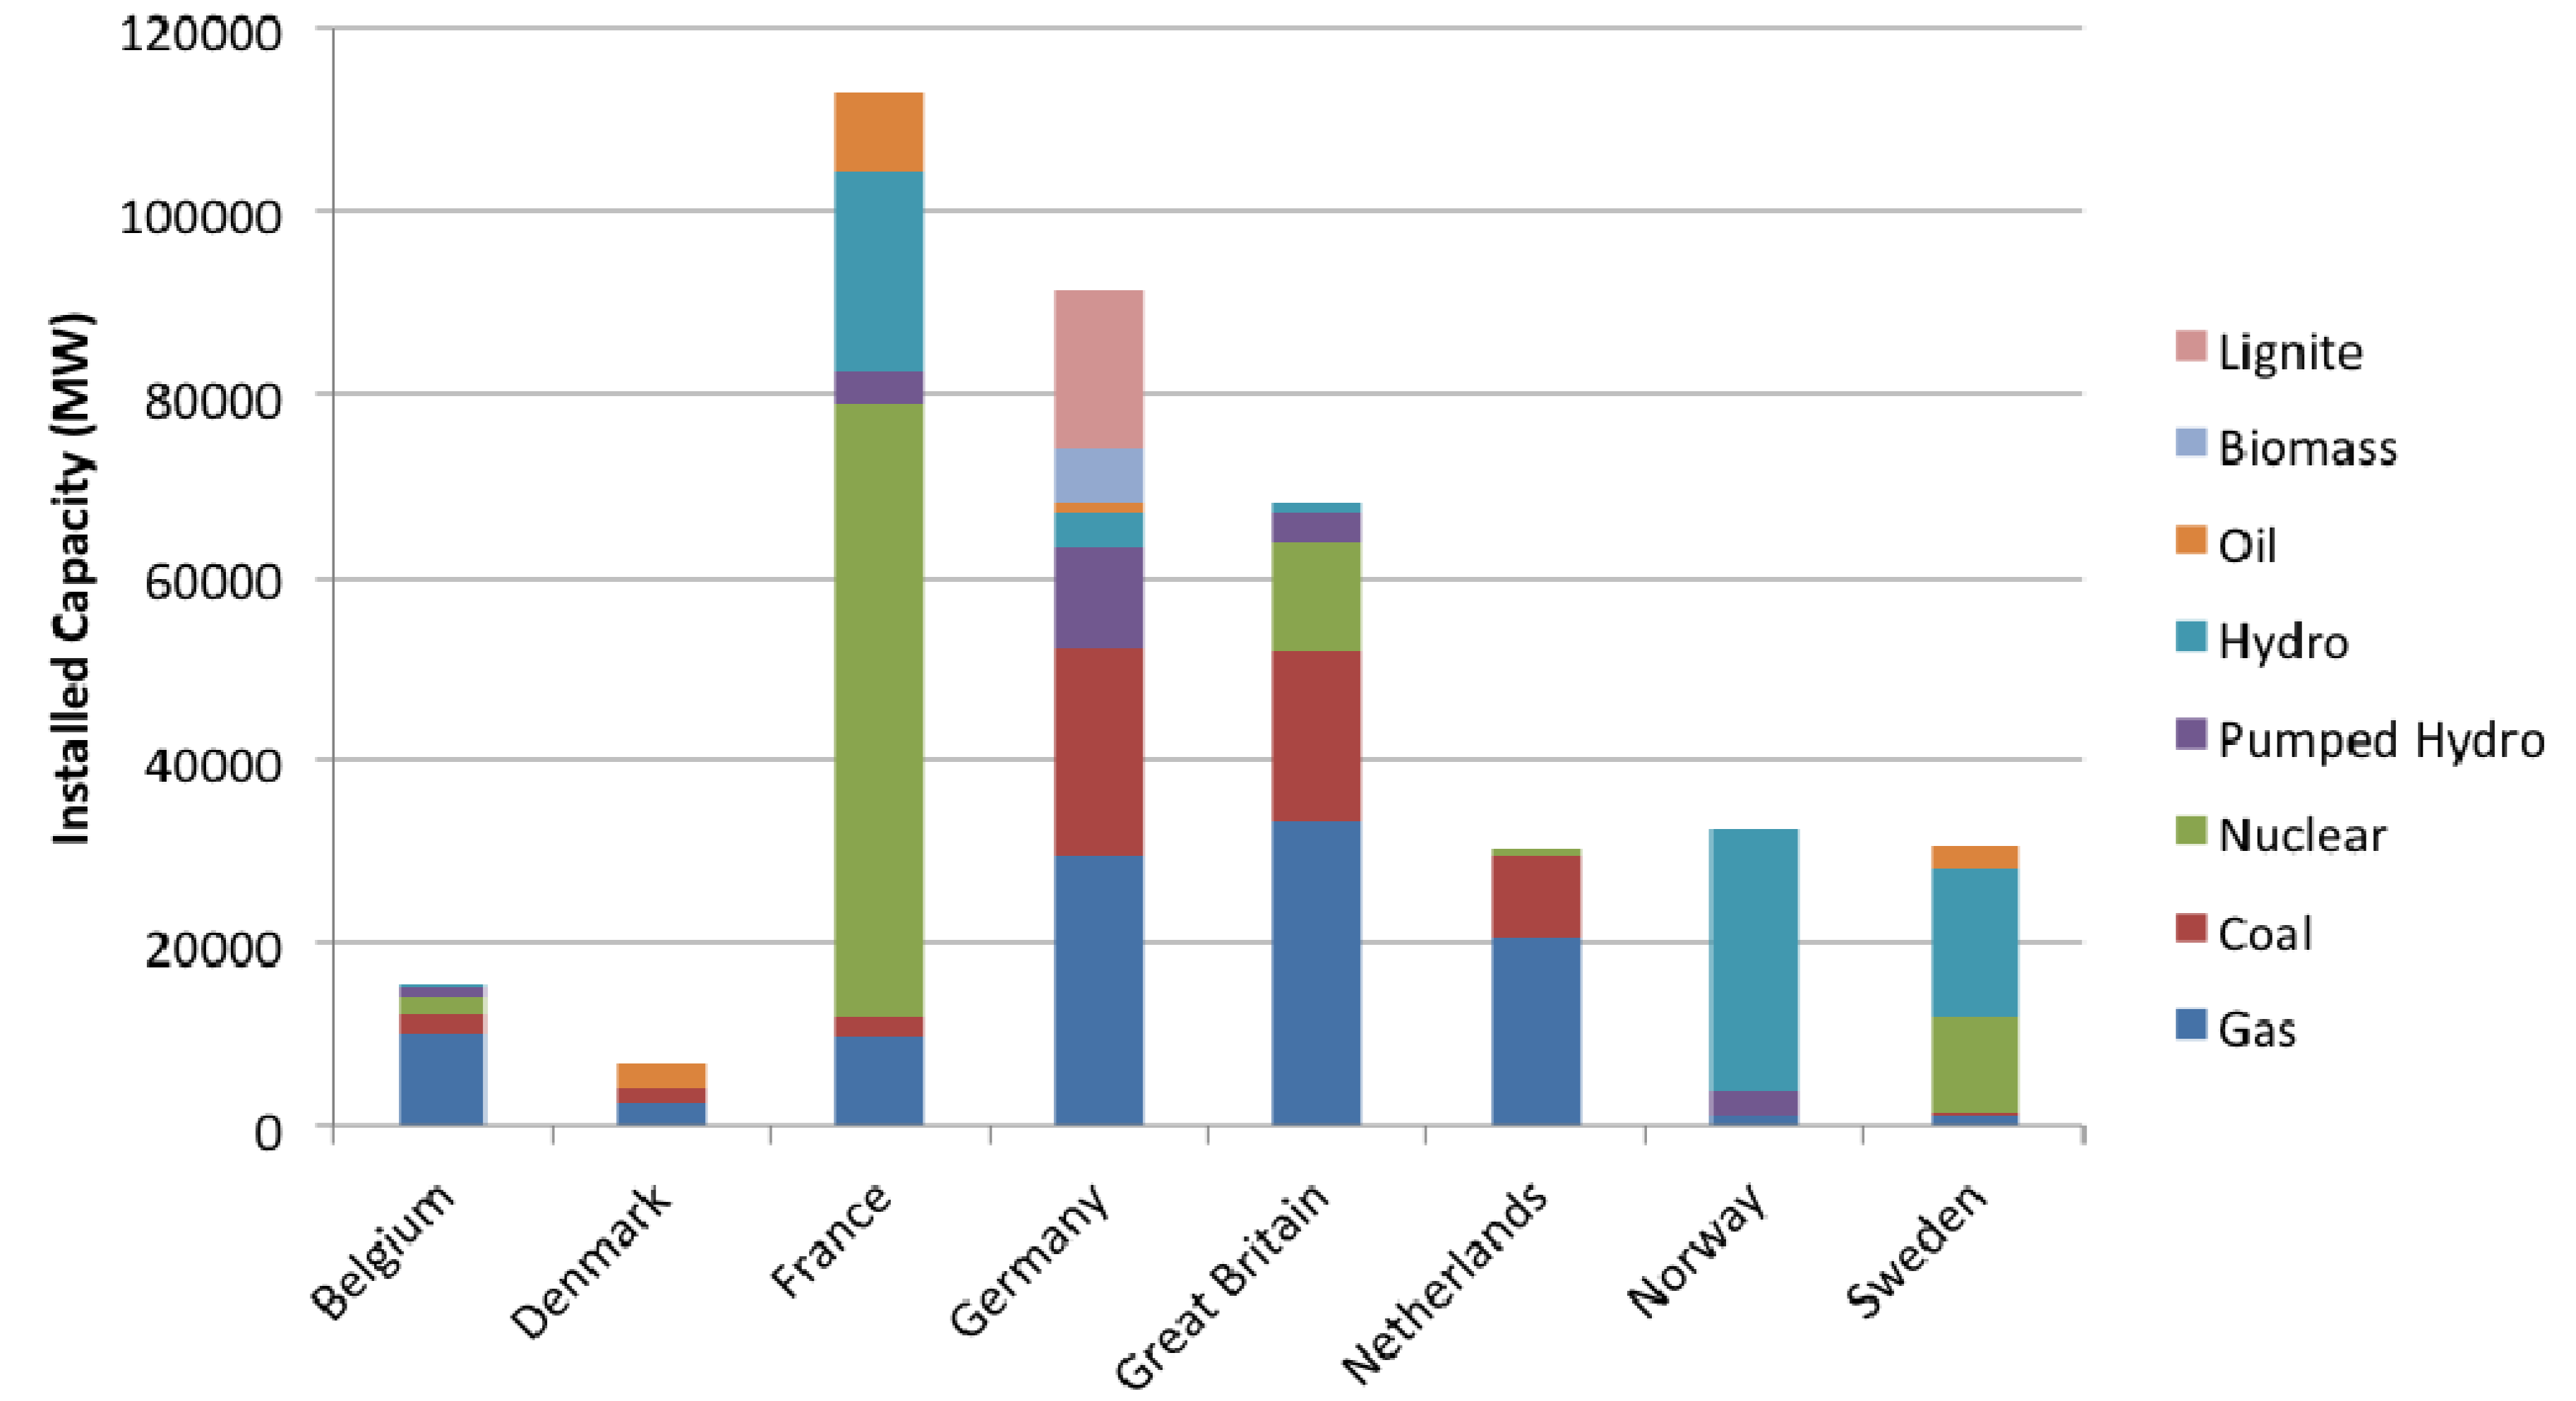
The study covers the eight countries bordering the North Sea (Belgium, France, Netherlands, Denmark, Germany, Great Britain, Norway and Sweden), grouped in three electrically synchronous islands [
15] (United Kingdom, Scandinavia and Continental Europe). For each country, a 2030 North Sea scenario consists of conventional generators, native loads and onshore solar and wind farm production. These three elements are aggregated at the country level. The data used is taken from [
5,
16] and summarized in
Table 2 and
Figure 6, showing the technology mix for RES and conventional generation per country. In addition,
Table 2 and
Figure 7 also provides some load-related statistics. Installed generation capacity and net load (load minus onshore renewable energy sources) are distributed in the network nodes of each national grid, proportional to the percentage of the population living in the city associated with that network node. An overview of the resulting data used is summarized per country in
Table 3. The underlying assumptions are that electricity consumption is proportional to the number of inhabitants of a given region, and that same mix of generation technologies is available at each onshore node. As a consequence, the model is not well suited for evaluating onshore network congestion as induced by offshore wind, which falls outside the scope of this paper. The conventional generators are assumed to have no ramp rate limitations. Hydropower is also taken into consideration. It is assumed that some hydropower plants are able to not only deliver power, but also to pump water with electricity taken from the grid. The power range for each type of generator is given in
Table 4. These constraints are used in the optimization model described in
Section 3.3.
Table 2.
Load and installed generation capacity for North Sea countries, 2030 scenario.
Table 2.
Load and installed generation capacity for North Sea countries, 2030 scenario.
| Country | Onshore wind (GW) | Solar power (GW) | Offshore wind (GW) | Conventional generation (GW) | Min load (GW) | Mean load (GW) | Max load (GW) |
|---|
| Belgium | 2.5 | | 1.5 | 15.5 | 9.5 | 15.2 | 21.1 |
| Denmark | 4.7 | | 4.4 | 6.9 | 2.7 | 4.9 | 7.7 |
| France | 38 | 13 | 0 | 112.9 | 37.2 | 68.1 | 112.1 |
| Germany | 47 | 66 | 26.1 | 91.2 | 41.2 | 66.4 | 95 |
| Great Britain | 19.4 | | 31.2 | 68 | 22.9 | 43 | 69.4 |
| Netherlands | 6 | | 10.8 | 30.3 | 11.3 | 17.6 | 25.6 |
| Norway | 5.8 | | 7.2 | 32.6 | 7.9 | 14.2 | 22.6 |
| Sweden | 7 | | 0 | 30.4 | 8.2 | 15.4 | 24.5 |
| Total North Sea | 130.4 | 79 | 81.2 | 387.8 | 146 | 244.8 | 365.6 |
Figure 6.
Conventional generation mix by country and technology, 2030 scenario.
Figure 6.
Conventional generation mix by country and technology, 2030 scenario.
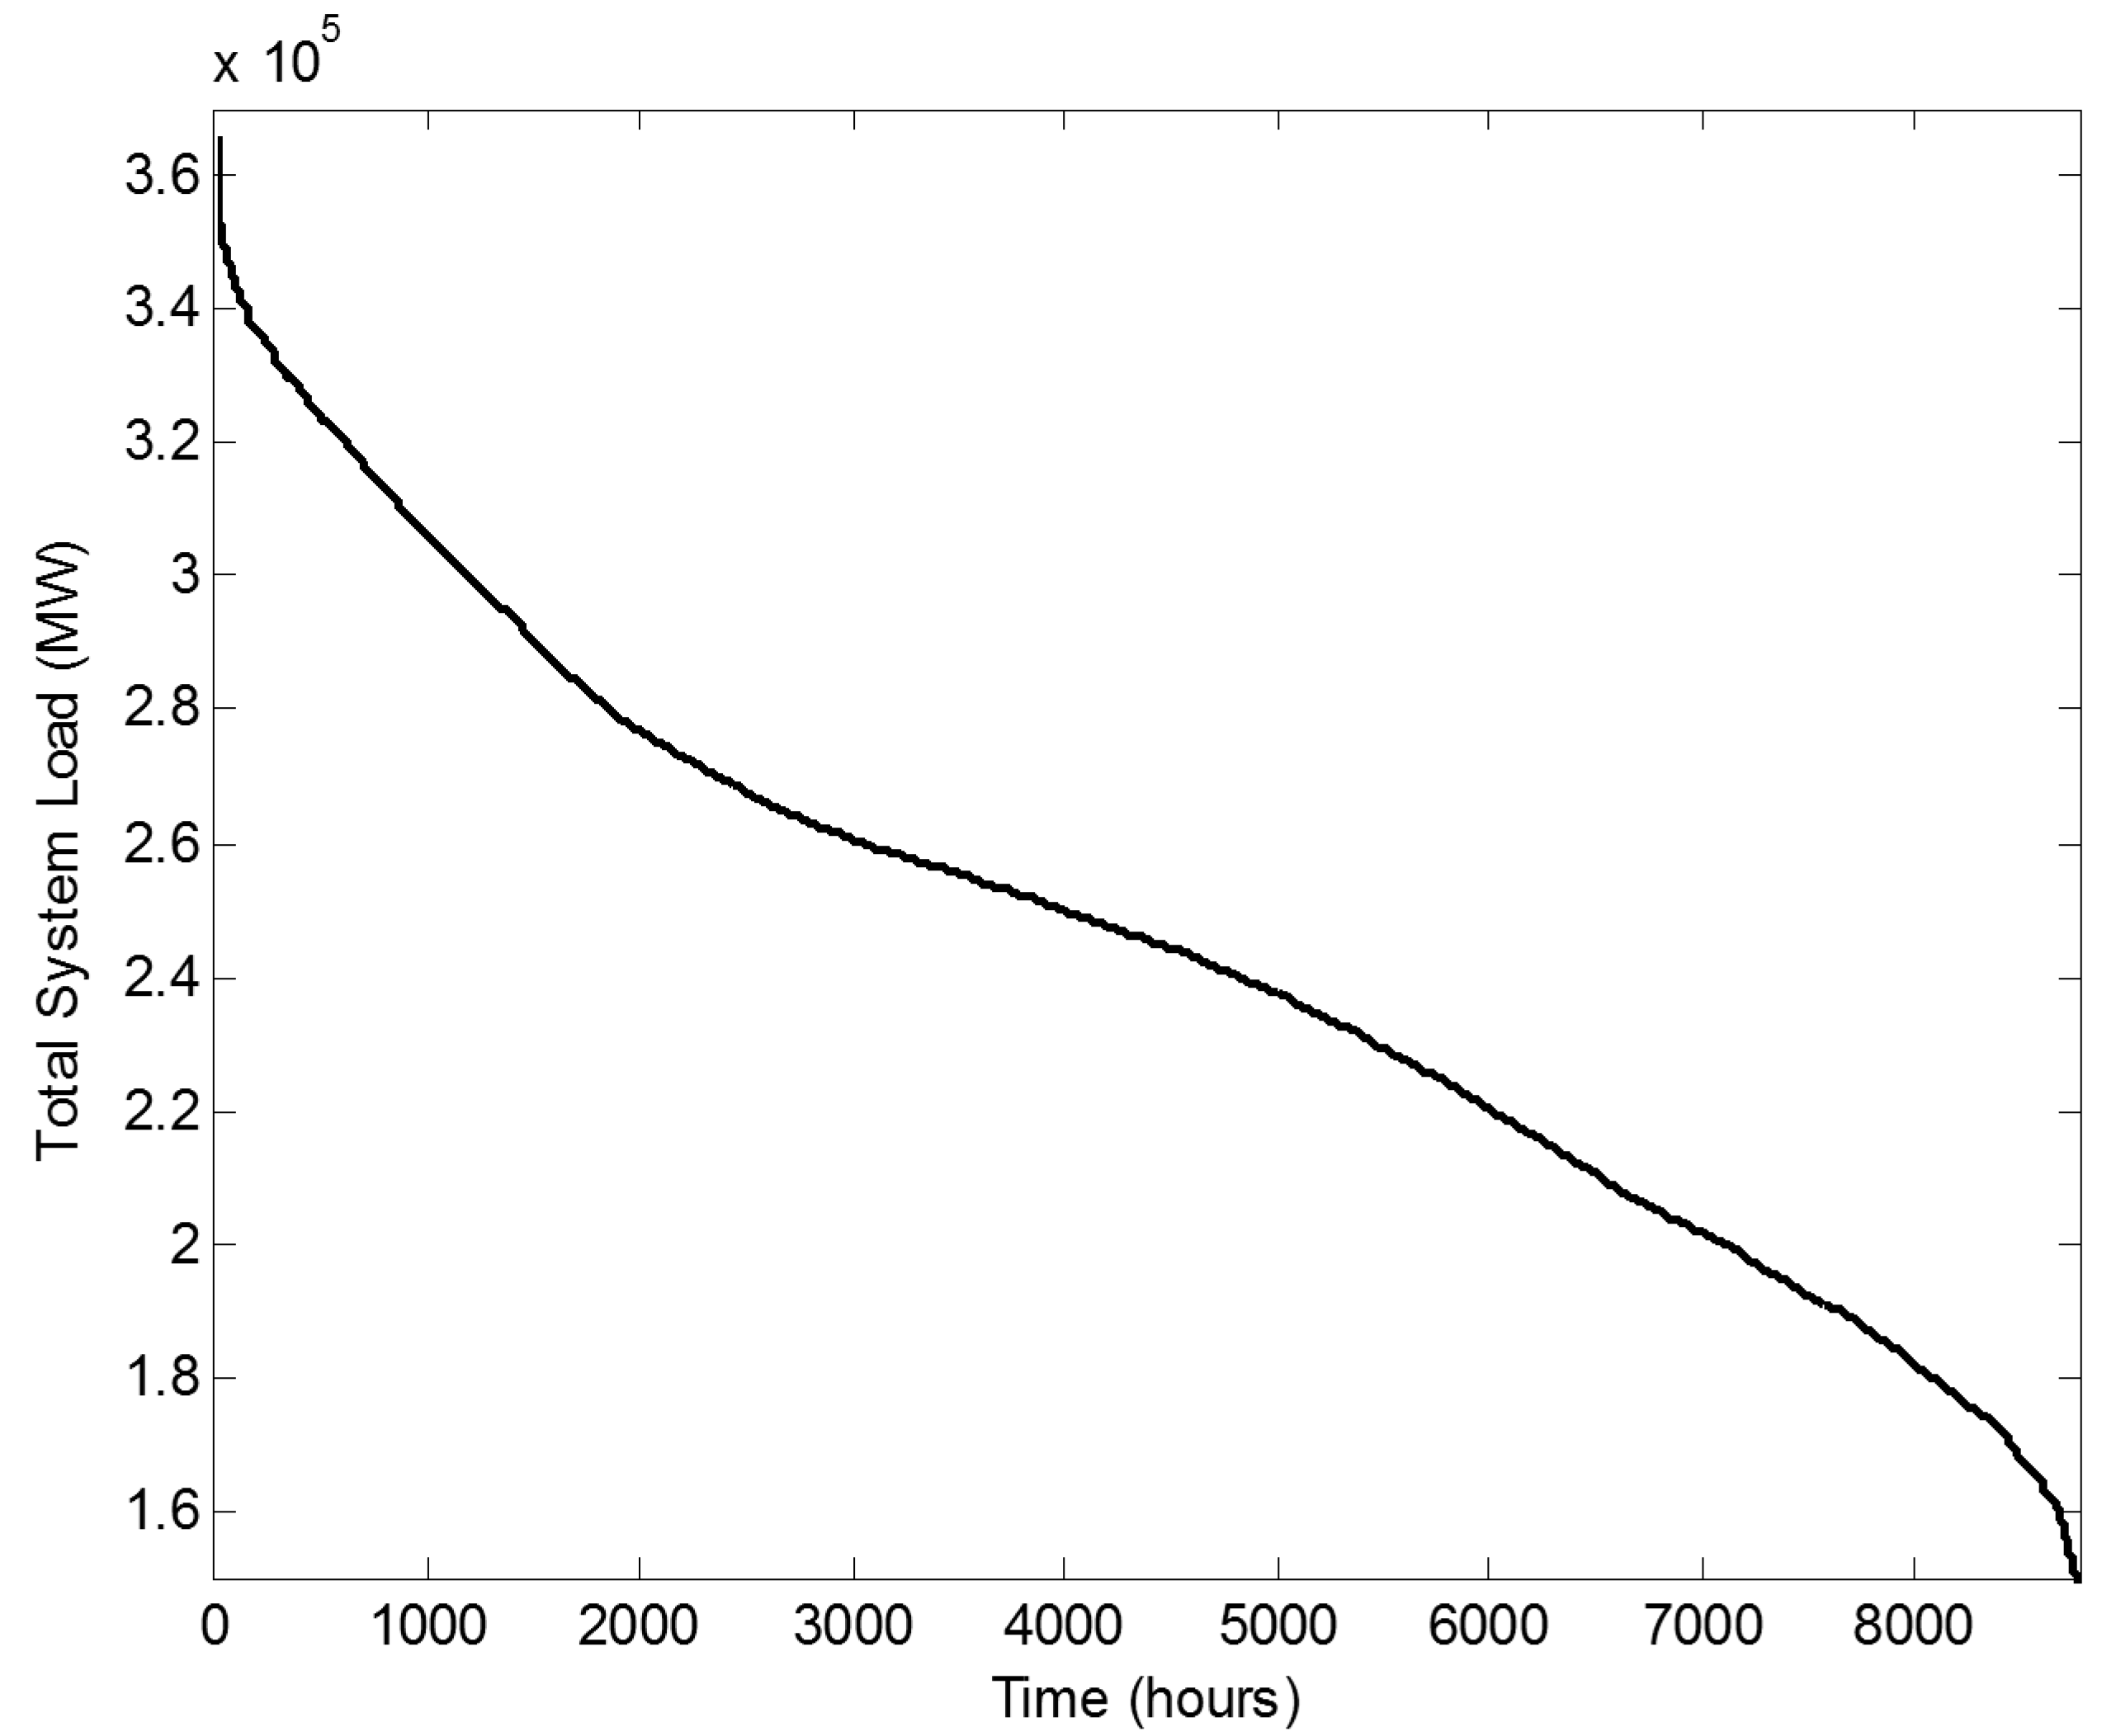
Figure 7.
Load duration curve for the aggregated North Sea countries, year 2030.
Figure 7.
Load duration curve for the aggregated North Sea countries, year 2030.
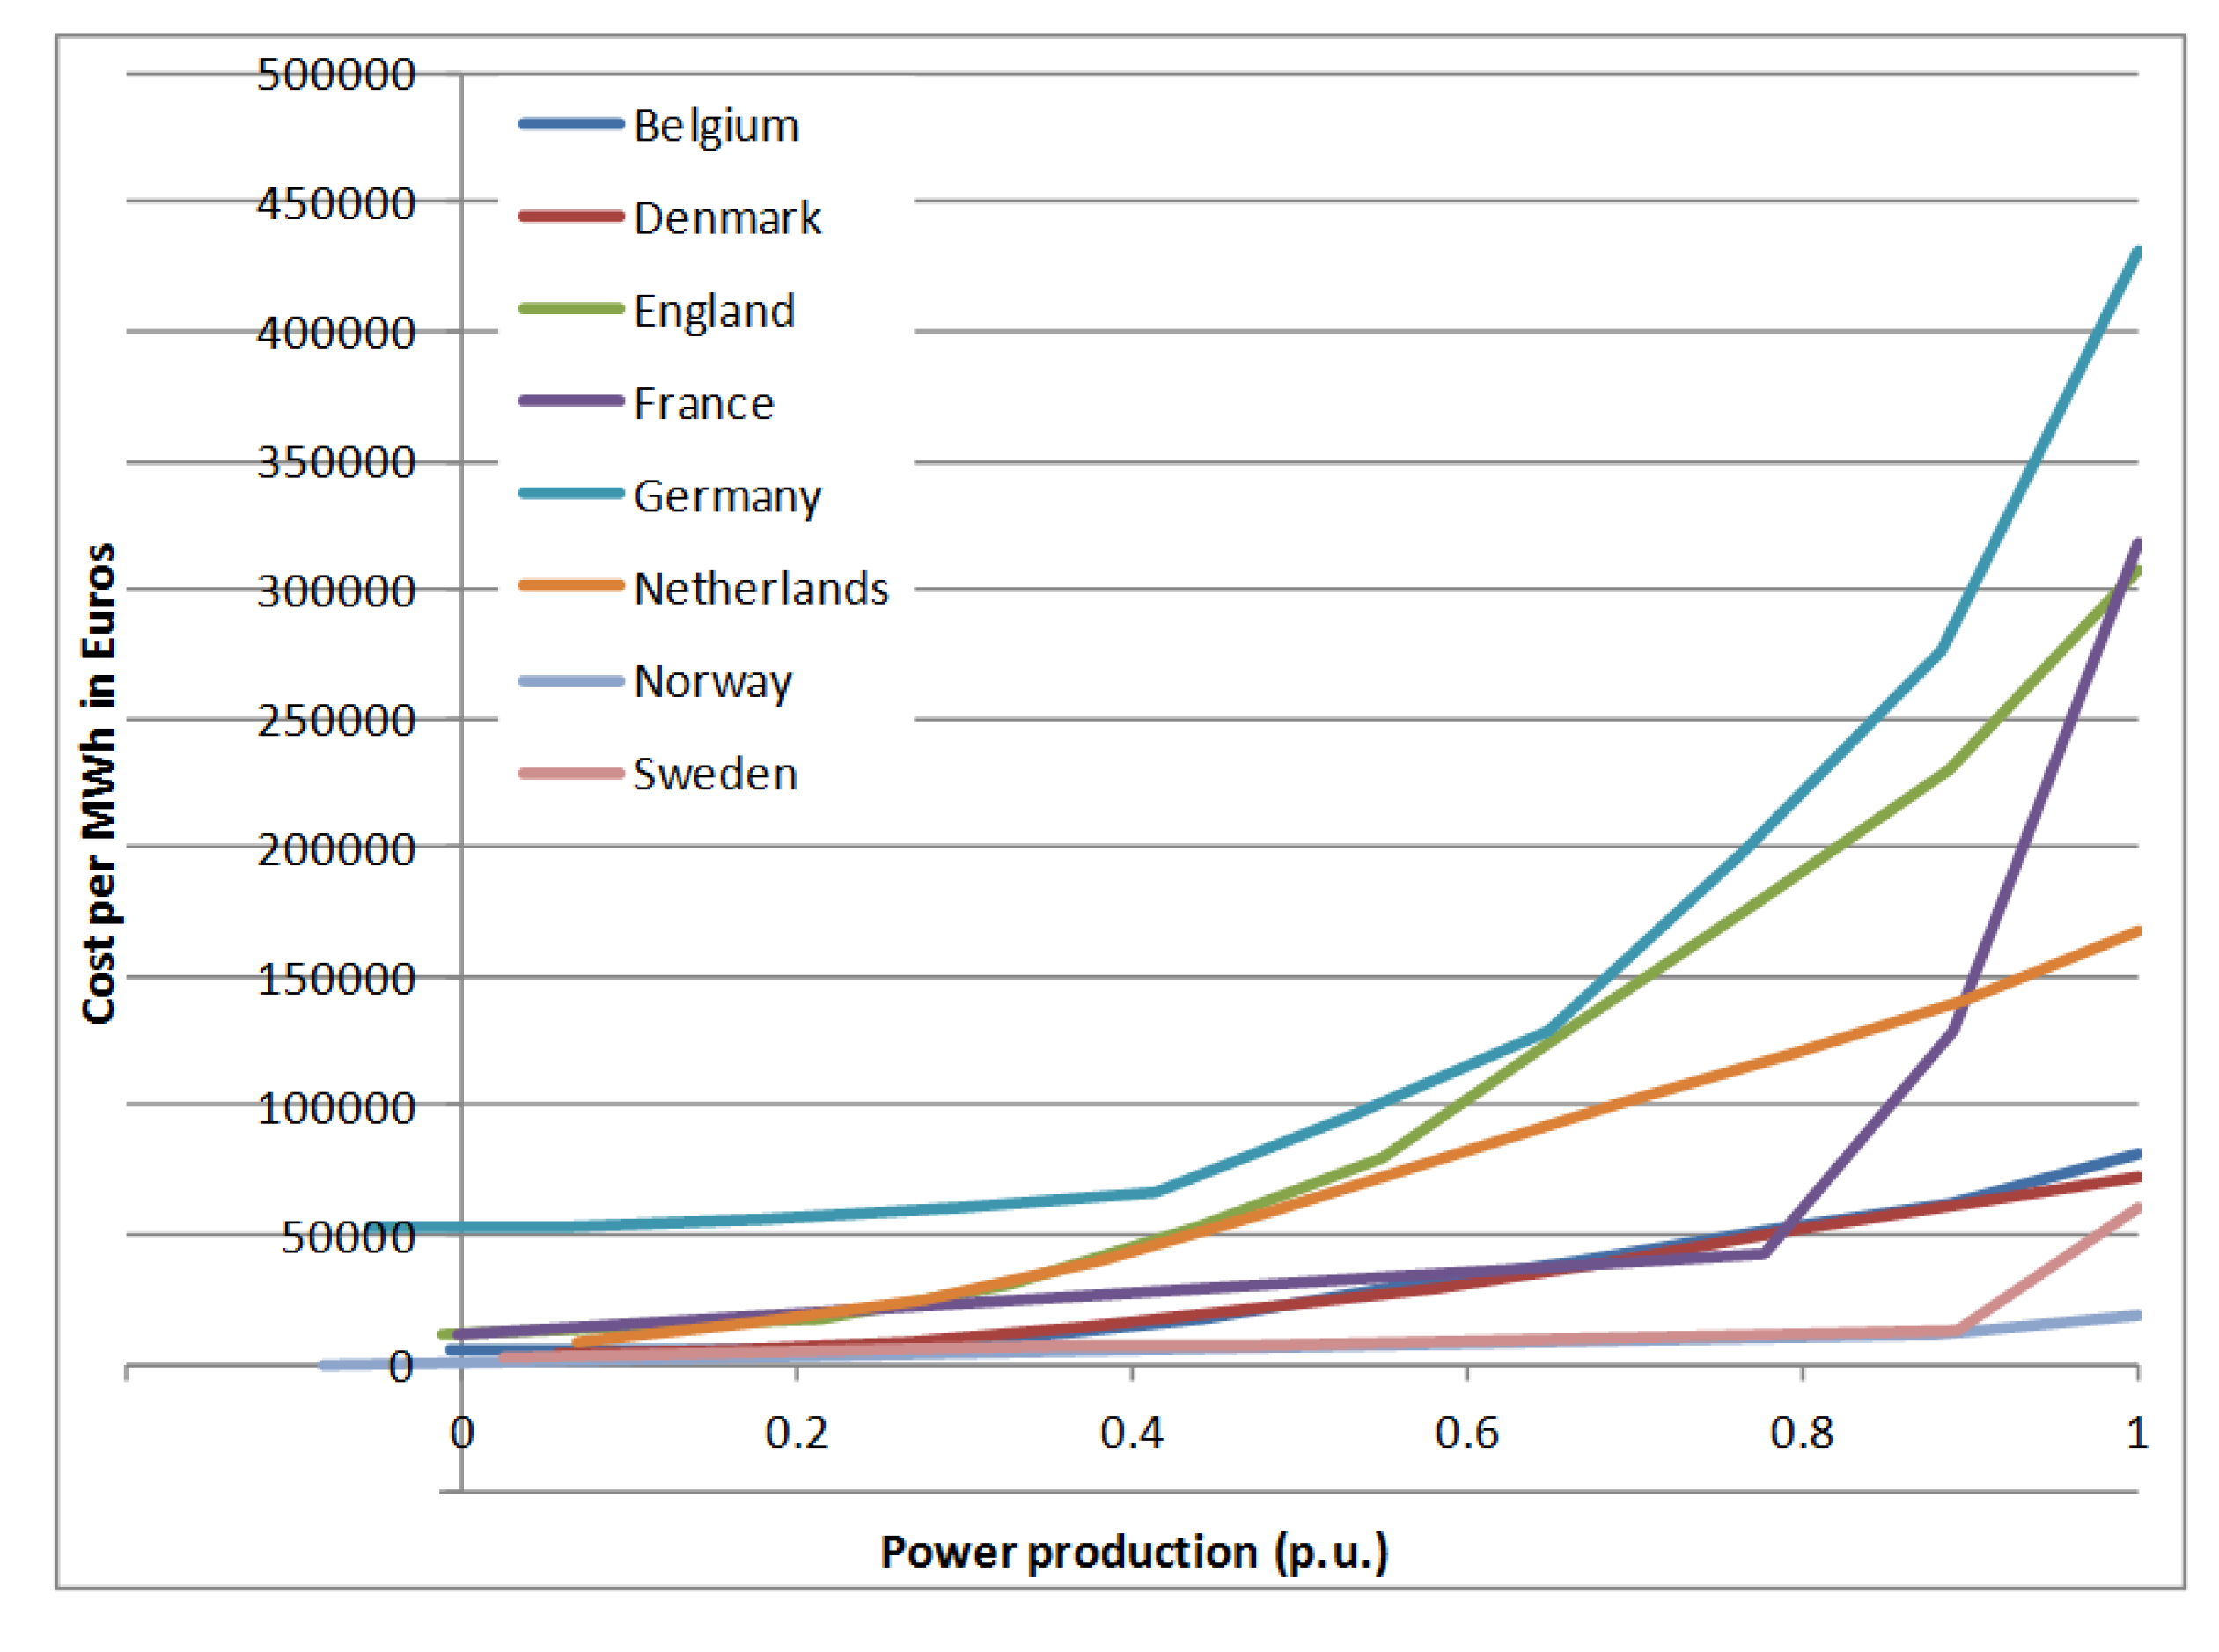
Aggregated generation cost curves were built for each country based on the generation technology mix, efficiency and fuel cost projections for 2030 (see
Table 5 as an example for Belgium). Wind and solar energy are treated as zero marginal cost resources. More details can be found in [
16,
17].
Table 3.
Distribution of generation and load in the onshore network nodes by country.
Table 3.
Distribution of generation and load in the onshore network nodes by country.
| Belgium | France | Netherlands | Denmark | Norway | Germany | Great Britain | Sweden |
|---|
| Node name | (% load) | Node name | (% load) | Node name | (% load) | Node name | (% load) | Node name | (% load) | Node name | (% load) | Node name | (% load) | Node name | (% load) |
|---|
| Antwerp | 15 | Chooz | 50 | Diemen | 20 | Copenhagen | 45 | Bergen | 15 | Bremen | 20 | Birmingham | 13.1 | Arrie | 30 |
| Bruges | 4 | Lille | 50 | Ens | 10 | Fraugde | 9 | Fredrikstad | 7 | Dollern | 60 | Carlisle | 0.4 | Lindome | 60 |
| Brussels | 60 | | | Geertruidenberg | 20 | Landerupgard | 46 | Oslo | 67 | Hanover | 20 | Edinburgh | 2.8 | Söderåsen | 10 |
| Charleroi | 7 | | | Hengelo | 10 | | | Stavanger | 11 | | | Glasgow | 6.9 | | |
| Ghent | 8 | | | Maasbracht | 20 | | | | | | | London | 47.5 | | |
| Liège | 6 | | | Maasvlakte | 20 | | | | | | | Manchester | 19.8 | | |
| | | | | | | | | | | | | Newcastle | 9.5 | | |
Table 4.
Power ranges used for the various types of power plants.
Table 4.
Power ranges used for the various types of power plants.
| Power plant type | Power range |
|---|
| Conventional power plant | Pmin ≤ Pg ≤ Pmax |
| Hydropower | 0 ≤ Pg ≤ Pmax |
| Pumped hydropower | −Pmax ≤ Pg ≤ Pmax |
| Offshore wind farms | 0 ≤ Pg ≤ Pmax = f (Vwind) |
| Onshore wind farms and photovoltaic modules | 0 ≤ Pg ≤ Pmax |
Table 5.
List of Belgium power plants.
Table 5.
List of Belgium power plants.
| Station name | Max power level per unit (MW) | Number of units in station | Min power (MW) | Total power (MW) | Fuel | Efficiency | Fuel cost (€/MWh) |
|---|
| Ccgt_newBE | 500 | 11 | 250 | 5500 | Gas | 0.58 | 6.52 |
| Ccgt_oldBE | 300 | 12 | 150 | 3600 | Gas | 0.58 | 6.52 |
| Coal____BE | 235 | 8 | 117.5 | 1880 | Coal | 0.39 | 2.9 |
| Gas_cv__BE | 217.5 | 2 | 108.75 | 435 | Gas | 0.25 | 15.12 |
| GT_new__BE | 65 | 2 | 32.5 | 130 | Gas | 0.38 | 9.95 |
| GT_old__BE | 25 | 19 | 12.5 | 475 | Gas | 0.25 | 15.12 |
| Nucl____BE | 1030 | 2 | 515 | 2060 | Nuclear | 0.33 | 0.36 |
| Pmp_hyd_BE | 325 | 4 | −1300 | 1300 | Pumped Hydro | 1 | 0.36 |
| Ror_hyd_BE | 116 | 1 | 0 | 116 | Hydro | 1 | 0.36 |
From the data in
Table 2,
Table 3 and
Table 4, the function “fmincon” from the MATLAB optimization toolbox is used to compute an aggregated minimum cost power dispatch for a given production level in each country. The resulting cost curves are shown in
Figure 8.
Figure 8.
Energy cost curves for all countries; production normalized by total installed capacity.
Figure 8.
Energy cost curves for all countries; production normalized by total installed capacity.
3.2. AC and DC Power Grids
The AC onshore grid is a rough approximation based on publicly available data from the ENTSO-e (European Network of Transmission System Operators of Electricity) website [
15]. The overhead high voltage transmission lines are all assumed to have a rated voltage of 380 kV and a capacity of 2500 MW per circuit. The transmissions lines are modeled using the π model equivalent, with a resistive value of 0.035 Ohm/km, a reactance of 0.298 Ohm/km and a shunt admittance of 3.893 μS per km.
Various sophisticated transmission planning methods for the North Sea offshore grid that consider investment, reliability and market aspects have been proposed in [
18,
19,
20]. They are all optimization-based approaches, which can be solved via classical methods for continuous [
18] or mixed-integer optimization [
19] or heuristic ones, such as genetic algorithms in the case of [
20]. In this work, a pragmatic approach is taken when constructing the offshore grid, as its optimal configuration is not our focus, but rather the impact of such a grid on the onshore power systems of the North Sea region.
Several submarine HVDC point-to-point connections already exist or are planned in Europe (see
Table 6). The DC technology is applicable when carrying power over long distances or when it is desirable not to couple two separate synchronous AC systems.
Currently, most existing offshore wind farms are connected to shore via an AC cable. This can be done, as the distances are short (less than 60 km). With the remoteness between wind farms and shore, an increasing number of wind farms will be linked via DC connections, whose higher transmission efficiency begins to compensate for the larger initial investment compared to AC.
Pushing the concept further, some remote wind farms will be connected to shore via other wind farms, sharing the cost. It is even proposed [
1,
2,
3] to build a DC power grid in the North Sea to efficiently interconnect not only the wind farms, but also the countries bordering the North Sea.
Table 6.
List of existing point-to-point DC connections.
Table 6.
List of existing point-to-point DC connections.
| Cable name | Start | End | Length (km) | Voltage (kV) | Power (MW) | Service year |
|---|
| NorNed | Feda | Eemshaven | 560 | 450 | 700 | 2007 |
| BritNed | Isle of Grain | Maasvlakte | 260 | 450 | 1000 | 2010 |
| Skagerrak 1-4 | Kristiansand | Tjele | 240 | 400 | 1750 | 1993 |
| HVDC Cross-Channel | Sellindge | Les Mandarins | 73 | 270 | 2000 | 1986 |
| Konti–Skan | Lindome | Vester Hassing | 87 | 300 | 300 | 1988 |
| HVDC Storebælt | Fraugde | Herslev | 58 | 400 | 600 | 2010 |
| Scotland–Norway interconnector | Peterhead | Kvilldal | 570 | 300 | 1400 | 2020 |
| Baltic Cable | Lubeck | Arrie | 262 | 450 | 600 | 1994 |
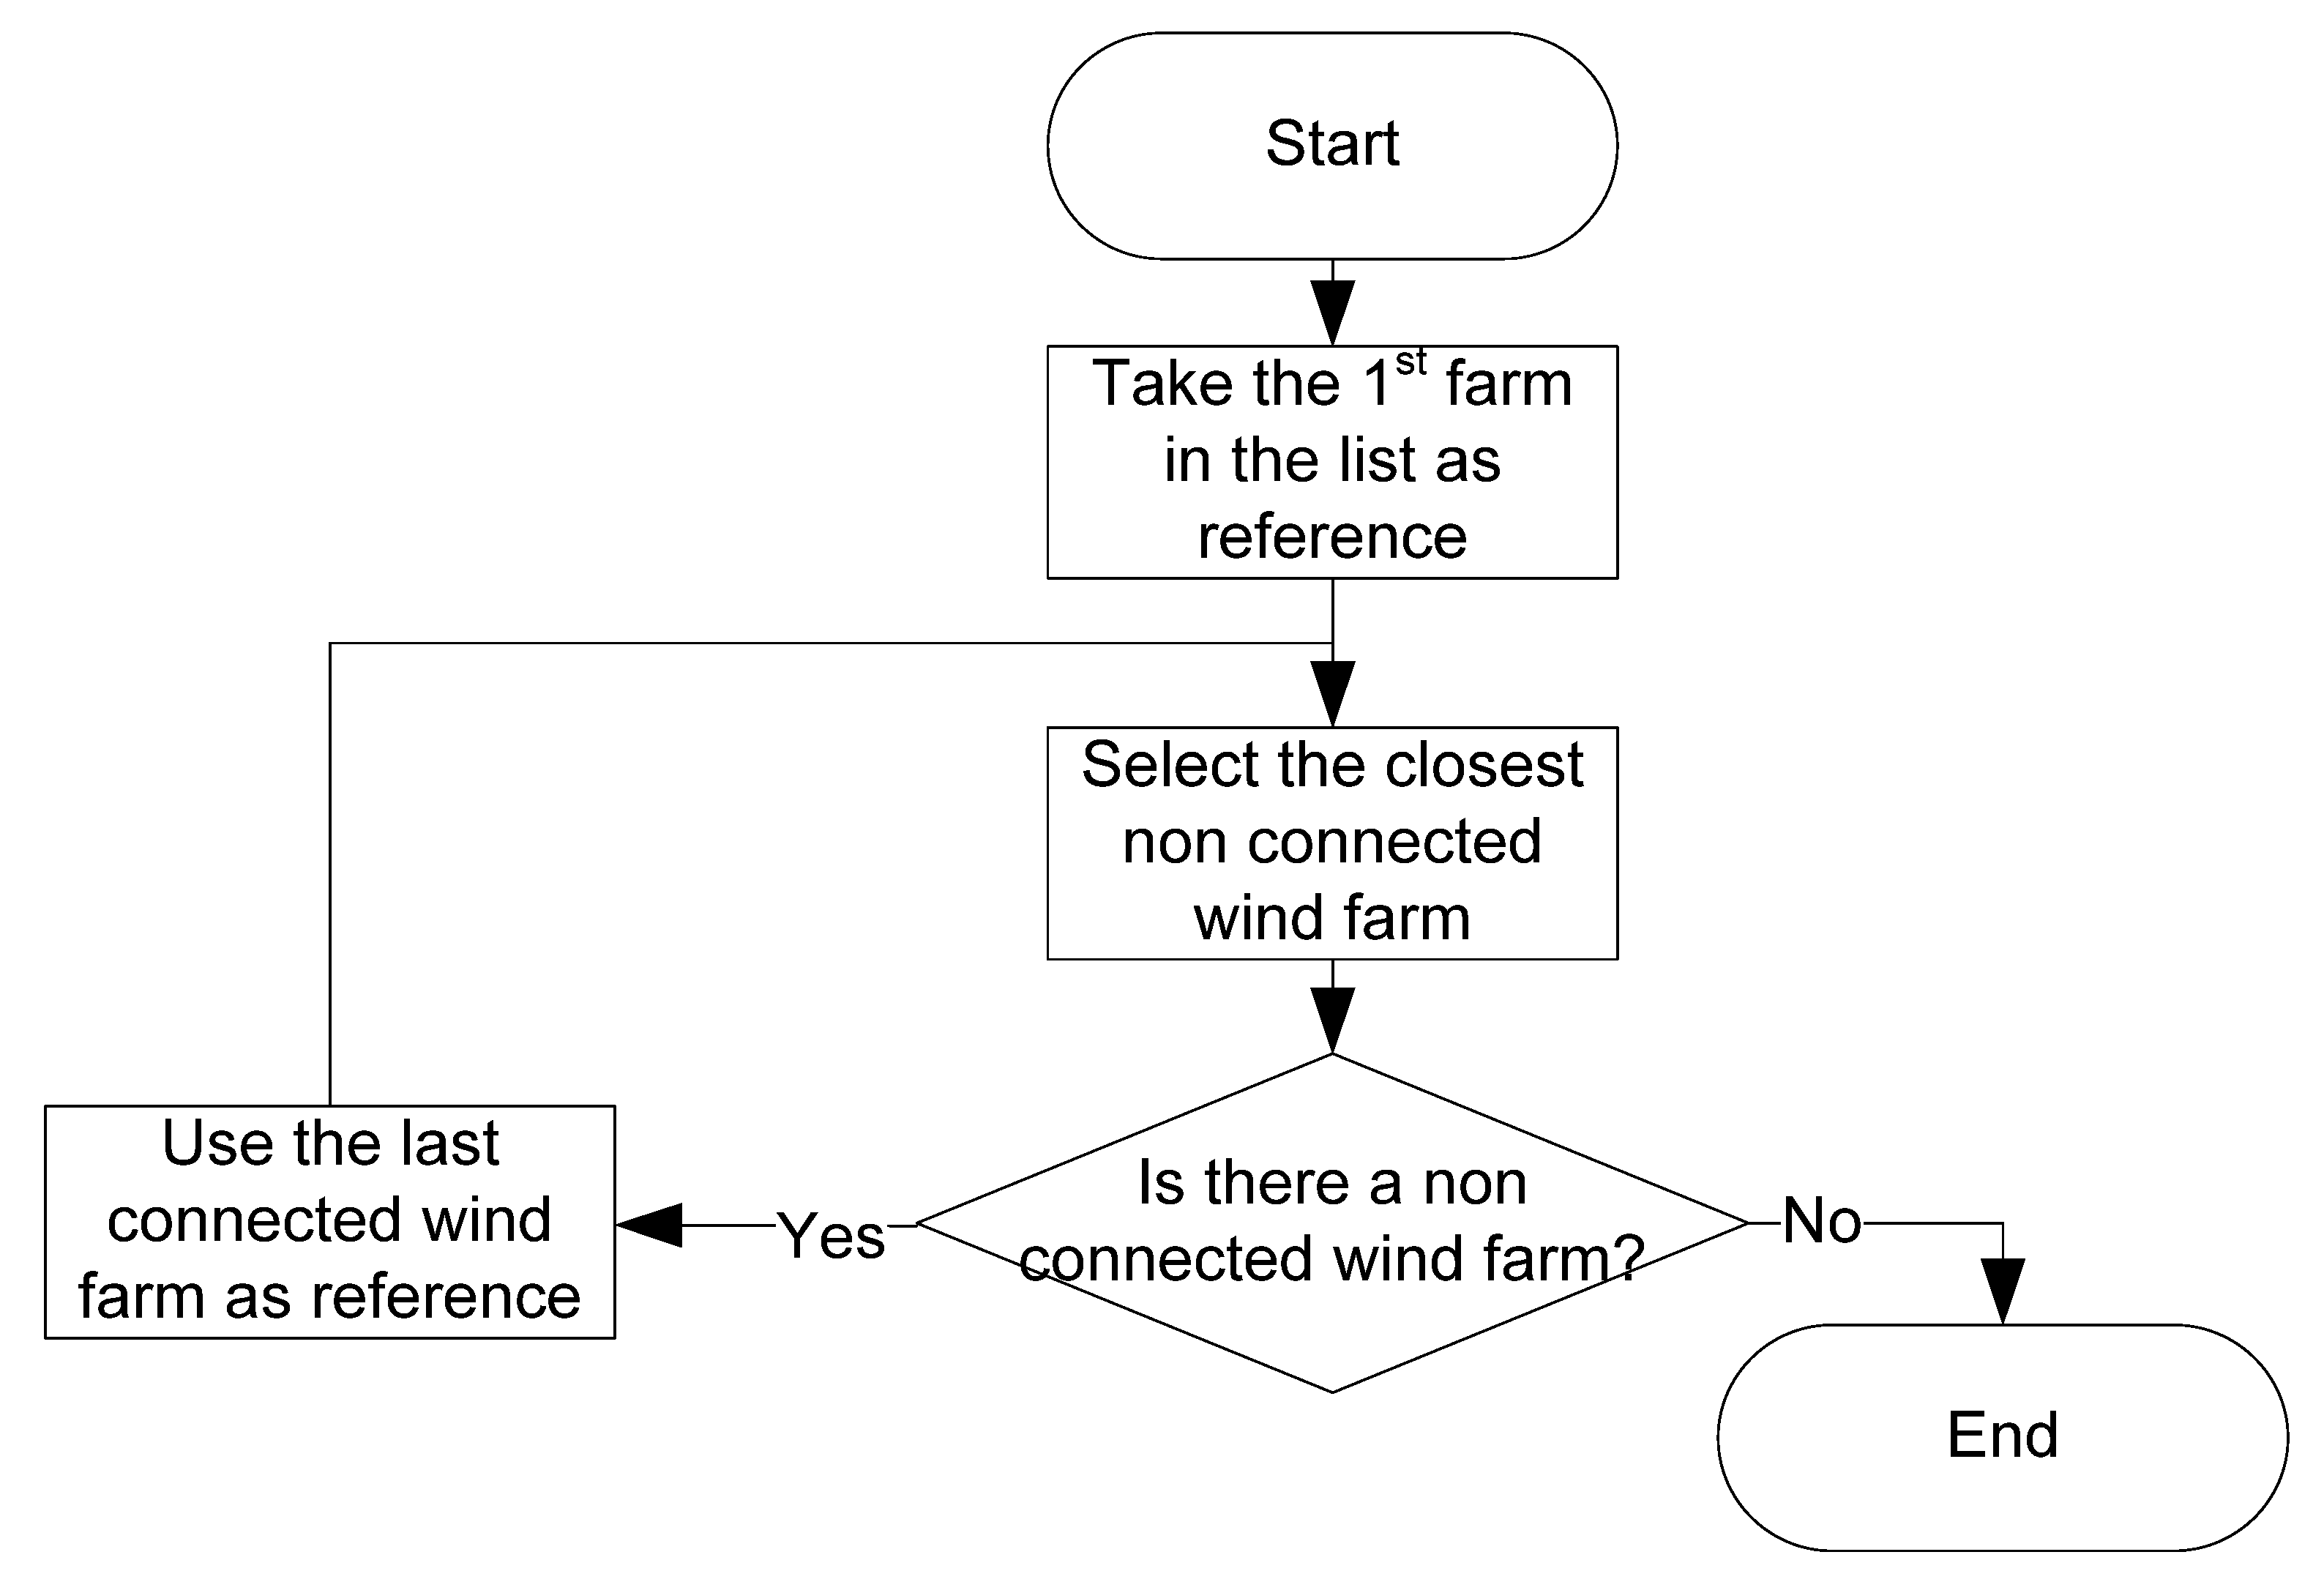
This option is considered in this paper. To model the DC offshore grid, the 177 selected wind farms are chained to build a skeleton grid, following the flowchart in
Figure 9. The initial connection capacities are set as 2000 MW, based on the current status of HVDC technology for point-to-point links (see the largest value in
Table 6). The interconnections in the DC grid are optimized via successive power flow computations by updating both the capacities and connections between nodes, with the aim of avoiding overcapacities, as well as bottlenecks. The process is completed when the utilization of the wind farm potential is above 99% for all wind farms. We chose a large utilization percentage, as we did not want bottlenecks in the grid to be a limiting factor in the integration of offshore wind.
Figure 9.
“Greedy” interconnection algorithm for DC-connected offshore wind farms.
Figure 9.
“Greedy” interconnection algorithm for DC-connected offshore wind farms.
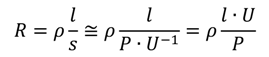
Whereas the resistive value of the AC cables is assumed constant per unit length (regardless of their capacity), a more precise modeling is necessary for the DC cables to avoid bottlenecks and convergence issues. Consequently, the resistance values per kilometer may vary from a DC cable to another, depending on their rated voltage and capacity. Assuming copper cables in a DC bipolar system with a voltage of ±450 kV and a maximum cable current density of 1 A mm
−2 [
21], the resistance of the conductors is computed with the formula:
with:
R: total cable resistance in Ω;
ρ: copper resistivity: 16 × 10
−9 Ω m
−1 ;
l: cable length in m;
P: maximum power carried by the cable in W;
U: voltage of the cable in V.
The length values are doubled to represent the two monopole paths of a bipolar DC link.
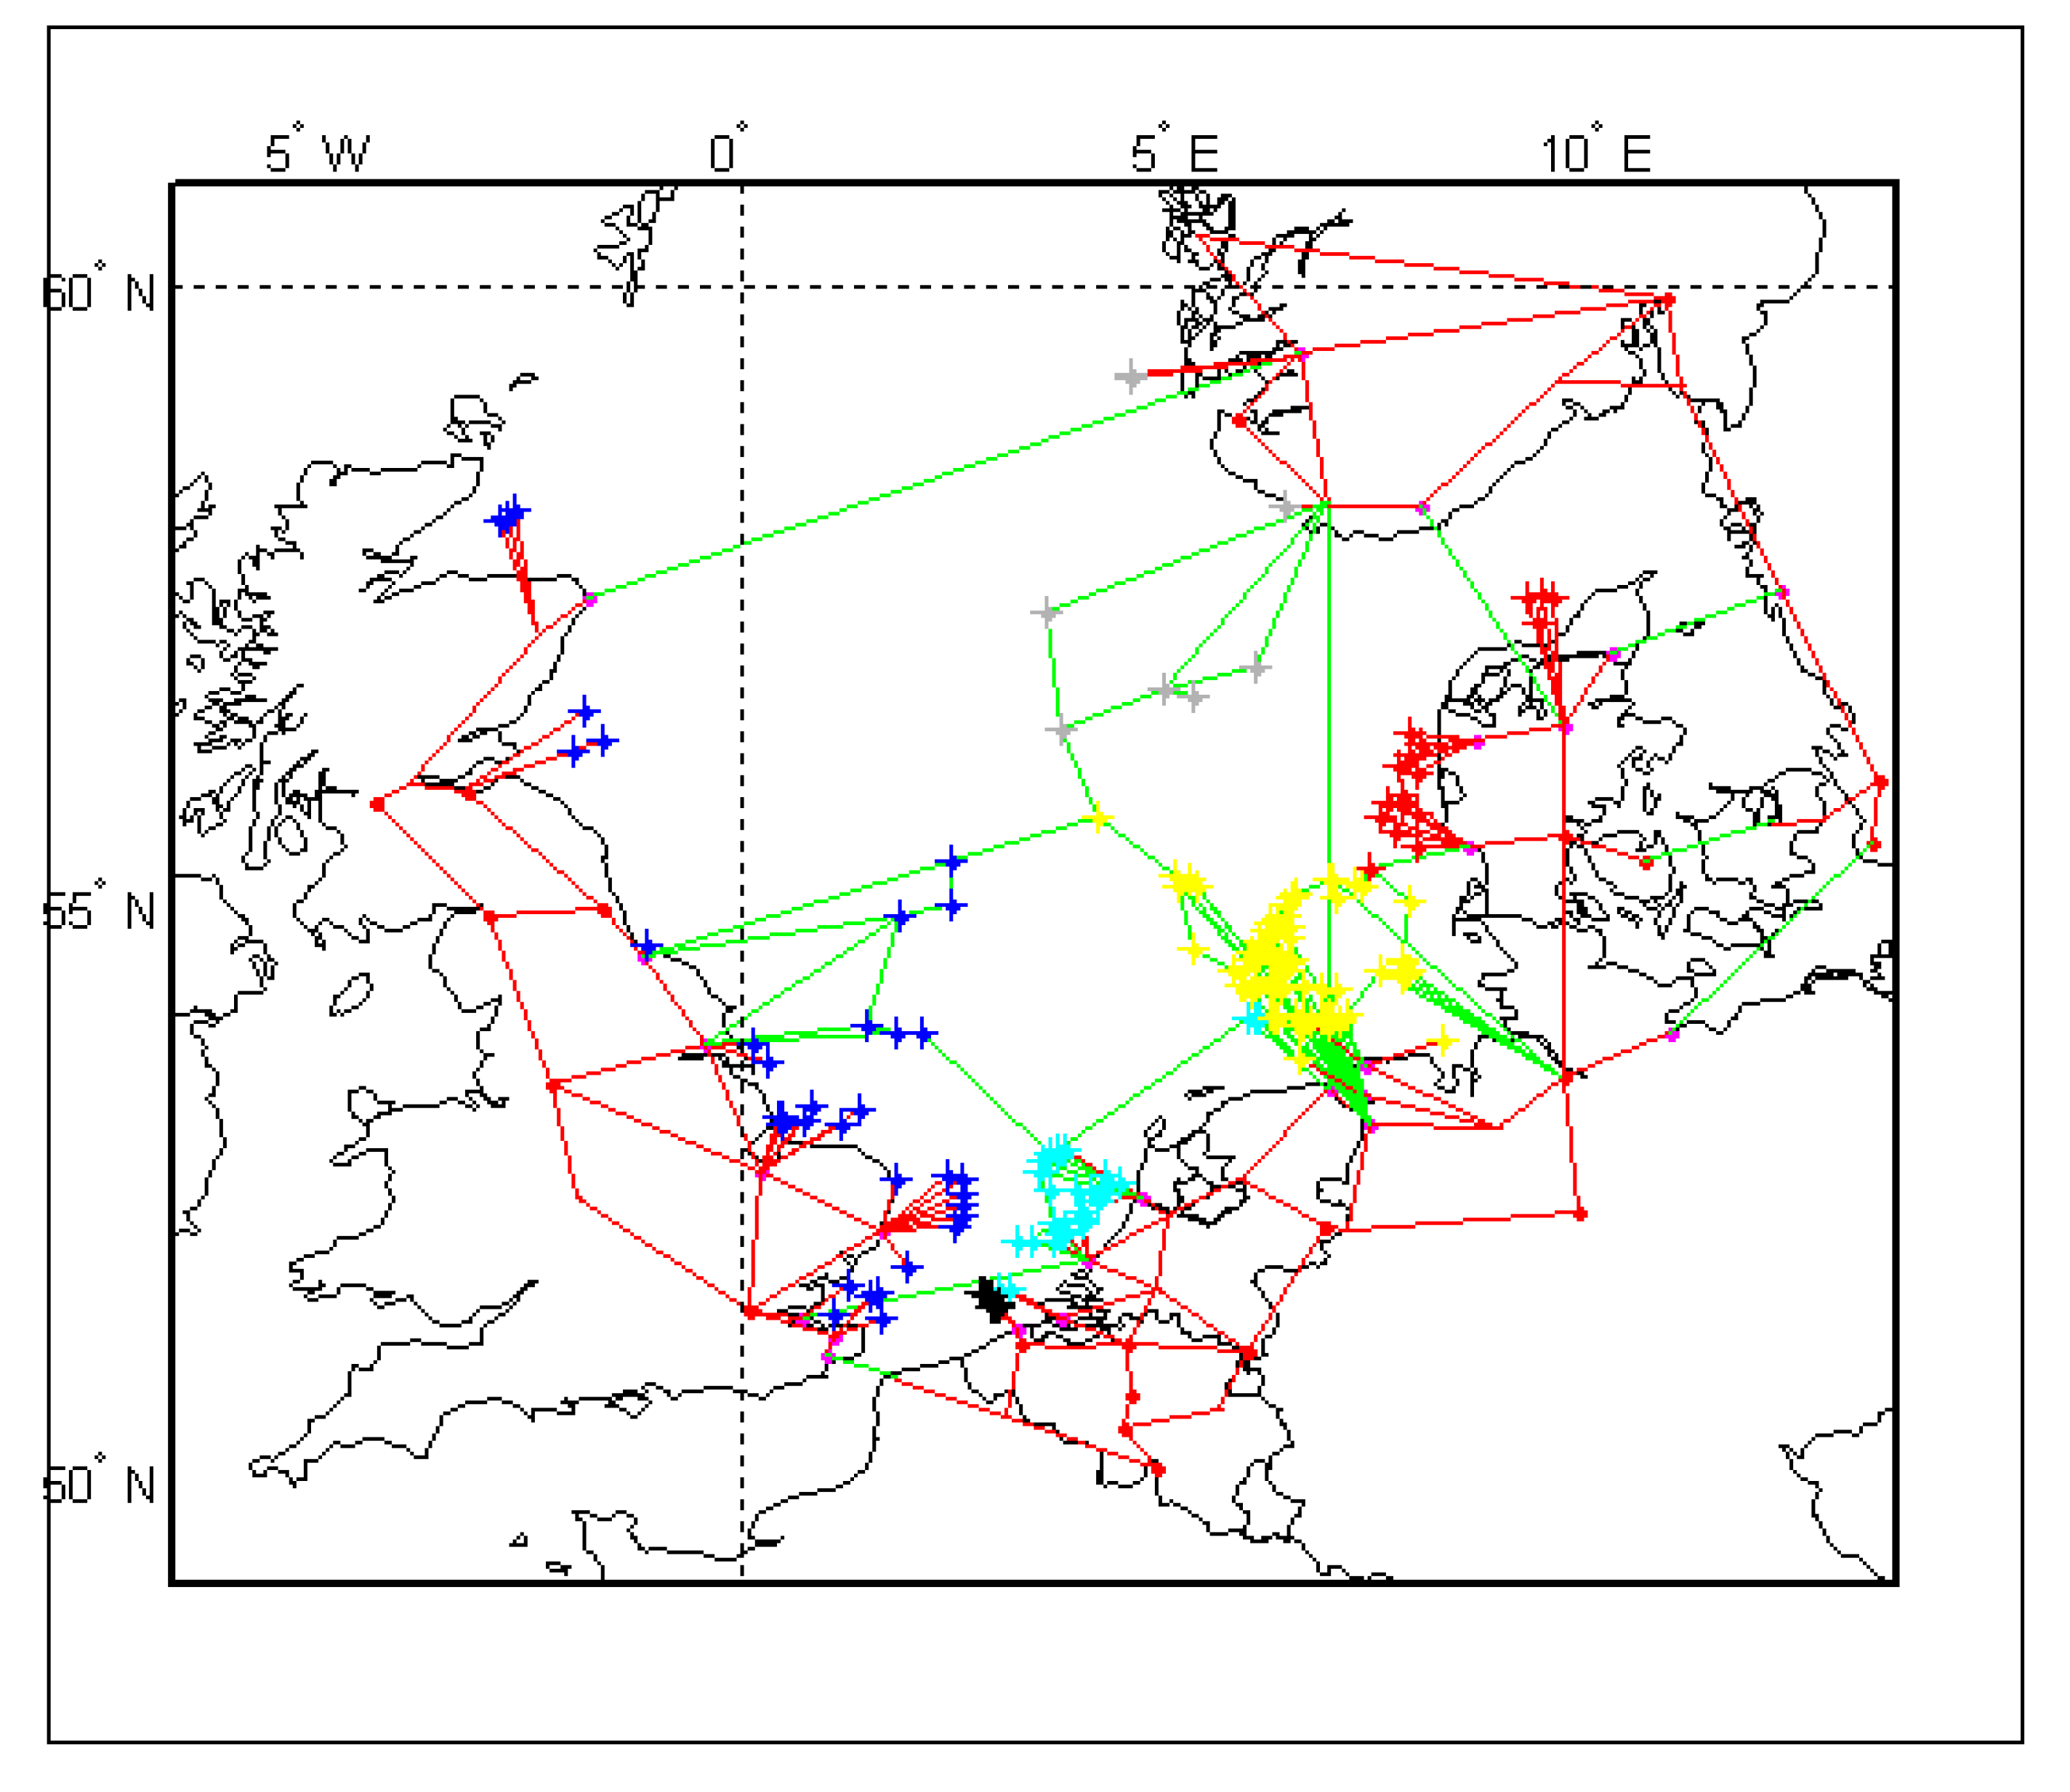
The schematic of the resulting hybrid transmission grid is displayed in
Figure 10. The AC lines are in red, and the DC lines in green. Each cross represents an offshore wind farm.
3.3. Interconnection of AC and DC Grids and Optimal Power Flow
At this moment, MATPOWER [
22], the tool chosen to perform the steady-state power flow computations, is able to simulate AC grids and HVDC point-to-point connections. This limitation is not an issue for a study of the current network, as existing DC links are only point-to-point connections between two AC grids (see
Table 6). However, in the case of this paper, an optimal power flow-based simulation of a DC grid interconnected with three AC grids is needed.
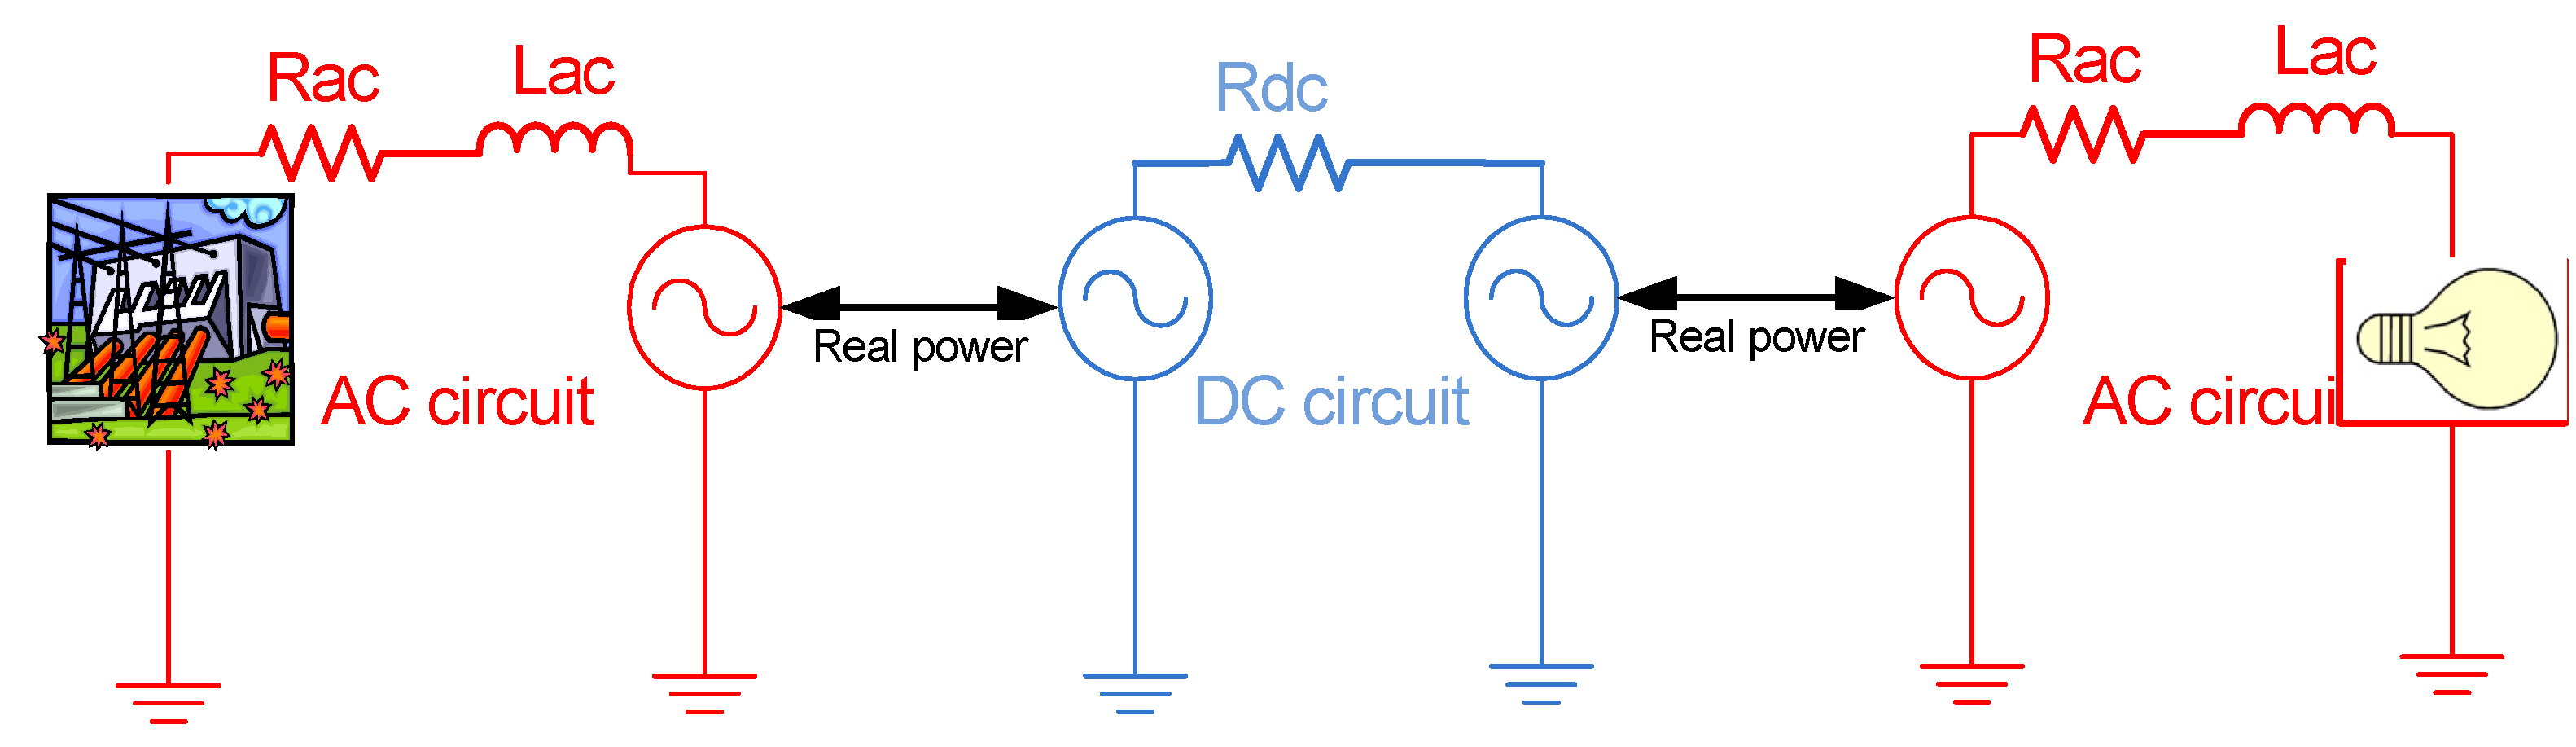
A DC grid can be approached as an AC grid with nominal frequency set to zero. Consequently, only the resistive value of the transmission cable has an influence on the power and voltage. From this assumption, a classical AC optimal power flow tool, like MATPOWER, can be used. To enable the connection between asynchronous AC grids, the “HVDC” point-to-point link model in MATPOWER is used, with converter losses neglected. This HVDC connection transfers the active power from one part of the circuit to another, as illustrated in
Figure 11 by the black arrows.
Figure 10.
Proposed hybrid AC-DC high-voltage grid, 2030 scenario.
Figure 10.
Proposed hybrid AC-DC high-voltage grid, 2030 scenario.
Figure 11.
AC-DC interconnected system for optimal power flow simulations. Rac and Lac are the resistance and inductance parameters of the AC systems; Rdc is the resistance of the DC offshore grid.
Figure 11.
AC-DC interconnected system for optimal power flow simulations. Rac and Lac are the resistance and inductance parameters of the AC systems; Rdc is the resistance of the DC offshore grid.
By using this model, it is possible to simulate both AC and DC grids simultaneously. The optimal power flow feature from MATPOWER [
22] is used for each hour of the three simulated years. MATPOWER uses the standard built-in functions of the MATLAB optimization toolbox. As widely accepted in the literature, the optimization problem is set up to satisfy the load demand, while minimizing the operating cost of generation sources (using the fuel cost curves shown in
Figure 8), respecting the power limits on generators (see
Table 4) and transmission lines and, also, bus voltage ranges. Since the optimization tool uses a full non-linear AC power flow for the onshore grid, some convergence issues were encountered, which were dealt with by relaxing the voltage constraints to a 0.8–1.2 p.u. range. In future studies, the onshore grid would have to be modeled more accurately than what could be realized using publicly available information here and strengthened with proper reactive power support, so that voltages are brought to a ±10% operating range centered around 1 p.u. Other modeling limitations are discussed below in
Section 3.4.
3.4. Modeling Limitations
The modeling is quite simple, yet adequate for long-term power system planning studies, where many assumptions are necessary to deal with an uncertain future. The merit order for generation sources is based on variable (fuel) cost only, assuming zero costs for renewables. Conventional power plants have no ramp rate limitations, no start-up costs and no minimum up and down times. A more detailed, unit commitment-based modeling for generation sources in the case of Continental Europe has been done in [
5,
23,
24]. Furthermore, since no limitation is modeled for the energy storage capacity of pumped hydro, this technology might be overused as a buffer in the simulations, to absorb the shortage and surplus in production. In general, the behavior of conventional units is idealized by assuming maximum flexibility. All these assumptions lead to optimistic results regarding the amount of wind energy that may be integrated by 2030. As mentioned in
Section 3.1, assessing the consequences of wind on the onshore grids cannot be done with this simple model; refer to [
5] for a more precise assessment. The same can be said regarding dimensioning the offshore grid, which is not based on economic considerations, such as a cost-benefit analysis, but simply on facilitating the integration of all but 1% of the wind energy available from the offshore sites. However, by removing the above-mentioned limitations, we are creating an extreme scenario for the experienced ramp rates due to wind power variability in the North Sea. The assumptions are justified, since our goal is to estimate this resource variability and its most severe consequences for the power systems of the North Sea countries.
4. Results
The influence of the DC offshore grid is determined by looking at the power variations seen by each synchronous area over intervals of one to four hours. These two intervals, respectively, are of concern for the allocation of the load-following reserve and the commitment of generating units. The power variation is evaluated by subtracting from the native load the sum of the power injected into (or withdrawn from) the DC grid in each area. The simulation results highlight the impact of a meshed DC grid and the integration of large amounts of offshore wind power on the onshore AC grids. The power injected by the DC grid in each of the three synchronous areas increases the variation in their net load, as seen by the conventional generators (see
Table 7). The increase is predictably more significant when we look at longer time intervals; however, it is still small (6%) for Continental Europe and moderate for the British grid, with a change of 29% over four hours. In Scandinavia, load variations are currently smaller than in other regions, but are expected to double with the addition of offshore wind. This could be a concern for conventional generators, as they will be operated more dynamically, with more start-ups, shut-downs and ramping events. However, the synchronous regions also have different capabilities to cope with variations. The amount of flexible generation can be estimated by aggregating installed capacities for hydropower (including pumped hydro storage), gas, oil and biomass in each zone. The results amount to 50% flexible generation available in Continental Europe, 55% in Great Britain and 82% in Scandinavia. In particular, thanks to its large hydro-power fleet, Scandinavia may be able to cope with this large increase in expected variability. In contrast, the Continental and Great Britain synchronous zones have a more rigid electrical power production portfolio.
Table 7.
DC grid influence on the net load variability seen by each synchronous area.
Table 7.
DC grid influence on the net load variability seen by each synchronous area.
| Time interval | Synchronous area | Load (GW/h) | Load-DC injection (GW/h) | % change | Impact on reserves |
|---|
| 1 hour | Continental | 25 | 26 | 4% | Limited impact |
| Scandinavia | 5 | 9 | 80% | Higher need for load following reserve |
| Great Britain | 9 | 10 | 11% | Limited need for extra load following reserve |
| 4 hours | Continental | 62 | 66 | 6% | Limited impact |
| Scandinavia | 11 | 20 | 82% | Higher need for extra unit commitment |
| Great Britain | 21 | 27 | 29% | Moderate need for extra unit commitment |
5. Conclusions
This paper has employed meso-scale reanalysis wind speed data to evaluate the possible size of power variations over intervals of one to four hours for a future scenario of offshore wind power in the North Sea. An examination of all time steps of three complete years of 10-min resolution data indicates that for certain periods of each year, simultaneously high wind speeds over large offshore areas can occur and have a significant impact on the aggregated power production of the wind farms. Conventional and renewable generation sources for the countries bordering the North Sea were modeled so that a more realistic representation of the effects onshore could be considered. A method was devised to adapt the AC optimal power flow computation tool, MATPOWER, to solve the market trading problem for an AC-DC hybrid system.
Concurrent wind speed measurements across a wide area are preferable to meso-scale data, but are not practically available for the whole North Sea region. The data used in this paper allow only estimates of variability in advance of more detailed investigations. As meso-scale simulations are smoother than measurement data [
9,
17], it is likely that variability is not overestimated in this study. Simultaneous influences of the electricity trade and offshore wind generation appear to cause an increase in the variability of the net load, as seen by the onshore systems. However, as this study could not model in detail the future generation fleet of associated countries, the changes observed are only an approximation of how such ramps might distribute over the interconnected areas. For the simplified power system studied, this increase appears to be relatively small in the case of Continental Europe and moderate in the case of Great Britain. In the case of Scandinavia, the net load variability roughly doubles with the introduction of offshore wind. However, due to the high flexibility of hydro power generation, this is not expected to cause severe problems. More detailed studies that incorporate future technico-economic characteristics and ramp rate constraints of conventional units and reservoir limitations of hydro power plants are needed to confirm this hypothesis.


