Article

Households’ Willingness-to-Pay for Fish Product Attributes and Implications for Market Feasibility of Wastewater-Based Aquaculture Businesses in Hanoi, Vietnam

1
Ministry of Health and Wellness, Government of Alberta, 10025 Jasper Avenue, Edmonton, AB T5J1S6, Canada
2
Resource Recovery and Reuse, Water Quality and Health Research Group, International Water Management Institute (IWMI), P. O. Box 2075, Colombo 10120, Sri Lanka
3
Vietnam National University of Agriculture (VNUA), Trau Quy, Gia Lan, Hanoi, Vietnam
*
Author to whom correspondence should be addressed.
Resources 2017, 6(3), 30; https://doi.org/10.3390/resources6030030
Submission received: 29 April 2017 / Revised: 22 June 2017 / Accepted: 10 July 2017 / Published: 21 July 2017

Abstract

:
A choice experiment was used to assess households’ willingness-to-pay (WTP) for informational attributes (sources of water used to rear fish, and certification) of fish products in Hanoi, Vietnam. The study showed that households’ purchasing decisions are influenced by their access to information of food product attributes and ascribe an economic value to it. The results indicated that households are willing to pay 51% (USD 1.11 per kg) above the prevailing market price of fish for information to know if wastewater is used to rear the fish they consume. Similarly, they are willing to pay 20% above the prevailing market price of fish (USD 0.43 per kg) to know if freshwater is used as a rearing medium. It is important to note that the increased marginal WTP is for information on whether the fish they consume is raised in wastewater over freshwater. This supports the notion of households’ concern over the safety of consuming wastewater-raised fish. Households are also willing to pay 65% (USD 1.42 per kg) above the prevailing market price for certified fish. Based on the cost of fish certification and WTP estimates, we found a total economic benefit of USD 172 million for the implementation of a wastewater-raised fish business model in Hanoi. The demand for wastewater-raised fish is likely to be affected by households’ perception of certification by a trusted government agency, source of water used to raise the fish, age, income and household size.

1. Introduction

In 2050, the challenge of providing food, water and nutritional security will be greater for households and communities. This pressure stems from increasing urban demand on natural resources including land, water and energy [1]. These issues will be predominant in many arid and semi-arid countries, where water is already in limited supply and is increasingly becoming scarce with climate change uncertainties. Policy makers in these countries are challenged to consider other viable options including market-based approaches that can lead to achieving sustainable water resource management for current and future generations. The concept of “circular economy” which builds on the resource recovery and reuse paradigm shift has been proposed because it offers the opportunity to augment sustainable use of water resources and increase food security.
There are increasingly innovative business-oriented reuse systems such as wastewater-based aquaculture that can enhance the pace of investments in a “circular economy”. Greater wastewater reuse can enhance social benefits, provided health and environmental risks can be managed appropriately. The majority of wastewater reuse for aquaculture in the world today occurs in Asia, where it is a traditional practice in countries such as Vietnam and China [2]. Many international organizations such as the UNDP and World Bank are promoting the adoption of an integrated system of wastewater treatment plants and aquaculture in developing countries [3]. These systems have the potential to improve sanitation because they provide low treatment cost options to policy makers and have the opportunity to reduce nutrients and pathogens in wastewater.
In several cities in northern Vietnam, the use of wastewater in agriculture is the only means of treatment and fertilizes about 500 ha of fish ponds [4,5]. From a public sector perspective, the sale of fish and aquatic plants represent opportunities to offset the costs of the wastewater treatment. This trend is supported by national estimates of Vietnam, which indicates that wastewater-based aquatic products have the potential to generate a revenue of approximately $5760 per ha per year for vegetable production and $7200 per ha per year for fish production, which is three times higher than that of rice production, a major local staple crop [6]. The food security perspective of wastewater-based aquaculture cannot be ignored especially in view of the limited availability of reliable fresh water sources for sustainable aquaculture production. Wastewater represents an important source of nutrients and water, which can be used to increase both fish and crop production [7]. Wastewater-based aquaculture accrues significant social benefits, via employment generation, fish for households, service providers such as producers of fish fingerlings, and economic actors involved in fish transport and marketing.
While the potential benefits of wastewater use for aquaculture are multi-fold and significant, a number of driving factors are anticipated to influence the use of wastewater in aquaculture in the future. A key factor that threatens wastewater-based aquaculture is the perceived consumer health risks. The World Health Organization (WHO) has developed specific guidelines for the safe use of wastewater for aquaculture to ensure public health protection [5]. The guidelines recognize the need for public health standards to be based on epidemiological rather than microbiological guidelines, as these guidelines are context specific [5]. Many studies show that there is no strong evidence of health risks from the consumption of wastewater-raised fish [3]. Supporting studies from India and Egypt [8,9] suggest that fish reared in treated wastewater-raised ponds have better microbiological quality than freshwater fish cultivated in water bodies and surface waters, which may have been unintentionally polluted. A study in Vietnam corroborates this notion, where there was no significant difference found in the number of presumptive thermotolerant coliforms in the gut content and muscle tissue of fish raised in wastewater-based ponds and non-wastewater-based ponds [10]. Fattal et al. (1992) and Edwards (2000) reported similar findings [11,12].
Even with the implementation of practices that satisfy health and hygiene guidelines, wastewater-based aquaculture may still not be a viable business if consumers are unwilling to purchase fish reared in treated wastewater. Market and consumer acceptance of fish grown in treated wastewater is critical as the willingness-to-pay (WTP) for the fish is the parameter with the greatest impact on profit margins [13]. Research shows mixed reviews on consumers’ perception of wastewater-raised fish. In Ghana, for example, wastewater-raised tilapia is sold at prevailing market prices as those of freshwater systems [14]. Conversely, in Vietnam, although significant evidence indicates no increased human health risks from consumption of fish raised in wastewater reuse systems, concerns over toxin accumulation in edible fish has been found to significantly influence consumer demand [5]. Mancy et al. (2000) found similar results in Egypt where consumers were reluctant to consume fish cultivated in wastewater although noted suitable for human consumption [15].
This issue of food safety has been attributed to market failures related to imperfect information between households and producers with regard to product-specific attributes [16]. Particularly for wastewater-raised fish, this issue also arises because of inadequate knowledge and awareness of the level of health risks associated with wastewater-raised fish, unclear policy development and regulation for fish marketing. There is limited information on the sources of water used to raise fish for the market. As a result, households’ purchasing decisions are usually not based on improved fish safety and quality attributes. The assessment of fish safety attributes can restore households’ confidence and provide the optimal attributes mix for potential investors to focus on for the promotion of wastewater-raised fish. If indeed consumers’ purchasing decisions are influenced by source and product quality information, then understanding consumers’ acceptance of fish reared in treated wastewater is critical.
This paper assesses in the context of a choice experiment: (a) households’ willingness-to-pay (WTP) for information on the sources of water used to rear the fish they consume; and (b) households’ WTP for certification of a fish product. This paper, additionally, assesses the potential feasibility of investment in a wastewater-based aquaculture business in view of consumers’ WTP estimates. There are numerous studies that have estimated consumers’ WTP for fish product attributes, but the majority of them have been undertaken in developed countries and have focused on seafood labeling and production practices with few studies in Asia [16,17,18,19,20] where food safety is a big challenge. To the best of our knowledge, this is the first empirical application of a choice experiment that estimates households’ WTP for informational attributes (certification and sources of water used to raise fish) of a fish product in Hanoi, Vietnam. This study provides important information on households’ preferences for wastewater-raised fish, which is valuable information for potential wastewater-based aquaculture businesses, policy makers and future investors in the wastewater sector. The results of the study will be of interest to wastewater regulators in Hanoi, but also to international donors and wastewater investors who are constantly exploring a holistic approach in generating multiple benefits from wastewater reuse businesses. With the estimates of WTP for these attributes, we can also understand how these attributes jointly affect households’ choices, which should be of interest to wastewater marketers and policy makers in low- and middle-income countries.

2. Materials and Methods

2.1. Theoretical Framework

Stated preference methods such as contingent valuation and choice-based conjoint analysis have gained immense popularity in eliciting consumers’ valuation of food products [21,22,23]. These methods elicit WTP from consumers in a hypothetical and less than realistic environment and are based on intended behavior. Critics argue that these methods are not incentive-compatible as households’ decision making strategies are not truthfully revealed with respect to their preference for the good in question. It is not surprising that research has shown that these elicitation techniques have consistently overestimated consumers’ WTP measures [22,24]. Despite this bias, these approaches continue to be used because they provide results that are better than other methods and are relatively cost effective to implement. Many studies tend to use elicitation methods such as contingent valuation, but a choice experiment is appropriate for this study because of the attributes considered [25]. Choice experiments are dominant because the purchasing decisions of consumers tend to relate to observed market purchasing decisions, where typically a consumer has to select a product from a set of options [26,27,28].
The choice experiment (CE) approach has been applied in many fields to estimate consumers’ preferences including estimating preferences for food attributes. In particular, Ortega et al. (2011) used the approach in China to measure consumer preferences for selected food safety attributes in pork and with incorporation of food safety risk perceptions [16]. Similarly, Olesen et al. (2010) used the approach to measure WTP for fish welfare; while application of the approach to estimate WTP for farmed fish can be found in Honkanen and Olsen (2009) and Vanhonacker et al. (2011) [17,29,30]. The economic theorem underlying the choice experiments is presented in detail in Appendix A.

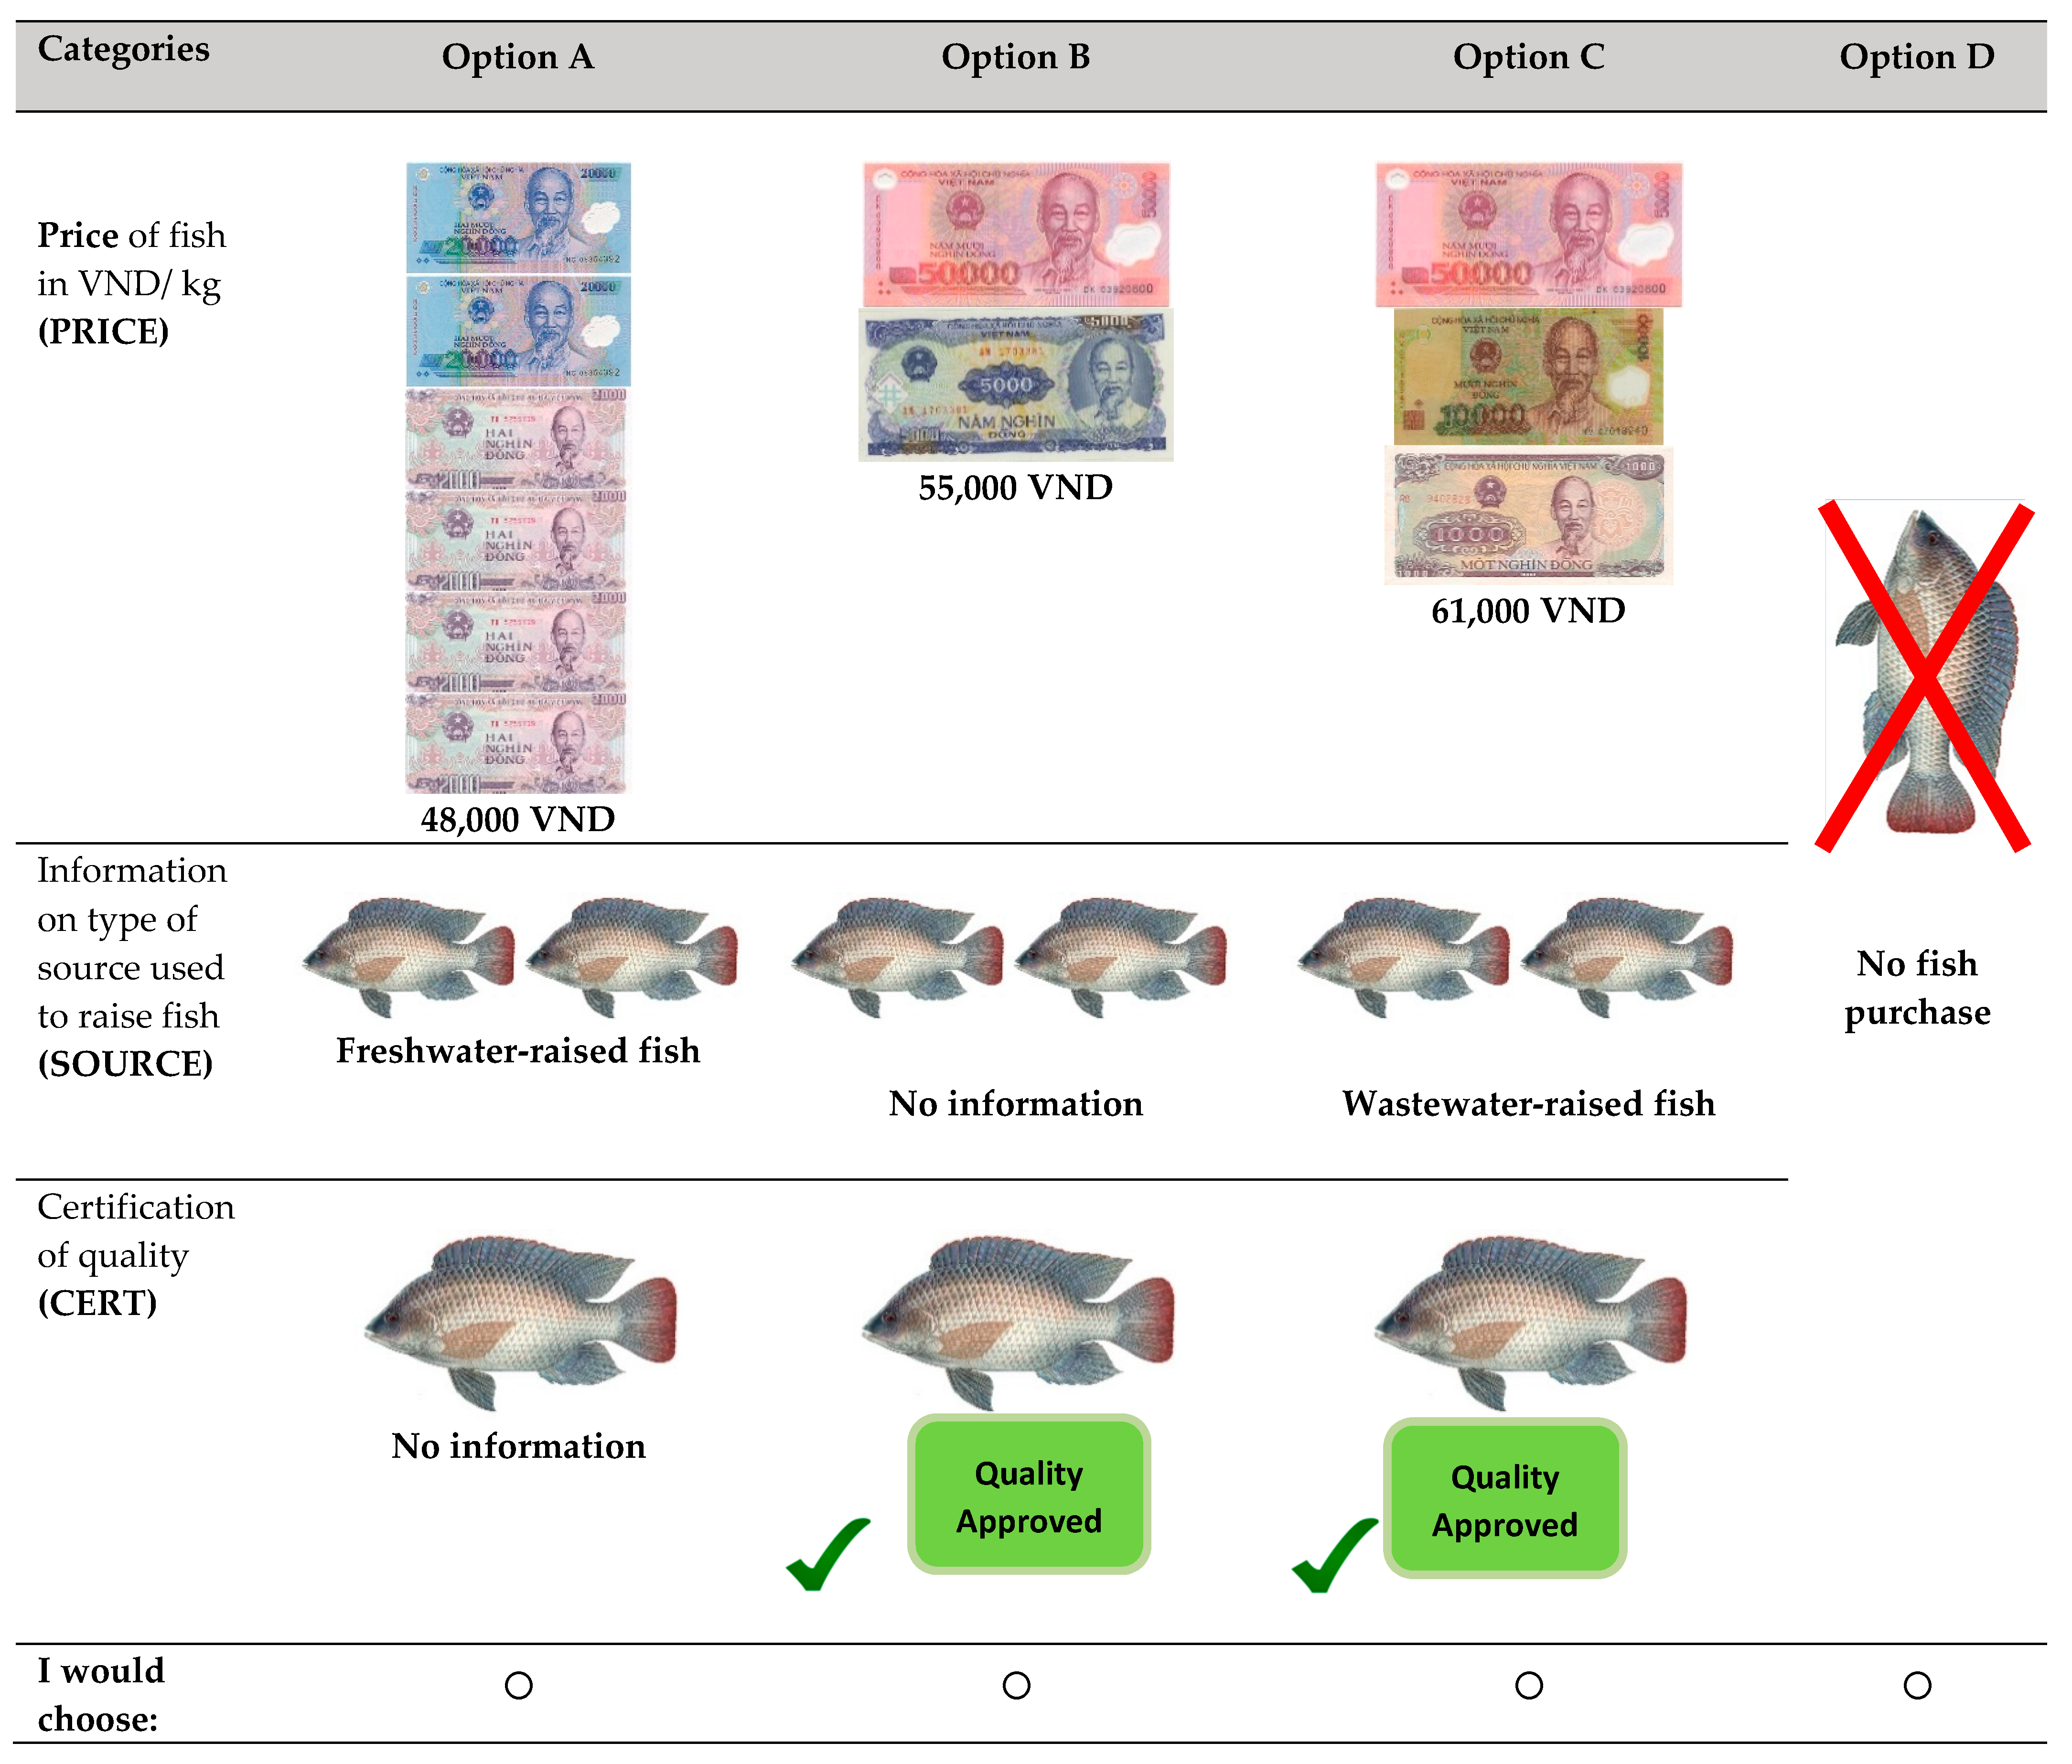
2.2. The Experiment Design

This study assesses households’ WTP for different characteristics of fish (i.e., reared with different sources of water, including wastewater; and certified or not) and the potential implications for wastewater-based aquaculture businesses. The primary research step was to select applicable product attributes. The “good” to be valued in this choice experiment (CE) is fish (Tilapia) under considerations of certification and information on sources of water used to raise the fish. A review of fish consumption and aquaculture studies helped in identifying these attributes [16,18,31]. In collaboration with local research partners and through multiple focus group discussions, the final attributes were selected. Given the challenges in getting the exact changes and levels in attribute characteristics, a qualitative approach was used to select the levels. The choice profile consisted of attributes from three categories: price, source and certification. Local partners provided information on the price levels used in the choice experiment. Additional information on the price levels was obtained through a scoping study. Three levels of prices were chosen ranging from USD 2.18 per kg to USD 2.77 per kg (48,000 VND per kg to 61,000 VND per kg), which reflected the low-end and high-end prices that could be observed in actual fish markets in the study area (Table 1).
In the context of fish products, few studies have included informational attributes such as third-party certification and sources of water used to rear fish for the market. Fish safety issues often arise from lack of trust between producers and consumers with respect to product-specific attributes. Third-party certification could serve as a quality assurance indicator, which may influence household purchasing decisions [16,18]. Another significant variable that could influence household purchasing decisions is their knowledge of the type of medium used to raise the fish. It is possible that households may perceive wastewater-raised fish as unsafe for consumption, and if this is the case, then demand for such products could be negatively impacted. It is expected that households will have a positive valuation of information on water sources used to rear the fish they consume.
In this experiment, we considered five attributes at two levels, and with two alternatives to choose, hence, a full factorial experiment is required. However, it was not possible to implement the experiment with these numbers; thus, we decided to use a fractional factorial design. SAS was used to obtain optimal design that allowed for the estimation of all the main and two-way interaction effects. Based on the feedback received from the pre-test of the experiment, especially with respect to the challenges of completing the initial efficient design of 18 profiles, we decided to use the saturated design of six profiles to avoid this issue. The respondents were required to indicate their preferred option for each choice set, which contained alternatives A, B, C and D (status quo) or a neither option (Table 2). Such an “opt out” option can be considered as a status quo or baseline alternative, which is necessary for estimating welfare [32]. In addition, the inclusion of “opt out” option presents households with all the options and provides the opportunity for them to either delay or decline to make a choice if the options presented are not welfare enhancing.
Prior to implementing the field experiments, a pre-test was conducted among a small sample of respondents in urban Hanoi–Hoan Kiem to ensure the suitability of the choice experiment instrument. The respondents were aware that the different choice sets with specific product attributes represented a specific type of fish product information. During the actual experiment, upon the selection of a respondent, an educational session to describe the general premise of the field experiment was conducted with the experiment participants. The respondents were fully educated on the experimental procedures, the choice sets and the rationale of the choice of attributes. Special attention was paid to the different options defining each choice set and the different levels of the specific attributes. Additionally, it was made clear to the respondents that the attributes defining “Source” and “Certification” referred to the fish product carrying information regarding the medium used to rear the fish and product certification, respectively. In addition, pictograms, as shown in Figure A1 in Appendix B, were used to facilitate the comprehension of the different options available in the different choice sets.
During both the pre-test and actual implementation of the field experiments, the respondents were asked to provide their consent for participation in the study. The premise of the study was explained in detail and the consent statement read to the prospective respondent. All the interviews were conducted by a researcher along with local translators in Vietnamese to ensure respondents fully completed the experimental procedures. A signed (if literate) and/or verbal (if illiterate) was obtained from the prospective participant is she/he agreed to participate in the survey.

2.3. Study Area and Sampling Strategy

The choice experiment survey was conducted in 2014 in Hanoi, Vietnam. The respondents for the study were sampled from households in eight districts in Hanoi. Representative of: (a) urban Hanoi were Hai Ba Trung, Hoan Kiem, and Cau Giay districts; (b) peri-urban Hanoi were Gia Lam district; and (c) rural Hanoi were Chuong My, Son Tay, Thach That and Soc Son. The number of districts per demographic categorization was based on the population size. There are noted challenges in determining the optimal sample size for the choice experiment. In many choice experiments, sample size determination is based on the number of choice tasks, number of alternatives and the number of analysis cells. Given the cost, time and difficulty of implementing the survey in Hanoi, we randomly selected 136 households. This sample size is appropriate and empirically consistent with results of global review studies compiled by De Bekker-Grob et al. (2015) [33]. These authors found that of 69 experiments, 22 (32%) had sample sizes smaller than 100 respondents, whereas 16 (23%) of the 69 experiments had sample sizes larger than 600 respondents; six (9%) even had sample sizes larger than 1000 respondents. For this study, seventeen households were randomly selected in each district for a total sample size of 136 households interviewed for the study. The household heads in the selected sample were provided with choice cards with information on fish reared in different sources of water, their respective prices and whether the fish was certified or not (Table 2 and Figure A1 in Appendix B). The selected attributes were clearly explained to each participant before the interview. The data was coded based on the attribute levels (Table 1). The price attribute was coded as a cardinal variable. The certification attribute was coded as a dummy variable while the source attribute was coded as two-level dummies (i.e., source_wastewater and source_freshwater) using the “none” option as the base. The estimated coefficients for source variables indicate households’ valuation of the change from the status quo level to the higher utility levels.

3. Results and Discussion

3.1. Socio-Demographic Characteristics of Households

The respondents who participated in the survey were either heads of the household or spouses of the household. Of the 136 households interviewed, there were more males than females with an average age of 45 years (Table 3). It is important to note that although the sample is largely male, in the Vietnamese household, most food purchasing decisions are made by the head of household whom is typically male. Over 64% of the respondents were within the productive age group and most of them were noted to contribute to the economic development of Hanoi. The mean household size was 3.85, which is consistent with the current trend of national statistics in Vietnam [34]. Most of the respondents had some form of formal education, with about 10% having a university degree, indicating a fair literacy rate of the sample. There was limited national-level data on percentages per educational profiles, however the observed distribution is noted to be similar to that of the surveyed sample. Over 70% of the respondents reported a total annual income of less than USD 455 or 10 million Vietnamese Dong (VND). The annual average household income of USD 2273 for the surveyed sample is significantly lower than the national average (USD 6000). This disparity may be reflective of households’ reluctance in disclosing their income particularly in developing countries; and may have caused a downward bias in the study results. Respondents’ household income was noted to generally come from trading and services, labor wages, pension and remittances from developed countries. Surprisingly, a small percentage of household income was generated from agricultural sources. The diversity in households’ socio-demographic backgrounds provides an understanding of households’ structure and distribution, which could be vital in business decision making and policy development in the study area.

3.2. Households' Fish Consumption Patterns and Purchasing Decisions

The types of fish purchased and the pattern of consumption may influence respondents’ decisions on the options they select. Survey respondents were asked to provide information on the current sources and types of fish they purchase from the local market. Most of the respondents consume farmed fish and sea fish, but less of wild fish. The dynamism and the pattern of fish consumption may be influenced by factors such as cost, preferences, location, health, pollution, cultural factors and scarcity of fish. Moreover, the question that needs further evaluation is whether households are aware, if the fish they consume are raised in wastewater or wastewater related sources? As expected, the survey results show that about 75% of the respondents were unaware if they have consumed any wastewater-raised-fish. The Likert-scale results show that about 25% believe to not have consumed this type of fish (Table 4). This result is not surprising, as most of the respondents have not heard of wastewater-raised fish and only 10% are aware of wastewater-raised fish. These results show that respondents are unaware of the sources of water used for fish farming and that other factors may be significant in their decision-making on fish consumption. With respect to factors affecting purchasing decisions, the results show that households considered factors such as low price to be relevant, all other things being equal. About 50% of the respondents value information on the source of fish they consumed, but many respondents value availability and taste as the most important factors, which influenced their decisions. The quality of fish is another important factor households consider when purchasing fish.

3.3. Households’ Perceptions of Wastewater-Raised Fish

The results so far suggest that most of the households consume different types of fish, but are unaware of the sources of water used for rearing the fish they consume. Additionally, most of the respondents indicated that they believe to not have consumed wastewater-raised fish or are unaware if they had in the past. Since most of the households, have not or are unaware if they have consumed wastewater fed-fish, five broad indicators were used to assess households’ perceptions of this type of fish. The indicators considered were: (a) belief in the efficiency of the wastewater treatment technology; (b) safety level of the treated wastewater; (c) quality of wastewater fed-fish; (d) location of purchase; and (e) certification by a government agency. It is worth mentioning that each broad indicator had sub-indicators that helped households to understand the questions and guided their answers. Respondents rated their choices on a five level Likert-scale ranging from 1 (least important) to 5 (very important). Most of the respondents believe that if a higher-quality wastewater treatment technology is used and the fish is certified by a government agency, then it is possible that the demand for wastewater-raised fish could increase (Table 5). However, this option also requires better investment and effective management options that could sustain this type of fish business. It is obvious that when respondents are aware of the source of water used for fish farming, there could be an impact on the demand for the wastewater-raised fish. In this regard, the survey results show that about 91% of the respondents would be willing to buy wastewater-raised fish, when full information is provided about the quality and safety. The demand for the product could increase if a friend or neighbor recommends that it is safe. The respondents did not believe that retailers should be given the full responsibility to certify fish from wastewater fed-systems. This may be due to the mistrust of households of current fish retailers. Most of the respondents believed that such a mandate should be given to a government agency. That is, if a government agency certified the product and sold by retailers, then it is possible that respondents would purchase the product and this could possibly increase market demand.

3.4. Choice Modeling Results

In the choice model analysis, Equations (A3) and (A6) in Appendix A were estimated using a multinomial logit regression model with NLOGIT 5. We derived basic models from both equations without the socio-economic variables to determine the best fit model. The overall fit of the conditional logit (CL) model was 0.063, which resonates with the standards used to describe probabilistic discrete choice models. The Swait–Louviere log likelihood ratio test was used to select the appropriate model for the analysis [35]. As expected, the results show a significant increase to the model fit from the CL model to the RPL model at 1% significance level. In addition, we compared the McFadden R2 and log-likelihood scores and the results show that RPL model provided better estimates than the CL model. The CL model recorded a McFadden R2 of 0.123 compared to 0.363 in the RPL model. The RPL model is deemed appropriate to account for preference heterogeneity and the estimates are presented in Table 7.
Empirically, consumer socio-economic characteristics and perception factors can influence choice preference [36]. Concerning the effect of perceptions and factors affecting households’ purchasing decisions, a series of questions were utilized. The first broad set of questions addressed households’ purchasing decisions (Table 4), while the second broad set of questions focused on households’ perceptions about wastewater-raised fish (Table 5). These questions were measured on a Likert-scale ranging from one being least important to five being most important. Principal Component Analysis (PCA) was used to obtain statements that accurately measure households’ purchasing decisions and perceptions of wastewater fed-fish.
PCA is an orthogonal linear transformation that reduces a set of variables into a smaller number of variables, which are normally called principal components. In PCA, each successive principal component accounts for as much of the remaining data variability as possible [37,38,39]. After obtaining all required components through the Eigenvalues criterion, we used the component rotation method to discriminate between the components, which also facilitated the interpretation of components. Typically with PCA, the challenge is to determine the number of components to retain. We used the Kaiser Criterion to retain those factors or components with eigenvalues ≥1. Based on the eigenvalues, we retained six components for the purchasing decisions questions, while four were kept for the perceptions questions. Similarly, the rotated matrix led to six components for the purchasing decisions questions and four for the perception questions (Appendix B). The Kaiser–Meyer–Olkin (KMO) statistics capture excessive correlations, which could indicate multicollinearity. A successful PCA should generate a KMO value greater than 0.5. Both KMO values are above 0.5 (Appendix B). The Bartlett’s test of sphericity is used to determine whether the correlation matrix of the statements used in the PCA differs significantly from the identity matrix. If the test is not significant, it means PCA is not an appropriate method for this analysis. To validate the PCA analysis, the Bartlett test should reject the hypothesis that the correlation matrix is the identity matrix. The results show that both Bartlett’s tests are highly significant, thus, there is an evidence of correlation between the statement questions.
It is not feasible to include all these components into the regression model. Thus, composite variables were derived from these components. The steps used to create the composite variables as perceptions 1, 2, 3 and 4 are as follows: first, we assigned factor loadings (>0.4) under each component to determine the contribution of each factor to the component. In cases where two factor loadings were greater than the baseline value, the one with the higher factor loading was selected for the analysis. Table 6 presents the detailed assignment of factor loading of purchasing decisions questions into the various components. Second, factors loading under similar components (i.e., fresh fin, fresh and clear eyes, etc.) were then aggregated to create a new variable called perception 1, which measures respondents’ perceptions on whether safety of fish is important in their purchasing decisions. We used the same approach to cluster factors such as ease in processing, how sellers processed fish into component 3 and then aggregated these factors to create a new variable called perception 2, which measures respondents’ perceptions on processing technology or treatment system for wastewater fed-fish farming. The same process was used to create perception variables 3 and 4. Factor loadings for these factors are presented in Appendix B.
The PCA results show that factors such as respondents’ perceptions on whether safety of fish was assured (perception 1), respondents’ perceptions on the processing technology or treatment system for wastewater fed-fish farming (perception 2), respondents’ perceptions on information of the type of market the fish is sold in (perception 3) and respondents’ perceptions if certification is done by relevant authority (perception 4) were suitable determinants of households’ perceptions about wastewater-raised fish. These variables and other socio-economic variables contributed to the estimation of households’ heterogeneous preferences for fish products (Table 7). We used the sequential modeling selection process to arrive at the final model presented in Table 8. The first model deals with only the attributes considered for the study. Model 2 deals with all the relevant demographic and farm characteristics variables. In this model, we added age, education, gender, income, household size, religion, farming experience, previous experience with compost, and farm size. Model 3 deals with only the key demographic variables such as age, gender, income, education and household size. Model 4 deals with perception variables and the demographic variables. Model 5 deals with the final model presented in Table 8. After an extensive model selection through likelihood ratio test of the various interactions of the fish attributes with the respondents’ social, economic and perception characteristics, the model that includes, age, household size, income, gender, education and perceptions variables was found to fit the data better (Table 8).

3.4.1. Random Parameter Logit (RPL) Model Results

The RPL results show that the coefficient on price is negative and highly significant (p = 0.000), which shows that prior expectations about price and the probability of fish purchase would be negatively correlated (Table 8). In line with the CL model results, all the coefficients of the attributes are significant at 1% level and the signs for source_freshwater and certification were as expected a priori. Contrary to expectation, the sign for source_wastewater is not as expected and is positive. This suggests that households expressed positive WTP for information to know if wastewater is used to raise the fish for the market. Coefficients from the RPL model show that households value high quality fish which is certified and carries information on the source of water used to raise the fish they consume. Intuitively, the probability of purchasing wastewater-raised fish will be highly influenced by whether the final fish product sold to households carries information on certification and the medium in which the fish is raised. An important observation with the results is the significant difference between the WTP estimates for information of wastewater-raised versus freshwater fish. This may be attributable to consumers’ perceptions of product quality of wastewater-raised fish in comparison to freshwater fish.
The RPL model also showed that households were willing to pay more for fish that is certified by a government agency than information on the two types of water sources considered—wastewater fed fish and farmed fish. This may be attributable to the environmental and quality attribute (essentially safety) associated with the certification of the product. If a trusted agency certified wastewater-raised fish, this has the potential to build the confidence of households in purchasing these types of fish than when they are not certified. Thus, certification of wastewater-raised fish will be an important determining factor to improve the profitability of any business model in this sector. The results indicate that households in Hanoi are willing to pay a premium price to acquire better quality products and that their preferences are not homogenous. However, households’ positive WTP are likely to be affected by age, income, household size and perceptions on the quality of the fish (Table 8).

3.4.2. Latent Class Model (LCM) Results

Latent Class Model (LCM) was used to overcome some of the limitations of the RPL model by allowing parameter estimates to vary among different classes. The “testing down” approach was adopted where we started from a large number of classes and gradually reduced to a smaller number of classes [40]. We started with three classes, but the model failed to converge. The model provided the best fit when two classes were identified. The probability that a randomly chosen household belongs to a given class is 0.7% and 0.3% respectively (Table 9).
We used the certification and price coefficients from the LCM model to characterize the households into two classes—moderate and high value certification households. The results for the first class reveal a relatively higher coefficient for certification than the second class, but a lower willingness to pay for the attribute. This means that households in the first class would suffer a utility loss if they did not have the option of certified fish.
We classified households in this class as “high” value certification households while those in class one are designated as “moderate value” certification households. Households in class two place a relatively high value on product certification and information on the medium used to rear fish for the market. This group is more likely to derive utility from fish when a relevant government agency provides information on certification. Households in class 1 represent households who are relatively less concerned about the sources of water used to raise fish for the market and may not believe that certification assures high quality fish.

Households’ Characteristics and Latent Class Segments

The relative size of each segment is calculated by inserting the estimated coefficients into Equation (A9), and using it to generate a series of probabilities that a given household belong to a given segment. Households are then assigned to a segment based on the larger of the two probability scores. Using this approach, we found that 96 respondents belong to the first segment, and 39 belong to the second.
The results show that households in segment one are relatively older and have larger families than those in segment two and the difference in annual income earned is significantly different across the two segments as well. Those in segment one have a marginally higher educational level than households in segment two, but we observed a higher college educational level among those in segment two. With respect to the perception variables, the analysis suggests that those in segment two have marginally higher rankings on their perception variables than those in segment one. Given the characteristics of the respondents in segment one, it likely that they will like to have full information about the product and probably understand the risks and benefits of the product before making any informed decisions. As a result, they do have lower perceptions, implying that they have a perceived high risk of consuming wastewater fed-fish. Conversely, respondents in segment two with better educational levels are more willing to consume certified wastewater fed-fish than those in segment one (Table 10).

3.4.3. Households’ Marginal Willingness-to-Pay

The results from the RPL models were used to estimate households’ marginal WTP. Results from marginal WTP estimation are useful for business profitability analysis and policy development. To estimate the marginal WTP, the price of the good must be included as an attribute. This provides an understanding of the relative importance households’ attach to the characteristics within the choice design. The estimates show that households were willing to pay USD 1.11 per kg (or 24,385 VND per kg) more than current market prices to know if wastewater is used to raise the fish, USD 0.43 per kg (or 9414 VND per kg) more to know if freshwater is used to raise the fish (Table 11). Households show a higher WTP for certification at USD 1.42 per kg (or 31,292 VND per kg) than information on the sources of water used to rear the fish. This result is supported by the respondents’ answers to questions regarding their perceptions towards fish certification. Majority of the respondents were supportive of purchasing fish if certification was assured (90%) while less than 5% were not in favor of this approach.
The LCM also showed a wide-range of preference heterogeneity for the three attributes. Overall, the marginal WTP estimations for sources of water used to rear fish and certification attributes reveal households valued these attributes and are willing to pay for them. Households in segment two are willing to pay more than those in segment one for all the attributes. These households accounted for about 30% of the sample. These may be the premium households who value fish quality attributes and are willing to pay for information on the sources of water used to raise the fish relative to those in segment one. In addition, this household group value certified fish more than those in segment one (Table 12). It may be necessary for investors to focus their marketing strategies on households who are likely to belong to segment two than those in segment one.

4. Costs and Benefits of Certification

Brand identity conveys a message of product quality, but this is often realized at the cost of high prices and limited supply. Such market failures are remediable with quality certification measures using a trustworthy and independent party to test the product for its quality. This approach can provide producers with a license or certificate guaranteeing consumers that the product will meet their needs. Observing quality in this way comes at a cost, and wastewater-based aquaculture businesses can recover it by charging the differential cost as an increase in the product price to consumers, and still generate benefits to consumers who now have alternative sources of obtaining information on product quality. The existence of an independent certification can create a more competitive market to provide certified fish products and other businesses will be incentivized to pay the fees for certification, and compete to provide the given quality most effectively. In the case of Hanoi, the results indicate positive consumers’ WTP for certification of fish and information on the medium used to raise fish. Thus, the critical question that remains is whether consumers’ WTP for certification can sufficiently cover certification costs.
With the marginal WTP estimates, households expressed positive WTP for all the attributes. This is important information for future investors in wastewater-based aquaculture businesses as this will influence the type of pricing strategy they choose to implement; particularly, what share of the certification cost they will choose to transfer to their customers and still ensure that there is sufficient demand. Given these estimates, it is important to compare it with the potential costs of certification. Fish certification cost in Vietnam ranges between USD 0.19 and 0.24 per kg [41]. It is important to note that these figures exclude infrastructure investment and is based on the assumption that there is an existing governmental facility that provides these services at a cost. The certification cost of wastewater-raised fish is estimated to mainly include costs related to pre-investment to compliance to the quality standards, fee for certification, field inspection, collection of sample (transportation cost) and laboratory analysis.
Based on the marginal WTP for certification for wastewater-raised fish, it is estimated that households are willing to pay 6 to 7.5 times higher than the actual cost of certification using the lower and higher limit of certification cost, respectively. The total benefits that can accrue from the provision of certified wastewater-raised fish can be estimated based on the total market size for freshwater fish (tilapia, carps and catfish - these are capable of being raised in wastewater in Hanoi, Vietnam). The total market size is estimated at 12,130 tons, based on a per capita fish consumption of 18.8 kg per year for freshwater fish and total population of Hanoi of 6.452 million. The total potential benefit is estimated at approximately USD 172.24 million (Table 13). Based on an estimated total cost of certification of USD 23 and 34 million, the estimated net benefit accruable to wastewater-raised producers can range between USD 138 and 149 million, which is about 4–4.5 times higher than their investment in providing certified wastewater-raised fish assuming the higher-end of the certification cost. This suggests that there are significant benefits to be gained in investing in the provision of services for fish product quality in Vietnam.

5. Conclusions

Wastewater-based aquaculture as a business has great potential in Hanoi, Vietnam. Policy makers are increasingly looking for feasible options to recover costs associated with wastewater management through reuse, but also ensuring to mitigate health risks associated with these initiatives. This paper used a choice experiment approach to analyze households’ valuation of informational attributes of fish; specifically, certification and source of medium used to raise fish. These fish product attributes serve as quality indicators for households. The estimates show that households expressed positive WTP for all three attributes. This suggests that households are more willing to know if wastewater is used to raise the fish and if a relevant government agency will be responsible for certification. The Latent Class Model (LCM) results provide an opportunity to divide households into two classes or segments based on their preferences for information on fish certification. The first segment included households that would not suffer a utility loss if certified fish was not offered to them. The majority of households belonged to this segment. Conversely, the second segment included households that would suffer a utility loss. These estimates show that households in the second segment were willing to pay USD 2.92 per kg for information to know if fish is certified by a relevant government authority. In addition, households in the second segment were willing to pay USD 2.74 per kg to know if wastewater was used to rear fish for the market.
Cost of certification analysis shows that producers may be able to achieve benefits of 6–7.5 times higher than the current total cost of certification. The results indicate that households in Hanoi are willing to pay a price premium to acquire better quality food products; suggesting that providing source and product quality information through testing and certification can promote a more competitive market for fish, particularly wastewater-raised fish. As a result, higher quality fish in terms of having additional safety attributes can be sold at higher price in Hanoi markets. The findings corroborate the survey results on perceptions of certified fish; and demand is expected to increase if certification is done by a trusted government agency. This result indicates that there is a strong need for the Vietnamese government to provide adequate food safety and quality control as the households in this study preferred a government party to provide food safety certification. The results also suggest that quality assurance considerations and high incomes are factors that would increase the probability of higher expenditures on wastewater-raised fish. As the Vietnamese urban per capita income continues to rise rapidly, more people are expected to join the higher income class that is incentivized to pay a higher price for better information on food safety. This should serve as a catalyst for governmental agencies and the private sector to invest in quality control services for food safety and new wastewater-based aquaculture businesses as this approach may contribute to improve food and strengthened nutritional quality in Hanoi, Vietnam. In conclusion, while some households may be willing and able to pay for values they believe in, it must first be apparent that the market can deliver these values. The governance of value chains and the flow of information between relevant actors is imperative. In this regard, related constraints that may impede on the delivery of these values and information in farmed fish value chains in Vietnam need to be assessed.
Initial results presented in this study show that household preferences are influenced by all attributes considered over the status quo condition. Alternatively, freshwater could be used as the status quo option for the experiment. This option was not considered because the aim of the study was to assess if households will be willing to pay for information on the sources of water used to raise the fish for the market. The option of using freshwater as the base choice in the experiment is beyond the scope of this paper.

Acknowledgments

This study is based on a research project on “recovery of resources and reuse of waste” supported by the Swiss Agency for Development and Cooperation (SDC). Any opinions, findings, and conclusions or recommendations expressed in this document are those of the authors and do not necessarily reflect the views of the Swiss Agency for Development and Cooperation.

Author Contributions

George K. Danso and Miriam Otoo conceived and designed the experiments and questionnaires; Nguyen Duy Linh performed the experiments and gathered the data; and George K. Danso, Miriam Otoo, and Ganesha Madurangi analyzed the data and wrote the manuscript.

Conflicts of Interest

The authors declare no conflict of interest. The sponsors had no role in the design of the study; in the collection, analyses, or interpretation of data; in the writing of the manuscript, and in the decision to publish the results.

Appendix A.

Theoretical Framework
With choice experiments, a given household h obtains utility from choosing alternative i from a finite set of J alternatives contained in a choice set, C . The household utility function is comprised of deterministic and stochastic components, but the former depends on the attributes of an alternative. We denote V ( Z i h ) as the deterministic component and the ε i h as the stochastic component. Formally, we specified household utility of alternative i as:
U i h = V ( Z i h ) + ε i h
Random utility theory is defined such that household h will choose alternative i , if U i h > U j h j i . Given the choice set C , the probability of the ith household choosing alternative i from a set of alternatives J , is estimated as:
P i h = exp [ V ( Z i h ) ] j = 1 J exp [ V ( Z j h ) ]
To capture the influence of attributes and other variables, we denote M h as a vector of household h’s socio-economic characteristics and θ j h as the vector of the coefficients related to the household characteristics. Let β j k represent the parameter associated with k characteristics while Z j k denotes the k characteristics value of the choice j . We denote d j k and δ as the price scalar along with its fixed parameter; the price coefficient is specified as a fixed coefficient to avoid an unrealistic positive coefficient associated with price [42]. Assuming a linear function for V ( . ) with random specific characteristics, the conditional indirect utility function is estimated as:
V j h = δ d j k + β j k Z j k + θ j h ( M h Z j k )
In Equation (A3), we assumed that the random error term associated with household specific characteristics is identically and independently distributed with a type one extreme value (Gumbel) distribution. Equation (A3) assumes that households’ preferences are homogenous. Heterogeneity in households’ preferences for fish with informational attributes is best measured using a random parameter logit (RPL) model. The RPL model is flexible because it allows for preference heterogeneity and does not suffer from the independence of irrelevant alternative (IIA) assumption [43]. For a given sample, the RPL model relaxes the IIA assumption by allowing variation in the taste variables through a specified distribution. Let α represent a parameter with a random component ( λ ) because of preference heterogeneity across households. Also, let χ represent a vector of deviation parameters. The RPL model is given as:
U i h = V ( Z i h ( α + λ i ) ) + ε i h
Similarly, the probability of household h choosing alternative i from a set of alternatives J can be obtained from Equation (A4) as:
P i h = exp [ V ( Z i h ( α + λ i ) ) ] j = 1 J exp [ V ( Z j h ( α + λ i ) ) ]
Consequently, the conditional indirect utility function, which indicates preference deviation with respect to mean preferences for households, is given as:
V j h = δ d j k + β j k Z j k + χ h k Z j k + θ j h ( M h Z j k )
It is difficult to estimate the closed form of Equation (A5) and we have to rely on a simulated approach for the probabilities. Halton draws, which provide better coverage of density function and faster convergence, were utilized at 500 draws per iteration in the simulated maximum likelihood estimator [43]. It is appropriate to make an assumption with respect to the distribution of each of the random coefficients. However, the choice is limited by the difficulty of model estimation and availability of econometric software. The two main alternative assumptions are a normal and a log-normal distribution. Applying a log-normal distribution means that we restrict all households to have the same sign of each coefficient. In our case, this is not appropriate, since we expect different households to have positive and negative preferences for the different attributes of fish. It is also reasonable to expect that there is a correlation between the randomly distributed parameters. Thus, we used a normal distribution for the estimated coefficient of mean preference and constant household taste variables over all the choices, but with variation from one household to the other [44].
Alternatively, heterogeneity in preferences can be assumed to occur discretely using a latent class approach where h households are grouped into a number of s latent classes, each composed of homogenous households [45]. Now, let the deterministic component of the random utility model take the form of Z i h = β Z i h . In addition, we represent β s as the specific parameter for class s and the P h s denote the probability that household, h falls into class s . We define Z h and ϖ s as a set of observable household characteristics that affect the class membership and a vector of parameter for households in class, s . The probability that household h selects option i in a given choice situation on the class is represented by:
P i h | s = exp ( β s Z i h ) j = 1 J exp ( β s Z j h )
Subsequently, the probability that household h falls into class s can be modeled as in the following studies [45,46]:
P h s = exp ( ϖ s Z h ) s = 1 S exp ( ϖ s Z h )
Maximum likelihood approach is used to estimate the LCM model, however, it is difficult to estimate the optimal number of segments a priori. The standard procedure is to estimate the model parameters sequentially for an increasing number of segments until an additional segment does not improve the model fit according to specific statistical criteria (e.g., log-likelihood, AIC, and BIC) [47].
The marginal WTP estimation was based on the following the procedure. Marginal WTP of an attribute is estimated as:
W T P i = 1 ( β i β p r i c e )
Similar to other logit models, the coefficient estimates of the attribute variables from the LCM were best interpreted in the context of WTP. The average WTP for an attribute within a household class s is the negative ratio between an attribute coefficient in that class s ( β a t t r i b u t e , s ) and price coefficient in the same class, s ( β p r i c e , s ) . The standard deviation of the WTP measures was simulated using the Krinsky and Robb procedure with 1000 replications [48].
W T P a t t r i b u t e , s = β a t t r i b u t e , s β p r i c e , s
Krinsky and Robb bootstrapping procedure is used to estimate households WTP for source and product certification information and their respective 95% confidence intervals [48].

Appendix B

Figure A1. A pictorial representation of the choice set in Figure 1 presented to the experiment participants.
Resources 06 00030 g001
Table A1. PCA rotated matrix for households purchasing decision factors.
FactorsComponents
123456
Taste is the most important factor0.0500.6880.178−0.2010.014−0.091
To know clearly the source of fish consumed0.050−0.183−0.0230.826−0.080−0.252
Having reliable sellers available−0.0170.1100.0790.7900.2070.071
Safety in use is important0.0950.278−0.0400.3150.6780.000
No negative impacts on health−0.022−0.1390.121−0.0620.8650.036
Fresh gills are the most important factor0.3270.552−0.106-0.0520.490−0.016
Fresh fin is an important factor0.913−0.0140.0820.0190.0920.036
Fresh and clear eyes are important factors0.8720.167−0.0300.0510.034−0.103
Undamaged, unscratched fishtail is an important factor0.869−0.0220.1410.0060.0580.106
It is important that the fish is healthy and can swim fast0.6690.2980.1850.026−0.0530.017
Ease in processing is an important factor0.2010.1470.797−0.0090.0570.119
Limited time needed to process and cook fish0.147−0.0120.8960.061−0.0670.094
How the sellers pre-process the fish is an important factor−0.0620.4410.6550.0880.078−0.281
A convenient location to purchase the fish is an important factor0.0180.5750.550−0.0690.2470.307
Low price is an important factor−0.0020.0860.091−0.1120.0400.925
Stable price is an important factor0.1810.7560.1720.282−0.0030.291
Notes: Bold factor loadings are used to create the variables to measure perceptions. Rotated Method: Varimax with Kaiser Normalization. Rotation converged in nine iterations. Kaiser–Meyer–Olkin (KMO) measure of Sampling adequacy (0.697) and Bartlett’s Test of Sphericity (0.000).
Table A2. PCA rotated matrix for households’ perceptions on wastewater-fed fish.
FactorsComponents
1234
Current technology can treat wastewater for fish rearing0.1370.1240.0810.806
I can observe the wastewater treatment technique0.083−0.1870.8060.298
Product safety certification is granted by authorities0.808−0.0480.0290.136
Investment and good management is safe0.0400.1950.1630.760
I can directly observe the process0.1480.0670.8300.255
The safety of fish is certified by authorities0.9010.0380.1250.082
Relatives and friends can confirm that the fish is safe0.1580.5380.540−0.266
Official mass media can confirm that the fish is safe0.4610.620−0.0790.162
Wastewater-raised fish is labeled by supermarkets0.0810.4880.618−0.239
The fish is certified by authorities0.2770.7690.1290.058
The fish is cheaper than other types of fish0.8770.280.169−0.047
The fish is sold in central markets−0.3640.6000.3850.042
The fish is sold in supermarkets−0.1050.7670.0320.319
The fish is sold by the authorized stores0.1810.834−0.0740.137
Notes: Bold factor loadings are used to create the variables to measure perceptions. Rotation Method: Varimax with Kaiser Normalization. Rotation converged in seven iterations. Kaiser–Meyer–Olkin (KMO) measure of Sampling adequacy (0.753) and Bartlett’s Test of Sphericity (0.000).

References

  1. Wichelns, D.; Drechsel, P.; Qadir, M. Wastewater: Economic Asset in an Urbanizing World. In Wastewater: Economic Asset in an Urbanizing World; Drechsel, P., Qadir, M., Wichelns, D., Eds.; Springer: Berlin, Germany, 2015; pp. 3–14. [Google Scholar]
  2. Edwards, P.; Pullin, R.S.V. Wastewater-Fed Aquaculture. In Proceedings of the International Seminar on Wastewater Reclamation and Reuse for Aquaculture, Calcutta, India, 6–9 December 1988; Environmental Sanitation Information Center, Asian Institute of Technology: Bangkok, Thailand, 1988. [Google Scholar]
  3. Edward, P. Wastewater and Excreta Use in Aquaculture; Asian Institute of Technology: Bangkok, Thailand, 2008; Volume 3. [Google Scholar]
  4. Vo, Q.H. Wastewater Reuse through Aquaculture in Hanoi: Status and Prospects. Master’s Thesis, Asian Institute of Technology, Bangkok, Thailand, 1996. [Google Scholar]
  5. World Health Organization (WHO). Guidelines for the Safe Use of Wastewater Excreta and Grey Water. Wastewater and Excreta Use in Aquaculture; World Health Organization: Geneva, Switzerland, 2006; Volume 3. [Google Scholar]
  6. Nguyen, L.H.; Nguyen, V.A.; Yamaji, E. Wastewater reuse in Thanh Tri District, Hanoi Suburb, Vietnam. In Guidelines for Water Reuse, Appendix E: International Case Studies; USEPA: Washington, DC USA, 2012; pp. E120–E122. [Google Scholar]
  7. Bunting, S. Confronting the realities of wastewater aquaculture in peri-urban Kolkata with bio economic modeling. Water Res. 2007, 41, 499–505. [Google Scholar] [CrossRef] [PubMed]
  8. Pal, D.; Das Gupta, C. Microbial pollution in water and its effect on fish. J. Aquat. Anim. Health 1992, 4, 32–39. [Google Scholar] [CrossRef]
  9. Easa, M.; El-S Shereif, M.M.; Shaaban, A.I.; Mancey, K.H. Public health implications of wastewater reuse for fish production. Water Sci. Tech. 1995, 32, 145–152. [Google Scholar] [CrossRef]
  10. Lan, N.T.; Dalsgaard, A.; Cam, P.D.; Mara, D. Microbiological quality of fish grown in wastewater-raised and non-wastewater fed fishponds in Hanoi, Vietnam: Influence of hygiene practices in local retail markets. J. Water Health 2007, 5, 209–218. [Google Scholar] [PubMed]
  11. Fattal, B.; Doan, A.; Tchorsh, Y. Rates of experimental microbiological contamination of fish exposed to polluted water. Water Res. 1992, 26, 1621–1627. [Google Scholar] [CrossRef]
  12. Edwards, P. Wastewater-raised aquaculture: State-of-the-art. In Proceedings of the International Conference on Ecological Engineering, Science City, Calcutta, India, 23–27 November 1998. [Google Scholar]
  13. Rao, K.; Taron, A.; Linh, N.D. Financial Assessment of Waste Reuse Business Models in Hanoi, Vietnam SDC Project Report; International Water Management Institute (IWMI): Colombo, Sri Lanka, 2015. [Google Scholar]
  14. Murray, A.; Cofie, O.; Drechsel, P. Efficiency indicators for waste-based business models: Fostering private-sector participation in wastewater and faecal sludge management. Water Int. 2011, 36, 505–521. [Google Scholar] [CrossRef]
  15. Mancy, K.H.; Fattal, B.; Kelada, S. Cultural implications of wastewater reuse in fish farming in the Middle East. Water Sci. Tech. 2000, 42, 235–239. [Google Scholar]
  16. Ortega, D.L.; Wang, H.L.; Wu, L.; Olynk, N. Modeling heterogeneity in consumer preferences for select food safety attributes in China. Food Policy 2011, 36, 318–324. [Google Scholar] [CrossRef]
  17. Olesen, I.; Alfnes, F.; Røra, M.B.; Kolstad, K. Eliciting consumers' willingness to pay for organic and welfare-labeled salmon in a non-hypothetical choice experiment. Livest. Sci. 2010, 127, 218–226. [Google Scholar] [CrossRef]
  18. Fonner, R.; Sylvia, G. Willingness to pay for multiple seafood labels in a Niche Market. Mar. Resour. Econ. 2015, 30, 51–70. [Google Scholar] [CrossRef]
  19. Roheim, C.A.; Sudhakaran, P.O.; Durham, C.A. Certification of shrimp and salmon for best aquaculture practices: Assessing consumer preferences in Rhode Island. J. Aquac. Econ. Manag. 2012, 16, 266–286. [Google Scholar] [CrossRef]
  20. Nguyen, Q.; Leung, P. Do fishermen have different attitudes towards risk? An application of prospect theory to the study of Vietnamese fishermen. J. Agric. Resour. Econ. 2009, 34, 518–538. [Google Scholar]
  21. Lusk, J.L.; Hudson, D. Willingness-to-pay estimates and their relevance to agribusiness decision making. Rev. Agric. Econ. 2004, 26, 152–169. [Google Scholar] [CrossRef]
  22. Kimenju, S.C.; Groote, H.D. Consumer willingness to pay for genetically modified food in Kenya. J. Agric. Econ. 2008, 38, 35–46. [Google Scholar] [CrossRef]
  23. Ibro, G.; Seydou, R.; Saley, K.; Everhart-Valentin, K.; Fulton, J.; Lowenberg DeBoer, J.; Otoo, M. Testing the Market Potential for a New Value-Added Cowpea Product to Improve the Well-Being of Women Entrepreneurs in West Africa. J. Int. Agric. Ext. Educ. 2008, 16, 43–55. [Google Scholar] [CrossRef]
  24. Umberger, W.J.; Feuz, D.M. The usefulness of experimental auctions in determining consumers' willingness-to-pay for quality-differentiated products. Rev. Agric. Econ. 2004, 26, 170–185. [Google Scholar] [CrossRef]
  25. Adamowicz, W.; Boxall, P.; Williams, M.; Louviere, J. Stated preference approaches for measuring passive use values: Choice experiments and contingent valuation. Am. J. Agric. Econ. 1998, 80, 64–75. [Google Scholar] [CrossRef]
  26. Lusk, J.L.; Schroeder, T.C. Are Choice Experiments Incentive Compatible? A Test with Quality Differentiated Steaks. Am. J. Agric. Econ. 2004, 86, 467–482. [Google Scholar] [CrossRef]
  27. Birol, E.; Karousakis, K.; Koundouri, P. Using a choice experiment to account for preference heterogeneity in wetland attributes: The case of Cheimaditida wetland in Greece. J. Ecol. Econ. 2006, 60, 145–156. [Google Scholar] [CrossRef]
  28. Ndunda, E.; Mungatana, E. Evaluating the welfare effects of improved wastewater treatment using a discrete choice experiment. J. Environ. Manag. 2013, 123, 49–57. [Google Scholar] [CrossRef] [PubMed]
  29. Honkanen, P.; Olsen, S.O. Environmental and animal welfare issues in food choice: The case of farmed fish. Br. Food J. 2009, 111, 293–309. [Google Scholar] [CrossRef]
  30. Vanhonacker, F.; Altintzoglou, J.; Luten, T.; Verbeke, W. Does fish origin matter to European consumers? Insights from a consumer survey in Belgium, Norway and Spain. Br. Food J. 2011, 113, 535–549. [Google Scholar] [CrossRef]
  31. Ubilava, D.; Foster, K. Quality certification vs. product traceability: Consumer preferences for informational attributes of pork in Georgia. Food Policy 2009, 34, 305–310. [Google Scholar] [CrossRef]
  32. Hensher, D.A.; Rose, J.M.; Green, W.H. Applied Choice Analysis: A primer; Cambridge University Press: New York, NY, USA, 2005. [Google Scholar]
  33. De Bekker-Grob, E.W.; Donkers, B.; Jonker, M.F.; Stolk, E.A. Sample size requirements for discrete-choice experiment in healthcare: A Practical Guide. Patient 2015, 8, 373–384. [Google Scholar] [CrossRef] [PubMed] [Green Version]
  34. General Statistics Office (GSO). The Vietnam Population and Housing Census, 2009; General Statistics Office: Hanoi, Vietnam, 2010; Available online: https://unstats.un.org/unsd/demographic/sources/census/wphc/Viet%20Nam/Vietnam-Findings.pdf (accessed on 17 May 2016).
  35. Swait, J.; Louviere, J. The role of the scale parameter in the estimation and comparison of multinomial logit models. J. Mark. Res. 1993, 30, 305–314. [Google Scholar] [CrossRef]
  36. Louviere, J.; Hensher, D.; Swait, J. Stated Choice Methods: Analysis and Applications, 1st ed.; Cambridge University Press: Cambridge, UK, 2002. [Google Scholar]
  37. Kline, P. An Easy Guide to Factor Analysis; Routledge: Abingdon, Oxon, 1994; pp. 14–42. [Google Scholar]
  38. Field, A. Discovering Statistics Using SPSS, 2nd ed.; SAGE: London, UK, 2005. [Google Scholar]
  39. Bechtold, K.B.; Abdulai, A. Combining attitudinal statements with choice experiments to analyze preference heterogeneity for functional dairy products. Food Policy 2014, 47, 97–106. [Google Scholar] [CrossRef]
  40. Hensher, D.A.; Green, W.H. The mixed logit model: The state of practice. J. Transp. 2003, 30, 133. [Google Scholar] [CrossRef]
  41. Marschke, M.; Wilkings, A. Is certification a viable option for small producer fish farmers in the global south? Insights from Vietnam. Mar. Policy 2014, 50, 197–206. [Google Scholar]
  42. Meijer, E.; Rouwendal, J. Measuring welfare effects in models with random coefficients. J. Appl. Econ. 2006, 21, 227–244. [Google Scholar] [CrossRef]
  43. Train, K.E. Discrete Choice Methods with Simulation; Cambridge Books; Cambridge University Press: Cambridge, UK; New York, NY, USA, 2003. [Google Scholar]
  44. Train, K.E. Recreation demand models with taste differences over people. Land Econ. 1998, 74, 230–239. [Google Scholar] [CrossRef]
  45. Boxall, P.; Adamowicz, W. Understanding heterogeneous preferences in random utility models. A latent class approach. J. Environ. Resour. Econ. 2002, 23, 421–446. [Google Scholar] [CrossRef]
  46. Ouma, E.; Abdulai, A.; Drucker, A. Measuring heterogeneous preferences for cattle traits among cattle-keeping households in East Africa. Am. J. Agric. Econ. 2007, 89, 1005–1019. [Google Scholar] [CrossRef]
  47. Lim, K.H.; Hu, W.; Maynard, L.J.; Goddard, E. U.S. consumers’ preference and willingness to pay for country-of-origin labeled beef streak and food safety enhancements. Can. J. Agric. Econ. 2013, 62, 93–118. [Google Scholar] [CrossRef]
  48. Krinsky, L.; Robb, A.L. On approximating the statistical properties of elasticities. Rev. Econ. Stat. 1986, 68, 715–719. [Google Scholar] [CrossRef]
Table 1. Attribute levels and descriptions used in the experiment.
CategoriesAttribute LevelsDescriptionCoding
1. Price of fish in USD/kg (VND/kg)2.18; 2.50; 2.77
(48,000; 55,000; 61,000)
Refers to the retail price of fish or market price of fish where respondents typically shop.Continuous variable
2. Information on medium or source used to raise the fish - source of fish (SOURCE)- None;
- Farmed fish (freshwater);
- Wastewater-raised fish (wastewater)
Fish product carries information regarding the medium used to rear the fish;
- None denotes if there is no information on the source of water used to raise fish;
- Farmed fish (freshwater) indicates that freshwater is used to raise fish;
- Wastewater-raised fish indicates that wastewater is used to raise fish.
Dummy variables
3. Certification for quality (CERT)Yes; NoIf present product carries a label issued by an organization a assuring that the product was inspected throughout the production process for safety and quality.Dummy variable
a Trustworthy organization that provides food certification services (in the case of Hanoi, the Directorate for Standards and Quality under the Ministry of Science and Technology). USD = United States Dollar; VND = Vietnamese Dong; 1 USD = 22,000 VND. Tilapia is a very commonly consumed fish in Hanoi, and represents one of the few species of fish that can be reared in freshwater and treated wastewater. VND is defined here as Vietnamese Dong.
Table 2. A sample of choice card used in the experiment for selected households.
Fish AttributesOption AOption BOption COption D
Price in USD/ kg (VND/kg)2.18 (48,000)2.50 (55,000)2.77 (61,000)If options A, B, and C were all that was available at my local shop I would not purchase fish from that shop.
SourceFreshwaterNoneWastewater
CertificationNoYesYes
I would choose…
Table 3. Households’ socio-demographic profiles.
Respondents’ CharacteristicsVariablePercentage (%)National Statistics
GenderMale8374.1
Female1725.9
Age<258.124.3
26–352017.8
36–4524.420
46–5526.724.8
56–6512.67.4
>656.75.7
Education levelUp to grade 1272.677
Some college10.423
University10.4
Annual Household Income (in USD)0–45571.16000
456–91013.3
911–13641.5
1365–18182.2
>181911.9
Household size<29.63.85
324.8
441.6
514.6
68
Note: The source of national statistics data was obtained from https://www.cia.gov/library/publications/the-world-factbook/geos/vm.html; the national educational rate information was obtained from http://wenr.wes.org/2014/05/higher-education-in-vietnam/. It is important to note that the gross graduation rate is estimated at 10%. The national statistics value for household income is the average annual income and value for household size is the national average household size.
Table 4. Evaluation of key factors influencing households’ fish purchasing decisions.
CriteriaFive-Level Likert Scale Ranking
TrueTrue But Not Completely CorrectMaybe TrueFalseNo Idea
Percent of Surveyed RespondentsPercent of Surveyed RespondentsPercent of Surveyed RespondentsPercent of Surveyed RespondentsPercent of Surveyed Respondents
1. Taste is the most important factor78.714.03.72.9
2. To know clearly the source of fish consumed50.722.821.32.22.2
3. Having reliable sellers available55.130.911.81.5
4. Safety in use is important83.813.22.2
5. No negative impacts on health74.322.80.71.5
6. Fresh gills are the most important factor49.336.811.81.5
7. Fresh fin is an important factor19.147.827.93.70.7
8. Fresh and clear eyes are important factors24.350.122.11.50.7
9. Undamaged, unscratched fishtail is an important factor16.946.327.97.40.7
10. It is important that the fish is healthy and can swim fast51.533.112.512.52.2
11. Ease in processing is an important factor24.325.732.414.72.2
12. Limited time needed to process and cook fish5.930.93919.14.4
13. How the sellers pre-process the fish is an important factor18.428.737.513.21.5
14. A convenient location to purchase the fish is an important factor43.422.823.59.6
15. Low price is an important factor21.323.525.728.7
16. Stable price is an important factor39.725.726.57.4
17. Clear price tags are important factors27.923.536.89.61.5
Table 5. Households' perceptions of wastewater-raised fish.
Criteria - I Would Buy Wastewater-Raised Fish If:Five-level Likert scale ranking
Strongly DisagreeDisagreeNeutralAgreeStrongly Agree
Percent of Surveyed RespondentsPercent of Surveyed RespondentsPercent of Surveyed RespondentsPercent of Surveyed RespondentsPercent of Surveyed Respondents
  1. Current technology can treat wastewater for fish rearing3.75.921.359.68.8
  2. I can observe the wastewater treatment technique1431.643.410.3
  3. Product safety certification is granted by authorities1.52.95.953.735.3
  4. Investment and good management is safe2.92.924.3618.1
  5. I can directly observe the process1.58.831.648.58.8
  6. The safety of fish is certified by authorities1.53.73.755.135.3
  7. Relatives and friends can confirm that the fish is safe1.514.723.554.45.1
  8. Official mass media can confirm that the fish is safe1.57.421.359.69.6
  9. Wastewater-raised fish is labeled by supermarkets2.214.730.144.18.1
  10. The fish is certified by authorities0.74.41.551.541.2
  11. The fish is cheaper than other types of fish22.829.42518.43.7
  12. The fish is sold in central markets5.919.128.741.93.7
  13. The fish is sold in supermarkets5.99.636.8398.1
  14. The fish is sold by the authorized stores1.52.92.952.239.7
Table 6. Composite variables from the principal component analysis.
IndexDescription of Factor Aggregation
Perception 1Component 1:
Fresh fin is an important factor
Fresh and clear eyes are important factors
Undamaged, unscratched fishtails is an important factor
It is important that the fish is healthy and can swim fast
Component 2:
Taste is the most important factor
Fresh gills are the most important factor
A convenient location to purchase the fish is an important factor
Stable price is an important factor
Clear price tags are important factors
Component 4:
To know clearly the source of fish consumed
Having reliable sellers available
Component 5:
Safety in use is important
No negative impacts on health
Perception 2Component 3:
Ease in processing is an important factor
Limited time need to process and cook fish
How the seller pre-processed the fish is an important factor
Perception 3Component 2:
Official mass media can confirm that the fish is safe
The fish is labeled by supermarkets
The fish is cheaper than other types of fish
The fish is sold in central markets
The fish is sold in supermarkets
Component 3:
I can observe the wastewater treatment technique
I can directly observe the process
Relative and friends can confirm that the fish is safe
Perception 4Component 1:
Product safety certification is granted by authorities
The safety of fish is certified by authorities
The fish is certified by authorities
The fish is sold by the authorized stores
Component 4:
Current technology can treat wastewater for fish rearing
Investment and good management is safe
Note: To create the composite index, add all the factors under the component and divide by total number of factors.
Table 7. Definition of variables used in the regression analysis.
VariablesDescription
GenderGender of the respondents; dummy variable where male is 1 and 0 for female: gender_wastewater (gender interaction with wastewater-raised fish source attribute); gender_freshwater (gender interaction with farmed-fish source variable), gender_certification (gender interaction with certification attribute)
AgeAge of the respondents in years; age_wastewater (age interaction with wastewater fed-fish source attribute); age_freshwater (age interaction with farmed fish source attribute); age_certification (age interaction with certification attribute)
EducationRespondents’ education in years; education_wastewater (education interaction with wastewater-raised fish source attribute); education_freshwater (education interaction with farmed-fish source attribute), education_certification (education interaction with certification attribute)
IncomeHousehold annual income; income_wastewater (income interaction with wastewater-raised fish source attribute); income_freshwater (income interaction with farmed-fish source attribute); income_certification (income interaction with certification attribute)
Household sizeHousehold size; household size_wastewater (household size interaction with wastewater-raised fish source attribute); household_freshwater (household size interaction with farmed-fish source attribute); household size_certification (household size interaction with certification attribute)
Perception 1Respondents’ perceptions whether safety of fish is assured; Perception1_wastewater (perception of fish safety interaction with wastewater-raised fish source attribute); Perception1_freshwater (perception of fish safety interaction with farmed-fish source attribute); Perception1_certification (perception of fish safety interaction with certification
Perception 2Respondents’ perceptions on the processing technology or treatment system for wastewater fed-fish farming; Perception2_wastewater (perception of fish on processing system interaction with wastewater-raised fish source attribute); perception2_freshwater (perception of fish on processing technology interaction with farmed-fish source attribute); perception2_certification (perception of fish on processing technology or system interaction with certification attribute)
Perception 3Respondents’ perceptions on information on the type of market the fish is sold in (supermarket, or central market); perception3_wastewater (perception of fish market types interaction with wastewater-raised fish source attribute); perception3_freshwater (perception of fish market types interaction with farmed-fish source attribute); perception3_certification (perception of fish market types interaction with certification attribute)
Perception 4Respondents’ perceptions if certification is done by relevant authority; perception4_wastewater(perception of fish certification by relevant authority interaction with wastewater-raised fish source attribute); perception 4_freshwater (perception of fish certification by relevant authority interaction with farmed-fish source attribute); perception4_certification (perception of fish certification by relevant authority interaction with certification attribute)
Table 8. Parameter estimates from the conditional logit (CL) and random parameters logit (RPL) models.
ModelsBasic ModelsExtended Models
Conditional Logit (CL)Random Parameter Logit (RPL)Conditional Logit (CL)Random Parameter Logit (RPL)
VariablesCoefficient (s.e.)Coefficient (s.e.)Coefficient (s.e.)Coefficient (s.e.)
Price−0.073 (0.001) ***−0.077 (0.173) ***−0.074 (0.006) ***−0.074 (0.008) ***
Source wastewater1.195 (0.115) ***1.652 (0.107) ***1.456 (0.363) ***2.235 (0.544) ***
Source freshwater0.314 (0.106) ***0.269 (0.107) ***0.934 (0.476) **1.583 (0.707) **
Certification1.602 (0.107) ***1.974 (0.163) ***2.049 (0.356) ***2.369 (0.465) ***
Gender_wastewater −0.134 (0.212)−0.124 (0.323)
Gender_freshwater −0.015 (0.218)−0.519 (0.435)
Gender_certification −0.457 (0.271) *−0.026 (0.279)
Age_wastewater −0.003 (0.005)−0.004 (0.007)
Age_freshwater −0.004 (0.005)−0.017 (0.009) *
Age_certification −0.009 (0.006)−0.003 (0.006)
Education_wastewater −0.012 (0.023)−0.006 (0.036)
Education_freshwater 0.004 (0.025)0.035(0.046)
Education_certification 0.018 (0.031)−0.012 (0.031)
Income_wastewater 0.003 (0.002)−0.006 (0.003) **
Income_freshwater 0.002 (0.002)0.003 (0.002)
Income_certification 0.004 (0.002) **0.003 (0.002)
Household size_wastewater −0.081 (0.179)−0.541 (0.250) **
Household size_freshwater −0.403 (0.177) **−0.570 (0.321)
Household size_certification −0.302 (0.216)−0.126 (0.224)
Perception1_wastewater −0.012 (0.081)−0.029 (0.118)
Perception1_freshwater −0.262 (0.104)−0.334 (0.156) **
Perception1_certification −0.076 (0.079)−0.095 (0.100)
Perception2_wastewater −0.205 (0.084) **−0.260 (0.120) **
Perception2_freshwater −0.240 (0.115) **−0.211 (0.179)
Perception 2_certification 0.016 (0.085)0.037 (0.105)
Perception 3_wastewater 0.128 (0.095)0.142 (0.138)
Perception 3_freshwater 0.193 (0.122)0.261 (0.179)
Perpcetion3_certification −0.042 (0.097) **0.193 (0.118) ***
Perception 4_wastewater −0.151 (0.089) ***0.072 (0.137)
Perception4_freshwater 0.272 (0.123) **−0.036 (0.172) ***
Perception4_certification 0.173 (0.093) ***−0.213 (0.119) ***
Stdv (source_wastewater) 0.888 (0.191) ***
Stdv (source_freshwater) 1.064 (0.209) ***
Stdv (certification) 0.462 (0.167) ***
Opt out −0.602 (0.093) *** −0.398 (0.131) ***
Log likelihood−739.430−665.44−691.49−617.188
McFadden R20.06270.313280.12350.36308
AIC1486.91346.914451310.4
Note: parentheses indicate the standard errors of the respective coefficients; * refer to significance at 10% level; ** significance at 5% level; and *** significance at 1% level. In the case of this study, the two fish types were considered for the market experiments. We considered Carp and Tilapia fish types. There was no significant difference between the regression model results for Tilapia and Carp. Thus, we present the choice experiment results for Tilapia only. We interacted the three attributes and added interactive terms in the model, but there were all insignificant.
Table 9. Latent class model results.
ClassesClass 1 (Segment): “Moderate Certification Households”Class 2 (Segment): “High Certification Households”
VariablesCoefficient (standard error)Coefficient (standard error)
Price−0.261 (0.061) ***−0.032 (0.015) ***
Source_wastewater3.722 (1.007) ***1.944 (0.0.223) ***
Source_freshwater2.135 (0.732) ***1.211 (0.195) ***
Certification3.462 (0.699) ***2.072 (0.185) ***
Class Probability0.700.30
Log Likelihood−609.378
McFadden R20.371
AIC1246.8
Note: parentheses indicate the standard errors of the respective coefficients; *** refer to significance at 1% level.
Table 10. Characteristics of households by classes.
Respondents’ CharacteristicsClass 1 (Segment N = 96): “Moderate Certification Households”Class 2 (Segment N = 39): “High Certification Households”
Mean (s.d.)Mean(s.d.)
Age **46.19 (16.60)37.29 (11.82)
Income284 (66.79)159.0 (22.81)
Household size **4.39 (1.40)3.62 (0.74)
Percentage
Gender
 - Male91.785.7
 - Female14.314.3
Education
 - Up to grade 1283.871.4
 - Some college7.120.0
 - University9.18.6
Perception variablesMean (s.d.)Mean (s.d.)
Perception 1 ***3.37 (0.85)3.92 (0.66)
Perception 2 ***3.34 (0.797)3.82 (0.79)
Perception 3 **3.42 (0.92)3.74 (0.71)
Perception 4 **3.10 (0.97)3.46 (0.96)
Note: T-test and Person Chi-Square tests show significance differences among the segments at (**) 5% and (***) 1% significance levels. Perceptions variables treated as continuous variables with the following scale for reference: 1 = strongly disagree, 2 = disagree, 3 = neutral, 4 = agree, 5 = strongly agree.
Table 11. Households’ willingness-to-pay, mean (95% confidence interval).
AttributesBasic ModelsExtended Models
Conditional Logit (CL)Random Parameter Logit (RPL)Conditional Logit (CL)Random Parameter Logit (RPL)
Source_wastewater0.744 (0.047) ***0.971 (0.079) ***0.765 (0.327) ***1.108 (0.104) ***
Source_freshwater0.195 (0.058) ***0.123 (0.035) **0.539 (0.359) ***0.427 (0.100) ***
Certification0.997 (0.058) ***1.161 (0.098) ***1.144 (0.367) ***1.422 (0.302) ***
Note: Standard deviations calculated through bootstrapping procedure are given in parentheses. Note: parentheses indicate the standard errors of the respective coefficients; ** refer to significance at 5% level; and *** significance at 1% level.
Table 12. Willingness-to-pay per household segment, mean (95% confidence interval).
AttributesClass 1 (Segment): “Moderate Certification Households”Class 2 (Segment): “High Certification Households”
Source_wastewater0.65 (0.055) ***2.74 (1.34) **
Source_freshwater0.37 (0.06) ***1.71 (0.87) **
Certification0.60 (0.07) ***2.92 (1.40) ***
Note: Standard deviations calculated through bootstrapping procedure are given in parentheses. Note: parentheses indicate the standard errors of the respective coefficients; ** refer to significance at 5% level; and *** significance at 1% level.
Table 13. Estimated benefits from certification of wastewater-raised fish in Hanoi, Vietnam.
Marginal WTP for Certification
(USD per kg)
Unit Cost of Certification (USD per kg)
(Lower–Higher Limit)
Total Cost of Certification
(in millions USD)
Total Estimated Benefits from Certification
(in millions USD)
Net Benefit from Certification
(in millions USD)
1.420.19–0.2423.03–33.94172.24138–149

