The Forgotten Islands: Monitoring Tourist Numbers and Managing Tourism Impacts on New Zealand’s Subantarctic Islands


1
Faculty of Environment, Society & Design, Lincoln University, P.O. Box 85084, Lincoln 7647, Christchurch, New Zealand
2
Gateway Antarctica, University of Canterbury, Private Bag 4800, Christchurch, New Zealand
*
Author to whom correspondence should be addressed.
Resources 2017, 6(3), 38; https://doi.org/10.3390/resources6030038
Submission received: 2 June 2017
/
Revised: 7 August 2017
/
Accepted: 11 August 2017
/
Published: 15 August 2017
(This article belongs to the Special Issue Sustainable Tourism and Natural Resource Conservation in the Polar Regions)
Abstract
:Situated to the south of New Zealand in the Southern Ocean are the New Zealand Subantarctic Islands, comprising the Auckland, Campbell, Antipodes, Snares and Bounty Islands. Sometimes referred to as the ‘Forgotten Islands’, these island groups are among the most remote and hostile within New Zealand waters. Yet, as they harbour some of the country’s most unique biodiversity and contain some of the world’s least modified landforms, they were recognized in 1998 with the designation of World Heritage Area status. It is not surprising therefore that the Islands have long appealed to visitors wishing to explore and understand the Islands’ rich natural and cultural environments. Typically, fare-paying tourists arrive by sea in small- to medium-sized expedition-style cruise vessels, although in recent years, the number of small vessels, such as yachts and sail boats, has increased. The most recent Conservation Management Strategy (2016) proposes developing and implementing a visitor monitoring programme to determine the effects of visitors on the natural and cultural environment, as well as on the visitor experience itself. However, there is only piecemeal data published on visitor numbers (especially since the mid-1990s) upon which to base visitor monitoring, and there is only limited evidence regarding the range of possible impacts visitors may have, including direct and indirect impact on wildlife, soils, and vegetation. In order to address this gap in knowledge, this case study draws on stakeholder interviews (n = 4), and a range of secondary sources (including visitor statistics from the Department of Conservation, tour operators and other published works) to provide an overview and update on visitation to the Islands, including site-specific data, an assessment of tourist impacts, and how impacts are currently monitored and managed.
1. Introduction
Throughout the Subantarctic region are widely scattered islands, occurring in ten recognized groups, belonging to six states [1]. The New Zealand Subantarctic Islands are made up of five groups of islands: The Auckland Islands; Campbell Island; Antipodes Islands; Snares Islands; and Bounty Islands (see Figure 1). Often called the ‘Forgotten Islands’, these islands and their coastal environments are among the most remote and hostile within New Zealand’s waters. However, they are home to some of the country’s most unique biodiversity and contain some of the least modified landforms in the world. The Subantarctic Islands’ climate and geographical isolation from mainland New Zealand, and from each other, has enabled these islands to become a sanctuary for a wide range of biodiversity with a high degree of endemism. These features contributed to their designation as national nature reserves in 1986, one of the highest levels of statutory protection in New Zealand.
Furthermore, in 1998, these island groups and their coastlines were internationally recognized as a World Heritage Area due to their outstanding representation of significant ongoing ecological and biological processes and their ability to provide natural habitats for threatened species with outstanding universal value from the point of view of science and conservation (criteria 9 and 10, see The United Nations Educational, Scientific and Cultural Organization (UNESCO) criteria; Department of Conservation, 2014; UNESCO, 1998) (see Table 1).
Since tour operators first began offering commercial cruises in 1967, these Islands have seen an increasing number of tourists [7,8]. Until 1987, only one to two ships visited the Islands annually, bringing with them between 45 and 190 passengers over the duration of each cruise season. Since this time, visitation increased, and a record season between 2008 and 2009 saw 17 vessels bring 1333 passengers to view the New Zealand Subantarctic Islands [8] (the 2008–2009 season also saw record numbers of tourists visiting the Antarctic Peninsula [9]). With such a substantial number of visitors comes the potential for biophysical impacts on these environments, each with varying degrees of significance. Being able to effectively manage these impacts is of utmost importance to the Department of Conservation (DOC), the sole governing body in charge of the management of these island groups. In 2016, DOC published the revised Conservation Management Strategy [10] for the Islands, and proposed a visitor monitoring programme to determine the effects of visitors on the natural and cultural environment, as well as on the visitor experience itself. Critical to the success of the visitor monitoring programme is the availability of reliable data on tourism activities.
However, there is only piecemeal data reported on visitor numbers in the literature (especially since the mid-1990s), and while a knowledge base around the impacts and origins of non-native species in the Antarctic [11,12], and to some extent in the Subantarctic has been established [13] there is limited evidence regarding the full range of possible impacts visitors to the New Zealand Subantarctic Islands may have. In order to address this gap in knowledge, we first need to better understand the patterns and spatial extent of visitation to those islands as well as the impacts that have already been recorded. Responding to these research needs, the objectives of the research upon which this case study paper is based were to: (a) review relevant Department of Conservation visitor management documents and existing visitor data; (b) synthesize summaries of current visitor impact data and identify the range of human impacts occurring on the Islands; and (c) review current strategies for managing tourism to the Islands. As far as we are aware, this is the first time since the mid-1990s that the data on visitation to these islands has been collated, presented and organized at a site-specific scale.
2. Materials and Methods
The research was necessarily exploratory and largely descriptive in nature. In order to gain a holistic perspective on the management of tourism to New Zealand’s Subantarctic Islands, a primarily desk-based approach was taken to collate information from a variety of sources, including:
- (a)
- Peer-reviewed articles and prior research about the New Zealand Subantarctic Islands accessed through both internet databases and library catalogues. We used a keyword search of two online scholarly databases (Scopus and Google Scholar) for any articles that had a focus on tourism to the New Zealand Subantarctic Islands.
- (b)
- Four semi-structured interviews, providing first-hand evidence relating to managing and visiting the New Zealand Subantarctic Islands held with a tour guide, a tour operator, a visitor, and a DOC advisor. The interviews focused on topics related to visitor experience, visitor impacts and visitor management. All interviews were transcribed verbatim, and recurring themes and topics were identified and further explored.
- (c)
- A review of policy documents related to the conservation of the Islands and their management in respect of tourism to the Islands. The relevant policy documents were identified in conjunction with DOC and then independently analysed. DOC also provided some site vegetation monitoring data conducted between 2004 and 2013.
- (d)
- An analysis of available data on visitor numbers based on a review of historic visitation (through previously published literature and from tour operators) and more current numbers, including site-specific data (from about 2004 onwards, although data is spotty) that were provided directly by DOC. A spreadsheet was created to show total visitor numbers arriving annually (as well as the number of vessels transporting visitors) in addition to visitation to key landing sites.
3. Results
In order to situate current tourism data, we provide a brief overview of human exploration of the Islands and the early developments in Subantarctic tourism in the following section. We then explore existing tourism data (both published and from DOC sources) to provide an updated overview of visitation to the Islands collectively, but also on a site basis.
3.1. Early Visitors
While early Māori knew of the existence of these islands, the first of the New Zealand Subantarctic Islands to be discovered by Europeans were the Bounty Islands in 1788 [3]. Over the next 22 years, each of the other four island groups were revealed during various European expeditions to this remote corner of the world, concluding with the discovery of the Campbell Islands in 1810 by Captain Frederick Hasselburgh on the Perseverance [3].
Following their discovery by Europeans, the Islands became a place of refuge for ships during the exploration of the Antarctic. As the Islands and their resources became known to the European explorers, permanent whaling bases and camps for sealers were established [6]. Unsurprisingly, by 1827, seal populations throughout southern New Zealand and the Subantarctic region had been severely depleted, although the sealing industry remained (at least in sporadic form) until the last open season on fur seals in New Zealand in 1946 [3].
The first whaling station was established at Port Ross, in the Auckland Islands, in 1850 but lasted less than three years [14]. The second attempt at establishing a permanent whaling station came years later, in Northwest Bay on Campbell Island in 1909, and Northeast Bay, also on Campbell Island, in 1911 [3]. While initially successful, the declaration of the First World War resulted in all resident whalers enlisting and heading to war in 1916 [6].
The decline in whaling and sealing around the Islands, resulted in the abandonment of any permanent settlements, although sheep, pigs, poultry, rabbits, and various vegetables and garden fruits were introduced on the Auckland Islands to serve as an emergency food supply for future castaways [3]. Attempts were made to establish farms on Auckland and Campbell Islands in 1894 and 1895, with the introduction of sheep and cattle. However, neither approach saw success, and the Islands ceased farming within a few decades (Auckland Island in 1910, and Campbell Island in 1931) [3]. Since that time, the Islands and their wildlife, both native and introduced, were largely left alone, other than sporadic scientific voyages. As the scientific knowledge about the Islands grew, they were declared National Nature Reserves in 1986, receiving the highest level of protection available under New Zealand legislation for the preservation of their indigenous biodiversity and natural features.
3.2. Visitor Numbers and Trends
Headland (1994) traces the earliest voyages carrying passengers identified as ‘tourists’ to Campbell Island and the Auckland Islands (as well the Australian Macquarie Island) to the early 1880s, when ships were commissioned to search for castaways and check the status of provisions deposited on the Islands [15]. However, the modern era of commercial tourism did not start until the 1960s when the Islands witnessed infrequent visitation from commercial vessels, such as the Lindbald Explorer (Lindbald Travel) and World Discovery (Society Expeditions). This era can be regarded as the early days in tourist visits to the Islands, where the total number of visitors between 1967 and 1985 was only 1034 (see Figure 2). A watershed moment came in 1988 when New Zealand-based nature tourism operators Discovery Charters South Seas, Southern Heritage Tours (now Heritage Expeditions) and Pegasus Dive Charters began offering yacht-based tours to the Islands for up to 20 people [5]. As a result, visitor numbers to the Subantarctic Islands dramatically increased, as is illustrated in Figure 2.
As the public became more aware of these islands, tourism operators sought to establish regular expedition cruises, allowing the public to experience the Islands and be educated about the unique flora and fauna found there. With these commercial offerings came an exponential increase in visitation, with 1201 visits over the six years spanning 1985 to 1991. This can be seen as the growth stage in tourism to the Subantarctic Islands.
Hall and Wouters (1994) suggest that there were four key reasons behind this initial increase in tourism to the Subantarctic region: (1) increase in public awareness of remote tourism destinations through increased exposure to wildlife documentaries, membership of conservation organizations, and advertising; (2) relative tourist overcrowding of the Antarctic Peninsula, leading some operators to search for more remote destinations that convey an Antarctic experience for visitors without other tourists being sighted; (3) improved ship-transport technology, making travel more comfortable and safer for tourists; and (4) overall expansion of the Antarctic/Subantarctic tourism market [5]. While the overall growth in tourist demand appears to have stabilized since the early 1990s, the volume of tourist visits to the Islands is now established, with 13,890 visits over this period (Figure 2). According to one tour operator:
“…demand for visitation is currently described as ‘flat’, for example: The Islands are not a destination in their own right, they are a stop-over on the way, or way back from, Antarctica. If you don’t stop at the Subs, it is a long time at sea. Generally there is a fixed number, of which is very small, a lot smaller than projections indicate. Any spikes in demand are due to other ships, taking one-off trips. The demand is flat.”
These ‘spikes’ in demand, seen in seasons 2000–2001, 2005–2006 and 2008–2009, can be attributed to significant calendar events which may draw more passengers than other years, e.g., new millennium, Mawson Centenary, or Scott Centenary. Given that adventure and nature-based travel are two of the fastest growing sectors of the tourism industry [16], it is not surprising that areas such as the Subantarctic Islands have received such sustained visitation over the last 20 years.
Counting ship visits provides a crude overview of visitation. Knowing how many passengers are on each ship offers a better indication of the pressure placed on the environment during each visit. It may also help to explain some unusual trends found in the data, such as in the 2014–2015 season where 11 ships carried 657 passengers, but in the 2013–2014 season, 12 ships brought 1063 passengers. Conversely, a comparison of the seasons 1992–1993 and 1993–1994 shows two more ships in the 1993–1994 season, yet 360 fewer tourists. In order to determine how many passengers landed at each site per vessel, quotas and permits were introduced to help monitor impacts on the environment.
When visiting the New Zealand Subantarctic Islands, tourists have the chance to land on Auckland Island’s Main Island and Enderby Island as well as Campbell Island, and to experience the Snares Islands via a zodiac boat (a small inflatable motorized dingy). Each island has specific visitor sites and tracks, allocated by DOC, allowing tourists access to various highlights the Islands have to offer. Research found that tourists visiting the New Zealand Subantarctic Islands and Antarctica were likely to be mature in age, highly educated, affluent, have a high degree of conservation group involvement, and generally very positive about their experiences and satisfactions derived from their visits [7]. Of the limited research conducted on the social aspects of tourism to the New Zealand Subantarctic Islands, the main motivations for going on a trip to these islands include the special settings, wildlife, and remoteness [7].
3.3. Managing Visitors
Tourist landings are only permitted on Auckland Islands’ Main and Enderby Islands and on Campbell Island. While it is possible for visitors to observe the coastline of the Snares Island group via zodiac, no landings are permitted [4]. As visits became more frequent, formal management plans were established, for Campbell Island in 1983, the Snares in 1984, and the Auckland Islands in 1987. With these management plans came a quota and permit system, which was introduced by DOC to keep a record of shore landings.
For every shore landing, an entry permit is required per day and per person to cover quarantine and processing costs as well as the Subantarctic Guidebook, which is given to visitors [5]. An entry permit requires a fee to cover both processing of the permit and visitor impact management. Currently, the base fee amounts to NZD 150 per person. In addition, a landing fee of NZD 75 is charged per person and landing at hardened sites, i.e., the Enderby Island Northern Cliffs and Campbell Island Col-Lyall boardwalks. For other sites, the landing fee amounts to NZD 20 per person and day. The permits can be privately obtained, but are most often used by commercial operators who must also obtain a concession to authorize their business activities. A fee is also charged for a concession, which covers both the concession processing fee and a Crown Resources Rental of NZD 12 per day and person, or NZD 6 per half-day and person.
In 1990/1991, a quota of 500 visitors, or four ship visits, per season was set for the Auckland and Campbell Islands [5]. This quota was then increased to a maximum of 600 people to land at any one designated tourism site [5]. Permits are required for all land access, irrespective of purpose (for instance, research, tourism, management, etc.), and visitors are defined as ‘people using areas and facilities managed by the Department of Conservation’ [4] (p. 221). Although it is technically possible to arrange visits to the Islands independently, typically the Subantarctic Islands are visited using the services of a concessionaire/tour operator. The visitor quota and visitor management regime for the New Zealand Subantarctic Ilands came under revision in 2016 as part of the recent Conservation Management Strategy for the Southland Murihiku region [10].
3.4. Visitor Sites
Within the islands that allow landings, DOC has specified tracks and areas where tourists are permitted to visit (see Figures 3, 5 and 7). These sites are categorized into ‘large’ and ‘small’ sites, depending on the number of permits DOC has allocated for these visitation areas (Peat, 2006). Only three ‘large’ sites exist; Enderby Island, and the Enderby Island settlement/cemetery site in the Auckland Islands, and the Col-Lyall Saddle boardwalk site on Campbell Island. Up until recently, the ‘small’, more vulnerable sites could receive no more than 150 visitors per season, a number reviewed in the most recent Conservation Management Strategy (2016) [4,10]. Guidelines now identify 17 key visitor areas/or tracks and determine both (a) the maximum number of visitors per day, and (b) the maximum number of visitors per year. The smaller sites allow for 50 visitors per day (and between 50 and 400 visitors annually), while the two large sites, now identified as the Northern Cliffs (Enderby Island) and the Col-Lyall Saddle Track (Campbell Island), permit 200 visitors per day (and 1100 annually). The guidelines also allow for 25 landings per year by non-commercial visitors on small vessels [10].
The following maps (Figures 3, 5 and 7) depict selected landing sites on the Enderby, Auckland and Campbell Islands, and the accompanying charts outline visitation over time to a selection of key landing sites. All figures show the set quota in blue and the activated permits in red. In the past, quotas have been set on an annual basis, and have fluctuated quite significantly as the following figures indicate. The current Conservation Management Strategy (2016) has now fixed these quotas for the duration of the policy document, or until the proposed Subantarctic Visitor Management Plan is implemented (or until visitor facilities are improved to prevent adverse effects) [10].
3.4.1. Enderby Island
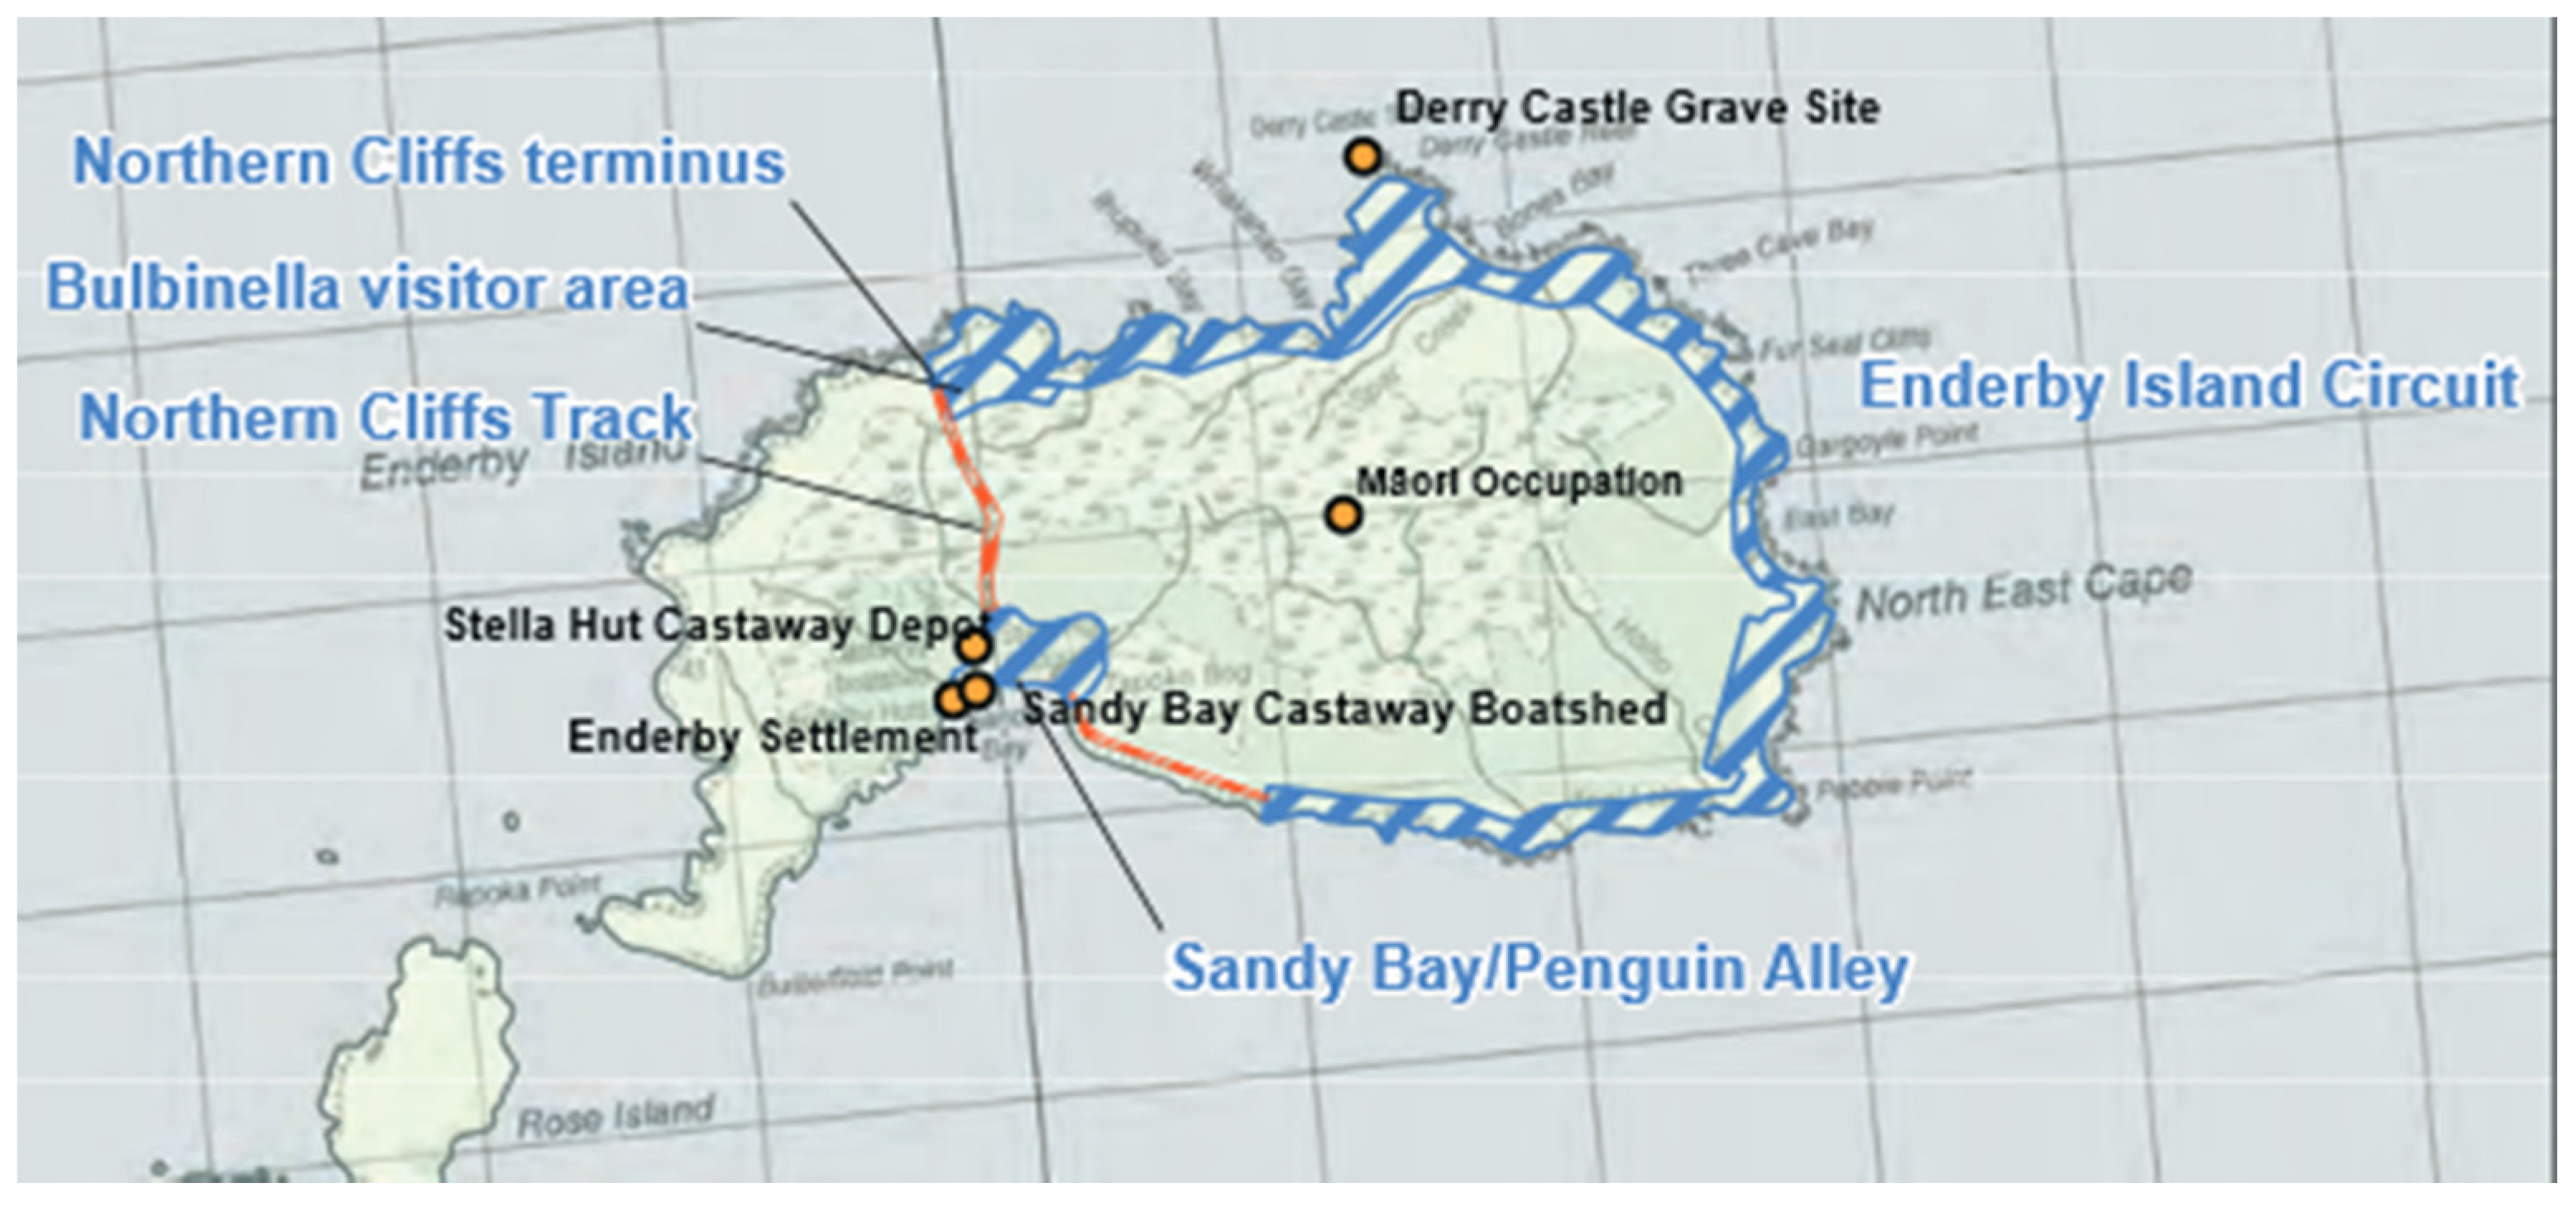
One of the most visited areas across the New Zealand Subantarctic Islands are the Northern Cliffs on Enderby Island (Figure 3), and it is here that DOC has installed boardwalks to minimize visitor impacts.
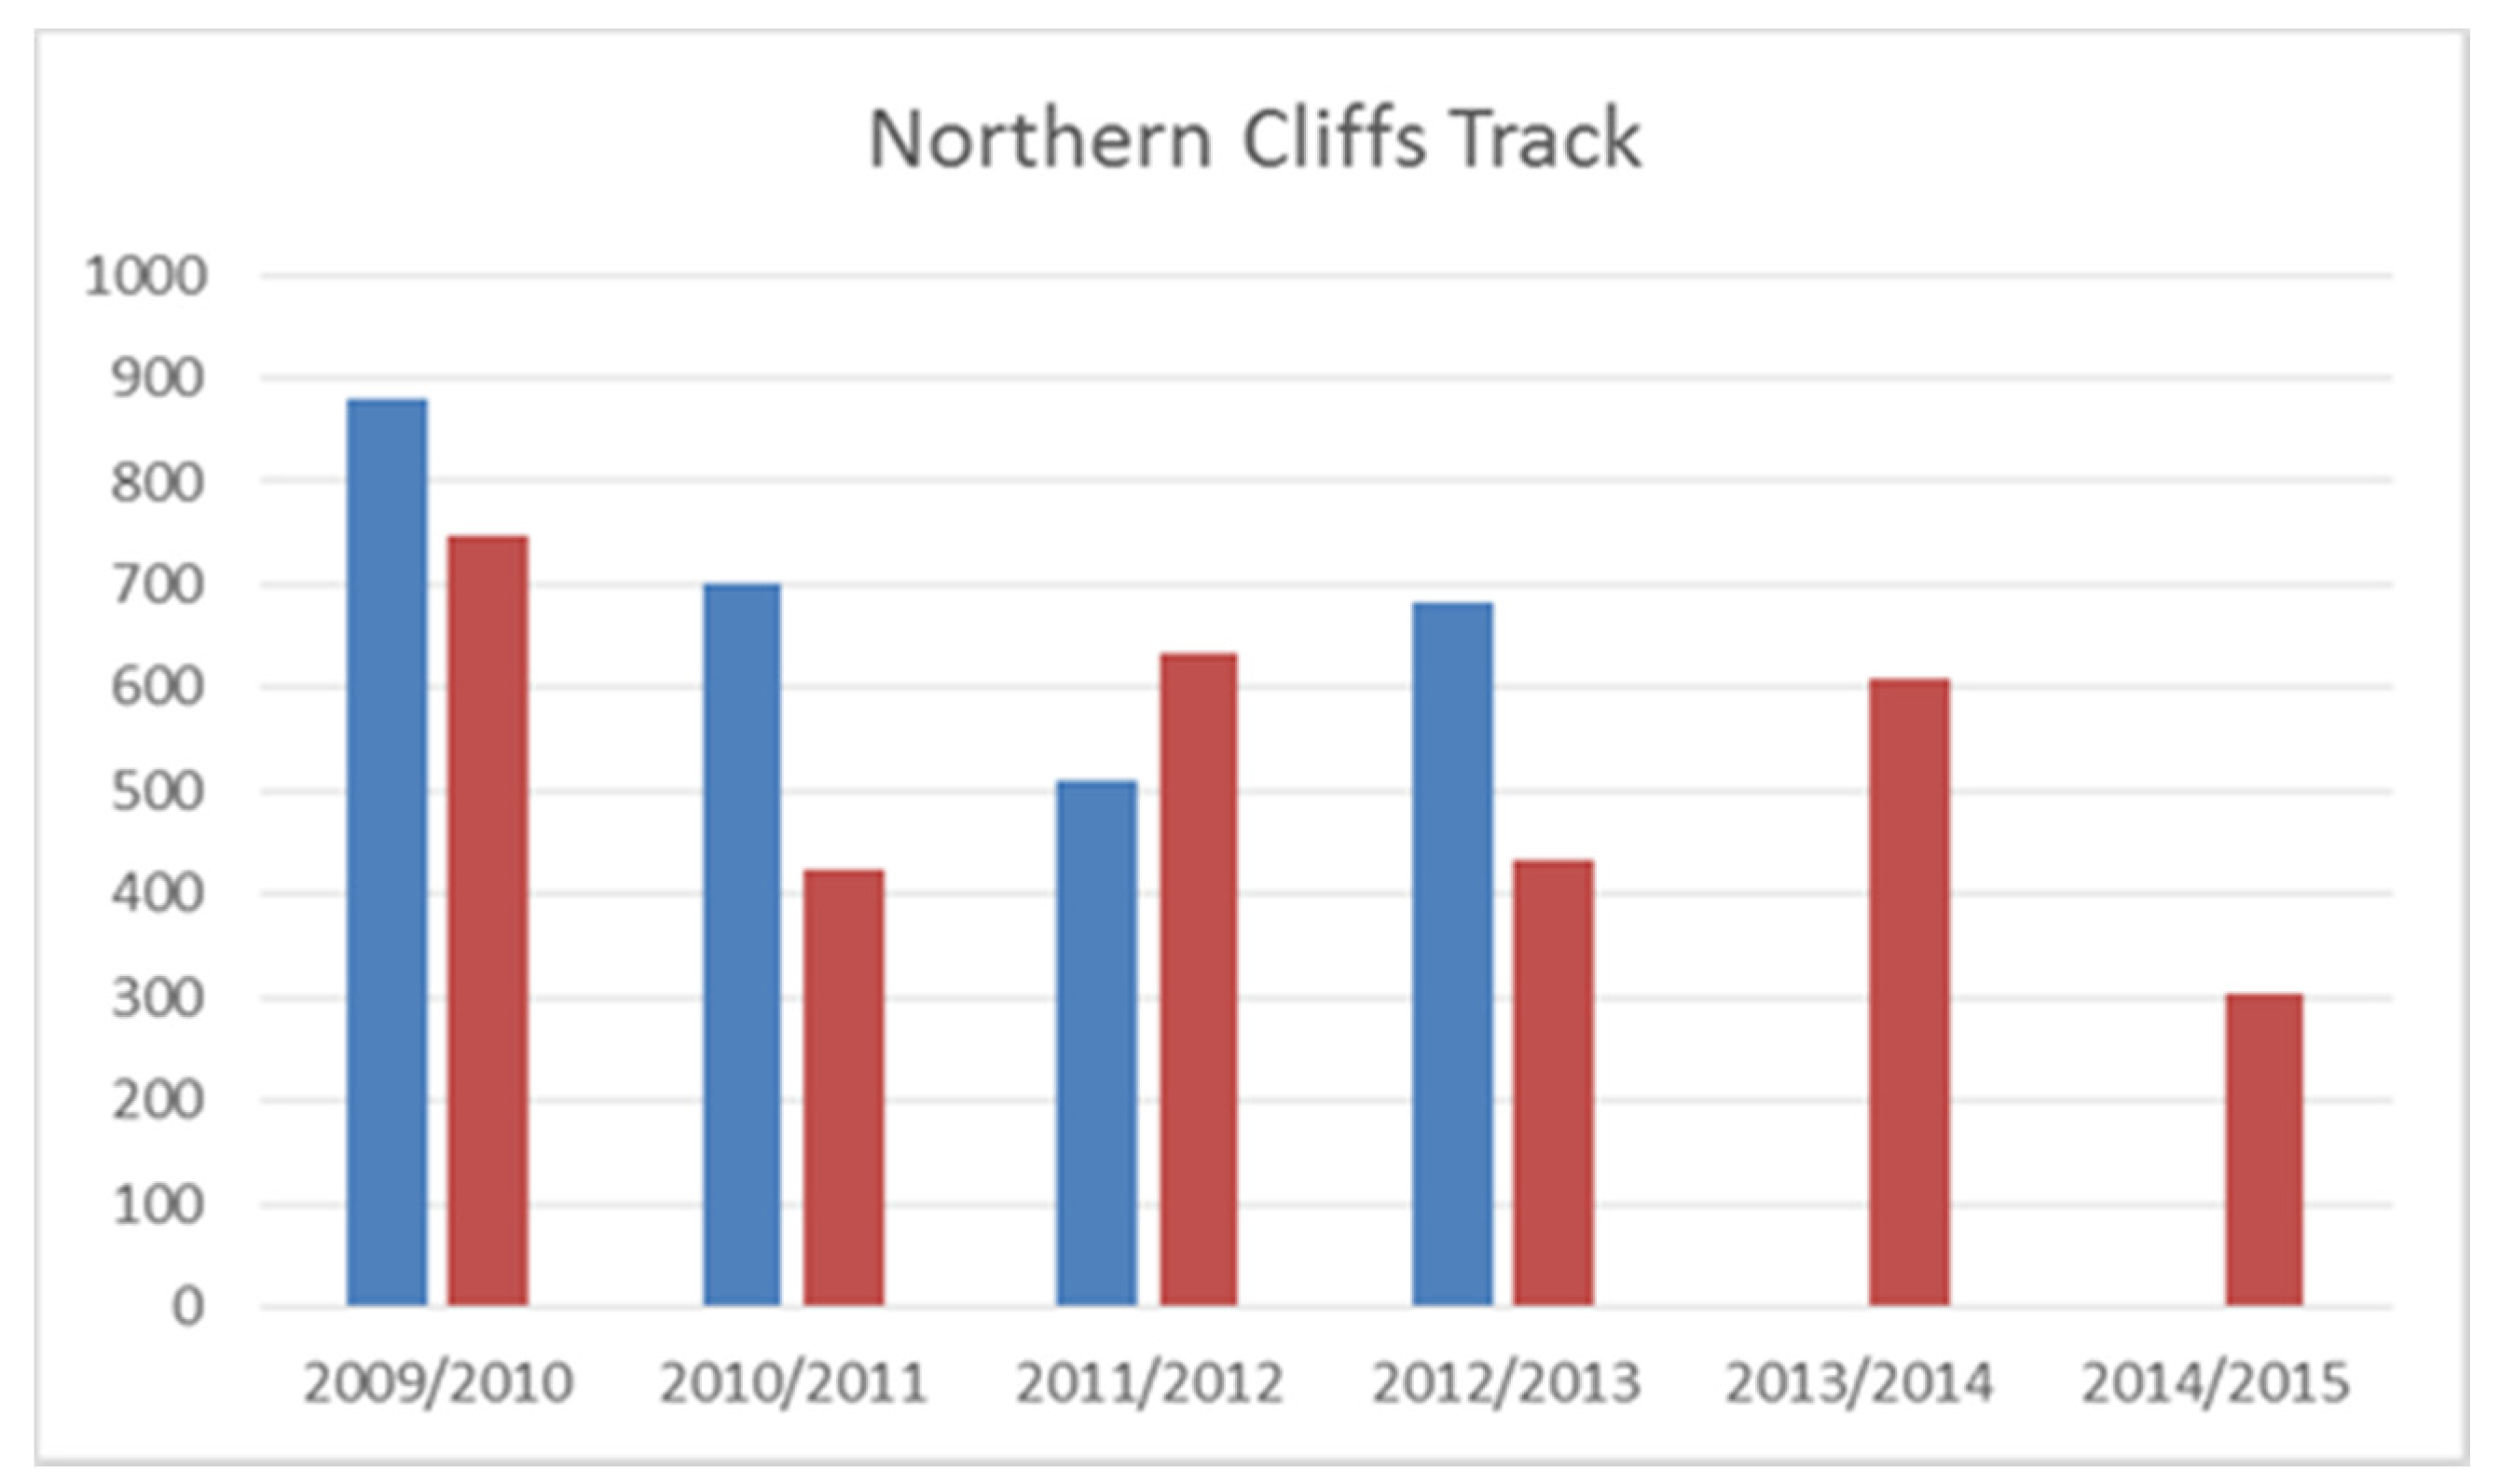
As Figure 4 reveals, annual visitation to this site has fluctuated from approximately 300 to 750 visitors. It is noted for the 2011–2012 season that the set quota was exceeded for this site, perhaps reflecting a small spike in overall visitor numbers to the Islands (see Figure 2). The current Conservation Management Strategy allows for 200 visitors per day at Sandy Bay/Penguin Alley, Northern Cliffs Track and the Northern Cliffs terminus (Figure 3) and 1100 visitors annually [10]. Based on the historic data (presented in Figure 4), this new guideline more than accommodates existing demand, potentially inviting an increase in visitation to this site in the future.
3.4.2. Auckland Islands
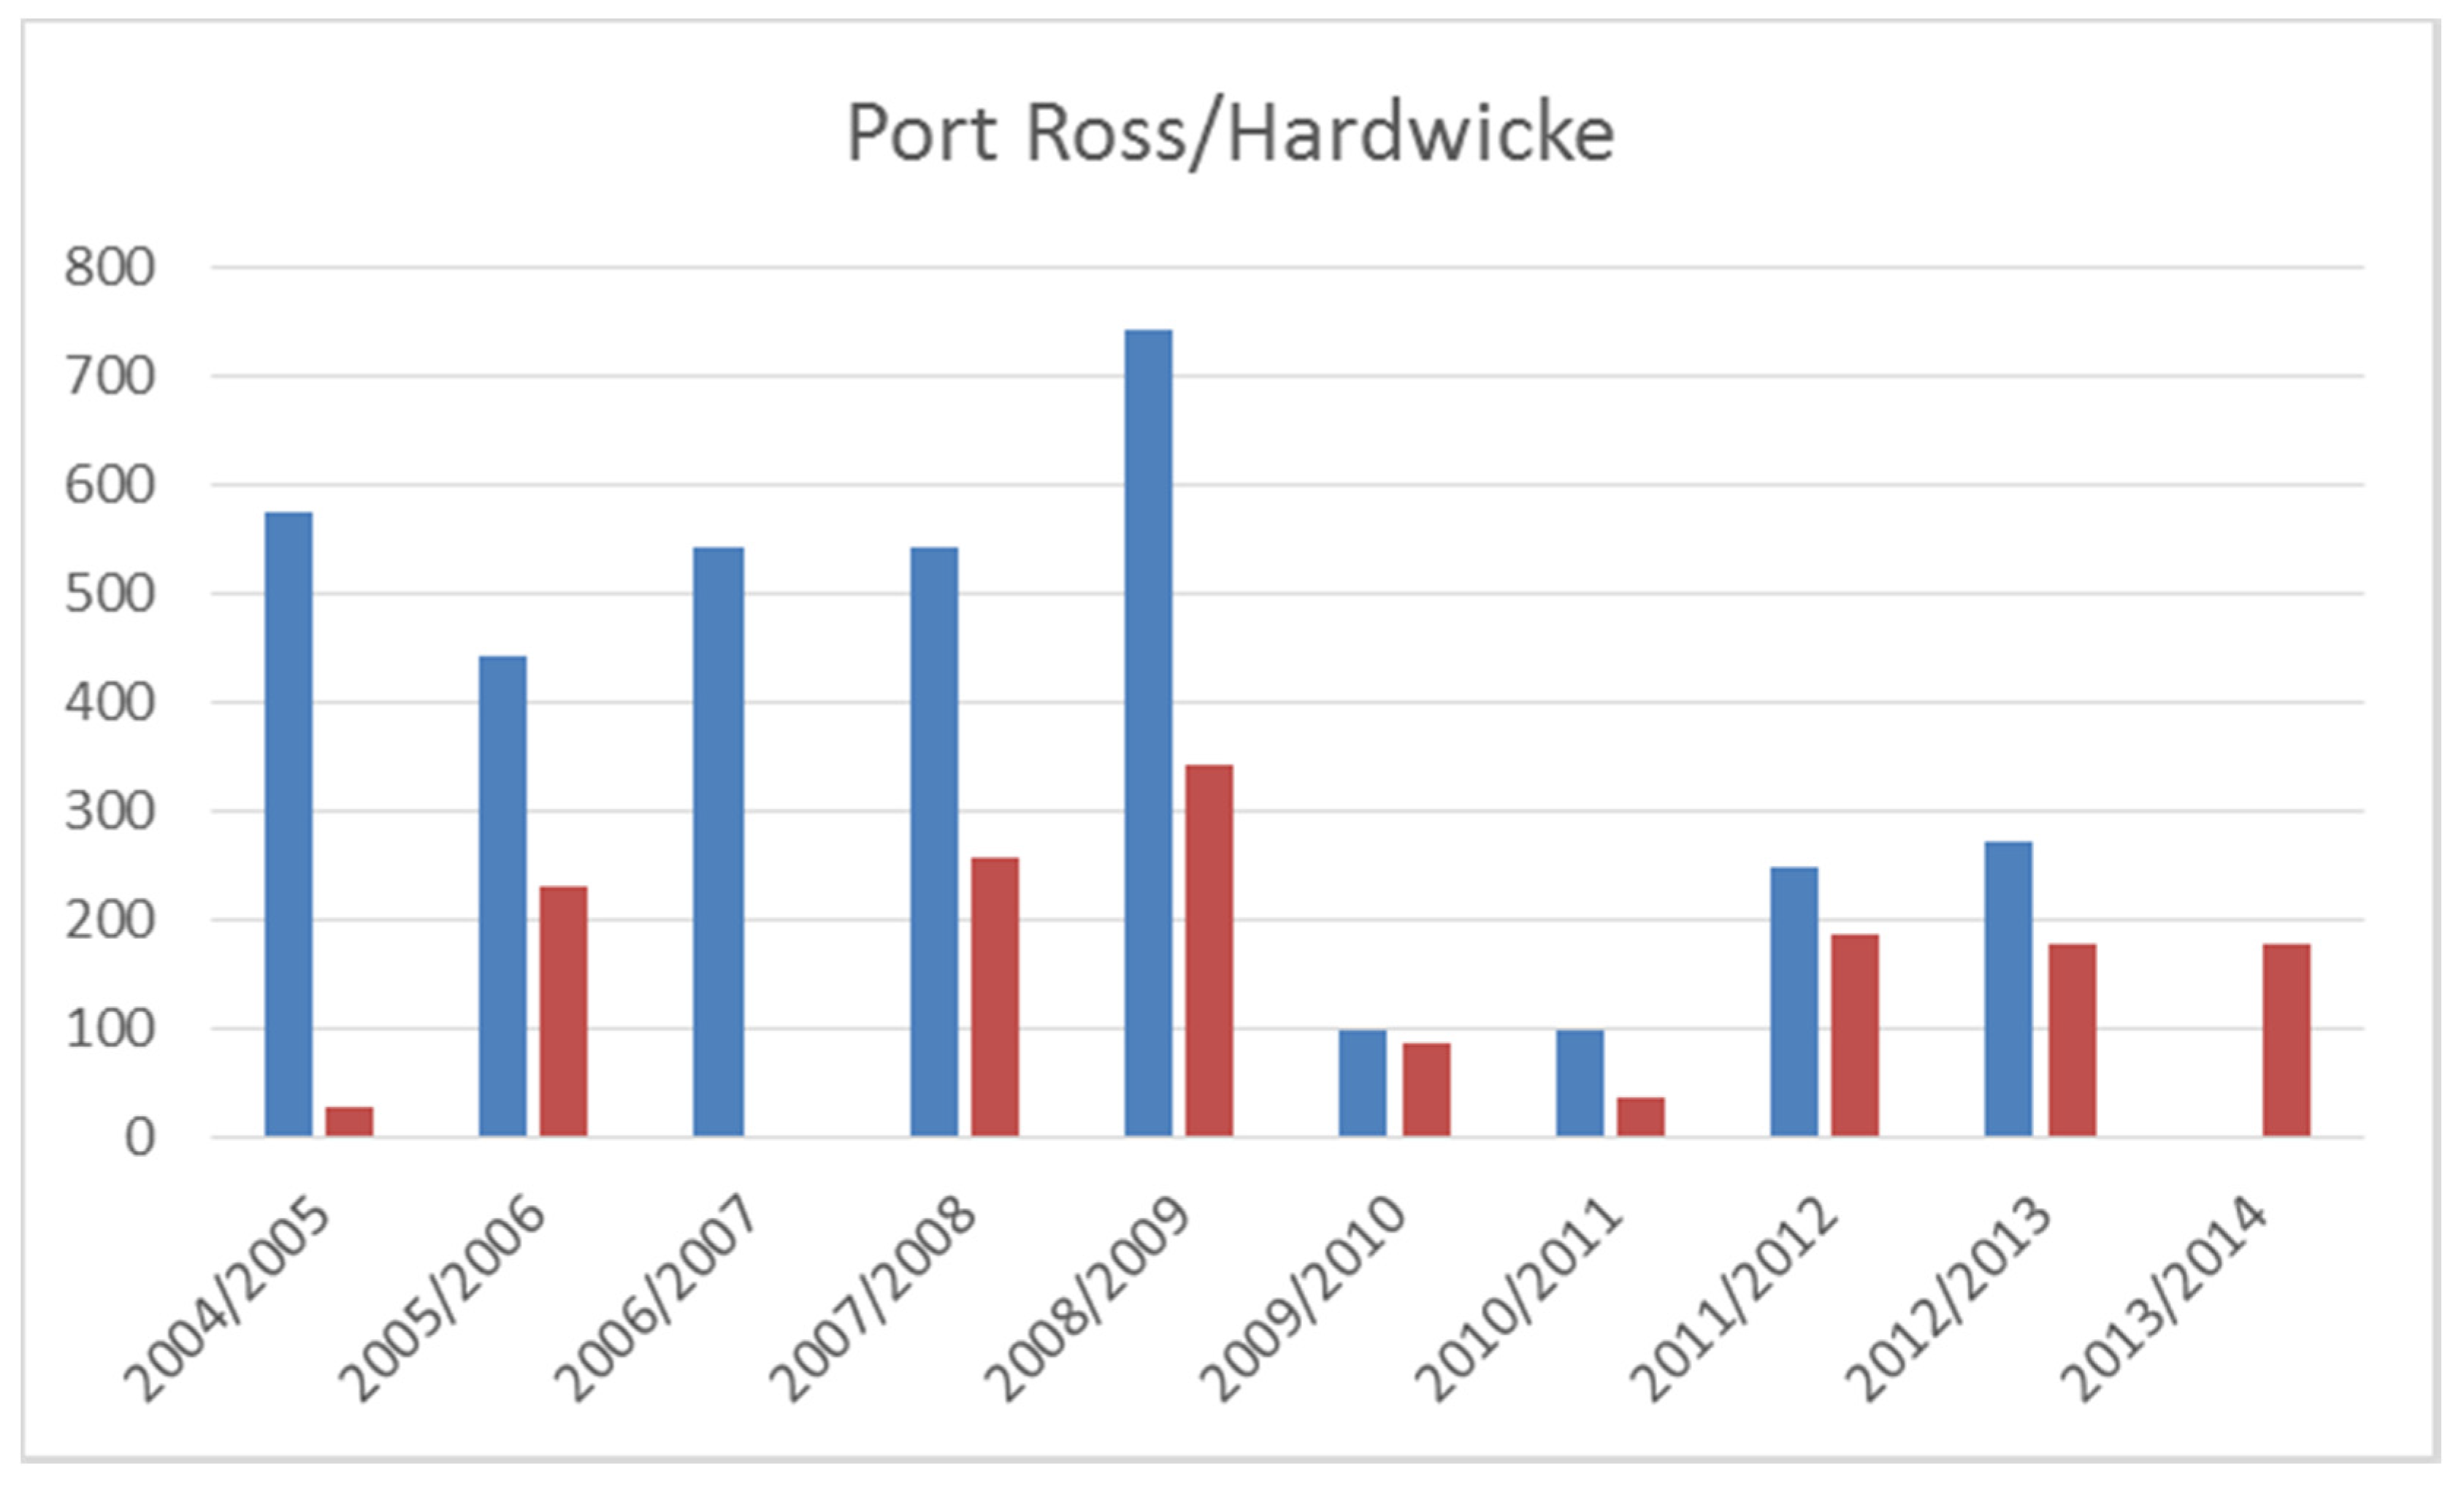
In the most recent Conservation Management Strategy (2016) there are nine visitor areas/tracks identified on the Auckland Island, the most among the three visitor-accessible islands. Hardwicke and the Terror Cove visitor area are the most visited sites in the Auckland Islands (Figure 5).
The historic visitor data presented in Figure 6 indicates that visitation has not exceeded the stated quota at the Hardwicke visitor site. The most recent guideline allows for 400 visitors per year (with up to 200 per day).
3.4.3. Campbell Island
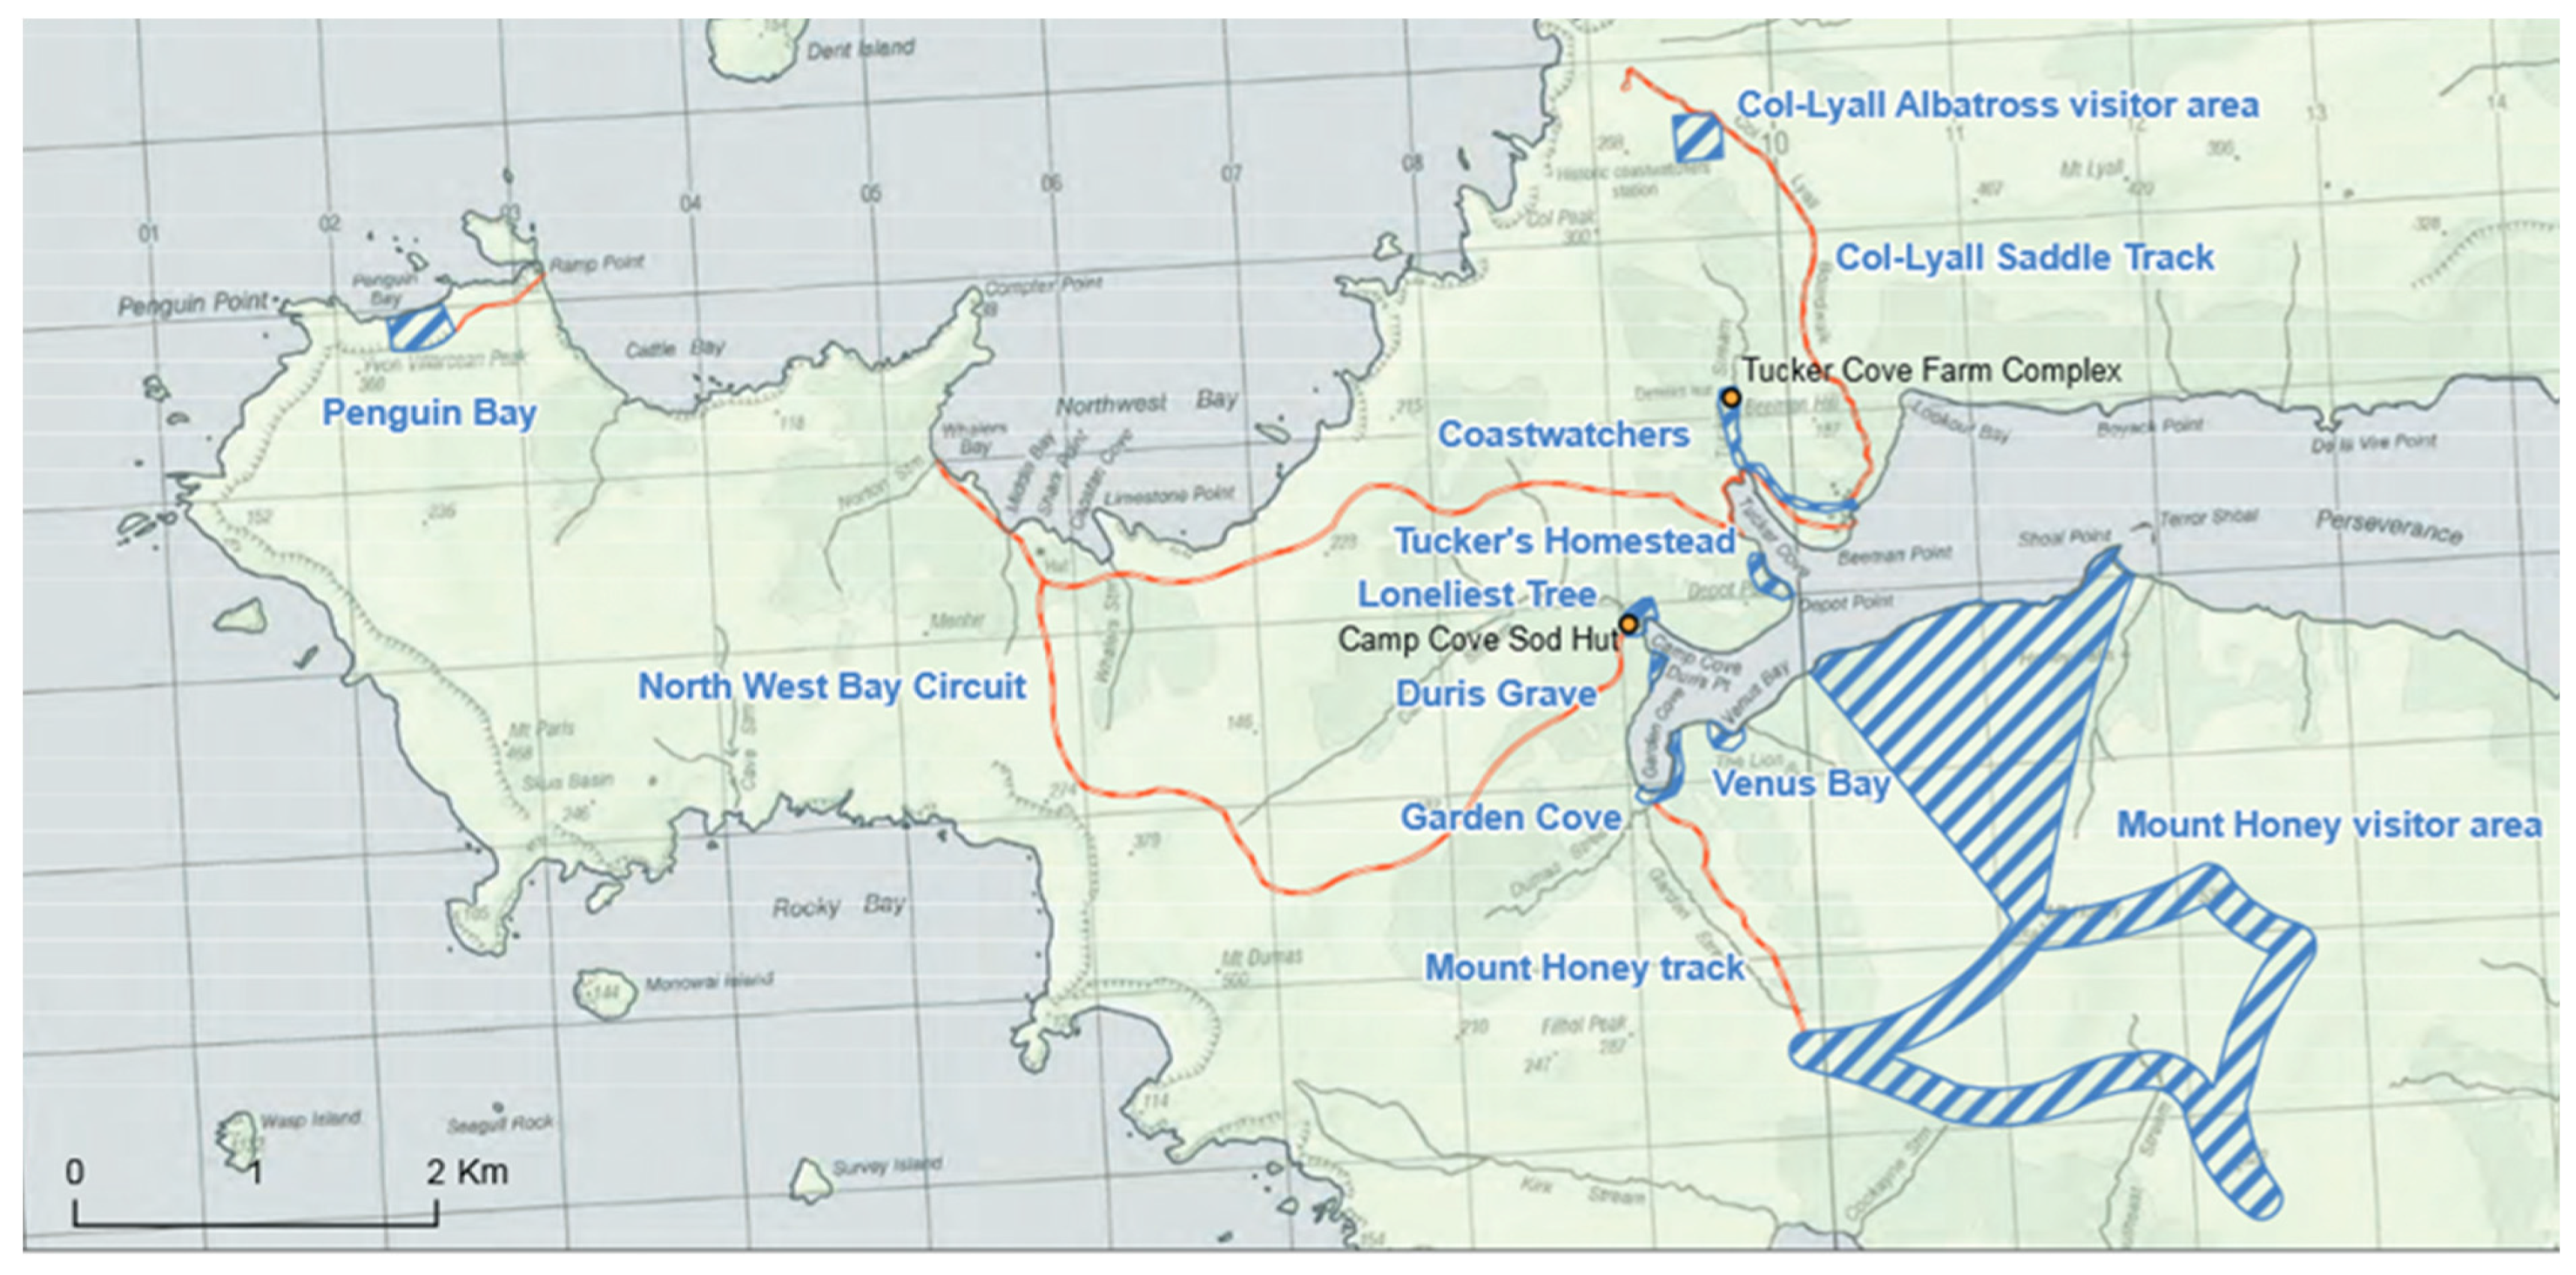
The other most visited site within the Islands is Col-Lyall on Campbell Island (Figure 7).
As Figure 8 indicates, annual visitation to this site has fluctuated from approximately 250 to 750 visitors since the mid-2000s. In line with the new guidelines set for the Northern Cliffs on Enderby Island, this site on Campbell Island can now allow for 1100 visitors annually and up to 200 daily [10].
3.5. Quotas and Permits
The choice of areas visited during an expedition are at the discretion of the tour operator and are often tailored to suit the itinerary, e.g., bird watching vs. marine mammal viewing, and are determined by the length of the trip. Consistently popular sites include Enderby Island, Tagua Coastwatcher’s base, and the Col-Lyall saddle boardwalk. All of the other sites show sporadic visitation over the last ten years. Despite their allocated quotas, these less-visited sites often receive only half of their allocated quota—generally because these sites are not easily accommodated in the itinerary implemented by the expedition, and due to the significant influence of the weather and ocean conditions in determining which landing sites can be used, as well as the length of time spent ashore. When asked about the factors that influence visitation, a tour operator stated that:
“The weather is the largest contributing factor. At times there is a 50% chance of bad weather, dramatically impacting visitation. If it was a flat run to the subs, which could be done in pleasure boats, there would be a lot more people going there”.
Simply knowing what permits are used does not necessarily imply knowledge of actual visitation, as “a ship may have a permit for 100 people to do the walk, but due to weather or track conditions, only 4 people will do the walk. Gaining a permit does not reflect actual landings of people on the Island. Of the 350 passengers to go in one year, if 140 do the full walk on Enderby Island, and 210 just do the boardwalk, the resulting impact would be different, so too would be the time spent on the Island. If the weather is bad, trips will be quick, with minimal participation” (Tour operator).
When examining the quota and permit data, it is clear that site quota numbers have changed from year to year for many sites. While the reason for this remains unknown (this appears to have been remedied in the recent Conservation Management Strategy), it is imperative that for these quotas to be effective at minimizing the impacts associated with visitation, they must be informed by some form of monitoring to build the evidence base for establishing a threshold. One tour operator indicated that, over the last four years, they have had an average of seven vessel visits to the Subantarctic Islands per year plus two Antarctic itineraries which included visits to the Subantarctic Islands, with a capacity of 50 people per trip. These visits would likely be spread throughout the season, bringing an estimated 350 people to the Islands. Alternatively, it is possible for one larger cruise ship with a capacity of 200 passengers to make two trips, bringing 400 people to these islands in a relatively short space of time. Not only would these larger cruises bring more people, and hence more noise, to the Islands at any one time, but temporally proximate visits of large groups would also reduce the amount of time the environment has to recover from any resulting impact on vegetation and wildlife.
3.6. Tourism Impacts
Internationally, obtaining and managing visitor data is an essential component of protected area management. Common data obtained includes information on visitor numbers, behaviour and attitudes [18]. This data can provide comparative information on the use of resources by visitors and help managers prioritize investment decisions. Quotas and permits are the current method used by the Department of Conservation for the management of visitors to the New Zealand Subantarctic Islands [4]. Due to the Islands’ protected status and their associated values, any access to the Islands requires permits. This includes those accessing the Islands to maintain the facilities of the Meteorological Service of New Zealand and researchers and other visitors travelling to the Islands. The intent in utilizing such a rigorous permitting process stems from a precautionary approach, aiming to avoid potential adverse effects of research and visitor access by limiting the number of visitors per site [4].
While permits help monitor visitor use, and quotas enforce restrictions on visitor numbers per site to help minimize impacts associated with their visitation, these specific impacts can only be measured if sufficient information on the original status of the landscapes and their flora and fauna is available, against which observed changes can be assessed. The latter also implies that regular vegetation and wildlife surveys are undertaken to notice and record any changes. The data collected through regular monitoring should include physical and biological data, but should also extend to the cultural values of a site and information about social and land-use history, visitor use, non-recreational uses, socio-economic costs and benefits, and infrastructure and facilities [18]. While it may be challenging to obtain data on all of the above for all sites, a robust set of accurate and comprehensive site-specific baseline information is crucial when attempting to identify what may be the cause of any changes in an environment.
It is well documented that visits to pristine natural environments will create some impact [19,20] but it is possible to minimize many of these impacts through effective management. To be managed effectively, these impacts must first be identified, measured, and evaluated [21]. Table 2 gives an overview of potential impacts, their possible causes, and options for management wishing to mitigate or minimize these impacts.
These impacts associated with island visitation are compounded by the relatively small size of each island and their unique evolutionary development [16]. Their relative isolation from population centres, unique climatic and physical conditions, and distinctive biodiversity found there are the Islands’ greatest conservation assets, but their fragility means minute changes brought about through human impacts may have major long-term impacts on ecosystem stability [5]. The reason for this is that “the specialization of island biota makes them more vulnerable to external disturbance and environmental change, particularly human-induced impacts, and the extinction of species is particularly common on islands when new competitors or physical conditions are introduced” ([5], p. 359). Table 3 shows how impacts associated with human visitation have already been addressed by DOC.
It is because these islands are so vulnerable to potential biophysical impacts associated with visitation that they must be managed with extreme care, not only for the sake of their endemic flora and fauna, but also because nature-based tourism in island settings relies on ecologically intact and well-managed ecosystems [16]. Research conducted on the impacts of hiking on soils and vegetation has shown that there are a variety of factors that influence the overall resulting impact: frequency of use; type and behaviour of use; season of use; environmental conditions; and the spatial distribution of use. The primary management tools involve manipulation of these factors [22]. Generally, it has been shown that in Subantarctic environments trampling benefits introduced vascular species, such as Poa annua, and that lichens and bryophytes prefer undisturbed environments [23]. It is also known that the relationship between the amount of use and the amount of impact is curvilinear, or asymptotic, suggesting it is best to concentrate use and impact at sites which already have established visitation, and to disperse use and impact in relatively pristine places [22]. The latter has also been emphasized by Tejedo et al. [24], who have found that soils in maritime Antarctica that are subject to limited exposure from foot traffic, which they define as generally fewer than 100 passes per year, can generally recover relatively quickly, and that therefore dispersal of foot traffic on these soils is advised. Frequently visited areas with high foot traffic are not recovering quickly enough, and Tejedo et al. suggest that single-track use of these areas be the recommended modus operandi [24].
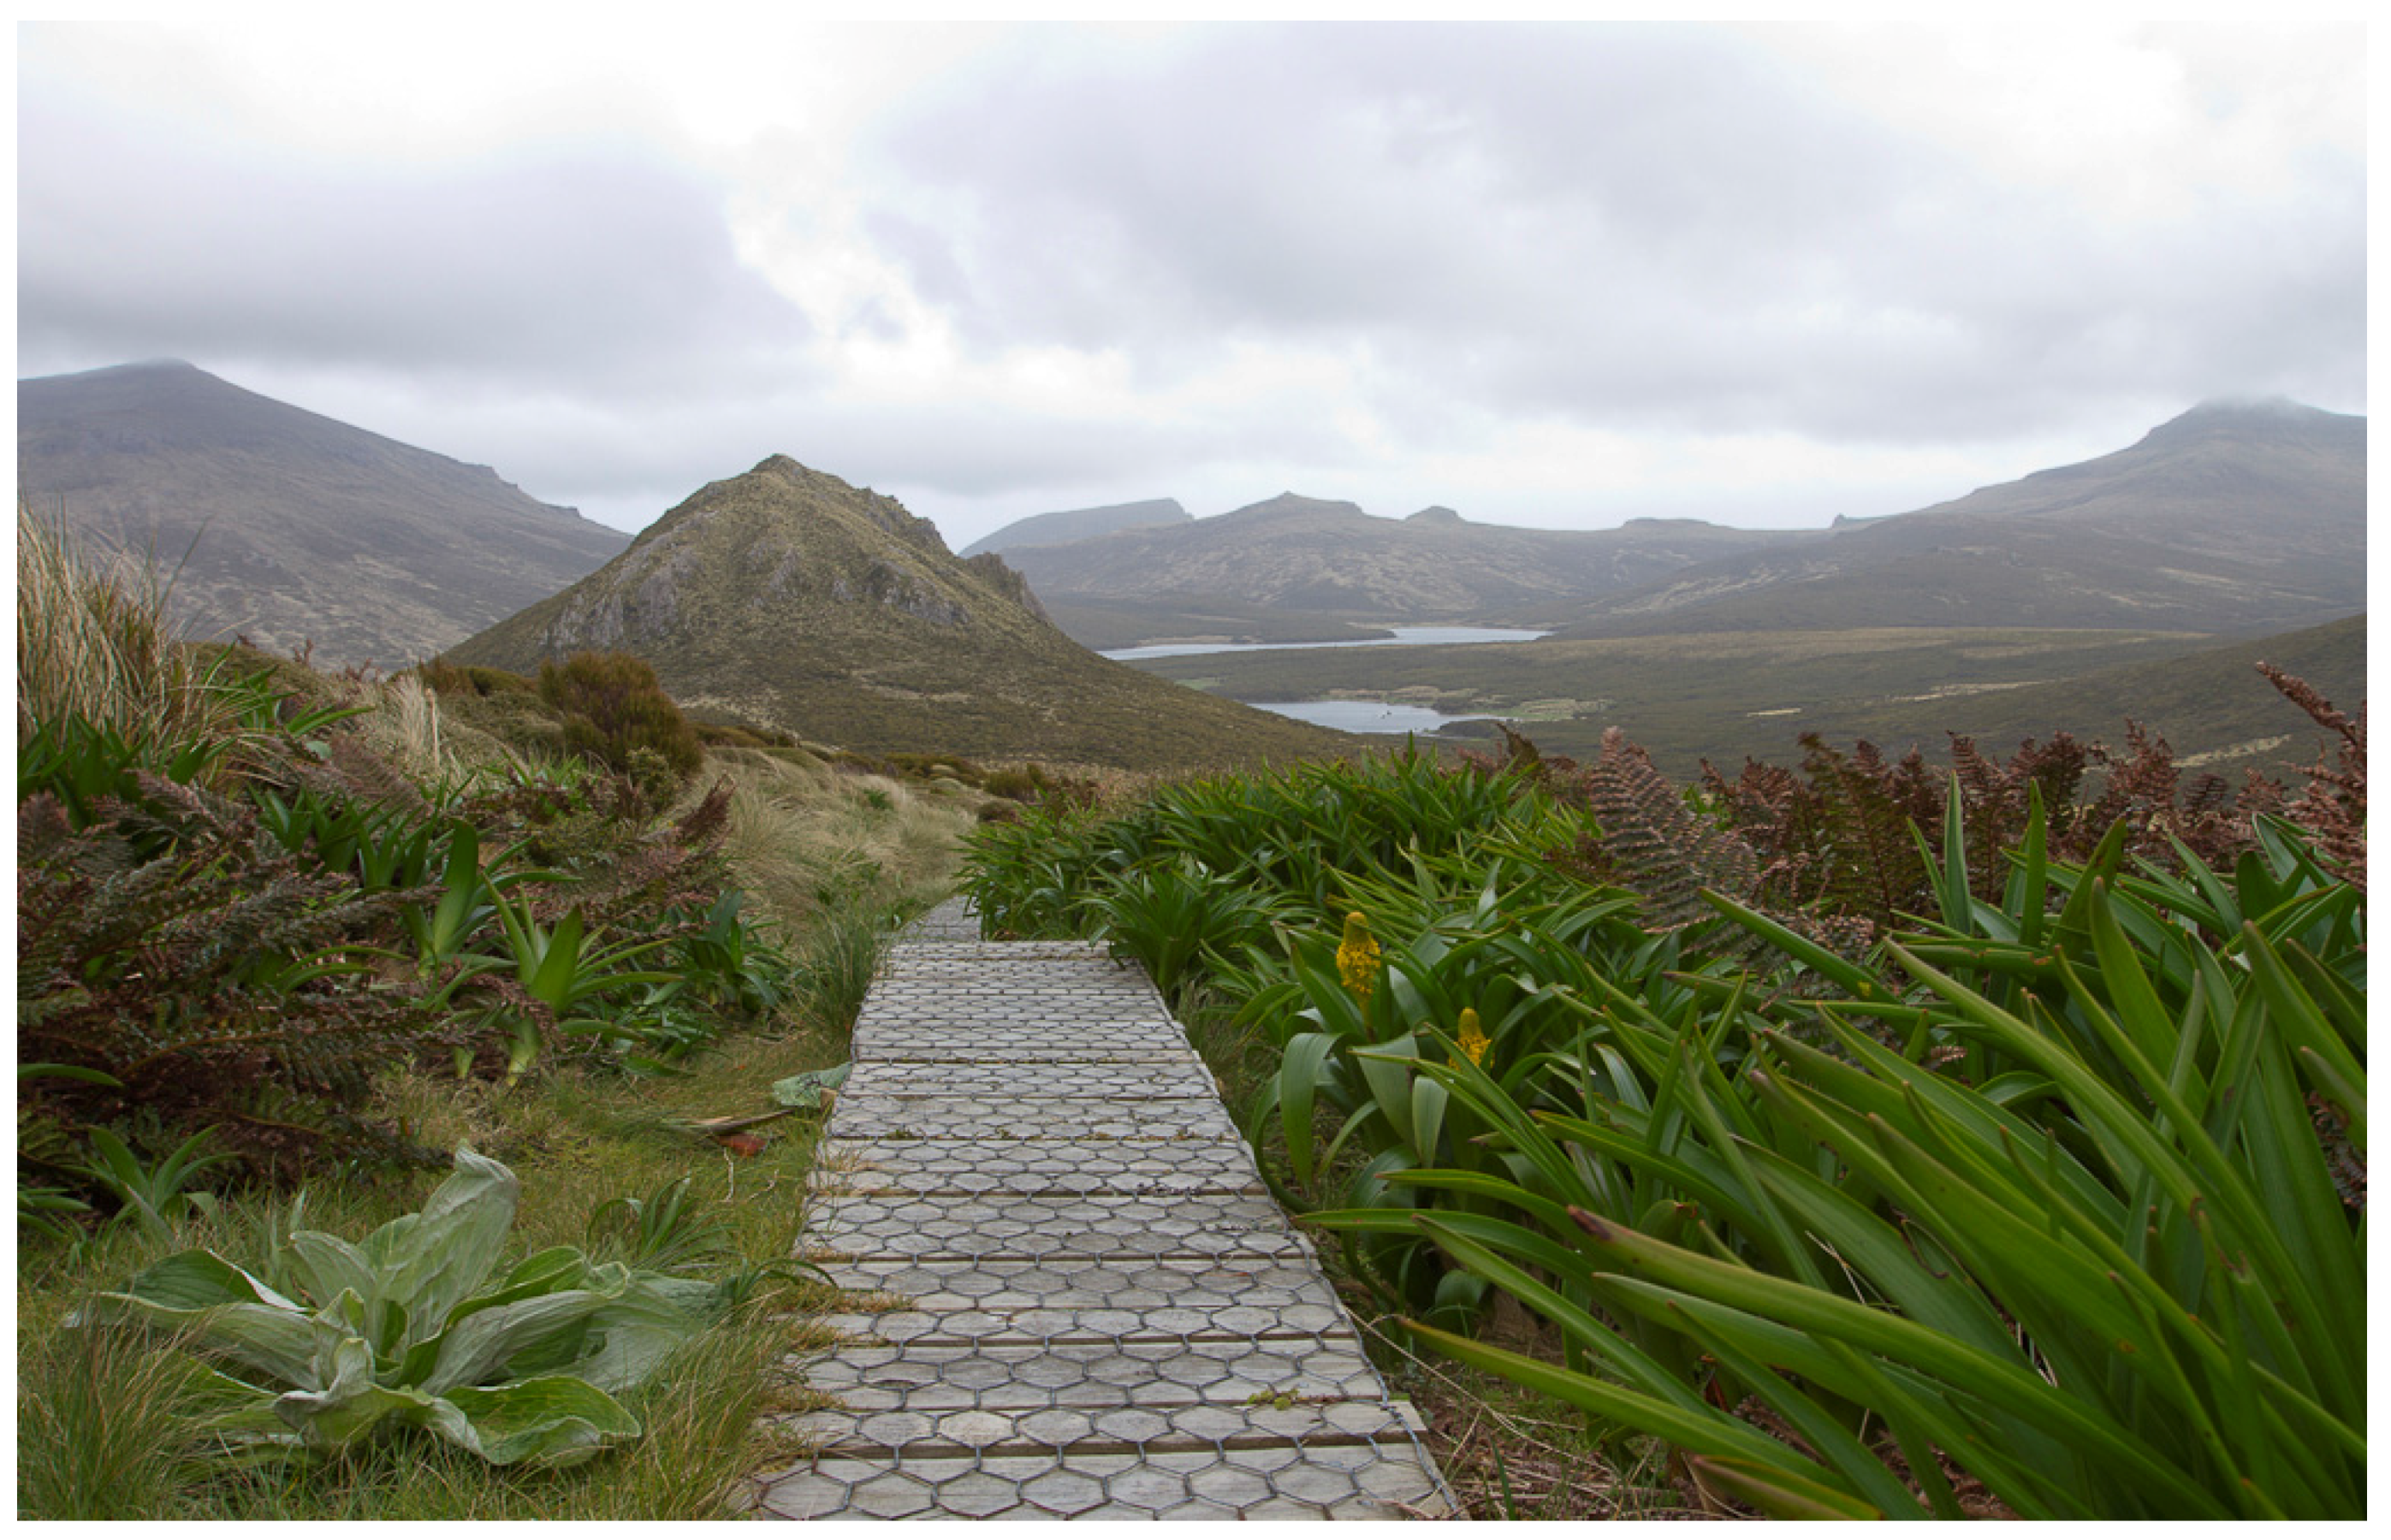
Many sites within the New Zealand Subantarctic Islands are restricted by quotas to receive between 50 and 200 visitors annually, but the two most visited sites within the New Zealand Subantarctic Islands, the Northern Cliffs on Enderby Island and the Col-Lyall Saddle on Campbell Island, are now able to receive 1100 visitors annually. This is made possible due to boardwalks being installed in an effort to minimize vegetation trampling associated with visitation (see Figure 9). While this has certainly altered the vegetation found beneath the boardwalks, it is a compromise to allow sustained visitation into the future in a way that restricts the spread of vegetation trampling and any associated erosion [19].
Alongside quotas and permits and site hardening interventions (such as boardwalks), the DOC has introduced several other means of visitor impact mitigation for these islands, such as minimum visitor-to-guide ratios, biosecurity procedures, minimal impact codes and a government observer scheme, which requires departmental representatives/observers to be present on every voyage that has people landing in the Islands [4]. The minimal impact codes are set by the DOC as a tool for managing the impacts related to visitation, but the physical effects of visitation on the environments cannot be known without sufficient and ongoing monitoring [19].
Between 2004 and 2013, DOC undertook vegetation trampling and soil erosion monitoring at a number of sites, on tracks commonly used by tourists throughout Campbell Island and Enderby Island [25]. Longitudinal photo points were used to allow comparison with previous years in a bid to illustrate any change. A desk-based analysis of this monitoring in 2013 did not show any significant observable change in physical impact at the sites monitored [25]. It was noted, however, “that as track surfaces start to deteriorate, they will continue to do so quite rapidly, as track surface and vegetation recovery is expected to be slow in the harsh Subantarctic conditions” ([25], p. 2). The first year that monitoring was conducted ‘pre-season’ in December was in 2013, and the pre-season monitoring results suggest that some track surfaces do recover over the winter [25]. Such replicable monitoring informs DOC about whether the visitor quotas set for the previous season are sufficient. Upon comparison of the recent photos, it appears that repeat visitation to the sites monitored has not caused significant observable changes in the soil and vegetation cover at the sites monitored, and where any vegetation damage has occurred, it has not occurred to an extent where that vegetation could not recover naturally [25].
The most recent Conservation Management Strategy (2016) proposes to develop and implement a visitor monitoring programme to determine the effects of visitors on the natural and cultural environment, as well as on the visitor experience itself. The DOC indicates that if the effects are more than minor (or if a site’s values are vulnerable to degradation), the number of site permits may be reduced (or a site may be closed entirely to visitors). Any concerns arising will be addressed with interested parties, including concessionaires [10]. However, it remains unclear how this proposed monitoring programme, and the proposed Visitor Management Plan, will be developed and implemented.
4. Conclusions
From their European discovery in 1788, through commercial exploitation of whales and seals during the 1800s into the early 1900s, the attempts at colonization from 1894 to 1931, to the beginnings of commercial cruises in 1967, these unique island habitats have witnessed increasing visitation from humans. While visitors’ motivations for travelling to these islands have undeniably changed over the course of their human history, the Islands continue to fascinate and intrigue anyone who is exposed to their wild, isolated, natural environments [26,27,28].
While visitor numbers are small compared to many other tourist destinations, to ensure continued protection of the natural conservation values, meaningful policy frameworks and conservation management strategies must be in place to facilitate sustainable tourist visits to these pristine environments. The DOC now implements practices learnt from previous experience and examples from overseas to help sustain functional ecosystems for the Islands’ unique biodiversity, and their notably high degree of endemism, while allowing particular islands and sites to be visited by nature-seeking tourists. Allowing tourism within these islands comes with an undeniable risk to the environments found there, but with effective communication, a robust programme of visitor research (including a site-specific assessment of visitor impacts; as well as impacts associated with cruise travel to the Islands themselves), education, legislation and supervision, these risks may be mitigated, eliminated, or at least minimized, ensuring managers meet conservation goals while providing appropriate opportunities for the public to appreciate these once ‘forgotten islands’ and the wonders found there.
Acknowledgments
The research was funded via the Royal Society of New Zealand for a summer scholarship project examining visitor impacts on the New Zealand Subantarctic Islands. The authors acknowledge the Department of Conservation for support and especially the guidance and encouragement from the staff at the Southland Conservancy. Staff at Heritage Expeditions New Zealand Ltd. are also thanked for their kind assistance.
Author Contributions
Emma J. Stewart, Stephen Espiner and Daniela Liggett conceived, designed and supervised the summer scholarship project. Zac Taylor analyzed the data and drafted the initial report in conjunction with his supervisors. Emma J. Stewart, Stephen Espiner and Daniela Liggett wrote the paper in conjunction with Zac Taylor.
Conflicts of Interest
The authors declare no conflict of interest.
References and Notes
- Hall, C.M.; Johnston, M. Polar Tourism: Tourism in the Arctic and Antarctic Regions; John Wiley & Sons: London, UK, 1995. [Google Scholar]
- Department of Conservation. Subantarctic Islands Research Strategy: Background; Department of Conservation: Wellington, New Zealand, 2005.
- Department of Conservation. New Zealand’s Subantarctic Islands; Reed Books: Auckland, New Zealand, 1999.
- Department of Conservation. Southland Murihiku Conservation Management Strategy 2015–2025; Department of Conservation: Wellington, New Zealand, 2014.
- Hall, M.; Wouters, M. Managing Nature Tourism in the Sub-Antarctic. Ann. Tour. Res. 1994, 212, 355–374. [Google Scholar] [CrossRef]
- Peat, N. Subantarctic New Zealand: A Rare Heritage; Southland Conservancy, Department of Conservation: Invercargill, New Zealand, 2006.
- Cessford, G.R.; Dingwall, P.R. Tourist Visitors and Their Experiences at New Zealand Subantarctic Islands; Science & Research Series 96; Department of Conservation: Wellington, New Zealand, 1996; pp. 1–66.
- Department of Conservation supplementary data.
- International Association of Antarctica Tour Operators. IAATO overview of Antarctic tourism: 2008–2009 Antarctic season and preliminary estimates for 2009–2010 Antarctic season, IP 85, XXXII. In Proceedings of the Antarctic Treaty Consultative Meeting, Baltimore, MD, USA, 6–17 April 2009. [Google Scholar]
- Department of Conservation. Conservation Management Strategy: Southland Murihiku, Volume 1; Department of Conservation: Wellington, New Zealand, 2016.
- Hughes, K.A.; Convey, P. Determining the native/non-native status of newly discovered terrestrial and freshwater species in Antarctica—Current knowledge, methodology and management action. J. Environ. Manag. 2012, 93, 52–66. [Google Scholar] [CrossRef] [PubMed]
- Tsujimoto, M.; Imura, S. Does a new transportation system increase the risk of importing non-native species to Antarctica? Antarct. Sci. 2012, 24, 441–449. [Google Scholar] [CrossRef]
- Whinam, J.; Chilcott, N.; Bergstrom, D.M. Subantarctic hitchhikers: Expeditioners as vectors for the introduction of alien organisms. Biol. Conserv. 2005, 121, 207–219. [Google Scholar] [CrossRef]
- Department of Conservation. Subantarctic Islands Heritage: Nomination of the New Zealand Subantarctic Islands by the Government of New Zealand for Inclusion in the World Heritage List; DOC: Wellington, New Zealand, 1997.
- Headland, R.K. Historical development of Antarctic tourism. Ann. Tour. Res. 1994, 21, 269–280. [Google Scholar] [CrossRef]
- Newsome, D.; Moore, S.A.; Dowling, R.K. Natural Area Tourism: Ecology, Impacts and Management; Channel View Publications: Bristol, UK, 2013. [Google Scholar]
- Department of Conservation. New Zealand’s Subantarctic Islands: Tourism Policy; Department of Conservation: Wellington, New Zealand, 2013.
- Chape, S.; Spalding, M.; Jenkins, M. The World’s Protected Areas: Status, Values and Prospects in the 21st Century; University of California Press: Berkeley, CA, USA, 2008. [Google Scholar]
- Cessford, G.R.; Dingwall, P.R. An Approach to Assessing the Environmental Impacts of Tourism; Conservation Advisory Science Notes No. 247; Department of Conservation: Wellington, New Zealand, 1999.
- Higgenbottom, K.; Green, R.; Northrope, C. A Framework for Managing the Negative Impacts of Wildlife Tourism on Wildlife. Hum. Dimens. Wildl. 2003, 8, 1–24. [Google Scholar] [CrossRef]
- Wearing, S.; Neil, J. Ecotourism: Impacts, Potentials and Possibilities; Elsevier: Oxford, UK, 2009. [Google Scholar]
- Cole, D.N. Impacts of hiking and camping on soils and vegetation: A review. Environ. Impacts Ecotour. 2004, 41, 60. [Google Scholar]
- Scott, J.J.; Kirkpatrick, J.B. Effects of human trampling on the Subantarctic vegetation of Macquarie Island. Polar Rec. 1994, 30, 207–220. [Google Scholar] [CrossRef]
- Tejedo, P.; Pertierra, L.R.; Benayas, J.; Convey, P.; Justel, A.; Quesada, A. Trampling on maritime Antarctica: Can soil ecosystems be effectively protected through existing codes of conduct? Polar Res. 2012, 31, 10888. [Google Scholar] [CrossRef] [Green Version]
- Visser, C. Subantarctic Visitor Impact Monitoring Results 2013; Department of Conservation: Wellington, New Zealand, 2013; pp. 1–53.
- Sanson, L. An Ecotourism Case Study in Subantarctic Islands. Ann. Tour. Res. 1994, 21, 244–254. [Google Scholar] [CrossRef]
- Cessford, G.R.; Dingwall, P.R. Tourism on New Zealand’s Subantarctic Islands. Ann. Tour. Res. 1996, 21, 318–332. [Google Scholar] [CrossRef]
- Orams, M. Experiences of adolescents on an expedition to New Zealand’s sub-Antarctic: Results from the use of photo-elicitation. Polar J. 2015, 5, 446–465. [Google Scholar] [CrossRef]
Figure 1.
Location of the New Zealand Subantarctic Islands [2].
Figure 1.
Location of the New Zealand Subantarctic Islands [2].
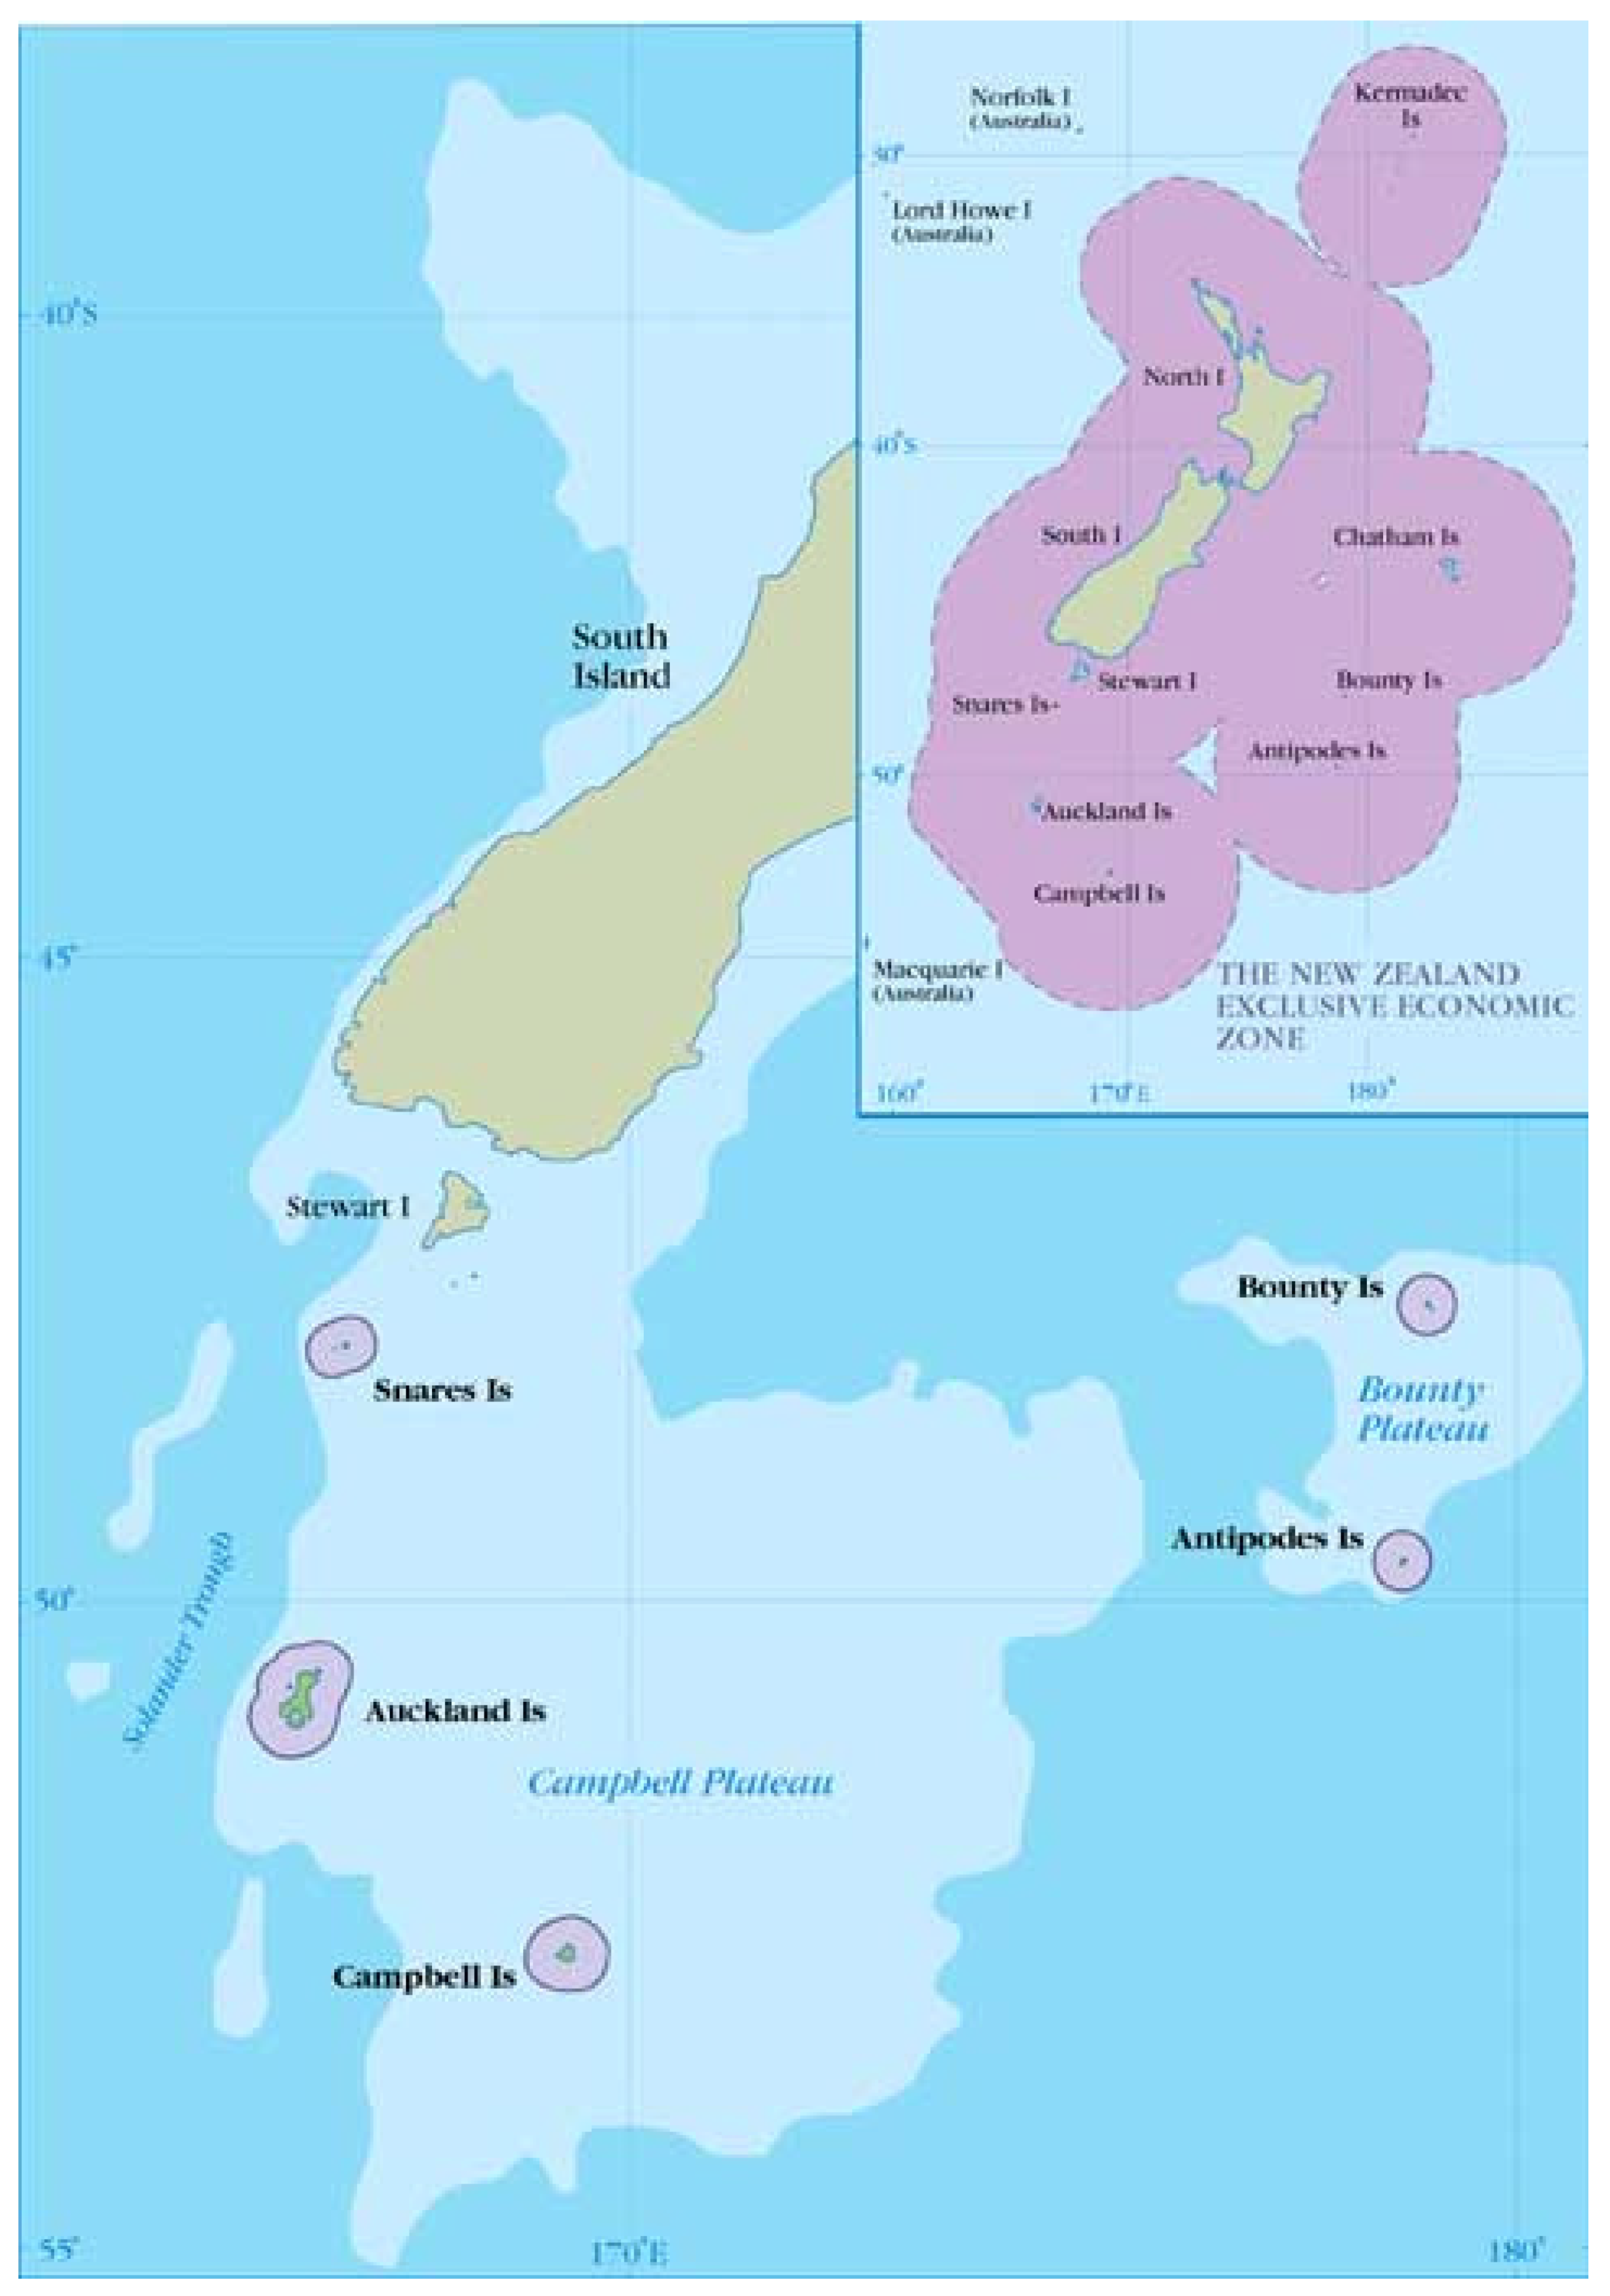
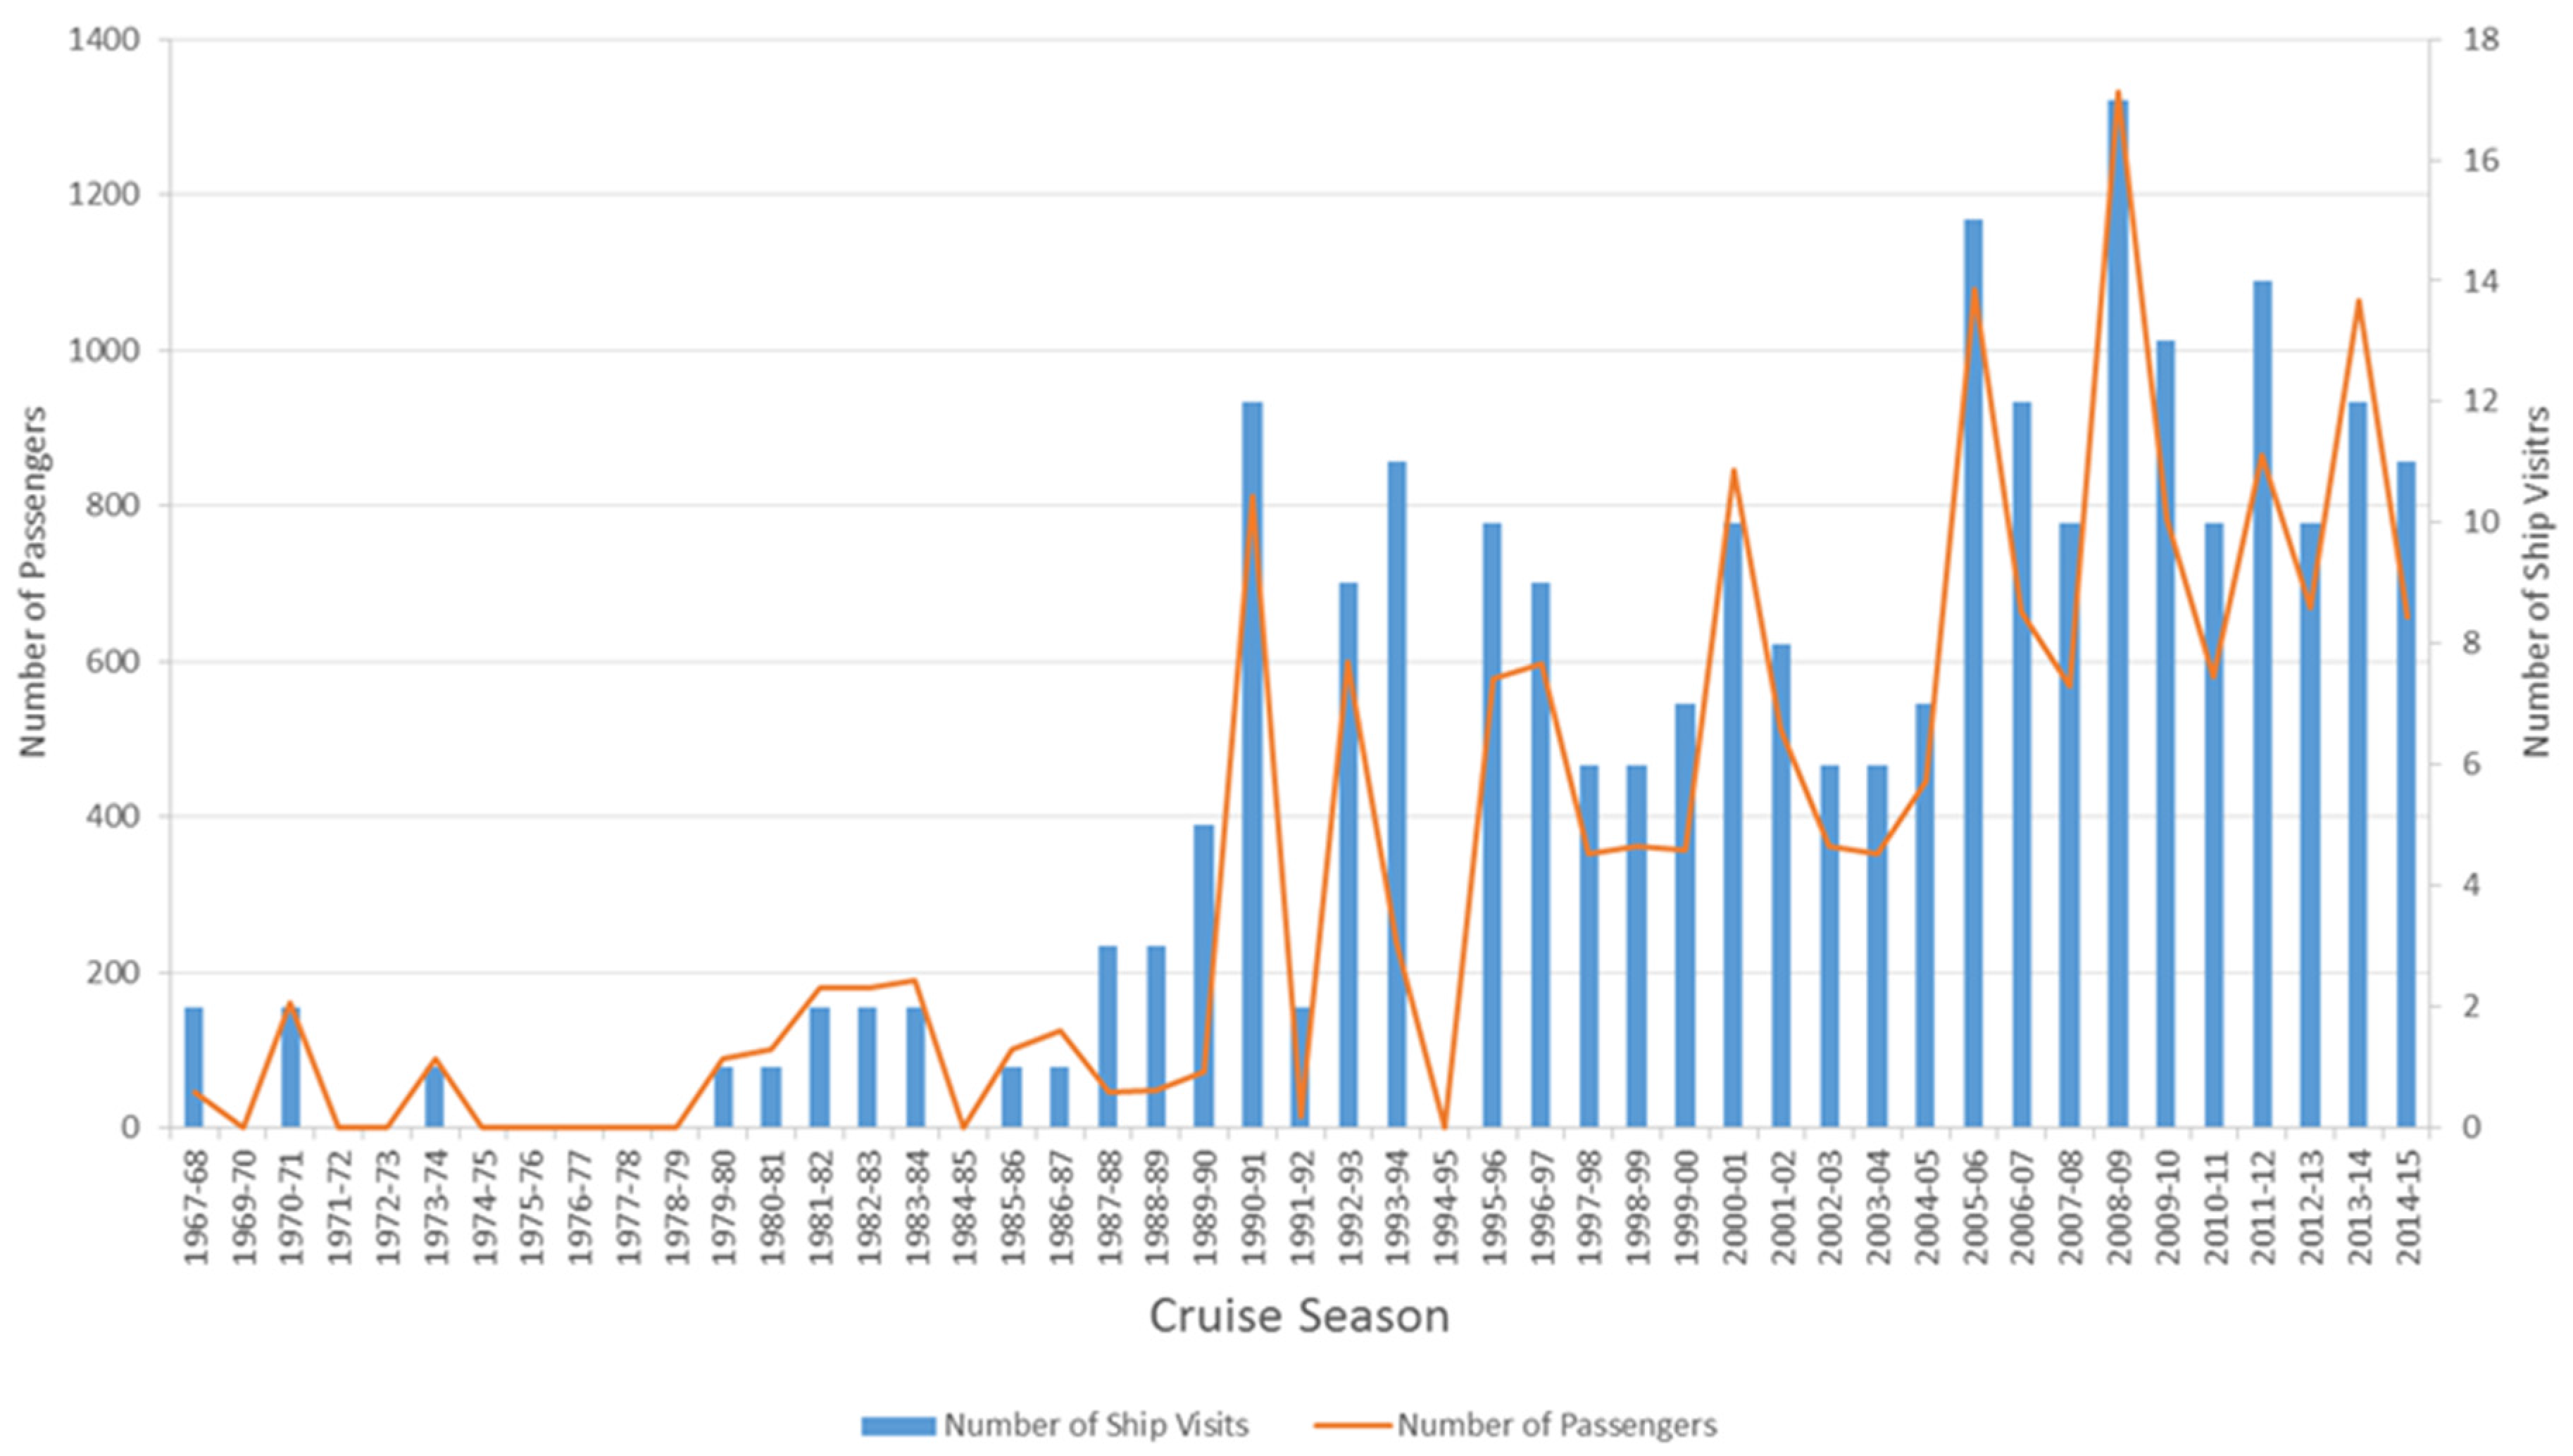
Figure 3.
Enderby Island visitor areas, located north of Auckland Island. Blue shows visitor areas and red marks visitor tracks (Image retrieved from [17]) (p. 28).
Figure 3.
Enderby Island visitor areas, located north of Auckland Island. Blue shows visitor areas and red marks visitor tracks (Image retrieved from [17]) (p. 28).

Figure 4.
Northern Cliffs track quotas (missing data for 2013–2015) and used permits between years 2009 and 2015 [8]. (The set quota is in blue and the activated permits are in red).
Figure 4.
Northern Cliffs track quotas (missing data for 2013–2015) and used permits between years 2009 and 2015 [8]. (The set quota is in blue and the activated permits are in red).

Figure 5.
Port Ross visitor areas, located at the northern tip of Auckland Island. Blue shows visitor areas and red marks visitor tracks (Image retrieved from [17]) (p. 28).
Figure 5.
Port Ross visitor areas, located at the northern tip of Auckland Island. Blue shows visitor areas and red marks visitor tracks (Image retrieved from [17]) (p. 28).
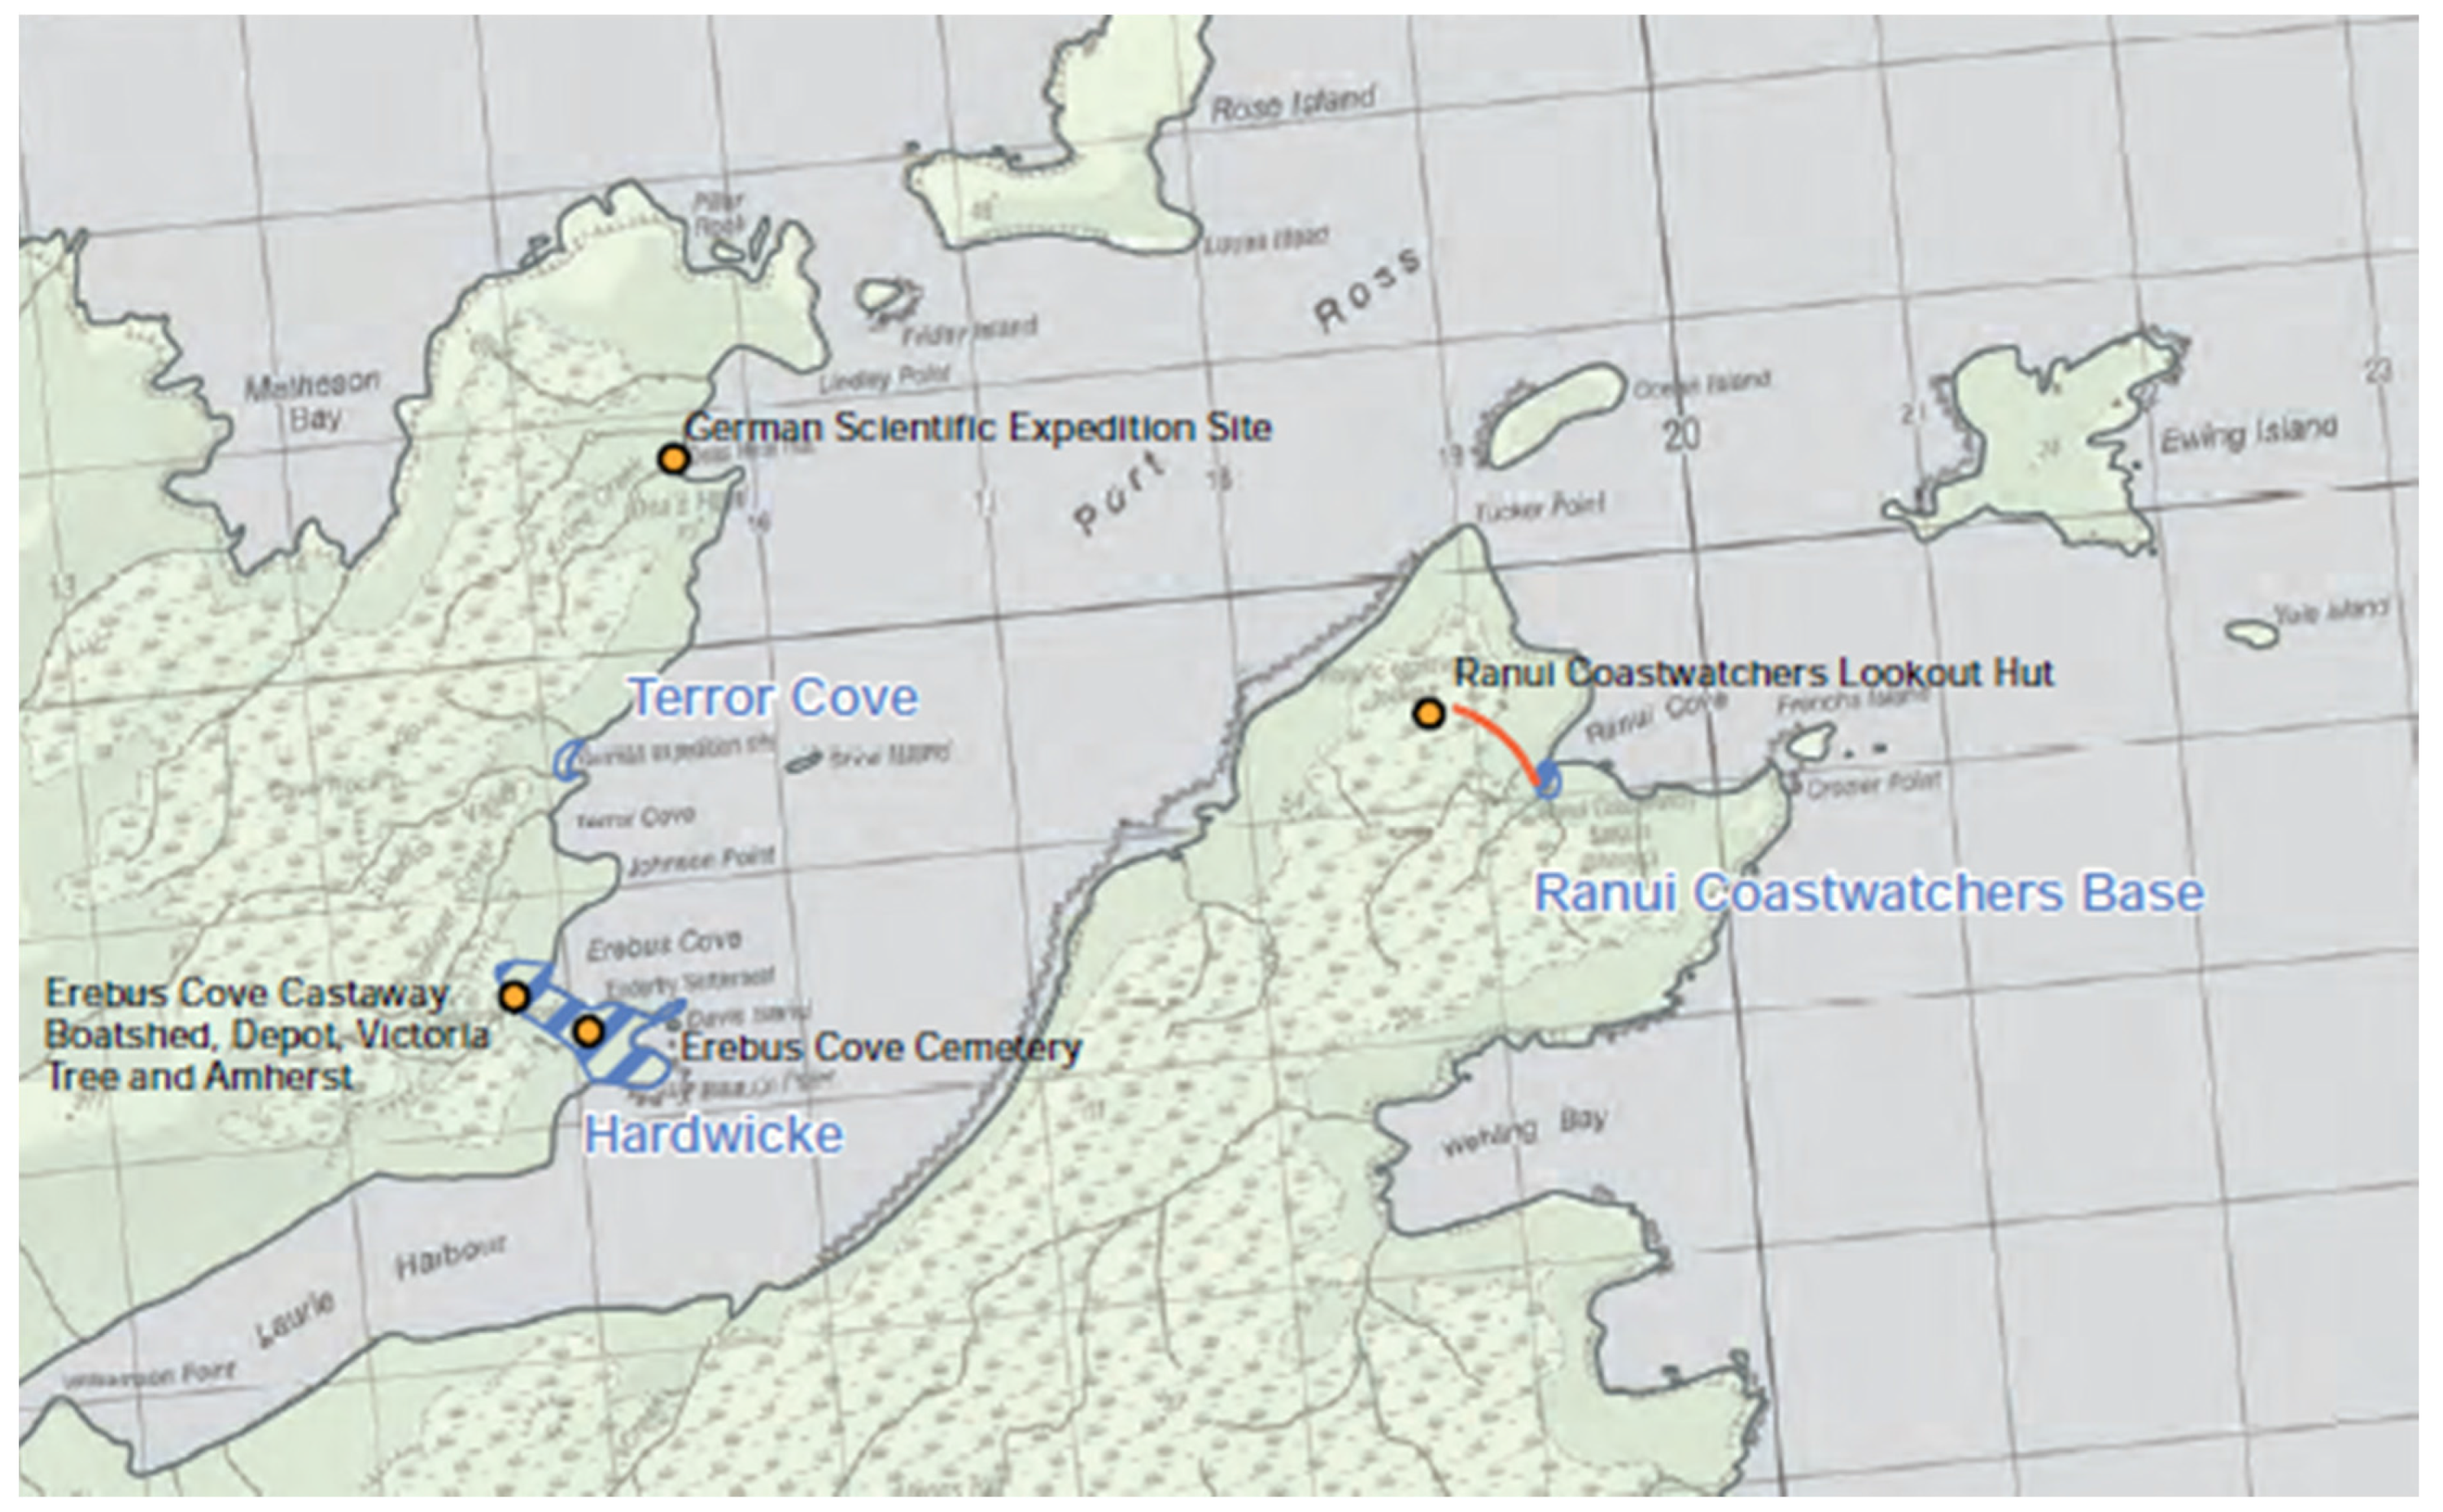
Figure 6.
Hardwicke visitor site quotas and permits used from years 2004–2014 (missing data for 2013–2015) [8]. (The set quota is in blue and the activated permits are in red).
Figure 6.
Hardwicke visitor site quotas and permits used from years 2004–2014 (missing data for 2013–2015) [8]. (The set quota is in blue and the activated permits are in red).

Figure 7.
Campbell Island visitor areas and tracks. Blue shows visitor areas and red marks visitor tracks (Image retrieved from [17]) (p. 27).
Figure 7.
Campbell Island visitor areas and tracks. Blue shows visitor areas and red marks visitor tracks (Image retrieved from [17]) (p. 27).

Figure 8.
Col-Lyall Saddle Boardwalk quota and permits used between years 2004 and 2015 (missing data for 2013–2015) [8] (The set quota is in blue and the activated permits are in red).
Figure 8.
Col-Lyall Saddle Boardwalk quota and permits used between years 2004 and 2015 (missing data for 2013–2015) [8] (The set quota is in blue and the activated permits are in red).
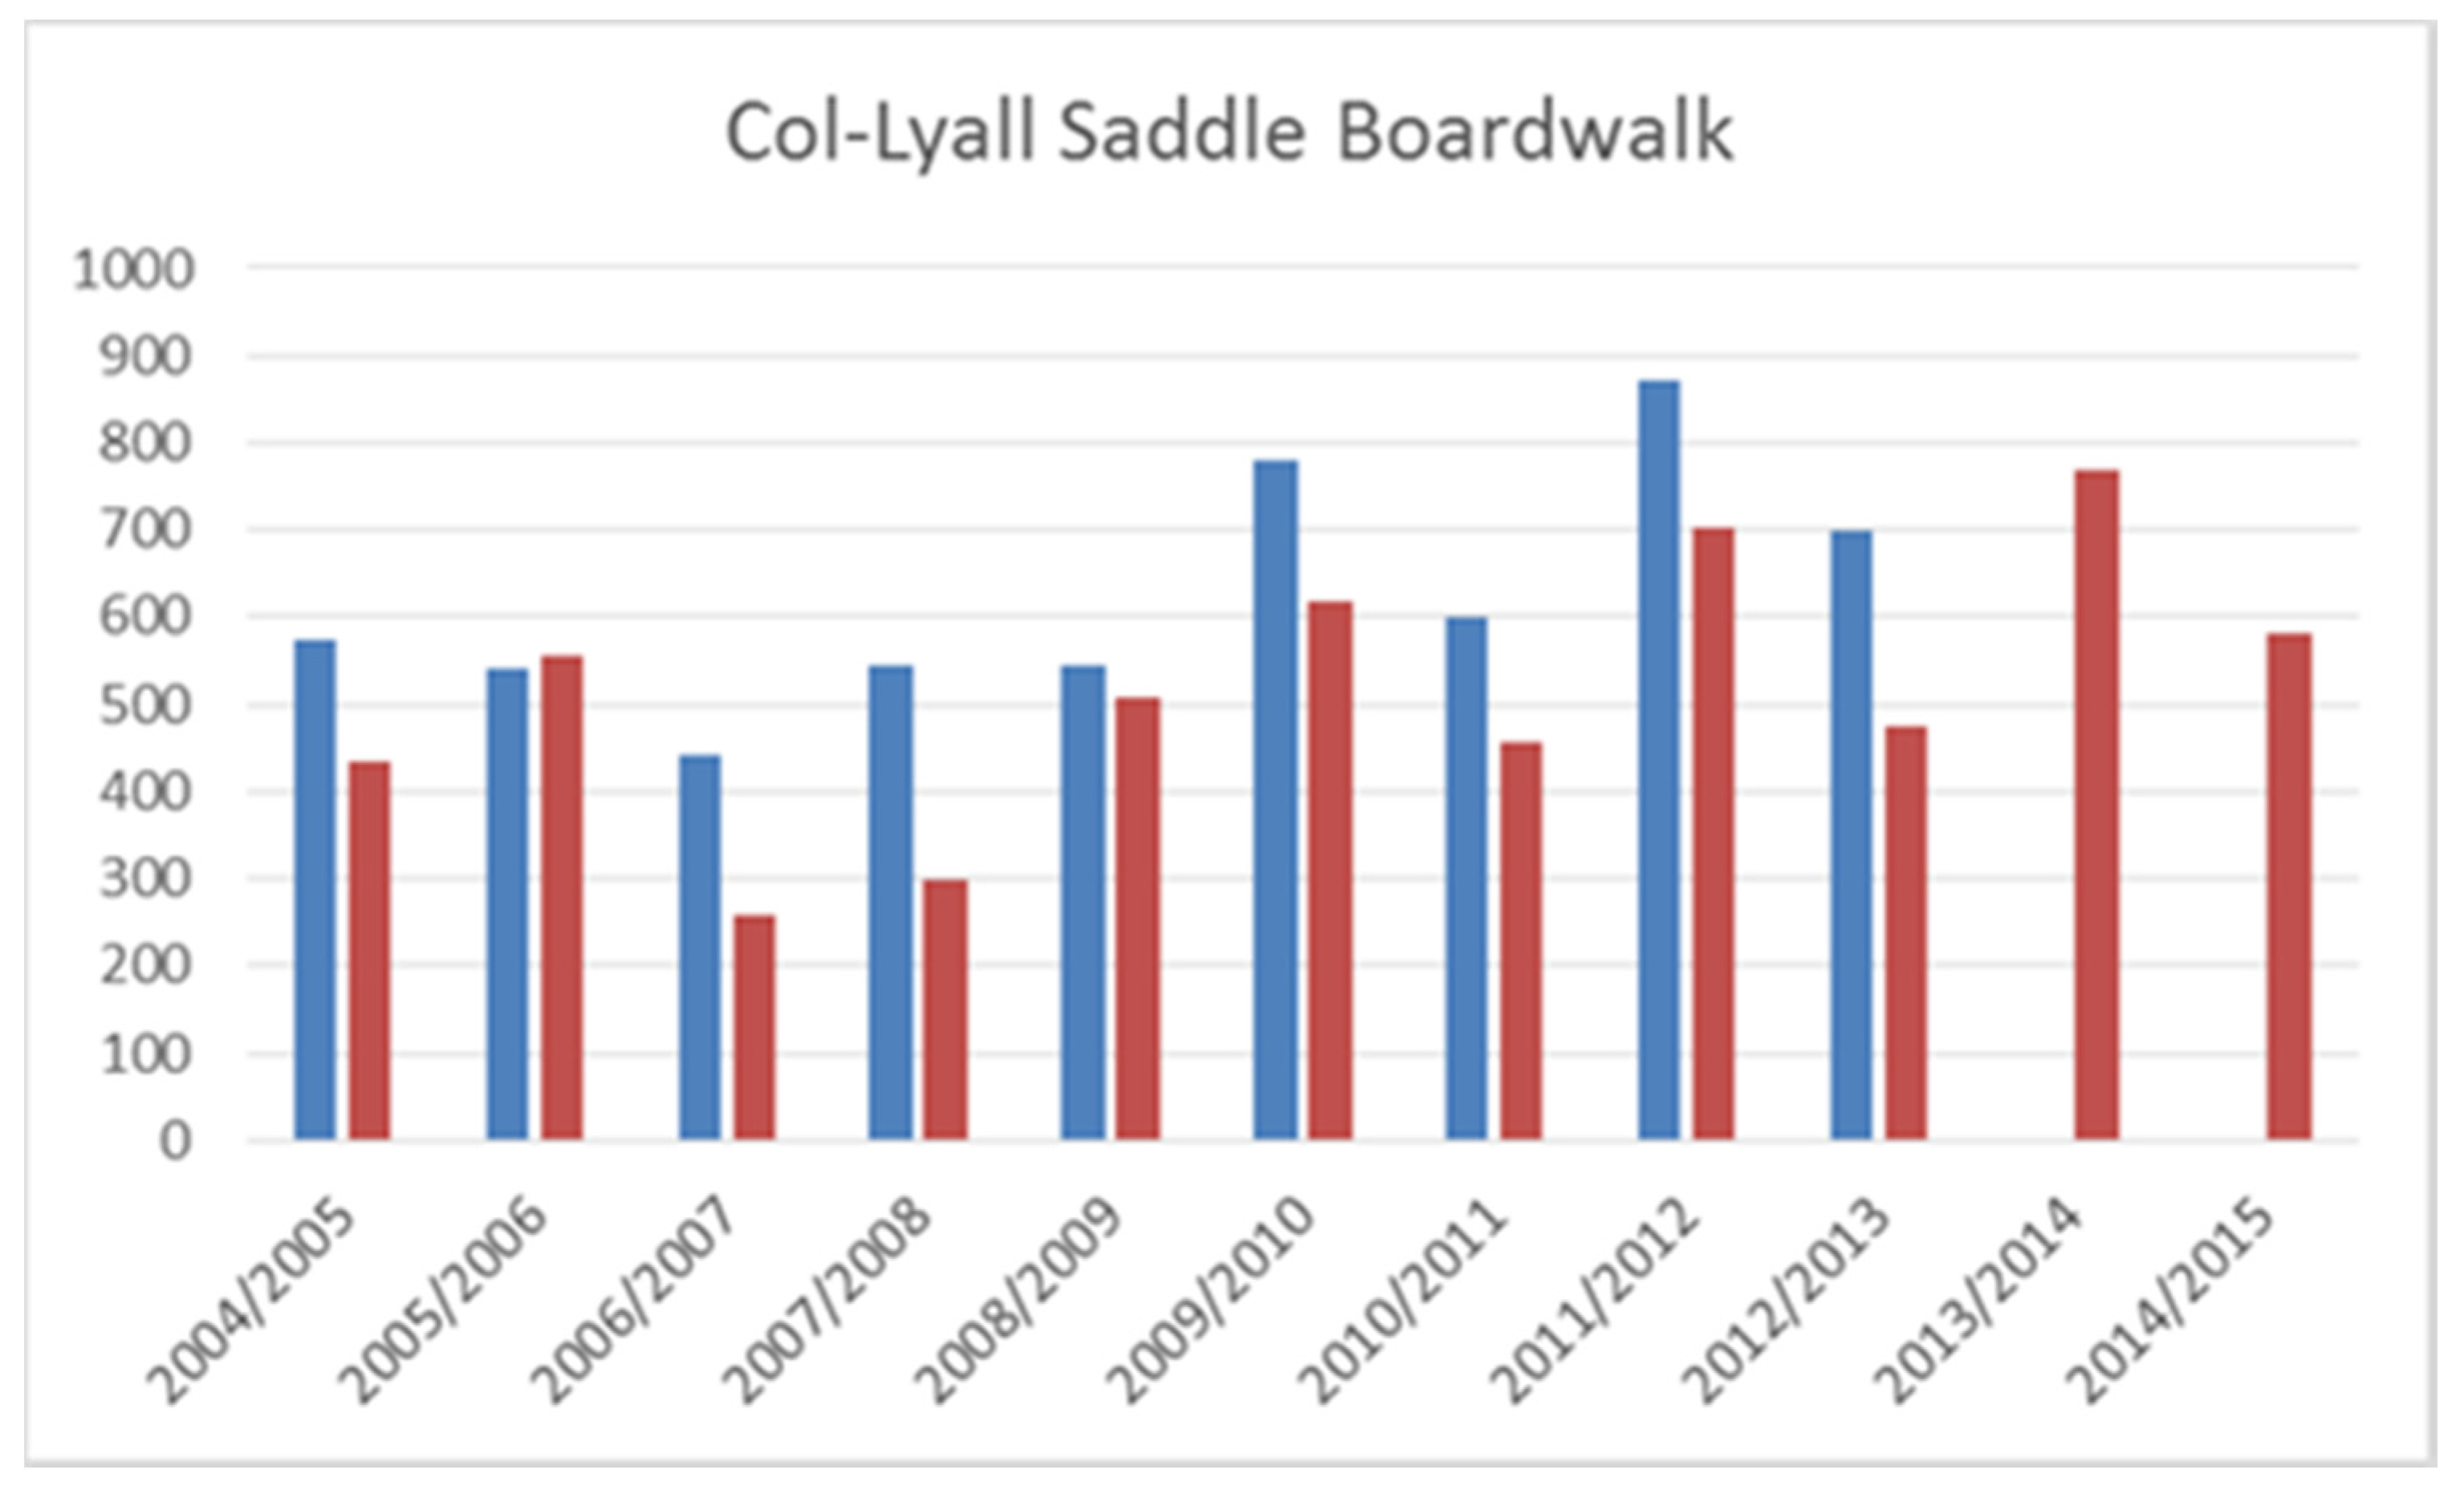
Figure 9.
Boardwalks on New Zealand Subantarctic Islands (Source: Heritage Expeditions New Zealand Ltd (Christchurch, New Zealand)).
Figure 9.
Boardwalks on New Zealand Subantarctic Islands (Source: Heritage Expeditions New Zealand Ltd (Christchurch, New Zealand)).


Table 1.
New Zealand Subantarctic Islands and their features [3,4,5,6]. DOC: Department of Conservation.
| Island Group | Area (ha) | Mean Temp (°C) | Annual Rainfall (mm) | Key Dates | Current Conservation Status | Visitor Access |
|---|---|---|---|---|---|---|
| Auckland Islands | 62,560 40 km long, 12 km wide (at its widest) | 8 | 1000–1500 | Reserve for preservation of Fauna and Flora 1934. | National Nature Reserve 1986, and World Heritage Area 1998 | Landings permitted as part of a guided trip, or if a permit is obtained through DOC |
| Nature Reserve 1977; under Reserves Act 1977. | ||||||
| National Nature Reserve 1986. | ||||||
| Marine sanctuary in 1993; under the Marine | ||||||
| Mammals Protection Act 1978. | ||||||
| Marine reserve in 2003 | ||||||
| Campbell Island | 11,331 | 6 | Reserve for preservation of Fauna and Flora 1954. | National Nature Reserve 1986, and World Heritage Area 1998 | Landings permitted as part of a guided trip, or if a permit is obtained through DOC | |
| Nature Reserve 1977; under Reserves Act 1977. | ||||||
| National Nature Reserve 1986. | ||||||
| Marine reserve in 2014 | ||||||
| Antipodes Islands | 2097 | 8 (estimate) | 1000–1500 | Reserve for preservation of Fauna and Flora 1961. | National Nature Reserve 1986, and World Heritage Area 1998 | No tourist landings. Cruising permitted |
| Nature Reserve 1977; under Reserves Act 1977. | ||||||
| National Nature Reserve 1986. | ||||||
| Marine reserve in 2014 | ||||||
| Snares Islands | 328 | 11 | 1200 | Reserve for preservation of Fauna and Flora 1961. | National Nature Reserve 1986, and World Heritage Area 1998 | No tourist landings. Cruising permitted |
| Nature Reserve 1977; under Reserves Act 1977. | ||||||
| National Nature Reserve 1986 | ||||||
| Bounty Islands | 135 Depot Island the largest at 800 m long | 10 (est) | Reserve for preservation of Fauna and Flora 1961. | National Nature Reserve 1986, and World Heritage Area 1998 | No tourist landings. Cruising permitted | |
| Nature Reserve 1977; under Reserves Act 1977. | ||||||
| National Nature Reserve 1986 | ||||||
| Marine reserve in 2014 |
Table 2.
Actual/potential environmental impacts from human visitation (Amended and updated from [5,18]).
| Impact Category | Impact | Cause | Management Options |
|---|---|---|---|
| Biophysical | Soil erosion or soil compaction | Walking on/off tracks Established tracks create channels where water flows more frequently | Restrict access |
| Dictate track route | |||
| Harden site | |||
| Instate quotas | |||
| Monitoring | |||
| Biophysical | Vegetation trampling | Walking on/off tracks | Restrict access |
| Dictate track route | |||
| Harden site | |||
| Monitoring | |||
| Biophysical | Souveniring | Visitors taking flora/fauna/objects | Legislation |
| Education | |||
| Supervision | |||
| Biophysical | Littering | Visitors leaving rubbish/possessions behind (mostly accidental) | Legislation |
| Education | |||
| Supervision | |||
| Biophysical | Pollution | Ships dispose of waste (either purposefully or accidently) Oil/fuel spill | Legislation |
| Rules regarding ship design | |||
| Biophysical | Alien species introduction | Seedlings/organisms introduced on clothing or equipment | Legislation |
| Education | |||
| Quarantine procedures | |||
| Boarder security | |||
| Biophysical | Wildlife disturbance | Noise pollution Visitors interacting with/getting too close to fauna Visitation during peak breeding periods Overflights | Restrict access |
| Dictate track route | |||
| Legislation | |||
| Education | |||
| Supervision | |||
| Cultural | Damage to historic sites | Gradual change through visitation (increased CO2, changed moisture content, movement of dirt) Souveniring Direct damage (e.g., through graffiti or vandalizing) | Restrict access |
| Legislation | |||
| Education | |||
| Visitor guidelines | |||
| Supervision | |||
| Social | Diminished visitor experience | Overcrowding | Restrict access |
| Social | Interference with other activities, e.g., research | Visitors going outside of designated visitor sites and tracks | Restrict access |
| Dictate track route | |||
| Legislation | |||
| Education | |||
| Supervision |
Table 3.
Solutions instated by DOC to address impacts associated with tourism.
| Impact | Solution |
|---|---|
| Trampling | Hardening of two popular sites, set track routes and visitor areas, and set quota numbers for these areas |
| Souveniring | Established code of practice through legislation, education of visitors by tour operators, and having a DOC representative present on all voyages to ensure compliance |
| Littering and pollution | Introduced legislation, enforce through education and supervision of visitors through guide ratios |
| Introduction of alien species | Thorough quarantine checks before and after leaving the ship, educate visitors prior to their trip so they are aware of procedures, and having a DOC representative present on all voyages to ensure compliance |
| Wildlife disturbance | Guide to visitor ratios and education of visitors prior to their visit, as well as briefing on board the ship prior to shore landings |
| Overcrowding | Quota system to reduce diminished visitor experience and guidelines set in the CMS stating how many people may visit a site in one day and how many ships may be present at stated landing sites |
© 2017 by the authors. Licensee MDPI, Basel, Switzerland. This article is an open access article distributed under the terms and conditions of the Creative Commons Attribution (CC BY) license (http://creativecommons.org/licenses/by/4.0/).
Share and Cite
MDPI and ACS Style
Stewart, E.J.; Espiner, S.; Liggett, D.; Taylor, Z. The Forgotten Islands: Monitoring Tourist Numbers and Managing Tourism Impacts on New Zealand’s Subantarctic Islands. Resources 2017, 6, 38. https://doi.org/10.3390/resources6030038
AMA Style
Stewart EJ, Espiner S, Liggett D, Taylor Z. The Forgotten Islands: Monitoring Tourist Numbers and Managing Tourism Impacts on New Zealand’s Subantarctic Islands. Resources. 2017; 6(3):38. https://doi.org/10.3390/resources6030038
Chicago/Turabian StyleStewart, Emma J., Stephen Espiner, Daniela Liggett, and Zac Taylor. 2017. "The Forgotten Islands: Monitoring Tourist Numbers and Managing Tourism Impacts on New Zealand’s Subantarctic Islands" Resources 6, no. 3: 38. https://doi.org/10.3390/resources6030038
Note that from the first issue of 2016, this journal uses article numbers instead of page numbers. See further details here.