Recycling in Brasil: Paper and Plastic Supply Chain †

1
SUSTENTAR, Interdisciplinary Institute for Studies and Research on Sustainability, Brumadinho, MG 35460 000, Brazil
2
FLUXUS, Laboratory on Urban and Socio-Environmental Sustainability Teach Learning, Department of Sanitation and Environment Studies, School of Civil Engineering, Architecture and Urban Studies, UNICAMP—University of Campinas, Campinas, SP 13 083 872, Brazil
3
ORIS—Observatory of Inclusive and Solidarity Recycling, Belo Horizonte 30535 500, Brazil
*
Author to whom correspondence should be addressed.
†
The first version of this article was presented at XI National Seminar of Solid Waste. Brasilia/Brazil, 2014.
Resources 2017, 6(3), 43; https://doi.org/10.3390/resources6030043
Submission received: 2 July 2017
/
Revised: 24 August 2017
/
Accepted: 24 August 2017
/
Published: 29 August 2017
(This article belongs to the Special Issue Recycling In Emerging Economies: Practical Considerations for the Circular Economy in Fast-Growing Middle-income Cities and Countries)
Abstract
:Although recycling is considered the core of a circular economy for returning materials to the supply chain, its procedures are poorly understood. Waste recycling is considered a big source of energy saving and a promoter of CO2 recovery. Besides that, it generates jobs and changes markets worldwide. The Brasilian National Policy on Solid Waste (PNRS) recognizes Waste Pickers as the major social agent in the recycling process responsible for putting Brasil among the ten largest paper-recycling countries in the world. This paper presents an analysis of Brasilian recycling chains of paper and plastics and the main challenges for expanding recycling from Municipal solid waste. The research data were obtained from primary and secondary source related to the recycling supply chain of paper and of the following plastics—High Density Polyethylene (HDPE),Low Density Polyethylene (LDPE), Polypropylene(PP), Polyethylene Terephthalate(PET) and Polystyrene(PS). Enterprises of various sizes, including informal ones and WPs associations/cooperatives, were visited, in the five Brasilian geographic regions, during the years of 2013 and 2014. A nomenclature was defined for the various enterprises that operate in the Brasilian recycling chain. Each node of the plastic and paper recycling chain was described. The main bottleneck observed in these chains is the lack of continuous programs of selective collection with an emphasis on environmental education processes in the 5570 Brasilian municipalities. Several possibilities not only to promote waste recycling but also to increase the productivity of the sorting process are discussed.
1. Introduction
Destatte (2014) points out that a circular economy comprehends seven current practices that should be interconnected from a strategic eco-design: industrial ecology, re-utilisation, re-use, repair, the economy of functionality and recycling [1]. One of these practices, recycling, is considered at this point as the core of a circular economy for returning materials to the supply chain [2].
Although it is one of the most discussed subjects, the recycling procedures are poorly understood. It is necessary to discuss the whole process of waste management, as the main economic model—the linear economy—demands a mass production of merchandise, followed by a massive amount of waste. The world’s concerns in relation to climate change have made countries contrive complex waste policies. EU directives bind the whole region to close loops in order to avoid the waste phase. In the USA, several states and cities are also committed, as are several Asian and Pacific countries. In Latin America, although the policies are new, the recycling practices are current.
Brasil defined a National Policy on Solid Waste in 2010 (Federal Law No. 12305/2010), which brings a hierarchy of treatments towards waste, recognizing its economic and social value, besides ratifying several States policies regarding Waste Pickers (WPs), the main representative of the Brasilian informal recycling sector (IRS), as a major social agent in the recycling process. This Policy also bans landfilling organic and recyclable waste and defines the Extend Producer Responsibility for packaging and Waste Electric Electronic Equipment (WEEE), besides other harmful wastes. In order to achieve this, an integrated and shared waste management must be implemented, with citizens, private sectors, and governments working together to form solutions.
From the 79.9 million tons of urban solid waste produced in 2015 [3], more than 80% were reusable and recyclable materials, and near 30% were paper and plastics [4]. Although only 17% of Brasilian municipalities organized waste selective collection [5], the industries report significant recycling indexes for paper (28%), cardboard (70%), and PET (56%), and these numbers grow every year [6]. The PET recycling index in Brasil is reported to be higher than the USA, England, Italy and Portugal [7]. The WPs are largely recognized as responsible for the return of plastics and paper to production [8].
Waste recycling is considered a big source of energy saving and a promoter of CO2 recover. Besides that, waste recycling generates jobs and changes markets worldwide. In 2013, 57% of the paper used in the world was produced from recycled fibers (~233 million tons). The steel industry utilized 375 million tons of steel scrap as feedstock [9].
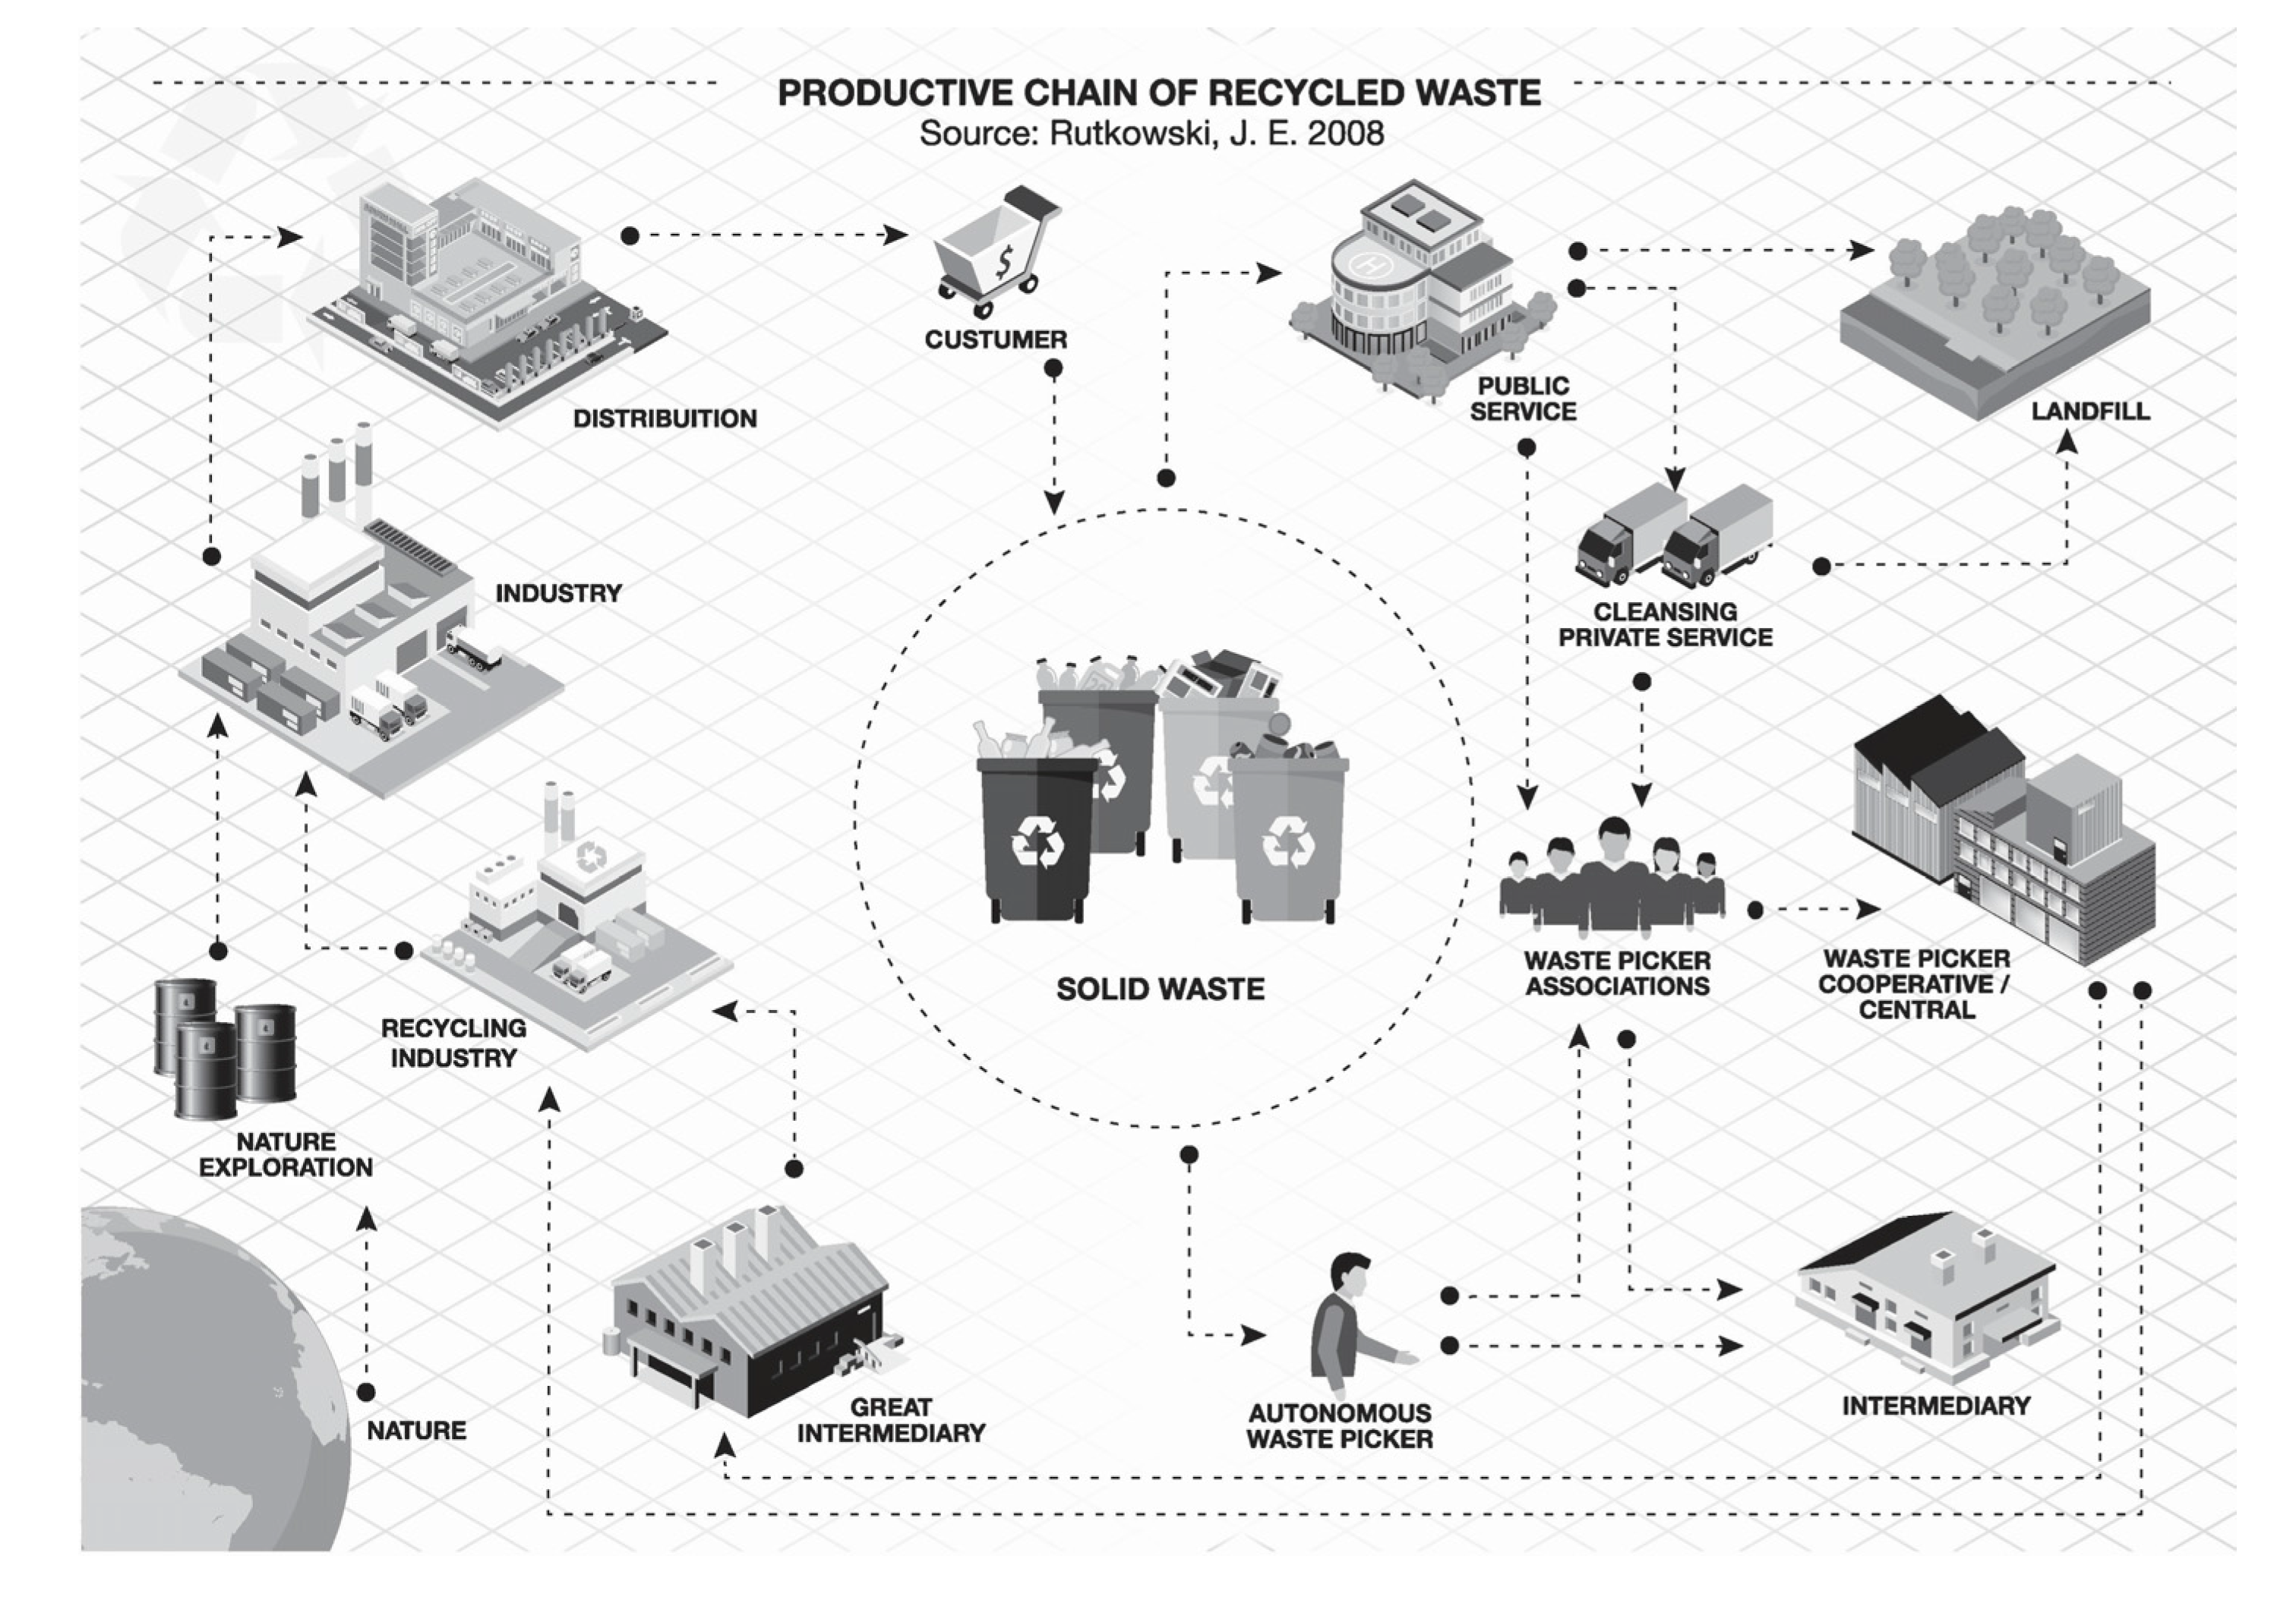
The supply chain of the recycling industry is divided into two parts. The most visible is the value chain, where the recyclable material become feedstock to the original productive chain of paper, plastic, steel, aluminum and other material. This chain depends on a service chain formed by the processes of collection, sorting, baling, and others which are necessary to allow the mixed material at the trash bin to be transformed into an industrial resource. As Anne Scheinberg has pointed out these two chains in the low and middle income countries are linked by the recycling informal sector [10]. In Brasil, as represented in Figure 1, the IRS place is occupied by WPs that collect the recyclables from trash bins, streets, dumpsites, households, and companies and treat them in order to sell them as feedstock to the recycling industry [8].
Brasil is among the ten largest paper-recycling countries in the world [11]. In 2015, 61% of the nationwide paper consumed (9.6 million tons) was recycled [12]. There is a consistent growth in the area: in 2008, there were around 380 thousand workers, more than double the figure of 1999 [12]. Table 1 confirms a consistent growth of MSW recycling over the years, with a volume of 7.1 million tons of recycled materials recorded in 2008 [7]. The Brasilian recycling chains of paper and plastics seem very significant, although seldom studied.
The present paper aims to analyze these chains, whose importance increases with the increasing advancement of the recycling industry and the global waste exports [13]. In addition to an overview of the productive sector and the value chain of recyclable paper and plastics in Brasil, this paper addresses the main challenges for expanding recycling from MSW, considering the recycling targets imposed by Brasilian legislation and the crescent importance of the circular economy vision as a strategic option for sustainable development.
2. Materials and Methods
The research data were obtained from primary and secondary source related to the recycling supply chain of paper and plastics—HDPE, LDPE, PP, PET and PS. These materials were defined from the list of the main recyclable materials collected by the WPs in Brasilian cities [14,15]. Responsible for 79.3% of the WPs’ income [4], these recyclables have a great recycling market demand.
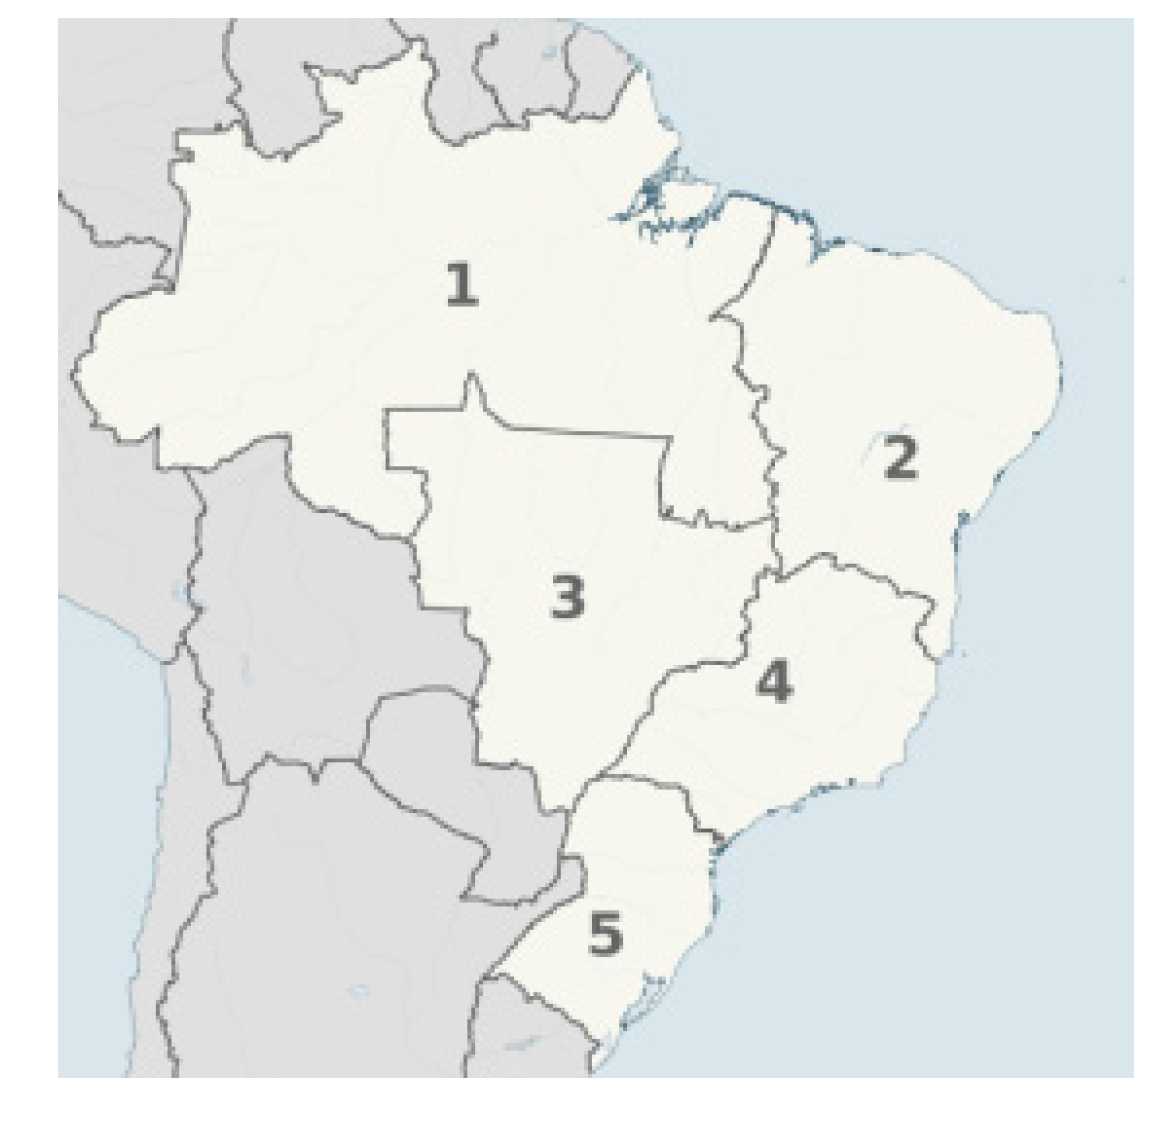
To capture the diversities and specificities of the sector, enterprises of various sizes, including informal ones and associations/cooperatives of WPs, were visited, in the five Brasilian geographic regions (Figure 2).
Two strategies were designed to identify the social agents that should be visited by the research team. The first relied on the WPs knowledge about the local recycling market and used their information to locate one buyer and another until closing the chain. The second one was identifying recycling companies from commercial lists for each region. The information from these two sources was crossed to define the cities visited in each region. Next, the selected enterprises were invited to participate in the survey and those, who accepted, were visited. A semi structured questionnaire was applied. The research team was formed of production engineers experienced at waste recycling. The issues addressed were:
- (A)
- Social agents participating in all links of the plastic and paper recycling chain;
- (B)
- Quantity of material produced, quality requirements and marketing price at each chain link;
- (C)
- Each social agent production scale;
- (D)
- Description of production processes with introduction of recyclables as feedstock/secondary material;
- (E)
- Understanding possible partnerships among social agents in the supply chain, such as, supplier support practices and production and logistical cost sharing;
- (F)
- Understanding the relationship between materials of a lower value of commercialization and those of a greater value;
- (G)
- Survey of commercialization alternatives for sorted materials.
The methodology was validated through 24 interviews conducted in the Minas Gerais state located in the Southeast region, with helped to design a procedure and a tool to collect the data. Previous to the field trip, the companies were contacted by telephone and/or emailto confirm: their address, role in the recycling chain and the company size. There were 73 visits during the years 2013 and 2014: 69 enterprises and four entities representing the Brasilian plastic and paper sectors.
The research aimed to understand the recycling value chain from the WPs’ needs. Therefore, they were involved from the beginning and acted as the main informant. The epistemological principle that guided this research was the participatory methodologies—the involvement of social agents requires the practice of a science with people and not for them, and with scientific knowledge that is permanently collated with practical knowledge [16,17].
3. Results
Worldwide, nomenclature in the recycling business needs a proper definition [18]. In order to describe the Brasilian Recycling Chain for paper and plastic stakeholders, nomenclature criteria were established (Table 2).
3.1. Recycling Supply Chain
Recycling can be understood as “an industrial procedure to reuse the raw material for the production of new products (similar or not)” [19]. For post-consumer materials, such as those generated in households, to be transformed into raw materials for the recycling industries, they must be separated at source, collected, sorted, benefited and marketed as inputs, therefore forming the recycling chain (Figure 1).
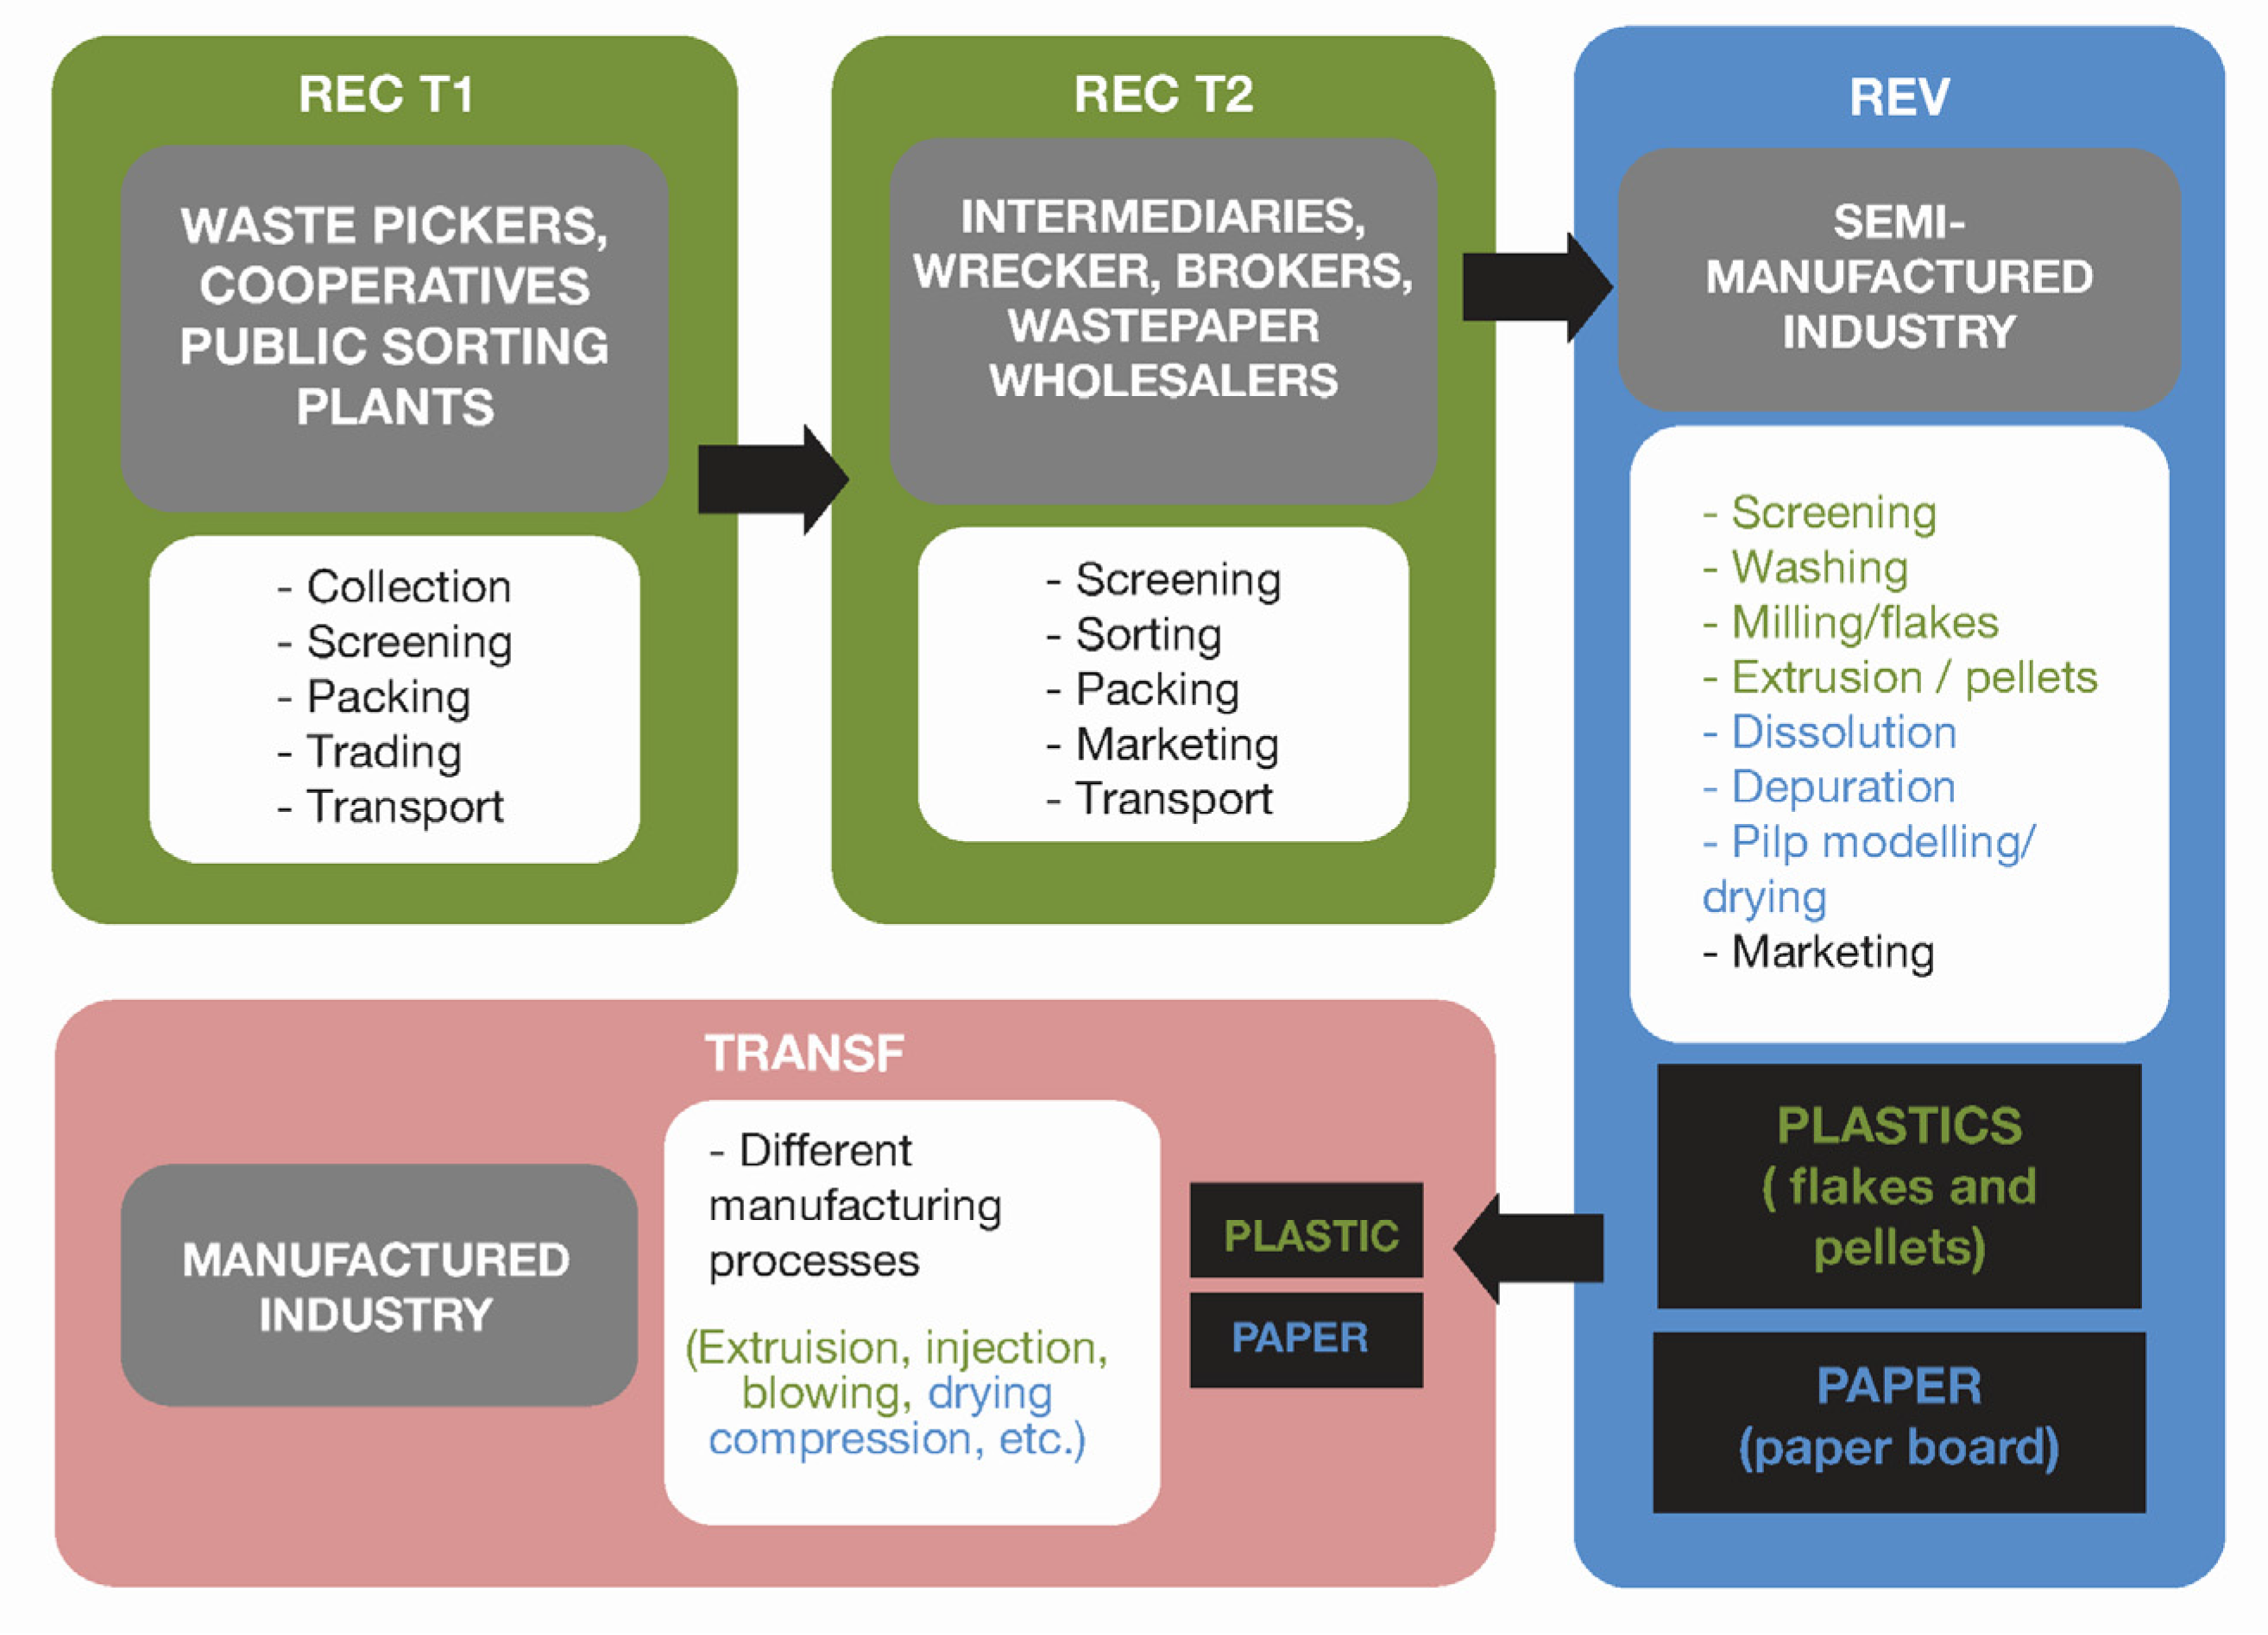
The Recycling Chain stakeholders are divided into three groups: recuperators, revaluators and transformers. Figure 3 shows those groups and the production processes they perform. The most commonly used waste separation in Brasil is dry and wet, so selective collection systems collect plastics, paper, glass and metals—the dry fraction—together. The recuperators TI (REC T1) collect or receive this mixed material and are responsible for the first sorting. The dry material is separated in different streams, one for each kind of recyclable material. Although performing a similar role in relation to each fraction of dry waste, REC T2 differs not only in terms of not collecting from the source (households, commerce, etc.), procedure fostered only by REC T1, but also in terms of size and scale of material sorted. REC T2 manipulates bigger quantities. They are private ventures, and the majority is organized as formal companies. On the other hand, REC T1 is mainly formed by waste pickers that act independently on streets and open dumps, or by WP Co-operatives (WPC), solidarity economics ventures. The WPC organize recycling facilities improving WP working conditions and income. Commercializing material in greater scale, WPC gets better market conditions than individual WP, becoming a real player at the value chain in every Brasilian region. The survey demonstrated that, in relation to recyclable PET, on average, the value that REC T2 pays to WPC is 400% higher than the amount paid to WP; and the price that industry pays to REC T2 is 8% higher than the price that this last pays to WPC (Table 3).
In the next step, there are two different chains, one for each kind of material. The size, technical processes and role of the re-valuators companies (REV) become diverse when considering the kind of paper or plastic to be processed. The Transformers (TRANSF) are companies that utilize recyclable material as feedstock to produce new merchandise.
The use that is given to recycling induces differentiated sorting and classification steps. In the stages of re-valuation and transformation there are situations in which the materials are processed by type or just mixed. Technologies that process one type of material require fine sorting with accurate material classification, which impacts on both the costs and the volume of recovered materials. On the other hand, these technologies degrade the physical and chemical properties of the material less, making it possible to repeat the recycling process more often, for example, the continuous production of cardboard from used cardboard. Other technologies, such as the manufacture of plastic woods from a set of different plastic resins and fibers, are oriented to the recycling of mixed materials, which reduces the need for a fine separation. These aggregated materials make impossible a later separation, reducing the range of possibilities for future recycling.
The recycling chain, as all supply chains, are subject to the market. The costs of collection and preparation (sorting, pre-treatment, conditioning, transport) are evaluated in comparison to revenues from material sales. For some materials, such as aluminum cans, this balance shows to be very profitable and recycling happens in a record proportion, even without the need for a public intervention in the collection and sorting stage. Under the laws of the market, profitable by-products of waste are “naturally” reintegrated into the production process. However, at the other extreme, there is the unwanted waste or pollutants with a production cost above the market price [20]. In these cases, State intervention is needed in order to induce commercialization of less profitable materials, increasing the range of recyclable products and the environmental benefits.
3.2. Input Link: Generators and Recoverers
Waste generators and recuperators (REC T1, REC T2) are the input link in the recycling chain. The generators are citizens/households/businesses. Some are considered to be large generators of urban waste and, therefore, of recyclable materials, such as, shopping malls, condominium, public offices and banks, supermarkets, and large offices, among others. The quantity and quality of the materials generated as well as the dispersion of the generators will influence the subsequent steps of the process. The scale of recyclable generation influences not only the logistical costs but also the material quality. The large generators tend to deliver material that is cleaner and more homogeneous.
The influence of the generators on the quantity recovered and the largest generating sources varies according to the recyclable material. Residences tend to generate a more significant amount of PET, HDPE, type IV white paper and aluminum cans. The big generators stand out in the case of LDPE, white paper II, and cardboard. Big generators may differentiate themselves in relation to the type of material, for example, the graphic industry and public offices produce white paper type I, whilst cardboard is generated by supermarkets and home appliance stores. In general, residences residues need to pass through more steps in the value chain before reaching manufacturing industries than the ones from large generators, whose materials are sent directly to recuperators and sometimes to REVs.
The initial links are the most problematic. The official programs for the selective collection of urban waste represent 1% of the recycled materials in Brasil, since only 18% of the municipalities declare to adopt the selective collection as public policy [21], according to CICLOSOFT Research 2016 that is a survey on Municipalities Recycling Programme carried out biannually by Brasilian NGO CEMPRE (Business Commitment to Recycling). A total of 80% of these municipalities are in the south and southeast regions, the richest ones, and in general, they practice a poorly organized partial selective collection: in some regions of the city and citizens are not properly informed about the service. Additionally, most of the Municipalities that declare adopting selective collection do not have an official program associated with waste management; but only recognize that WPs and WPC pursue some kind of recyclable material collection.
The materials generated in the large urban generators are concentrated and this positively influences the logistical costs of the collection process and the quality of the material due to the homogeneity of the separation. Highly homogeneous and cleaned wastes are more easily incorporated into the subsequent processing steps for recyclable materials; therefore represent the bulk of the recycled material in some chains, such as the paper one. The materials generated in the households are pulverized, that is, the sources are scattered in several points, each one producing a small quantity.
The quantity recovered and the source of generation varies for each material. For some, the generation within households is more significant, as is the case of PET, HDPE, type IV white paper and aluminum cans; whilst for others, the large generators—supermarkets, commerce, public services—stand out, as is the case for LDPE, white paper II, and cardboard. In addition, large generators can also be differentiated in relation to the type of material, for example, large generators of white paper type I are seen in the graphic industry and public offices. Cardboard is generated on a large scale in supermarkets and appliance stores. In general, residues generated in residences pass through more chain steps to reach the recycling industry than those materials from large generators, which could sometimes be sent directly to REC T2 or even to the REVs.
For packaging, industry recognizes that nine out of ten kg of recycled packaging arrives at the recycling industry through WP works. They are considered responsible for increasing the amount of recycled MSW from 3 to 12% [7]. The activity of the WPs represents a link in the recycling supply chain of labor-intensive composed of jobs of a low degree of formal specialization, and dependent on tacit qualification, i.e., practical knowledge. This link represents an additional advantage for public policies, generating work and income for a portion of the population that, due to their social, health, and educational characteristics, would hardly be incorporated into the formal labor market. So, there is a potential reduction on, at least, social assistance and health care public policies.
Despite this, the working conditions of WPs (REC 1) are rather precarious. In addition to the lack of selective collection programs that compel them to collect recyclables from dustbins and/or from undifferentiated waste, most of the sorting warehouses are improvised. In daily life, WPs have to deal with diverse operational difficulties, such as the obligation to endure the operational costs of the collection, the lack of appropriated equipment, and other production problems which prevent higher productivity [22]. Most of the cooperative/association REC 1 has no more than 150 workers. About 40% of these are illiterate or have an incomplete elementary education. Being self-managed ventures, the administrative functions are also performed by WPs, not by specialized hired employees. The remuneration is given by individual production with an equal hour value for all functions and the wage is proportional to production, by apportionment or per day. Moreover, when they are not formally contracted as service providers of selective collection by the Municipality, this remuneration is frequently below the Brasilian minimum wage, because of the small market value of recyclables.
Obtaining the raw material at this link (REC T1) varies according to the stakeholders’ reality. The WP collects material using bags, street carts, adapted bikes, kombis, cars or trucks. Some cooperatives receive material from conventional or selective collection carried out directly by municipalities or their contractors. In addition, cooperatives could receive donations from large generators and industries, periodically or otherwise. In general, the materials processed are post-consumer and belong to the categories of plastics, paper, metals and glass. The amount of material processed does not present a pattern, and can vary from 2 to 500 tons per month. Also, the average productivity per worker is variable. The average value identified was 2.5 tons/worker/month, with a range varying from less than half a ton to 4.6 tons/worker/month.
REC T1s perform different levels of separation. The sorting may be arranged in a number of unique or combined forms, such as, in conveyors belts, boxes, silos, tables, countertops, drums and on the floor. Segregated materials may be pressed and balled for easy stocking and transportation, or marketed loosed, depending on the storage capacity and kind of available containers and the buyers’ requirement. The tailings index is generally high, in some cases reaching 80%. It is evaluated that this value is related to the degree of generator mobilization for source separation to recycling. REC T1s do not form a stock of products, because they need to sell the material to survive. They don’t have access to credit. Their priority business partner is REC T2 in the same city or within a distance of 200 km. If there are REV or TRANS enterprises in the region, the REC T1s might market in combination with them. However, this rarely happens because of the production scale and the industry deferred payment issues.
As the amount of recyclable material varies with seasons and holiday dates, the price also varies. The end-of-the-year holiday increases the amount of material and the prices consequently go down. In the rainy season, moisture induces a reduction in the price of paper. Prices are also linked to worldwide economic behavior, since plastics and cellulose are global commodities. In purchase and sale relationships, a common practice is the called “married” material. An example of a married purchase is PS, difficult to sell, with PP, and a married sale may be with PVC and polyethylene or PET. In these cases the price of the product of higher cost is diminished to compensate the supposed loss of the buyer.
RECs T2 are formed by private companies not engage in collecting, they may have “captive” WPs, most of whom are homeless. Depending on the material quality, they buy pre- or post-consumer materials that are already sorted, or directly from large generators or REC T1 or even smaller REC T2. If the material is well separated in a big generator, no productive process is done, just transporting from there to the next buyer. In most cases, the material is sent to a warehouse to be re- sorted and is pressed to compose bigger bales, not only more appropriated to the scale needs of industry but to cheapen transportation costs. The material is processed through three flows for increasing scale and reducing cargo handling and storage costs:
- • Mixed from various sources;
- • Re-screened for the removal of contaminants according to quality criteria of the purchasing industries (REV or TRANS);
- • Re-baled to bigger bales, to reduce;
These flows allow a register of a sales price increase from 65 to 400% in PET kg REC T1 purchased price to REC T2 sales.
3.3. Recoverers’ Business Strategies
RECs T2 often do not process materials without market value, in comparison to REC T1s that have to manipulate all kind of mixed material which they come across. REC T2 used to create material stock for waiting/forcing a price increase or for meeting the volume demanded by a customer. They might practice combined purchasing to obtain higher value materials at lower prices. REC T2 sells materials directly to REVs, TRANS, or to larger REC T2s. Some REC T2 infrastructure and equipment are similar than those of REC T1. Many are informal ventures led directly by the owner. The number of workers can range from three to 20 in the operational sector to only one in the administrative sector.
The majority of REC T2s buy materials from autonomous WPs and submit them to very precarious working conditions: lowering the price, exchanging material for the cart loan or alcoholic drinks and drugs. In order to keep the REC T1 loyalty as a supplier and to maintain a lower price for recyclables, REC T2 may offer some type of support, such as payment in advance, transportation costs, loans and/or maintenance services on equipment, donation of bales tying strips, lend of truck, containers and others equipment.
The range of production of REC T2 varies from 30 to 700 tons/month and productivity per worker per month, from 1.25 to 26 tons, with an average of 5.9 tons/worker/month. The tailings amount is much lower than for REC T1s, with an average of 4.6%, ranging from 0.4 to 10%. Most suppliers are located within a radius of 150 km and REC T2s sells to customers located within a radius of 450 km. The payment term is quite variable and transportation costs to the buyer tend to be paid by the REC T2. They are also subjected to price seasonality and variation due to quantity and quality. The REC T2s offer the same exclusivity to their customers as they ask from their suppliers.
Among the REC T2, the paper scrapers process a large amount of material of a certain type and stand out for their high productivity and for the reduction in the quantity of different types of materials processed. They are bigger with a production range from 700 and 3500 tons/month (10 times superior to the other REC T2s). Production/worker/month ranges from 35 to 135 tons/worker/month, with an average of 85 tons/worker/month. Therefore, the paper scrapers have a productivity 14 times superior than the other REC T2s. It was observed that their average tailing value is 1% of the total processed, which is much lower than the REC T1 and other REC T2s. They usually pay suppliers on demand and sell directly to the industry on a long term basis, which requires working capital. They have large warehouses (around 4000 m2), where is possible to stock about 450 tons/month.
The main productive activity performed by the paper scrapers is refine sorting as they buy materials with variable quality and redefine it from the demand of each buyer according to ABNT NBR 15755:2009 [23], that defines directives for paper recycling. This reclassification adds value to the material and is an important part of the business’s profitability. They sell to REV and TRANS—paper and pulp companies, toilet paper, paper towel and napkins, packaging—located within a radius of 300 to 700 km and pay for transport costs when the distance is up to 100 km. They identify seasonality in the demand and price of recyclable paper, but the latter also varies according to the global price for the pulp sales.
3.4. Production Link: Revalorizationers and Transformers
The re-valuation and transformation of recyclables is an economically viable activity, dependent on the continuous supply of material and on the availability of appropriate technologies, economically viable techniques to treat the different materials found in the waste [24]. These conditions might vary not only for different materials, but also for different Brasilian region. Plastic and paper recycling chains have some common characteristics regarding the production link. The occurrence of non-homogeneous products of different quality characteristics, such as color, the degree of impurities, and compaction, greatly influence the price and can define the interest in acquiring the material. In addition, the added value is very small, which makes the cost of transport very relevant.
One of the main difficulties for recyclers to obtain recyclables of a desirable quantity is the lack of well-structured selective collection programs. The recycled plastic industry operates with an idle capacity. In the manufacture of corrugated paper, about 63% of the raw material used is recycled corrugated paperboard: 50% comes from the industrial packaging lines, and 13% comes from post-consumer packaging [7].
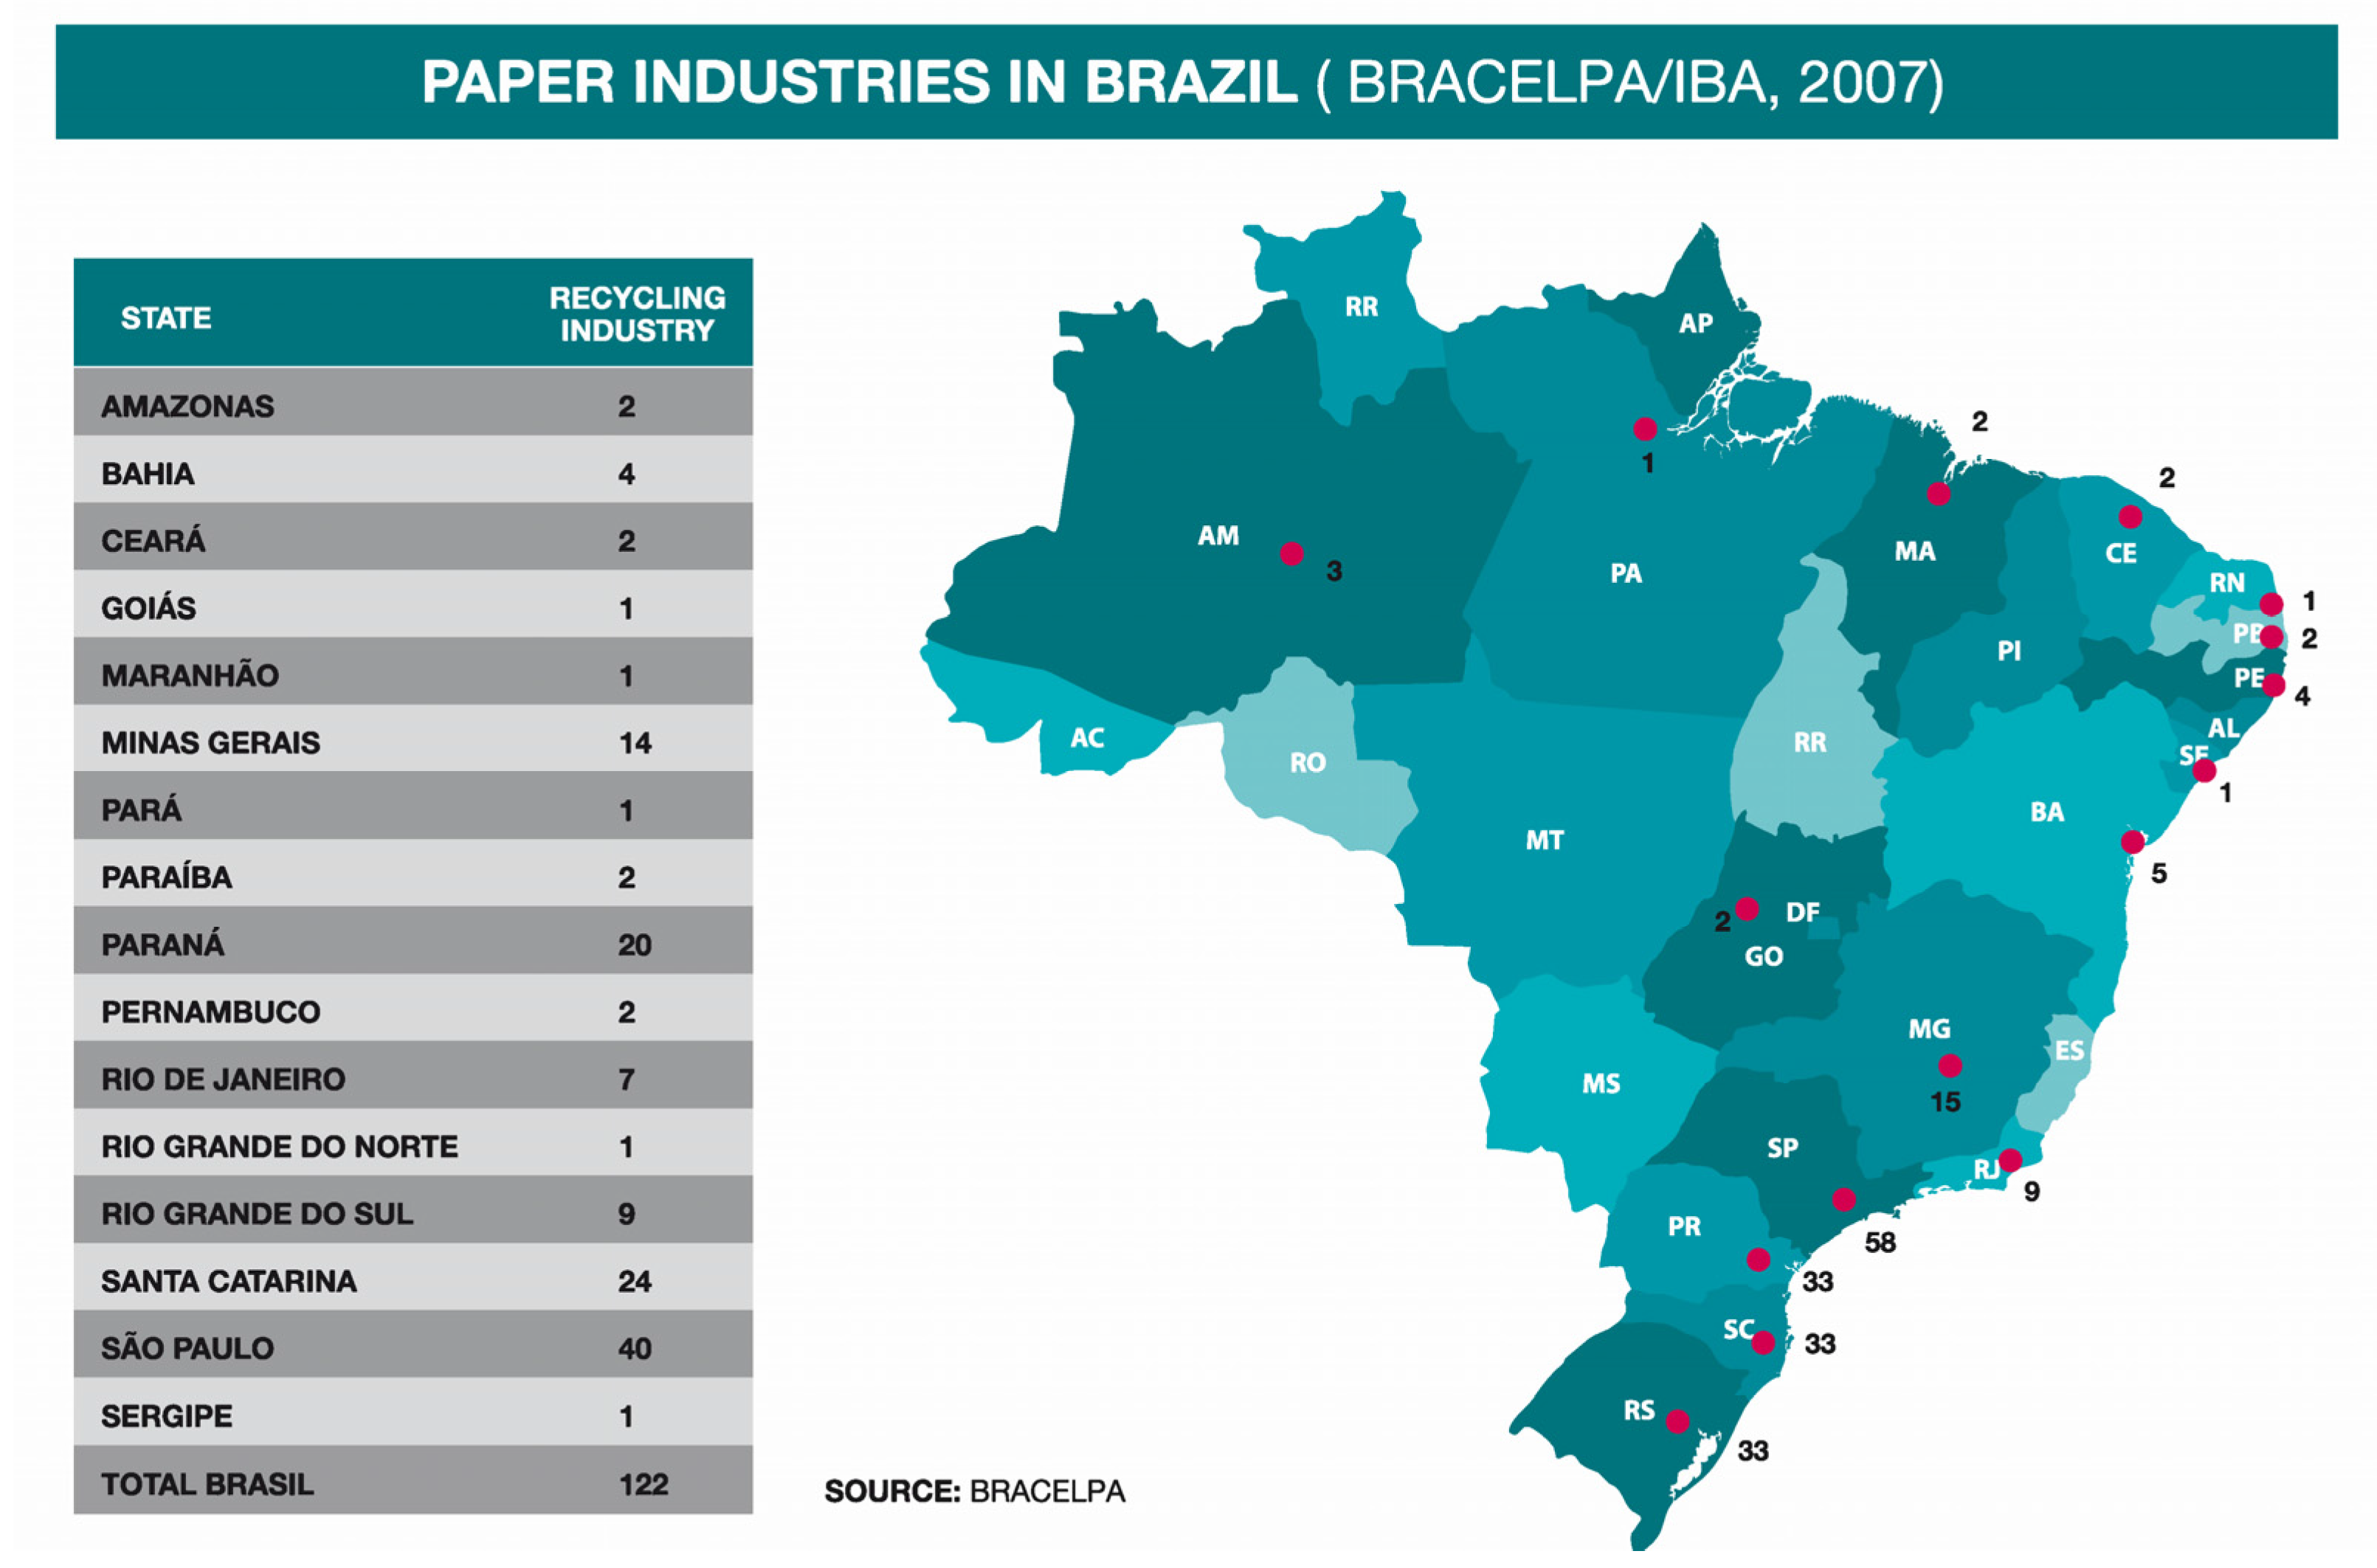
There are 175 paper industries in Brasil (Figure 4). The major paper mills are concentrated in the states of São Paulo (SP) (Southeast region), Paraná (PR) and Santa Catarina (SC) (both in South region), which consume 71% of the paper scrapes produced in Brasil [7]. There are smaller factories that use recycled fibers in all regions of the country, but not in all states.
The scale of production of paper recyclers varies. Large companies dominate with a processing of 4000 tons/month. Paper REVs are represented by the paper reel manufacturers whose product is used by the packaging industry. TRANS include the sanitary paper industry, and the classical paper industry and they work directly with recycled paper as raw material.
Brasil has 11,590 processed plastic industries. Most are micro and small businesses—72.5% employ up to 20 workers [27]. There are differences in the size of the recycling companies, depending on the type of plastic processed. The production scale of the REV and TRANS companies of PET is significantly higher (approximately 1000 tons/month) when compared to HDPE, LDPE and PP whose scale is on average 183 tons/month, ranging from 4.4 tons/month to 500 tons/month. These REV or TRANS industries are located in different regions of the country, mainly in densely industrialized areas and close to the consumer market. In the Minas Gerais state (MG), half of the jobs in this industry are in the Metropolitan Region of Belo Horizonte, the state Capital, where there are 42 recycling companies, equivalent to 5% of the total plastic recycling industries in Brasil. Another reason for the regional concentration of the recycling plastic chain is associated with the Local Production Arrangements, such as in Caxias do Sul Municipality (Rio Grande do Sul state (RS), South region), which provides injection and blow molds for the manufacture of plastic products, attracting the recycling plastic industry, where PP, HDPE, and LDPE recycling companies are numerous.
Brazil recycles about 21% of the plastics produced, which in terms of mechanical recycling, makes it one of the largest recycler in the world [28]. In the recycling chain, the social agents appropriate unequal value as shows Table 4 for PP sales price.
In contrast to paper, 68% of the recyclable plastics come from post-consumer uses. Recycled plastic is usually employed in secondary markets, such as household goods, packaging and office supplies, and small value products with a low quality and small technical specificity. There are about 34% idle capacities in the plastic recycling industry for lack of recycled feedstock [29]. Seasonality marks both the supply and sale of recycled pellets. The price is directly related to the price of the virgin resin and cannot exceed 80% of its value or it becomes economically unfeasible.
The REV link in the plastic recycling chain is characterized by the producers of flakes, granulates and fibers (intermediate products of the plastic recycling chain). The REVs of LDPE, HDPE, and PP usually outsource the grinding stage of the recyclable materials. Some types of recyclable materials such as Styrofoam (EPS) and PS coffee cups, despite the growing generation in urban waste, have a poorly consolidated and strongly regional market. Others, such as the multilayer snack food packets, do not have a market, and end up as tailings.
4. Discussion
A recycling system for paper and plastic represents a decrease in the volume of waste transported to landfill deposition reinforcing the industrial ecology principles of optimizing energy use and abiotic resource depletion potential [4,24]. The amount of Brasilian domestic recyclable material increases every year [3], but it is difficult to guarantee separation homogeneity and to avoid contamination. A recycling policy needs a continuous selective collection (CS) program with an emphasis on environmental education processes to raise both the material quality and consumer awareness [30,31]. This is the main bottleneck observed in the management of plastic and paper recycling chains of Municipal solid waste for the 5570 Brasilian municipalities.
Waste public policy in Brasil is still treated as a set of technical engineering actions, although the legislation points to a different direction: the shared responsibility of waste management. In the great majority of municipalities, public waste management processes do not prioritize environmental education actions or the selective collection of waste. As the generators do not feel fully committed to recycling, the residue is not segregated with care, so most of the recyclables go to the landfill/dumpsites or arrives contaminated at Material Recovery Facilities. Thus, the tailings rate is always high in the REC T1 link of the chain. However, when WP Cooperatives are hired by municipalities as service providers for the selective collection of waste, they also act as environmental educators; teaching the citizens what and how to segregate the recyclables and the tailings index diminishes considerably [8].
A transformative and emancipatory environmental education [32] should be applied as a fundamental process in the consolidation of programs of information, mobilization and sensitization for recycling in a municipal waste system. Generators, encouraged to promote citizen participation, may improve the adoption of a system that considers recycling as an important step to non-generation in the future.
Recycling MSW is primarily a distribution channel problem. The highest cost of MSW recycling is in the initial steps, the transportation and sorting processes. The Brasilian Solid Waste Policy recommends the implementation of a selective collection system in the municipalities with the active participation of WPs. The social technology of selective collection developed by the WPs has been proved to be technically and economically more efficient: it increases the amount of recyclables collected, with a higher quality and lower costs [8,9]. However, the inclusion of WPs in the waste management and in the recycling chain requires strategies and instruments in order to guarantee dialogue between the formal economy and the social and solidarity economy, in which WP ventures are organized. Although building partnerships between different social agents has been frequently pointed out as a fundamental step to implement environmental innovations towards circular economy [33], this is not an easy achievement.
A productivity increase of the recyclable material sorting process should be carried out [24,34]. Despite the evidently important job executed by the WPs in the recycling supply chain, it can be improved for the WPs to be able to deliver better quality recyclables in a faster way, to the recycling industry. The improvements require organizing the workflow, and implementing and renewing some equipment and in-cargo handling logistics in the WP’s warehouses. So far, most implementation has been carried out without technical support [24]. Public investment is necessary, as the achieved profitability at this link does not allow adequate investments.
The market value defined which recyclable material the WPs will collect, if they are not hired as Selective Collection service providers by Municipalities. Not all recyclables are recycled. The recycling market is segmented and composed of several stakeholders, with different roles to play and interests. The geographic concentration of the industry reduces the price, makes the commercialization of some materials unfeasible, and often justifies the presence of the middlemen (REC T2). Differentiated production scales, and hence the knowledge and investment needed to manufacture some recycled material, create barriers that prevent certain players from acting in some links of the chain.
The recyclable market is also linked to commodities—thermoplastic resins in the case of plastics and pulp in the case of paper. The prices are tied to international markets, making the prices of recyclables unstable in the domestic market. An oligopolistic market—few buyers and little competition in the Brasilian recyclable market—is worsened by the existence of informality in the ventures as in the case of the plastic recycling industry. Inequality in this market demands regulation with the monitoring of prices and production, definition of a proper tax base and incentive mechanisms, such as public purchases or the obligation to use a minimum percentage of recycled raw materials in some sectors of the economy. This may be particularly important for the recycled paper production chain since Brasil has one of the lowest pulp production costs in the World. Often, the paper industry prefers to use pulp instead recycled paper as feedstock.
Other public programs for promoting recycling seem to be needed. In addition to expanding the Municipal Solid Waste legal recycling indexes, mechanisms must be created to pay the costs of selective collection and waste recycling in a stable manner, seeking alternatives that will lessen or eliminate the seasonality that prevails in the activity. Resources collected through Extended Producer Responsibility and waste gate fees, financial mechanisms defined in Brasilian Waste Policy, should be implemented by Municipalities to cover the costs related to waste recycling, such as the Urban Environmental Services provided by WPs activities. Although WPs are the weakest link, they are responsible for an important stage of the recycling chain.
Finally, if closing the loops of material is the objective, new technologies are needed. Design for Environment and Eco Design are important for producing good quality products and materials that are easier to recycle. ABIPET (Brasilian Association of the PET Industry) has some interesting activities in this direction in Brasil. There is also a need to provide technological services and other benefits linked to an increasing use of recyclables as raw materials.
5. Conclusions
The recyclable market in Brasil may be characterized as a segmented and oligopolistic market with several different social agents, some informal ones, that play different roles in the recyclable value chain. The geographical concentration of the recycling industry, the high costs of transportation and the small profit rates of recyclable materials do not allow the trade of some materials in particular regions. Therefore, the middlemen presence is justified as they play an important role in regulating the market: they are the main source of recyclable feedstock to the industry. Even so, the industry complains about scale, continuity, and quality supply.
The absence of Municipal Selective Collection Programs landfilled most of the Brasilian recyclable material as waste. The precise amount is unknown as the country lacks reliable data on waste generation. There is a common understanding that Waste Pickers are the main social agent responsible for diverting recyclables from landfills. Nonetheless, they carry on working in precarious conditions with difficulties in organizing themselves as social ventures—co-operatives and associations—and to integrate as private providers for the Municipalities Selective Collection Services. However, the majority of material recovery facilities installed in Brazil are operated by WPs.
The WP cooperatives face another setback: they are organized in a social/solidary economy and the recycling value chain is organized on capitalist principles, and to improve the WP integration and recycling results there is a necessity to build strategies and tools to establish this dialogue and relationship in better equality conditions.
A continental sized country such as Brasil has great regional variation in terms of recyclable material prices, which are all linked to commodity prices and to global market variation, as is the case all over the world [35]. On the other hand, Brasilian recyclable material is mainly utilized in the inner market and there is a lack of information and understanding about how the international recycling market works and how to participate in it.
The Brasilian industry demands policies not only to amplify the recyclable diverting conditions from trash, such as the implementation of waste gate fees, but to promote waste recycling, such as tax benefits to induce the plastic and paper industry to use recycled raw material, as special tax regimes and sustainable procurement rules. Besides industry demands, the WP organizations must receive public support for continuous improvement and to avoid less efficient technologies, such as incineration [36].
Acknowledgments
We are grateful for the partnership of MNCR (WP National Movement) and INSEA (Nenuca Institute for Sustainable Development) that collaborated in making contact with the WP cooperatives/associations in all Brasilian regions. We also thank the Bank of Brasil Foundation for financing the field study and the researchers Cinthia Versiani Scott Varella, Larissa Souza Campos and Janaína Macruz, from Núcleo Alter-Nativas de Produção (Alternatives of Production Nucleus) / Engineering School / UFMG (Federal University of Minas Gerais), for data collection and helping with the data analysis.
Author Contributions
Jacqueline Elizabeth Rutkowski conceived, and designed the method and procedures and analysed the data; Jacqueline Elizabeth Rutkowski and Emília Wanda Rutkowski wrote the paper.
Conflicts of Interest
The authors declare no conflict of interest. The founding sponsors had no role in the design of the study; in the collection, analyses, or interpretation of data; in the writing of the manuscript, and in the decision to publish the results.
References
- Destatte, P. Archives de Tag: Economy of Functionality. 2014. Available online: https://phd2050.wordpress.com/tag/economy-of-functionality/ (accessed on 1 March 2017).
- Velis, C.A.; Coronado, M.; Lerpiniere, D. Circular Economy: Closing the Loops; ISWA (International Solid Waste Association): Vienna, Austria, 2015. [Google Scholar]
- ABRELPE, Associação Brasileira de Empresas de Limpeza Pública e Resíduos Especiais. Panorama dos Resíduos Sólidos no Brasil; ABRELPE: São Paulo, Brazil, 2015; p. 92. [Google Scholar]
- IPEA, Instituto de Pesquisa Econômica Aplicada. Plano Nacional de Resíduos Sólidos: Diagnósticos dos Resíduos Urbanos, Agrosilvopastoris e a Questão dos Catadores; Comunicados do IPEA: Brasília, Brazil, 2012; p. 15. [Google Scholar]
- IBGE, Instituto Brasileiro de Geografia e Estatística. Atlas Saneamento/Pesquisa. Nacional de Saneamento Básico—PNSB 2008; IBGE: Rio de Janeiro, Brazil, 2011. [Google Scholar]
- IBGE, Instituto Brasileiro de Geografia e Estatística. Indicadores de Desenvolvimento Sustentável, Brasil; IBGE: Rio de Janeiro, Brazil, 2015. Available online: http://www.ibge.gov.br/home/geociencias/recursosnaturais/ids/default_2015.shtm (accessed on 15 June 2017).
- Valor Econômico. Análise setorial—Resíduos sólidos: Logística Reversa. In Estrutura, Mercado, Perspectivas; Valor Econômico: São Paulo, Brazil, 2011; p. 140. [Google Scholar]
- Rutkowski, J.E.; Rutkowski, E.W. Expanding worldwide urban solid waste recycling : The Brasilian social technology in WPs inclusion. Waste Manag. Res. 2015, 33, 1084–1093. [Google Scholar] [CrossRef] [PubMed]
- BIR (Bureau of International Recycling) Annual Report. 2014. Available online: http://www.bir.org/assets/Documents/publications/Annual-Reports/UK-AR2014-FIN-WEB.pdf (accessed on 20 March 2017).
- Scheinberg, A. Technical Paths for Inclusive Recycling in middle-income countries. In Proceedings of the II ORIS International Seminar, Federal University of Minas Gerais, Belo Horizonte, Brazil, October 2014. [Google Scholar]
- IBA, Indústria Brasileira de Árvores. Relatório de Desempenho do Setor 2014; IBA: São Paulo, Brazil, 2015; p. 80. Available online: http://iba.org/pt/biblioteca-iba/publicacoes / (accessed on 28 August 2017).
- IBGE, Instituto Brasileiro de Geografia e Estatística. Estudos e Pesquisas—Informação Geográfica n° 7, Indicadores de Desenvolvimento Sustentável Brasil 2010; IBGE: Rio de Janeiro, Brazil, 2010; p. 443. [Google Scholar]
- Cooper, J. The dependence of paper recycling on global markets paper. In Proceedings of the ISWA World Congress, Viena, Austria, 7–11 October 2013. [Google Scholar]
- MMA/MCidades. Manual de Coleta Seletiva; MMA/MCidades: Brasília, Brazil, 2008. [Google Scholar]
- Rutkowski, J.E. Sustentabilidade de Empreendimentos Econômicos Solidários: Uma abordagem na Engenharia de Produção. Tese (Doutorado em Engenharia de Produção), COPPE, Universidade Federal do Rio de Janeiro, Rio de Janeiro, Brazil, 2008; p. 239. [Google Scholar]
- Thiollent, M. Pesquisa-Ação nas Organizações; Editora Atlas: São Paulo, Brazil, 1997. [Google Scholar]
- Thiollent, M. Crítica Metodológica, Investigação Social e Enquete Operária; Polis: São Paulo, Brazil, 1981. [Google Scholar]
- Ervasti, I.; Miranda, R.; Kauranen, I. Paper recycling framework, the “Wheel of Fiber”. J. Environ. Manag. 2016, 174, 35–44. [Google Scholar] [CrossRef] [PubMed]
- Eigenheer, E.; Ferreira, J.A.; Adler, R.R. Reciclagem: Mito e Realidade; In-Fólio: Rio de Janeiro, Brazil, 2005. [Google Scholar]
- Bertolini, G. Economie des Déchets; Edition Technip: Paris, France, 2005; p. 178. [Google Scholar]
- CEMPRE. CICLOSOFT 2016. Radiografando a Coleta Seletiva. 2016. Available online: http://cempre.org.br/ciclosoft/id/8 (accessed on 25 June 2017).
- Lima, F.P.A.; Varella, C.V.S.; Oliveira, F.G.; Parreira, G.; Rutkowski, J.E. Tecnologias Sociais da Reciclagem: Efetivando Políticas de Coleta Seletiva com Catadores. In Gerais: Revista Interinstitucional de Psicologia, 4 (2), Ed. Especial; UFMG: Belo Horizonte, Brazil, 2011; pp. 131–146. [Google Scholar]
- ABNT. Recycled paper and board—Recycled fibres content—Specification; NBR 15755:2009; ABNT: São Paulo, Brazil, 2009. [Google Scholar]
- Kaur, A.; Mishra, A.K. Management andRecycling Routes in Plastic Waste Management Framework: A World Prospective. Plast. Polym. Technol. PAPT 2014, 3, 26–30. [Google Scholar]
- Rutkowski, J.E.; Varella, C.V.; Campos, L.; Inácio, J.M. Análise da Cadeia Produtiva dos Materiais Recicláveis no Brasil. In Relatório de Pesquisa; INSTITUTO SUSTENTAR/FBB: Brasília, Brazil, 2013. [Google Scholar]
- IBA, Indústria Brasileira de Árvores. Relatório IBÁ 2017; IBA: São Paulo, Brazil, 2017; p. 80. Available online: http://iba.org/pt/biblioteca-iba/publicacoes (accessed on 28 August 2017).
- ABIPLAST (Brasilian Association of Plastic Industry) Perfil 2014: Brasilian Plastic Processed Industry. 2015. Available online: http://file.abiplast.org.br/download/links/2015/perfil_abiplast_2014_web.pdf (accessed on 26 June 2017).
- PLASTIVIDA (Socioenvironmental Institute of Plastics) Brasil recicla mecanicamente 21% dos Plásticos. 2012. Available online: www.plastivida.org.br/images/releases/Release_091_Reciclagem_Plasticos_.pdf (accessed on 2 January 2014).
- Castelani, L.C. A Cadeia de Reciclagem do Plástico no Brasil: Fragilidades, Potencialidades e Desafios. MScDissertation, Escola Nacional de Saúde Pública Sérgio Arouca, Rio de Janeiro, Brazil, 2014. [Google Scholar]
- Golev, A.; Corder, G. Typology of Options for Metal Recycling: Australia’s Perspective. Resources 2015, 5, 1. [Google Scholar] [CrossRef] [Green Version]
- Quartey, E.T.; Tosefa, H.; Danquah, K.A.B.; Obrsalova, I. Theoretical Framework for Plastic Waste Management in Ghana through Extended Producer Responsibility: Case of Sachet Water Waste. Int. J. Environ. Res. Public Health 2015, 12, 9907–9919. [Google Scholar] [CrossRef] [PubMed]
- Quintas, J.S. Educação no processo de gestão ambiental: Uma proposta de educação ambiental transformadora e emancipatória. In Layrargues, P. P. [coord] Identidades da Educação Ambiental Brasileira; Ministério de Meio Ambiente: Brasília, Brazil, 2004; pp. 113–140. [Google Scholar]
- Stadler, L.; Lin, H. Leveraging Partnerships for Environmental Change: The Interplay between the Partnership Mechanism and the Targeted Stakeholder Group. J. Bus. Ethics 2017. [Google Scholar] [CrossRef]
- Lazarevic, D.A.E.; Buclet, N.; Brandt, N. Plastic waste management in the context of a European recycling society: Comparing results and uncertainties in a life cycle perspective. Resour. Conserv. Recycl. 2010, 55, 246–259. [Google Scholar] [CrossRef]
- Furniss, J. Alternative framings of transnational waste flows: reflections based on the Egypt—China PET plastic trade. Area 2015, 47, 24–30. [Google Scholar] [CrossRef]
- Huysman, S.; Debaveye, S.; Schaubroeck, T.; Meester, S.; De Ardente, F.; Mathieux, F.; Dewulf, J. The recyclability benefit rate of closed-loop and open-loop systems: A case study on plastic recycling in Flanders. Resour. Conserv. Recycl. 2015, 101, 53–60. [Google Scholar] [CrossRef] [Green Version]
Figure 1.
Recyclable waste supply chain.

Figure 2.
Brasilianregions (1—North; 2—Northeast; 3—Centre west; 4—Southeast; 5—South).

Figure 3.
Flowchart of the recycling chain for plastic and paper (Boxes represent: grey—stakeholders; white—production processes; black -material type).
Figure 3.
Flowchart of the recycling chain for plastic and paper (Boxes represent: grey—stakeholders; white—production processes; black -material type).


Table 1.
Annual quantities of recycled material in Brasil (tons).
| Year | Al Can | Paper | Glass | PET | Steel Can | Tetrapak |
|---|---|---|---|---|---|---|
| 1993 | 50,0 | 38,8 | 25,0 | - | 20,0 | - |
| 1994 | 56,0 | 37,5 | 33,0 | 18,8 | 23,0 | - |
| 1995 | 62,8 | 34,6 | 35,0 | 25,4 | 25,0 | - |
| 1996 | 61,3 | 37,1 | 37,0 | 21,0 | 32,0 | - |
| 1997 | 64,0 | 36,3 | 39,0 | 16,2 | 33,0 | - |
| 1998 | 65,2 | 36,6 | 40,0 | 17,9 | 34,0 | - |
| 1999 | 72,9 | 37,9 | 40,0 | 20,4 | 37,0 | 10,0 |
| 2000 | 78,2 | 38,3 | 41,0 | 26,3 | 40,0 | 15,0 |
| 2001 | 85,0 | 41,4 | 42,0 | 32,9 | 45,0 | 15,0 |
| 2002 | 87,0 | 43,9 | 44,0 | 35,0 | 49,5 | 15,0 |
| 2003 | 89,0 | 44,7 | 45,0 | 43,0 | 47,0 | 20,0 |
| 2004 | 95,7 | 45,8 | 45,0 | 47,0 | 45,0 | 22,0 |
| 2005 | 96,2 | 46.9 | 45,0 | 47,0 | 44,0 | 23,0 |
| 2006 | 94,4 | 45,4 | 46,0 | 51,5 | 49,0 | 24,2 |
| 2007 | 96,5 | 43,7 | 47,0 | 53,5 | 49,0 | 25,5 |
| 2008 | 91,5 | 43,7 | 47,0 | 54,8 | 46,5 | 26,6 |
Source: Adapted by the author from [7].
Table 2.
Stakeholders identified in Brasilian Recycling Chain.
| Type | Description | Example | |
|---|---|---|---|
| Enterprises Recoverers of recyclable materials (REC) | recover recyclable from waste | ||
| REC T1 | Collects mixed dry waste from generators (domestic and big ones) and performs the first sorting process, baling and transport | Associations and Cooperatives of WPs (ACs), autonomous WPs, municipal screening units | |
| REC T2 | Buys selected material to commercialize, may also perform a secondary sorting, i.e., a finer material classification | Middlemen, scrap yards | |
| Enterprises Revaluators (REV) of recyclable materials | Intermediary industries transforming the material selected in raw material, many times carry out a new sorting to improve quality of the feedstock | Industries producing pellets/grains and flakes from recycled plastics; Factories producing paper coils to feed the paper packaging industry | |
| Transformer Enterprises (TRANS) of recycled raw material | Industries that manufacture paper and plastic products from raw material produced with revalued material in the form of grains or flakes (plastic) or recovered and reinserted in the original production paper chain | Paper producers (writing paper, napkins and sanitary papers, cardboard, etc.). Diverse kind of industries that produce different plastics products, as cars parts, plastic consumable products, textiles with synthetic fibres, etc. | |
Table 3.
AggregationValue for recyclable PET.
| Sales Price (R$) | RECT1 | RECT2 | |
| Individual WP | WPC | ||
| 0,3 | 1,2 | 1,3 | |
| Rise (%) | - | +400 | +8 |
Table 4.
Average value in Brasil for recycled PP sales price.
| Value and Operations | Social Agents | |||
|---|---|---|---|---|
| REC T1 | REC T2 | REV | TRANSF | |
| sale price (R$) | 0,40 | 0,60 | 2,20 | 7,00 |
| appropriate value (%) | 6 | 3 | 23 | 69 |
| operation | Sorting and bailing | Stocking | Milling and extrusion | Injection |
© 2017 by the authors. Licensee MDPI, Basel, Switzerland. This article is an open access article distributed under the terms and conditions of the Creative Commons Attribution (CC BY) license (http://creativecommons.org/licenses/by/4.0/).
Share and Cite
MDPI and ACS Style
Rutkowski, J.E.; Rutkowski, E.W. Recycling in Brasil: Paper and Plastic Supply Chain. Resources 2017, 6, 43. https://doi.org/10.3390/resources6030043
AMA Style
Rutkowski JE, Rutkowski EW. Recycling in Brasil: Paper and Plastic Supply Chain. Resources. 2017; 6(3):43. https://doi.org/10.3390/resources6030043
Chicago/Turabian StyleRutkowski, Jacqueline Elizabeth, and Emília Wanda Rutkowski. 2017. "Recycling in Brasil: Paper and Plastic Supply Chain" Resources 6, no. 3: 43. https://doi.org/10.3390/resources6030043
Note that from the first issue of 2016, this journal uses article numbers instead of page numbers. See further details here.