A Tool for the Sustainability Assessment of Farms: Selection, Adaptation and Use of Indicators for an Italian Case Study


Department of Health, Animal Science and Food Safety (VESPA), University of Milan, 20133 Milan, Italy
*
Author to whom correspondence should be addressed.
Resources 2017, 6(4), 60; https://doi.org/10.3390/resources6040060
Submission received: 20 September 2017
/
Revised: 20 October 2017
/
Accepted: 20 October 2017
/
Published: 24 October 2017
(This article belongs to the Special Issue Sustainability Indicators for Environment Management)
Abstract
:Indicator-based tools are widely used for the assessment of farm sustainability, but analysts still face methodological and conceptual issues, including data availability, the complexity of the concept of sustainability and the heterogeneity of agricultural systems. This study contributes to this debate through the illustration of a procedure for farm sustainability assessment focussed on the case study of the South Milan Agricultural Park, Italy. The application is based on a set of environmental, social and economic indicators retrieved from the literature review. The framework is based on three main steps: (i) Data collection mainly through interviews with farmers and institutions; (ii) data elaboration through an aggregative structure; and (iii) score analysis. The latter step includes a descriptive analysis that allows a comparison among farms or groups of farms and a principal components analysis that helps to confirm the dimensions in which indicators were previously included (components). Results derived from the sampled farms show that the framework can provide easy-to-read results useful at different levels. The study highlighted the procedures for the framework construction that is compatible with the region’s context and objectives, using an analytical approach that aims at the use of balanced features of availability and reliability of data.
1. Introduction
Since it was first mentioned in the Brundtland report [1] where sustainable development was defined ‘a development that meets the needs of the present without compromising the ability of future generations to meet their own needs’, the term sustainability has been extensively used among the scientific community for explaining and promoting good practice in farming system management [2]. However, numerous researchers have posed relevant questions about its use and objectives [3]; thus, the concept of agricultural sustainability is still considered rather vague [4,5,6].
Despite this lack of agreement, agricultural sustainability assessments usually involve the evaluation of the typical three pillars of sustainability: environment, society and economy [2,7], which are used for the evaluation at different scales, ranging from field and farm to regional, national and even international scales [8,9]. This is a central issue, since different spatial parameters involve the use of different data and therefore obtain different information.
Focusing on the farm level, various researchers have highlighted some technical limitations of this concept, particularly:
- Data collection at the farm level is often carried out through interviews with farmers who could be reluctant to participate in surveys or who may not have the information required [10]. In addition, it is sometimes difficult to verify the accuracy of the information provided by farmers [11,12]. This could be a limiting research factor because of issues of availability and quality of collected data.
Despite these difficulties, over the past 30 years many studies have been proposed and several assessment methods developed, but further efforts are still required for the development of new interpretive methods, especially in regard to the integration into environmental, social and economic policy planning [7]. Nevertheless, achieving a single integrated approach seems to be difficult. The main issues are related to problems of incommensurability between different facets or dimensions of sustainability [16]. On the consequence, research studies tend to include these three pillars, treating them separately and with a different relevance [17]. The environmental pillar is more studied because of the growing sensitivity of the community to ecological issues. On the other hand, the evaluation of economic and social sustainability suffers from a lack of accepted and well-grounded frameworks [18]. From the methodological point of view, according to [5], the existing methods could be categorised by two main interpretative schemes: the goal-prescribing models and the system-describing models. The goal-prescribing models aim to identify techniques that should improve agricultural sustainability. The system-describing model looks at the evaluation of a set of sustainability features of the agricultural activities and aim at identifying strengths and weakness of agricultural systems, helping in decision-making rather than indicating operative solutions [13]. Considering the measurement approaches, researchers have developed different solutions. For instance, multi-attributes, multi-criteria analysis and cost-benefits analysis, fuzzy and rough-set logic, and life cycle assessment represent an incomplete list of possible methods used in sustainability analysis [19,20,21,22,23]. In this sense, it is worth underlining that the literature suggests that efforts should also be focused on combining the different analytical techniques in order to obtain a valid, unique and robust representation of the agricultural sustainability [19,22,23].
Compared to the existing literature, the present study proposes a system-describing assessment that uses the farm/local scale because of the possibility this scale offers for in-depth investigation of the farm environment and economic dynamics. The analytical framework allows to gather the measures of different facets of agricultural sustainability, and to aggregate them in easy-to-read dimensionless indicators. In this sense, the goal of this research was to evaluate farm sustainability by offering an educational tool, named 4Agro, for the assessment of farm sustainability that can be useful for farmers and policy-makers interested in multi-attribute sustainability assessment. On the other hand, a possible flawless of the approach is that it requires specific surveying to collect primary data, generating high costs, relatively small samples and difficulties in repetition over the years.
The survey highlights the procedure for the construction of a farm-level methodology for the support of stakeholders involved in the area of a specific case study [24]. Starting from an analysis of the literature, an indicator-based framework has been created for the evaluation of environmental, social and economic sustainability of farms, with the objective of ranking farms or groups of farms according to different sustainability objectives, in relation to the needs of the local institution of the case study. In this view, the model has the aim of simplifying the readability of the results. In the present paper, results are presented in order to highlight opportunities and limitations of these types of analysis.
The rest of the paper is divided into three further sections. The second section presents the characteristics of the tool, while the third section presents the results obtained from a case study. The final paragraph provides some conclusions and reflections on further developments.
2. Materials and Methods
2.1. Construction of a Framework for Agricultural Sustainability Assessment
Because of the complexity of parameters that describe farm sustainability, their evaluation as a whole could be expensive and complex [25,26]. The use of proxy variables could therefore be useful in estimating the multiple aspects of sustainability. The scientific literature refers to these proxies as indicators, defined as ‘synthetic variables of substitution of other variables that are otherwise difficult to determine’ [27].
According to this concept, this framework proposes an analytical procedure that starts from the farms’ data collection. Depending on their nature, these data are converted by indicators into dimensionless numbers attributed through graduated ranges. Different criteria are applied for different indicators, according to their nature and the sustainability objective they need to evaluate (please refer to Supplement 1 for technical details). As explained in the following sections, the authors chose to use an adapted aggregative structure (Figure 1), which has been already proposed by various studies, such as the IDEA method [28], the SAFA tool [29] and others [10,25,30]. This type of assessment of agricultural sustainability of farms allows analyses at different levels, such as analysis between indicators of the same farms, comparison between farms or groups of farms or score evaluation analysis through temporal comparison.
The method is based on three main steps: Data collection, data elaboration and score analysis.
STEP 1—Data collection. This step involves the collection of the basic information regarding farms. Such information is called “primitive data”, because it is not aggregated and possesses different units of measurements, depending on the characteristic being evaluated.
STEP 2—Data elaboration. The second step involves the elaboration of data through sub-indicators (tools for the conversion of dimensional values into dimensionless indices), indicators (aggregation of sub-indicators for the evaluation of individual sustainability themes, numbered from 1 to 42), components (aggregation of indicators for the evaluation of wider sustainability themes, numbered from ENV_1, SOC_1, ECO_1 to ENV_5, SOC_5, ECO_5) and pillars (aggregation of components into environmental, social and economic pillars). This process involves a four-phase procedure:
- Phase 1: this is a first elaboration of primitive data that allows to obtain processed data containing the basic information for the successive elaborations;
- Phase 2: the calculation of sub-indicators provides integer and dimensionless values of that data for each farm. Values can range from negative to positive, according to their maximum scores;
- Phase 3: the calculation of indicators consists of the sum of two or more sub-indicators. A minimum of 0 and a maximum (variable) score is applied, depending on the case. This way, maximum scores define the best performance in terms of sustainability [31];
- Phase 4: the sum of two or more indicators provides the value of components [0 to 50] and, in turn, each pillar [0 to 250] of sustainability.
At the end of this process, scores of each sub-indicator, indicator, component and pillar are contained into a score database.
STEP 3—Score analysis. The third step involves statistical elaboration of the scores per farms according to the following two different approaches:
- Descriptive analysis: this elaboration aims at the exploration of the main characteristics of the sample by applying descriptive statistics. This approach involves the use of means and standard deviation of scores between subjects and groups of them. Due to their immediacy, this analysis also employs histograms and radar charts in order to represent the dimensions of different attributes controlled;
- Data reduction analysis: indicators used for sustainability assessment may be redundant [13] and/or correlated [30]. In this view, a data reduction approach may help researchers by summarising the information contained in the original database. Furthermore, as the aggregative definition of sustainability components proposed in this framework is subjective, data reduction through Principal Components Analysis (PCA—[32]) can be used to confirm the dimensions obtained by the indicators. In the present paper, this data reduction was applied to each pillar by using the software package IBM SPSS 21.0. The evaluation of the PCA was performed using the Kaiser–Meyer–Olkin (KMO) measure of sampling adequacy, the Bartlett’s test of sphericity and the Kaiser criterion [33].
2.2. Selection of Sustainability Indicators
The selection of sub-indicators, indicators and components derived from a literature review is mainly based on five methodologies: IDEA [28], RISE [34], SAFE [12], SOSTARE [30] and MOTIFS [10]. See [35] for an in-depth analysis of the literature on the sustainability assessment approach at the farm level. Table 1 summarises information on indicators (see Paragraph 3.1 for more details about the source of data). The indicators proposed by these methods were placed into sets of sustainability themes, according to their objectives. Each set was checked for redundancy and, in the case of multiple choices, indicators were selected through parameters of data availability [12], usefulness for users, ease of implementation and understanding, high sensitivity to system variations, connection to the issue they are representing and potentialities of adaptation to different case studies [26]. To establish whether indicators satisfy these features and indeed if data were available and accurate (issue 1 in the Introduction), a pilot test was performed on a reduced group of five farms. The method has educational purposes and its results have not direct effects on both farm and stakeholders choices. Therefore, issues related to the accuracy of data are mainly related to the knowledge of farmers, instead their frankness. Following this process, indicators were tested and, when needed, modified with the objective of reducing the subjectivity of interpretation [36] by finding a match between the needs of researchers and the stakeholders’ interests [37,38]. The final objective was to reduce the indicators to a minimum set of variables able to assess as many themes of sustainability as possible [25] (issue 1 in the Introduction).
Following the same procedure, the weighting of indicators is derived from researchers’ choices based on the knowledge and the requirements of the case study [39]. As highlighted in Section 3.1, the case study used for the construction of the present framework belongs to a delimited area in which the local institution has carried out specific instruments in order to reach specific environmental, social and economic performances of the agricultural activities. Although this assumption is not supported by all authors (e.g., [5]), our decision was based on the fact that indicators cannot be considered equally relevant with reference to agricultural sustainability [28], and some researchers believe that weighting all the indicators in the same way could lead to even worse results [40].
The framework aims at the evaluation of farm sustainability, combining the larger set of farm characteristics (issue 3 in the Introduction) available for the present case study (see Section 3.1). In this view, it seems useful to underline the decision to whether to calculate some indicators not bound to some farm features. Thus, in the present case study, indicators related to the breeding systems (9, 12, 13, 27 and 32) were removed in the case of no-livestock farms. To achieve the same max score of each component (50), the residual indicators were re-balanced.
The following sections describe how the literature review could be used to create a new method focusing on a specific case study. The sections summarise the environmental indicators (from 1 to 18) and components (from ENV_1, to ENV_5), the social indicators (from 19 to 33) and components (from SOC_1 to SOC_5) and the economic indicators (from 34 to 42) and components (from ECO_1 to ECO_5).
2.2.1. Environmental Indicators
Scientific literature on environmental sustainability mainly focuses on the principle of similarity to nature and the preservation of agroecosystems in the long term [41,42]. According to this concept, a farming system is environmentally sustainable if it protects the natural resources provided by the ecosystem, such as biodiversity and water, soil and air quality [43]. Obviously, the safeguarding of agricultural ecosystem services involves limiting the possible adverse impacts of agricultural practices on the preservation of natural resources [44,45].
ENV_1—Diversity. This component aims at the assessment of the degree of plant and animal diversity of a farm. Among the reviewed methods, RISE and MOTIFS only include the rate of animal and vegetal diversity of farm production. On the contrary, SOSTARE and IDEA also evaluate the natural biodiversity of farms, using the evaluation of non-crop vegetation, while SAFE uses criteria pertaining to habitat conservation.
Since an indirect measurement of biodiversity is provided by the following component ENV_2, this component follows the theory proposed by IDEA and MOTIFS, evaluating livestock and plant diversity. Therefore, the component accounts for diversity within farms and within animal and plant species used in each farm (Indicators 1, 2 and 3), with a specific measurement considering the presence of endangered plant varieties and livestock breeds (Indicator 4).
ENV_2—Organisation of spaces. Following the framework proposed by RISE, IDEA and SOSTARE, this component is a proxy for farmers’ choices regarding the use of land, which is linked to the reduction of soil erosion and the proliferation of parasites, improving landscape quality and natural habitat maintenance [46,47,48].
For farms, this regards issues related to crop rotation (Indicator 5), plot size (Indicator 6) and the presence of environmental elements such as hedges, rows, resurgences and water meadows (Indicator 7).
The percentage of farm surface belonging to protected areas (e.g., Natura 2000, national or regional parks) provides an indirect assessment of the environmental and landscape safeguarding (Indicator 8).
Finally, the stoking rate of a farm (Indicator 9) aims at the measurement of its space valorisation and the autonomy in forage production.
ENV_3—Agricultural practices. Obviously, agricultural practices directly affect environmental performances of farms. Concerning the use of fertilisers and agrochemicals, IDEA, MOTIFS and SOSTARE propose an indirect measurement of their effects on the soil, while SAFE and RISE use a direct evaluation of soil quality, proposing an overall evaluation of some chemical and physical soil parameters.
In this research, because of the choice of gaining data primarily from questionnaires, the framework proposes the evaluation of the use of fertilisers (Indicator 10) through the calculation of the nitrogen balance at the farm level (units of N per-Ha of used agricultural area).
Similarly, the use of agrochemical treatments (Indicator 11) and veterinary substances (Indicator 12) is derived from information provided by direct interviews. This component includes an additional evaluation of the presence of effluent treatments, if any (Indicator 13).
ENV_4—Natural resources. This component aims at evaluating the impacts of agronomic operations on soil quality (Indicators 14 and 16) and water use (Indicator 15).
The management of soils and, indirectly, their quality is strictly dependent on farm practices. In this field, due to the primary role of the use of fertilisers and agrochemicals, SAFE and MOTIFS do not provide any additional evaluation. In contrast, in this framework, the procedure follows RISE, IDEA and SOSTARE, which also consider factors that include soil cover, tilled area and farming operations in general.
The management of water resources involves both quality and quantity characteristics: consumption, irrigation systems, chemical and physical parameters. This framework is in line with IDEA, MOTIFS, RISE and SOSTARE, which consider irrigation systems and their use of water, including efficiency, without considering any measurement of the quality of water, which would require direct measurements.
Finally, because the measurement of air quality is relevant at larger spatial levels (regional or higher), the present framework follows the approach adopted by SOSTARE and RISE, avoiding its evaluation.
ENV_5—Energy. Concerning energy management, although the calculation of the amount of energy inputs is a shared evaluation, only MOTIFS and SAFE also provide an evaluation of the use of renewable resources.
In this framework, the total amount of energy input (Indicator 17) is derived from the conversion of fuel, nitrogen, animal feeding, gas and electricity into energy fluxes (Mj/ha), applying similar indicators proposed by IDEA, MOTIFS and SOSTARE.
Furthermore, a second indicator has been added to evaluate the use of renewable resources and systems for energy saving (Indicator 18) [49].
2.2.2. Social Indicators
Despite the growing recognition of the role of agriculture in safeguarding the social heritage of territories, their culture and traditions, the assessment of social sustainability has received less attention than that of environmental and economic sustainability [50,51,52]. This may relate to the fact that the perception of social issues is heterogeneous and causes a lack of conceptual clarity [13]. In addition, the assessment of social sustainability is particularly dependent on the local context and its socio-political goals [17]. Nonetheless, researchers have identified a wide range of social issues in agriculture, mainly represented by the connection between rural area and citizenship [53] and the multifunctional role played by agriculture [54].
SOC_1—Quality. The evaluation of the quality of farm’s food products (Indicator 19) takes into account the Protected Denomination of Origin (PDO) and the organic products as important means that contribute to a higher social acceptance of agriculture and its production systems [55]. Due to the data requirement, this framework does not consider the measurement of the intrinsic quality of products, as proposed by SAFE, which, on the contrary, includes issues related to their safety, security and diversification.
The evaluation of the quality of the landscape involves both ecological and social topics. The methodologies IDEA, SAFE and MOTIFS put these evaluations in the social pillar because of the positive or negative externalities in the social acceptance of farming in rural areas, while SOSTARE, which does not include any social evaluation, provides similar indicators that are otherwise categorised within the environmental pillar.
In this framework, the functional and aesthetic roles of rural buildings (Indicator 20) and the farm landscape (Indicator 21) have been included into the social pillar because of positive or negative social externalities for the rural areas [51].
SOC_2—Short supply chain and related activities. Among the most important roles recognised by consumers of farmers is the participation in short food supply chains [56], which allows tradition to be maintained [57] and to support the local economies and trust producers [58,59]. Because of that, these activities are depicted by RISE and IDEA as relevant factors pertaining to the social inclusion of farms.
Thus, this component aims at the assessment of farms’ short chain systems such as direct sales, online sales, ethical purchasing groups, farmers’ markets, restaurants, shops and canteens (Indicator 22) and the presence of activities related to agro-tourism and educational activities organised by farmers (Indicator 23), following the approach proposed by IDEA.
SOC_3—Work. All the reviewed methods, except SOSTARE, provide an assessment of work conditions. This topic involves both external and internal factors that include the quality of life of family and non-family labours (SAFE and IDEA), the equality of retribution (RISE), the professional pride of farmers (MOTIFS) and innovation through training and research (IDEA).
The indicator 24 proposes a framework for the evaluation of the employment in agricultural activities as a relevant indicator for the social development of rural areas, where the level of employment has fallen considerably in the last decades [47,60,61].
Demographic characteristics of workers such as their nationality provenience, age and gender (Indicator 25) and their training level (Indicator 26) should also be considered as a key aspect for the growth of the agricultural sector [62].
SOC_4—Ethical and social developments. Among the most important ethical issues related to agricultural activities, animal welfare is today a primary concern of society [63]. Thus, IDEA and MOTIFS fit the assessment of animal welfare in the social pillar because of its ethical value [64]. Nevertheless, these issues also involve ecological themes; because of that, subsequent updates of RISE will include it in the environmental pillar [34], following SAFA guidelines.
In the present framework, we decided to include this assessment into the social pillar because of its social relevance for the objectives of the institution of the case study. Due to the complexity of these issues, the use of a single approach to evaluate different types of livestock is difficult. Therefore, this framework proposes the new Indicator 27, which is based on a diversified evaluation in relation to the most important livestock of the farm (cattle, pigs, poultry, sheep/goats) through the calculation of livestock units (LSU).
Finally, human development is measured by farmers’ attitudes towards participation to association of producers (Indicator 28) and supply chain cooperation (Indicator 29) as relevant attributes for the innovation of agricultural systems and human development in rural areas [28].
SOC_5—Culture and education. Some ecological (Indicator 30) and cultural aspects (Indicator 31) also indicate the social responsibility of farmers [12]. In this sense, the autonomy in feed, fertilisers, water, seed provision (Indicator 32) characterises the resilience degree of a farm in different economic, environmental and social changes [28]. In addition, the workers’ education levels provide an important parameter (Indicator 33) for the social growth of agricultural areas [12].
2.2.3. Economic Indicators
The economic sustainability of agricultural activities is considered a basic constraint for the survival of farm systems over time [65]. In recent decades, this aspect has become more relevant because of the reduction of public support to agriculture and the intensification of global trade for agricultural commodities. Consequently, farmers are facing increasingly difficult decisions for improving the levels of competitiveness and profitability of the traditional agricultural production [66].
ECO_1—Economic viability. The measurement of the economic state of a farm through the evaluation of its most relevant economic parameters has a primary role.
This component takes into account the Value of Production (VP) (Indicator 34), i.e., the amount of the value of goods and services produced by a farm during a year, and the Added Value (Indicator 35), i.e., the increase in value generated from the production process to the value of intermediate consumption. According to SOSTARE and MOTIFS, the value of production is measured in relation to the used agricultural area, while the value added is measured in relation to the agricultural working unit.
ECO_2—Persistence. Especially if the farm is small or medium-sized, the amount of income derived from the family’s workforce acquires more importance. This may have an impact on its ability to endure over time thanks to the continuity of family work.
The selected Indicator 36 is derived from the framework proposed by SOSTARE through the calculation of the amount of the household income through the ratio between Earnings before Interest, Taxes, Depreciation and Amortization (EBTDA) and VP.
Similarly, Indicator 37 is based on the ratio between the sum of EBITDA and the income derived from public subsidies of the Common Agricultural Policy (CAP) and Family Working Unit (FWU) [28].
ECO_3—Independence. The economic autonomy of a farm has important reflection on its capacity to introduce innovation and create new workplaces [67]. Firstly, with the reduction of public founding for agriculture in Europe, dependency on public support is a crucial issue [30]. The methodologies IDEA, SAFE and SOSTARE consider this attitude through the evaluation of the relevance of CAP aid on the economic performances of farms.
In this sense, this component evaluates the economic incidence of the public subsides over farm income (Indicator 38) and proposes a further indicator for the evaluation of financial autonomy of the farm, accounting for the total amount of contracted loans (Indicator 39).
ECO_4—Diversification. The dynamic character of a farm can be measured by its capacity to be resilient following quick changes in the market. In this case, diversification of farm activities, products and services (IDEA and SOSTARE) could play an important role in the competitiveness of a farm [58], because the more specialised the farm, the more exposed it is to financial risks [28].
In the present framework, this component provides the evaluation of the number and relative importance of products and services sold by the farm (Indicator 40) and its business portfolio (Indicator 41).
ECO_5—Multifunctionality. Following the concept of diversification, a farm’s resilience to economic volatility also depends on its multifunctional features.
3. Results and Discussion
3.1. Data Collection
The survey was carried out in the region of the South Milan Agricultural Park (Parco Agricolo Sud Milano, PASM, Figure 2). The park is located on the Po plain (Northern Italy) and involves around 40,000 hectares of the peri-urban area of the city of Milan. Although most of the farms have an intensive production system, they are characterised by a wide range of land, livestock and economic dimensions [51]. The most representative crops are maize, rice and grassland, while the main livestock are cattle, poultry and pigs [54].
This research involved a set of 50 farms (Table 2). This sample does not aim at being a subset of the whole set of farms (about 1000), but rather was created with the objective of assessing farms with as many different characteristics as possible. In this way, an initial dataset containing all existing farms (1012 according to the SIARL (Lombardy Agricultural Information System) database in 2014) was created beforehand and subsequently, several sub-sets were created considering the farm size, the type and the main production, the geographical location, the economic size and the related activities. Farms were placed into homogeneous pools according to their characteristics. Within each of these sets, the final group of the sampled farms was created taking into account also the willingness of farmers to respond to interviews and to provide some administrative information. The collection of farm data started from the already available sources (the SIARL database and other PASM’s projects), while the remaining data were retrieved through interviews with farm owners via questionnaires.
3.2. Score Analysis
3.2.1. Descriptive Analysis
Table 3 provides the descriptive indicator statistics, components and pillars for the whole sample of farms. Because indicators could involve different a range of scores depending on their weight, in order to help readers, the means were coupled with a percentage expressing the relative value over the maximum boundary.
The architecture of the model allows the user to perform a detailed analysis of the different aggregation levels, depending on the objective of the survey.
For a visual representation of results, the use of radar charts is particularly useful when the study aims at the comparison among farms or is carried out on the same farm for different years of analysis [27,39]. To offer some examples of possible applications, in Figure 3, farms are compared among homogeneous groups. This approach, which has also been applied in other similar studies (e.g., IDEA, RISE, SOSTARE and MOTIFS), is particularly useful at the educational level and for promotional purposes.
Results of comparison between average scores of 41 conventional farms and nine organic farms are shown in Figure 3a. According to [30], organic farms achieved higher scores in any environmental component, with exception of the ENV_5—Energy (11.1 vs. 9.7), probably because a larger size of farms has a positive impact on its energy efficiency. Similarly, higher scores of the organic farms in the components SOC_1—Quality of the products and the territory (37.7 vs. 18.6), SOC_2—Short supply chain and the related activities (29.0 vs. 14.0) and SOC_3—Work (30.9 vs. 21.8) are a direct consequence of their higher attitude in regard to multifunctionality. These aspects also involve the components SOC_4—Ethic and human development (27.4 vs. 17.8) and SOC_5—Society, culture and ecology (33.2 vs. 23.8), as confirmation of the higher level of culture, education and training required for the practice of organic production. On the contrary, the organic attribute does not seem to lead to better economic performances since the ECO_1, ECO_2 and ECO_3 components of conventional farms achieved higher scores.
Similarly, the average scores of 35 multifunctional farms were higher when compared to the 15 non-multifunctional farms (Figure 3b). These results are probably due to their direct contact with consumers [70], which does not seem to influence the economic components. From an environmental point of view, multifunctional farms achieved higher scores only in the first two components (18.7 vs. 12.2 in the Diversity component and 18.1 vs. 15.1 in the Organisation of spaces component). This probably means that the multifunctional attribute does not lead to a better use of inputs (fertilisers, agrochemical, energy, etc.), but it reflects on the quality of the landscape and the environment.
In Figure 3c, the SO (SO: Standard Output. It is a monetary measure (€) that gives a value of the economic size of farms.) parameter enables the classification of farms on the base of their economic size. In line with the findings of [47,62], the framework has shown higher economic performances of farms with a higher value of SO. This is probably due to the existence of economies of scale in agricultural productions [71] but, according to [72], it has only some reflection in the environmental and social components (SOC_3—Work particularly).
Since the SO values are strictly correlated to the farm size, similar results were observed in the analysis of the land size (Figure 3d).
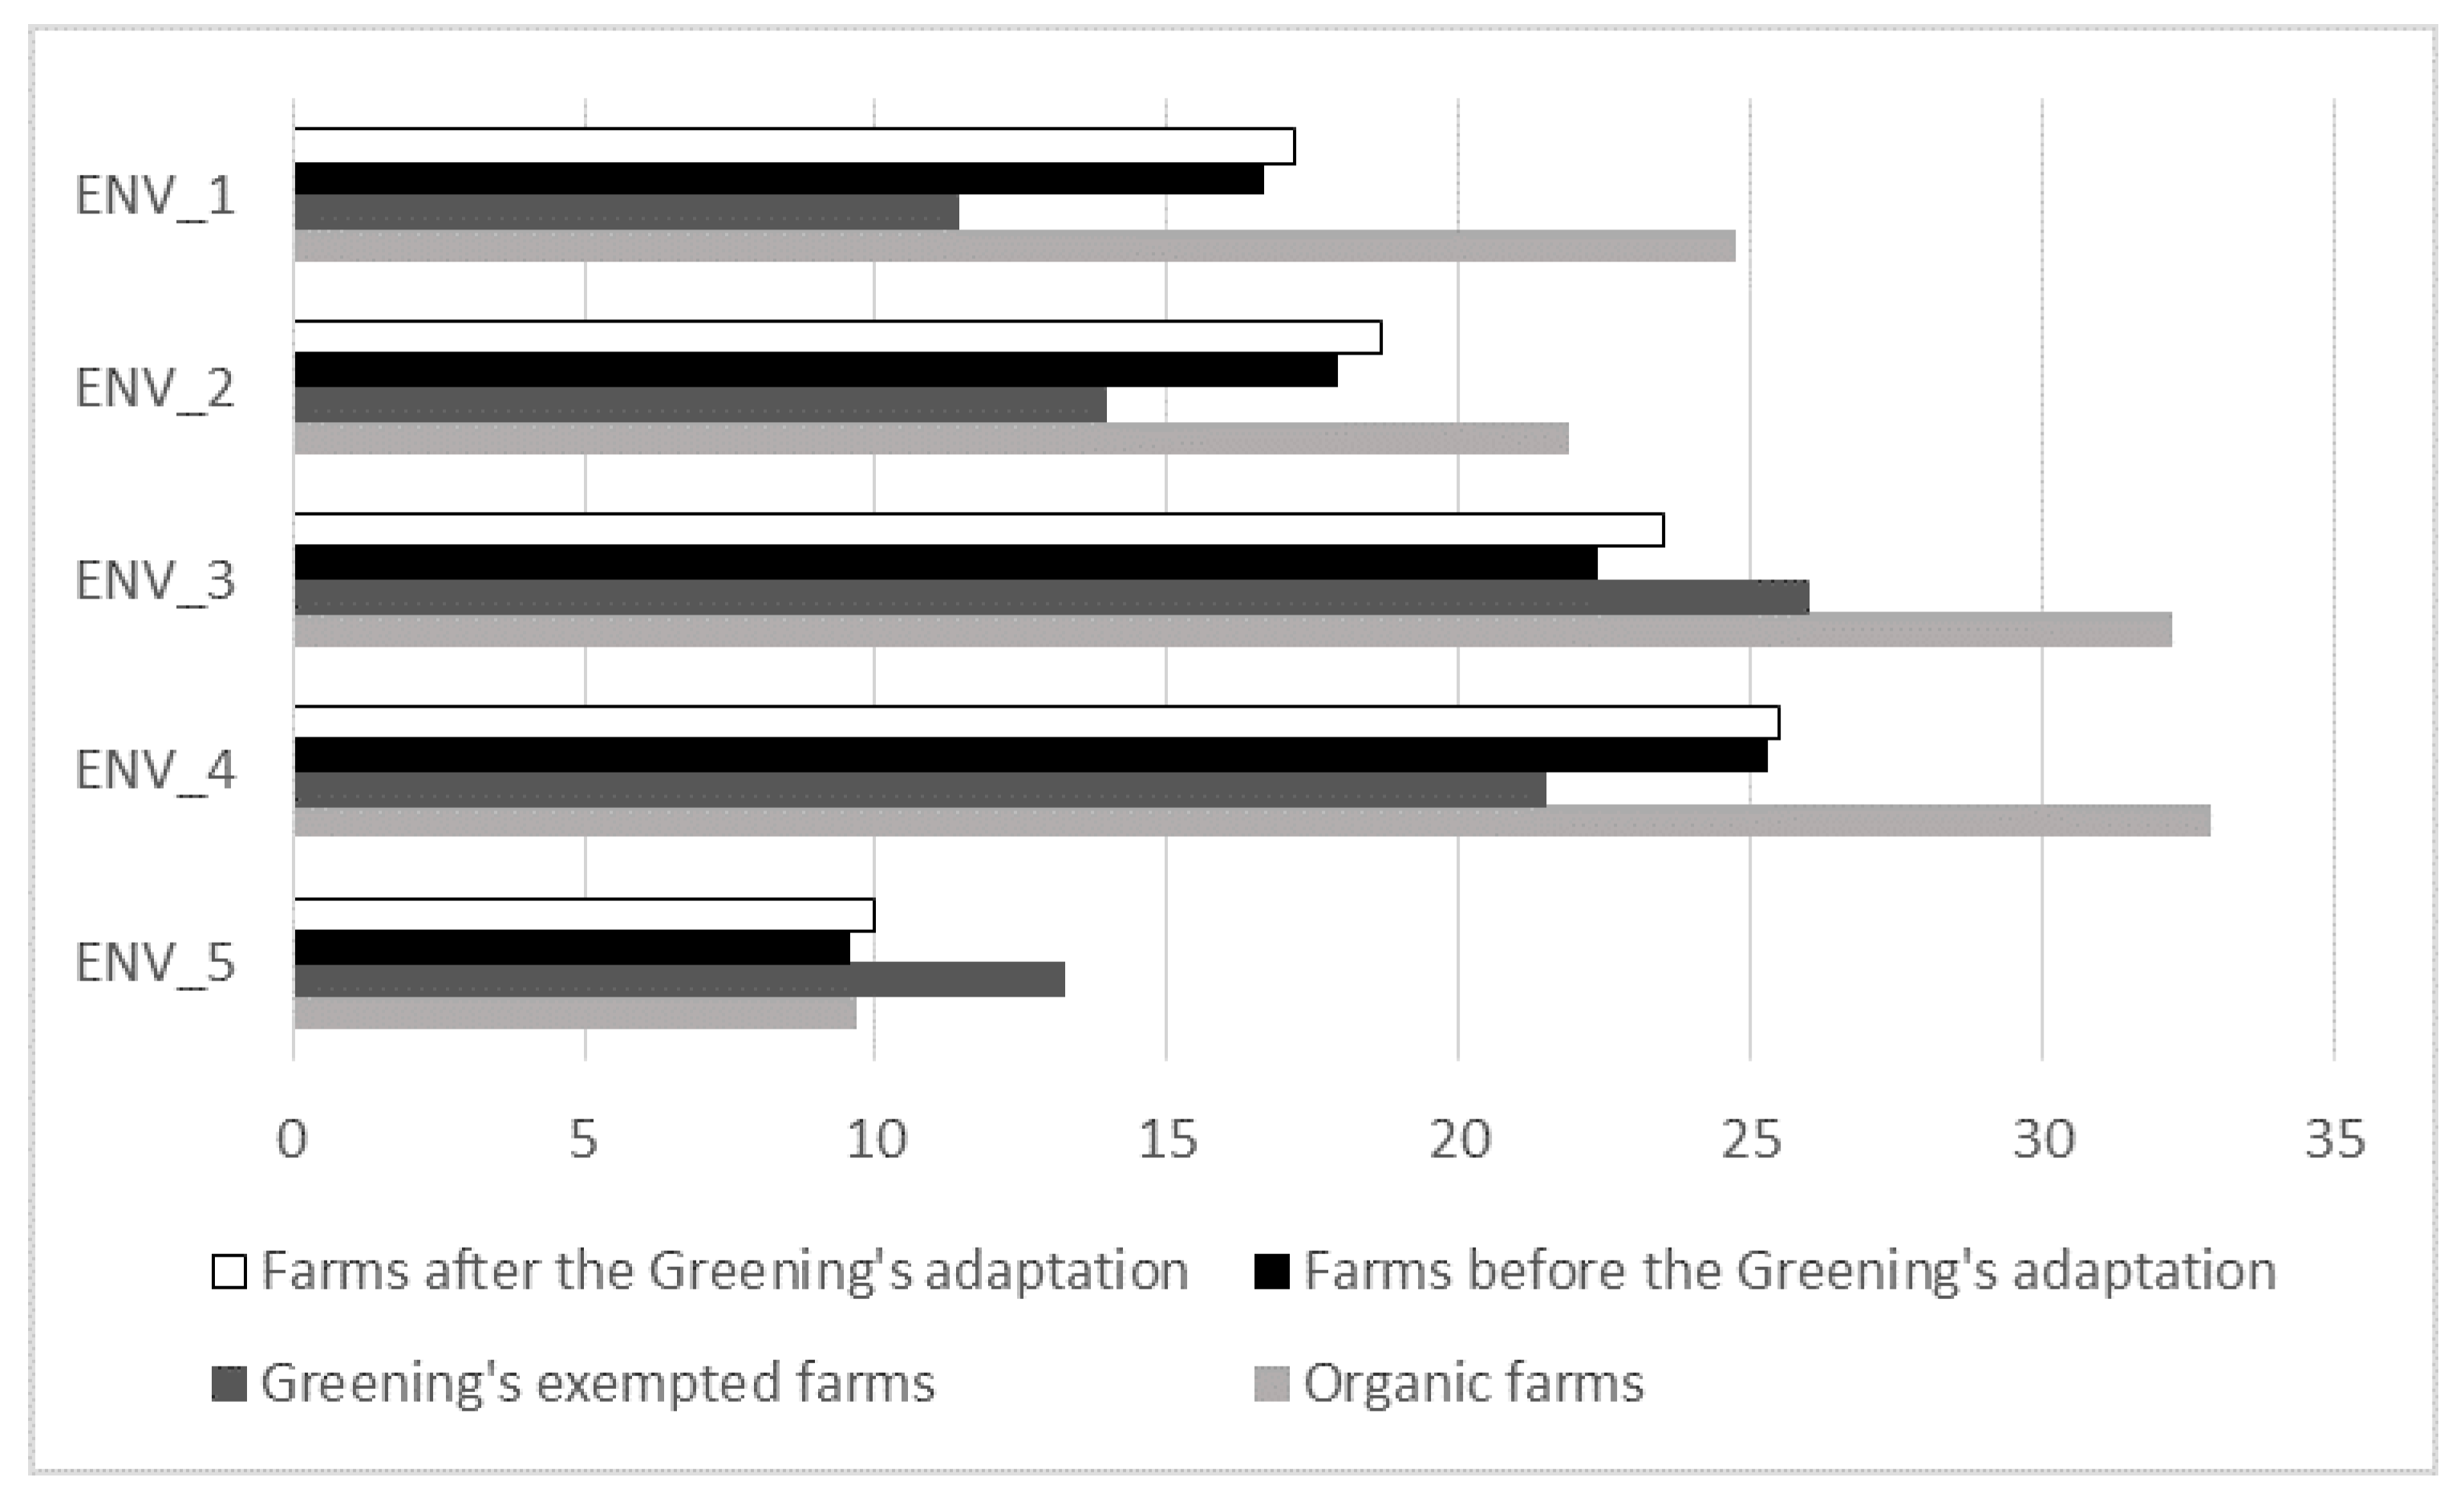
This representation of results mainly has an educational function. Nevertheless, when the comparison is carried out on the same set of farms for different years, these types of assessment may provide a way to verify the capacity of policies (especially locals) to improve the sustainability of the area. The present research has been conducted on a single year of analysis; thereby, in order to show a possible approach for the comparison of different scenarios, Figure 4 presents the hypothetical effects of the process of Greening on environmental sustainability [12], since our data refers to the year 2013, during which Greening was not yet approved by the EU Parliament. This was done in order to adapt the farms to the two main Greening constrains: the crop diversification (EU Council Regulation 1307/2013, article 44) and the Ecological Focus Areas (EFA, EU Council Regulation 1307/2013, article 46). Therefore, seven environmental indicators (1, 2, 5, 6, 7, 14 and 17) have been recalculated. The analysis has been carried out on the average scores of the 23 farms that are affected by the new CAP 2014–2020, which are presented by two profiles, from “Farms before Greening adaptation” to “Farms after Greening adaptation”. This way, the environmental profiles of these farms have been modified in order to reach compatibility on Greening through the simplest way (introduction of new nitrogen-fixing crops tackers and the increase of buffer strips). Figure 4 shows the comparisons of results among these farms and the farms that, on the contrary, do not need any adaptation: the organic farms (9), the rice farms and farms with less than 10 ha of arable surface (18) (Greening exempted farms). Results show an overall improvement in the scores of farms that are required to adapt to Greening. However, it is interesting to note that in three out of five components, farms that are exempted from the Greening reach significantly lower scores than other farms, even before the adaptation to the Greening by the other farms. This means that, for the present sample of farms, the constraints imposed by the Greening have a significant effect on the sustainability of farms, but not on those that needed more improvements.
3.2.2. Data Reduction Analysis
A Principal Components Analysis (PCA—[32]) was carried out on the mean scores of the 50 farms in the indicators composing each pillar, considering the components belonging to different pillars as different by nature. The indicators related to livestock management (9, 12, 13, 27, 32) have not been included in this analysis because it was necessary to compare livestock and non-livestock farms. Components were extracted and rotated using the Varimax method in order to facilitate the interpretation. Furthermore, we considered all the variables that scored more than 0.500 as being relevant for the definition of a component.
Environmental pillar. Starting with 15 variables, the cumulative percentage of variance of the first five components accounted for a total of 67.52% of the overall variance (Table 4). The first principal component (21.29%) associated indicators 2—Tree crops diversity (0.811), 5—Crop rotation (0.794), 1—Annual crop diversity (0.681), 11—Pesticides (0.600) and 7—Ecological buffer zones (0.577). These five variables characterised this component with the attribute of diversity. In fact, the higher values of variables that characterise this component was obtained by organic and multifunctional farms, while conventional farms were poorly represented. The second principal component accounted for 15.78% of the total variance. It opposed indicators 10—Fertilisation (−0.775) and 17—Energy dependence (−0.815) to indicators 3—Animal diversity (0.688) and 16—Organic matter management (0.591). In this case, livestock farms achieved higher scores due to their higher performances in the animal diversity indicator and the higher use of organic fertilisation. Consequently, these four variables characterised the component of the attributes of livestock management represented. The other three components were difficult to identify because they were poorly characterised by well-defined attributes. The third component (11.91%) opposed indicators 15—Water resource management (0.666) to Indicator 8—Environmental and landscape safeguard (−0.720). The fourth component (9.59%) opposed Indicator 6—Plot management (0.656) to Indicator 18—Renewable energy (−0.767). The fifth component (8.95%) opposed Indicator 4—Safeguard of the genetic diversity to Indicator 14—Soil management (−0.817).
Social pillar. The PCA carried out on the 13 variables of the social pillar (Table 5) accounted for 74.49% of the overall variance. The first principal component (21.38%) associated indicators 31—Accessibility to the farm spaces (0.836), 23—Related activities (0.773), 28—Associations and social implications (0.658), 26—Training (0.605). This variable underlined the typical characteristics of multifunctionality, by which the social contributions of the farm-related activities are associated to the needs of providing skilled jobs. The second component (18.91%) was defined by indicators 25—Sustainability of employment (0.797), 19—Quality of the products (0.769), 30—Waste management (0.712) and 33—Education (0.673). In this case, the higher scores reached by farms that produce certified products (in particular organic) contributed to the definition of the component with the attribute of high quality products. The third principal component (13.38%) associated indicators 24—Work (0.904) and 22—Short food supply chain (0.601). The component is characterised by farms with a high rate of multifunctionality and short sale channels, such as direct sale and other related activities, which also means a higher need of workforce in relation to the farm’s land size. Therefore, it could be defined by the attribute of Short chain. The fourth component (12.29%) associated Indicator 29—Cooperation (0.851) to Indicator 22—Short food supply chain (0.548) and acquires the definition of association and cooperation. The fifth is a residual component (8.53%) defined by Indicator 2—Rural buildings (0.807).
Economic pillar. The PCA carried out on the nine variables of the economic pillar was characterised by three principal components (Table 6) that accounted for a total of 73.18% of the overall variance. The first component (36.78%) associated indicators 35—Value added (0.951), 37—Income per family worker (0.936), 34—Value of the production (0.905) and 36—Farm ability to generate income (0.742). This component clearly represents the economic value of profitability. The second component (20.68%) associated indicators 4—Farm business diversification (0.907), 42—Multifunctionality (0.760) and 40—Diversification of the production (0.650), which attributes to this component the typical features of diversification. Finally, the third component (16.73%) opposed Indicator 38—CAP Independence (0.680) to Indicator 39—Autonomy (−0.824), which has also led to renaming this component Financial autonomy. This is an interesting result and underlines that in our sample, there is an indirect relation between attribute of autonomy and independence from the CAP subsidies.
This statistical analysis showed a high variability within farms regarding sustainability and, in many cases, systems belonging to different categories exhibited similar strengths and weaknesses, while comparable farms sometimes showing opposite results. This is probably due to a high heterogeneity of the sample under analysis.
Results derived from the PCA showed that the economic pillar was described by three components, while the environmental and social ones were characterised by five components. This is due to fact that there is more correlation within economic indicators than within environmental and social indicators. This also suggests that the use of such a reduction technique as a complementary approach to descriptive statistics is suited for the understanding of the underling phenomenon. In fact, when multiple variables are used to measure an object, there are two potential outcomes: most of the variables are correlated or some subset of the original variables may show some correlation patterns. This case is most common in agricultural sustainability studies where the correlations of the variables are unknown; when this situation occurs, PCA is normally used to explore the correlation patterns within the original set.
In addition, the principal components do not fully recover the indicators associated into categories (components) that were considered a priori. Moreover, only 1 out of 37 indicators was not relevant in the 13 components derived from the PCA. Nevertheless, this demonstrates that the majority of the initial indicators and components were important to describe the observed variability among farms and that they were not redundant. This could be interpreted as an important sign of sensitivity of the framework, able to assign values of sustainability in relation to the real value of a farm, not following its descriptive information such as the type or production, the land size, etc.
This statistical approach was aimed at providing a way to reduce data necessary for the analysis and, consequently, the number of questions to farmers. This approach could be more useful in case of enlargement of the survey to a larger set of farms of the same area. In this case, it seems appropriate to underline that the results of this data reduction approach depend on the heterogeneity of characteristics of farms of the case study and, consequently, on the quality of the sampling process. Consequently, since the simplification process is dependent on the case study, an in-depth analysis should be considered. In this case, a valid way to check the significance of the statistical approach could be the test of the tool on a different set of farms.
4. Conclusions
The present paper proposed an approach to the evaluation of farm sustainability.
The survey has shown that approaches of farm ranking could provide information at the educational level. Nevertheless, the research highlighted their usefulness also at the institutional level to establish the effect of policies on sustainability. In this sense, it might be interesting to use these tools to evaluate the effects of environmental, social and economic measures provided by policy makers on the performances of farm sustainability over time.
From the methodological point of view, the survey highlighted the procedures for the construction of this framework highly compatible to the context and objectives of a circumscribed region. In this view, the tool was tested on different farms belonging to the area of the PASM.
The method proposed here has also allowed the use of the same approach for different farming systems, using a framework of indicators for the evaluation of the wider range of environmental, social and economic sustainability of farms. Nevertheless, some adaptations and compromises were necessary in order to fit the framework into the characteristics of the farms of the case study [34], which depends on the heterogeneity of the sample. These procedures mainly involved operations on the farms’ databases and a re-balance of indicators.
As already stated by previous surveys [10,30], even in this case study, the goal of obtaining accurate farm data was a primary task that outlined the problems of availability and sensitivity of the gathering of information. Considering as mandatory the choice of data sources that, in this study, were mainly provided by interviews and questionnaires, an analytical approach was here proposed in order to reduce the amount of data need for the elaboration. The main objective was to reach an ideal balancing between quality and quantity of information and its cost. Nevertheless, the approach of data reduction proposed in this study was based purely on statistics and no other indication has been taken into account, such as the time and cost of obtaining information or the willingness of the farmers to be interviewed and provide farm data [60]. These parameters are, however, difficult to implement in an analytical framework, and their relevance is very subjective since it highly depends on the case study.
Finally, given that the farmers’ interest in sustainability can vary significantly [37,73], these types of assessment often suffer because of a lack of interest from farmers. Because of that, an appropriate solution could be to find a way to use the data necessary for the calculation of indicators to provide more concrete information at the farm level [37]. To reach this goal, the method proposed here is now implemented into an online application, called 4Agro (available on http://fouragro.iambientale.it/ and, soon, http://www.cittametropolitana.mi.it/parco_agricolo_sud_milano/) by which each farm of the PASM can perform a self-evaluation of its performance, starting from data already contained into the SIARL database. On the consequence, the application is able to perform a quick evaluation of farms (from 30 min to 1.5 h) applying the method described in this paper. Besides the values of indicators, 4Agro is able to link the sustainability assessment with the more practical information useful for farmers, such as the Common Agricultural Policy payments, the Rural Development Plan, local trademarks, etc.
Supplementary Materials
The following are available online at www.mdpi.com/2079-9276/6/4/60/s1, Supplement 1: Technical details.
Acknowledgments
This work was supported by Città Metropolitana di Milano, Parco Agricolo Sud Milano, Fondazione Cariplo.
Author Contributions
This paper is the result of the contribution between all authors. However, Eugenio Demartini edited the “Introduction” and the “Economic indicators” sections; Mattia Bertocchi edited the “Construction of a framework for the agricultural sustainability assessment”, “Environmental indicators”, “Data collection” and the “Data reduction analysis” sections; while Anna Gaviglio edited the “Selection of sustainability indicators”, “Social indicators” and the “Descriptive analysis” sections. The “Conclusions” should finally be attributed to all authors.
Conflicts of Interest
The authors declare no conflict of interest. The founding sponsors had no role in the design of the study; in the collection, analyses, or interpretation of data; in the writing of the manuscript, and in the decision to publish the results.
References
- WCED (World Commission on Environment and Development). Our Common Future; Oxford University Press: Oxford, UK, 1987. [Google Scholar]
- Pope, J.; Annandale, D.; Morrison-Saunders, A. Conceptualising sustainability assessment. Environ. Impact Assess. Rev. 2004, 24, 595–616. [Google Scholar] [CrossRef]
- Díez, E.; McIntosh, B. A review of the factors which influence the use and usefulness of information systems. Environ. Model. Softw. 2009, 24, 588–602. [Google Scholar] [CrossRef]
- Bond, A.J.; Morrison-Saunders, A. Sustainability Assessment: Pluralism, Practice and Progress; Routledge: Oxfordshire, UK, 2013. [Google Scholar]
- Hansen, J.W. Is agricultural sustainability a useful concept? Agric. Syst. 1996, 50, 117–143. [Google Scholar] [CrossRef]
- Weaver, P.M.; Rotmans, J. Integrated sustainability assessment: What is it, why do it and how? Int. J. Innov. Sustain. Dev. 2006, 1, 284–303. [Google Scholar] [CrossRef]
- Gómez-Limón, J.A.; Sanchez-Fernandez, G. Empirical evaluation of agricultural sustainability using composite indicators. Ecol. Econ. 2010, 69, 1062–1075. [Google Scholar] [CrossRef]
- Binder, C.R.; Feola, G.; Steinberger, J.K. Considering the normative, systemic and procedural dimension in indicator-based sustainability assessment in agriculture. Environ. Impact Assess. Rev. 2010, 30, 71–81. [Google Scholar] [CrossRef]
- Smith, C.S.; McDonald, G.T. Assessing the sustainability of agriculture at the planning stage. J. Environ. Manag. 1998, 52, 15–37. [Google Scholar] [CrossRef]
- Meul, M.; Van Passel, S.; Nevens, F.; Dessein, J.; Rogge, E.; Mulier, A.; Van Hauwermeiren, A. MOTIFS: A monitoring tool for the integrated farm sustainability. Agron. Sustain. Dev. 2008, 28, 321–332. [Google Scholar] [CrossRef]
- Freebairn, D.M.; King, C.A. Reflections on collectively working toward sustainability: Indicators for indicators! Aust. J. Exp. Agric. 2003, 43, 223–238. [Google Scholar] [CrossRef]
- Van Cauwenbergh, N.; Biala, K.; Bielders, C.; Brouckaert, V.; Franchois, L.; Garcia Cidad, V.; Hermy, M.; Mathijs, E.; Muys, B.; Reijnders, J.; et al. SAFE-A hierarchical framework for assessing the sustainability of agricultural systems. Agric. Ecosyst. Environ. 2007, 120, 229–242. [Google Scholar] [CrossRef]
- Demartini, E.; Gaviglio, A.; Bertoni, D. Integrating agricultural sustainability into policy planning: A geo-referenced framework based on Rough Set theory. Environ. Sci. Policy 2015, 54, 226–239. [Google Scholar] [CrossRef]
- Omann, I.; Spangenberg, J.H. Assessing social sustainability. The social dimension of sustainability in a socio-economic Scenario. In Proceedings of the 7th Biennial Conference of the International Society for Ecological Economics, Sousse, Tunisia, 6–9 March 2002. [Google Scholar]
- Smith, B.; Smithers, J. Sustainable agriculture: Interpretations, analyses and prospects. Can. J. Reg. Sci. 1993, 16, 499–524. [Google Scholar]
- Rigby, D.; Woodhouse, P.; Young, T.; Burton, M. Constructing a farm level indicator of sustainable agricultural practice. Ecol. Econ. 2001, 39, 463–478. [Google Scholar] [CrossRef]
- Singh, R.K.; Murty, H.R.; Gupta, S.K.; Dikshit, A.K. An overview of sustainability assessment methodologies. Ecol. Ind. 2009, 9, 189–212. [Google Scholar] [CrossRef]
- Chatzinikolaou, P.; Manos, B. Review of Existing Methodologies and Tools for Measuring Sustainability in Rural Areas. 2012. Available online: http://www.feem-project.net/belpasso_2012/files/studpapers/Paper_Chatzinikolaou.pdf (accessed on 8 September 2012).
- Nijkamp, P.; Vreeker, R. Sustainability assessment of development scenarios: Methodology and application to Thailand. Ecol. Econ. 2000, 33, 7–27. [Google Scholar] [CrossRef]
- Munda, G. Multiple criteria decision analysis and sustainable development. In Multiple Criteria Decision Analysis. State of the Art Surveys; Figueira, J., Greco, S., Ehrgot, M.M., Eds.; Springer: New York, NY, USA, 2005; pp. 953–986. [Google Scholar]
- Hák, T.; Moldan, B.; Lyon Dahl, A. Sustainability Indicators: A Scientific Assessment; Island Press: Washington, DC, USA, 2007. [Google Scholar]
- Gitau, T.; Gitau, M.W.; Waltner-Toews, D. Integrated Assessment of Health and Sustainability of Agroecosystems; Taylor and Francis: Oxfordshire, UK, 2009. [Google Scholar]
- De Luca, A.I.; Iofrida, N.; Leskinen, P.; Stillitano, T.; Falcone, G.; Strano, A.; Gulisano, G. Life cycle tools combined with multi-criteria and participatory methods for agricultural sustainability: Insights from a systematic and critical review. Sci. Total Environ. 2017, 595, 352–370. [Google Scholar] [CrossRef] [PubMed]
- Leeuwis, C. Communication for Rural Innovation, Rethinking Agricultural Extension; Blackwell Publishing: Oxford, UK, 2004. [Google Scholar]
- Bélanger, V.; Vanasse, A.; Parent, D.; Allard, G.; Pellerin, D. Development of agri-environmental indicators to assess dairy farm sustainability in Quebec. East. Can. Ecol. Ind. 2012, 23, 421–430. [Google Scholar] [CrossRef]
- Girardin, P.; Bockstaller, C.; van der Werf, H.M.G. Indicators: Tools to evaluate the environmental impacts of farming systems. J. Sustain. Agric. 1999, 13, 5–21. [Google Scholar] [CrossRef]
- Bockstaller, C.; Girardin, P.; Van der Werf, H.M.G. Use of agro-ecological indicators for the evaluation of farming systems. Eur. J. Agron. 1997, 7, 261–270. [Google Scholar] [CrossRef]
- Zahm, F.; Viaux, P.; Girardin, P.; Vilain, L.; Mouchet, C. Assessing farm sustainability with the IDEA method—From the concept of farm sustainability to case studies on French farms. Sustain. Dev. 2008, 16, 271–281. [Google Scholar] [CrossRef]
- Food and Agriculture Organization of the United Nation (FAO). Sustainability Assessment in Food and Agriculture Systems (SAFA). 2013. Available online: http://www.fao.org/nr/sustainability/sustainability-assessments-safa/en/ (accessed on 18 October 2013).
- Paracchini, M.L.; Bulgheroni, C.; Borreani, G.; Tabacco, E.; Banterle, A.; Bertoni, D.; Rossi, G.; Parolo, G.; Origgi, R.; De Paola, C. A diagnostic system to assess sustainability at a farm level: The SOSTARE model. Agric. Syst. 2015, 133, 35–53. [Google Scholar] [CrossRef]
- Mitchell, G.; May, A.; McDonald, A. PICABUE: A methodological framework for the development of indicators of sustainable development. Int. J. Sustain. Dev. World Ecol. 1995, 2, 104–123. [Google Scholar] [CrossRef]
- Jolliffe, I.T. Principal Component Analysis; John Wiley and Sons: Hoboken, NJ, USA, 2005. [Google Scholar]
- Kaiser, H.F. The application of electronic computers to factor analysis. Educ. Psychol. Meas. 1960, 20, 141–151. [Google Scholar] [CrossRef]
- Grenz, J.; Thalmann, C.; Stämpfli, A.; Studer, C.; Häni, F. RISE, a method for assessing the sustainability of agricultural production at farm level. Rural Dev. News 2009, 1, 5–9. [Google Scholar]
- Gaviglio, A.; Bertocchi, M.; Demartini, E. Lessons learned from a process of farm sustainability assessment: Literature review, methodology and governance opportunities. Riv. Stud. Sulla Sostenibilità 2016, 2, 129–139. [Google Scholar] [CrossRef]
- Coteur, I.; Marchand, F.; Debruyne, L.; Dalemans, F.; Lauwers, L. A framework for guiding sustainability assessment and on-farm strategic decision making. Environ. Impact Assess. Rev. 2016, 60, 16–23. [Google Scholar] [CrossRef]
- De Mey, K.; D’Haene, K.; Marchand, F.; Meul, M.; Lauwers, L. Learning through stakeholder involvement in the implementation of MOTIFS: An integrated assessment model for sustainable farming in Flanders. Int. J. Agric. Sustain. 2011, 9, 350–363. [Google Scholar]
- Triste, L.; Marchand, F.; Debruyne, L.; Meul, M.; Lauwers, L. Reflection on the development process of a sustainability assessment tool: Learning from a Flemish case. Ecol. Soc. 2014, 19, 47. [Google Scholar] [CrossRef]
- Von Wiren-Lehr, S. Sustainability in agriculture—An evaluation of principal goals-oriented concepts to close the gap between theory and practice. Agric. Ecosyst. Environ. 2001, 93, 131–145. [Google Scholar] [CrossRef]
- Thivierge, M.-N.; Parent, D.; Bélanger, V.; Angers, D.A.; Allard, G.; Pellerin, D.; Vanasse, A. Environmental sustainability indicators for cash-crop farms in Quebec, Canada: A participatory approach. Ecol. Indic. 2014, 45, 677–686. [Google Scholar] [CrossRef]
- Goodland, R. The concept of environmental sustainability. Ann. Rev. Ecol. Ecosyst. 1995, 26, 1–24. [Google Scholar] [CrossRef]
- Van der Werf, H.M.G.; Petit, J. Evaluation of the environmental impact of agriculture at the farm level: A comparison and analysis of 12 indicator-based methods. Agric. Ecosyst. Environ. 2002, 93, 131–145. [Google Scholar] [CrossRef]
- Lafebrve, A.; Eilers, W.; Chunn, B. Environmental Sustainability of Canadian Agriculture. In Agri-Environmental Indicator Report Series—Report 2; Agriculture and Agri-Food: Ottawa, ON, Canada, 2005. [Google Scholar]
- Dale, V.H.; Polasky, S. Measures of the effects of agricultural practices on ecosystem services. Ecol. Econ. 2007, 64, 286–296. [Google Scholar] [CrossRef]
- Pacini, C.; Wossinka, A.; Giesen, G.; Vazzana, C.; Huirne, R. Evaluation of sustainability of organic, integrated and conventional farming systems: A farm and field-scale analysis. Agric. Ecosyst. Environ. 2003, 95, 273–288. [Google Scholar] [CrossRef]
- Carvalheiro, L.G.; Kunin, W.E.; Keil, P.; Aguirre-Gutiérrez, J.; Ellis, W.N.; Fox, R. Species richness declines and biotic homogenisation have slowed down for NW-European pollinators and plants. Ecol. Lett. 2013, 16, 870–878. [Google Scholar] [CrossRef] [PubMed]
- Häni, F.; Braga, F.; Stämpfli, A.; Keller, T.; Fisher, M.; Porche, H. RISE, a tool for holistic sustainability assessment at the farm level. Int. Food Agribus. Manag. Rev. 2003, 6, 78–90. [Google Scholar]
- Parolo, G.; Abeli, T.; Gusmeroli, F.; Rossi, G. Large scale heterogeneous cattle grazing affects plant diversity and forage value of alpine species. Grass Forage Sci. 2011, 66, 541–550. [Google Scholar] [CrossRef]
- Bartoli, A.; Cavicchioli, D.; Kremmydas, D.; Rozakis, S.; Olper, A. The impact of different energy policy options on feedstock price and land demand for maize silage: The case of biogas in Lombardy. Energy Policy 2016, 96, 351–363. [Google Scholar] [CrossRef]
- Bacon, C.M.; Getz, C.; Kraus, S.; Montenegro, M.; Holland, K. The social dimensions of sustainability and change in diversified farming systems. Ecol. Soc. 2012, 17, 41. [Google Scholar] [CrossRef]
- Gaviglio, A.; Bertocchi, M.; Marescotti, M.E.; Demartini, E.; Pirani, A. The social pillar of sustainability: A quantitative approach at the farm level. Agric. Food Econ. 2016, 4, 15. [Google Scholar] [CrossRef]
- Littig, B.; Griessler, E. Social sustainability: A catchword between political pragmatism and social theory. Int. J. Sustain. Dev. 2005, 8, 65–79. [Google Scholar] [CrossRef]
- Santini, F.; Paloma, S.G. Short Food Supply Chains and Local Food Systems in the EU: A State of Play of Their Socio-Economic Characteristics; Publications Office of the European Union: Luxembourg, 2013. [Google Scholar]
- Bertocchi, M.; Gaviglio, A.; Demartini, E. A new framework for the assessment of environmental sustainability of farms. Calit. Suppl. Q. Access Success 2016, 17, 566–573. [Google Scholar]
- Falguera, V.; Aliguer, N.; Falguera, M. An integrated approach to current trends in food consumption: Moving toward functional and organic products? Food Control 2012, 26, 274–281. [Google Scholar] [CrossRef]
- Gaviglio, A.; Pirani, A. Consumer perception of cured pork meats: The added value of the organic attribute food analysis. Czech J. Food Sci. 2015, 33, 32–36. [Google Scholar] [CrossRef]
- Bessière, J. Local development and heritage: Traditional food and cuisine as tourist attractions in rural areas. Soc. Rural 1998, 38, 21–34. [Google Scholar] [CrossRef]
- Lockie, S. Responsibility and agency within alter-native food networks: Assembling the “citizen consumer”. Agric. Hum. Values 2009, 26, 193–201. [Google Scholar] [CrossRef]
- Seyfang, G. Ecological citizenship and sustainable consumption: Examining local organic food networks. J. Rural Stud. 2006, 22, 383–395. [Google Scholar] [CrossRef]
- Bonneau, M.; Klauke, T.N.; Gonzàlez, J.; Rydhmer, L.; Ilari-Antoine, E.; Dourmad, J.Y.; de Greef, K.; Houwers, H.W.J.; Cinar, M.U.; Fàbrega, E.; et al. Evaluation of the sustainability of contrasted pig farming systems: Integrated evaluation. Animal 2014, 8, 2058–2068. [Google Scholar] [CrossRef] [PubMed]
- Reig-Martínez, E.; Gómez-Limón, J.A.; Picazo-Tadeo, A.J. Ranking farms with a composite indicator of sustainability. Agric. Econ. 2011, 42, 561–575. [Google Scholar] [CrossRef]
- Bertoni, D.; Cavicchioli, D. Farm succession, occupational choice and farm adaptation at the rural-urban interface: The case of Italian horticultural farms. Land Use Policy 2016, 57, 739–748. [Google Scholar] [CrossRef]
- Broom, D.M. Animal welfare: An aspect of care, sustainability, and food quality. J. Vet. Med. Educ. 2010, 37, 83–88. [Google Scholar] [CrossRef] [PubMed]
- Schader, C.; Grenz, J.; Meier, M.S.; Stolze, M. Scope and precision of sustainability assessment approaches to food systems. Ecol. Soc. 2014, 19, 42. [Google Scholar] [CrossRef]
- Lien, G.; Hardaker, J.B.; Flaten, O. Risk and economic sustainability of crop farming systems. Agric. Syst. 2007, 94, 541–552. [Google Scholar] [CrossRef]
- Grande, J. New venture creation in the farm sector—Critical resources and capabilities. J. Rural Stud. 2011, 27, 220–233. [Google Scholar] [CrossRef]
- Olper, A.; Raimondi, V.; Cavicchioli, D.; Vigani, M. Do CAP payments reduce farm labour migration? A panel data analysis across EU regions. Eur. Rev. Agric. Econ. 2014, 41, 843–873. [Google Scholar] [CrossRef]
- Jongeneel, R.A.; Polman, N.B.P.; Slangen, L.H.G. Why are Dutch farmers going multifunctional? Land Use Policy 2008, 25, 81–94. [Google Scholar] [CrossRef]
- Meert, H.; Van Huylenbroeck, G.; Vernimmen, T.; Bourgeois, M.; van Hecke, E. Farm household survival strategies and diversification on marginal farms. J. Rural Stud. 2005, 21, 81–97. [Google Scholar] [CrossRef]
- Gafsi, M.; Favreau, J.L. Appropriate method to assess the sustainability of organic farming systems. In Proceedings of the 9th European IFSA Symposium, Vienna, Austria, 4–7 July 2010; pp. 912–921. [Google Scholar]
- Álvarez, A.; Arias, C. Technical efficiency and farm size: A conditional analysis. Agric. Econ. 2004, 30, 241–250. [Google Scholar] [CrossRef]
- Gavrilescu, C.; Toma, C.; Turtoi, C. Assessment of the sustainability degree of agricultural holdings in Macroregion 1 using the IDEA Method. Bull. UASVM Hortic. 2012, 69, 122–130. [Google Scholar]
- De Olde, E.M.; Oudshoorn, F.W.; Sørensen, C.A.G.; Bokkers, E.A.M.; de Boer, I.J.M. Assessing sustainability at farm-level: Lessons learned from a comparison of tools in practice. Ecol. Ind. 2016, 66, 391–404. [Google Scholar] [CrossRef]
Figure 1.
The aggregative structure of the framework.
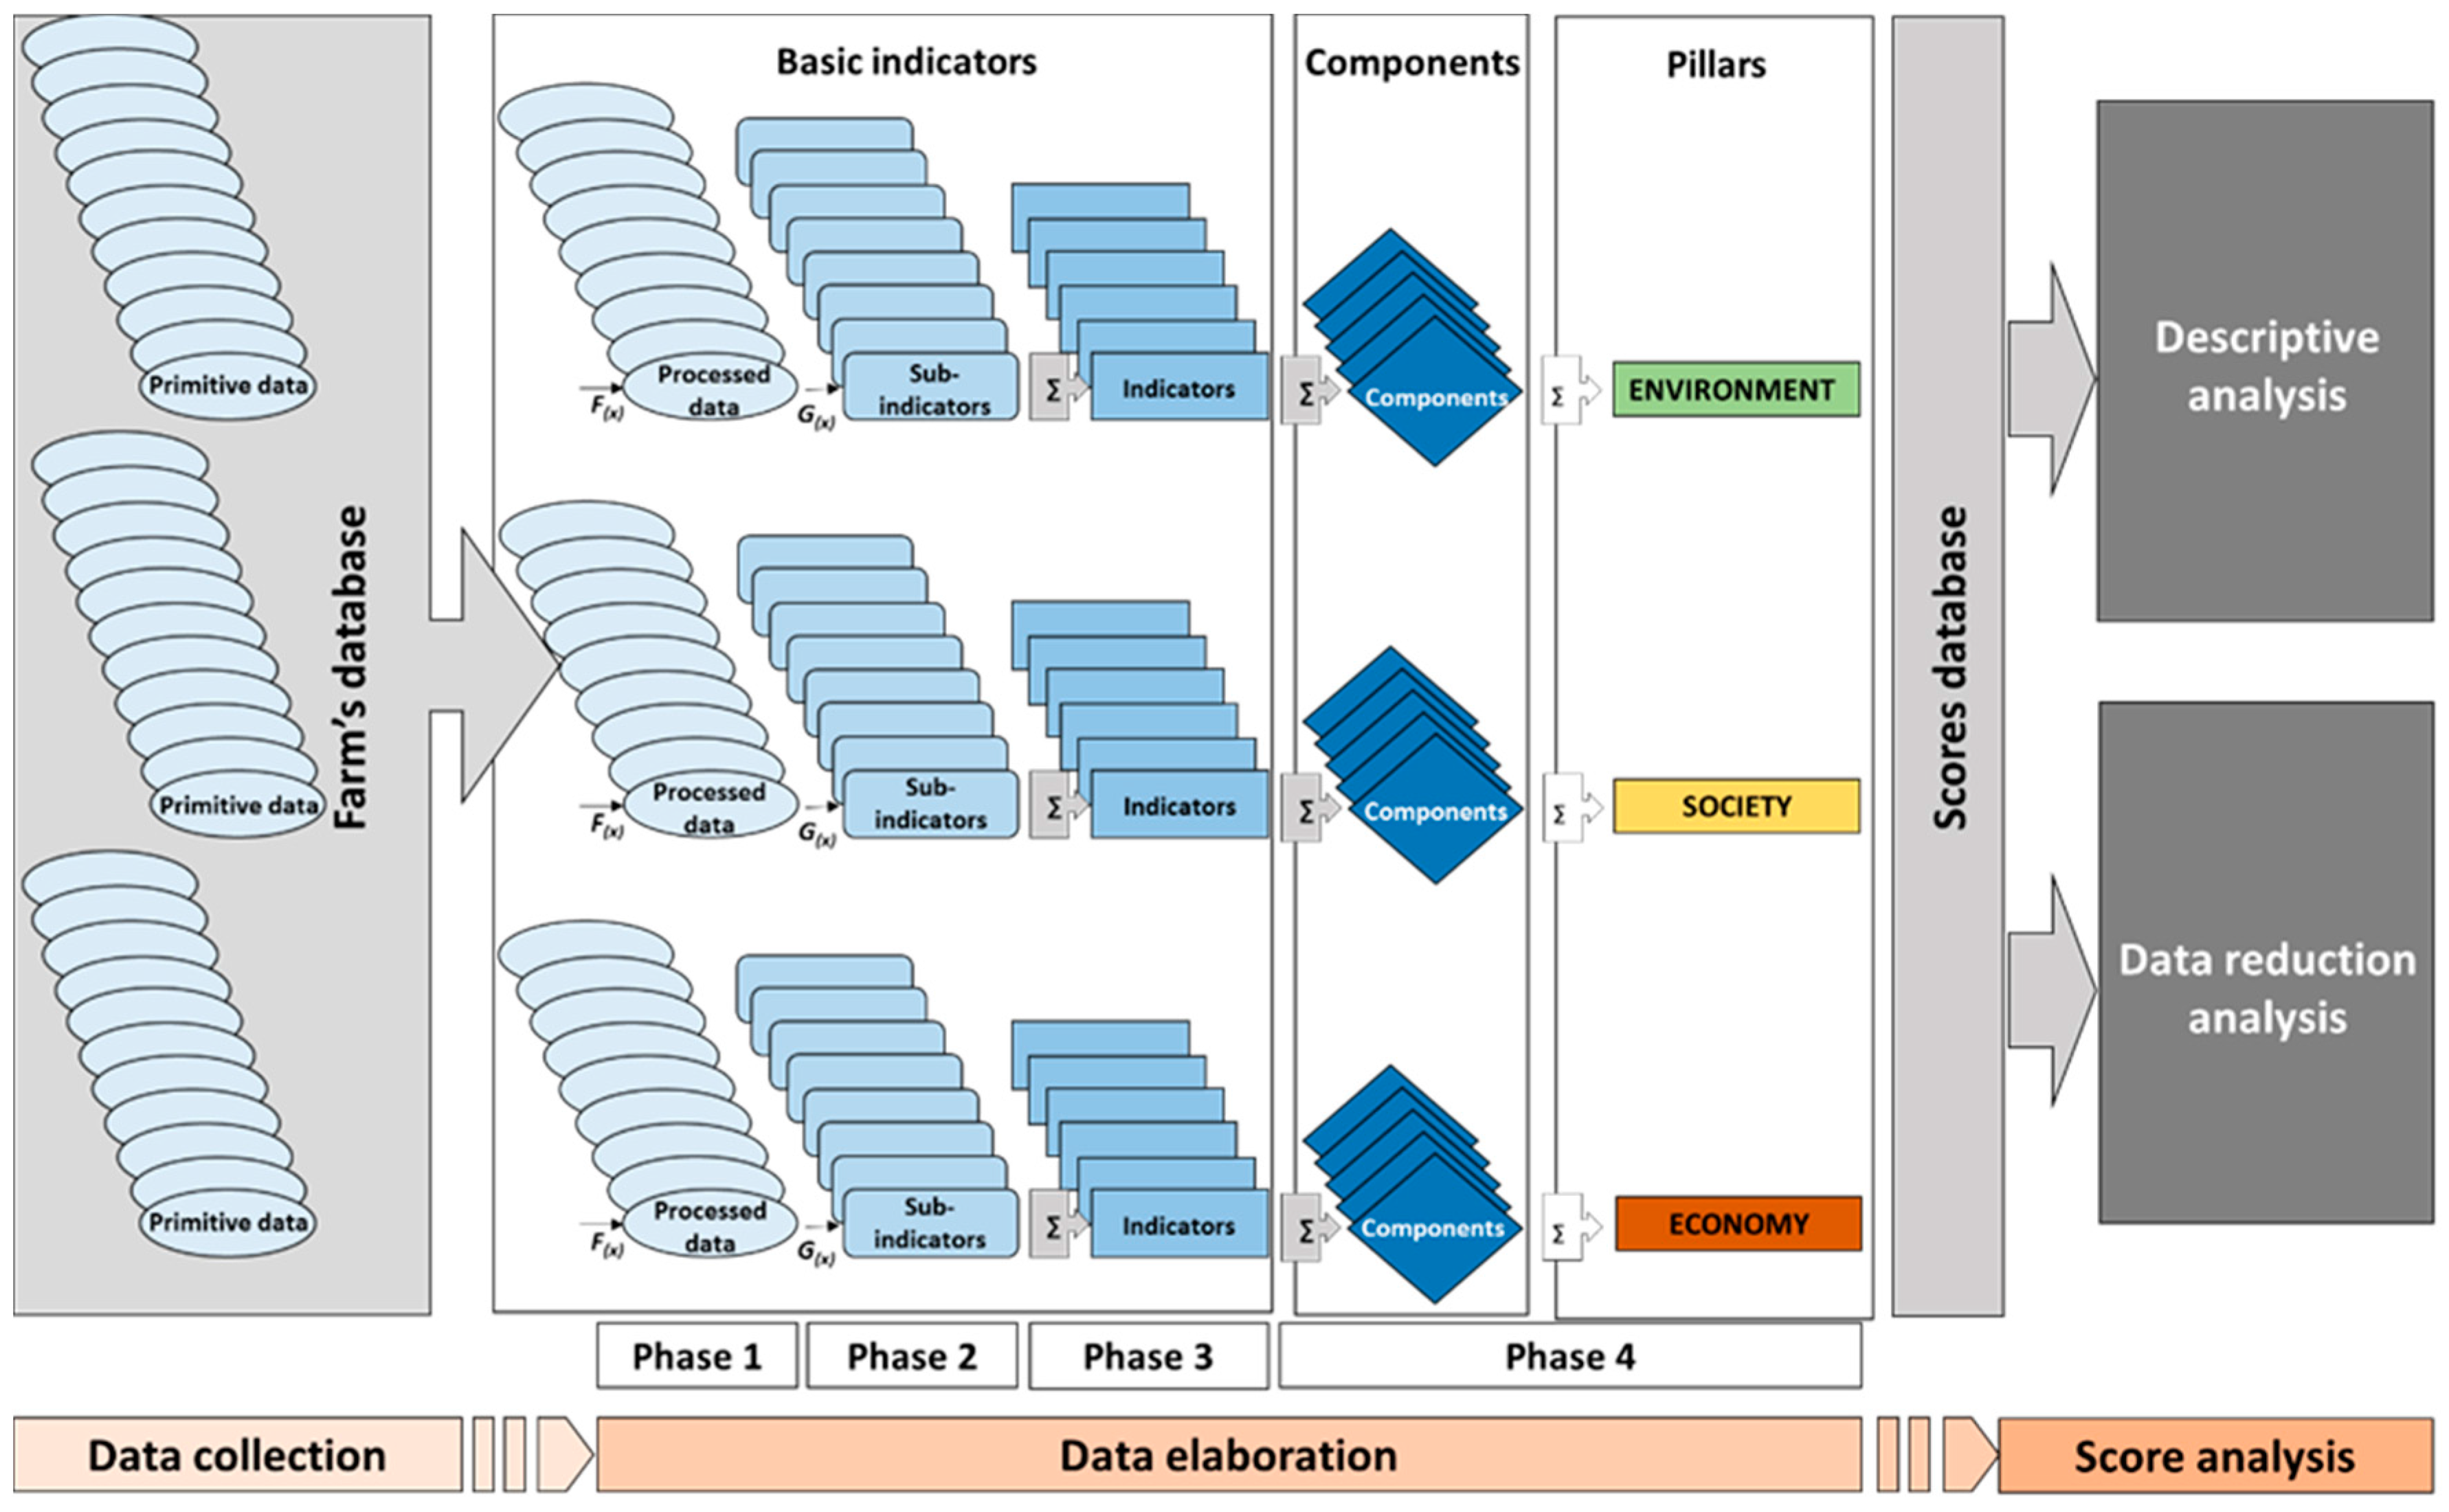
Figure 2.
Case study: Parco Agricolo Sud Milano.
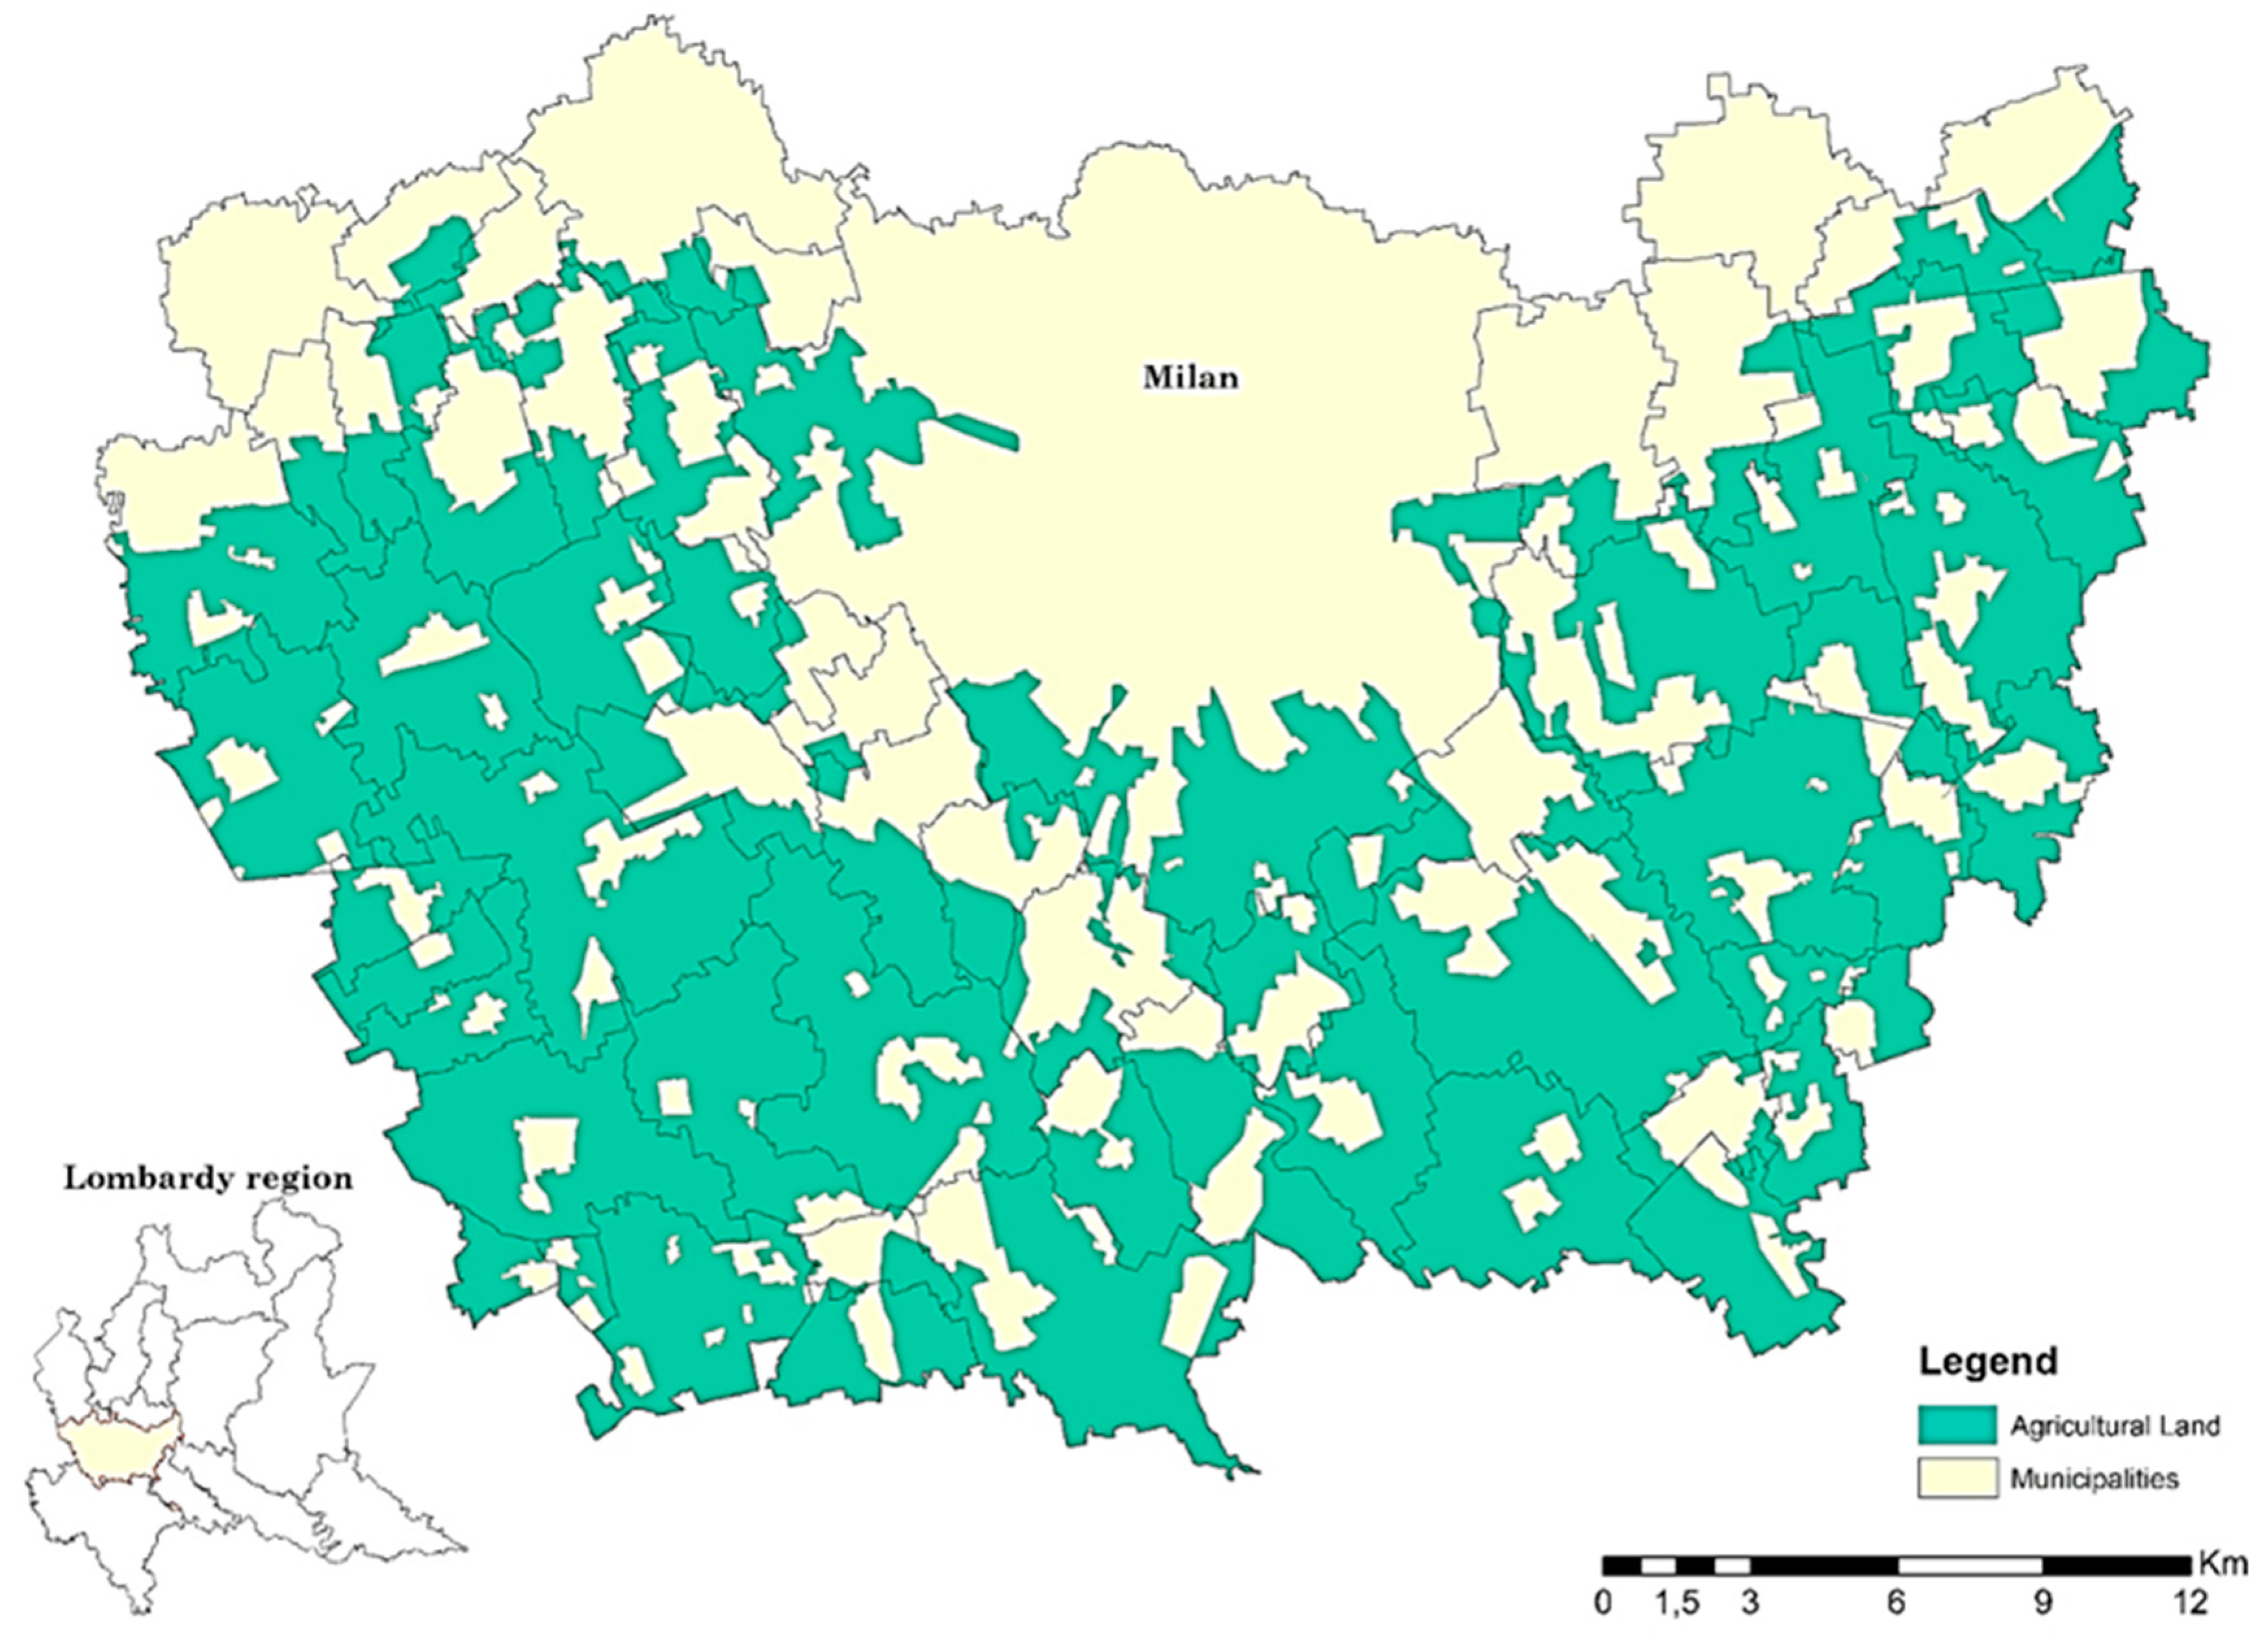
Figure 3.
Radar diagrams of farms’ average scores: (a) conventional vs. organic; (b) non-multifunctional vs. multifunctional; (c) size of UAA: small (UAA < 50 ha), medium (50 < UAA < 100 ha), large (UAA > 100 ha); (d) value of SO: small (SO < 100), medium (100 < SO < 200), large (SO > 200).
Figure 3.
Radar diagrams of farms’ average scores: (a) conventional vs. organic; (b) non-multifunctional vs. multifunctional; (c) size of UAA: small (UAA < 50 ha), medium (50 < UAA < 100 ha), large (UAA > 100 ha); (d) value of SO: small (SO < 100), medium (100 < SO < 200), large (SO > 200).
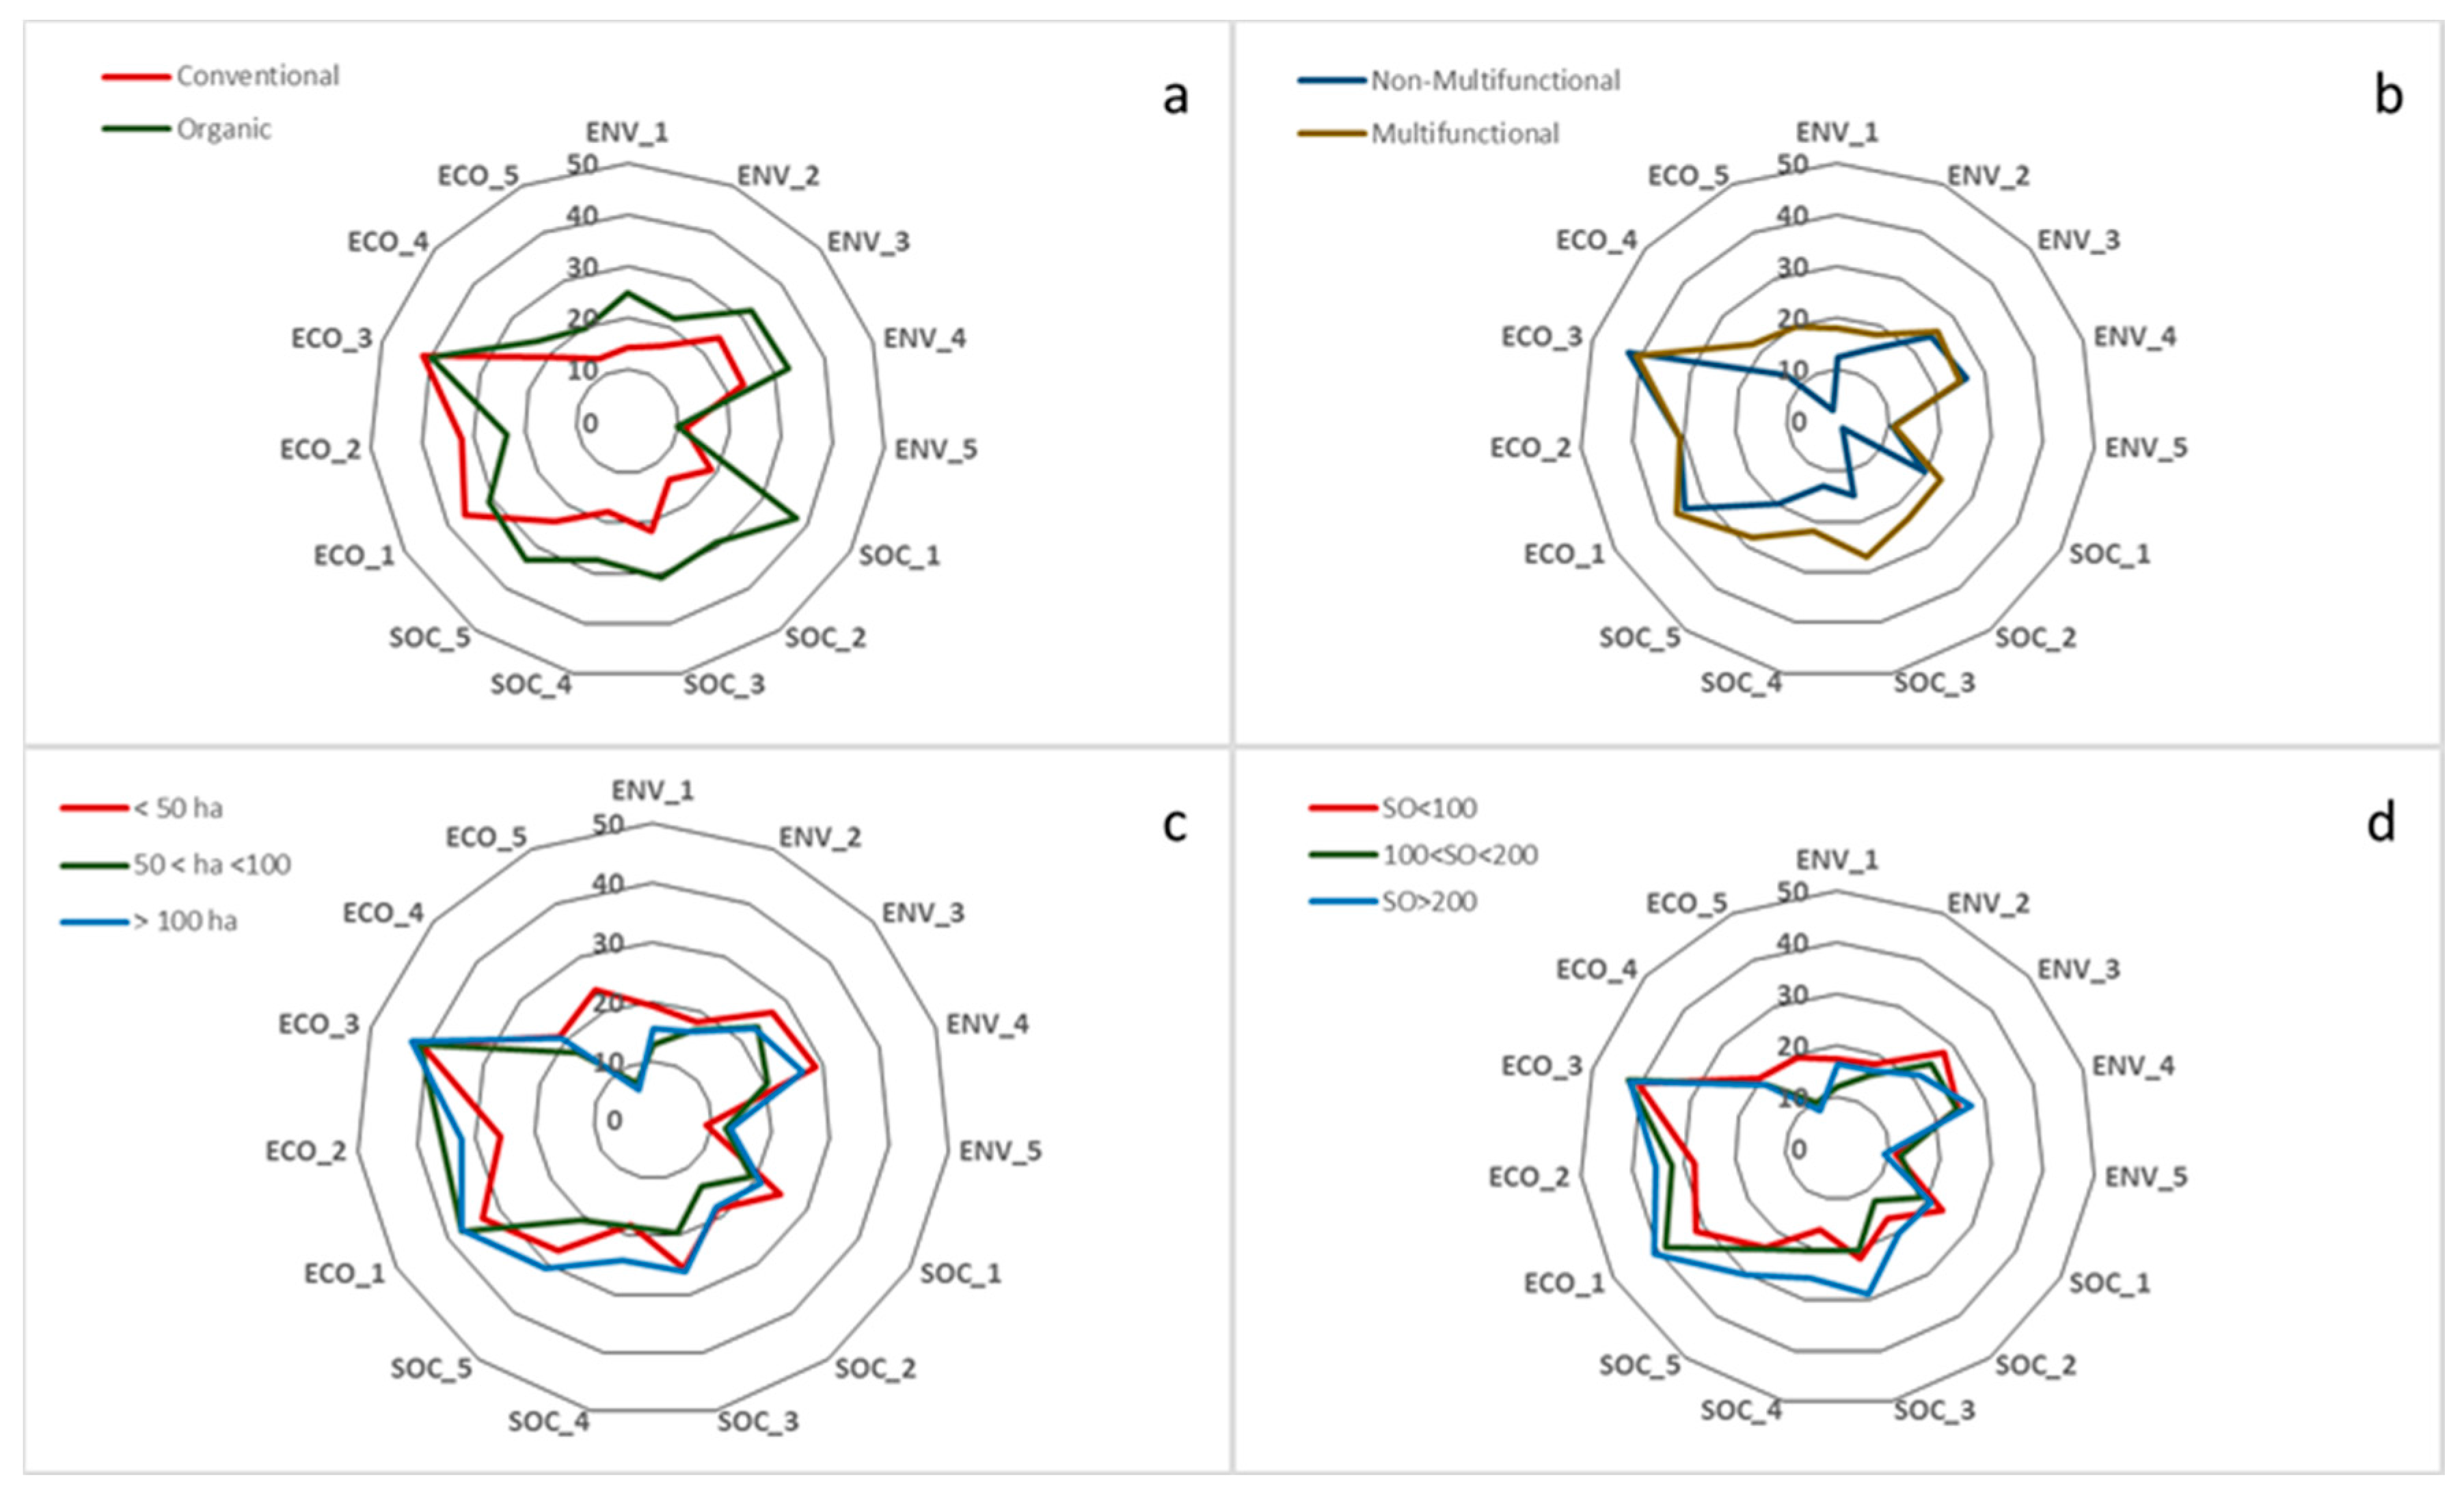
Figure 4.
Average scores of the environmental components achieved by Farms before the Greening’s adaptation and the same Farms after the Greening’s adaptation, Greening’s exempted farms and the Organic farms.
Figure 4.
Average scores of the environmental components achieved by Farms before the Greening’s adaptation and the same Farms after the Greening’s adaptation, Greening’s exempted farms and the Organic farms.

Table 1.
The framework: selected indicators.
| Indicator | Weight | Inspiration | Data Sources |
|---|---|---|---|
| 1-Annual crop diversity | 14 | Idea, Motifs | Questionnaire, SIARL Database |
| 2-Tree crops diversity | 14 | Idea, Motifs | Questionnaire, SIARL Database |
| 3-Animal diversity | 14 | Idea, Motifs | Questionnaire, SIARL Database |
| 4-Safeguard of animal and vegetal diversity | 8 | Idea | Questionnaire, Previous projects |
| 5-Crop rotation | 14 | Idea, Motifs, Rise | Questionnaire, SIARL Database |
| 6-Plot management | 6 | Idea, Motifs, Rise | Questionnaire |
| 7-Ecological buffer zones | 20 | Idea, Rise, Safe, Sostare | Questionnaire |
| 8-Environmental and landscapes safeguard | 4 | Idea | Questionnaire |
| 9-Stocking rate | 6 | Idea | SIARL Database |
| 10-Fertilisation | 20 | Idea, Motifs, Sostare | Questionnaire, SIARL Database |
| 11-Pesticides | 20 | Idea, Motifs, Sostare | Questionnaire |
| 12-Veterinary treatments | 3 | Idea | Questionnaire |
| 13-Management of livestock effluents | 7 | Idea | Questionnaire |
| 14-Soil management | 20 | Idea, Sostare | Questionnaire |
| 15-Water resource management | 20 | Idea, Rise, Sostare | Questionnaire |
| 16-Organic matter management | 10 | Idea | Questionnaire |
| 17-Energy dependence | 25 | Idea, Rise, Sostare, Safe, Motifs | Questionnaire, SIARL Database |
| 18-Renewable energy | 25 | New | Questionnaire |
| 19-Quality of the products | 20 | Idea, Safe | Questionnaire |
| 20-Rural buildings | 12 | Idea, Motifs | Questionnaire |
| 21-Landscape and territory | 18 | Idea, Motifs | Questionnaire |
| 22-Short food supply chain | 30 | Idea | Questionnaire, Previous projects |
| 23-Related activities | 20 | Idea | Questionnaire, Previous projects |
| 24-Work | 25 | Idea | Questionnaire, SIARL Database |
| 25-Sustainability of the employment | 15 | Idea, Safe | Questionnaire |
| 26-Training | 10 | Idea | Questionnaire |
| 27-Livestock management | 25 | New | Questionnaire |
| 28-Associations and social implications | 15 | Idea | Questionnaire |
| 29-Cooperation | 10 | Idea | Questionnaire, Previous projects |
| 30-Waste management | 15 | Rise | Questionnaire |
| 31-Accessibility to the farm spaces | 10 | Idea | Questionnaire |
| 32-Sustainable use of materials | 15 | Idea | Questionnaire |
| 33-Education | 10 | New | Questionnaire |
| 34-Value of production | 30 | Motifs, Sostare | Questionnaire |
| 35-Added value | 20 | Rise, Safe, Motifs, Sostare | Questionnaire |
| 36-Farm ability to generate income | 25 | Motifs, Sostare | Questionnaire |
| 37-Income per family worker | 25 | Sostare | Questionnaire |
| 38-CAP independence | 25 | Idea, Safe, Sostare | Questionnaire, SIARL database |
| 39-Autonomy | 25 | Idea, Safe | Questionnaire |
| 40-Diversification of the production | 30 | New | Questionnaire |
| 41-Business diversification | 20 | Idea, Sostare | Questionnaire |
| 42-Multifunctionality | 50 | New | Questionnaire |
Table 2.
Characteristics of the farms in the sample.
| Farm Characteristics | Quantity (N) | Percentage (%) |
|---|---|---|
| Type of Breeding | ||
| No breeding | 20 | 40.0 |
| Cattle (meat prod.) | 7 | 14.0 |
| Cattle (dairy farms) | 15 | 30.0 |
| Poultry | 4 | 8.0 |
| Pigs | 3 | 6.0 |
| Sheep/Goat | 1 | 2.0 |
| Land area—Utilised Agricultural Area | ||
| <50 ha | 23 | 46.0 |
| 50–100 ha | 18 | 36.0 |
| >100 ha | 9 | 18.0 |
| Multifunctionality | ||
| Non-multifunctional (no related activities) | 15 | 30.0 |
| Multifunctional (one or more related activities) | 35 | 70.0 |
| Type of production | ||
| Conventional | 41 | 82.0 |
| Organic | 9 | 18.0 |
| Economic size—Standard Output | ||
| SO < 100 | 28 | 56.0 |
| 100 < SO < 300 | 14 | 28.0 |
| SO > 300 | 8 | 16.0 |
| Total | 50 | 100.0 |
Table 3.
Statistics of scores of indicators, component and pillars of the whole sample of farms (n = 50).
Table 3.
Statistics of scores of indicators, component and pillars of the whole sample of farms (n = 50).
| Sustainability Attributes | Level | Range | Mean | SD | Min | Max | ||
|---|---|---|---|---|---|---|---|---|
| Min | Max | Val. | % | Val. | Val. | Val. | ||
| Environment | Pillar | 0 | 250 | 95.1 | 38.0 | 21.8 | 61 | 158 |
| ENV_1—Diversity | Component | 0 | 50 | 16.2 | 32.4 | 8.7 | 2 | 40 |
| 1—Annual crop diversity | Indicator | 0 | 14 | 6.1 | 43.6 | 3.7 | 1 | 14 |
| 2—Tree crops diversity | Indicator | 0 | 14 | 3.4 | 24.0 | 3.9 | 0 | 14 |
| 3—Animal diversity | Indicator | 0 | 14 | 6.0 | 43.1 | 4.9 | 0 | 14 |
| 4—Safeguard of animal and vegetal diversity | Indicator | 0 | 8 | 0.7 | 9.0 | 1.5 | 0 | 6 |
| ENV_2—Organisation of spaces | Component | 0 | 50 | 17.2 | 34.4 | 6.0 | 6 | 32 |
| 5—Crop rotation | Indicator | 0 | 14 | 2.4 | 16.9 | 3.3 | 0 | 14 |
| 6—Plot management | Indicator | 0 | 6 | 5.6 | 94.0 | 1.1 | 0 | 6 |
| 7—Ecological buffer zones | Indicator | 0 | 20 | 5.3 | 26.5 | 3.1 | 0 | 12 |
| 8—Environmental and landscapes safeguard | Indicator | 0 | 4 | 2.8 | 70.0 | 0.8 | 0 | 4 |
| 9—Stocking rate | Indicator | 0 | 6 | 1.2 | 20.7 | 2.1 | 0 | 6 |
| ENV_3—Agricultural practices | Component | 0 | 50 | 25.4 | 50.9 | 6.4 | 13 | 39 |
| 10—Fertilisation | Indicator | 0 | 20 | 9.3 | 46.4 | 5.4 | 0 | 17 |
| 11—Pesticides | Indicator | 0 | 20 | 13.6 | 68.1 | 3.2 | 9 | 20 |
| 12—Veterinary treatments | Indicator | 0 | 3 | 2.1 | 70.0 | 1.0 | 0 | 3 |
| 13—Management of the livestock effluents | Indicator | 0 | 7 | 0.5 | 6.6 | 0.7 | 0 | 3 |
| ENV_4—Natural resources | Component | 0 | 50 | 25.3 | 50.6 | 8.4 | 11 | 47 |
| 14—Soil management | Indicator | 0 | 20 | 10.6 | 53.2 | 4.5 | 0 | 20 |
| 15—Water resource management | Indicator | 0 | 20 | 8.1 | 40.7 | 4.8 | 5 | 20 |
| 16—Organic matter management | Indicator | 0 | 10 | 6.5 | 65.2 | 3.2 | 0 | 10 |
| ENV_5—Energy | Component | 0 | 50 | 10.9 | 21.8 | 5.3 | 2 | 21 |
| 17—Energy dependence | Indicator | 0 | 25 | 7.1 | 28.4 | 5.1 | 0 | 17 |
| 18—Renewable energy | Indicator | 0 | 25 | 3.8 | 15.2 | 2.9 | 0 | 10 |
| Society | Pillar | 0 | 250 | 106.9 | 42.8 | 43.4 | 37 | 220 |
| SOC_1—Quality | Component | 0 | 50 | 22.0 | 44.1 | 8.8 | 11 | 47 |
| 19—Quality of the products | Indicator | 0 | 20 | 3.3 | 16.6 | 6.7 | 0 | 20 |
| 20—Rural buildings | Indicator | 0 | 12 | 7.1 | 59.0 | 2.1 | 0 | 11 |
| 21—Landscape and territory | Indicator | 0 | 18 | 11.6 | 64.7 | 3.7 | 4 | 18 |
| SOC_2—Short supply chain and related activities | Component | 0 | 50 | 16.7 | 33.5 | 14.4 | 0 | 50 |
| 22—Short food supply chain | Indicator | 0 | 30 | 11.8 | 39.4 | 10.9 | 0 | 30 |
| 23—Related activities | Indicator | 0 | 20 | 4.9 | 24.6 | 5.7 | 0 | 20 |
| SOC_3—Work | Component | 0 | 50 | 23.5 | 46.9 | 10.4 | 5 | 42 |
| 24—Work | Indicator | 0 | 25 | 13.7 | 54.9 | 6.3 | 5 | 25 |
| 25—Sustainability of the employment | Indicator | 0 | 15 | 4.4 | 29.5 | 3.1 | 0 | 12 |
| 26—Training | Indicator | 0 | 10 | 5.3 | 53.2 | 3.7 | 0 | 10 |
| SOC_4—Ethic and social development | Component | 0 | 50 | 19.2 | 38.5 | 11.5 | 0 | 42 |
| 27—Livestock management | Indicator | 0 | 25 | 10.8 | 43.3 | 9.1 | 0 | 22 |
| 28—Associations and social implications | Indicator | 0 | 15 | 7.0 | 46.5 | 4.9 | 0 | 15 |
| 29—Cooperation | Indicator | 0 | 10 | 1.4 | 14.4 | 2.0 | 0 | 8 |
| SOC_5—Culture and education | Component | 0 | 50 | 25.5 | 50.9 | 9.2 | 6 | 44 |
| 30—Waste management | Indicator | 0 | 15 | 6.9 | 45.7 | 3.7 | 0 | 15 |
| 31—Accessibility to the farm spaces | Indicator | 0 | 10 | 6.8 | 68.0 | 3.6 | 0 | 10 |
| 32—Sustainable use of materials | Indicator | 0 | 15 | 6.8 | 45.6 | 5.1 | 0 | 15 |
| 33—Education | Indicator | 0 | 10 | 5.0 | 49.6 | 2.3 | 0 | 8 |
| Economy | Pillar | 0 | 250 | 141.5 | 56.6 | 27.7 | 80 | 196 |
| ECO_1—Economic viability | Component | 0 | 50 | 35.4 | 70.7 | 9.4 | 12 | 48 |
| 34—Value of production | Indicator | 0 | 30 | 20.5 | 68.3 | 4.1 | 9 | 25 |
| 35—Added value | Indicator | 0 | 20 | 14.88 | 74.4 | 5.6 | 0 | 23 |
| ECO_2—Persistence | Component | 0 | 50 | 30.60 | 61.2 | 12.1 | 0 | 45 |
| 36—Farm ability to generate income | Indicator | 0 | 25 | 11.5 | 45.8 | 5.9 | 0 | 21 |
| 37—Income per family worker | Indicator | 0 | 25 | 19.1 | 76.6 | 7.7 | 0 | 25 |
| ECO_3—Independence | Component | 0 | 50 | 41.4 | 82.9 | 5.6 | 24 | 50 |
| 38—CAP independence | Indicator | 0 | 25 | 19.6 | 78.2 | 4.6 | 0 | 25 |
| 39—Autonomy | Indicator | 0 | 25 | 21.9 | 87.5 | 5.1 | 0 | 25 |
| ECO_4—Diversification | Component | 0 | 50 | 19.5 | 39.1 | 7.1 | 8 | 42 |
| 40—Diversification of the production | Indicator | 0 | 30 | 11.8 | 39.5 | 3.6 | 6 | 22 |
| 41—Business diversification | Indicator | 0 | 20 | 7.7 | 38.5 | 4.8 | 0 | 20 |
| ECO_5—Multifunctionality | Component | 0 | 50 | 14.6 | 29.2 | 16.8 | 0 | 50 |
| 42—Multifunctionality | Indicator | 0 | 50 | 14.6 | 29.2 | 16.8 | 0 | 50 |
The indicators 9, 12, 13, 27 and 32 refer to sustainability of breeding activities, thus the values refer to calculation over this specific subset of farms (n = 31).
Table 4.
Principal components of the PCA on the environmental indicators.
| Indicator | Principal Component | ||||
|---|---|---|---|---|---|
| 1 | 2 | 3 | 4 | 5 | |
| 1 Annual crops diversity | 0.681 | −0.040 | 0.523 | 0.022 | 0.114 |
| 2 Tree crops diversity | 0.811 | −0.019 | 0.049 | 0.181 | 0.074 |
| 3 Animal diversity | 0.111 | 0.688 | −0.341 | 0.065 | 0.186 |
| 4 Safeguard of animal and vegetal diversity | 0.448 | −0.117 | −0.181 | 0.212 | 0.671 |
| 5 Crop rotation | 0.794 | 0.082 | −0.009 | −0.099 | −0.109 |
| 6 Plot management | 0.155 | 0.168 | −0.085 | 0.656 | −0.045 |
| 7 Ecological buffer zones | 0.577 | −0.043 | −0.213 | −0.384 | −0.050 |
| 8 Environmental and landscape safeguard | 0.129 | 0.067 | −0.720 | 0.186 | 0.091 |
| 10 Fertilisation | 0.279 | −0.775 | −0.041 | 0.089 | 0.129 |
| 11 Pesticides | 0.600 | 0.357 | 0.394 | 0.065 | −0.229 |
| 14 Soil management | 0.396 | 0.060 | −0.141 | 0.117 | −0.817 |
| 15 Water resource management | 0.274 | 0.144 | 0.666 | 0.312 | 0.195 |
| 16 Organic matter management | 0.352 | 0.591 | 0.396 | 0.150 | −0.165 |
| 17 Energy dependence | −0.086 | −0.815 | −0.093 | 0.027 | 0.085 |
| 18 Renewable Energy | 0.234 | 0.265 | −0.064 | −0.767 | −0.075 |
Rotation method: Varimax with KMO normalisation. Percentage of variance per Component: 1 = 21.29%; 2 = 15.78%; 3 = 11.91%; 4 = 9.59%; 5 = 8.95%; Cumulative = 67.52%.
Table 5.
Principal components of the PCA on the social indicators.
| Indicator | Principal Component | ||||
|---|---|---|---|---|---|
| 1 | 2 | 3 | 4 | 5 | |
| 19 Quality of the products | −0.008 | 0.769 | −0.027 | 0.423 | −0.180 |
| 20 Rural buildings | 0.144 | 0.081 | 0.080 | 0.207 | 0.807 |
| 21 Landscape and territory | 0.427 | 0.204 | 0.240 | 0.090 | −0.450 |
| 22 Short food supply chain | 0.252 | 0.176 | 0.601 | 0.548 | 0.179 |
| 23 Related activities | 0.773 | 0.060 | 0.364 | 0.231 | −0.081 |
| 24 Work | 0.209 | 0.165 | 0.904 | 0.068 | −0.053 |
| 25 Sustainability of the employment | 0.250 | 0.797 | 0.175 | −0.123 | −0.037 |
| 26 Training | 0.605 | 0.336 | 0.384 | −0.211 | 0.317 |
| 28 Associations and social implications | 0.658 | 0.097 | −0.132 | 0.442 | −0.002 |
| 29 Cooperation | 0.145 | 0.117 | 0.134 | 0.851 | 0.150 |
| 30 Waste management | 0.046 | 0.712 | 0.321 | 0.134 | 0.161 |
| 31 Accessibility to the farm spaces | 0.836 | 0.164 | 0.213 | 0.030 | 0.106 |
| 33 Education | 0.537 | 0.673 | −0.058 | 0.104 | 0.138 |
Rotation method: Varimax with KMO normalisation. Percentage of Variance per Component: 1 = 21.38%; 2 = 18.91%; 3 = 13.38%; 4 = 12.29%; 5 = 8.53%; Cumulative = 74.49%.
Table 6.
Principal components of the PCA on the economic indicators.
| Indicator | Principal Component | ||
|---|---|---|---|
| 1 | 2 | 3 | |
| 34 Value of production | 0.905 | −0.128 | 0.064 |
| 35 Value added | 0.951 | 0.000 | 0.207 |
| 36 Farm ability to generate income | 0.742 | −0.014 | 0.333 |
| 37 Income per family worker | 0.936 | −0.134 | −0.150 |
| 38 CAP independence | 0.346 | −0.056 | 0.680 |
| 39 Autonomy | 0.006 | −0.034 | −0.824 |
| 40 Diversification of the production | 0.042 | 0.650 | −0.280 |
| 41 Business diversification | −0.102 | 0.907 | 0.004 |
| 42 Multifunctionality | −0.165 | 0.760 | 0.325 |
Rotation method: Varimax with KMO normalisation. Percentage of Variance per Component: 1 = 36.78%; 2 = 20.68%; 3 = 16.73%; Cumulative = 74.19%.
© 2017 by the authors. Licensee MDPI, Basel, Switzerland. This article is an open access article distributed under the terms and conditions of the Creative Commons Attribution (CC BY) license (http://creativecommons.org/licenses/by/4.0/).
Share and Cite
MDPI and ACS Style
Gaviglio, A.; Bertocchi, M.; Demartini, E. A Tool for the Sustainability Assessment of Farms: Selection, Adaptation and Use of Indicators for an Italian Case Study. Resources 2017, 6, 60. https://doi.org/10.3390/resources6040060
AMA Style
Gaviglio A, Bertocchi M, Demartini E. A Tool for the Sustainability Assessment of Farms: Selection, Adaptation and Use of Indicators for an Italian Case Study. Resources. 2017; 6(4):60. https://doi.org/10.3390/resources6040060
Chicago/Turabian StyleGaviglio, Anna, Mattia Bertocchi, and Eugenio Demartini. 2017. "A Tool for the Sustainability Assessment of Farms: Selection, Adaptation and Use of Indicators for an Italian Case Study" Resources 6, no. 4: 60. https://doi.org/10.3390/resources6040060
Note that from the first issue of 2016, this journal uses article numbers instead of page numbers. See further details here.