How Much Environment Do Humans Need? Evidence from an Integrated Online User Application Linking Natural Resource Use and Subjective Well-Being in Germany


Abstract
:1. Introduction
2. Data and Methods
2.1. Data
- Nutrition, including diets, food waste and all the foodstuffs and drinks consumed;
- Building and housing, including the use of energy (electricity and heating) for household purposes;
- Consumer goods, including clothes, furniture, household appliances such as fridges and washing machines, consumer electronics such as TV sets and tablets;
- Mobility, including everyday mobility such as commuting and leisure activities by car, motorbike, bicycle and public transport;
- Leisure activities, including hobbies such as sports and cultural activities;
- Vacations, including travel and accommodation.
2.2. Methods
- : life satisfaction of user
- : material footprint
- : personal characteristics
- : household characteristics
- : lifestyle
- : error
3. Results
4. Discussion and Conclusions
Relevance for Consumer Policies
Author Contributions
Conflicts of Interest
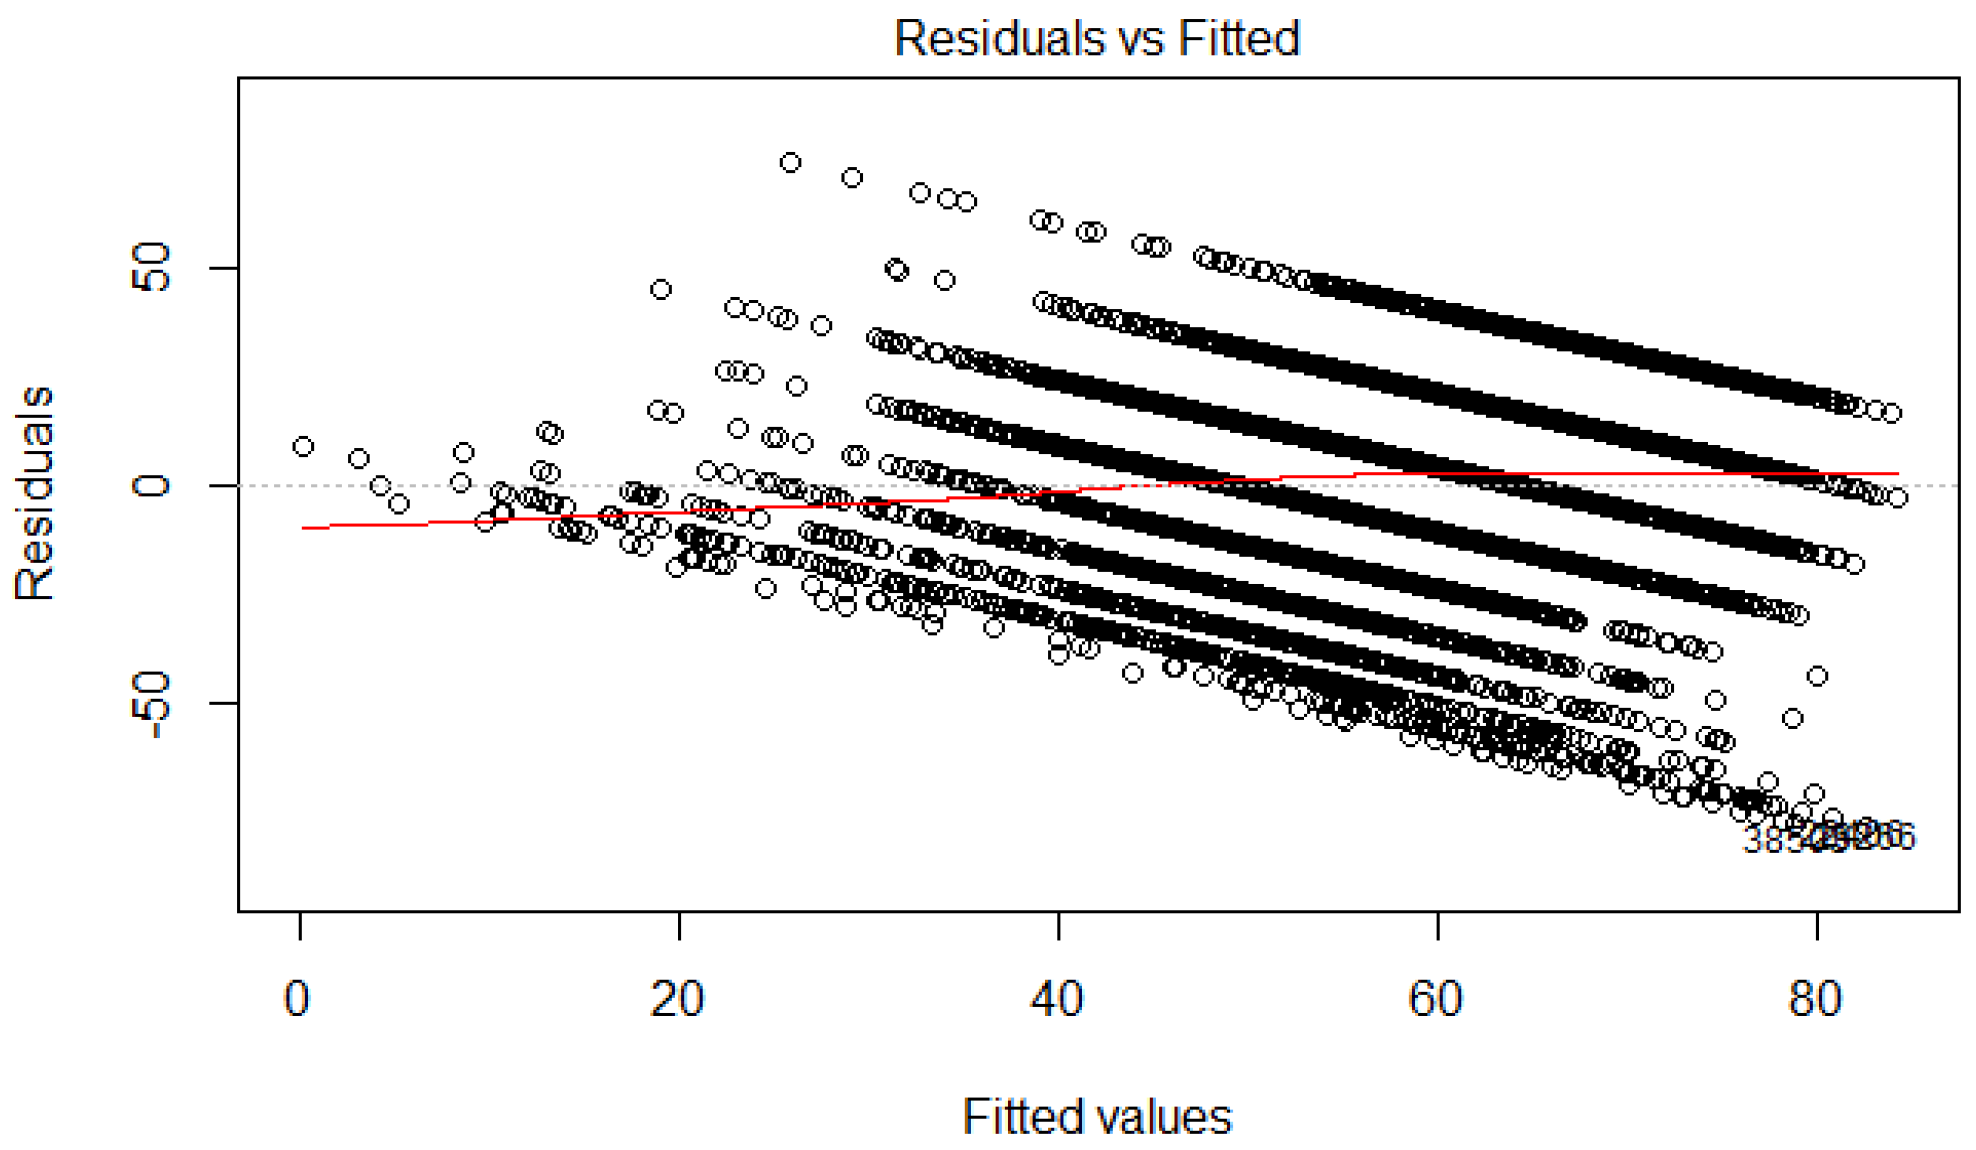
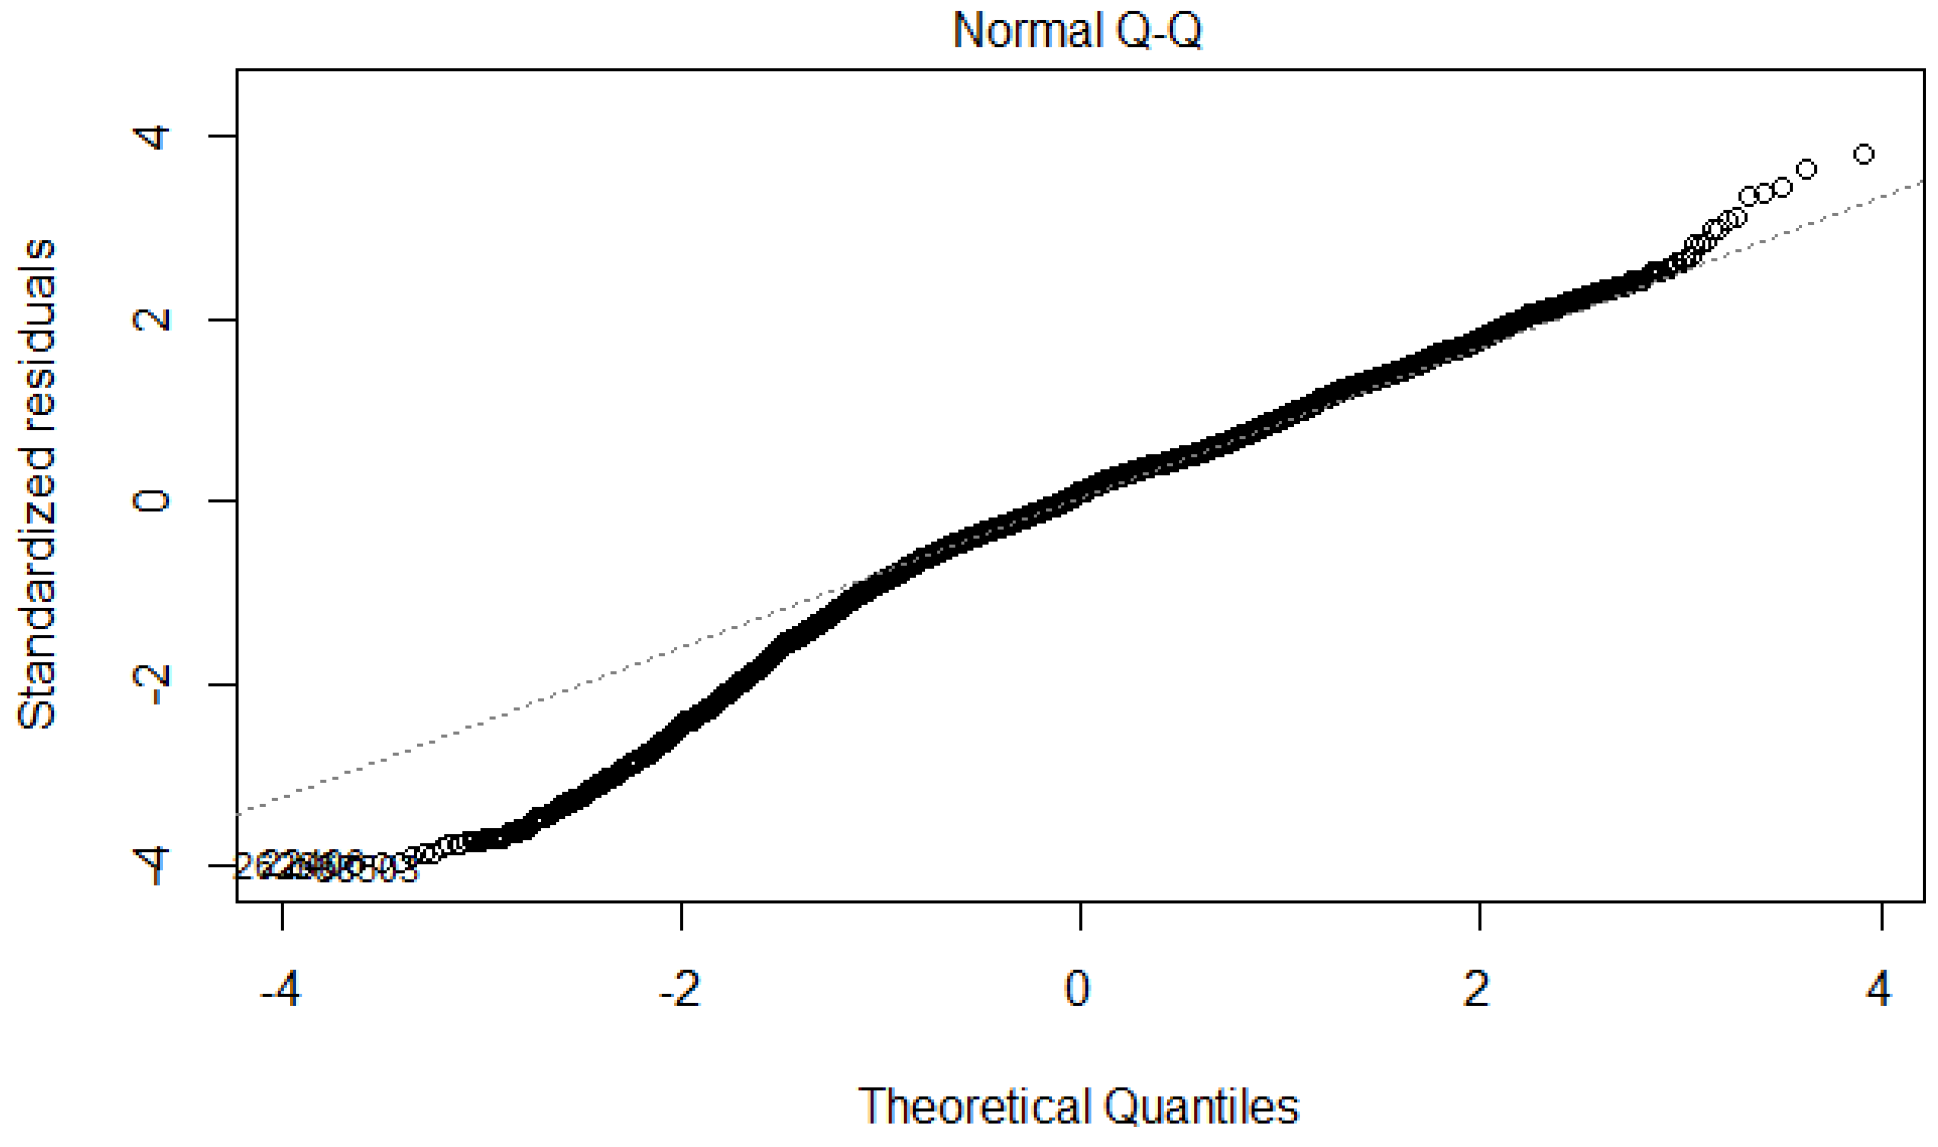
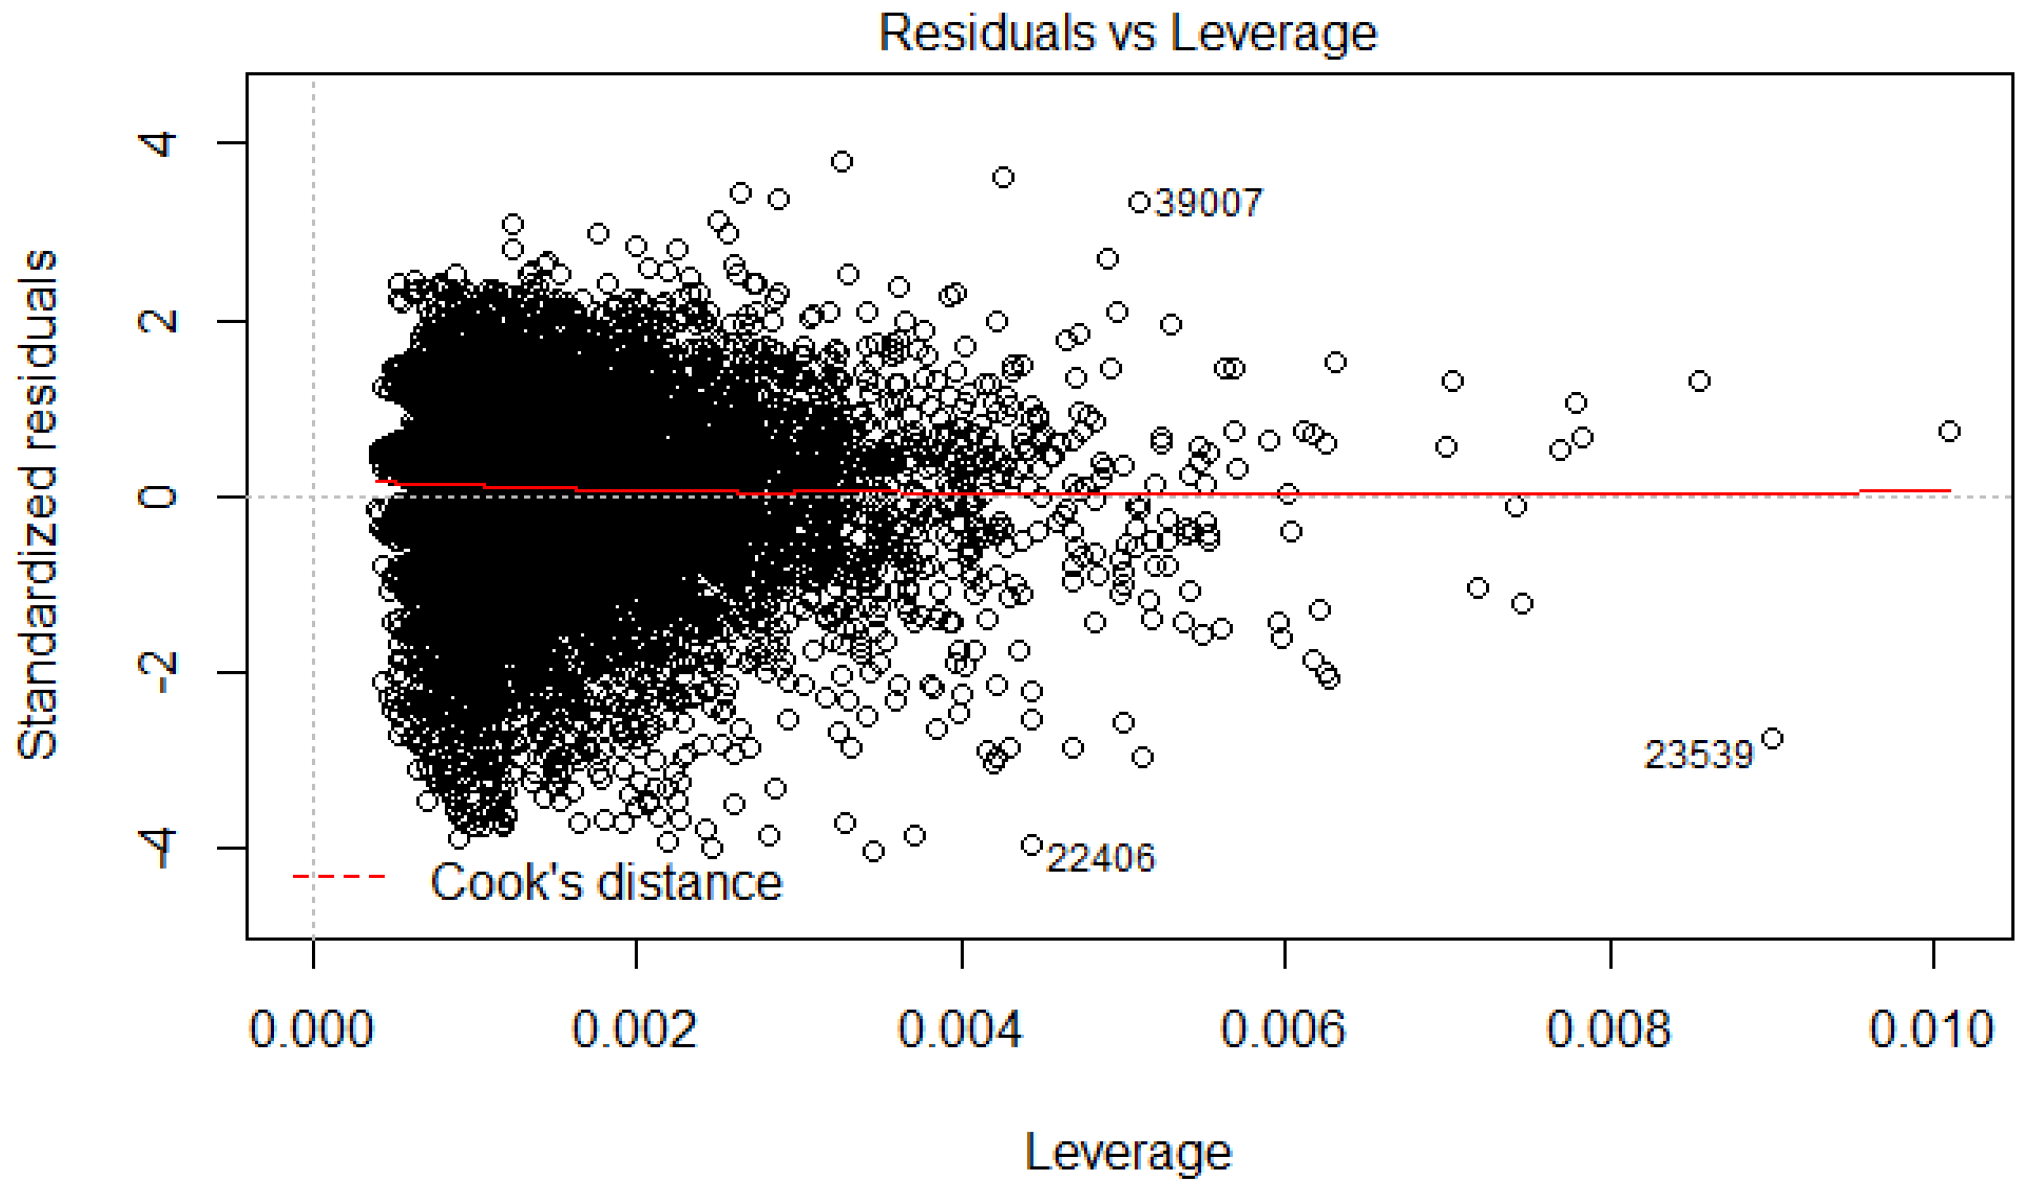
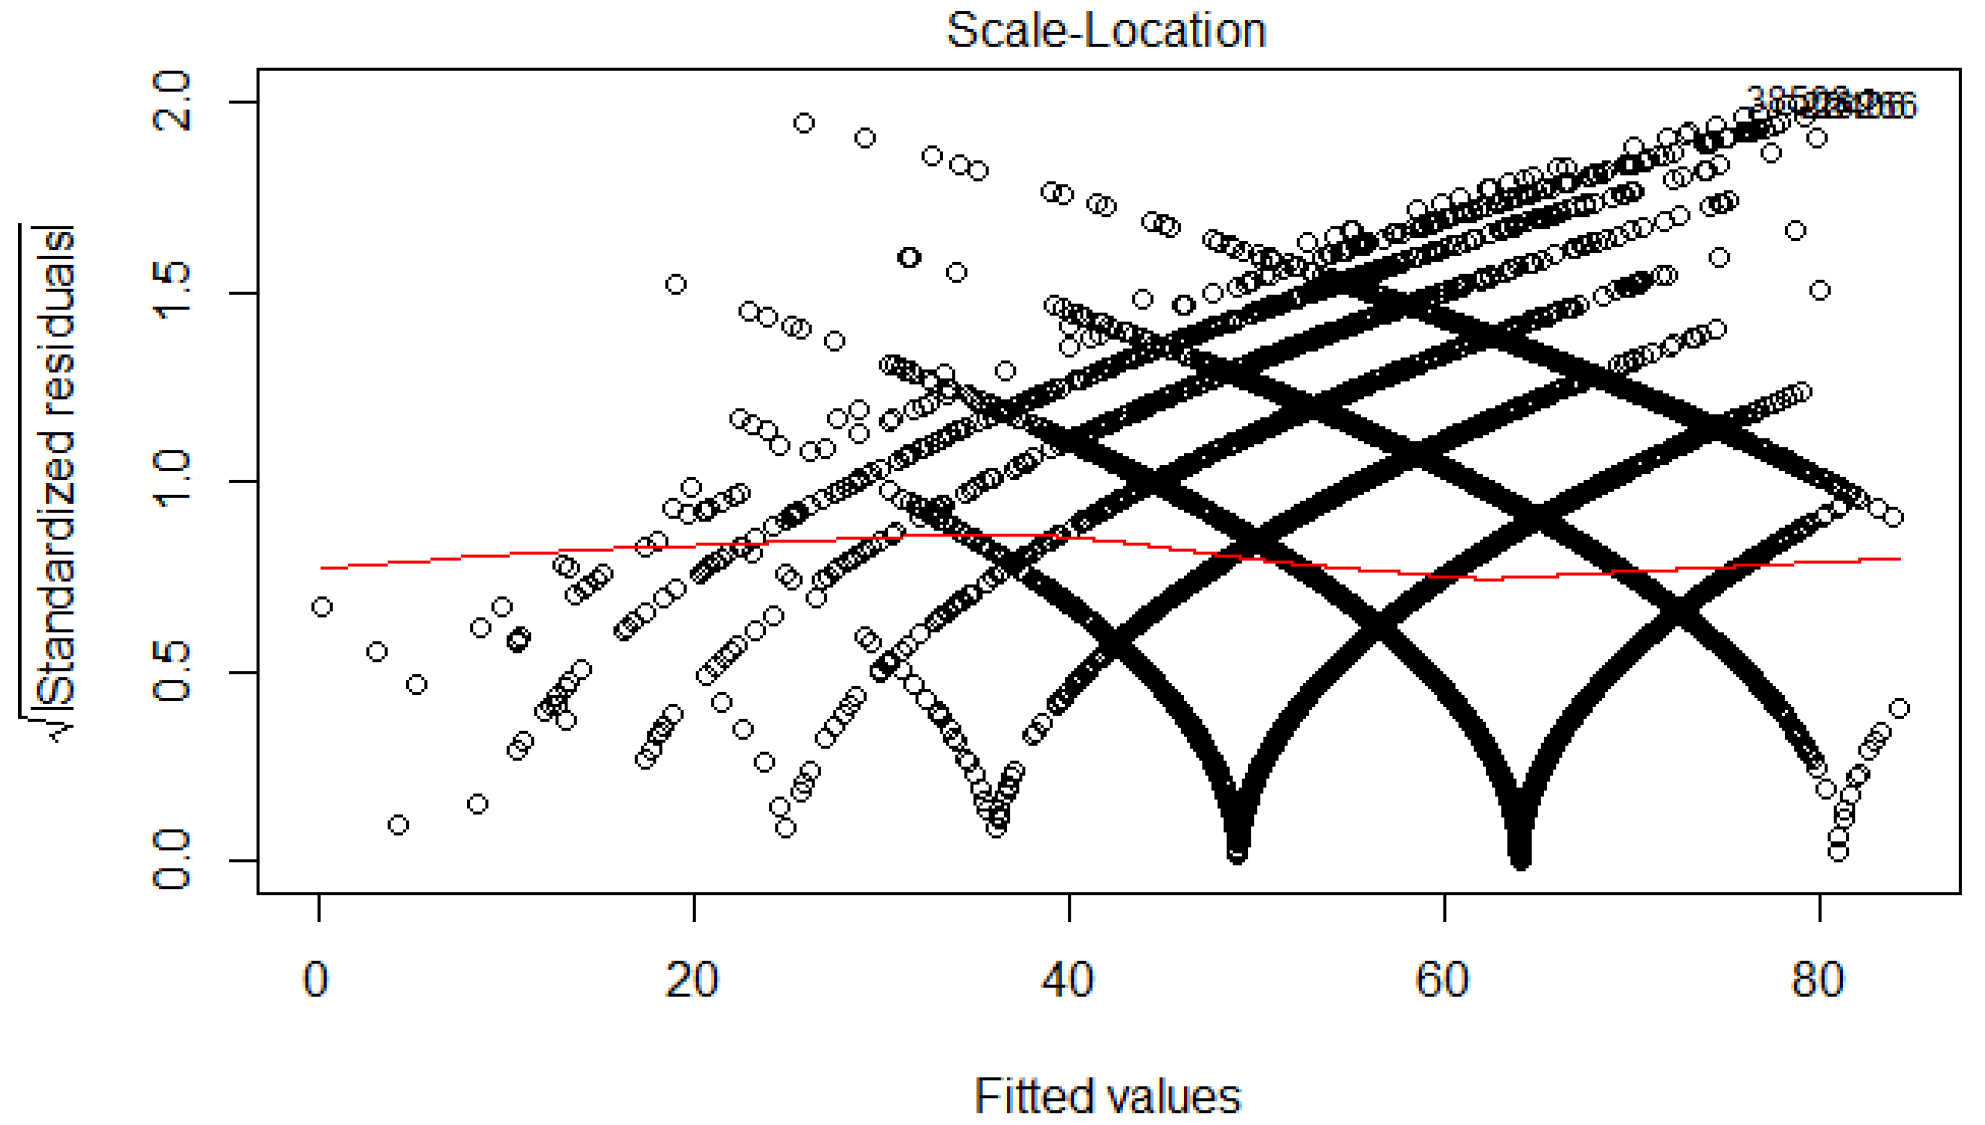
Appendix A. Regression Diagnostics

References and Note
- Schmidt-Bleek, F. Wieviel Umwelt Braucht der Mensch? MIPS—DAS Maß für Ökologisches Wirtschaften; Birkhäuser: Basel, Switzerland, 1994. [Google Scholar]
- Liedtke, C.; Bienge, K.; Wiesen, K.; Teubler, J.; Greiff, K.; Lettenmeier, M.; Rohn, H. Resource Use in the Production and Consumption System—The MIPS Approach. Resources 2014, 3, 544–574. [Google Scholar] [CrossRef]
- Lettenmeier, M.; Liedtke, C.; Rohn, H. Eight Tons of Material Footprint—Suggestion for a Resource Cap for Household Consumption in Finland. Resources 2014, 3, 488–515. [Google Scholar] [CrossRef]
- Lenzen, M.; Cummins, R.A. Happiness versus the environment—A case study of Australian lifestyles. Challenges 2013, 4, 56–74. [Google Scholar] [CrossRef]
- Andersson, D.; Nässén, J.; Larsson, J.; Holmberg, J. Greenhouse gas emissions and subjective well-being: An analysis of Swedish households. Ecol. Econ. 2014, 102, 75–82. [Google Scholar] [CrossRef]
- Ambrey, C.L.; Daniels, P. Happiness and footprints: Assessing the relationship between individual well-being and carbon footprints. Environ. Dev. Sustain. 2016, 1–26. [Google Scholar] [CrossRef]
- Chenoweth, J.; López-Avilés, A.; Morse, S.; Druckman, A. Water consumption and subjective wellbeing: An analysis of British households. Ecol. Econ. 2016, 130, 186–194. [Google Scholar] [CrossRef]
- Dietz, T.; Rosa, E.A.; York, R. Environmentally efficient well-being: Rethinking sustainability as the relationship between human well-being and environmental impacts. Hum. Ecol. Rev. 2009, 16, 114–123. [Google Scholar]
- Apergis, N. The Impact of Greenhouse Gas Emissions on Personal Well-Being: Evidence from a Panel of 58 Countries and Aggregate and Regional Country Samples. J. Happiness Stud. 2016, 1–12. [Google Scholar] [CrossRef]
- Bringezu, S. Possible Target Corridor for Sustainable Use of Global Material Resources. Resources 2015, 4, 25–54. [Google Scholar] [CrossRef]
- United Nations. Report of the Inter-Agency and Expert Group on Sustainable Development Goal Indicators; E/CN.3/2016/2, Annex III; Economic and Social Council: New York, NY, USA, 2016. [Google Scholar]
- OECD. OECD Guidelines on Measuring Subjective Well-Being; OECD Publishing: Paris, France, 2013. [Google Scholar]
- Durand, M. The OECD Better Life Initiative: How’s Life? And the Measurement of Well-Being. Rev. Income Wealth 2015, 61, 4–17. [Google Scholar] [CrossRef]
- Enste, D.; Ewers, M. Lebenszufriedenheit in Deutschland: Entwicklung und Einflussfaktoren; IW-Trends—Vierteljahresschrift zur empirischen Wirtschaftsforschung: Cologne, Germany, 2014; Volume 2. [Google Scholar]
- Buhl, J.; Teubler, J.; Stadler, K.; Liedtke, C. The resource use of private households in North Rhine-Westphalia, Germany. Sustain. Manag. Forum 2017, 25, 255–264. [Google Scholar]
- Box, G.E.; Cox, D.R. An analysis of transformations. J. R. Stat. Soc. Ser. B (Methodol.) 1964, 26, 211–252. [Google Scholar]
- According to the representative Allensbacher Markt- und Werbeträgerträgeranalyse 2017 (AWA 2017) of the Allensbach Institut für Demoskopie (ifd), 8.1% of the German population are vegetarian and renounce meat products to the greatest extent. In our sample, 33% of users stated that they followed a vegetarian or vegan diet. Available online: http://www.ifd-allensbach.de/awa/service/english/overview.html (accessed on 28 November 2017).
- Buhl, J.; Hasselkuß, M.; Suski, P.; Berg, H. Automating Behavior? An Experimental Living Lab Study on the Effect of Smart Home Systems and Traffic Light Feedback on Heating Energy Consumption. Curr. J. Appl. Sci. Technol. 2017, 22, 1–18. [Google Scholar]
- Umpfenbach, K. Influences on Consumer Behavior—Policy Implications beyond Nudging; Final Report of the European Commission; Katharina Umpfenbach and Ecologic Institute: Berlin, Germany, 2014; pp. 1–25. [Google Scholar]
- Bundesregierung. Nationales Programm für Nachhaltigen Konsum. Gesellschaftlicher Wandel durch einen Nachhaltigen Lebensstil; Bundesministerium für Umwelt, Naturschutz, Bau und Reaktorsicherheit (BMUB): Berlin, Germany, 2016. [Google Scholar]
- Buhl, J.; Schipperges, M.; Liedtke, C. Die Ressourcenintensität der Zeit und ihre Bedeutung für nachhaltige Lebensstile. In Verbraucherwissenschaften; Kenning, P., Ed.; Springer Fachmedien Wiesbaden: Wiesbaden, Germany, 2017; pp. 295–311. [Google Scholar]


| Statistic | N | Mean | Std. dev. | Min. | Max. |
|---|---|---|---|---|---|
| Personal characteristics | |||||
| Female | 26,103 | 0.62 | 0.49 | 0 | 1 |
| Age | 24,596 | 36.00 | 12.00 | 18 | 71 |
| Years of schooling | 26,118 | 14.00 | 3.20 | 9 | 21 |
| Occupational status | 18,463 | 3.00 | 1.10 | 1 | 4 |
| Unemployment | 18,463 | 0.14 | 0.35 | 0 | 1 |
| Household characteristics | |||||
| Household size | 44,238 | 2.20 | 1.00 | 1.00 | 6.00 |
| Number of children | 9119 | 1.60 | 0.71 | 1 | 4 |
| Size of dwelling (m2) | 30,482 | 95.00 | 47.00 | 7.00 | 300.00 |
| Subjective assessments | |||||
| Subjective health | 17,297 | 1.30 | 0.57 | −1 | 2 |
| Relative income | 22,125 | −0.41 | 1.00 | −2 | 2 |
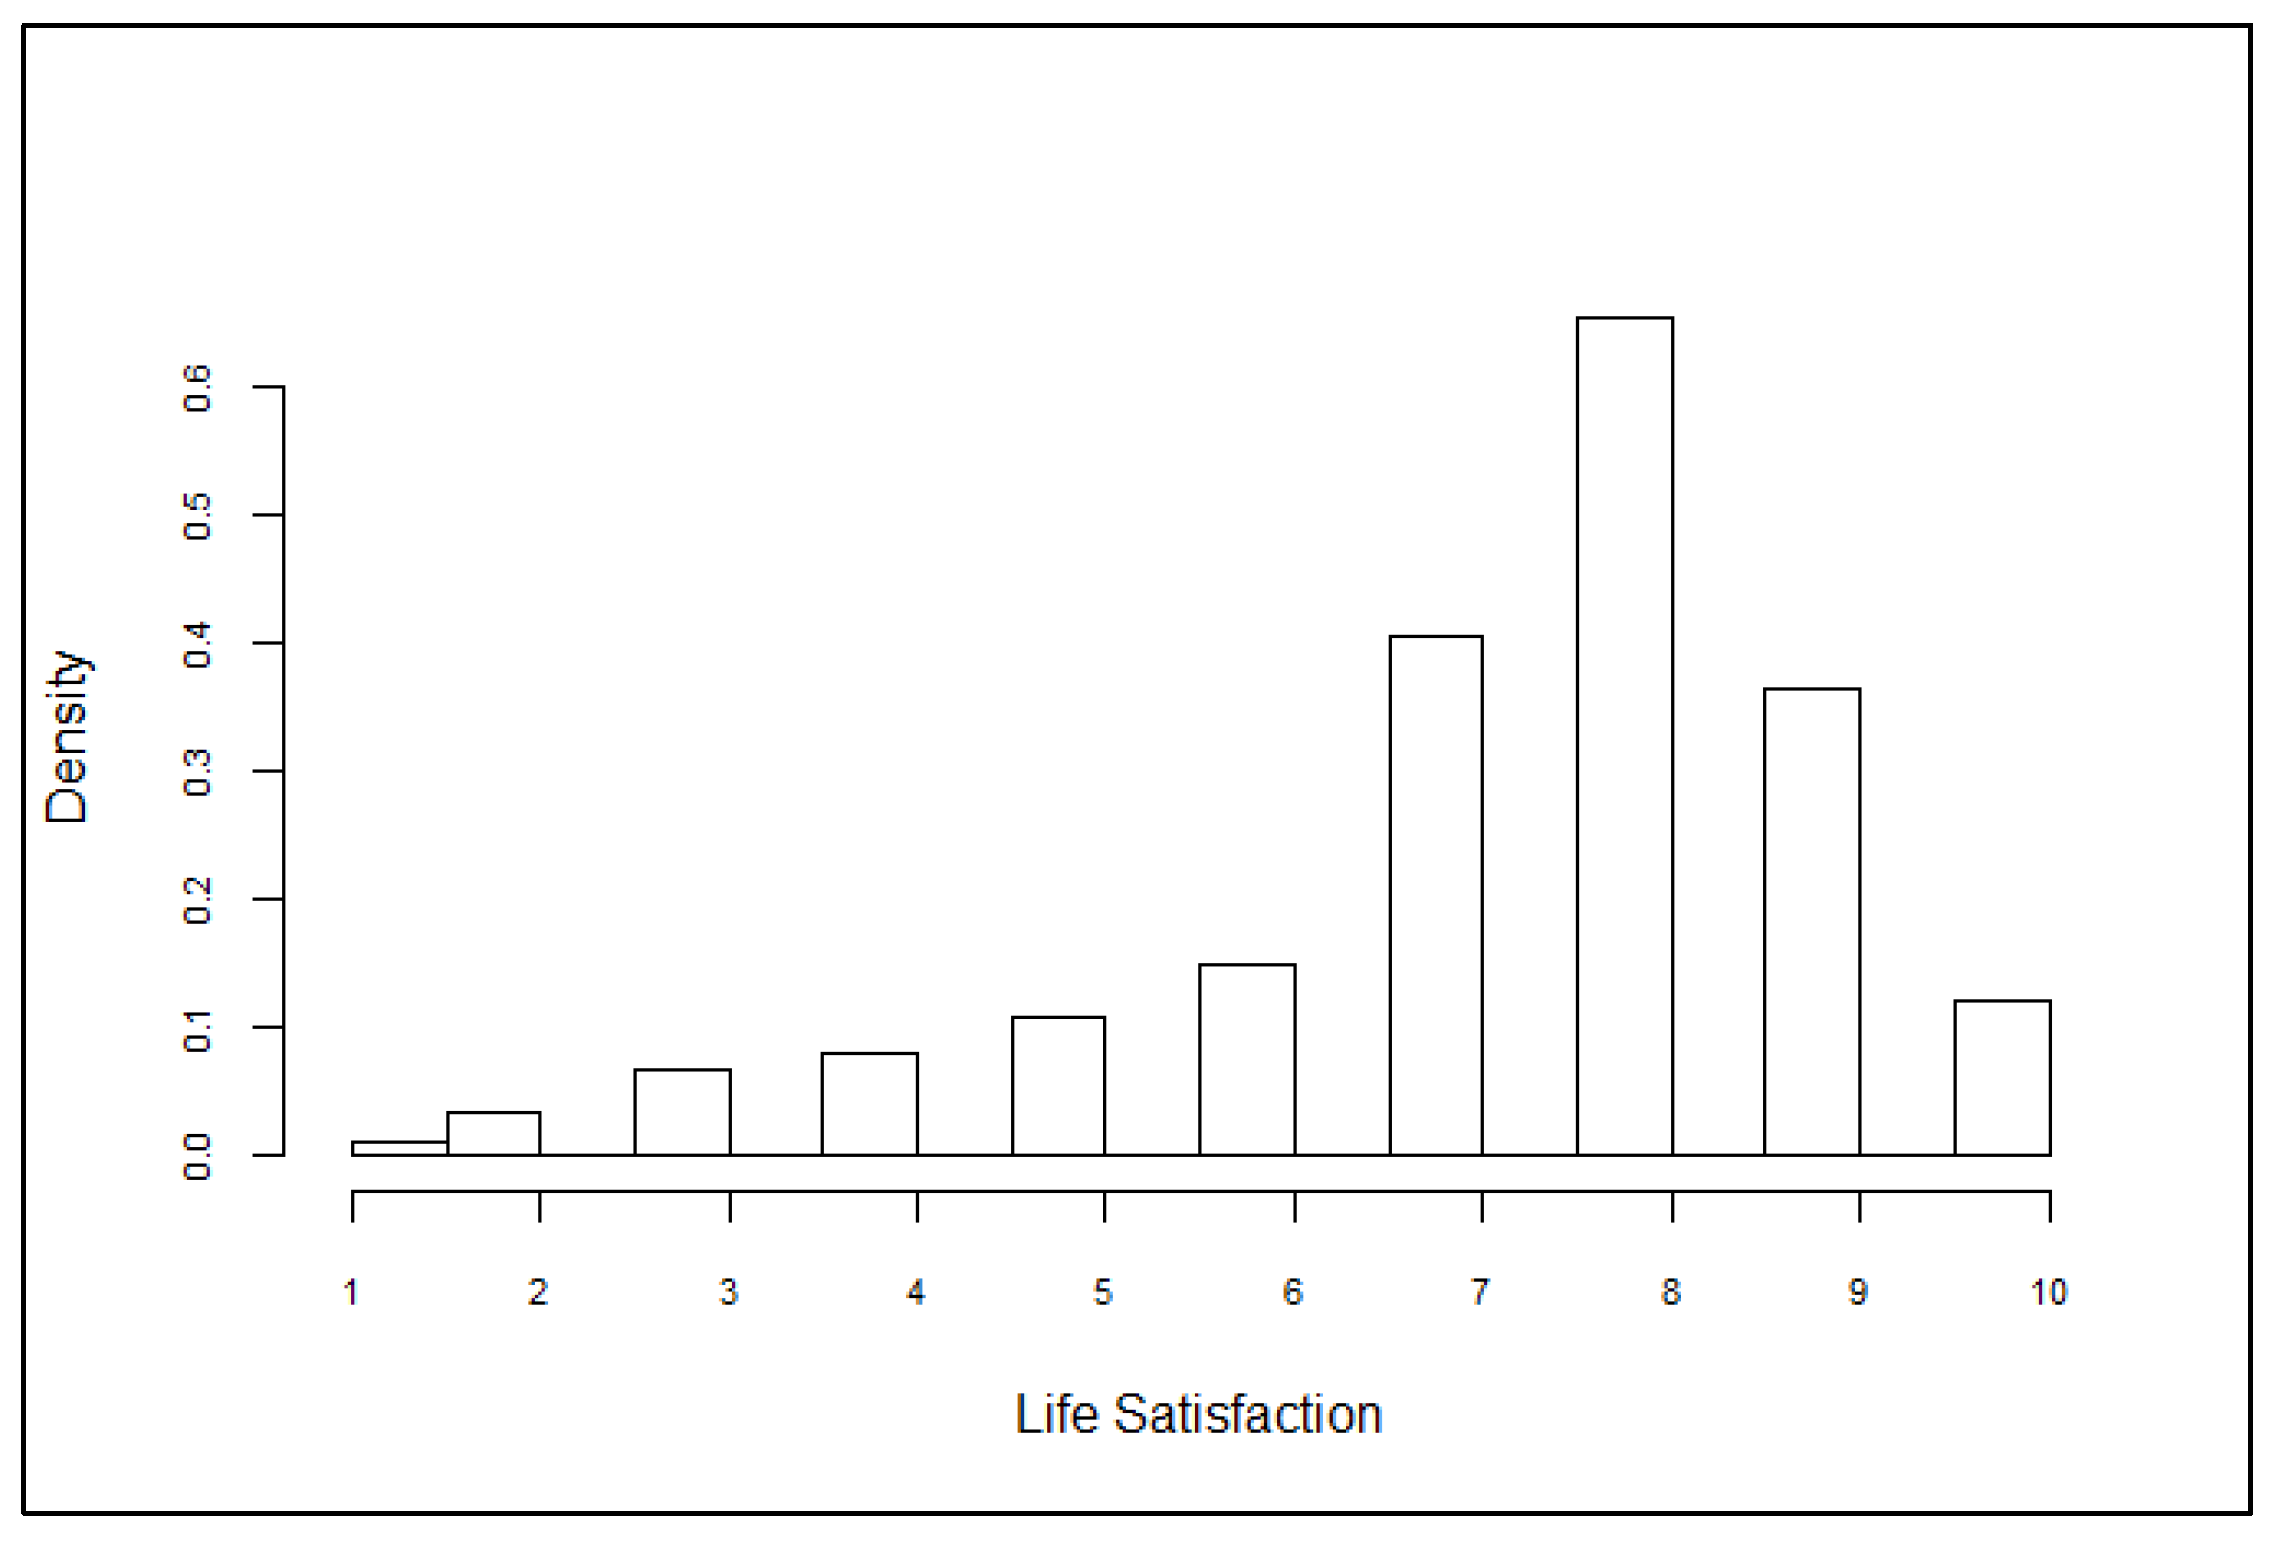
| Life satisfaction | 26,041 | 7.30 | 1.80 | 1 | 10 |
| Satisfaction with social ties | 17,690 | 1.00 | 0.71 | −2 | 2 |
| Lifestyle | |||||
| Diet | 44,317 | 2.20 | 0.84 | 1 | 4 |
| Vegetarian | 44,317 | 0.33 | 0.47 | 0 | 1 |
| Hours spent on hobbies | 44,091 | 8.00 | 12.00 | 0.00 | 75.00 |
| Days on vacation | 44,056 | 15.00 | 13.00 | 0 | 81 |
| Trips (in km) | 44,086 | 220.00 | 327.00 | 0.00 | 1800.00 |
| Material footprint (kg) | |||||
| Housing | 44,068 | 8722.00 | 4059.00 | 45 | 26,804 |
| Consumer goods | 44,068 | 2859.00 | 1161.00 | 2 | 6936 |
| Nutrition | 44,068 | 5160.00 | 1323.00 | 82 | 9145 |
| Leisure | 44,069 | 446.00 | 639.00 | 0 | 5113 |
| Mobility | 43,456 | 6682.00 | 6407.00 | 1 | 39,447 |
| Vacations | 44,068 | 1525.00 | 1532.00 | 0 | 10,200 |
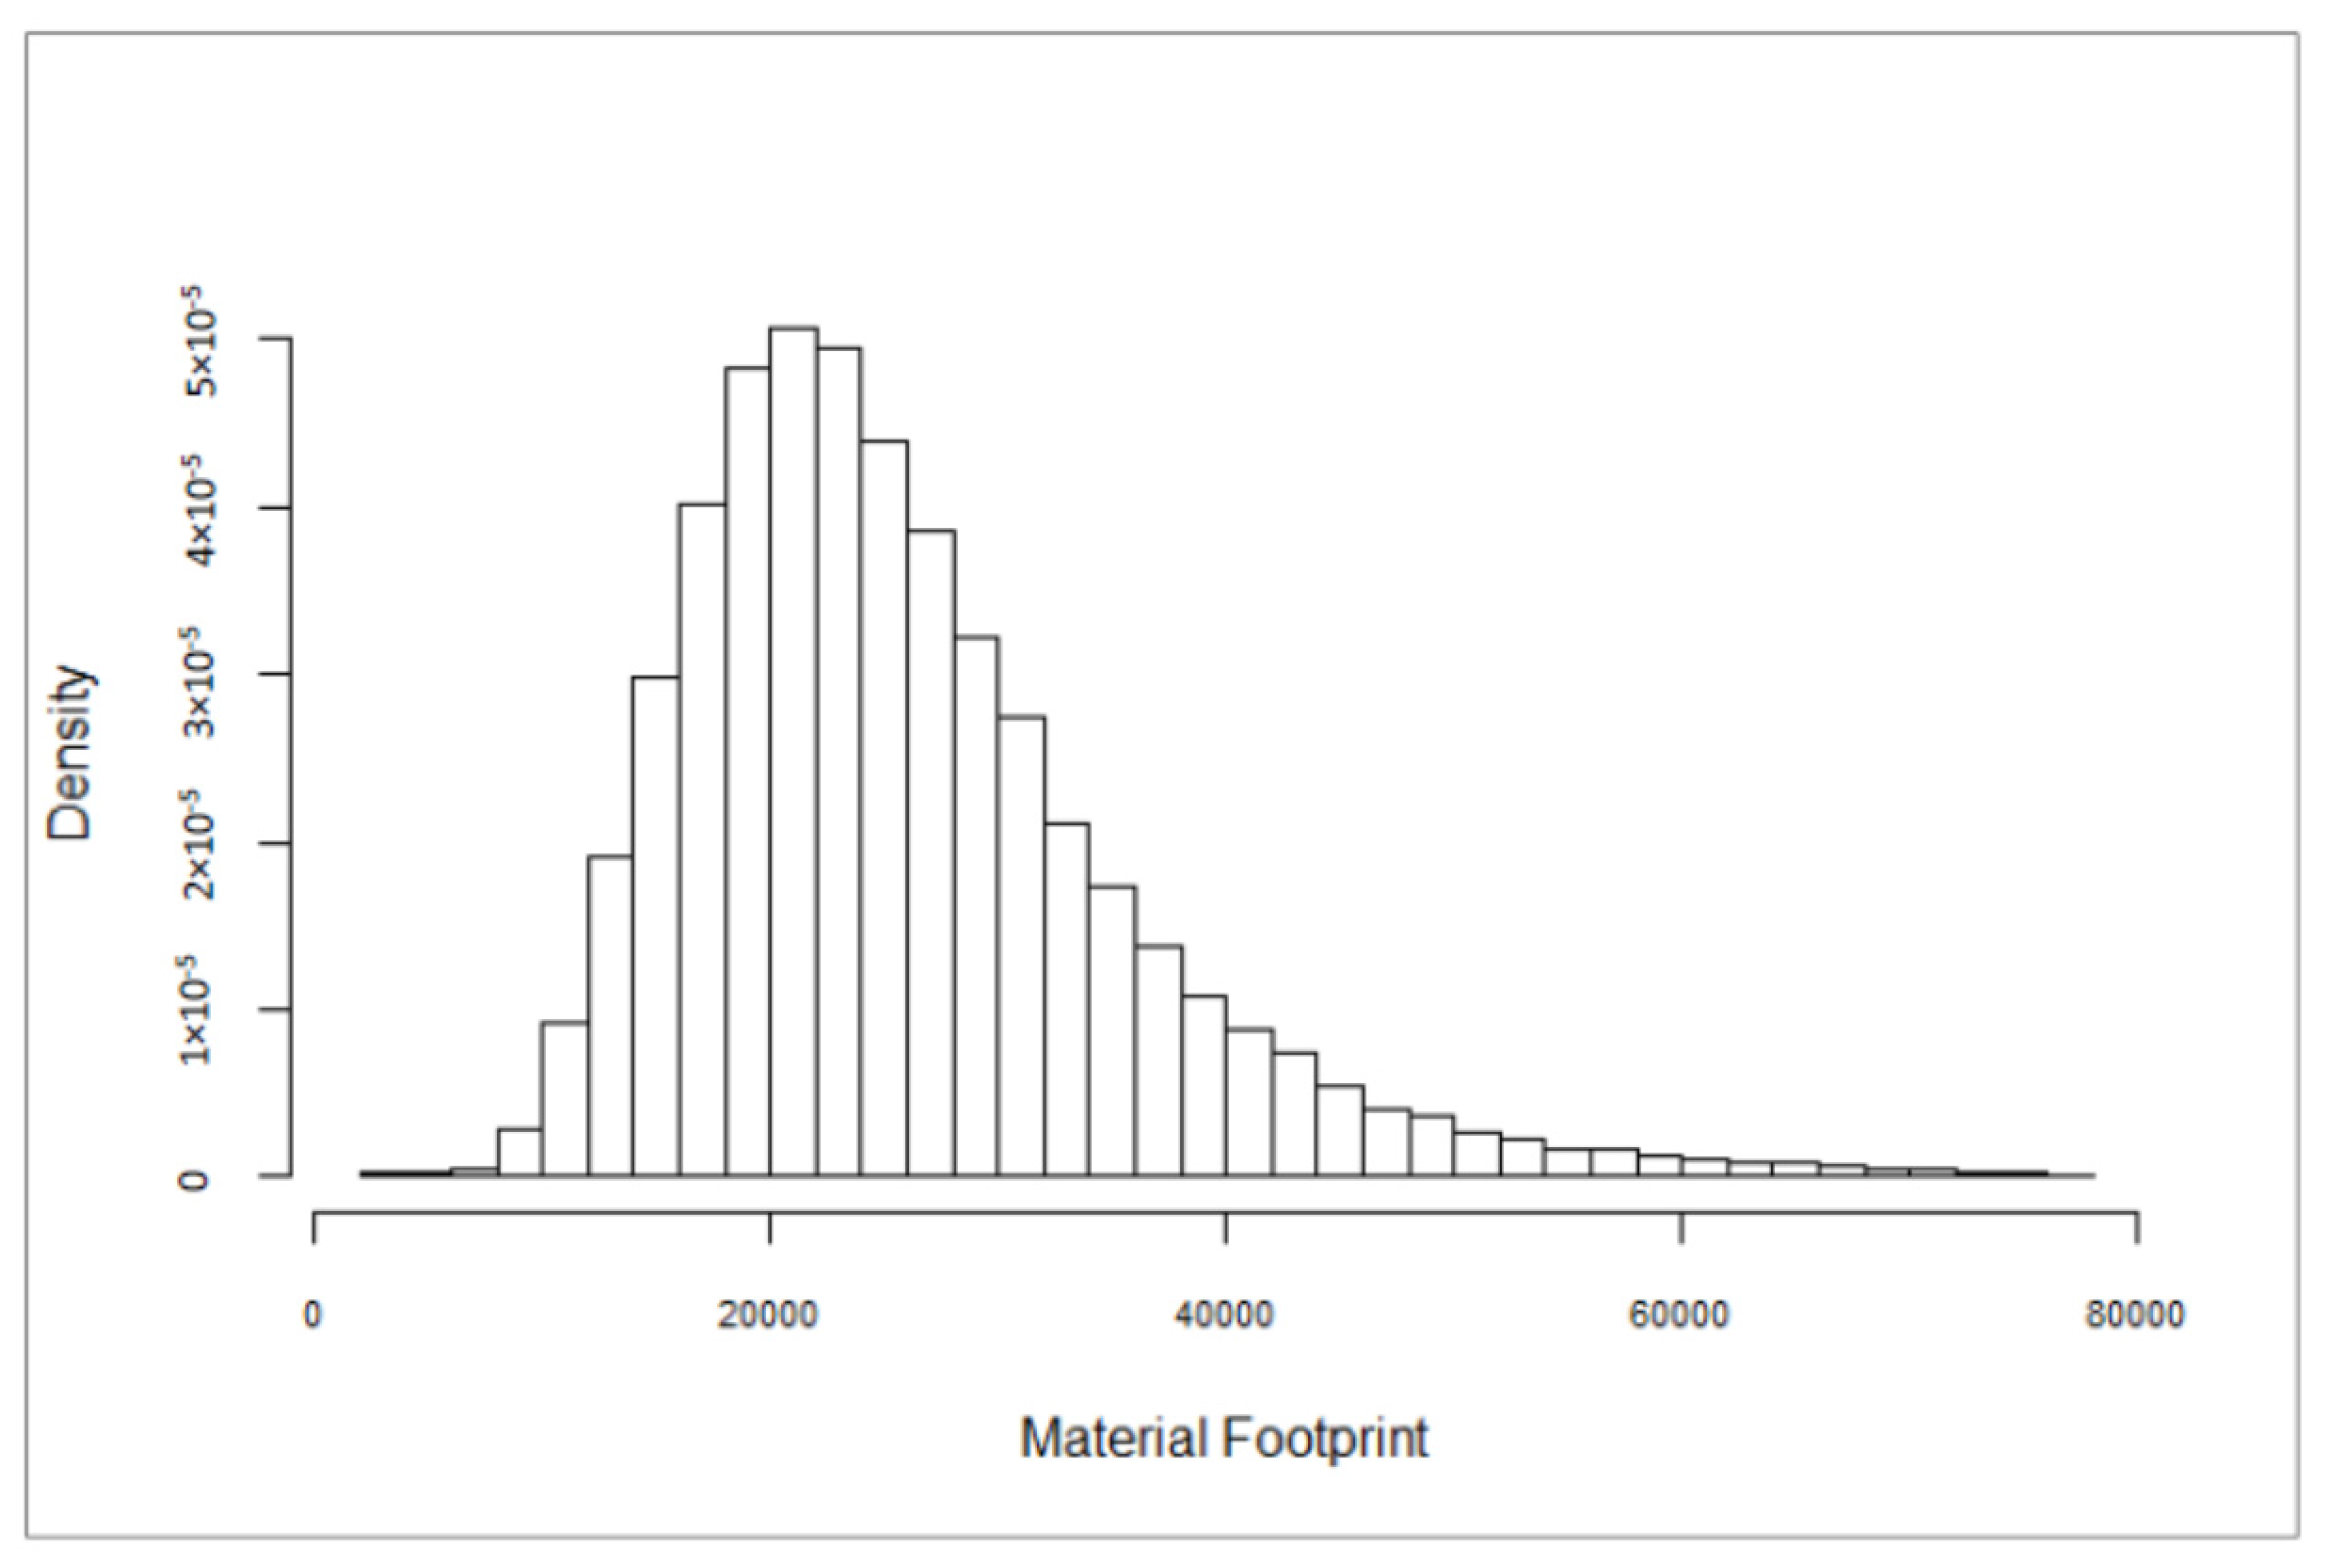
| Overall material footprint | 44,068 | 25,897.00 | 10,041.00 | 2711 | 76,570 |
| Variable | Life Satisfaction | |||
|---|---|---|---|---|
| (1) | (2) | (3) | (4) | |
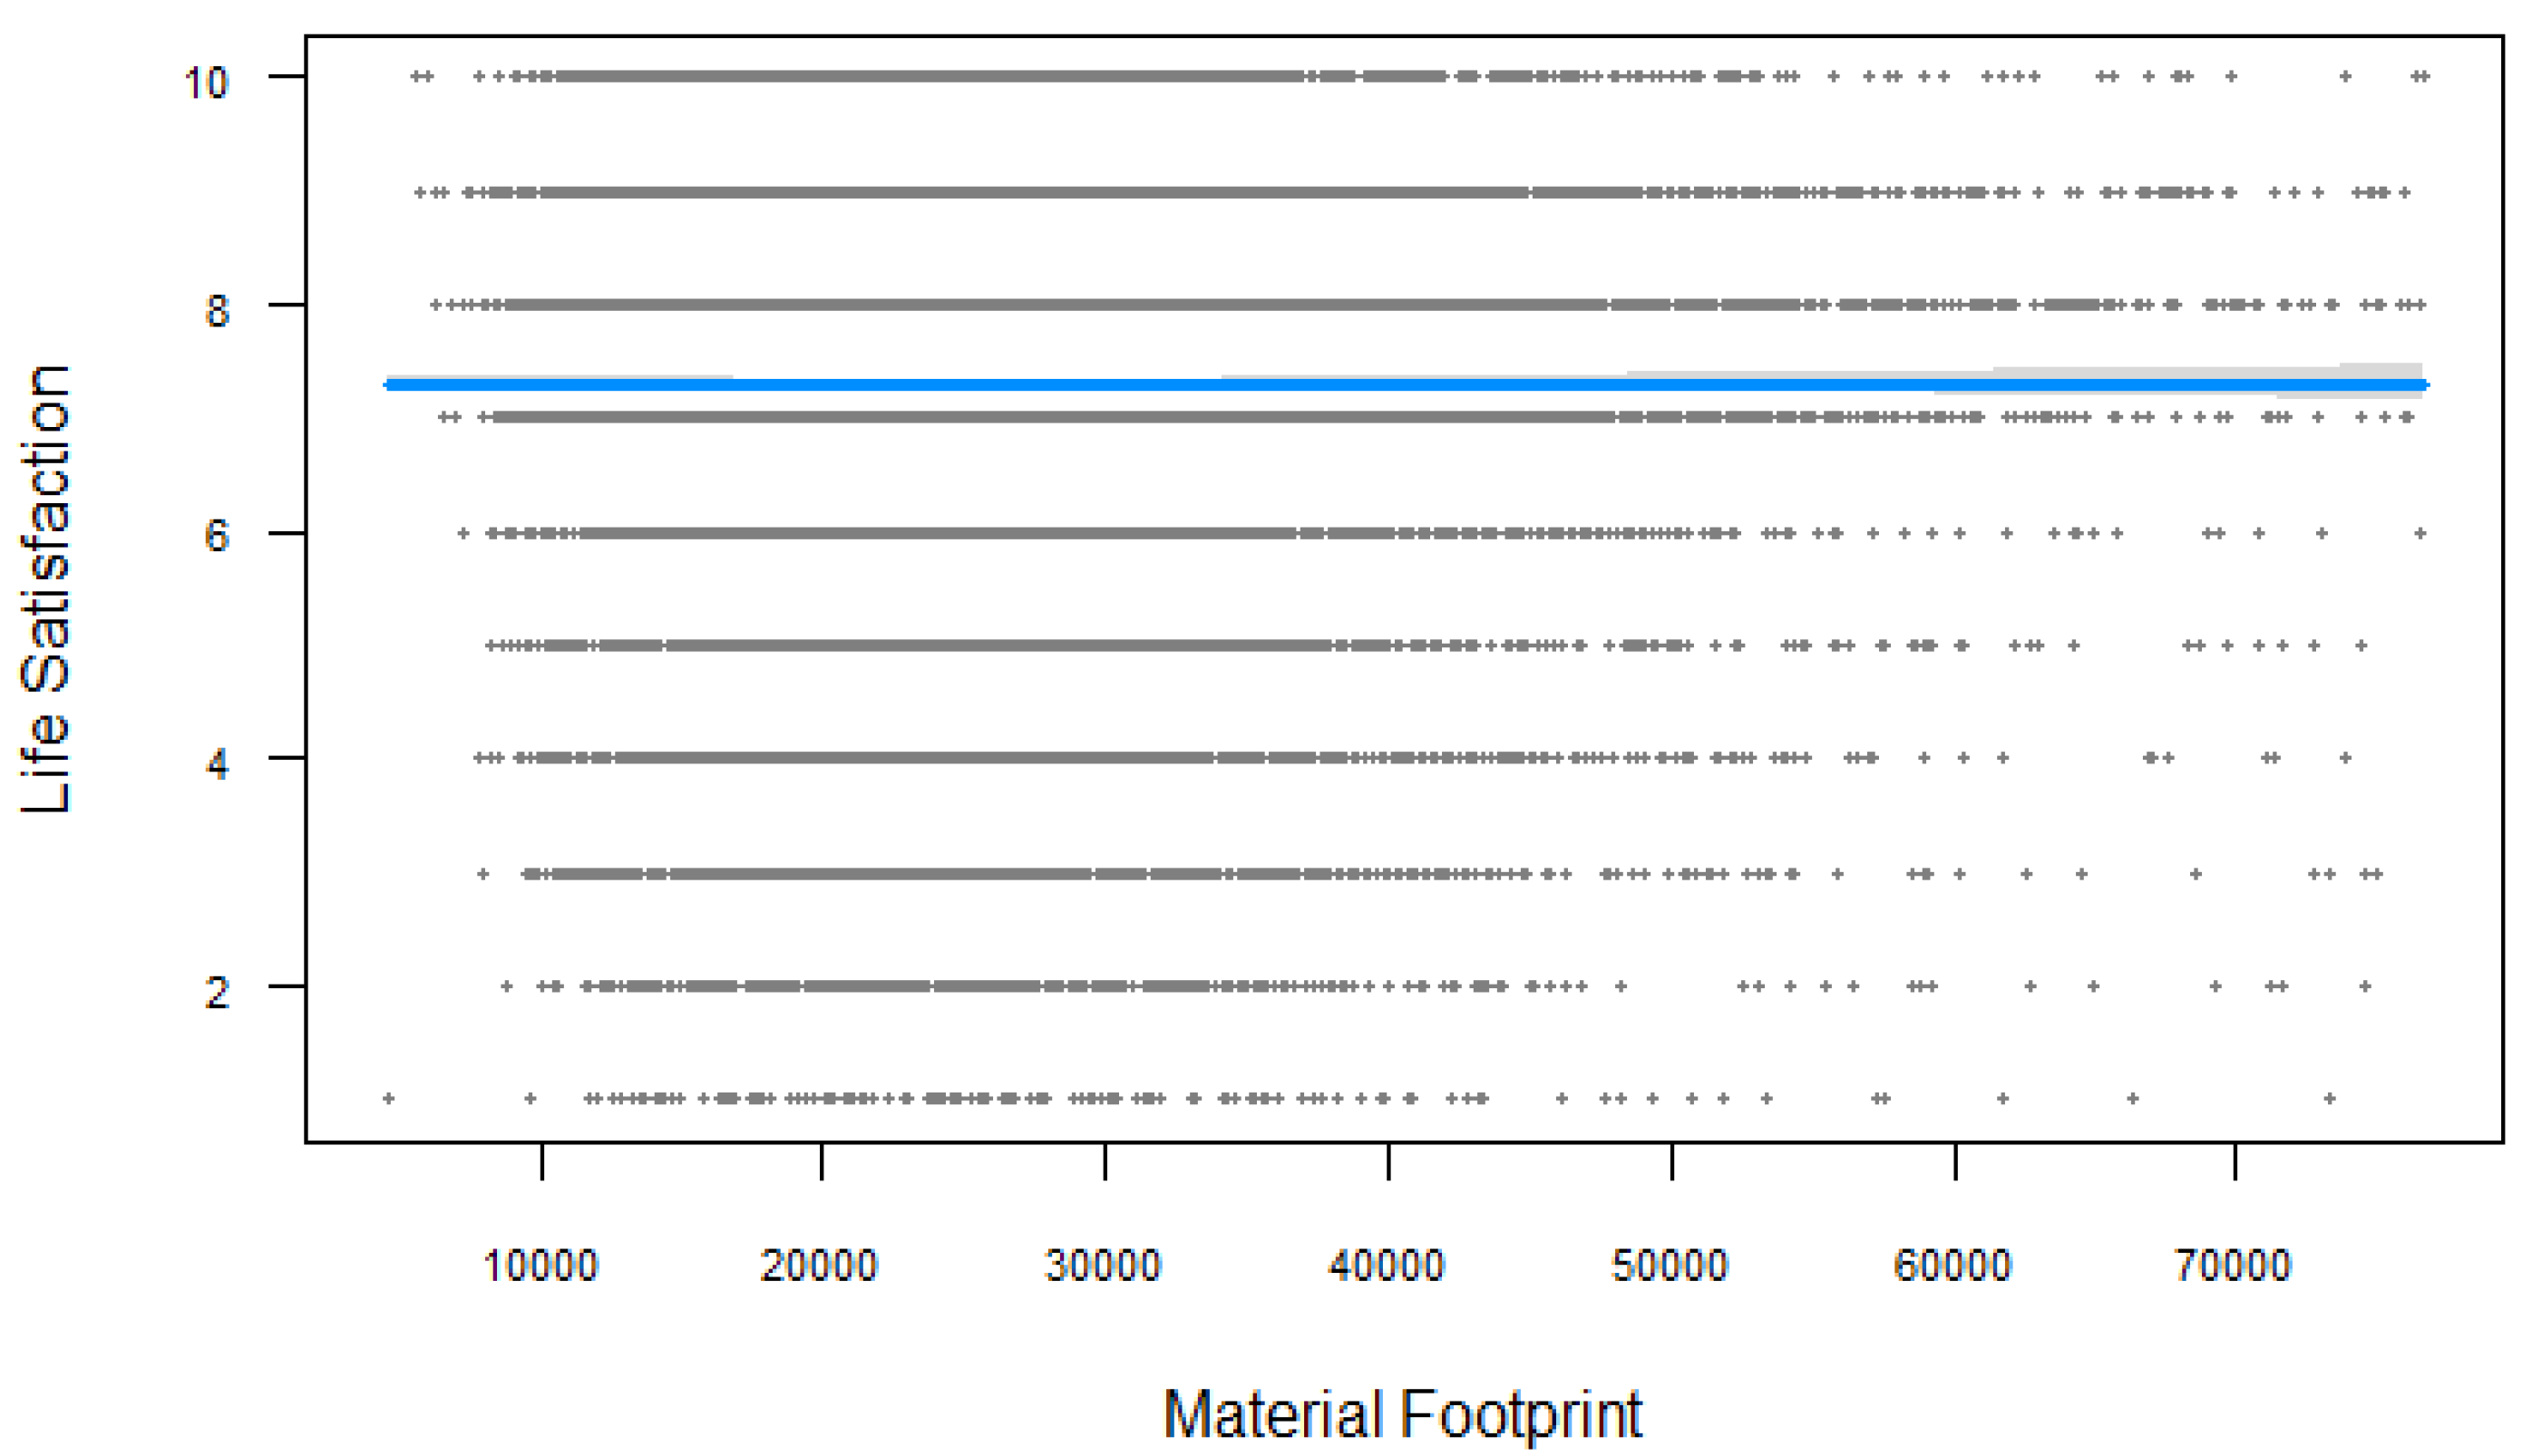
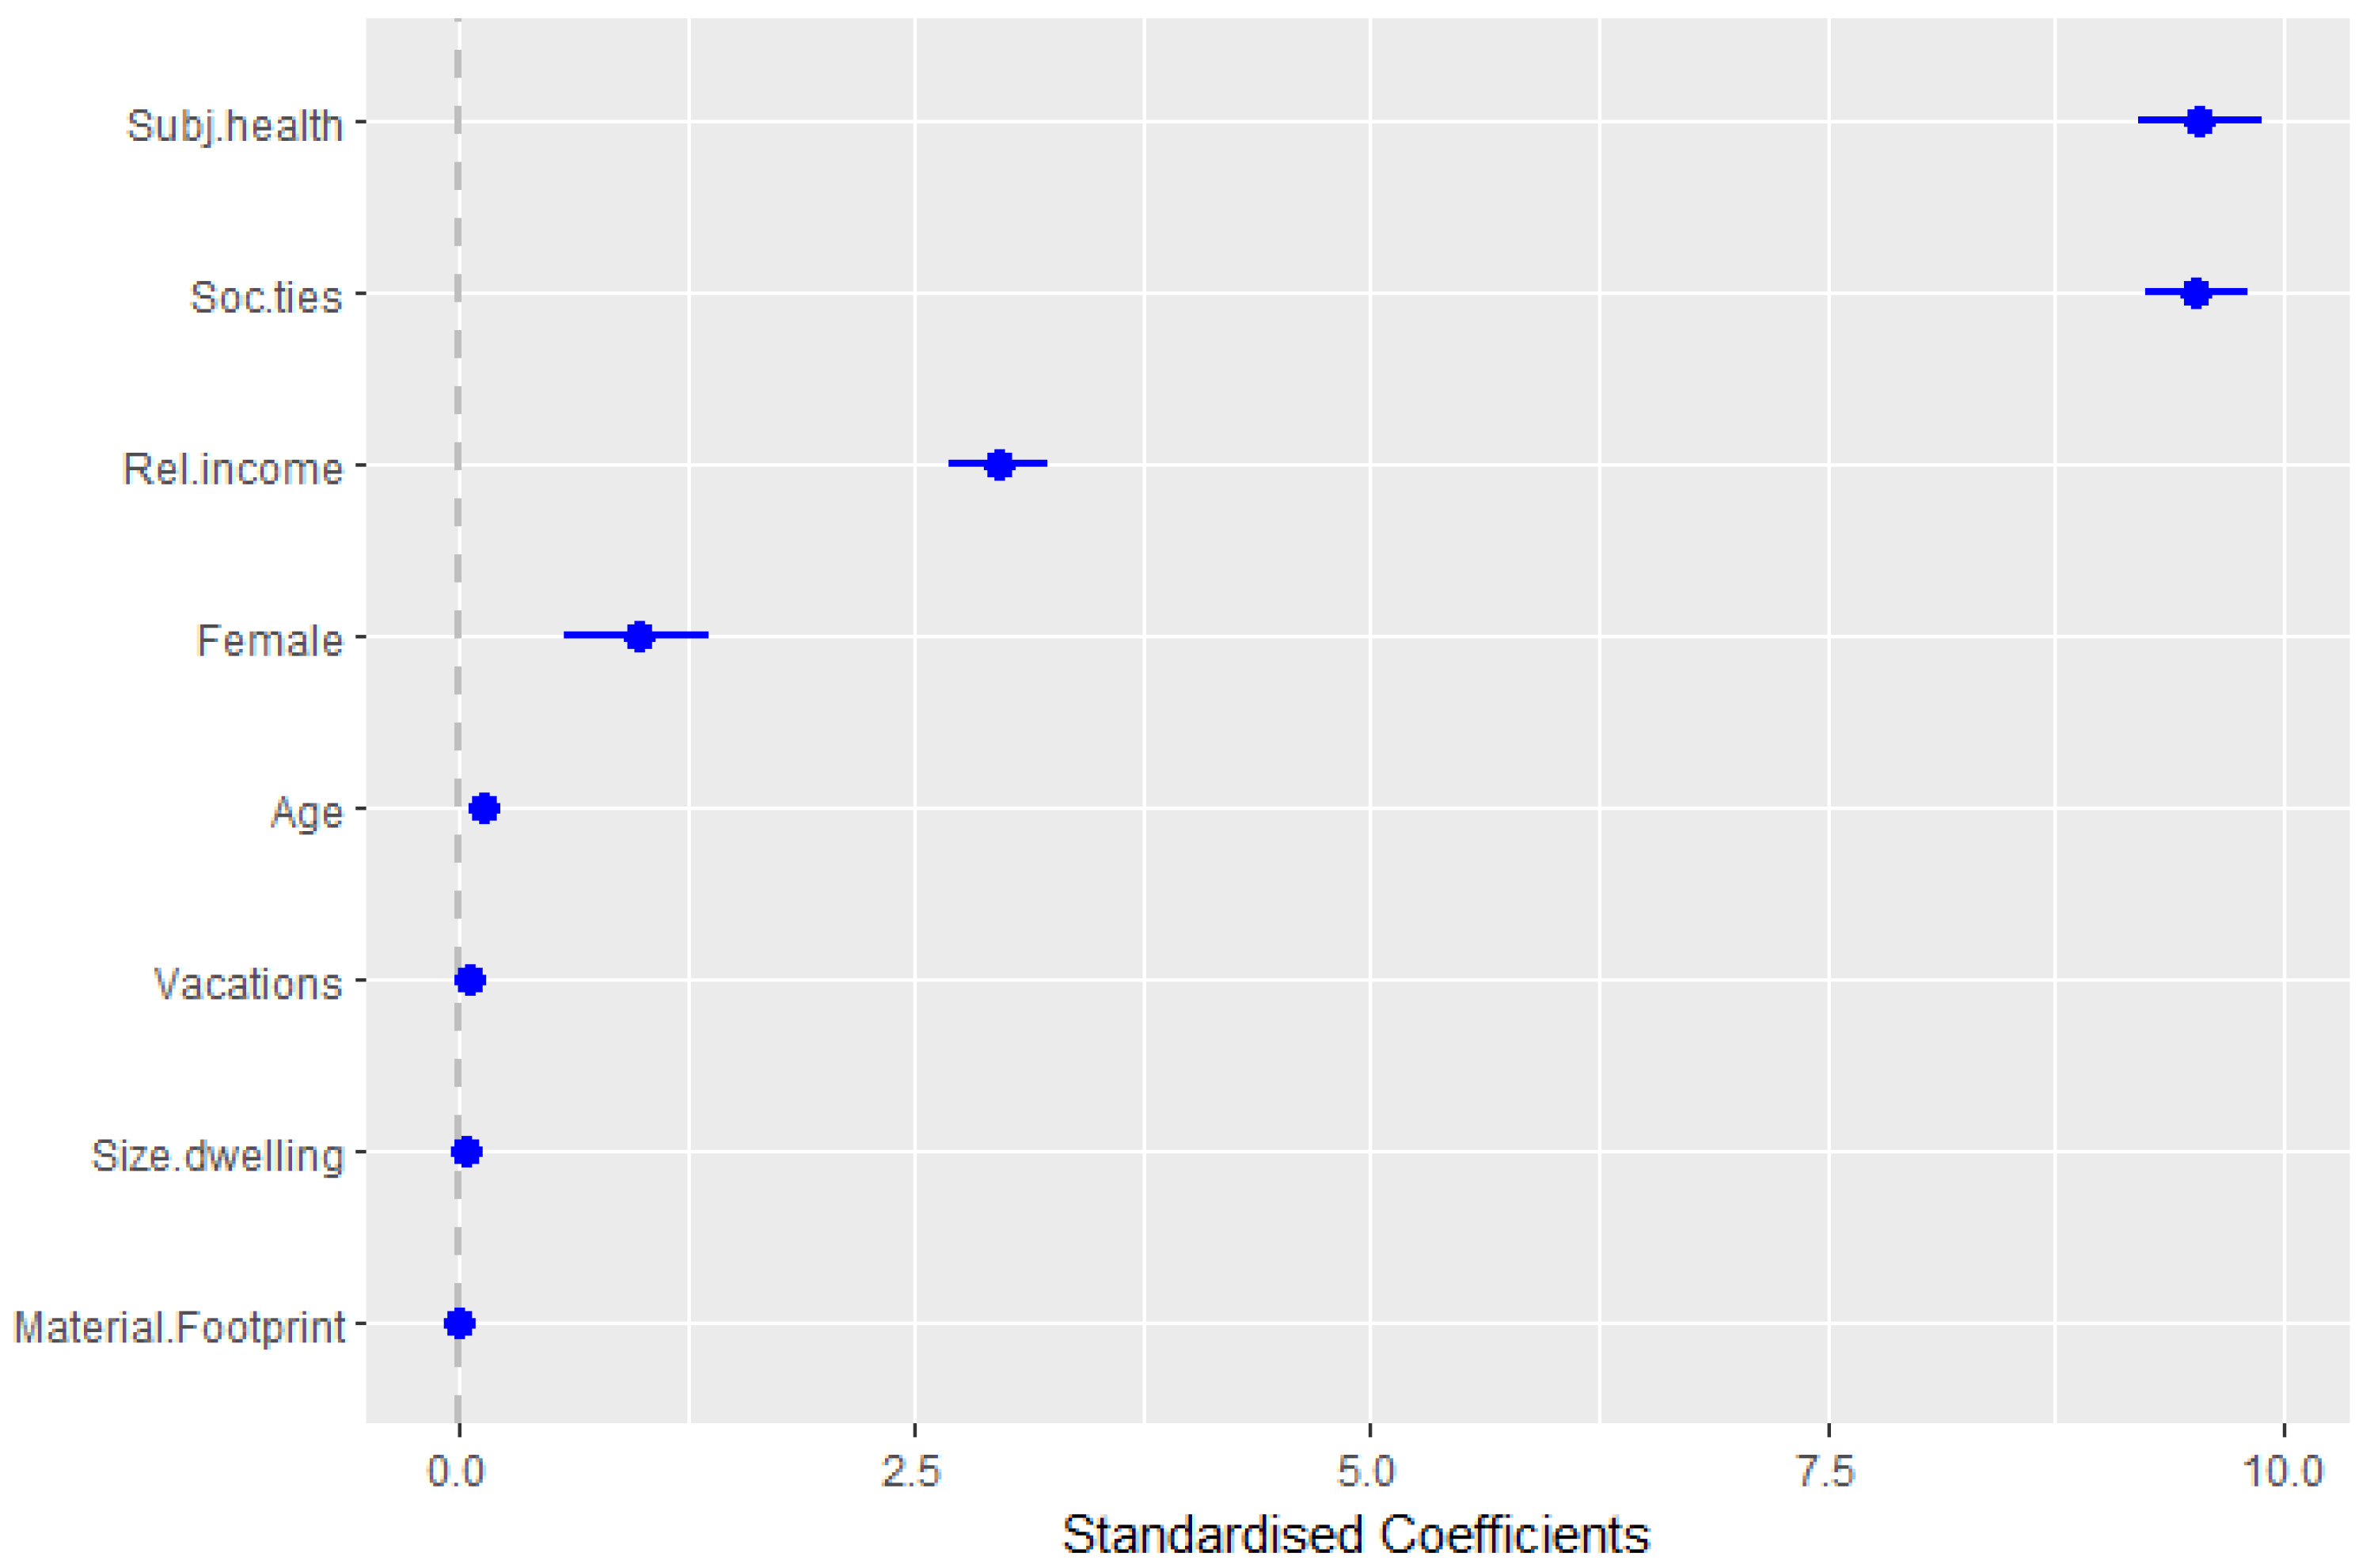
| Material footprint | −0.00003 | −0.0001 ** | −0.0001 *** | −0.0002 *** |
| −0.00003 | −0.00004 | −0.00004 | −0.00004 | |
| Leisure Footprint | 0.004 *** | −0.0002 | 0.001 | 0.0001 |
| −0.0004 | −0.001 | −0.001 | −0.001 | |
| Subj. health | 16.558 *** | 17.146 *** | 16.773 *** | |
| −0.577 | −0.596 | −0.608 | ||
| Social ties | 17.330 *** | 17.132 *** | 16.902 *** | |
| −0.484 | −0.502 | −0.512 | ||
| Rel. income | 5.794 *** | 5.438 *** | 5.370 *** | |
| −0.453 | −0.469 | −0.478 | ||
| Unemployment | 2.701 *** | 1.401 | 1.387 | |
| −0.927 | −1.036 | −1.056 | ||
| Female | 1.950 *** | 2.185 *** | ||
| −0.701 | −0.722 | |||
| Age | 0.261 *** | 0.258 *** | ||
| −0.031 | −0.032 | |||
| Years of schooling | 0.002 | −0.062 | ||
| −0.105 | −0.108 | |||
| Household size | 0.359 | 0.044 | ||
| −0.449 | −0.464 | |||
| Dwelling (in m2) | 0.049 *** | 0.057 *** | ||
| −0.009 | −0.01 | |||
| Vegetarian | 0.213 | |||
| −0.715 | ||||
| Hobbies (in h) | 0.048 | |||
| −0.03 | ||||
| Trips (in km) | 0.002 | |||
| −0.001 | ||||
| Vacations (in d) | 0.082 *** | |||
| −0.026 | ||||
| Constant | 91.020 *** | 59.584 *** | 44.316 *** | 44.764 *** |
| −0.713 | −1.304 | −2.497 | −2.581 | |
| Observations | 25,676 | 11,757 | 11,093 | 10,788 |
| R2 | 0.003 | 0.209 | 0.22 | 0.22 |
| Adjusted R2 | 0.003 | 0.208 | 0.219 | 0.218 |
| F statistic | 39.888 *** (df = 2; 25,673) | 516.554 *** (df = 6; 11,750) | 283.993 *** (df = 11; 11,081) | 202.026 *** (df = 15; 10,772) |
© 2017 by the authors. Licensee MDPI, Basel, Switzerland. This article is an open access article distributed under the terms and conditions of the Creative Commons Attribution (CC BY) license (http://creativecommons.org/licenses/by/4.0/).
Share and Cite
Buhl, J.; Liedtke, C.; Bienge, K. How Much Environment Do Humans Need? Evidence from an Integrated Online User Application Linking Natural Resource Use and Subjective Well-Being in Germany. Resources 2017, 6, 67. https://doi.org/10.3390/resources6040067
Buhl J, Liedtke C, Bienge K. How Much Environment Do Humans Need? Evidence from an Integrated Online User Application Linking Natural Resource Use and Subjective Well-Being in Germany. Resources. 2017; 6(4):67. https://doi.org/10.3390/resources6040067
Chicago/Turabian StyleBuhl, Johannes, Christa Liedtke, and Katrin Bienge. 2017. "How Much Environment Do Humans Need? Evidence from an Integrated Online User Application Linking Natural Resource Use and Subjective Well-Being in Germany" Resources 6, no. 4: 67. https://doi.org/10.3390/resources6040067