Article

Development of a Natural Anti-Age Ingredient Based on Quercus pubescens Willd. Leaves Extract—A Case Study

by
Hortense Plainfossé
1,2,3,
Pauline Burger
1,
Stéphane Azoulay
2,
Anne Landreau
2,4,
Grégory Verger-Dubois
1,3 and
Xavier Fernandez
2,*
1
NissActive, Pépinière Innovagrasse, Espace Jacques-Louis Lions, 4 traverse Dupont, 06130 Grasse, France
2
Université Côte d’Azur, CNRS, Institut de Chimie de Nice UMR7272, 06108 Nice, France
3
Laboratoires JYTA, 1ère Avenue, 5ème rue, 06156 Carros CEDEX, France
4
Faculté de Santé, Université d’Angers, 16 Boulevard Daviers, 49045 Angers CEDEX 01, France
*
Author to whom correspondence should be addressed.
Cosmetics 2018, 5(1), 15; https://doi.org/10.3390/cosmetics5010015
Submission received: 22 December 2017 / Revised: 16 January 2018 / Accepted: 17 January 2018 / Published: 27 January 2018
(This article belongs to the Special Issue Plants Used in Cosmetics)

Abstract

:
Consumers pay more and more attention not just to the safety and health aspects of ingredients entering their cosmetics’ formulations, but also to their potency, origin, processing, ethical value and environmental footprint. Sustainability of the supply chain, preservation of biodiversity, as well as greener extraction techniques are hence very popular with consumers. Consumers are primarily concerned by the efficacy of the cosmetic products they use and continuously scrutinize product labels, so marketing arguments need to be based on rigorous testing and reliable results to support claims (anti-age, anti-pollution, etc.) displayed on the product’s packaging. As a result, the increasing demand for natural ingredients with assessed bioactivities has profoundly modified the strategies adopted by cosmetic professionals to innovate in terms of actives. Sourcing and developing new natural cosmetic actives is a long-term procedure that is thoroughly described in the present paper, via the example of the design of both liquid and solid ingredients based on Quercus pubescens Willd. leaves extract, for which anti-age properties were assessed by a combination of in vitro assays.

1. Introduction

Constantly evolving consumers’ lifestyle is the key driver behind the transformation of the worldwide cosmetic industry engaged over the two past decades [1]: the sector is expected to reach $429.8 billion by 2022, registering a CAGR of 4.3% (Compound Annual Growth Rate, forecast period 2016–2022) [2]. An inclination towards natural beauty and personal care products has been initiated few years ago, fueled by the consumers’ ecological and ethical considerations, and their will for safer cosmetics. ‘Natural’ is often, not always quite rightly, synonym of ‘safer products presenting less side effects’ in the consumers’ mind and one notably notices the boom of ‘without’ claims. In brief, consumers are looking for safer and greener cosmetic ingredients and place a premium on real efficacy, so manufacturers must provide tangible evidence of the allegations claimed on the products’ packaging [3,4]. Consequently, manufacturers are constantly seeking originality and naturality, while multiplying bioassays to scientifically substantiate cosmetic allegations [5], and the natural beauty market valued approximately 11.06 billion U.S. dollars worldwide in 2016, is estimated to reach almost 22 billion U.S. dollars in 2024 [6].
The global cosmetic ingredients market amounted to approximately 22.9 billion U.S. dollars in 2016 is expected to rise to reach 33.80 billion U.S. dollars by the end of 2025 [7,8]. Even continuously progressing, natural ingredients still represent today only 7% of the global market [9]. To keep up with current trends, cosmetic manufacturers must ceaselessly innovate and develop new natural ingredients in accordance to consumer preferences, using the latest technologies of extraction, and notably of eco-extraction (activation methods such as ultrasounds or microwaves, green solvents, etc. [10]), or exploring the potentialities of original natural resources, while keeping sustainability and ethics in mind. Manufacturers can adopt one of the two following strategies to source naturally derived ingredients: they can either call on ethnobotanical knowledge, i.e., select plants of interest based on their renown traditional use (this re-discovery of traditional herbs is particularly efficient in regions presenting such continuous practices), or based on a high-throughput screening (often preferred in more industrialized regions, where traditional practices tend to disappear) [11].
Consumers are daily exposed to air pollutants (volatile organic compounds, ozone, particulate matter, etc.) and to all kinds of blue light sources (fluorescent and LED lighting, flat-screen TV, digital devices such as smartphones, laptops, etc.). They are more and more concerned with the impact of pollution and their hectic lifestyle, on the quality and beauty of their skin [12,13]. These preoccupations are strongly setting the guidelines of the cosmetics market over the next few years: anti-pollution, anti-blue light and moreover anti-age actives will call the tune on the cosmetic ingredients’ market. Skin health and beauty are intimately linked to the overall consumers’ well-being, so it is not surprising that skincare constitutes the cosmetic segment that witnessed the strongest growth over the 1998–2010 period, with maket shares evolving from 16.4% to 23.0% [1]. Skin aging is a complex biological process influenced by a combination of endogenous (genetics, metabolic processes, etc.) and exogenous (pollution, UV-radiations, chemicals, etc.) factors [14,15]. To fight the visible signs of aging, cosmetic anti-aging ingredients reinforce the skin barrier, improve the skin elasticity, boost its density, protect it against radicals, fade wrinkles, diminish the apparition of age spots, etc. The pursuit of beauty and the demographic realities—life expectancy registered over the last few years its fastest gain since the 1960s [16]—are substantially and ceaselessly fueling the demand for anti-aging actives and formulations; this sector is no exception: naturality rules.
The worldwide biodiversity constitutes an exceptional reservoir of innovative molecules presenting highly diverse structures and functions that can be tapped for novel drug leads as well as cosmetic development [17]. The Mediterranean area has long been identified as a region presenting high biodiversity due to its remarkable flora and specially its high rate of endemic species: representing only 2% of the world’s surface, this area houses 20% of the world’s total floristic richness [18,19]. This Mediterranean biome hence constitutes a choice target to source interesting molecules and notably natural ingredients intended for cosmetics and personal care formulation. Due to its establishment at the heart of this rich region and to its expertise in phytochemistry, our research team has access to this diversity through longstanding collaborations. Hence, 50 Mediterranean plants were initially selected over more than 500 available at the laboratory for the present study, based on their accessibility and their originality regarding the anti-aging activity (no anteriority such as already existing scientific article or patent). Hence, aqueous and organic solvent extracts, as well as essential oils were investigated for their anti-aging properties. From this survey, a crude extract of Quercus pubescens Willd. (Fagaceae) leaves display the best unprecedented anti-aging activities and was then selected for further investigations leading to the development of an innovative anti-age active and its practical cosmetic formulation.
Q. pubescens (genus Quercus sect. Quercus), commonly known as downy or pubescent oak, is a species of white oak native to southern Europe and southwest Asia [20] ; the word ‘pubescens’ meaning ‘with soft bristle’ actually refers to its hairy leaves and twigs, constituting an adaptation to drought. This species is also known as ‘truffle oak’ as it serves among other species as a host for economically important truffles. Q. pubescens is a medium-sized deciduous tree growing up to 20 m, preferentially in regions presenting a sub-Mediterranean microclimate characterized by hot dry summers and cool winters with little rainfall [21,22]. Particularly adaptable, this species grows on well-drained lime soils as well as on acidic grounds, and is found from sea level up to 1300 m [23]. Extracts of various species of oak are already used in cosmetics, mainly as skin conditioning actives; however, those actives are mainly based on bark or wood extracts: such a sampling endangers the survival of the oak trees tapped and is therefore not sustainable [24,25,26,27]. One patent reports the composition of an anti-oxidant cosmetic formula based on Q. robur, Q. ilex and Q. pubescens bark extracts [28]. To our knowledge, no previous study reports the development and the subsequent use of an extract of Q. pubescens leaves as a cosmetic active.
Developing and objectifying new natural cosmetic ingredients is a long-term procedure that is presented in detail in this article, via the example of the design of an anti-age ingredient based on an extract of Q. pubescens leaves. The first step consists of the optimization of the extraction procedure of Q. pubescens leaves to potentialize the bioactivity of the resulting extract while keeping in mind its further industrial scale-up. The second part of such a development encompasses the amelioration of the extract’s formulability, including its discoloration and/or deodorization, and the further development of both liquid and solid forms of the cosmetic ingredient.

2. Materials and Methods

All chemicals were obtained from Sigma-Aldrich (St. Louis, MO, USA) unless otherwise stated.

2.1. Plant Material

Leaves of Q. pubescens were collected respectively in December 2016 and in June 2017 from two different places in Provence-Alpes-Côte d’Azur, France (Figure 1): Vinon-sur-Verdon and the Valrose Park in Nice. A voucher has been deposited in the botanical collection at the Natural History Museum, Nice under the reference number NICE-D-4382.

2.2. Plant Extraction

The plant material was air dried and crushed into fine powder. Extraction of plant material was then performed by maceration using either the water/ethanol (H2O/EtOH 1/1) system or pure EtOH. About 1 g of plant material was extracted with approximately 10 g of solvent (extraction ratio 1/10) at room temperature (RT) using a magnetic stirrer (500 rpm) for 2 h. The resulting extracts were then filtered over filter paper 8–12 µm, gathered together and vacuum-concentrated to dryness.

2.3. Fractionation of Q. pubescens Leaves Extract

To identify the active fractions, the H2O/EtOH 1/1 extract of Q. pubescens leaves was then fractionated over silica gel (normal phase). The fractionation of the bulk extract led to the recovery of 5 distinct fractions: F1 (250 mL cyclohexane), F2 (250 mL cyclohexane/diethyl ether 1/1), F3 (250 mL diethyl ether), F4 (250 mL methanol) and F5 (250 mL methanol/water 1/1). The resulting fractions were further evaluated for their bioactivities, and their respective compositions were addressed by HPLC (High Performance Liquid Chromatography) and GC (Gas Chromatography), as well as by UPLC-HRMS (Ultra Performance Liquid Chromatography-High Resolution Mass Spectrometry, operated in the conditions presented in the following sections).

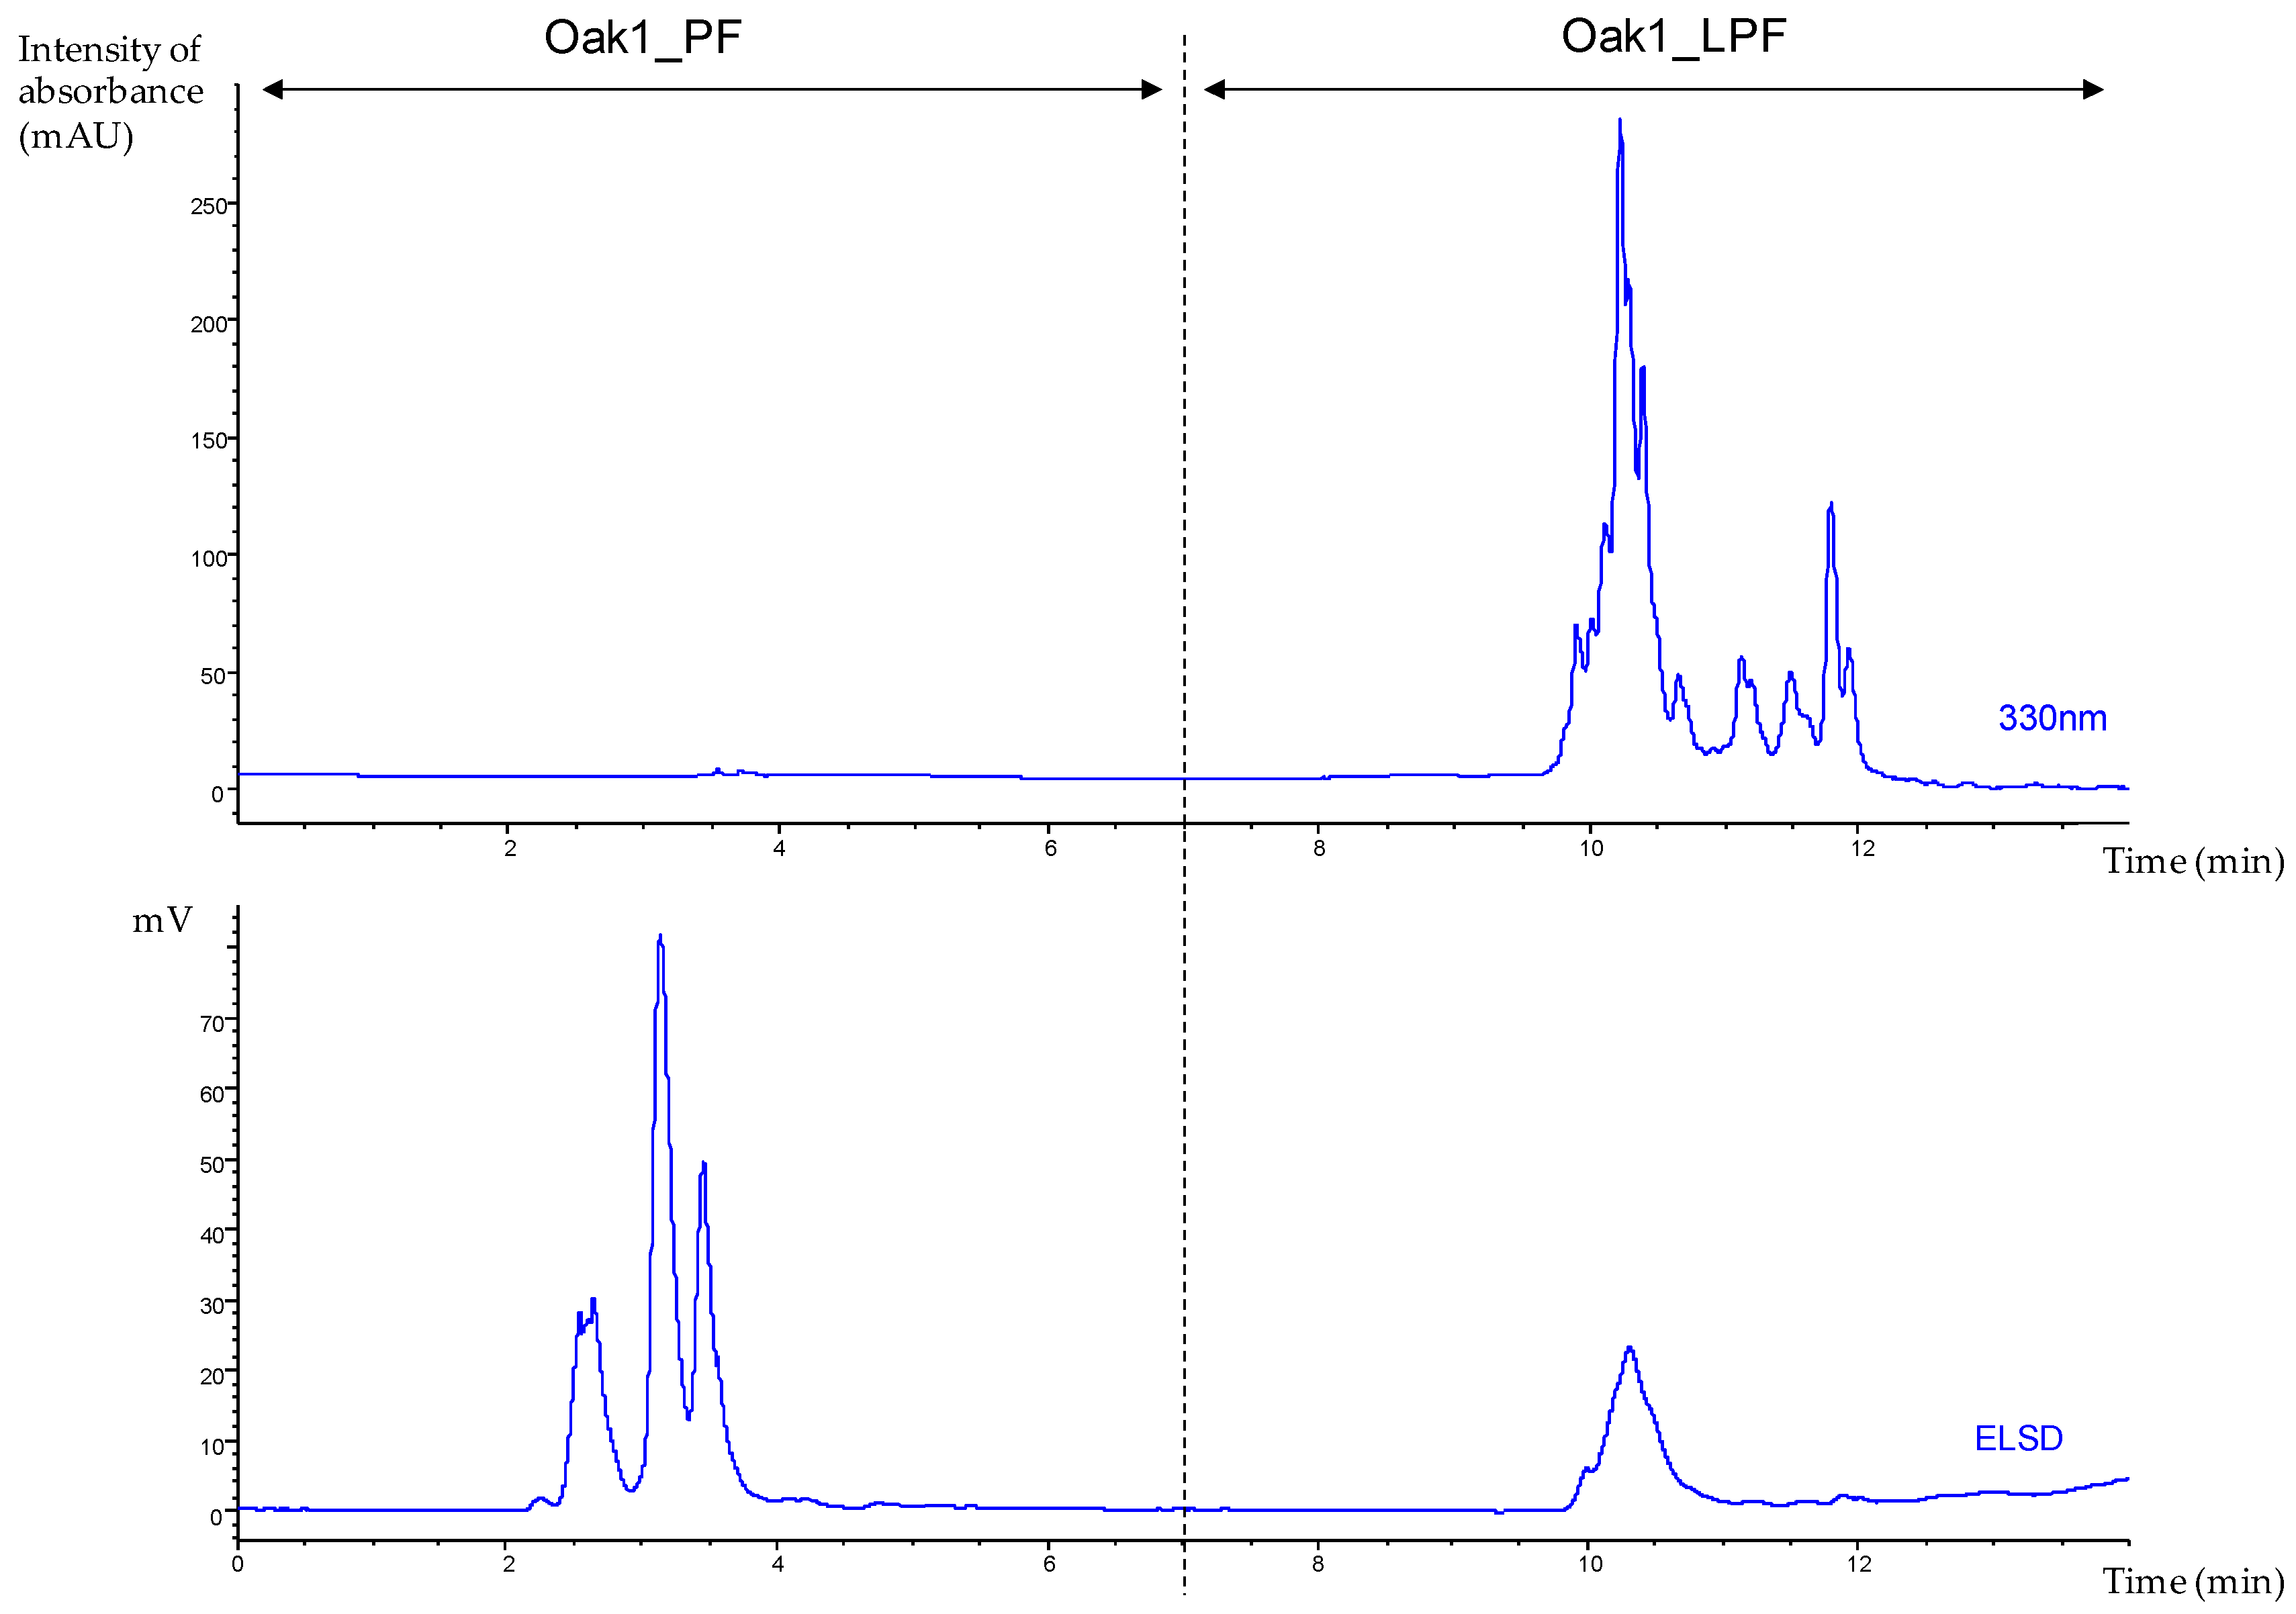
2.4. High Performance Liquid Chromatography

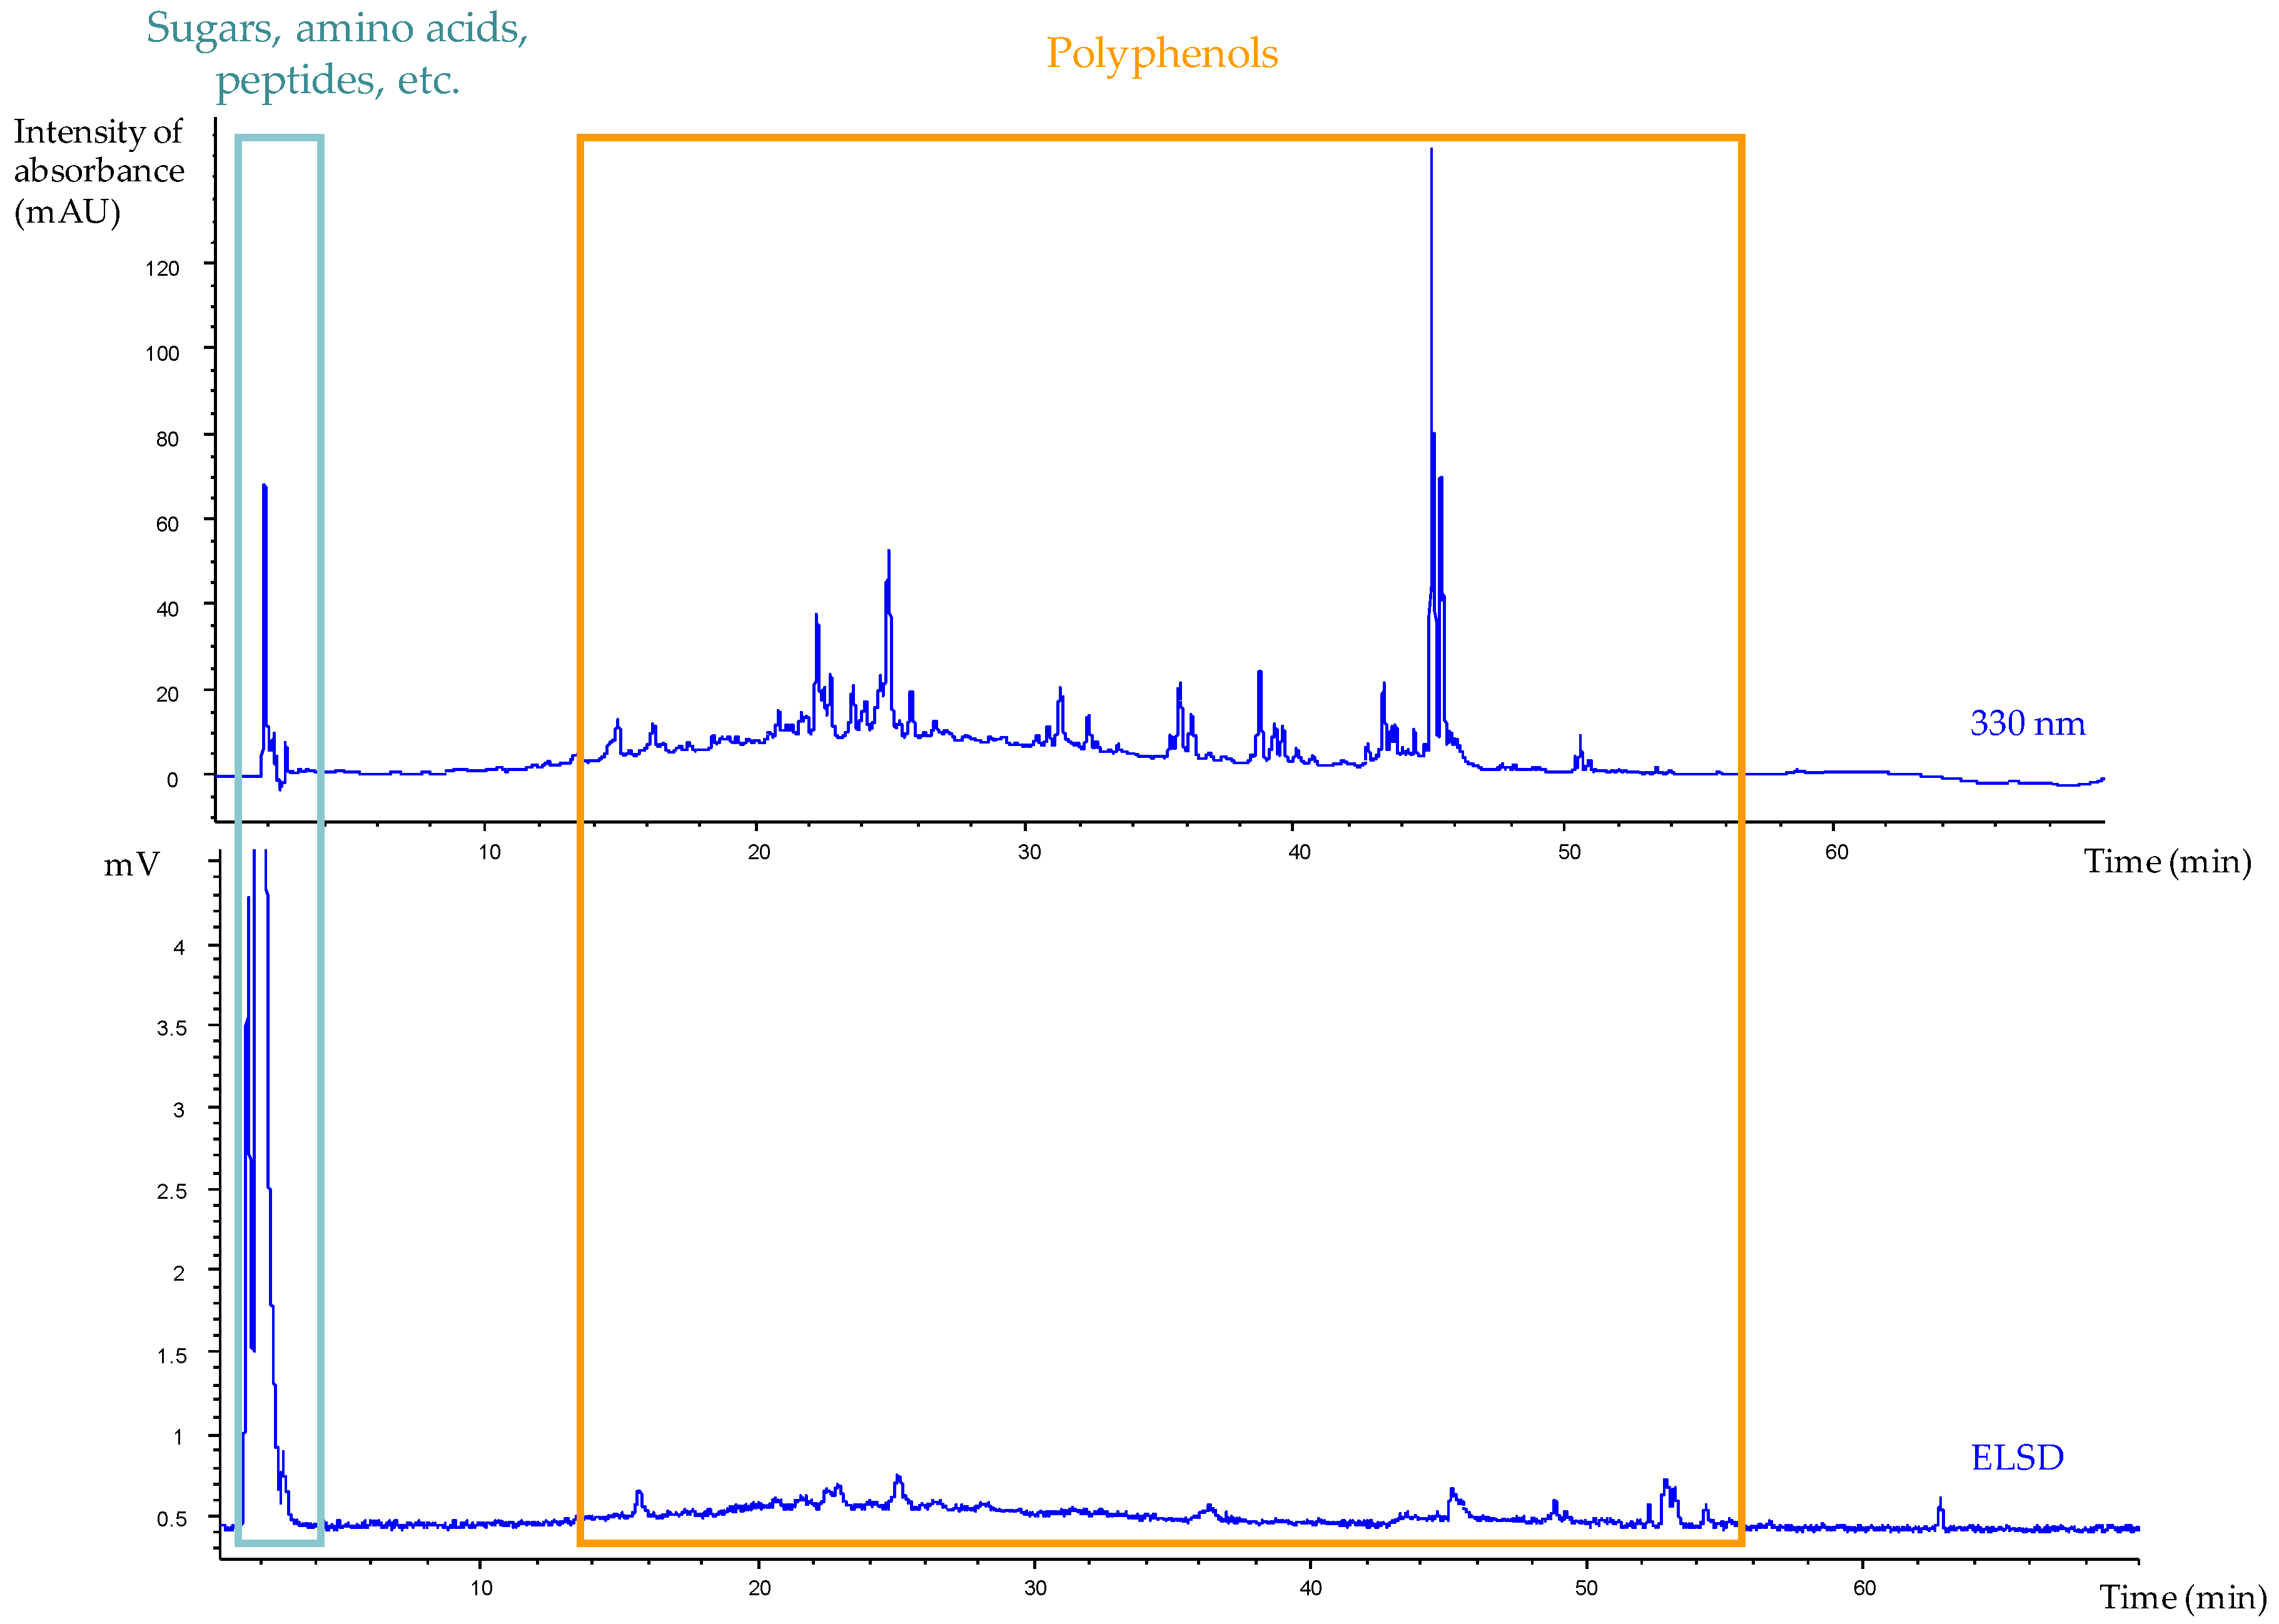
2.4.1. HPLC Analyses

Crude extracts and fractions diluted at 10 mg/mL in methanol (MeOH; chromatography grade) and filtrated over 0.45 µm PTFE syringe filter (polytetrafluoroethylene), were analyzed using an HPLC Agilent 1200 system (Courtaboeuf, Ile-de-France, France) equipped with a DAD (Diode Array Detector) and an ELSD (Evaporative Light Scattering Detector) operating under the following conditions: injection volume: 20 µL, and flow rate: 1.0 mL/min. Separations were performed on a C18 column (Phenomenex, Le Pecq, Ile-de-France, France; Luna® 5 μm, 150 mm × 4.6 mm i.d.). The mobile phase consisted in a multistep gradient of water (A), acetonitrile (B) and 2-propanol (C), all acidified with 0.1% acid formic: 0–5 min, 5% B; 5–40 min, 5–45% B; 40–50 min, 100% B; 50–55 min, 100% B; 55–68 min, 100% C, 68–70 min, 100% C. The DAD was set at 220, 254 and 330 nm, and ELSD conditions were set as follows: nebulizer gas pressure 3.7 bars, evaporative tube temperature 40 °C and gain 4.

2.4.2. Semi-Preparative HPLC

Q. pubescens extract obtained using H2O/EtOH 1/1 was then evaporated to dryness, dissolved in methanol (50 mg/mL) and semi-preparative HPLC was performed on a C18 column (Phenomenex, Le Pecq, Ile-de-France, France; Luna® 5 μm, 250 mm × 10 mm i.d.). Elution was performed using a multistep gradient of water (A) and acetonitrile (B), both acidified with 0.1% acid formic: 0–5 min, 5% B; 5–10 min, 5–100% B and 10–14 min, 100% B, under the following conditions: injection volume: 100 µL, and flow rate: 4.0 mL/min. Multiple injections were carried out and the resulting respective sub-fractions were pooled together.

2.5. Gas Chromatography-Mass Spectrometry (GC-MS)

The GC-MS analyses were performed using an Agilent 6890 gas chromatograph (Palo Alto, CA, USA) equipped with an Agilent MSD5973N mass selective detector, a multifunction automatic sampler (Combi-Pal, CTC Analytics, Zwingen, Switzerland) on an HP-1 MS capillary column (100% polydimethylpolysiloxane; 0.2 mm × 50 mm; film thickness, 0.33 μm). Samples (1 µL) were injected in splitless mode (split vent: 50 mL/min–30 s) and the injector was set at a temperature of 250 °C. The carrier gas was helium in constant flow mode at 1 mL/min. The oven temperature was programmed to rise from 60 °C to 180 °C at 2 °C/min, then from 180 °C to 300 °C at 6 °C/min and kept isothermally at 300 °C for 5 min. Acquisition was performed in scan mode (35–500 a.m.u. (atomic mass unit)/s; scan rate: 3.15 scans/s) and mass spectra were generated at 70 eV.
Compound identifications were based on comparison of mass spectra with literature, commercial libraries NIST, Wiley, Indianapolis, IN, USA) and laboratory MS libraries built up from pure substances, combined with comparison of GC linear retention index (LRI) [29,30]. Retention indices were determined with a series of linear alkanes C8–C24 used as a reference.

2.6. Bioassays

2.6.1. Materials

Untreated 96-well plates were purchased from Thermo Nunc (Villebon-sur-Yvette, Ile-de-France, France), whereas the UV-transparent ones were obtained from Costar, Sigma-Aldrich (Saint-Quentin Fallavier, Auvergne-Rhône-Alpes, France). Adhesive films (Greiner Bio-One, Courtaboeuf, Île-de-France, France) were used to seal the 96-well plates during incubation. Samples (extracts, fractions, standards and controls) were prepared at a concentration of 3.433 mg/mL in dimethyl sulfoxide (DMSO) in 1.5 mL Eppendorf tubes, appropriate for the use of the automated pipetting system epMotion® 5075 (Eppendorf, Montesson, Île-de-France, France).
An hydroglycerinated extract of Q. robur heartwood commercialized for its claimed protective activities against photo-aging, free radicals and environmental factors, was tested alongside our samples to perform direct comparison between oak-based ingredients.

2.6.2. Instrumentation

An automated pipetting system Eppendorf epMotion® 5075 was used to carry out the bioassays. A microplate reader (Spectramax Plus 384, Molecular Devices, Wokingham, Berkshire, UK) was used to measure absorbance values. Data were acquired with the SoftMaxPro software (Molecular devices, Wokingham, Berkshire, UK) and the Prism software (GraphPad Software, La Jolla, CA, USA) was used to calculate inhibition percentages. Unless otherwise stated, the results are presented as inhibition percentages (I%) calculated as follows:
I% = [(ODcontrol − ODsample)/ODcontrol] × 100 (with OD stating for optical density).
Similarly, all OD were corrected with the blank measurement corresponding to the absorbance of the sample before addition of the substrate.

2.6.3. DPPH Radical Scavenging Assay

The antioxidant activity of the extracts and fractions was measured based on the scavenging activity of the stable 1,1-diphenyl-2-picrylhydrazyl (DPPH) radical according to the following method widely used to examine the antioxidant activity of plant extracts [31,32]: 150 µL of a solution of ethanol/acetate buffer 0.1 M pH = 5.4 (50/50) were distributed in each well, together with 7.5 µL of the extracts evaluated (final concentration per well: 100 µg/mL). Trolox (3607.8 µM in DMSO) and a commercial extract of Rosmarinus officinalis L. (3.433 mg/mL in DMSO) were used as positive controls; DMSO alone constitutes the negative one (ODcontrol). A first OD reading was performed at 517 nm (ODblank). Then, 100 µL of a DPPH solution (386.25 µM in ethanol) were distributed in each well. The plate was sealed and incubated in the dark at room temperature (RT). After 30 min, the final OD reading was performed at 517 nm to assess the percentage of inhibition.

2.6.4. Tyrosinase Assays

Tyrosinase is a copper-containing oxidase controlling the production of melanin; it is mainly involved in the hydroxylation of l-tyrosine into L-DOPA (l-3,4-dihydroxyphenylalanine. monophenolase activity) and its further oxidation to dopaquinone (diphenolase activity). Since this enzyme plays a key role in melanogenesis, tyrosinase inhibitors are of great concern in the development of skin whitening agents [33]. The assays were performed as follows: 150 µL of a solution of mushroom tyrosinase prepared at a concentration of 171.66 U/mL in phosphate buffer (100 mM pH = 6.8) were distributed in each well (enzyme’s final concentration per well: 100 U/mL (monophenolic activity assay) or 50 U/mL (diphenolic activity assay)), together with 7.5 µL of the extracts evaluated (final concentration per well: 100 µg/mL). Kojic acid (3.433 mM in DMSO) and a commercial extract of Arctostaphylos uva-ursi (L.) Spreng. (3.433 mg/mL in DMSO) were used as positive controls; DMSO alone constitutes the negative one (ODcontrol). The plate was filmed and incubated at RT for 20 min. Then, 100 µL of a solution of l-tyrosine (monophenolic activity assay) or L-DOPA (diphenolic activity assay) 1 mM in phosphate buffer pH = 6.8 (substrate’s final concentration per well: 0.388 mM) were distributed in each well. After 20 min of incubation, OD reading was performed at 480 nm to assess the percentage of inhibition.

2.6.5. Lipoxygenase Assay

Lipoxygenase, an iron-containing enzyme catalyzing the deoxygenation of polyunsaturated fatty acids into the corresponding hydroperoxides, is known to play a key role in inflammation [34]. The assays are performed as follows: 150 µL of a solution of soybean lipoxygenase prepared at a concentration of 686.66 U/mL in phosphate buffer (50 mM pH = 8) were distributed in each well (enzyme’s final concentration per well: 400 U/mL), together with 7.5 µL of the extracts evaluated (final concentration per well: 100 µg/mL). Quercetin hydrate (1000 µM in DMSO) and a commercial extract of Arnica montana L. (3.433 mg/mL in DMSO) were used as positive controls; DMSO alone constitutes the negative one (ODcontrol). The plate was sealed and was incubated in the dark for 10 min. Then, 100 µL of a solution of linoleic acid prepared in phosphate buffer pH = 8 were distributed in each well. After incubation for 2 min in the dark, a first OD reading was performed at 235 nm. After a further incubation of 50 min, the final OD reading was performed at 235 nm to assess the percentage of inhibition.

2.6.6. Elastase Assay

Elastase is a serine protease that preferentially digests elastin, the highly elastic protein that works together with collagen to give skin its shape and firmness [35]. The assays were performed as follows: 150 µL of a solution of porcine pancreatic elastase prepared at a concentration of 0.171 U/mL in Tris buffer (50 mM pH = 8) were distributed in each well (enzyme’s final concentration per well: 0.1 U/mL), together with 7.5 µL of the extracts evaluated (final concentration per well: 100 µg/mL). Quercetin hydrate (8583.33 µM in DMSO) and a commercial extract of Rubus idaeus L. (3.433 mg/mL in DMSO) were used as positive controls; DMSO alone constitutes the negative one (ODcontrol). The plate was filmed and incubated at RT for 20 min. A first OD reading was performed at 410 nm. Then, 100 µL of a solution of N-succinyl-Ala-Ala-Ala-p-nitroanilide 2.06 mM in Tris buffer (Suc-AAA-pNA’s final concentration per well: 0.8 mM) were distributed in each well. After 40 min incubation, OD reading was performed at 410 nm to assess the percentage of inhibition.

2.6.7. Hyaluronidase Assay

Hyaluronidases are a family of enzymes that degrade hyaluronic acid, a high-molecular-weight glycosaminoglycan of the extracellular matrix. Presenting a unique capacity to bind and retain water molecules, this macromolecule is widely distributed in the body and notably at the periphery of collagen and elastin fibers: it therefore plays a major role in skin aging [36,37]. The assays were performed as follows: 150 µL of a solution of hyaluronidase prepared at a concentration of 13.3 U/mL in hyaluronidase buffer (pH 7) were distributed in each well, together with 7.5 µL of the extracts evaluated (final concentration per well: 100 µg/mL). Tannic acid (0.435 mg/mL in DMSO and a commercial extract of Rubus idaeus L. (3.433 mg/mL in DMSO) were used as positive controls; DMSO alone constitutes the negative one (ODcontrol). The plate was filmed and incubated at 37 °C for 20 min. A first OD reading was performed at 405 nm. Then, 100 µL of a solution of hyaluronic acid prepared at a concentration of 150 µg/mL in buffer (pH 5.35) were distributed in each well. After 30 min incubation at 37 °C, 50 µL of CTAB (cetyltrimethylammonium bromide) prepared at a concentration of 40 mM in a NaOH solution (2%) were added in each well and OD reading was performed at 405 nm to assess the percentage of inhibition (ODsample).
The results are presented as inhibition percentages (I%) calculated as follows:
I% = [ODsample/(ODblank − ODcontrol)] × 100.

2.6.8. Collagenase Assay

Responsible for the tensile strength of the skin, collagen constitutes therefore one of the structural units of the extracellular matrix. Collagenases are enzymes that cleave the collagen molecule within its helical region and that are more generally involved in the degradation of the extracellular matrix components, thus leading to skin wrinkling [38]. The assays were performed as follows: 150 µL of a solution of collagenase prepared at a concentration of 53 U/mL in tricine buffer (pH 7.5) were distributed in each well, together with 7.5 µL of the extracts evaluated (final concentration per well: 100 µg/mL). Tannic acid (1.72 µM in DMSO) and a commercial extract of Glycyrrhiza glabra L. (3.433 mg/mL in DMSO) were used as positive controls; DMSO alone constitutes the negative one (ODcontrol). The plate was filmed and incubated at RT for 15 min. A first OD reading was performed at 345 nm. Then, 100 µL of a solution of FALGPA (2-furanacryloyl-l-leucylglycyl-l-prolyl-l-alanine) prepared at a concentration of 5.15 mM in tricine buffer were distributed in each well. After 30 min incubation, final OD reading was performed at 345 nm to assess the percentage of inhibition (ODsample).
The results are presented as inhibition percentages (I%) calculated as follows:
I% = [ODsample/(ODblank − ODcontrol)] × 100.

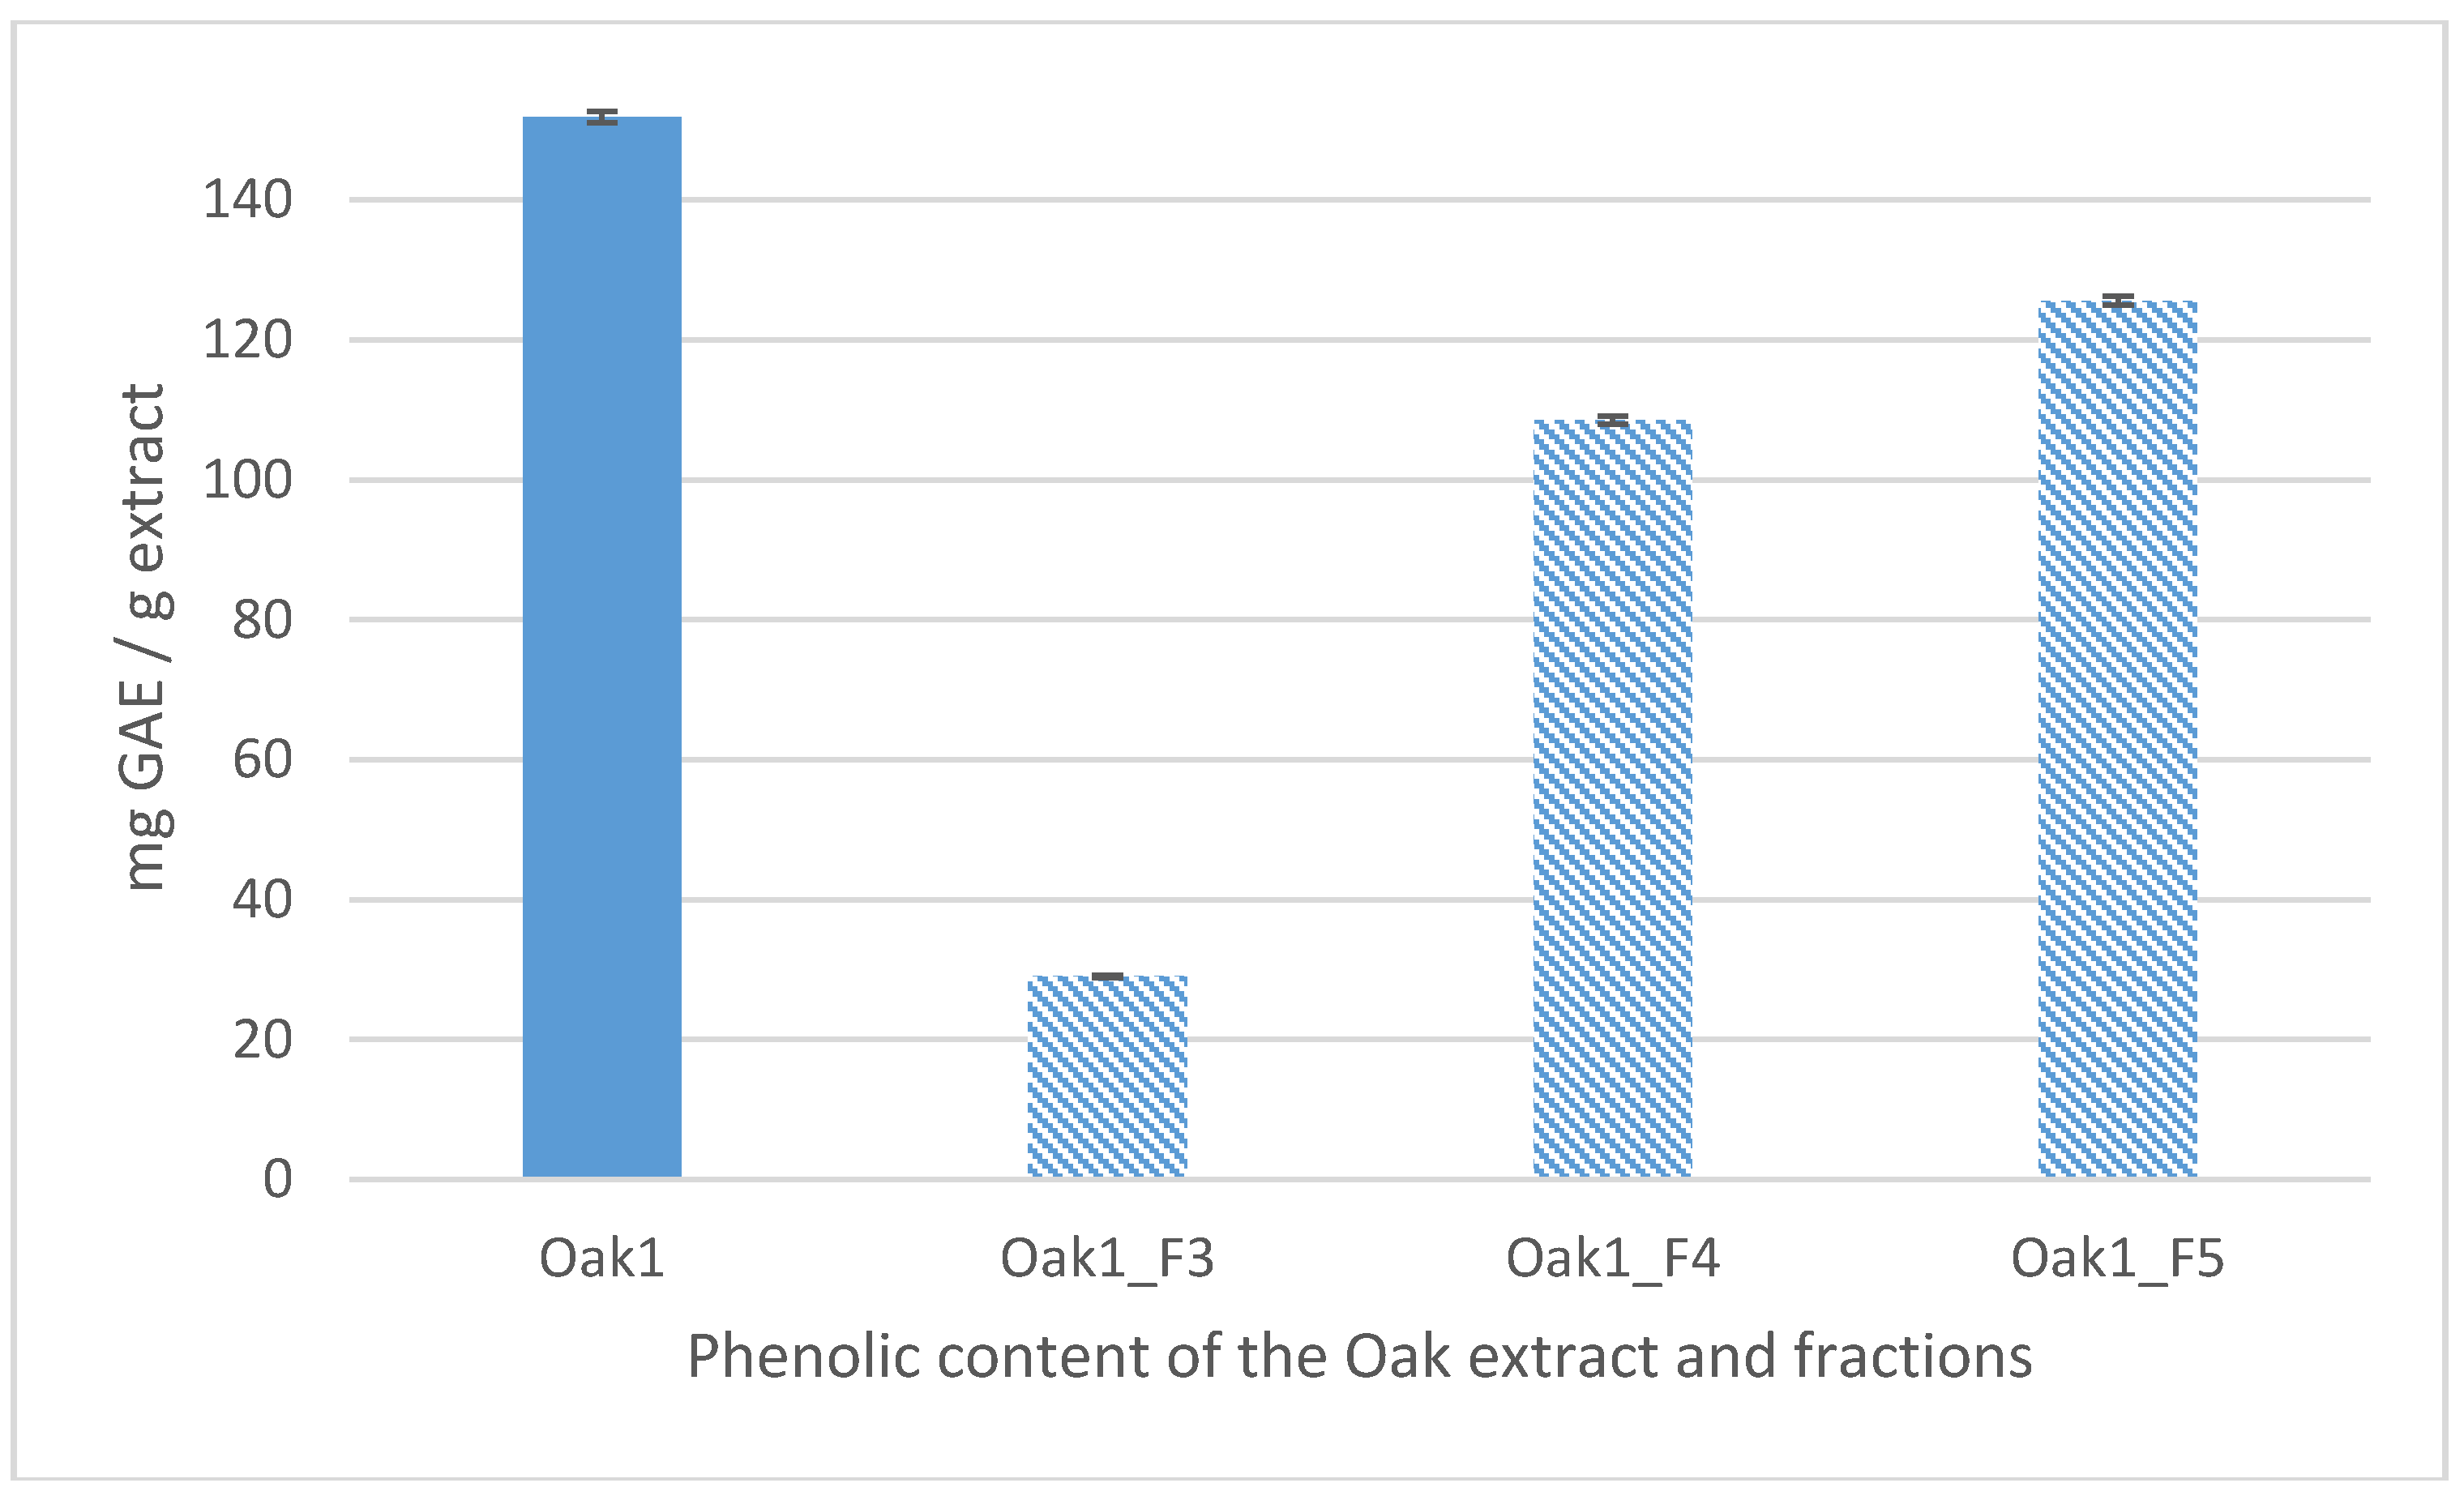
2.6.9. Total Polyphenol Analysis

The total polyphenolic content was estimated by the Folin–Ciocalteu method in 96-well plates as follows [39]: 75 µL of ultrapure water were distributed in each well, together with 15 µL of the extracts evaluated (final concentration per well: 100 µg/mL). DMSO alone was used as negative control. Then, 25 µL of a solution of Folin–Ciocalteu reagent/ultrapure water (1/1) were added in each well. After 6 min incubation under agitation, 100 µL of a solution of sodium carbonate (75 g/L) were distributed in each well. The plate was then filmed and incubated at RT in the dark for 90 min. An OD reading was performed at 765 nm: the amounts are expressed in milligrams of gallic acid equivalents (GAE) per gram of extract. The standard curve was prepared with gallic acid solutions (concentrations range: 200, 100, 50, 25 and 12.5 µg/mL).

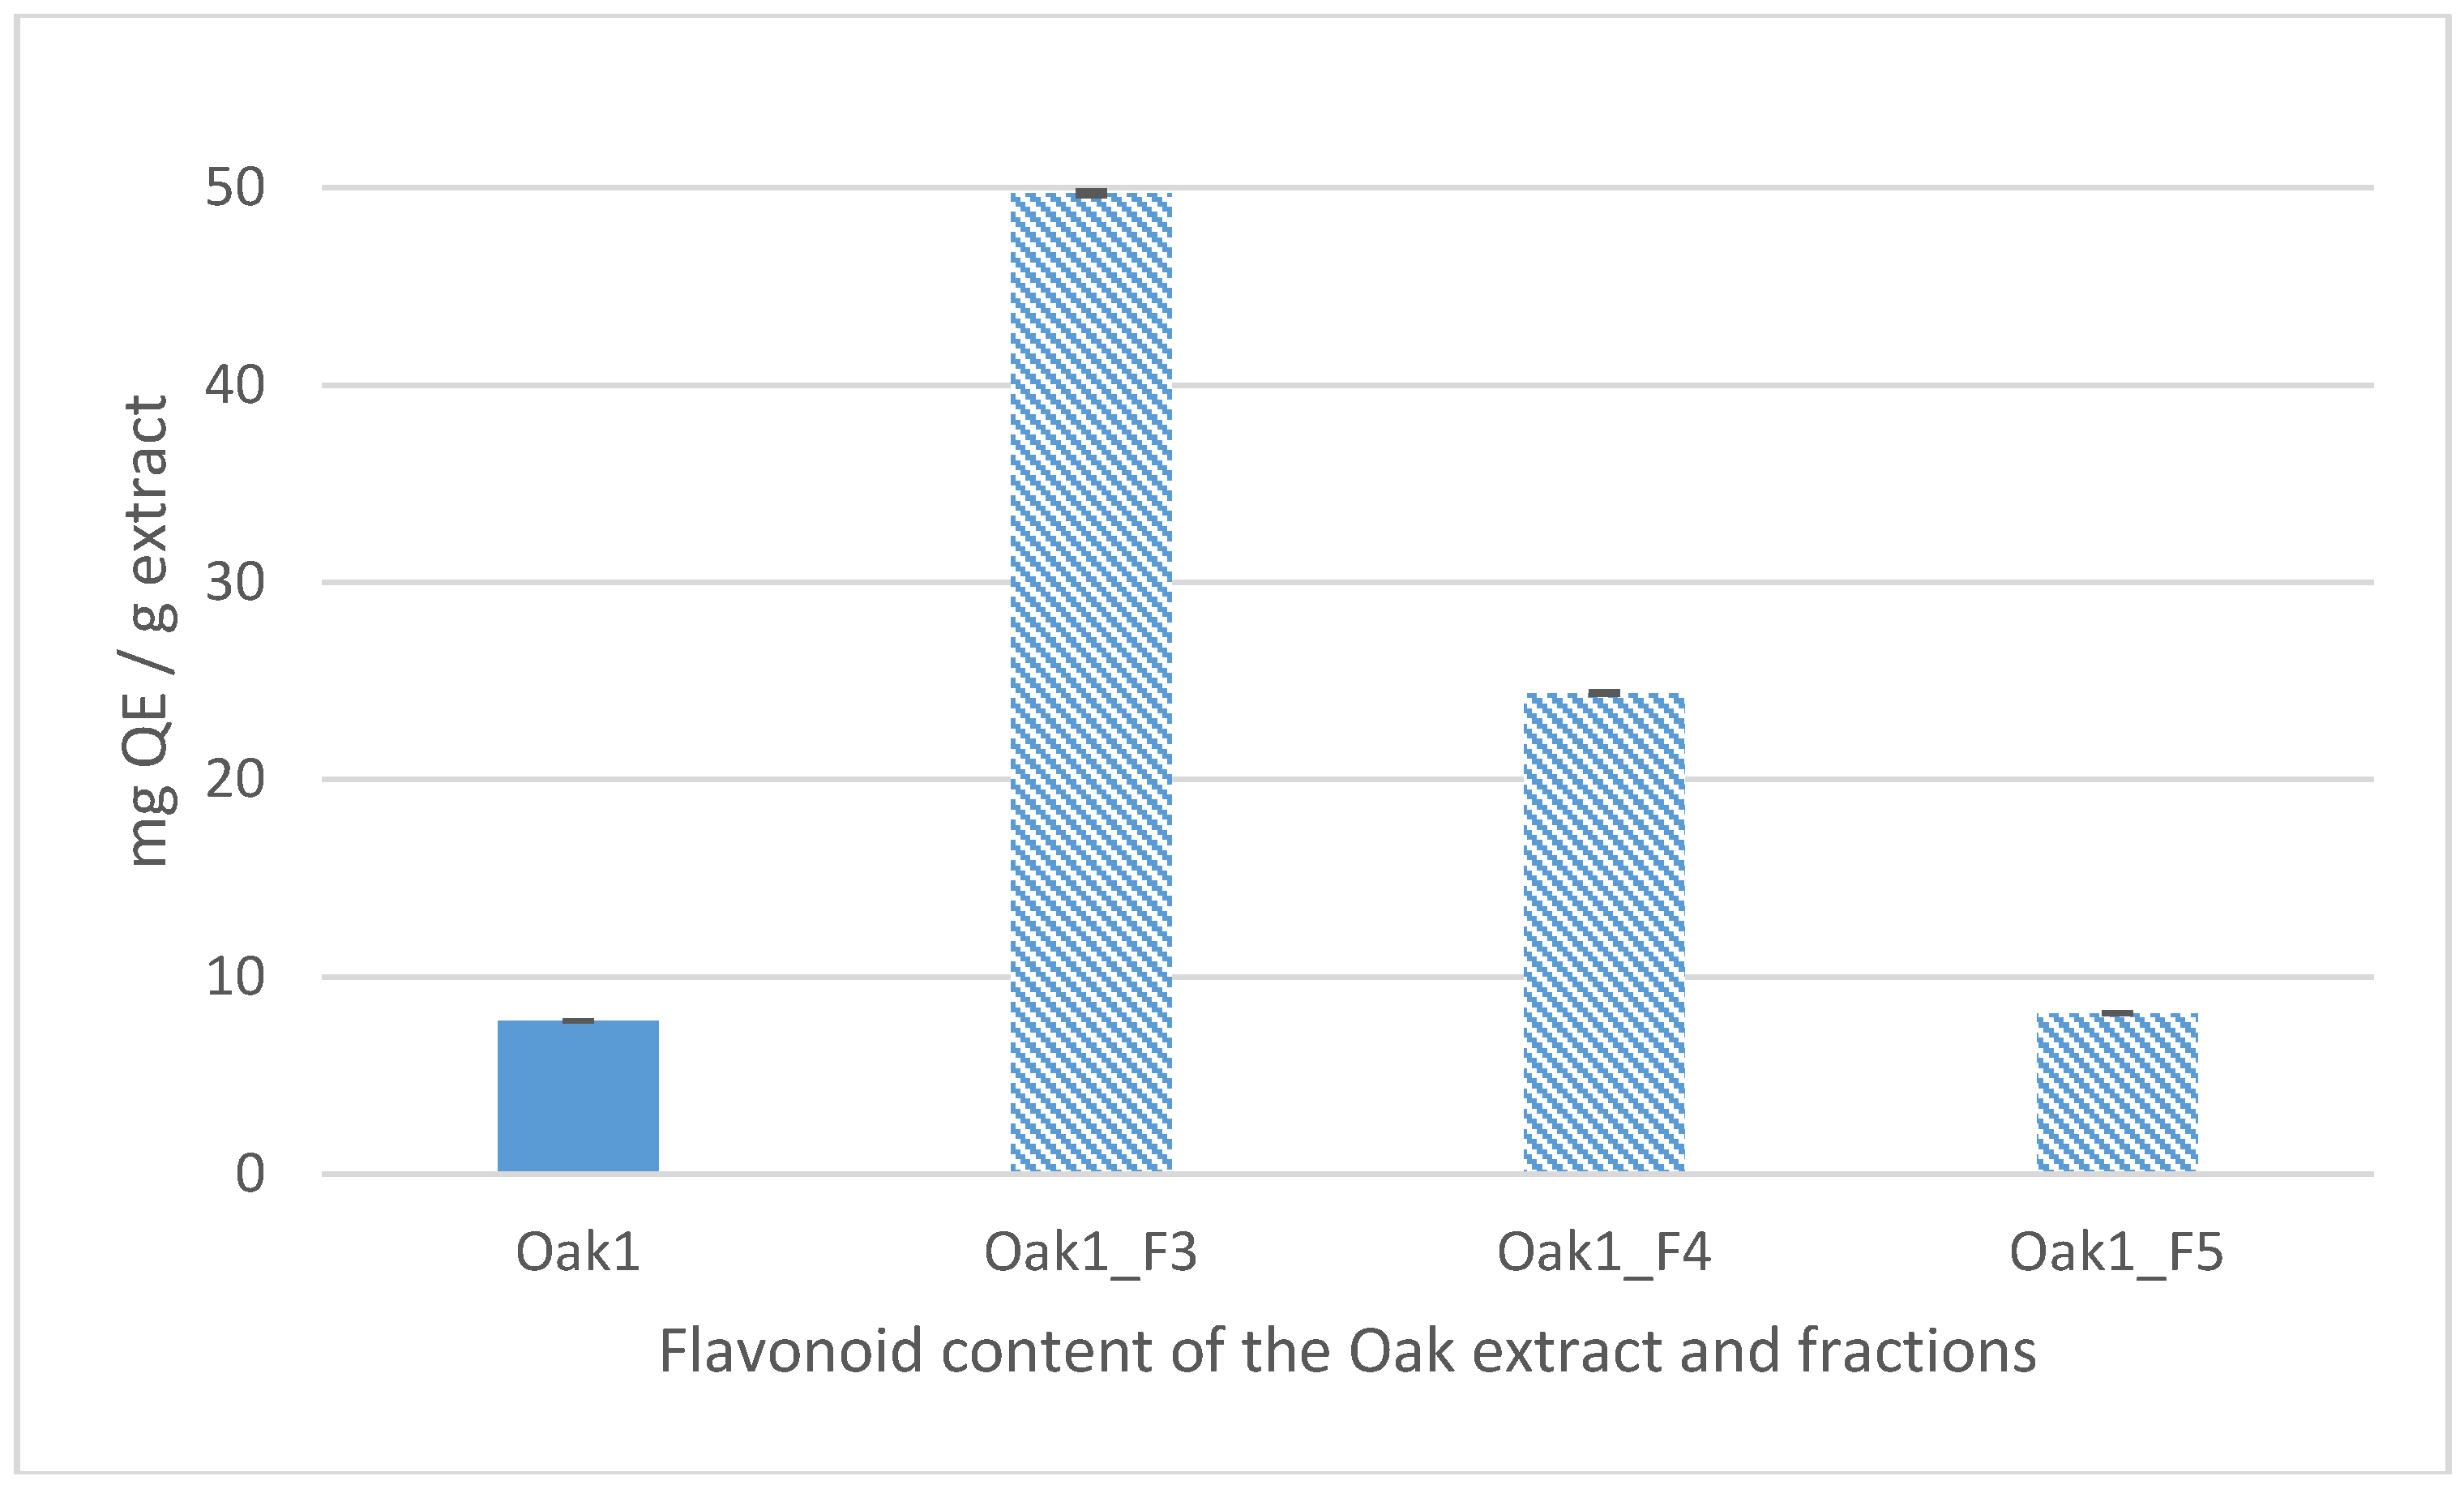
2.6.10. Total Flavonoid Analysis

The total flavonoid content was estimated in 96-well plates as follows: 100 µL of a mixture of ultrapure water/DMSO (1/1) were distributed in each well, together with 15 µL of the extracts evaluated (final concentration per well: 100 µg/mL). DMSO alone was used as negative control. Then, 10 µL of a solution of aluminum trichloride (100 g/L) were added in each well, together with 15 µL of potassium acetate (1 M) and 100 µL of ultrapure water. The plate was then filmed and incubated at RT in the dark for 40 min. An OD reading was performed at 415 nm: the amounts are expressed in milligrams of quercetin equivalents (QE) per gram of extract. The standard curve was prepared with quercetin hydrate solutions (concentrations range: 250, 125, 75, 25 and 5 µg/mL).

2.7. HPLC-ESI-MS Analyses

The fraction fingerprints were obtained using an HPLC Acquity system (Waters, Guyancourt, Ile-de-France, France). Separations were performed on an Acquity UPLC Kinetex® C18 column (Phenomenex, Kinetex® 2.6 µm C18 100 Å, 150 mm × 2.1 mm i.d.) at 25 °C with a flow rate of 0.6 mL/min. The injection volume was set at 1 µL. The mobile phase consisted of water (solvent A) and acetonitrile (solvent B) both acidified with 0.05% formic acid (all of chromatography grade), and was used in multistep gradient mode. The gradient was operated as follows: 0–1 min, 5% B; 1–9 min, 5–40% B; 9–15 min, 40–100% B, 15–17 min, 100% B; final isocratic step for 2 min at 5% B. The sample manager was thermostated at 15 °C. ESI (electrospray ionization) conditions operated in positive mode were set as follows: source temperature 150 °C, desolvation temperature 500 °C; capillary voltage 3 KV and cone voltage 10 V. Nitrogen was used as cone (10 L/hr) and desolvation gas (1000 L/hr).

2.8. Discoloration of the Extract

Discoloration of the extract was performed by adsorption of the molecules responsible for the coloration on activated carbon. Discoloration of both the solid and liquid ingredients was performed with 1% (w/w) of activated carbon for 1 h. The powdered activated carbon is then easily removed by settling and filtration.

2.9. Development of Liquid and Solid Cosmetic Ingredients

Solid and liquid cosmetic supports adapted to cosmetic formulation were evaluated for the development of the active ingredient.
Maltodextrin, a solid cosmetic support, was directly added to the crude extract (maltodextrin/crude extract 2/1 w/w). The mixture is then vacuum-concentrated to dryness, and the resulting powder is homogenized using pestle and mortar.
Propylene glycol was directly used during the extraction process: about 1 g of the dried and crushed plant material was extracted with approximately 10 g of propylene glycol at RT using a magnetic stirrer (250 rpm) for 4 h or 7 h 30. The resulting extracts were then filtered over filter paper 8–12 µm.

2.10. Stability Testing

Stability testing is performed to ensure that the ingredient developed meets the intended quality standards as well as functionality and aesthetics when stored under specific conditions. Accelerated stability testing was carried out as follows: both the ingredients on maltodextrin and in propylene glycol were stored in glass vials at 42 °C, and weekly monitoring of those samples was undertaken. Evaluation of critical aesthetic properties was performed both subjectively (obvious changes in color and odor were recorded by the operator) and objectively (Section 2.10.2), and the chemical compositions of both ingredients were scrutinized by HPLC-DAD-ELSD after separation from the cosmetic supports by SPE (Solid Phase Extraction, Section 2.10.1).

2.10.1. Solid Phase Extraction

SPE cartridges (Phenomenex, Polymeric Reversed Phase Strata-XL, 500 mg/6 mL) were fitted into stopcocks and connected to a vacuum manifold. The sorbent was conditioned with 10 mL of methanol (MeOH), and equilibrated with 10 mL water. With the stopcocks opened and the vacuum turned on, the SPE cartridge is then loaded with either 100 mg of Oak2_M or with 10 mL of Oak3D/H2O (1/3 v/v). The vacuum pressure was set at 40 kPa. After sample addition, the column was washed first with 10 mL H2O, then with 10 mL H2O/MeOH (10/1 v/v) and finally with 10 mL MeOH/dichloromethane (1/1 v/v). Sample was eluted twice with 5 mL MeOH (this stepwise elution was preferred to a single-10 mL elution as it improves the final SPE yield).

2.10.2. Color Evaluation

Color was evaluated using a spectrophotometer Color i™ 5 (X-Rite, Grand Rapids, MI, USA) previously calibrated with a white reference. An aliquot of each ingredient discolored or not was placed in glass tubes (sample thickness: 6 mm). The results were expressed according to the three-dimensional color space CIE 1976 L* a* b* (or CIELab coordinate system, CIE—Commission Internationale de l’Éclairage), defined by the International Commission on Illumination [40]. The three coordinates (expressed as the average of triplicates measurements) denote respectively the lightness of the color (L*), its red-versus-green attribute (a*) and its yellow-versus-blue attribute (b*), and ΔE*ab represents the color difference between two samples (ΔE*ab will have no unit). This color difference is calculated as the Euclidian distance between the points representing those samples in the space, as follows:
ΔE*ab = [(ΔL*)2 + (Δa*)2 + (Δb*)2]1/2.
A ΔE*ab between 1.00 to 2.50 represents the points at which an average individual starts to visually notice a color difference; if the ΔE*ab is less than 1.00, the color difference is barely perceivable by an average human observer [41,42].

3. Results

As already stated, a series of Mediterranean plants were initially selected over more than 500 for the present study, based on their accessibility and their originality regarding the anti-aging activity. From this survey, it appears that crude extract of Q. pubescens leaves displays the best unprecedented anti-aging activities. Added to this, the easiness of the raw material supply in the region, and the attractive marketing potential of the resulting cosmetic active (one can play about the nobility of this truffle oak) induced its selection for further investigations.

3.1. Crude Extract Oak1

First, the extraction of leaves of Q. pubescens was performed with H2O/EtOH 1/1 to cover the larger polarity range possible, hence to recover a maximum of metabolites. Leaves of Q. pubescens collected in two locations were extracted in the same conditions and the effect of the origin of the raw material on the chemical composition of the resulting extract was investigated. The various origin of plant material induced slightly different extraction yields (ranging from 10% to 16%); however, no major difference was evidenced in the phytochemical profiles of oak extracts obtained from leaves collected in different locations (data not shown). For convenience, the Q. pubescens extract obtained using H2O/EtOH 1/1 will further be referred to as Oak1 in the present article.
The HPLC fingerprinting of this extract revealed the presence of a large group of polyphenols eluting between 14 and 56 min (Figure 1).

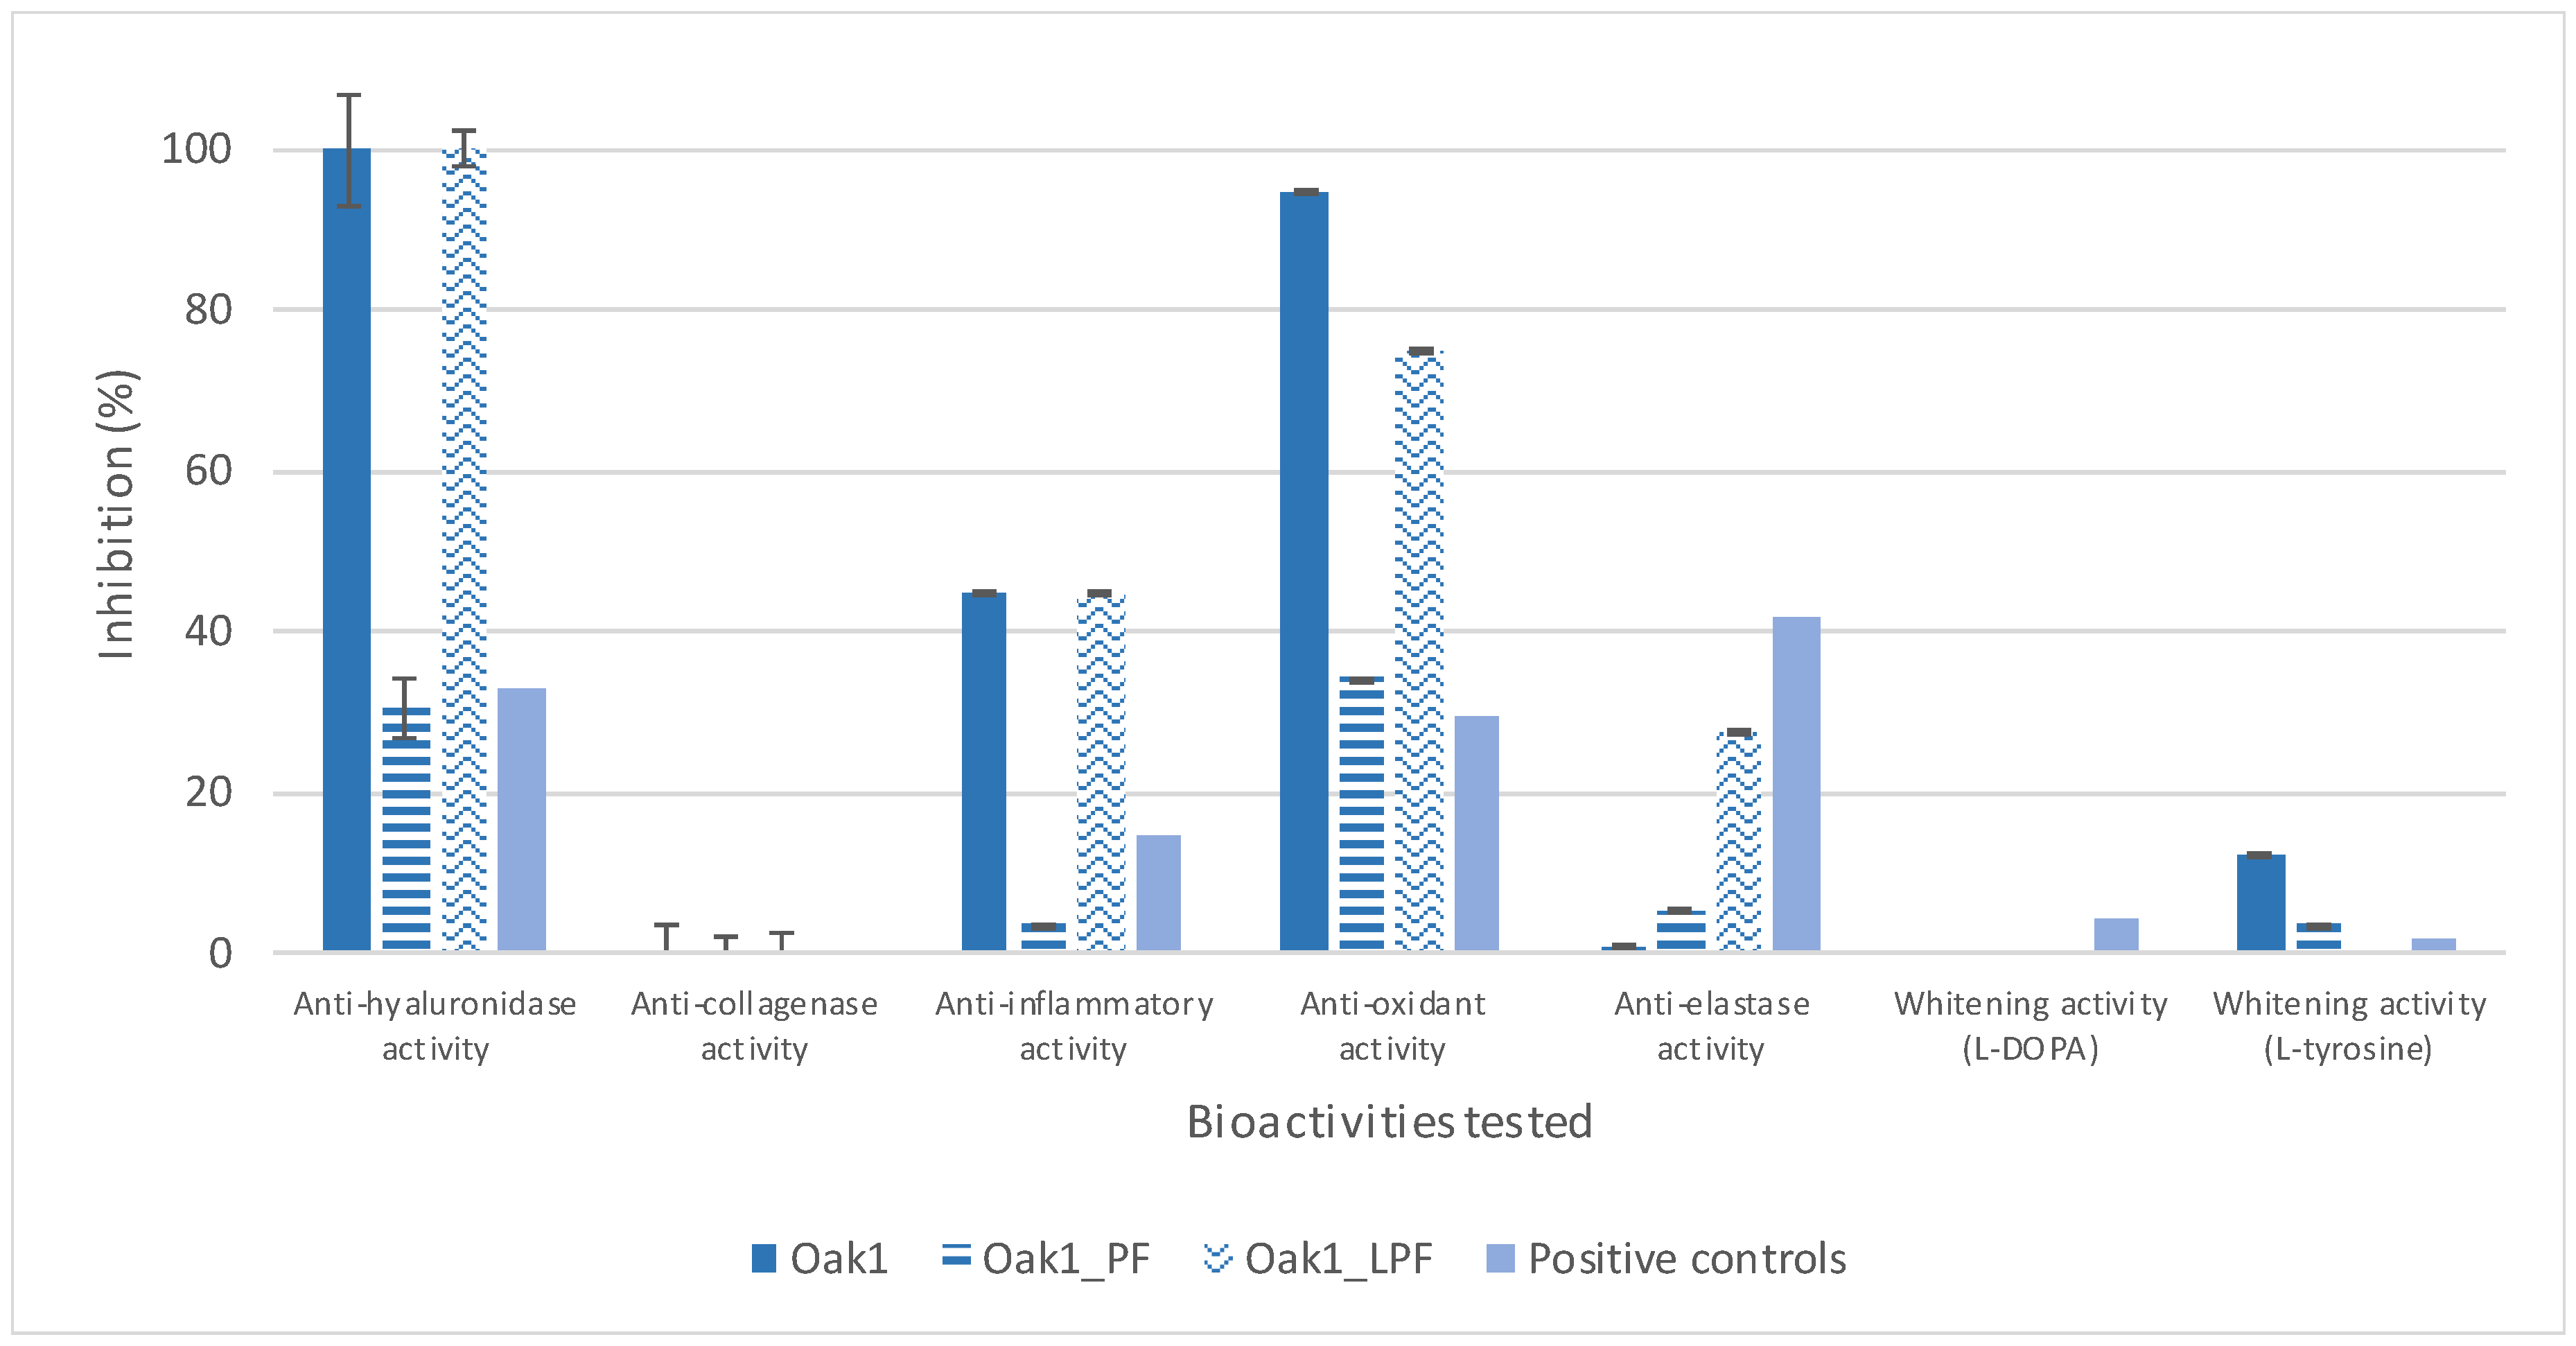
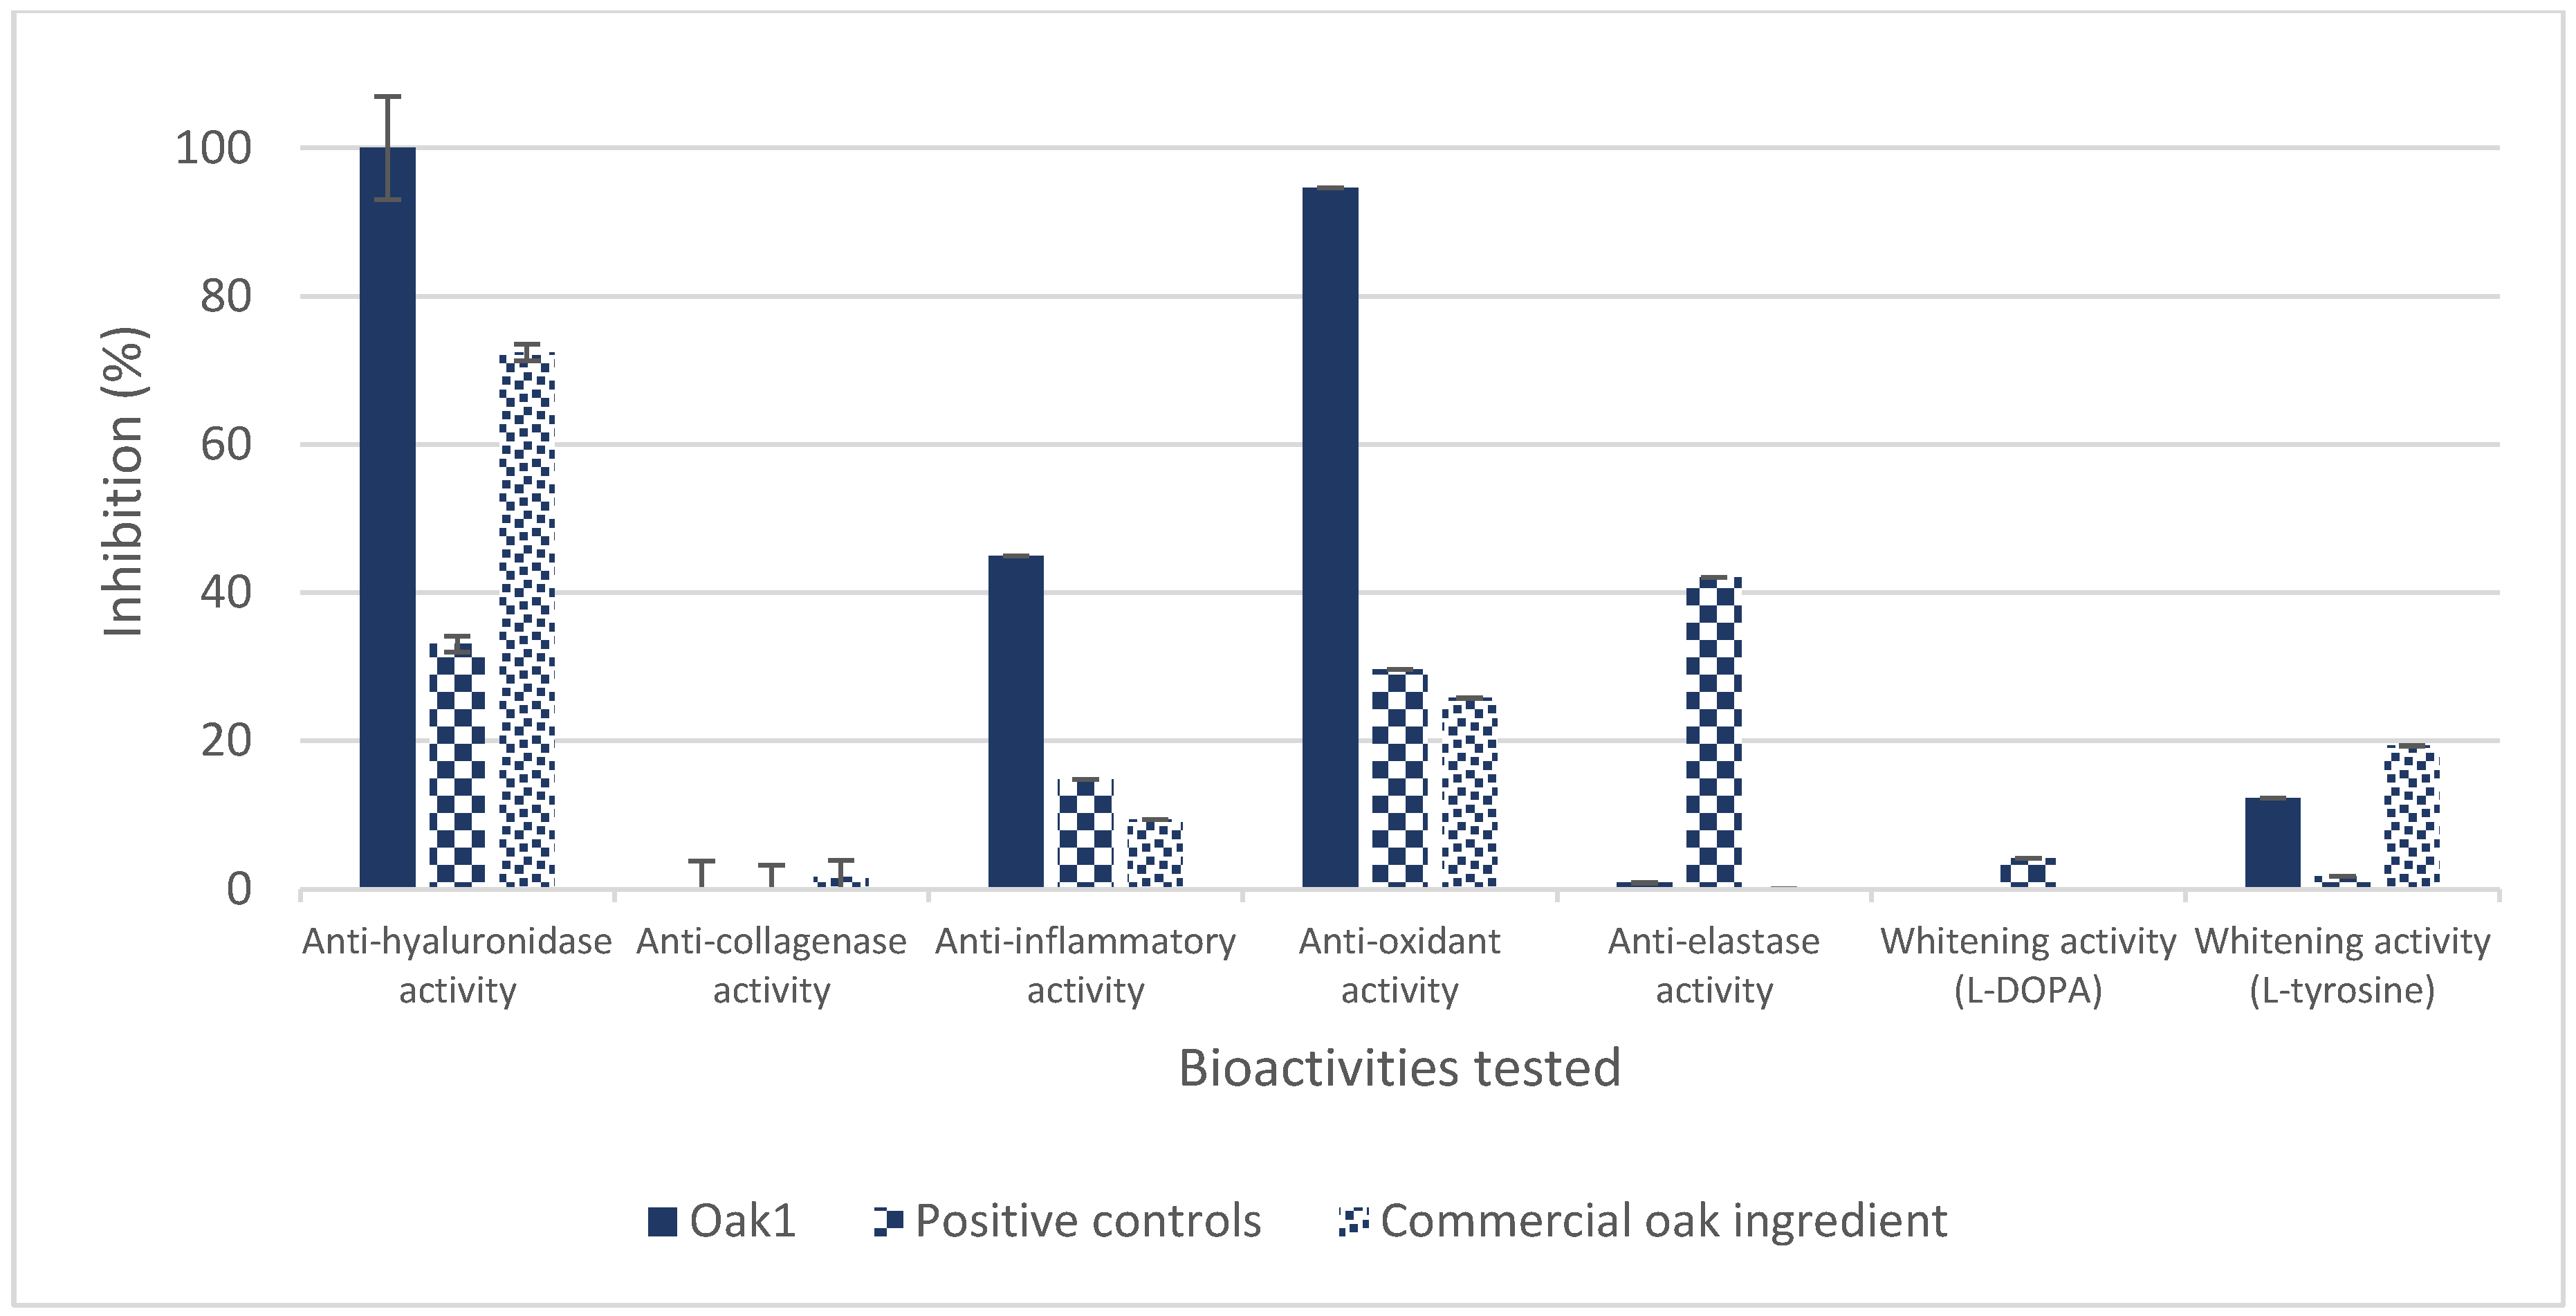
3.1.1. In Vitro Bioassays

The bioactivities of Oak1 were assessed using in vitro bioassays, and were compared to the bioactivities of commercial cosmetic ingredients used for the respective activities tested (positive control) and to the bioactivities of a commercial oak ingredient. As presented in Figure 2, Oak1 displays real promising antioxidant and anti-hyaluronidase activities, as well as some interesting anti-inflammatory activity, compared to commercial ingredients.

3.1.2. Fractionation Scheme 1

To characterize the active compounds responsible for the bioactivities evidenced, Oak1 extract was then fractionated over silica gel (Table 1). The fractionation of 3.5 g of Oak1 led to the recovery of five distinct fractions: F1 (cyclohexane), F2 (cyclohexane/diethyl ether 1/1), F3 (diethyl ether), F4 (methanol) and F5 (methanol/water 1/1). The resulting fractions Oak1_F2 to Oak1_F5 were further evaluated for their bioactivities; no further investigation was undertaken for Oak1_F1 as even if this fraction would be interesting in terms of bioactivity, it would not be commercially viable to develop any resulting cosmetic ingredient due to it poor extraction yield.
Fraction solutions were concentrated at 3.433 mg/mL in DMSO and their activities were assessed the same way as the one of crude extract. Results of these bioassays are presented in Table 1. No remarkable bioactivity was observed for Oak1_F2, and no further investigation was initiated. Some interesting anti-elastase activity was reported for Oak1_F3. Both fractions Oak1_F4 and Oak1_F5 were identified as potent anti-oxidants and significant hyaluronidase inhibitors, similarly to the crude extract Oak1. These fractions also display some anti-elastase activity.
The crude extract Oak1, as well as fractions Oak1_F3, Oak1_F4 and Oak1_F5, were further analyzed by GC-MS. The compounds identified are listed in Table 2. Apart from dihydroactinidiolide, 6,10,14-trimethyl-2-pentadecanone and dihydro-2.3-benzofuran, which were not available at the laboratory, all of these compounds were assayed for their bioactivities. Only nonanal displayed some interesting anti-elastase activity that can be linked to the anti-elastase activity evidenced for Oak1_F3.
The total phenolic acid and flavonoid contents of Oak1_F3, Oak1_F4 and Oak1_F5 were then determined. The results respectively presented in Figure 3 and Figure 4 show correlations between those contents and the activities previously evidenced for the respective fractions.
The crude extract Oak1, as well as fractions Oak1_F4 and Oak1_F5, all presenting a strong anti-oxidant potency, appear to be quite rich in polyphenolic compounds; such correlation between chemical composition and antioxidant activity was already reported in the literature [50,51,52]. HPLC-ESI-MS analysis of fraction Oak1_F4 reveals that it is mainly constituted of catechin, a flavanol already known to act as a powerful antioxidant [53].
Positive relationships were also observed between anti-hyaluronidase activity and phenolic content in the cases of fractions Oak1_F4 and Oak1_F5, as well as between anti-elastase activity and flavonoid content in the cases of fraction Oak1_F3 and to a lesser extent, of fraction Oak1_F4, as previously stated in the literature [52,54].

3.1.3. Fractionation Scheme 2

From the previous results (Section 3.1.2), it appeared that the molecules responsible for the bioactivities tested are concentrated in the most polar fractions resulting from Oak1 fractionation scheme 1, i.e., the fractions obtained with diethyl ether, MeOH and MeOH/H2O 1/1. To gain information about these metabolites, the Oak1 extract concentrated at 50 mg/mL in MeOH was roughly fractionated by semi-preparative HPLC as described in the Materials and Methods section to separate polar (Oak1_PF eluting between 0–7 min; yield: 62%) from less polar compounds (Oak1_LPF eluting between 7–14 min; yield: 38%; Figure 5). Several injections were realized and successive polar/less polar fractions were respectively pulled together to recover enough material to assess their bioactivities the same way as the one of Oak1.
No remarkable bioactivity was observed for Oak1_PF obtained with water added up with 5% of acetonitrile: this fraction is constituted of more polar compounds that the ones extracted in the previous fractions Oak1_F3 to Oak1_F5. The less polar compounds extracted in Oak1_LPF appear to be mainly responsible for the activities reported for Oak1: a large amount of polyphenols eluting between 10 and 50 min were notably identified based on their UV spectra and by comparison with standards available at the laboratory (Figure 6). In fact, Oak1_LPF present similar anti-inflammatory and anti-hyaluronidase activities, and appear to be a slightly less potent anti-oxidant, compared to Oak1 (Figure 7). Some interesting anti-elastase activity was reported for Oak1_LPF, revealing a potential antagonistic effect between both fractions, the polar one impeding the activity of the less polar one against this enzyme.
From the two fractionation strategies adopted, it appears that the compounds responsible for the bioactivities of Oak1 are of intermediate polarity. The subsequent process adopted to further develop oak-based cosmetic ingredients will be adapted to preferentially extract those compounds and hence potentialize their bioactivities.

3.2. Development of Cosmetic Ingredients

Once the active fraction identified, the corresponding natural cosmetic ingredient can be developed. The necessary requirements for such a development are quite numerous, as evidenced in Figure 8: natural extracts or fractions that display interesting bioactivities are usually not directly incorporable into a formulation as they may display undesirable qualities (color, odor, viscosity, etc.). The addition of an appropriate cosmetic support, either liquid or solid, can be necessary to facilitate the incorporation of natural actives into a cosmetic formulation.

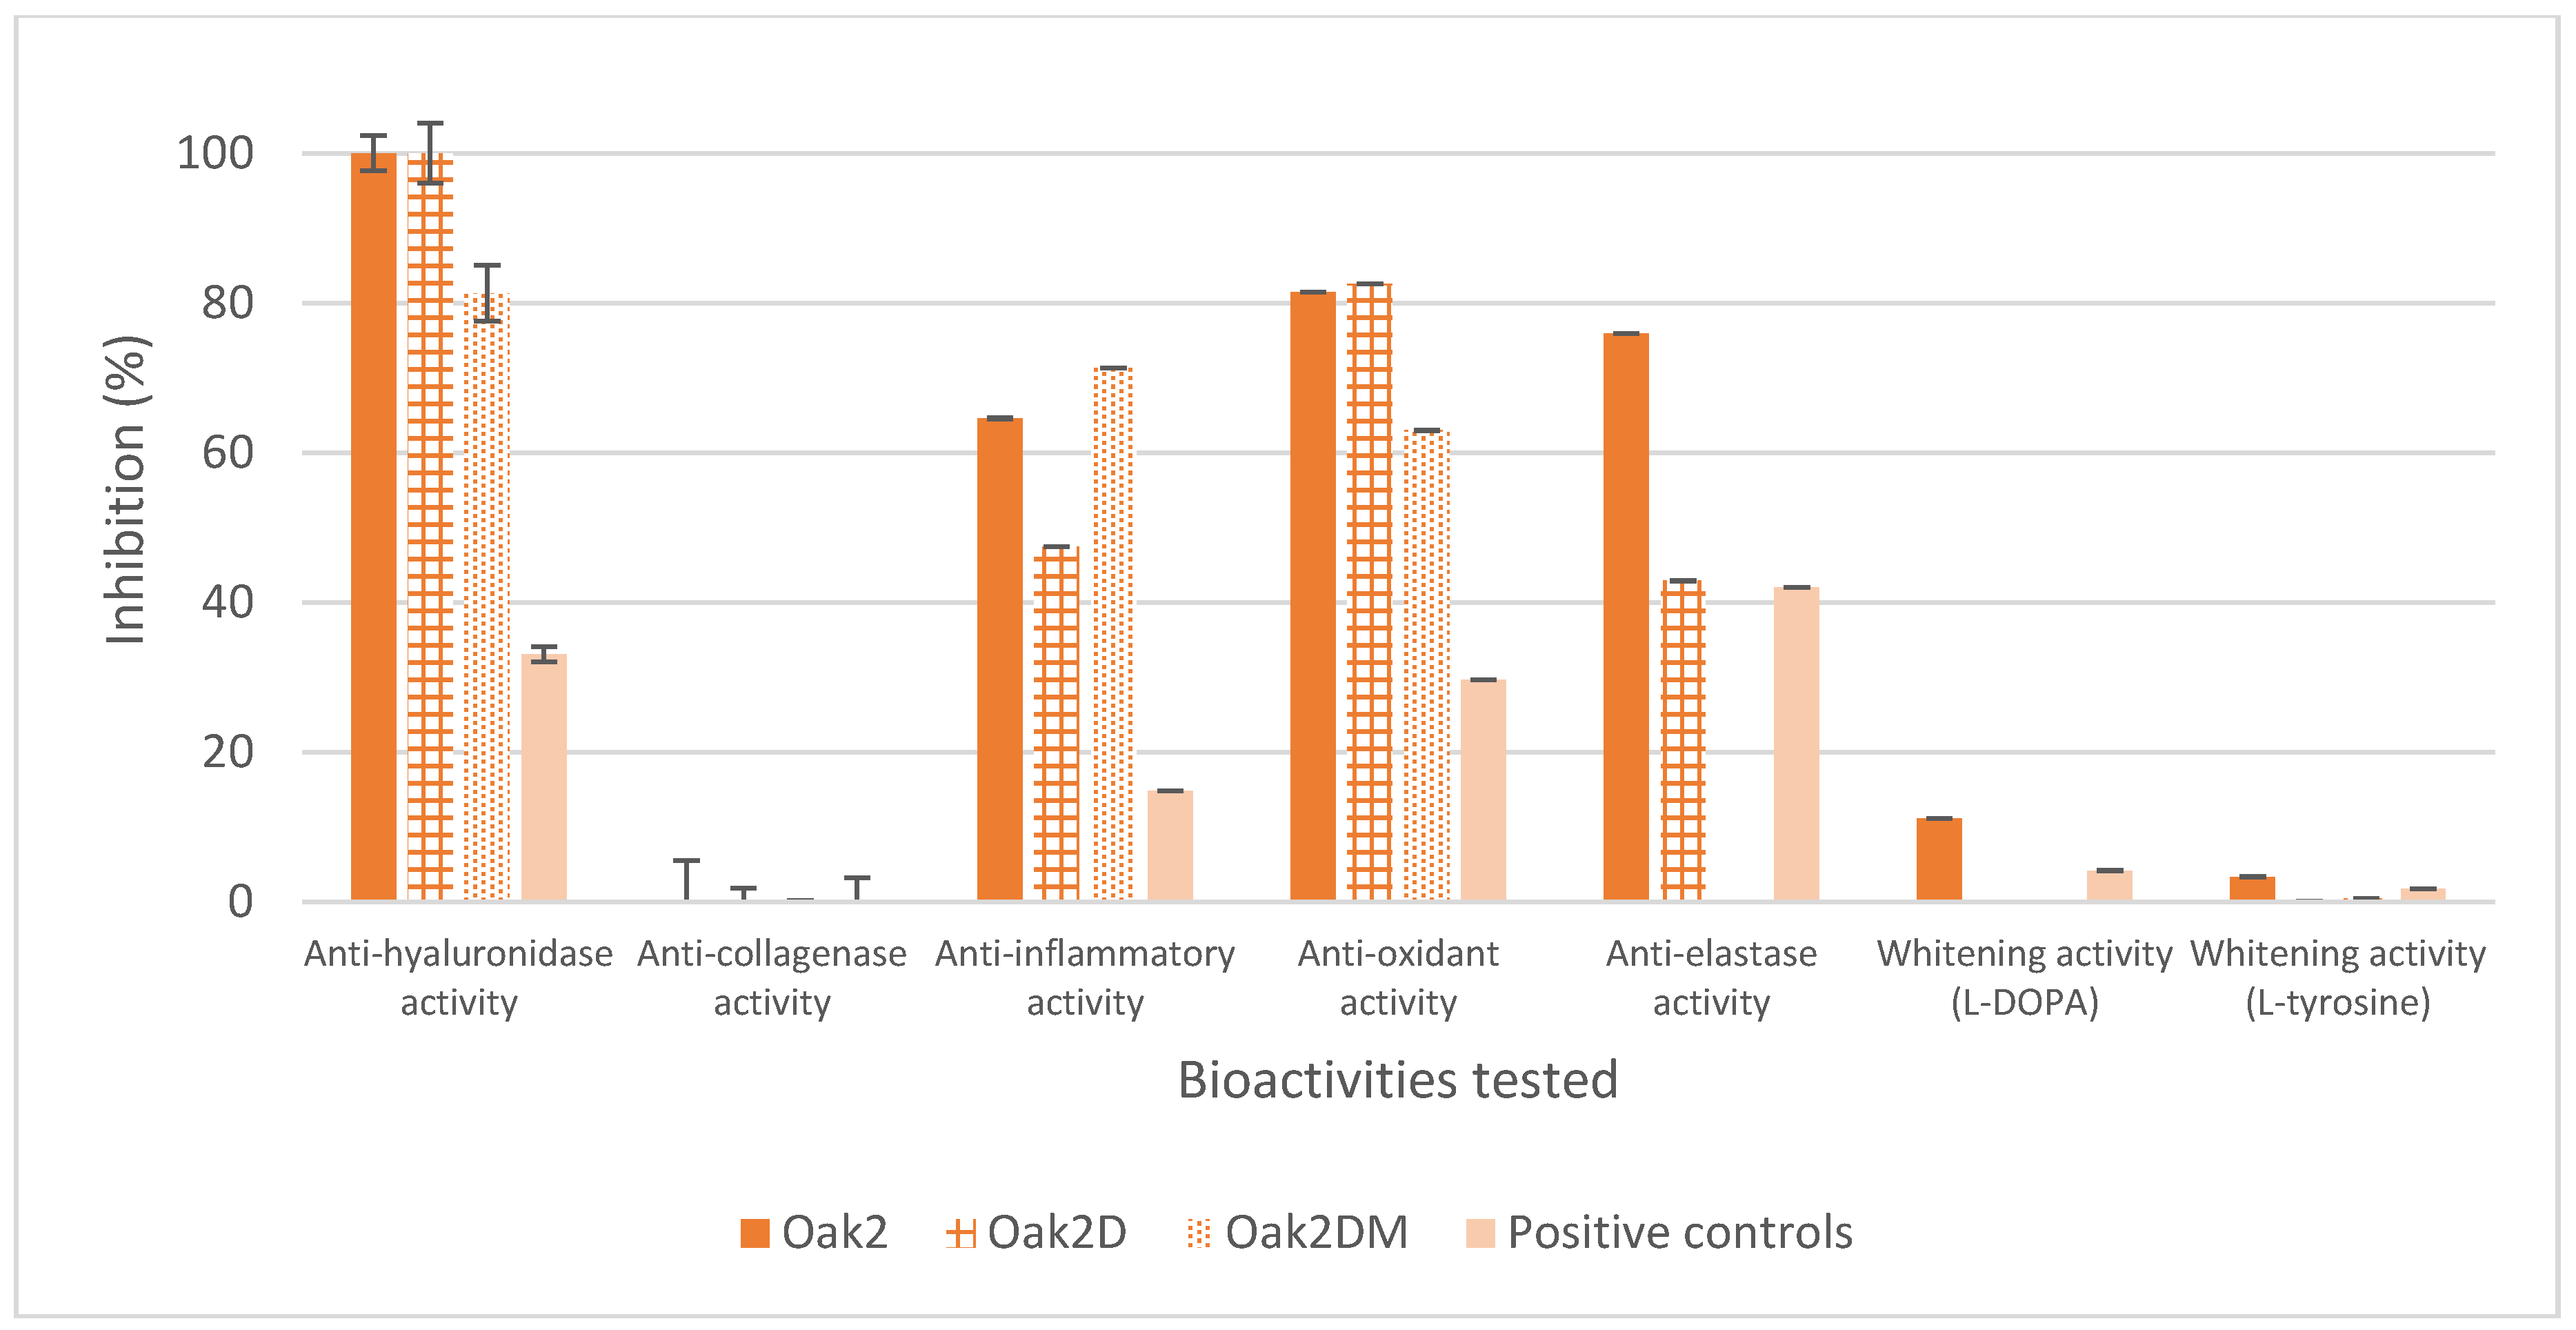
3.2.1. Solid Cosmetic Ingredient

As already stated in Section 3.1, the compounds responsible for the bioactivities of Oak1 are of intermediate polarity, so H2O/EtOH 1/1 is not the most convenient solvent system for the further development of an oak-based cosmetic ingredient. Added to this observation, one can argue that the elimination of water through concentration by vacuum evaporation is highly energy-consuming, and such a solvent system is hence not the most appropriate one for the ingredients’ industrial production. To objectivate the active metabolites’ content of the future ingredient and to facilitate the industrial scale-up of its fabrication process, H2O/EtOH 1/1 was replaced by pure EtOH: for convenience, the Q. pubescens extract obtained by 2 h-maceration of Q. pubescens leaves in ethanol will further be referred to as Oak2 in the present article (extraction yield range: 3–5%). The bioactivities of Oak2 were assessed using in vitro bioassays. As presented in Figure 9, apart from the promising antioxidant and anti-hyaluronidase activities already evidenced in the H2O/EtOH 1/1 extract Oak1, Oak2 also displays some anti-inflammatory activity and especially some very interesting anti-elastase activity.
The organic solvents used to extract active molecules from a plant also extract the molecules responsible for the plant’s color, which are generally unacceptable in skin care products [55] and need therefore to be submitted to further processing, including notably a discoloration procedure. Discoloration can be performed by adsorption of the undesirable molecule on activated carbon: the powdered activated carbon can easily be added to the liquid extract, and then removed by settling and filtration. Several discoloration conditions were tested using varying discoloration durations and various extract/activated carbon ratios. The best results were obtained when Oak2’s discoloration was performed with 1% (w/w) of activated carbon for 1 h. The resulting appropriately discolored extract Oak2D (Table 3: ΔE*ab > 2.5, indicating a color difference easily perceivable to the human eye) was recovered after elimination of the activated carbon (recover yield range: 55–60%) and its bioactivities were assessed using in vitro bioassays. Regarding the results presented in Figure 9, one can conclude that the discoloration does not affect the antioxidant and anti-hyaluronidase activities of the extract, but some losses of anti-inflammatory and anti-elastase activities are made evident.
Maltodextrin, a solid agent used in cosmetics to bind other compounds and stabilize formulas, was then added to the extract Oak2D (maltodextrin/crude extract 2/1 w/w). The mixture is then vacuum-concentrated to dryness, and the resulting powder (Oak2DM) is homogenized using pestle and mortar. The bioactivities of Oak2DM, as well as of maltodextrin alone (no activity reported; data not shown), were assessed using in vitro bioassays as already enunciated (at the same concentration as the extracts and fractions). Regarding the results presented in Figure 9, one can conclude that the addition of maltodextrin does not affect significantly the anti-hyaluronidase, the anti-oxidant and the anti-inflammatory activities of the extract, but a dramatic loss of anti-elastase activity compared to the crude extract Oak2 is made evident.
The solid ingredient Oak2DM developed here appears to be an efficient active to be incorporated in cosmetic anti-age formula. However, some optimization could still be done in the development of this solid oak ingredient. Some further discoloration trials should be undertaken to reach the same discoloration level or even a better one, without such a mass loss. One can also imagine that adjustments in the ratio of maltodextrin added to the discolored extract may potentially lead to less anti-elastase bioactivity’s loss.

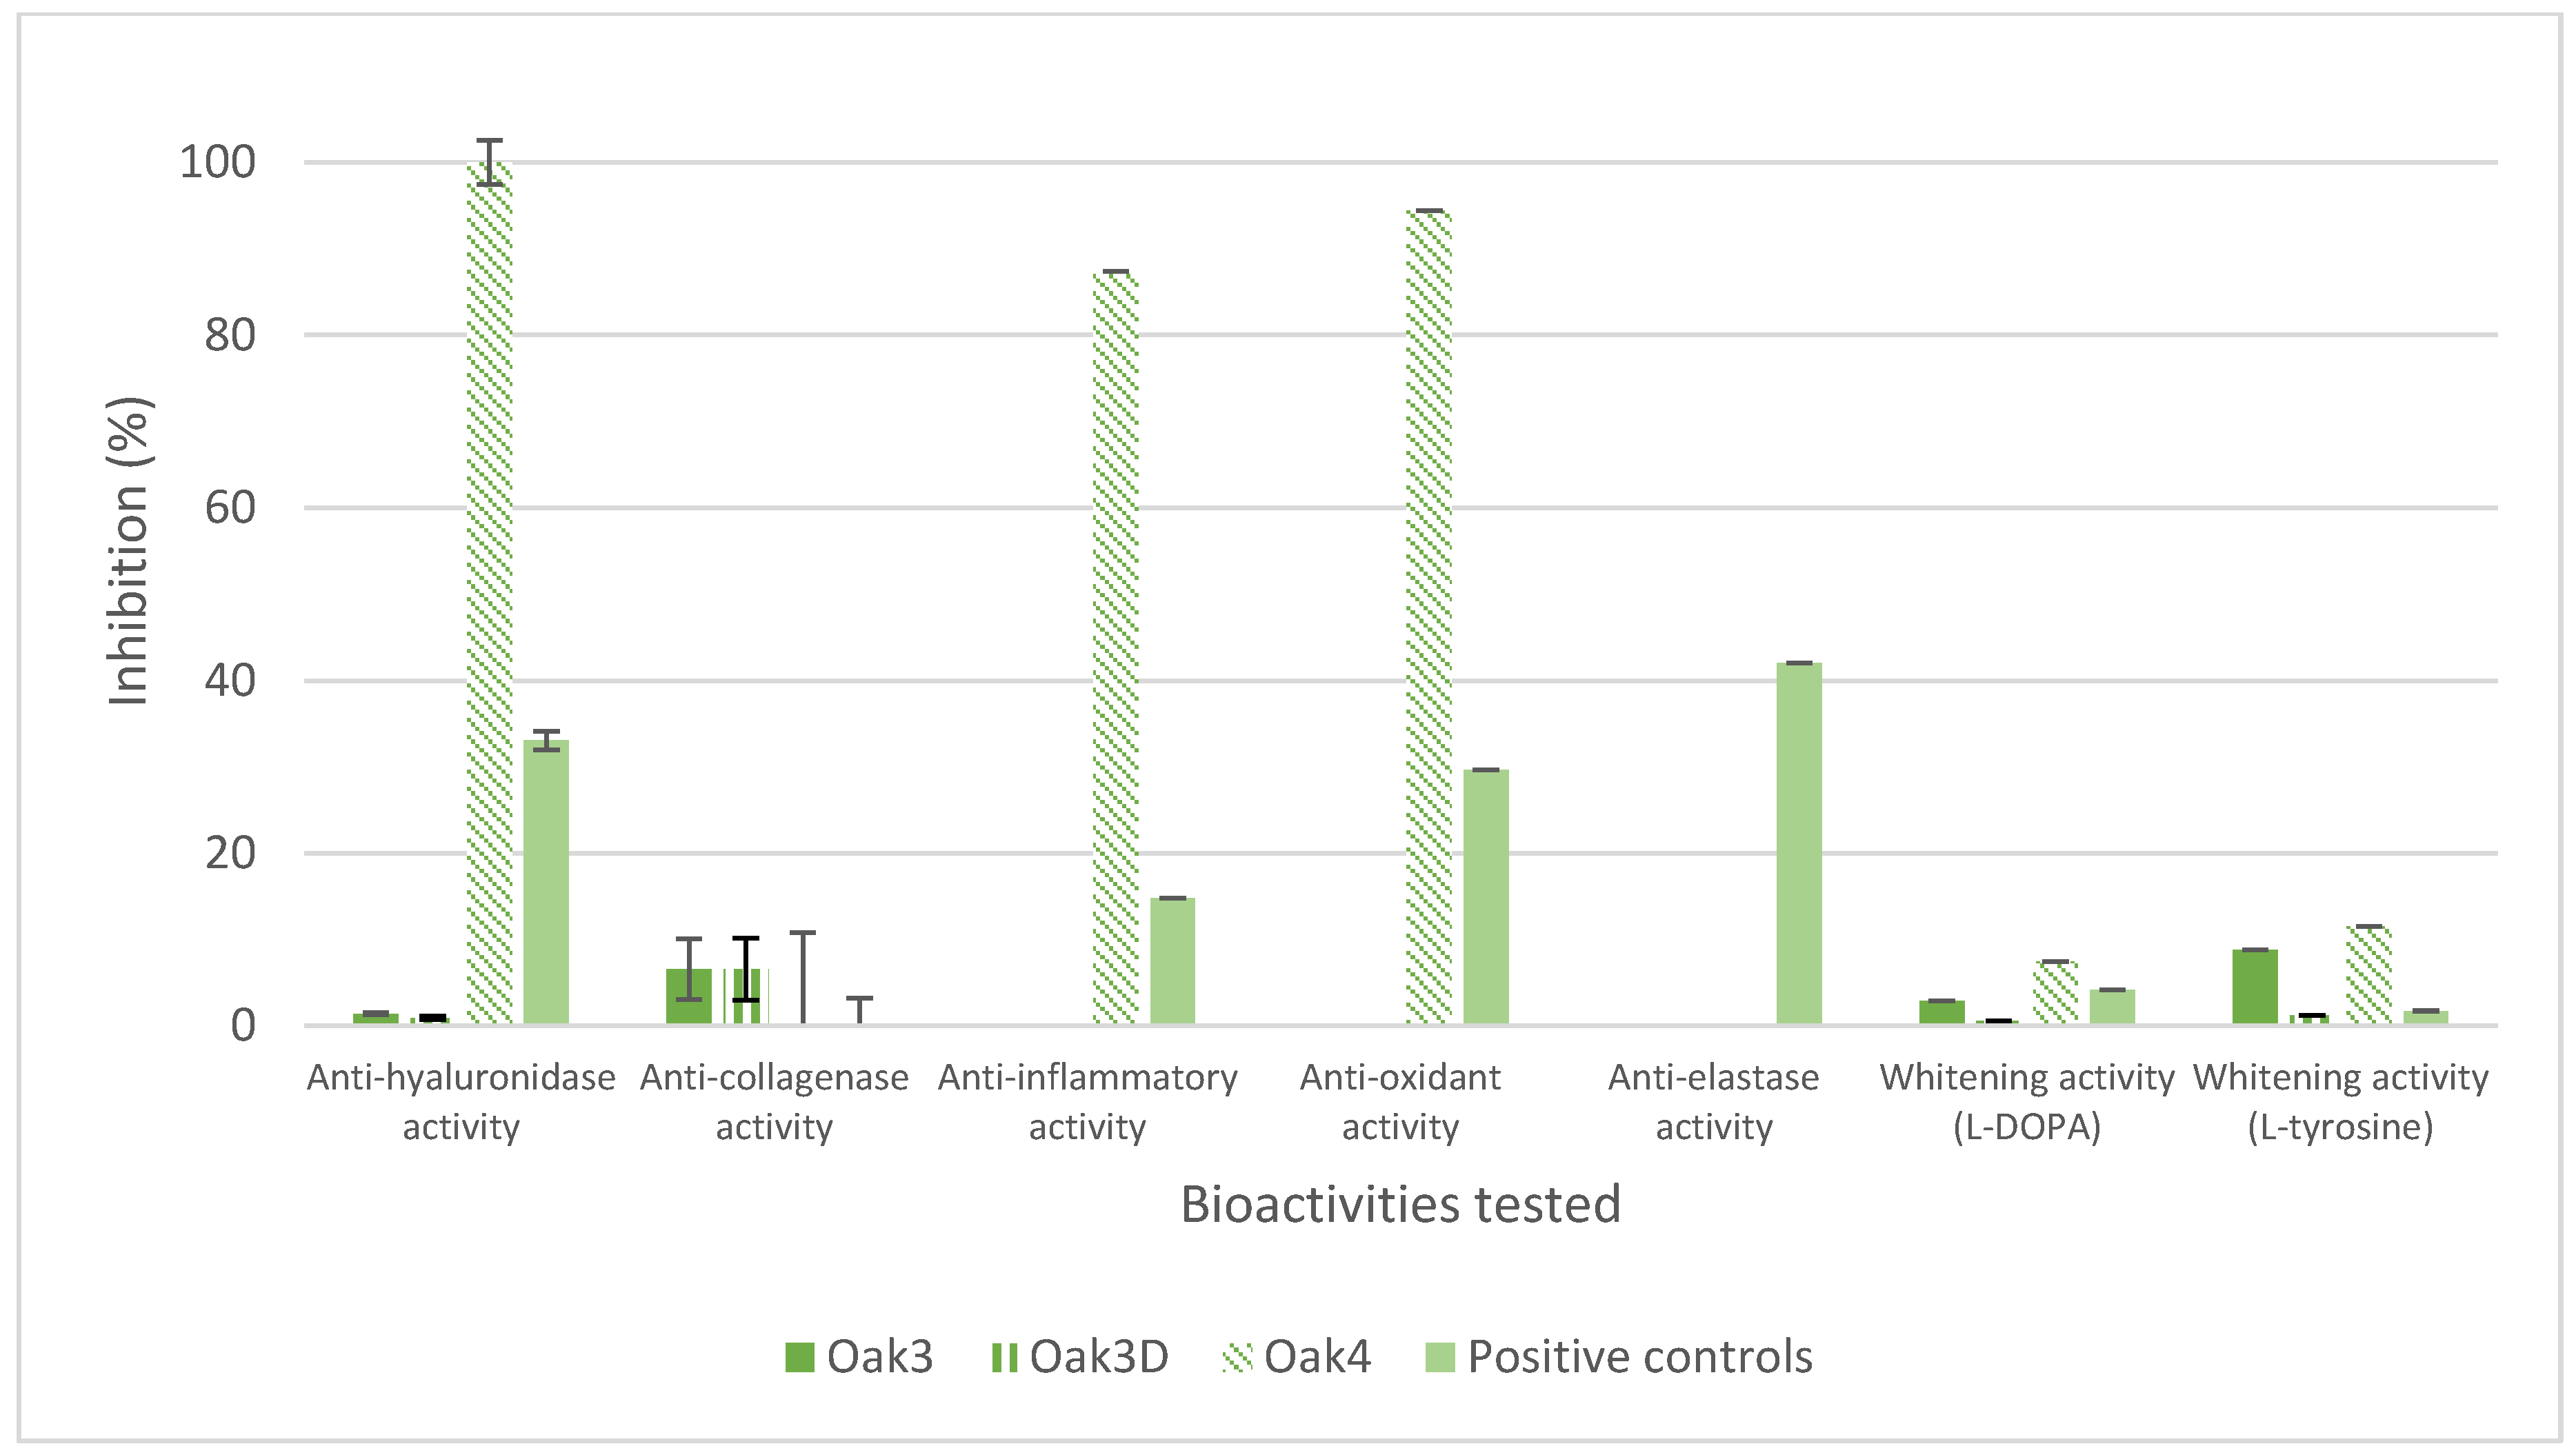
3.2.2. Liquid Cosmetic Ingredient

Liquid ingredients are preferred to formulate some cosmetics. Propylene glycol is one of the most widely used cosmetic supports: it serves as a humectant, a viscosity decreasing agent and as a solvent, so it is employed in many personal care formulations including facial cleansers, moisturizers, etc. Owing to its polarity, it was tested to directly extract the active metabolites of Q. pubescens leaves: leaves macerate in propylene glycol (dried plant/propylene glycol 1/10 w/w) for 4 h at room temperature. For convenience, the subsequent Q. pubescens extract will further be referred to as Oak3 in the present article.
Subsequent discoloration of Oak3 was undertaken. Several attempts were realized using varying Oak3/activated carbon ratios and discoloration times. From these tests, it appeared that the most suitable discoloration parameters consist in the addition of 1% (w/w) of activated carbon for 1 h: the discolored extract further referred to as Oak3D, was recovered after elimination of the activated carbon. From the color measurements presented in Table 2, it appears that the ΔE*ab is less than 1.00, indicating a color difference barely perceivable by an average human observer. Thus, one can conclude that additional discoloration attempts must be undertaken to obtain an appropriately discolored liquid extract.
The bioactivities of Oak3 and Oak3D, as well as the ones of propylene glycol alone (no activity reported; data not shown) were assessed using in vitro bioassays (Figure 10): no interesting bioactivities were evidenced.
Another attempt was then performed using a greater maceration time: oak leaves macerate in propylene glycol (dried plant/propylene glycol 1/10 w/w) for 7 h 30 at room temperature. The subsequent Q. pubescens extract, referred to as Oak4 displays some promising anti-hyaluronidase, anti-inflammatory and anti-oxidant activities (Figure 10). However, further discoloration of Oak4 using 0.1% (w/w) of activated carbon for 2 h 30 (efficient discoloration: ΔE*ab > 1; Table 2) dramatically affects all the bioactivities evidenced before the use of activated carbon (Oak4D displays no activity at all; data not shown).
From these results, it appears quite clearly that maceration time highly influences the bioactivities of the subsequent extract. Nevertheless, some further discoloration trials should be undertaken to reach appropriate discoloration, while preserving the extremely interesting anti-aging activity of Oak4. Finally, greener glycols are also currently tested to develop an even more natural cosmetic ingredient.

3.2.3. Stability Tests

Accelerated stability testing that was carried out were performed in glass vials at 42 °C to ensure that the ingredients developed meet the intended quality standards as well as functionality and aesthetics when stored under specific conditions. As no regulation exists regarding how to perform this kind of tests, the specific testing conditions are defined by the manufacturer. Typically, decisions are made whether the product is stable or not after eight weeks of testing, and a consensus exists that states that if a product is stable after eight weeks at 45 °C, it corresponds to stability after a one-year storage at room temperature.
In the present case, periodic monitoring of those samples is currently undertaken: visual/olfactory evaluation of critical aesthetic properties such as color, fragrance, texture is performed, and the chemical compositions of both ingredients are scrutinized weekly. The evolution of the molecular composition of these finished ingredients, and particularly of their phenolic contents, is followed by HPLC in the same experimental conditions (Section 2.4.1). The tests are not over, but so far, i.e., one month after the beginning of the stability test, no modification of the composition of the ingredient was noticed, but further investigations should confirm these observations.
Furthermore, it would be necessary to push these stability tests forwards once the definite formulation has been determined: additional tests should be performed in an aging chamber where the effect of temperature/lighting variations mimicking the ones a finished product is submitted to, from formulation to consumer’s use, could be monitored.

3.3. Formulation

An example of an anti-aging formula integrating the natural cosmetic ingredient, developed based on truffle oak leaves, is given in Table 4. The ingredient is titrated enough to be efficient even when incorporated in a low amount in a formula: depending on the activity wished for, the oak active, either solid or liquid, is incorporated in the formula in quantities ranging from 0.10% to 1.00%, and the quantity of the aqueous phase is consequently adjusted to respect the formula’s proportions.

4. Conclusions

In this article, the R&D process adopted to develop a new objectivated cosmetic ingredient, from the plant sourcing to the actual ingredient formulation is presented in detail through the example of the development of promising natural anti-age ingredients based on Q. pubescens leaves extract.
Application of high throughput screening technologies to natural product samples accelerates considerably the discovery, development and use of natural cosmetic ingredients, but such a screening is still a long-term undertaking [56]. It was recently suggested that only five in every 100 genetic resources identified as being potentially of interest will ever end up in cosmetic and personal care formulas [57]. In fact, once the ingredient developed, it must pass all the efficacy, quality, shelf life and safety/tolerability (cytotoxicity, skin and ocular irritability) tests right throughout the development chain prior to be launched on the market. Only after this array of controls has been undertaken will a formulator consider using this ingredient in an actual finished-product formulation. Some researchers actually integrate the toxicology assessment directly into the cosmetic ingredient R&D process to avoid an unpleasant discovery at the end of the process, which could lead to the restriction or even the abandonment of the ingredient’s use due to toxicity concerns [58]. The vigilance about worldwide regulation compliance is guaranteed by the U.S. Food and Drug Administration (FDA). At the European level, the Scientific Committee on Consumer Safety (SCCS, replacing the former SCCNFP) establishes and regularly revises guidance notes that contain relevant information on the different aspects of testing and safety evaluation of cosmetic substances [59]. These notes must be adapted at each individual case, depending, for instance, on the nature of the ingredients entering the formulation, on the finished product’s formulation itself, and the frequency and route of consumers’ use of the product.
Hence, such a translation of laboratory research into commercial successes often takes time (up to several years) and manufacturers must back the right horse about market trends many years in advance.

Acknowledgments

H.P. is grateful to the CIFRE - Conventions Industrielles de Formation par la REcherche - convention (ANRT JYTA) for her Ph.D. financing. The authors wish to thank Cécile Becquart for the development of the bioassays.

Author Contributions

H.P., G.V.-D. and X.F. conceived and designed the experiments; H.P., A.L. and G.V.-D. sourced the plant material; H.P. and A.L. performed the experiments; H.P., P.B., S.A., A.L. and X.F. analyzed the data; H.P. and P.B. wrote the article; and all authors have equally contributed to its revision.

Conflicts of Interest

The authors declare no conflict of interest.

References

  1. Lopaciuk, A.; Loboda, M. Global beauty industry trends in the 21st century. In Proceedings of the Management, Knowledge and Learning International Conference 2013, Zadar, Croatia, 19–21 June 2013; pp. 1079–1087. [Google Scholar]
  2. Cosmetics Market by Category (Skin & Sun Care Products, Hair Care Products, Deodorants, Makeup & Color Cosmetics, Fragrances) and by Distribution Channel (General Departmental Store, Supermarkets, Drug Stores, Brand Outlets)—Global Opportunity Analysis and Industry Forecast, 2014–2022. Available online: https://www.alliedmarketresearch.com/cosmetics-market (accessed on 17 November 2017).
  3. Beauty Survey 2017: Key Insights and System Update. Available online: http://go.euromonitor.com/WP-171024-BeautyandPersonalCareSurvey.html (accessed on 17 November 2017).
  4. Official Journal of the European Union. Commission Regulation (EU) No 655/2013 of 10 July 2013 Laying Down Common Criteria for the Justification of Claims Used in Relation to Cosmetic Products. 2013. Available online: http://ec.europa.eu/consumers/sectors/cosmetics/files/pdf/guide_reg_claims_en.pdf (accessed on 17 November 2017).
  5. Whitehouse, L. Proving Claims to Maximise on Beauty Trends. Available online: https://www.cosmeticsdesign-europe.com/Article/2017/06/30/Proving-claims-to-maximise-on-beauty-trends (accessed on 1 December 2017).
  6. Natural and Organic Beauty: Market Size Worldwide 2016–2024. Available online: https://www.statista.com/statistics/750779/natural-organic-beauty-market-worldwide/ (accessed on 17 November 2017).
  7. Cosmetic Ingredients: Global Market Size by Category 2015–2020. Available online: https://www.statista.com/statistics/627730/market-size-of-cosmetic-ingredients-worldwide-by-category/ (accessed on 17 November 2017).
  8. Cosmetic Ingredients: Global Market Size 2015–2020. Available online: https://www.statista.com/statistics/627786/market-size-of-cosmetic-ingredients-worldwide/ (accessed on 17 November 2017).
  9. Wynberg, R.P.; Laird, S.A. Access and benefit-sharing: Key points for policy-makers. The cosmetics industry. People Plants Int. 2015. Available online: https://www.researchgate.net/publication/303286830_Access_and_Benefit_Sharing_Key_Points_for_Policy-_Makers_-_The_Cosmetics_Industry (accessed on 22 November 2017).
  10. Chemat, F.; Strube, J. Green Extraction of Natural Products: Theory and Practice; John Wiley & Sons: Hoboken, NJ, USA, 2015; ISBN 978-3-527-33653-1. [Google Scholar]
  11. Mukherjee, P.K.; Maity, N.; Nema, N.K.; Sarkar, B.K. Bioactive compounds from natural resources against skin aging. Phytomedicine 2011, 19, 64–73. [Google Scholar] [CrossRef] [PubMed]
  12. Krutmann, J.; Liu, W.; Li, L.; Pan, X.; Crawford, M.; Sore, G.; Seite, S. Pollution and skin: From epidemiological and mechanistic studies to clinical implications. J. Dermatol. Sci. 2014, 76, 163–168. [Google Scholar] [CrossRef] [PubMed]
  13. Pan, T.-L.; Wang, P.-W.; Aljuffali, I.A.; Huang, C.-T.; Lee, C.-W.; Fang, J.-Y. The impact of urban particulate pollution on skin barrier function and the subsequent drug absorption. J. Dermatol. Sci. 2015, 78, 51–60. [Google Scholar] [CrossRef] [PubMed]
  14. Plainfossé, H.; Burger, P.; Michel, T.; Landreau, A.; Fernandez, X. Actifs cosmétiques pour la réparation cutanée. Tech. Ing. 2017, J3002. Available online: https://www.techniques-ingenieur.fr/base-documentaire/procedes-chimie-bio-agro-th2/cosmetiques-42634210/actifs-cosmetiques-pour-la-reparation-cutanee-j3002/ (accessed on 25 November 2017).
  15. Ganceviciene, R.; Liakou, A.I.; Theodoridis, A.; Makrantonaki, E.; Zouboulis, C.C. Skin anti-aging strategies. Dermatoendocrinol 2012, 4, 308–319. [Google Scholar] [CrossRef] [PubMed]
  16. Life Expectancy. Available online: http://www.who.int/gho/mortality_burden_disease/life_tables/situation_trends_text/en/ (accessed on 22 November 2017).
  17. Osbourn, A.E.; Lanzotti, V. Plant-Derived Natural Products: Synthesis, Function, and Application; Springer Science & Business Media: Berlin, Germany, 2009; ISBN 978-0-387-85498-4. [Google Scholar]
  18. Médail, F.; Quézel, P. Biodiversity hotspots in the Mediterranean Basin: Setting global conservation priorities. Conserv. Biol. 1999, 13, 1510–1513. [Google Scholar] [CrossRef]
  19. Médail, F.; Quezel, P. Hot-spots analysis for conservation of plant biodiversity in the Mediterranean basin. Ann. Mo. Bot. Gard. 1997, 84, 112–127. [Google Scholar] [CrossRef]
  20. Quercus pubescens Willd. Available online: https://npgsweb.ars-grin.gov/gringlobal/taxonomydetail.aspx?id=30735 (accessed on 23 November 2017).
  21. Apostol, E.N.; Dinu, C.G.; Apostol, B.; Ciuvăț, A.L.; Lorent, A.; Pleșca, I.; Postolache, D.; Leca, S.; Enescu, C.M. Importance of pubescent oak (Quercus pubescens Willd.) for Romanian forests in the context of climate change. Rev. Silvic. Și Cinegetică 2016, 21, 29–33. [Google Scholar]
  22. Quercus pubescens—EUFORGEN European Forest Genetic Resources Program. Available online: http://www.euforgen.org/species/quercus-pubescens/ (accessed on 15 November 2017).
  23. Gallé, A.; Haldimann, P.; Feller, U. Photosynthetic performance and water relations in young pubescent oak (Quercus pubescens) trees during drought stress and recovery. New Phytol. 2007, 174, 799–810. [Google Scholar] [CrossRef] [PubMed]
  24. CosIng—Cosmetics—GROWTH—European Commission. Available online: http://ec.europa.eu/growth/tools-databases/cosing/index.cfm?fuseaction=search.advanced (accessed on 23 November 2017).
  25. Lee, M.W.; Kim, H.H.; Kim, D.H. Composition for anti-wrinkling comprising fractions from leaves of Quercus mongolica. International Patent Application No. KR101483872, 19 January 2015. Available online: https://worldwide.espacenet.com/publicationDetails/biblio?FT=D&date=20150119&DB=EPODOC&locale=fr_EP&CC=KR&NR=101483872B1&KC=B1&ND=6 (accessed on 27 November 2017).
  26. Yang, K.W.; Kim, J.M.; Kim, K.M.; Ko, H.N.; Lee, M.Y.; Lee, Y.B. Composition for improving wrinkles using Quercus glauca branch extracts. International Patent Application No. KR20140137837, 3 December 2014. Available online: https://worldwide.espacenet.com/publicationDetails/biblio?FT=D&date=20141203&DB=EPODOC&locale=fr_EP&CC=KR&NR=20140137837A&KC=A&ND=5 (accessed on 27 November 2017).
  27. Charlois, S.; Riboulet, J.-M.; Bregou, M. Active Ingredient Based on an Oak Plant Extract with Anti-Skin Aging Effect and Cosmetic Composition Comprising Same. International Patent Application No. PCT/FR2014/052962, 28 May 2015. Available online: https://worldwide.espacenet.com/publicationDetails/biblio?FT=D&date=20150528&DB=EPODOC&locale=fr_EP&CC=WO&NR=2015075377A1&KC=A1&ND=5 (accessed on 27 November 2017).
  28. Favre, E. Cosmetic Composition Containing an Anti-Oxidant Agent Containing Oak and Aniseed Extracts. International Patent Application No. PCT/FR2008/051742, 23 April 2009. Available online: http://www.google.ca/patents/WO2009050398A2 (accessed on 30 November 2017).
  29. McLafferty, F.W.; Stauffer, D.B. The Wiley/NBS Registry of Mass Spectral Data; Wiley: New York, NY, USA, 1989; ISBN 978-0-471-62886-6. [Google Scholar]
  30. Boelens Aroma Chemical Information Service. BACIS ESO 2000, the Complete Database of Essential Oils; Leffingwell & Associates: Canton, GA, USA, 1999. [Google Scholar]
  31. Brand-Williams, W.; Cuvelier, M.E.; Berset, C. Use of a free radical method to evaluate antioxidant activity. LWT Food Sci. Technol. 1995, 28, 25–30. [Google Scholar] [CrossRef]
  32. Koleva, I.I.; van Beek, T.A.; Linssen, J.P.H.; de Groot, A.; Evstatieva, L.N. Screening of plant extracts for antioxidant activity: A comparative study on three testing methods. Phytochem. Anal. PCA 2002, 13, 8–17. [Google Scholar] [CrossRef] [PubMed]
  33. Burger, P.; Landreau, A.; Azoulay, S.; Michel, T.; Fernandez, X. Skin whitening cosmetics: Feedback and challenges in the development of natural skin lighteners. Cosmetics 2016, 3, 36. [Google Scholar] [CrossRef]
  34. Lu, W.; Zhao, X.; Xu, Z.; Dong, N.; Zou, S.; Shen, X.; Huang, J. Development of a new colorimetric assay for lipoxygenase activity. Anal. Biochem. 2013, 441, 162–168. [Google Scholar] [CrossRef] [PubMed]
  35. Debelle, L.; Tamburro, A.M. Elastin: Molecular description and function. Int. J. Biochem. Cell Biol. 1999, 31, 261–272. [Google Scholar] [CrossRef]
  36. Papakonstantinou, E.; Roth, M.; Karakiulakis, G. Hyaluronic acid: A key molecule in skin aging. Dermatoendocrinol 2012, 4, 253–258. [Google Scholar] [CrossRef] [PubMed]
  37. Baumann, L. Skin ageing and its treatment. J. Pathol. 2007, 211, 241–251. [Google Scholar] [CrossRef] [PubMed]
  38. Roy, A.; Sahu, R.K.; Matlam, M.; Deshmukh, V.K.; Dwivedi, J.; Jha, A.K. In vitro techniques to assess the proficiency of skin care cosmetic formulations. Pharmacogn. Rev. 2013, 7, 97–106. [Google Scholar] [CrossRef] [PubMed]
  39. Singleton, V.L.; Rossi, J.A. Colorimetry of total phenolics with phosphomolybdic-phosphotungstic acid reagents. Am. J. Enol. Vitic. 1965, 16, 144–158. [Google Scholar]
  40. CIE. Colorimetry—Part 4: CIE 1976 L*A*B* Colour Space; CIE DS 014-4.3/E:2007; CIE Central Bureau: Vienna, Austria, 2007. [Google Scholar]
  41. Rhein, L.D.; Schlossman, M.; O’Lenick, A.; Somasundaran, P. Surfactants in Personal Care Products and Decorative Cosmetics, 3rd ed.; CRC Press: Boca Raton, FL, USA, 2006; ISBN 978-1-4200-1612-3. [Google Scholar]
  42. ViewSonic. Technical Introduction. Delta E ≤ 2 Colour Accuracy. Available online: https://www.viewsonic.com/uk/products/lcd/pdf/ti_delta_E.pdf (accessed on 12 December 2017).
  43. Engel, R.; Gülz, P.-G.; Herrmann, T.; Nahrstedt, A. Glandular trichomes and the volatiles obtained by steam distillation of Quercus robur leaves. Z. Für Naturforschung C 1993, 48, 736–744. [Google Scholar]
  44. Jordão, A.M.; Ricardo-da-Silva, J.M.; Laureano, O.; Adams, A.; Demyttenaere, J.; Verhé, R.; De Kimpe, N. Volatile composition analysis by solid-phase microextraction applied to oak wood used in cooperage (Quercus pyrenaica and Quercus petraea): Effect of botanical species and toasting process. J. Wood Sci. 2006, 52, 514–521. [Google Scholar] [CrossRef]
  45. Palma-Fleming, H.A.; Kepner, R.E. Volatile components of California live oak, Quercus agrifolia. Phytochemistry 1983, 22, 1503–1505. [Google Scholar] [CrossRef]
  46. Kameoka, H.; Aso, Y.; Tsujino, H. Constituents of essential oil of leaves of Quercus dentata Thunb. J. Agric. Chem. Soc. Jpn. 1983, 57, 135–138. [Google Scholar]
  47. Mosedale, J.R.; Feuillat, F.; Baumes, R.; Dupouey, J.-L.; Puech, J.-L. Variability of wood extractives among Quercus robur and Quercus petraea trees from mixed stands and their relation to wood anatomy and leaf morphology. Can. J. For. Res. 1998, 28, 994–1006. [Google Scholar] [CrossRef]
  48. Fengel, D.; Wegener, G. Wood: Chemistry, Ultrastructure, Reactions; Walter de Gruyter: Berlin, Germany, 1983. [Google Scholar]
  49. Rocha, S.M.; Coimbra, M.A.; Delgadillo, I. Occurrence of furfuraldehydes during the processing of Quercus suber L. cork. Simultaneous determination of furfural, 5-hydroxymethylfurfural and 5-methylfurfural and their relation with cork polysaccharides. Carbohydr. Polym. 2004, 56, 287–293. [Google Scholar] [CrossRef]
  50. Plazonić, A.; Mornar, A.; Maleš, Ž.; Kujundžić, N. Phenolic content and antioxidant activities of Burr Parsley (Caucalis platycarpos L.). Molecules 2013, 18, 8666–8681. [Google Scholar] [CrossRef] [PubMed]
  51. Da Silva, J.F.M.; de Souza, M.C.; Matta, S.R.; de Andrade, M.R.; Vidal, F.V.N. Correlation analysis between phenolic levels of Brazilian propolis extracts and their antimicrobial and antioxidant activities. Food Chem. 2006, 99, 431–435. [Google Scholar] [CrossRef]
  52. Pientaweeratch, S.; Panapisal, V.; Tansirikongkol, A. Antioxidant, anti-collagenase and anti-elastase activities of Phyllanthus emblica, Manilkara zapota and silymarin: An in vitro comparative study for anti-aging applications. Pharm. Biol. 2016, 54, 1865–1872. [Google Scholar] [CrossRef] [PubMed]
  53. Justino, G.C.; Correia, C.F.; Mira, L.; Borges Dos Santos, R.M.; Martinho Simões, J.A.; Silva, A.M.; Santos, C.; Gigante, B. Antioxidant activity of a catechol derived from abietic acid. J. Agric. Food Chem. 2006, 54, 342–348. [Google Scholar] [CrossRef] [PubMed]
  54. Kolayli, S.; Sahin, H.; Can, Z.; Yildiz, O.; Sahin, K. Honey shows potent inhibitory activity against the bovine testes hyaluronidase. J. Enzyme Inhib. Med. Chem. 2016, 31, 599–602. [Google Scholar] [CrossRef] [PubMed]
  55. Fernandez, X.; Merck, F.; Kerdudo, A. Conservateurs pour les cosmétiques—Généralités et conservateursantimicrobiens. Tech. Ing. 2012, J2284. Available online: https://www.techniques-ingenieur.fr/base-documentaire/procedes-chimie-bio-agro-th2/cosmetiques-42634210/conservateurs-pour-cosmetiques-j2284/ (accessed on 23 November 2017).
  56. Kerdudo, A.; Burger, P.; Merck, F.; Dingas, A.; Rolland, Y.; Michel, T.; Fernandez, X. Development of a natural ingredient—Natural preservative: A case study. Comptes Rendus Chim. 2016, 19, 1077–1089. [Google Scholar] [CrossRef]
  57. d’Enfert, V. The Nagoya Protocol imposes new rules. Expr. Cosmétique 2013, 24, 40–42. [Google Scholar]
  58. Salminen, W.F. Integrating toxicology into cosmetic ingredient research and development. Int. J. Cosmet. Sci. 2002, 24, 217–224. [Google Scholar] [CrossRef] [PubMed]
  59. SCCS. The SCCS Notes of Guidance for the Testing of Cosmetic Ingredients and Their Safety Evaluation, 9th Revision; SCCS: Brussels, Belgium, 2016. [Google Scholar]
Figure 1. HPLC chromatograms obtained on a Luna® C18 column (150 mm × 4.6 mm; 5 μm) at 330 nm and with ELSD, presenting the major families of compounds identified in Oak1 extract.
Cosmetics 05 00015 g001
Figure 2. Bioactivities of Oak1, the Q. pubescens extract obtained using H2O/EtOH 1/1, compared to the bioactivities of commercial cosmetic ingredients used for the respective activities tested (positive controls) and to the bioactivities of a commercial oak ingredient.
Cosmetics 05 00015 g002
Figure 3. Total phenolic content of the H2O/EtOH (1/1) extract Oak1 and the three fractions Oak1_F3, Oak1_F4 and Oak1_F5 (GAE stands for gallic acid equivalent).
Cosmetics 05 00015 g003
Figure 4. Total flavonoid content of the H2O/EtOH (1/1) extract Oak1 and the three fractions Oak1_F3, Oak1_F4 and Oak1_F5 (QE stands for quercetin equivalent).
Cosmetics 05 00015 g004
Figure 5. Semi-preparative HPLC chromatograms obtained on a Luna® C18 column (250 mm × 10 mm; 5 μm) at 330 nm and with ELSD, presenting the two fractions resulting from Oak1 fractionation.
Cosmetics 05 00015 g005
Figure 6. HPLC chromatograms obtained on a Luna® C18 column (150 mm × 4.6 mm; 5 μm) at 330 nm and with ELSD, presenting the major families of compounds identified in Oak1_LPF fraction.
Cosmetics 05 00015 g006
Figure 7. Bioactivities of Oak1, the Q. pubescens extract obtained using H2O/EtOH 1/1, compared to the ones of Oak1_PF, Oak1_LPF and of commercial cosmetic ingredients used for the respective activities tested (positive controls).
Cosmetics 05 00015 g007
Figure 8. Strategy adopted to develop a natural cosmetic ingredient, from plant sourcing to formulation.
Cosmetics 05 00015 g008
Figure 9. Bioactivities of Oak2, the Q. pubescens extract obtained using pure ethanol, compared to the bioactivities of the discolored extract Oak2D, of the discolored extract deposited on maltodextrin Oak2DM and of commercial cosmetic ingredients used for the respective activities tested (positive controls).
Cosmetics 05 00015 g009
Figure 10. Bioactivities of Oak3 and Oak 4, the Q. pubescens extracts obtained using propylene glycol, compared to the bioactivities of the discolored extract Oak3D and of commercial cosmetic ingredients used for the respective activities tested (positive controls).
Cosmetics 05 00015 g010
Table 1. Extraction parameters (white cells) and bioactivities (grey cells) of the fractions F1–F5 resulting from the fractionation of the Oak1 extract.
Extraction Parameters/BioactivitiesOak1_F1Oak1_F2Oak1_F3Oak1_F4Oak1_F5Positive Control
Extraction (250 mL solvent)cyclohexanecyclohexane /diethyl ether 1/1diethyl ethermethanolmethanol/water 1/1
Fractions’ mass0.60 mg34.00 mg150.50 mg304.00 mg2.34 g
Yield0.02%0.96%4.24%28.53%65.98%
Whitening activityL-DOPAn.d.++++
L-Tyrosinen.d.++++
Anti-inflammatory activityn.d.+++
Anti-collagenase activityn.d.
Anti-elastase activityn.d.+++++++++++
Anti-oxidant activityn.d.++++++++
Anti-hyaluronidase activityn.d.++++++++++
n.d.: not determined; (−): inhibition < 30%; (+): 30% < inhibition < 50%; (++): 50% < inhibition < 70%; (+++): 70% < inhibition < 90%; (++++): inhibition > 90%.
Table 2. Major compounds identified by GC-MS in crude extract Oak1, as well as in fractions Oak1_F3, Oak1_F4 and Oak1_F5.
Extract/FractionConstituantRI a,b HP-1/RI LitReferences
Oak16,10,14-trimethyl-2-pentadecanone1827/1830identified in Q. robur leaves essential oil [43]
Oak1_F3nonanal1081/1082identified in Q. pyrenaica and Q. petraea wood extracts [44], as well as in Q. agrifolia and Q. robur leaves essential oils [43,45]
dihydroactinidiolide1481/1475identified in Q. dentata leaves essential oil [46]
dodecanoic acid1543/1547identified in Q. robur and Q. petraea wood extracts [47]
tetradecanoic acid1743/1750identified in Q. robur and Q. petraea wood extracts [47], as well as in Q. robur leaves essential oil [43]
methyl palmitate1903/1909-
hexadecanoic acid1945/1940identified in Q. robur, Q. petraea and Q. alba wood extracts [47,48], as well as in Q. robur leaves essential oil [43]
linoleic acid2105/2109identified in Q. robur, Q. petraea and Q. alba wood extracts [47,48]
Oak1_F4dihydro-2.3-benzofuran1197/1188
6,10,14-trimethyl-2-pentadecanone1827/1830identified in Q. robur leaves essential oil [43]
Oak1_F5furfural805/805identified in Q. suber wood [49]
furfuryl acohol838/835-
a Compounds are listed in order of their elution time from an HP-1 column. b RI = retention indices are determined on HP-1 column using the homologous series of n-alkanes (C8-C24).
Table 3. Color variations (with SD, standard deviation) observed for both solid and liquid cosmetic ingredients after activated carbon discoloration.
Oak IngredientsColor Characteristics
L *(Lightness) ± SDa *(Redness) ± SDb *(Yellowness) ± SDΔE *ab ± SD
Solid ingredientOak2−32.16 ± 0.0326.71 ± 0.03−12.76 ± 0.048.18 ± 1.79
Oak2D−26.73 ± 0.9628.42 ± 0.09−6.89 ± 1.56
Liquid ingredientOak3−29.92 ± 0.1927.06 ± 0.03−13.84 ± 0.040.58 ± 0.06
Oak3D−30.42 ± 0.1327.01 ± 0.03−13.55 ± 0.05
Oak4−29.92 ± 0.1927.06 ± 0.03−13.84 ± 0.041.22 ± 0.14
Oak4D−30.99 ± 0.0527.17 ± 0.04−13.27 ± 0.06
Table 4. Example of an anti-age formulation using the Q. pubescens ingredient.
INCI a NameQuantity (%)
Aquaq.s. b 100
Glycerin1.00
Stearic acid (and) Palmitic acid3.00
Argania spinosa seed oil5.00
Helianthus annuus hybrid oil5.00
Sorbitan stearate2.90
Polyglyceryl-4 laurate/Succinate (and) Aqua2.65
Q. pubescens extract0.10–1.00
Sodium benzoate (and) Potassium sorbate0.80
Citric acid0.40
a International Nomenclature of Cosmetic Ingredients, b q.s.: quantity sufficient for.

