Quantitative Analysis Using the Phototrichogram Technique of an Italian Population Suffering from Androgenic Alopecia

1
Institute of Skin and Product Evaluation (ISPE) srl, Via Bruschetti 1, 20125 Milano, Italy
2
Rigano Laboratories srl, Via Bruschetti 1, 20125 Milano, Italy
*
Author to whom correspondence should be addressed.
Cosmetics 2018, 5(2), 28; https://doi.org/10.3390/cosmetics5020028
Submission received: 20 March 2018
/
Revised: 12 April 2018
/
Accepted: 13 April 2018
/
Published: 17 April 2018
Abstract
:In this study, the values of some scalp basal parameters, collected during several clinical studies involving a total of 254 subjects with androgenic alopecia, were analyzed. Subjects’ values were grouped by age and gender, and the differences between groups were examined. The density values (n° of hair/cm2) and the percentages of anagen and telogen hair were considered. Furthermore, the variations recorded at the end of cosmetic treatments (ranging from 12 to 16 weeks) aiming to reduce excessive hair loss were analyzed. The basal values regarding the percentage of hair in the anagen phase evidenced a linear decrease with increasing age, with a corresponding increase of the percentage of hair in the telogen phase. As far as the hair density differences between males and females are concerned, females had a mean value significantly higher than males. Moreover, at the end of the intended anti-hair loss treatments, females were more susceptible to improvements of their hair density values.
1. Introduction
The premature hair loss associated with androgenic alopecia is a deeply felt problem. Indeed, a problem, concerning a large group of the population of both genders [1], that is the main cause of the progressive thinning of the density of scalp hair.
The cosmetic industry is struggling to cope with the quest for scalp treatments by means of products (lotions, shampoos, conditioners and diet supplements) aiming to decrease or prevent excessive hair loss. Nowadays, in order to satisfy the growing expectations of consumers, very high product performances are necessary. For this reason, it is essential to perform accurate efficacy evaluations before launching a new functional product on the market [2].
Different types of evaluation are possible: subjective, clinical and instrumental [3]. By means of subjective tests, like self-assessment questionnaires, it is possible to learn the perception of consumers both of the anti-hair loss, strengthening, and reinvigorating effects, and on the sensorial appreciation for fragrance pleasantness and ease of application.
Objective clinical evaluations are performed by expert evaluators that carry out an examination of the scalp and who, by means of specific trials called pull test and wash test, assess not only the good tolerability of the product, but also the changing level of hair resistance. The pull test is a clinical evaluation of the hair resistance to traction, while the wash test is the count of the number of hairs lost after a washing the scalp under standard conditions [4,5,6].
As regards the instrumental evaluations of efficacy in preventing the abnormal hair loss, the most common technique used is the phototrichogram, a technique that makes it possible to determine the density and the percentage of anagen and telogen hair in a selected area on the scalp. The anagen phase corresponds to the active hair-growth phase, while the telogen phase corresponds to the resting phase. Therefore, the expected results at the end of any efficacy study aiming to achieve an anti-hair loss treatment should be an increase of the hair density and of the percentage of anagen hair, with a corresponding decrease in the percentage of telogen hair [7].
Instrumental data are very useful for evaluating the efficacy of the anti-hair loss treatment. The phototrichogram technique has been standardized in order to obtain data that are as reproducible and repeatable as possible. The analysis of basal values of the parameters of density and percentage of anagen and telogen hair is also very useful. In the present study, the basal values of an Italian population suffering from androgenic alopecia were analyzed, grouping the subjects by age and sex and examining the differences. Furthermore, the variations recorded at the end of the period of use of cosmetic anti-hair loss treatments, ranging from 12 to 16 weeks, were analyzed.
2. Materials and Methods
In this study, the density values (n° of hair/cm2 and their percentage) and the percentages of anagen and telogen hair were considered. Data related to 254 subjects were analyzed. Data of measurements performed on a male population suffering from androgenic alopecia, II-IV stage of Norwood’s scale [8] and on a female population suffering from androgenic alopecia, I-II stage Ludwig’s scale [9], 20–75 years old, mean age 50 years, were selected. The diagnosis of androgenic alopecia was made through a clinical evaluation of hair and scalp by our dermatologist, including the evaluation of the anamnesis of the subjects (diseases, hormonal alterations, drugs, eating behavior) and of the course of hair loss (chronic or intermittent) [10]. All subjects gave their informed consent for inclusion before they participated in the study. The study was conducted in accordance with the Declaration of Helsinki. All clinical studies were approved by the ISPE Ethical Committee for cosmetic tests, appointed on 12 January 1998.
The following subjects were excluded: pregnant or nursing females, subjects taking topical or systemic drugs that could affect the results of the test, subjects showing systemic diseases or skin disorders that may affect the evaluation of the test articles or increase risk to the subject. Moreover, subjects who used coadjutant treatments for hair loss prevention (either topical and/or systemic) within a period of 3 months prior to admission in the study were also excluded.
Analysis by means of phototrichogram technique was performed at the beginning and at the end of the foreseen periods of different cosmetic treatments, such as lotions, shampoo or diet supplements, ranging from 12 to 16 weeks. Lotions were applied once a day, shampoos were used at least twice a week, while diet supplements were taken once a day.
The hair in an area of 1 cm2, in the mid-scalp area, was clipped. Digital images of the area were taken 48 hours after the clipping.
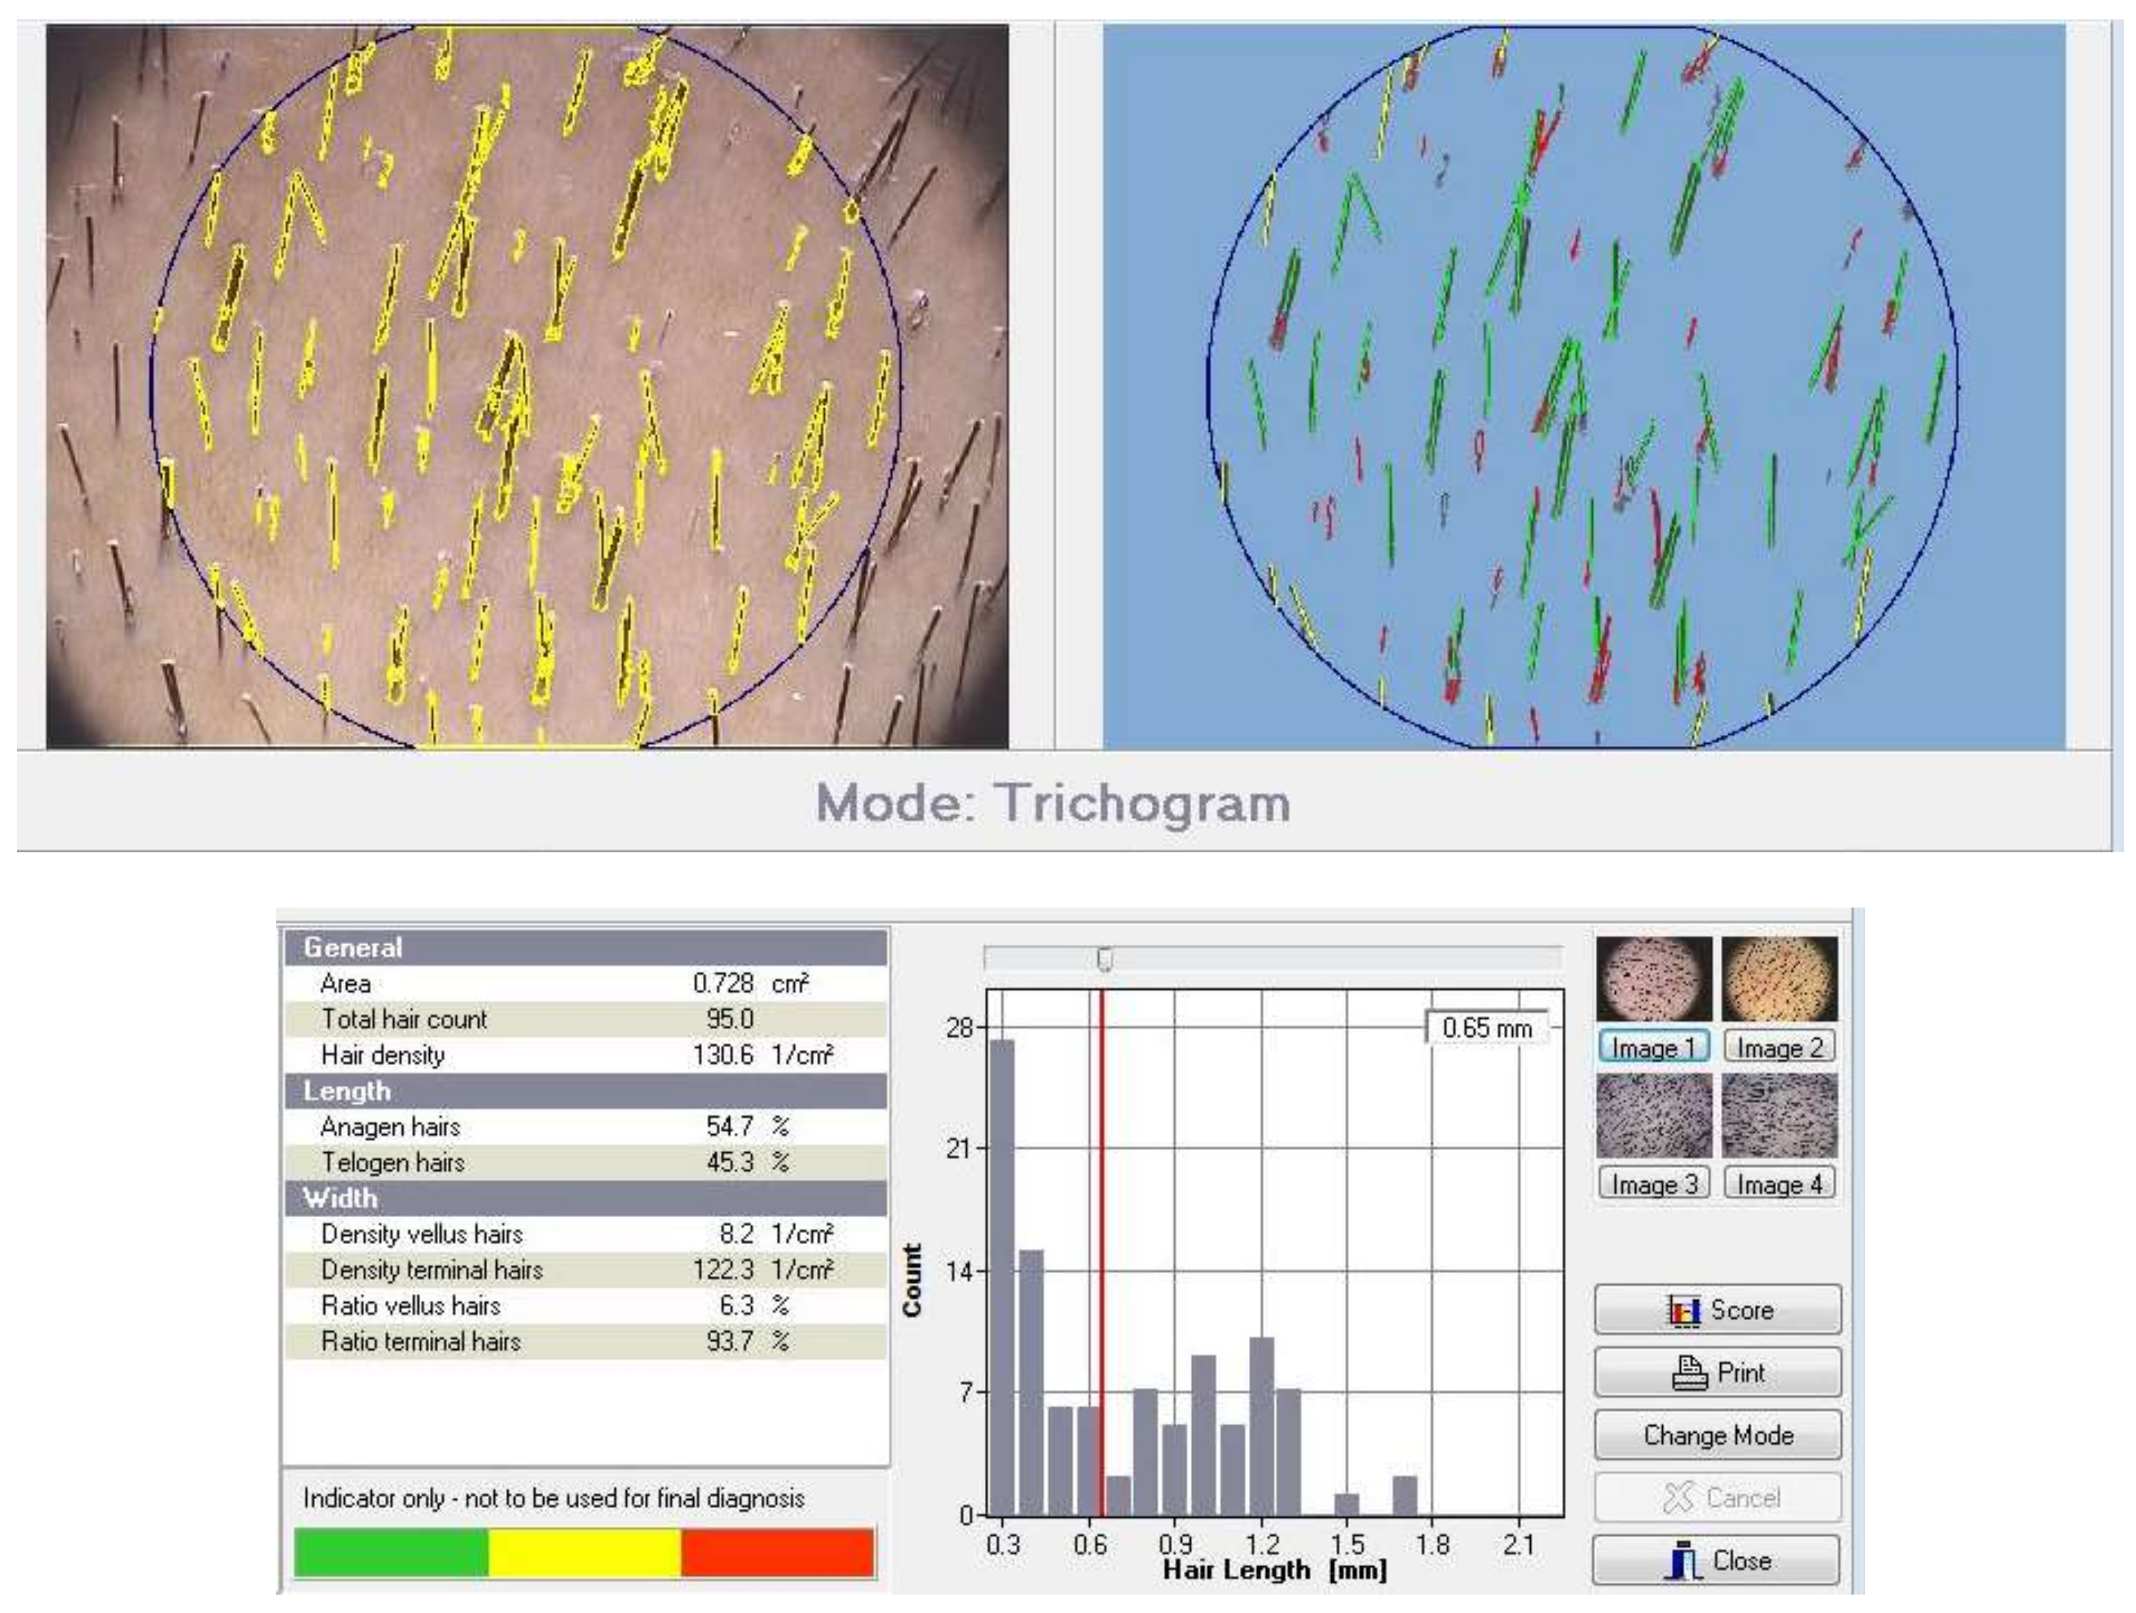
Fotofinder® Dermoscope (FotoFinder Systems GmbH, Bad Birnbach, Germany) was used to take the digital images of the scalp at 20-fold magnification. This system allows the recorded images of any skin surface to be carried out and memorized using the principle of Dermoscopy Digital Video. The analysis of the hair in the 1 cm2 clipped area was performed by means of the software Trichoscan Professional Ver. 2.0 (Tricholog GmbH, Freiburg im Breisgau, Germany), obtaining the hair density and the percentages of anagen and telogen hair [11,12] (Figure 1).
Mean values and standard deviations were calculated for each set of values.
The instrumental basal values and the corresponding variations related to the different age groups were statistically compared by means of One Way ANOVA for parametric and independent data.
The data related to the comparison between males and females were statistically compared by means of t-test for parametric and independent data.
In both cases, differences between the groups of values were considered significant when the probability p was <0.05.
3. Results and Discussion
Data concerning 254 subjects were subdivided into the following age groups: 20–40, 41–50, 51–60 and 61–75 years. The mean basal values of hair density (n° hair/cm2) showed a uniform distribution. No statistically significant differences were evidenced among the different age groups (Figure 2).
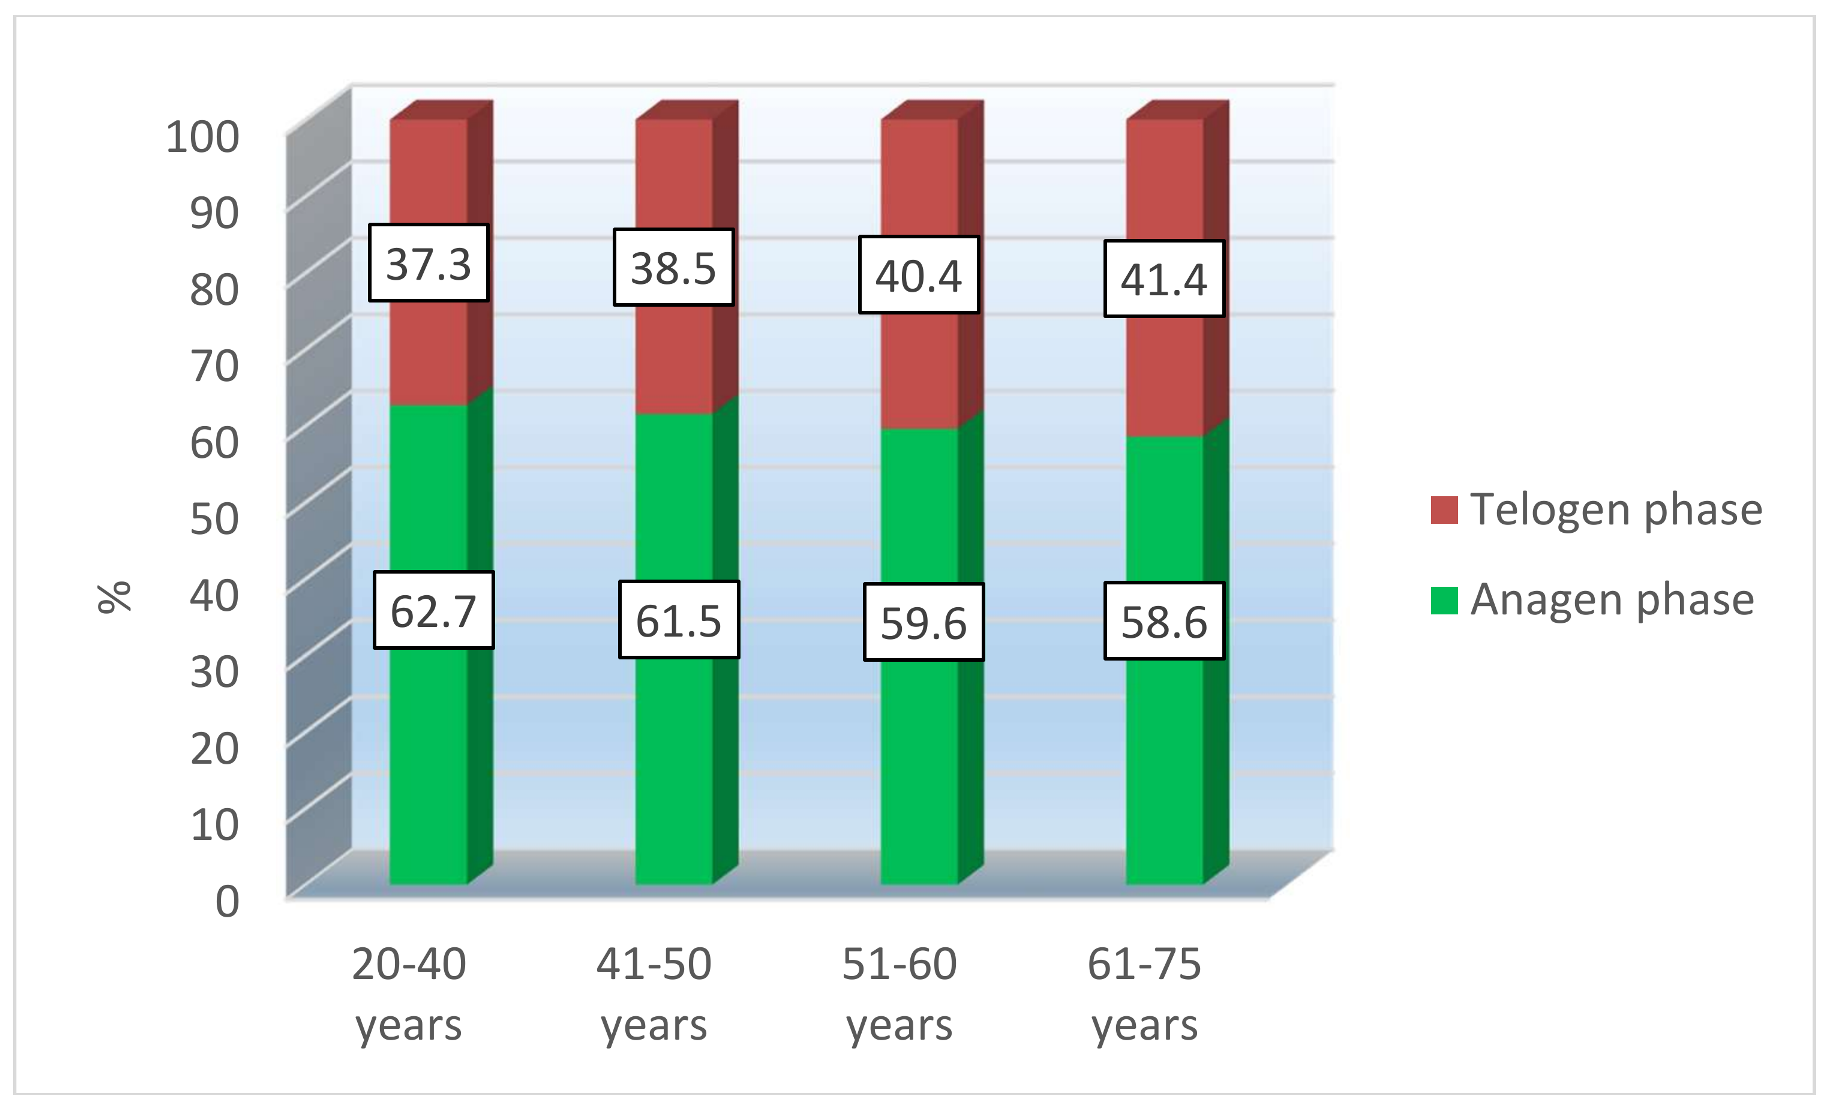
Concerning the percentage of hair in the anagen phase, a linear decrease with the increase of age was evidenced, with an equivalent increase of the percentage of hair in the telogen phase. However, no statistically significant differences were evidenced among the different age groups (Figure 3).
In addition, the variations both of the density values and of the percentage of hair in the anagen and telogen phase, obtained at the end of period of use of anti-hair loss treatments of 12–16 weeks, were compared. No correlations were evidenced between these variations and the age of the subjects (Table 1).
Furthermore, the mean basal values of hair density and percentage of hair in anagen/telogen phase were subdivided by gender, in order to evaluate the differences between males and females.
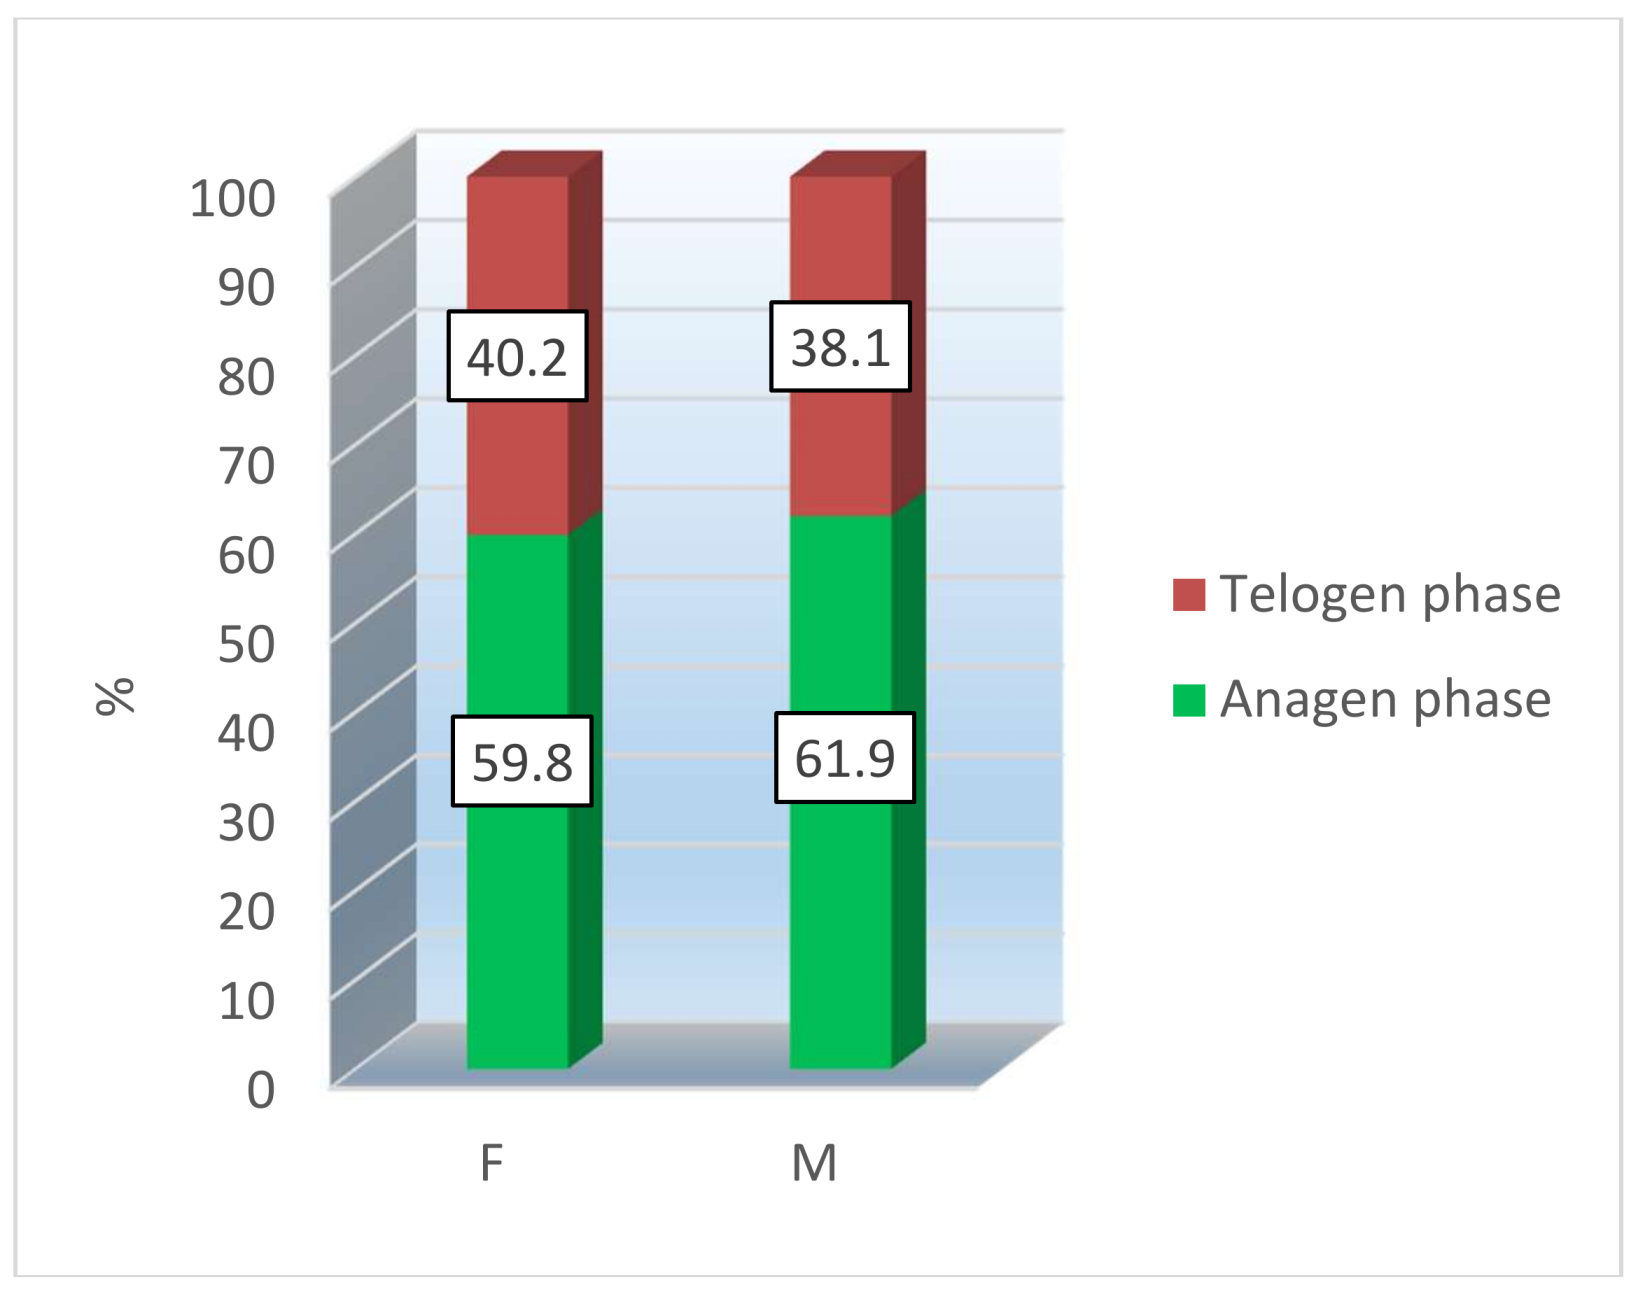
A difference in hair density was evidenced: the mean density value was equal to 224.4 hair/cm2 in the female group and equal to 201.0 hair/cm2 in the male group, which represents a statistically significant difference (p < 0.01) (Figure 4). On the other hand, the percentages of hair in the anagen/telogen phase were similar in males and females (Figure 5).
Concerning the variations obtained at the end of different anti-hair loss cosmetic treatments (lotions, shampoos or diet supplements), a statistically significant difference was evidenced between males (M) and females (F) in the percentage of hair in the anagen and telogen phase (p = 0.05), a parameter that seems to improve more easily in women than in men. The tendency to greater improvements in females was also shown with regard to the variations related to hair density, but in this case no statistically significant variations were evidenced between the two genders (Table 2).
In addition, a subdivision based on both gender and age was performed. The following groups were considered: females 20–50 years, males 20–50 years, females 51–75 years and males 51–75 years.
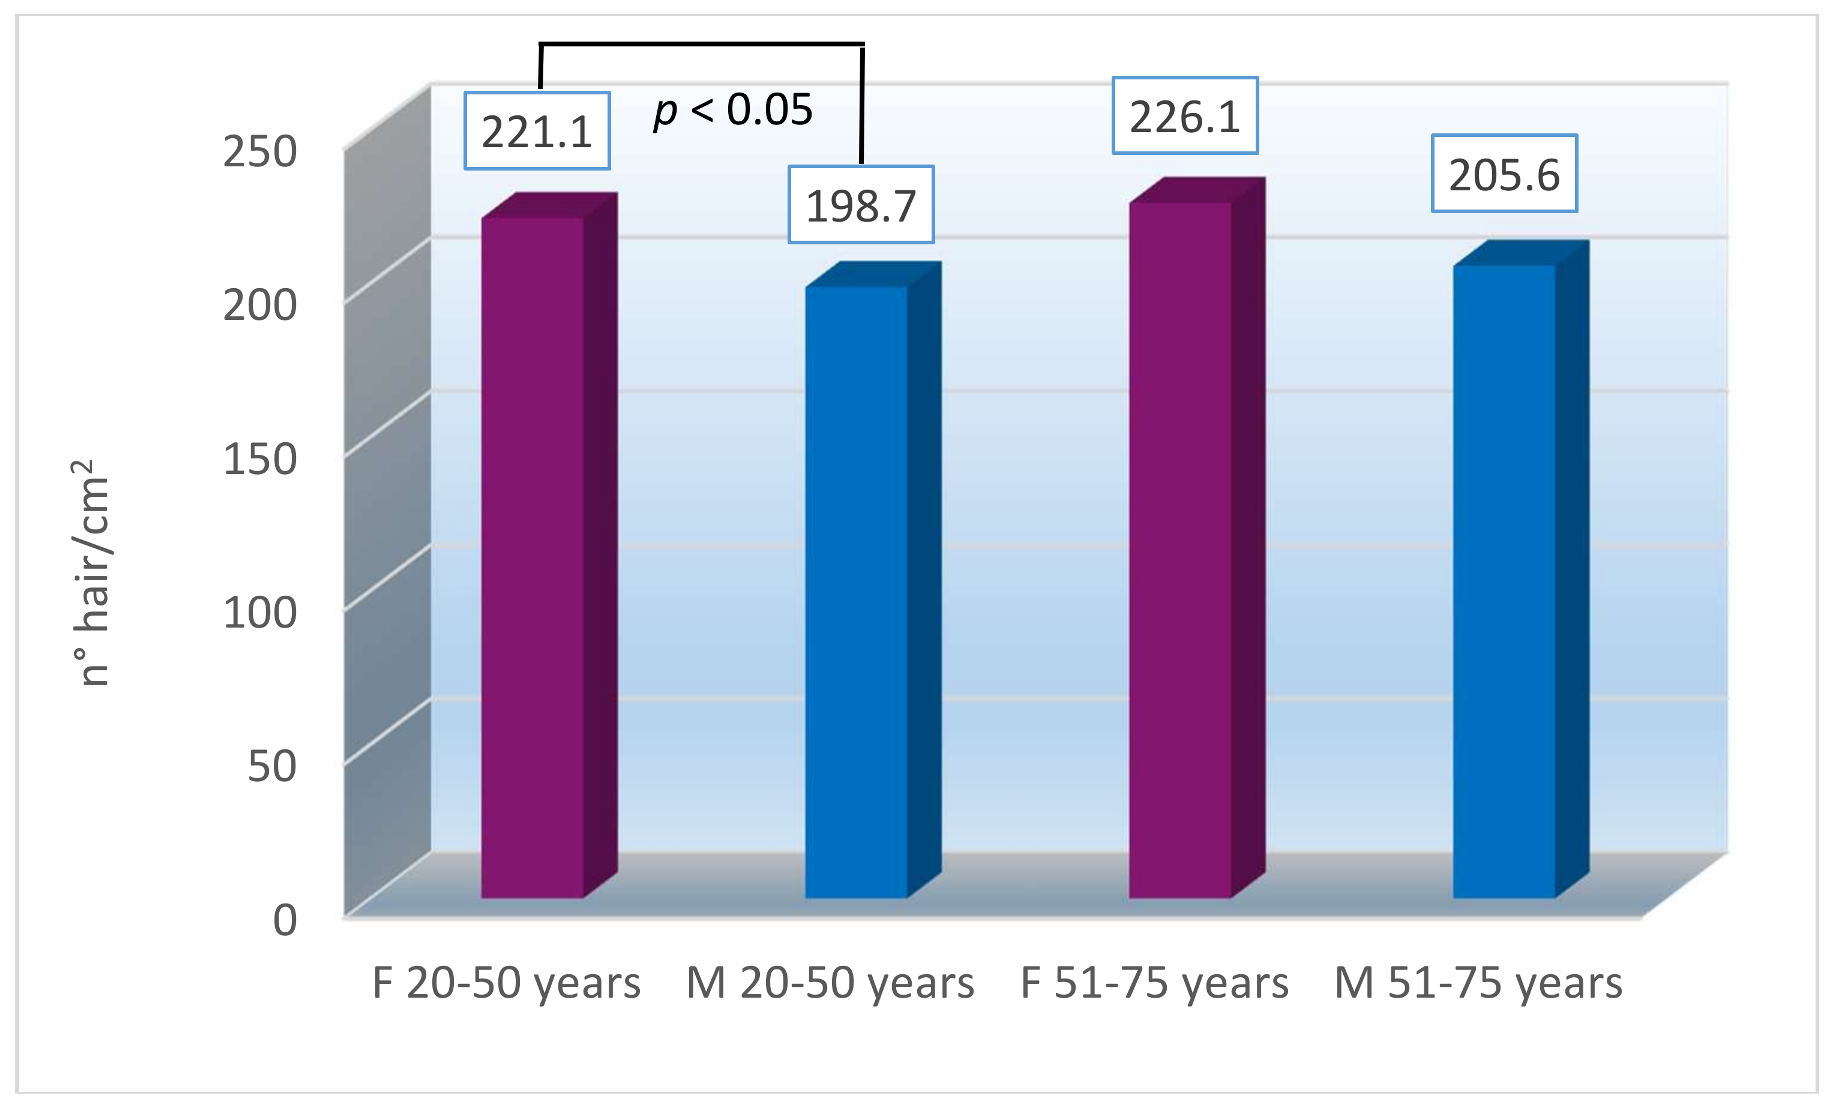
When analyzing the hair density values, a statistically significant difference was evidenced between males and females in the age group 20–50 years (p < 0.05); females showed a higher number of hairs in the analyzed area than males. This tendency is also shown in the age group 51–75 years, but in this case, no statistically significant differences were evidenced (Figure 6).
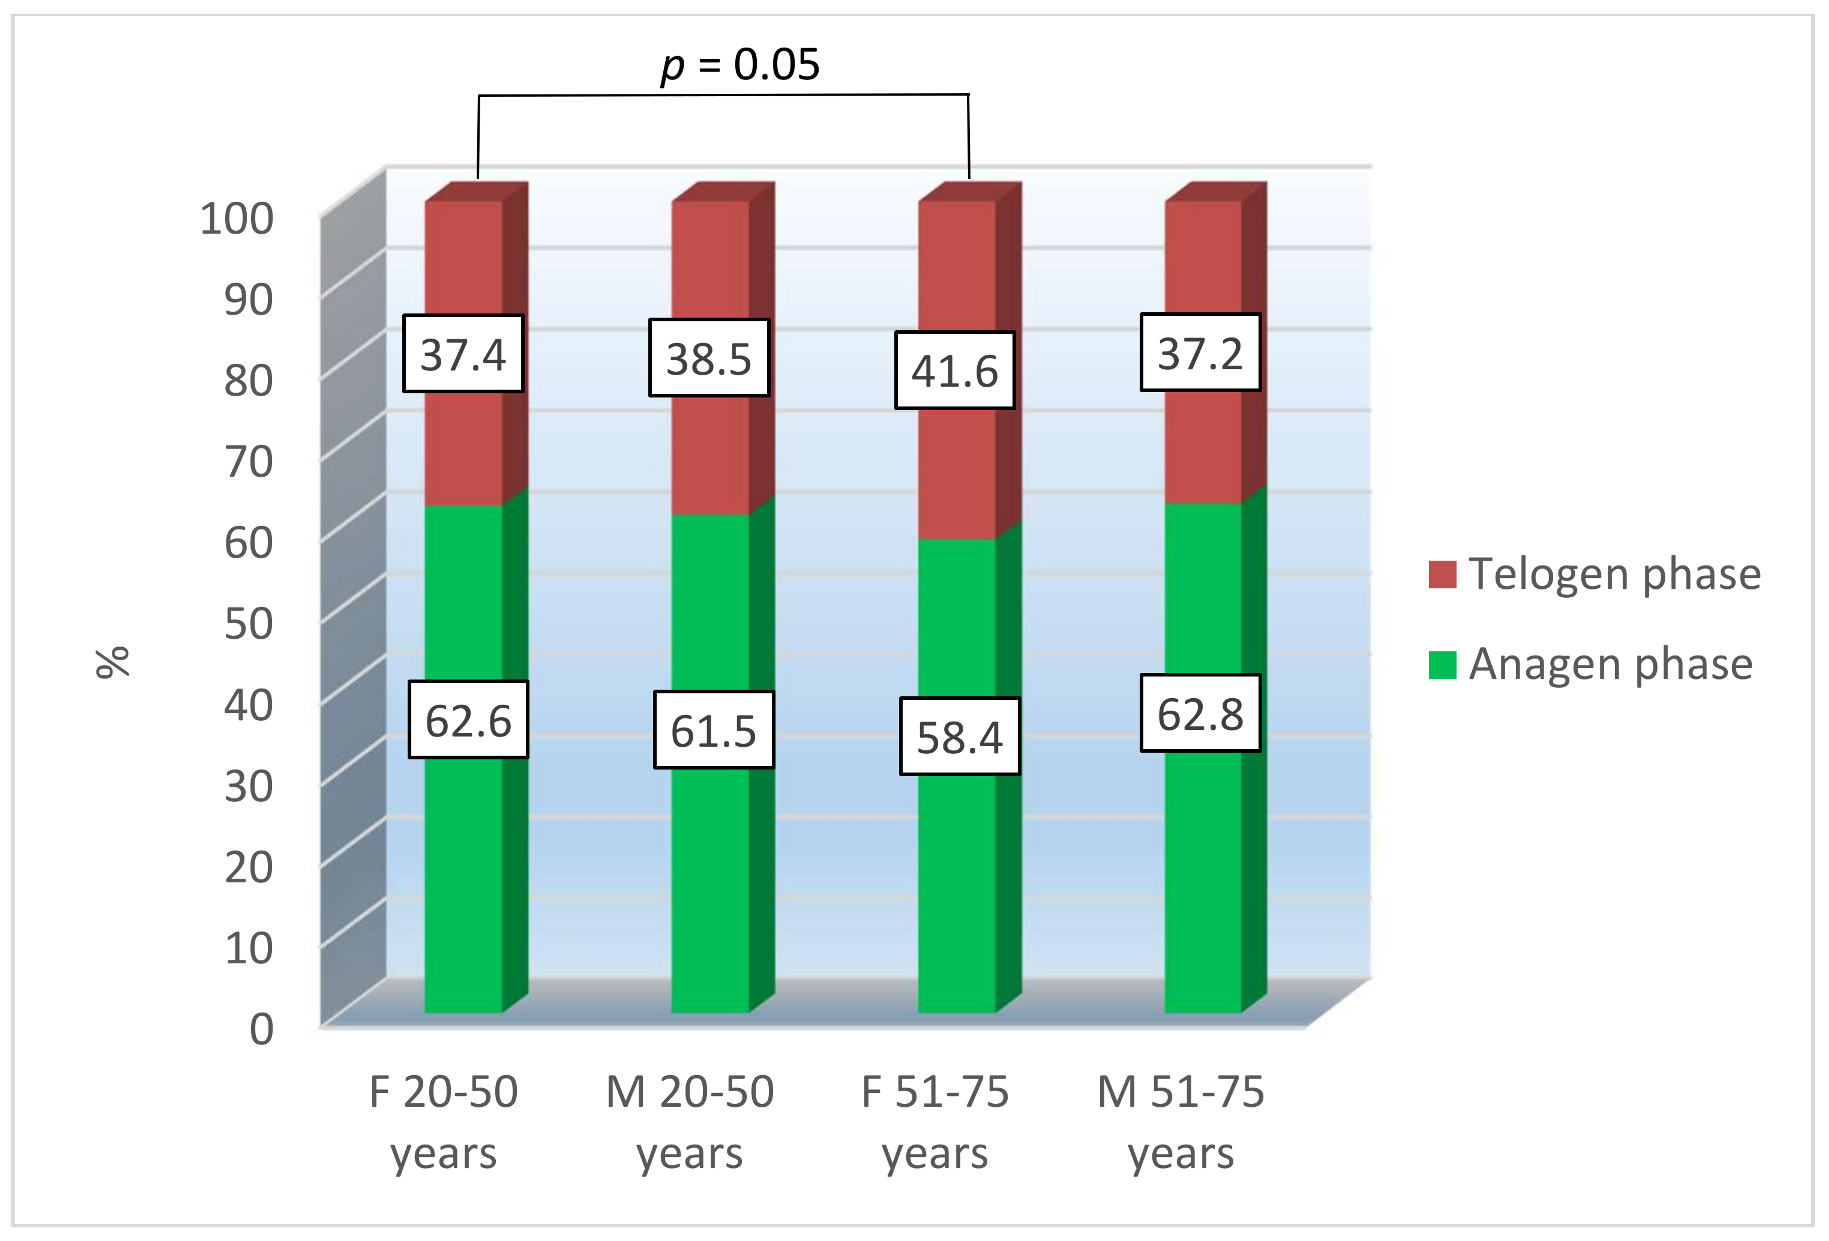
Concerning the mean values of the percentage of hair in the anagen and telogen phases, a statistically significant difference was evidenced in females between age groups (p = 0.05). With the age increase, there is a quite logical decrease in the percentage of anagen hair and an increase in the percentage of telogen hair (Figure 7).
Considering the variations obtained at the end of anti-hair loss treatments, no statistically significant differences were evidenced; nevertheless, females seem to frequently obtain better results than males. (Table 3).
4. Conclusions
In this research, data of clinical studies, performed in Italy, of different anti-hair loss treatments related to 254 subjects with androgenic alopecia, measured over a period of 5 years, were collected and compared.
The basal values of hair density and percentage of hair in the anagen and telogen phases, as well as the related variations at the end of anti-hair loss treatments ranging from 12 to 16 weeks, were analyzed.
The basal values of the percentage of hair in the anagen phase evidenced a linear decrease with the increase of age, with a corresponding increase in the percentage of hair in the telogen phase.
In particular, a statistically significant difference was evidenced in females between the age groups 20–50 year vs. 51–75 year.
Considering the differences between males and females, it is evident that females have a mean value of hair density significantly higher than males. Furthermore, at the end of different anti-hair loss treatments, females resulted more susceptible to improvements, as evidenced from the statistically significant difference between female and male group, when analyzing the variations of percentage of anagen and telogen hair. This tendency is also evident with regard to the hair density parameter, but in this case, no statistically significant variations were observed.
Acknowledgments
All sources of funding of the study should be disclosed. Please clearly indicate grants that you have received in support of your research work. Clearly state if you received funds for covering the costs to publish in open access.
Author Contributions
Sara Brancato, Claudia Cartigliani, Adriana Bonfigli and Luigi Rigano wrote the paper; Sara Brancato, Claudia Cartigliani and Adriana Bonfigli performed the clinical studies; Sara Brancato analyzed the data; Luigi Rigano supervised the whole work.
Conflicts of Interest
The authors declare no conflict of interest.
References
- Van Neste, D.; Lachapelle, J.M.; Antoine, J.L. Trends in Human Hair Growth and Alopecia Research; Kluwer Academic Publishers: Dordrecht, The Netherlands, 1989. [Google Scholar]
- Emma, T. Guidelines for the Evaluation of the Efficacy of Cosmetic Products; The European Cosmetics Association: Brussels, Belgium, 2008. [Google Scholar]
- Zviak, C. The Science of Hair Care. Dermatology; Marcel Dekker Inc.: New York, NY, USA, 1986; Volume 7. [Google Scholar]
- Angelini, G.; Rigano, L. Dermatite da contatto con cosmetici. In Dermatologia Professionale e Ambientale; Angelini, G., Vena, G.A., Eds.; ISED: Brescia, Italy, 1999; Volume 34, pp. 685–729. (In Italian) [Google Scholar]
- Walker, A.P.; Basketter, D.A.; Baverel, M.; Diembeck, W.; Matthies, W.; Mougin, D.; RÖthlisberger, R.; Coroama, M. Test guidelines for the assessment of human skin tolerance of potentially irritant cosmetic ingredients. Food Chem. Toxicol. 1997, 35, 1099–1106. [Google Scholar] [CrossRef]
- Cosmetic Product Test Guidelines for the Assessment of Human Skin Compatibility. COLIPA Guidelines, August 1997.
- Piérard, G.E.; Piérard-Franchimont, C.; Marks, R.; Elsner, P.; EEMCO group. EEMCO guidance for the assessment of hair shedding and alopecia. Skin Pharmacol. Physiol. 2004, 17, 98–110. [Google Scholar]
- Norwood, O.T. Male pattern baldness: Classification and incidence. South Med J. 1975, 68, 1359–1365. [Google Scholar] [CrossRef] [PubMed]
- Ludwig, E. Classification of the types of androgenetic alopecia (common baldness) occurring in female sex. Br. J. Dermatol. 1977, 97, 247–254. [Google Scholar] [CrossRef] [PubMed]
- Blume-Peytavi, U.; Blumeyer, A.; Tosti, A.; Finner, A.; Marmol, V.; Trakatelli, M.; Reygagne, P.; Messenger, A.; European Consensus Group. S1 guideline for diagnostic evaluation in androgenetic alopecia in men, women and adolescents. Br. J. Dermatol. 2011, 164, 5–15. [Google Scholar] [CrossRef] [PubMed]
- Hoffmann, R. Trichoscan: Combining epiluminescence microscopy with digital image analysis for the measurement of hair growth in vivo. Eur. J. Dermatol. 2001, 11, 362–368. [Google Scholar] [PubMed]
- Gassmueller, J.; Rowold, E.; Frase, T.; Hughes-Formella, B. Validation of Trichoscan® technology as a fully-automated tool for evaluation of hair growth parameters. Eur. J. Dermatol. 2009, 19, 224–231. [Google Scholar] [PubMed]
Figure 1.
Example of results obtained through Trichoscan Professional Ver. 2.0.

Figure 2.
Mean basal values of hair density as a function of the age group.
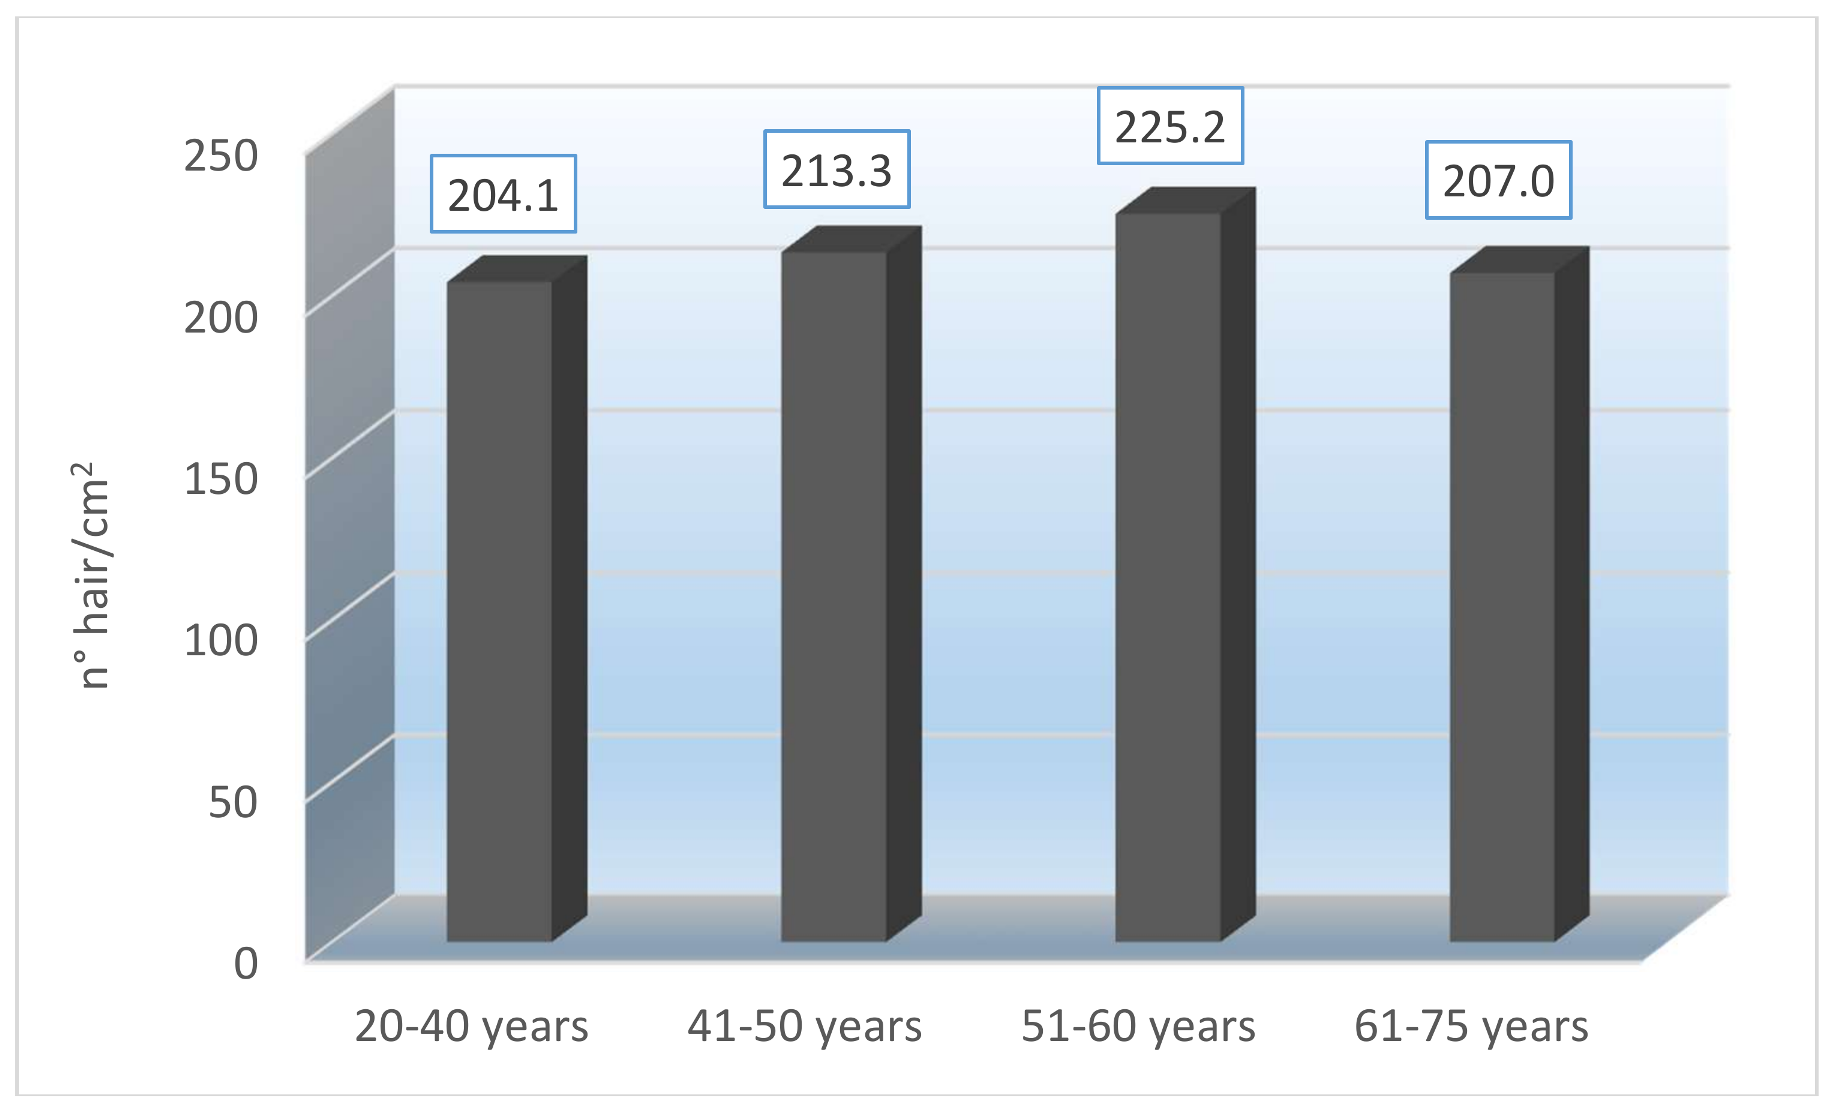
Figure 3.
Mean basal values of percentage of hair in anagen/telogen phase as function of the group age.
Figure 3.
Mean basal values of percentage of hair in anagen/telogen phase as function of the group age.

Figure 4.
Mean basal values of hair density as a function of gender.
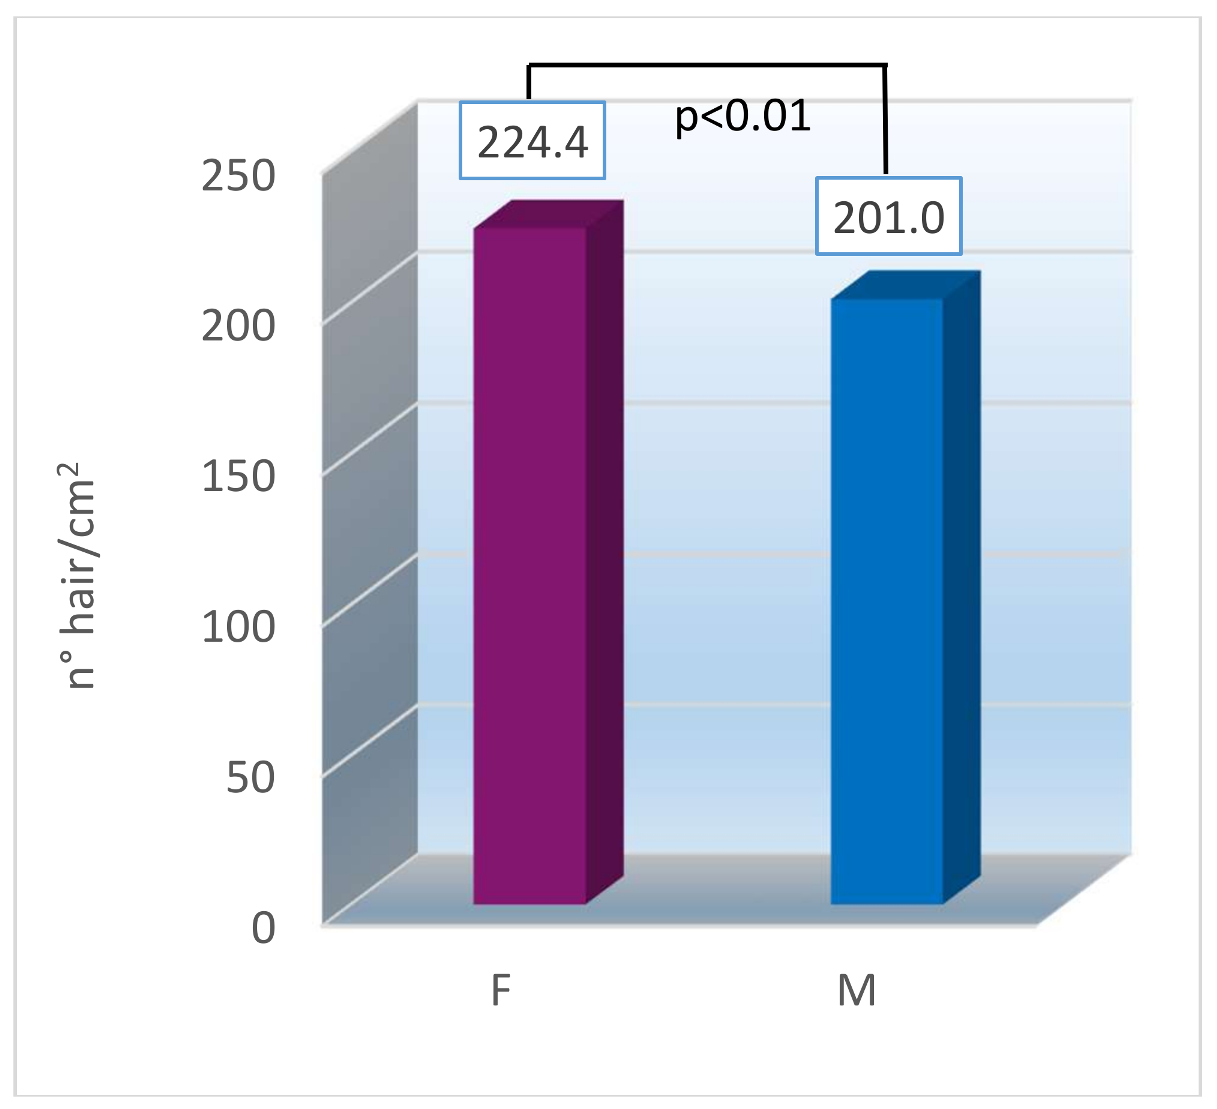
Figure 5.
Mean basal values of the percentage of hair in anagen/telogen phase as a function of gender.
Figure 5.
Mean basal values of the percentage of hair in anagen/telogen phase as a function of gender.

Figure 6.
Mean basal values of hair density as a function of the age group and gender.

Figure 7.
Mean basal values of the percentage of hair in anagen/telogen phase as a function of age group and gender.
Figure 7.
Mean basal values of the percentage of hair in anagen/telogen phase as a function of age group and gender.


Table 1.
Improvements (TF-T0) of hair density and percentage of hair in anagen/telogen phase at the end of different anti-hair loss cosmetic treatments (lotions, shampoo or diet supplements) as a function of age.
Table 1.
Improvements (TF-T0) of hair density and percentage of hair in anagen/telogen phase at the end of different anti-hair loss cosmetic treatments (lotions, shampoo or diet supplements) as a function of age.
| Variations TF-T0 | Density (n° Hair/cm2) | Anagen Phase | Telogen Phase |
|---|---|---|---|
| 20–40 years | +7.1 (+3.5%) | +3.9% | −3.9% |
| 41–50 years | +9.6 (+4.5%) | +2.7% | −2.7% |
| 51–60 years | +6.4 (+2.8%) | +5.7% | −5.7% |
| 61–75 years | +11.0 (+5.3%) | +6.2% | −6.2% |
Table 2.
Improvements (TF-T0) in hair density and percentage of hair in anagen/telogen phase at the end of different anti-hair loss cosmetic treatments (lotions, shampoos or diet supplements) as a function of gender.
Table 2.
Improvements (TF-T0) in hair density and percentage of hair in anagen/telogen phase at the end of different anti-hair loss cosmetic treatments (lotions, shampoos or diet supplements) as a function of gender.
| Variations TF-T0 | Density (n° Hair/cm2) | Anagen Phase | Telogen Phase |
|---|---|---|---|
| F | +8.4 (+3.7%) | +5.5% * | −5.5% * |
| M | +7.0 (+3.5%) | +3.1% * | −3.1% * |
* p = 0.05.
Table 3.
Improvements (TF-T0) in hair density and percentage of hair in the anagen/telogen phase at the end of different anti-hair loss cosmetic treatments (lotions, shampoo or diet supplements) as a function of age and gender.
Table 3.
Improvements (TF-T0) in hair density and percentage of hair in the anagen/telogen phase at the end of different anti-hair loss cosmetic treatments (lotions, shampoo or diet supplements) as a function of age and gender.
| Variations TF-T0 | Density (n° Hair/cm2) | Anagen Phase | Telogen Phase |
|---|---|---|---|
| F 20–50 years | +10.2 (+4.6%) | +4.2% | −4.2% |
| M 20–50 years | +7.1 (+3.6%) | +2.3% | −2.3% |
| F 51–75 years | +7.4 (+3.3%) | +6.1% | −6.1% |
| M 51–75 years | +6.8 (+3.3%) | +4.7% | −4.7% |
© 2018 by the authors. Licensee MDPI, Basel, Switzerland. This article is an open access article distributed under the terms and conditions of the Creative Commons Attribution (CC BY) license (http://creativecommons.org/licenses/by/4.0/).
Share and Cite
MDPI and ACS Style
Brancato, S.; Cartigliani, C.; Bonfigli, A.; Rigano, L. Quantitative Analysis Using the Phototrichogram Technique of an Italian Population Suffering from Androgenic Alopecia. Cosmetics 2018, 5, 28. https://doi.org/10.3390/cosmetics5020028
AMA Style
Brancato S, Cartigliani C, Bonfigli A, Rigano L. Quantitative Analysis Using the Phototrichogram Technique of an Italian Population Suffering from Androgenic Alopecia. Cosmetics. 2018; 5(2):28. https://doi.org/10.3390/cosmetics5020028
Chicago/Turabian StyleBrancato, Sara, Claudia Cartigliani, Adriana Bonfigli, and Luigi Rigano. 2018. "Quantitative Analysis Using the Phototrichogram Technique of an Italian Population Suffering from Androgenic Alopecia" Cosmetics 5, no. 2: 28. https://doi.org/10.3390/cosmetics5020028
Note that from the first issue of 2016, this journal uses article numbers instead of page numbers. See further details here.